CHICAGO DIVISION OF Strategic Capital Planning AUGUST 2018 STATE OF THE SYSTEM 2018

Welcome message from author
This document is posted to help you gain knowledge. Please leave a comment to let me know what you think about it! Share it to your friends and learn new things together.
Transcript
CHICAGO
DIVISION OFStrategic Capital Planning
AUGUST 2018
STATE OF THE
SYSTEM2018
TABLE OF CONTENTS
INTRODUCTION 1
METRA INFRASTRUCTURE 4
CENTRAL BUSINESS DISTRICT MARKET 30
UNION PACIFIC - NORTH LINE 36
MILWAUKEE DISTRICT - NORTH LINE 48
NORTH CENTRAL SERVICE 60
UNION PACIFIC - NORTHWEST LINE 72
MILWAUKEE DISTRICT - WEST LINE 86
UNION PACIFIC - WEST LINE 98
BNSF RAILWAY LINE 112
HERITAGE CORRIDOR LINE 126
SOUTHWEST SERVICE LINE 138
ROCK ISLAND LINE 150
METRA ELECTRIC LINE 164
SOUTH SHORE LINE 182
APPENDIX 188
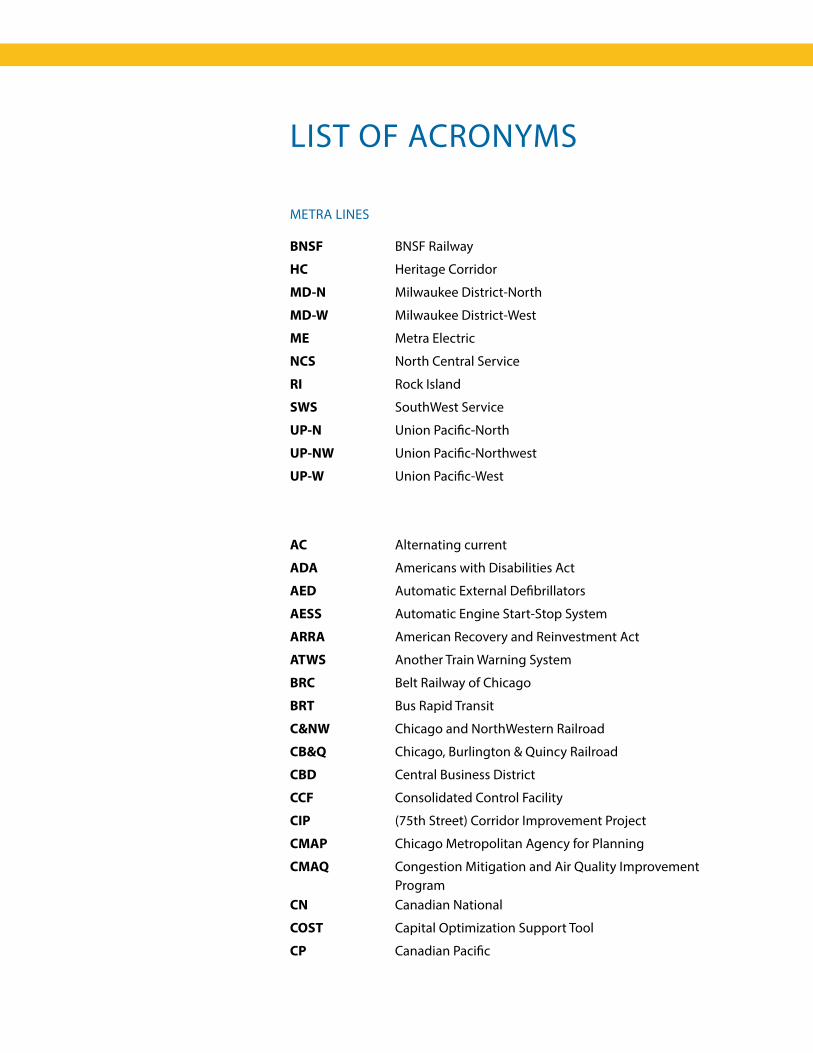
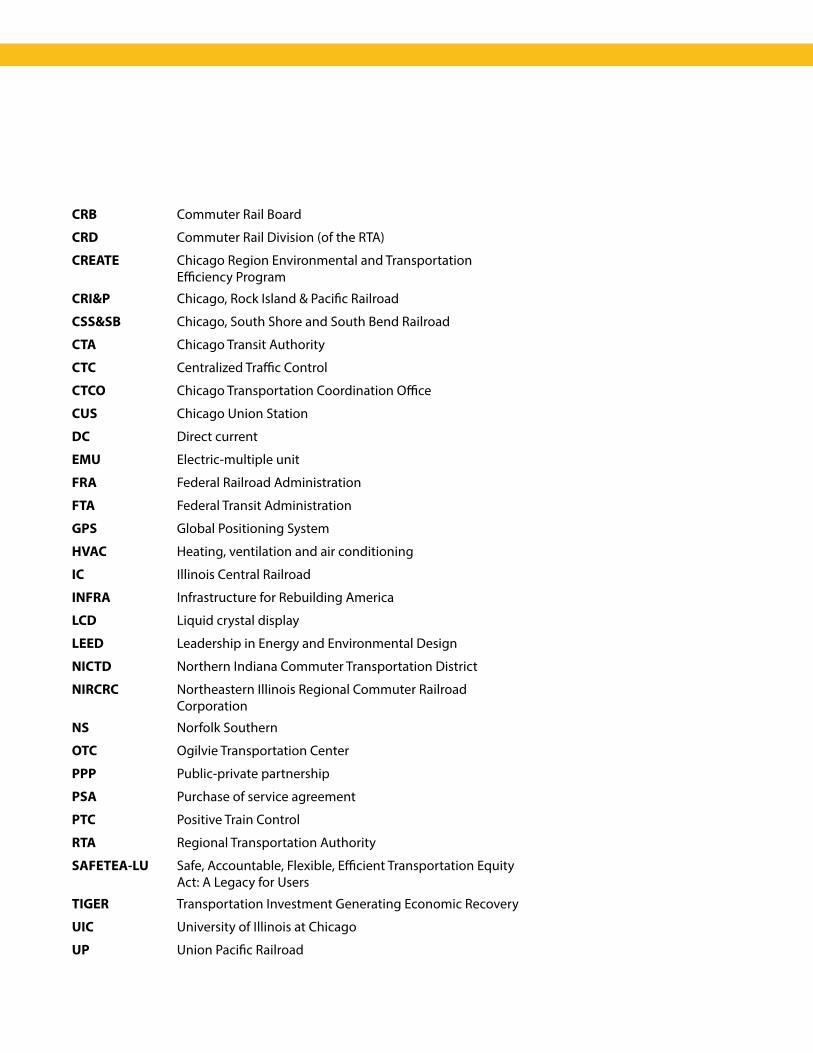
LIST OF ACRONYMS
AC Alternating current
ADA Americans with Disabilities Act
AED Automatic External Defibrillators
AESS Automatic Engine Start-Stop System
ARRA American Recovery and Reinvestment Act
ATWS Another Train Warning System
BRC Belt Railway of Chicago
BRT Bus Rapid Transit
C&NW Chicago and NorthWestern Railroad
CB&Q Chicago, Burlington & Quincy Railroad
CBD Central Business District
CCF Consolidated Control Facility
CIP (75th Street) Corridor Improvement Project
CMAP Chicago Metropolitan Agency for Planning
CMAQ Congestion Mitigation and Air Quality Improvement Program
CN Canadian National
COST Capital Optimization Support Tool
CP Canadian Pacific
BNSF BNSF Railway
HC Heritage Corridor
MD-N Milwaukee District-North
MD-W Milwaukee District-West
ME Metra Electric
NCS North Central Service
RI Rock Island
SWS SouthWest Service
UP-N Union Pacific-North
UP-NW Union Pacific-Northwest
UP-W Union Pacific-West
METRA LINES
CRB Commuter Rail Board
CRD Commuter Rail Division (of the RTA)
CREATE Chicago Region Environmental and Transportation Efficiency Program
CRI&P Chicago, Rock Island & Pacific Railroad
CSS&SB Chicago, South Shore and South Bend Railroad
CTA Chicago Transit Authority
CTC Centralized Traffic Control
CTCO Chicago Transportation Coordination Office
CUS Chicago Union Station
DC Direct current
EMU Electric-multiple unit
FRA Federal Railroad Administration
FTA Federal Transit Administration
GPS Global Positioning System
HVAC Heating, ventilation and air conditioning
IC Illinois Central Railroad
INFRA Infrastructure for Rebuilding America
LCD Liquid crystal display
LEED Leadership in Energy and Environmental Design
NICTD Northern Indiana Commuter Transportation District
NIRCRC Northeastern Illinois Regional Commuter Railroad Corporation
NS Norfolk Southern
OTC Ogilvie Transportation Center
PPP Public-private partnership
PSA Purchase of service agreement
PTC Positive Train Control
RTA Regional Transportation Authority
SAFETEA-LU Safe, Accountable, Flexible, Efficient Transportation Equity Act: A Legacy for Users
TIGER Transportation Investment Generating Economic Recovery
UIC University of Illinois at Chicago
UP Union Pacific Railroad
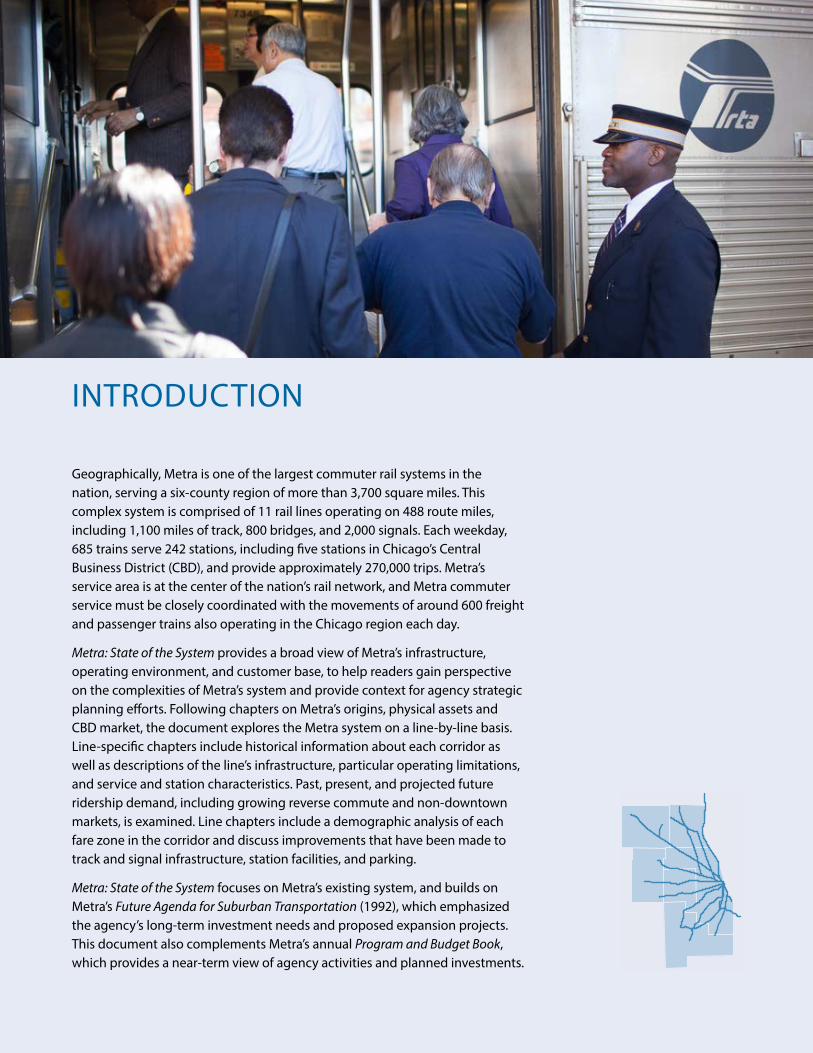
INTRODUCTION
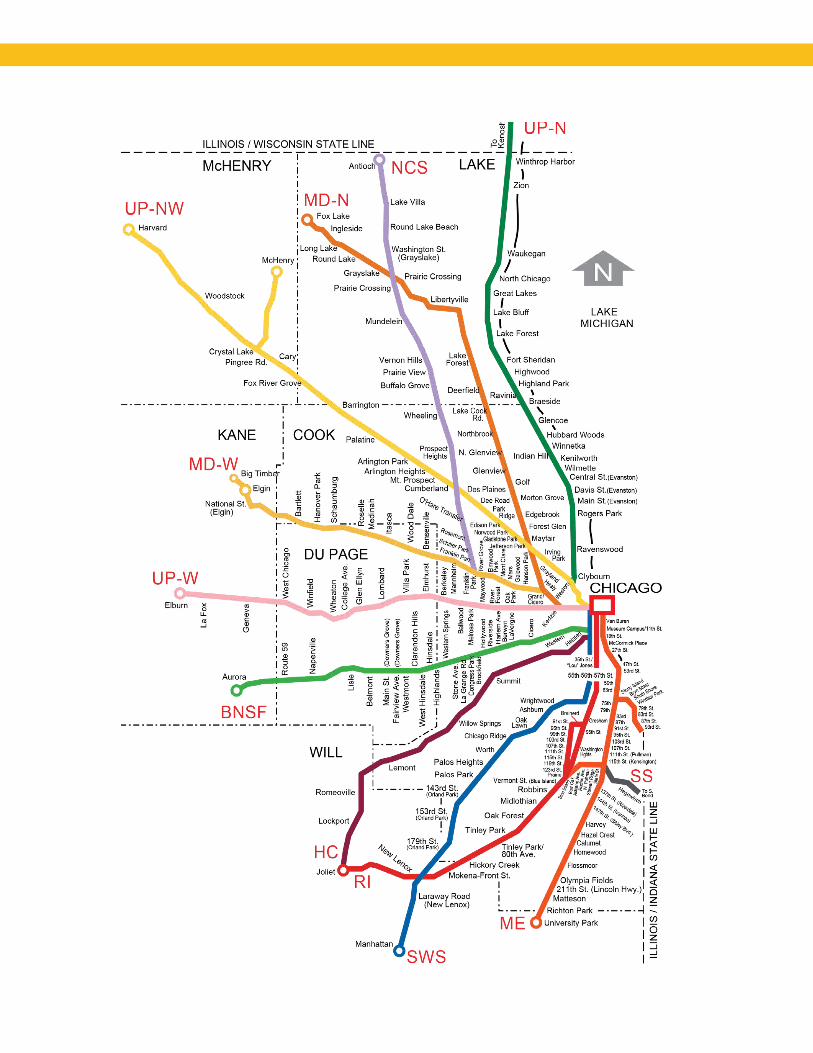
Geographically, Metra is one of the largest commuter rail systems in the nation, serving a six-county region of more than 3,700 square miles. This complex system is comprised of 11 rail lines operating on 488 route miles, including 1,100 miles of track, 800 bridges, and 2,000 signals. Each weekday, 685 trains serve 242 stations, including five stations in Chicago’s Central Business District (CBD), and provide approximately 270,000 trips. Metra’s service area is at the center of the nation’s rail network, and Metra commuter service must be closely coordinated with the movements of around 600 freight and passenger trains also operating in the Chicago region each day.
Metra: State of the System provides a broad view of Metra’s infrastructure, operating environment, and customer base, to help readers gain perspective on the complexities of Metra’s system and provide context for agency strategic planning efforts. Following chapters on Metra’s origins, physical assets and CBD market, the document explores the Metra system on a line-by-line basis. Line-specific chapters include historical information about each corridor as well as descriptions of the line’s infrastructure, particular operating limitations, and service and station characteristics. Past, present, and projected future ridership demand, including growing reverse commute and non-downtown markets, is examined. Line chapters include a demographic analysis of each fare zone in the corridor and discuss improvements that have been made to track and signal infrastructure, station facilities, and parking.
Metra: State of the System focuses on Metra’s existing system, and builds on Metra’s Future Agenda for Suburban Transportation (1992), which emphasized the agency’s long-term investment needs and proposed expansion projects. This document also complements Metra’s annual Program and Budget Book, which provides a near-term view of agency activities and planned investments.
2 | METRA STATE OF THE SYSTEM — INTRODUCTION
HISTORICAL OVERVIEW
The Northeastern Illinois Regional Commuter Railroad Corporation (NIRCRC) is a public corporation of the State of Illinois that was authorized by statute and created by Regional Transportation Authority (RTA) ordinance in 1980. The corporation, commonly known as Metra, is the primary operator of commuter passenger rail services in the six-county Chicago metropolitan area in Northeast Illinois.
The RTA was formed in 1974, initially to provide financial assistance to troubled passenger rail operators and suburban bus companies throughout the region. To keep the patchwork of public transportation providers running, voters in the six-county Chicago area, comprised of Cook, DuPage, Kane, Lake, McHenry and Will Counties, authorized the RTA’s creation.
From the beginning, the RTA’s mission has been to coordinate and assist public transportation and to serve as the conduit for state and federal subsidies needed to keep the system operational. The RTA did not at first directly operate commuter rail service (or any other transit service), but paid private railroads to do so under purchase of service agreements (PSAs). The RTA, along with the suburban Mass Transit Districts, began to reverse decades of disinvestment in the overall commuter rail system, primarily by buying new locomotives and cars. However, with the bankruptcies of the Rock Island and the Milwaukee Road together with the financial difficulties of the Illinois Central, the Illinois General Assembly gave the RTA the authority to directly own and operate (through NIRCRC) commuter railroad operations and the RTA eventually bought the tracks of those railroads over which commuter trains operated.
In 1983, the General Assembly reorganized the RTA into a planning and financial oversight agency (rather than a direct operator of transit service) and created the Commuter Rail Division (CRD) and the Suburban Bus Division (Pace Suburban Bus). Along with the Chicago Transit Authority (CTA), previously established in 1947, the three agencies (now known as service boards) fell under the financial oversight umbrella of the RTA. The CRD is responsible for commuter rail throughout the six Northeast Illinois counties, Pace for the suburban bus and regional ADA paratransit system, and the CTA continues to be responsible for rapid transit and bus service, primarily within the city of Chicago. Under this arrangement, each service board is responsible for day-to-day operations and maintenance, setting fare policy, and planning for services and facilities for their respective systems.
The service mark “Metra” is co-registered and controlled by NIRCRC and CRD. NIRCRC operates as a separate corporation but is governed by the Commuter Rail Board (CRB), which also governs the CRD. The CRB is responsible for the commuter passenger rail operations, capital investments, finances, fare policy, and service and facilities planning for the system. Revenues come
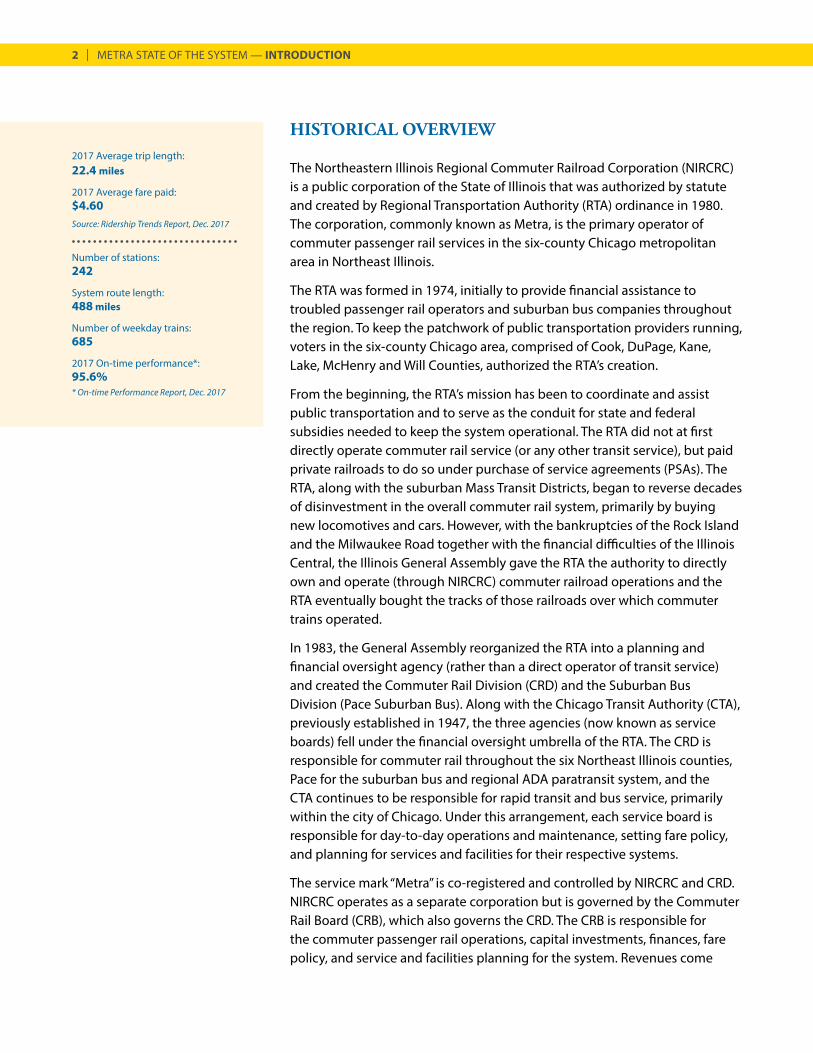
2017 Average trip length:22.4 miles
2017 Average fare paid:$4.60Source: Ridership Trends Report, Dec. 2017
Number of stations:242
System route length:488 miles
Number of weekday trains:685
2017 On-time performance*:95.6%* On-time Performance Report, Dec. 2017
METRA STATE OF THE SYSTEM — INTRODUCTION | 3
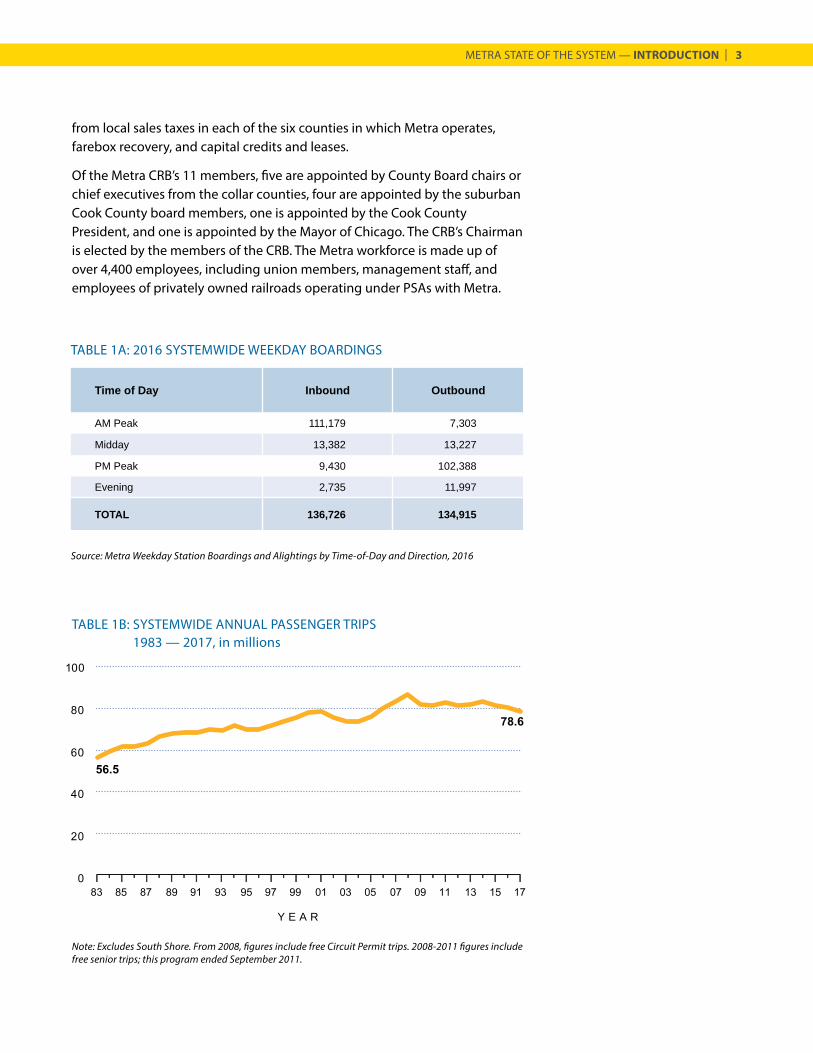
TABLE 1B: SYSTEMWIDE ANNUAL PASSENGER TRIPS1983 — 2017, in millions
Source: Metra Weekday Station Boardings and Alightings by Time-of-Day and Direction, 2016
TABLE 1A: 2016 SYSTEMWIDE WEEKDAY BOARDINGS
Time of Day Inbound Outbound
AM Peak 111,179 7,303
Midday 13,382 13,227
PM Peak 9,430 102,388
Evening 2,735 11,997
TOTAL 136,726 134,915
from local sales taxes in each of the six counties in which Metra operates, farebox recovery, and capital credits and leases.
Of the Metra CRB’s 11 members, five are appointed by County Board chairs or chief executives from the collar counties, four are appointed by the suburban Cook County board members, one is appointed by the Cook County President, and one is appointed by the Mayor of Chicago. The CRB’s Chairman is elected by the members of the CRB. The Metra workforce is made up of over 4,400 employees, including union members, management staff, and employees of privately owned railroads operating under PSAs with Metra.
Y E A R
Note: Excludes South Shore. From 2008, figures include free Circuit Permit trips. 2008-2011 figures include free senior trips; this program ended September 2011.
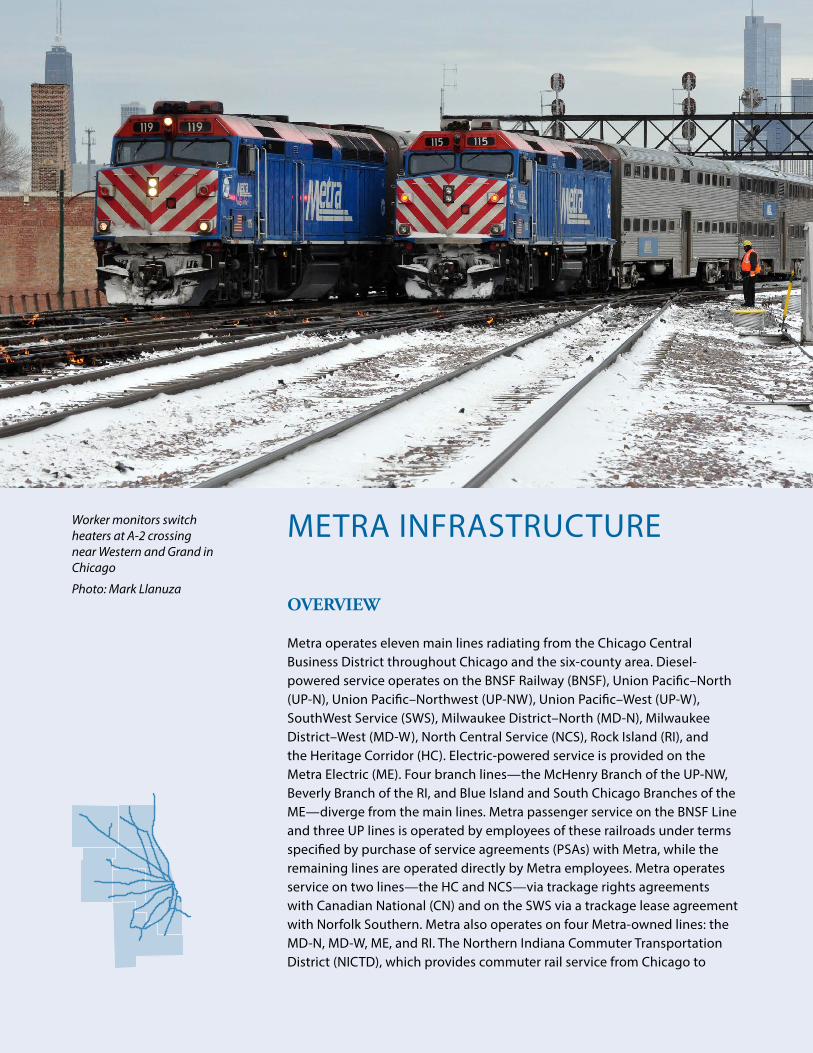
METRA INFRASTRUCTURE
OVERVIEW
Metra operates eleven main lines radiating from the Chicago Central Business District throughout Chicago and the six-county area. Diesel-powered service operates on the BNSF Railway (BNSF), Union Pacific–North (UP-N), Union Pacific–Northwest (UP-NW), Union Pacific–West (UP-W), SouthWest Service (SWS), Milwaukee District–North (MD-N), Milwaukee District–West (MD-W), North Central Service (NCS), Rock Island (RI), and the Heritage Corridor (HC). Electric-powered service is provided on the Metra Electric (ME). Four branch lines—the McHenry Branch of the UP-NW, Beverly Branch of the RI, and Blue Island and South Chicago Branches of the ME—diverge from the main lines. Metra passenger service on the BNSF Line and three UP lines is operated by employees of these railroads under terms specified by purchase of service agreements (PSAs) with Metra, while the remaining lines are operated directly by Metra employees. Metra operates service on two lines—the HC and NCS—via trackage rights agreements with Canadian National (CN) and on the SWS via a trackage lease agreement with Norfolk Southern. Metra also operates on four Metra-owned lines: the MD-N, MD-W, ME, and RI. The Northern Indiana Commuter Transportation District (NICTD), which provides commuter rail service from Chicago to
Worker monitors switch heaters at A-2 crossing near Western and Grand in Chicago
Photo: Mark Llanuza
METRA STATE OF THE SYSTEM — METRA INFRASTRUCTURE | 5
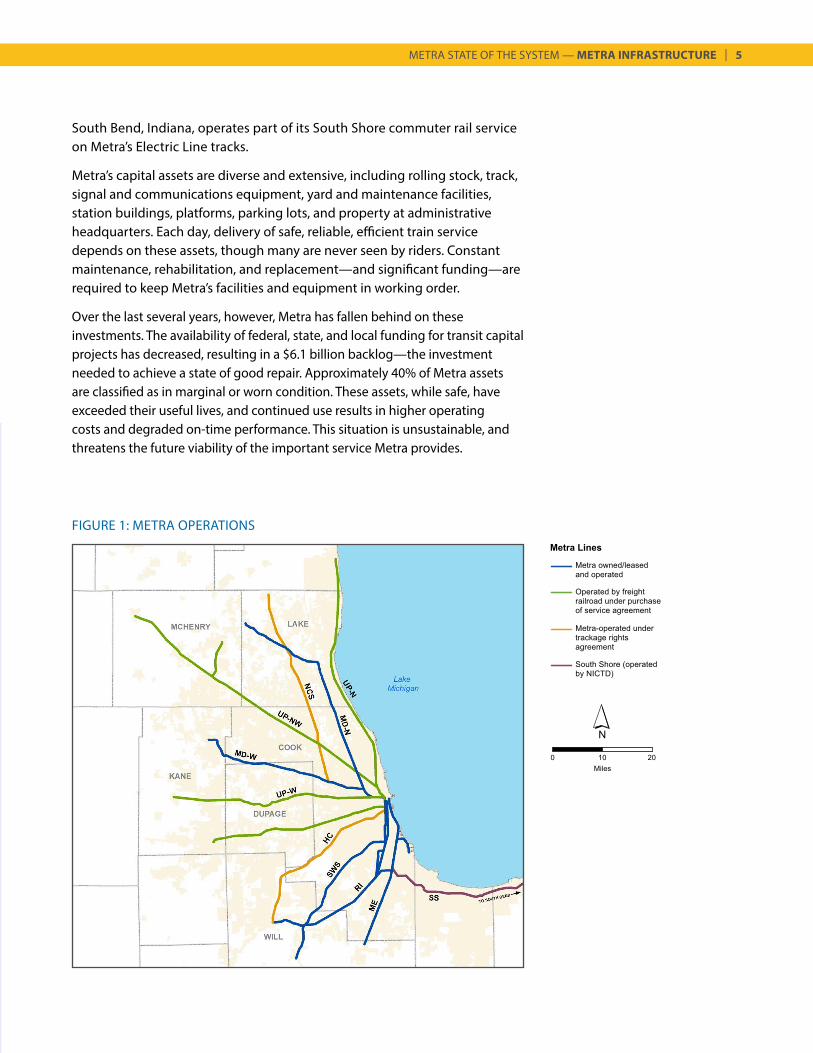
FIGURE 1: METRA OPERATIONS
South Bend, Indiana, operates part of its South Shore commuter rail service on Metra’s Electric Line tracks.
Metra’s capital assets are diverse and extensive, including rolling stock, track, signal and communications equipment, yard and maintenance facilities, station buildings, platforms, parking lots, and property at administrative headquarters. Each day, delivery of safe, reliable, efficient train service depends on these assets, though many are never seen by riders. Constant maintenance, rehabilitation, and replacement—and significant funding—are required to keep Metra’s facilities and equipment in working order.
Over the last several years, however, Metra has fallen behind on these investments. The availability of federal, state, and local funding for transit capital projects has decreased, resulting in a $6.1 billion backlog—the investment needed to achieve a state of good repair. Approximately 40% of Metra assets are classified as in marginal or worn condition. These assets, while safe, have exceeded their useful lives, and continued use results in higher operating costs and degraded on-time performance. This situation is unsustainable, and threatens the future viability of the important service Metra provides.
6 | METRA STATE OF THE SYSTEM — METRA INFRASTRUCTURE
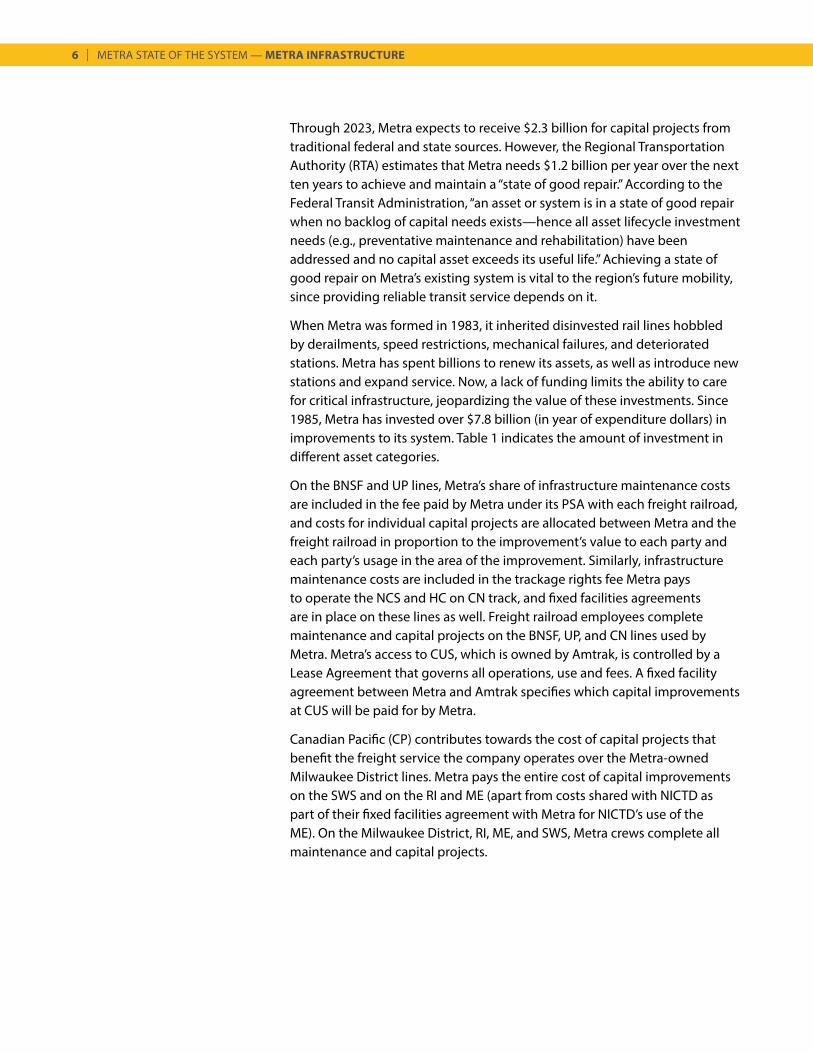
Through 2023, Metra expects to receive $2.3 billion for capital projects from traditional federal and state sources. However, the Regional Transportation Authority (RTA) estimates that Metra needs $1.2 billion per year over the next ten years to achieve and maintain a “state of good repair.” According to the Federal Transit Administration, “an asset or system is in a state of good repair when no backlog of capital needs exists—hence all asset lifecycle investment needs (e.g., preventative maintenance and rehabilitation) have been addressed and no capital asset exceeds its useful life.” Achieving a state of good repair on Metra’s existing system is vital to the region’s future mobility, since providing reliable transit service depends on it.
When Metra was formed in 1983, it inherited disinvested rail lines hobbled by derailments, speed restrictions, mechanical failures, and deteriorated stations. Metra has spent billions to renew its assets, as well as introduce new stations and expand service. Now, a lack of funding limits the ability to care for critical infrastructure, jeopardizing the value of these investments. Since 1985, Metra has invested over $7.8 billion (in year of expenditure dollars) in improvements to its system. Table 1 indicates the amount of investment in different asset categories.
On the BNSF and UP lines, Metra’s share of infrastructure maintenance costs are included in the fee paid by Metra under its PSA with each freight railroad, and costs for individual capital projects are allocated between Metra and the freight railroad in proportion to the improvement’s value to each party and each party’s usage in the area of the improvement. Similarly, infrastructure maintenance costs are included in the trackage rights fee Metra pays to operate the NCS and HC on CN track, and fixed facilities agreements are in place on these lines as well. Freight railroad employees complete maintenance and capital projects on the BNSF, UP, and CN lines used by Metra. Metra’s access to CUS, which is owned by Amtrak, is controlled by a Lease Agreement that governs all operations, use and fees. A fixed facility agreement between Metra and Amtrak specifies which capital improvements at CUS will be paid for by Metra.
Canadian Pacific (CP) contributes towards the cost of capital projects that benefit the freight service the company operates over the Metra-owned Milwaukee District lines. Metra pays the entire cost of capital improvements on the SWS and on the RI and ME (apart from costs shared with NICTD as part of their fixed facilities agreement with Metra for NICTD’s use of the ME). On the Milwaukee District, RI, ME, and SWS, Metra crews complete all maintenance and capital projects.
METRA STATE OF THE SYSTEM — METRA INFRASTRUCTURE | 7
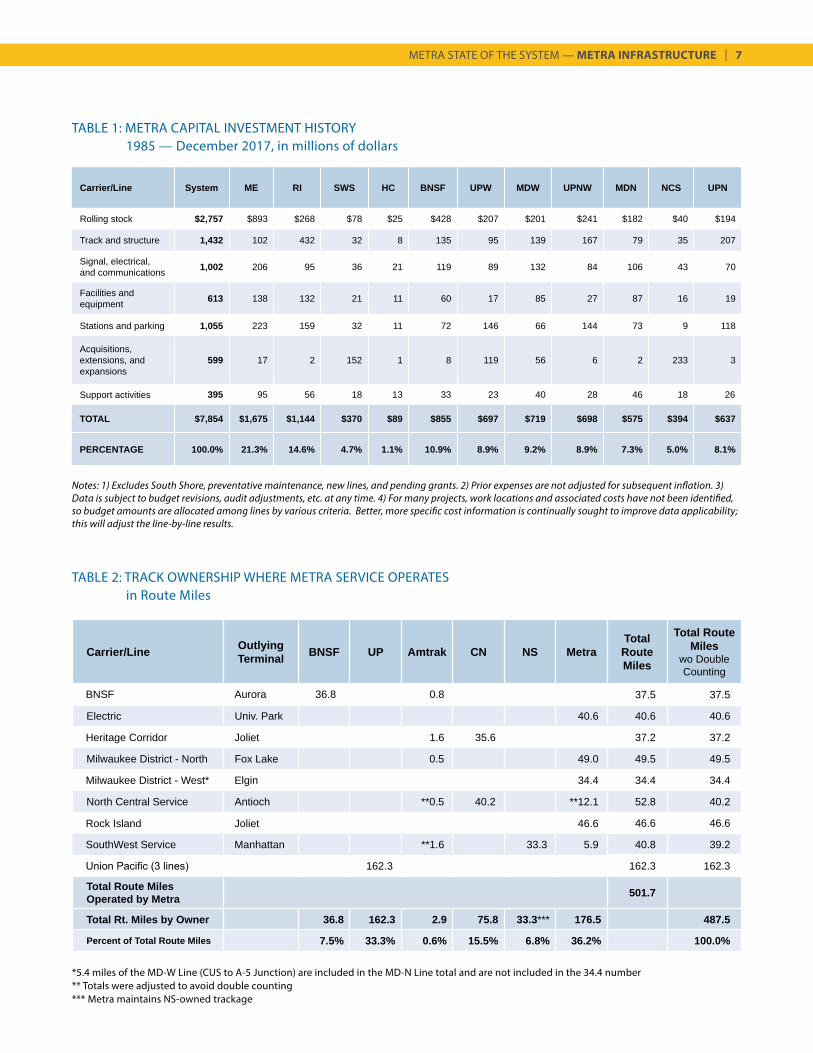
TABLE 2: TRACK OWNERSHIP WHERE METRA SERVICE OPERATES in Route Miles
Carrier/Line System ME RI SWS HC BNSF UPW MDW UPNW MDN NCS UPN
Rolling stock $2,757 $893 $268 $78 $25 $428 $207 $201 $241 $182 $40 $194
Track and structure 1,432 102 432 32 8 135 95 139 167 79 35 207
Signal, electrical, and communications 1,002 206 95 36 21 119 89 132 84 106 43 70
Facilities and equipment 613 138 132 21 11 60 17 85 27 87 16 19
Stations and parking 1,055 223 159 32 11 72 146 66 144 73 9 118
Acquisitions, extensions, and expansions
599 17 2 152 1 8 119 56 6 2 233 3
Support activities 395 95 56 18 13 33 23 40 28 46 18 26
TOTAL $7,854 $1,675 $1,144 $370 $89 $855 $697 $719 $698 $575 $394 $637
PERCENTAGE 100.0% 21.3% 14.6% 4.7% 1.1% 10.9% 8.9% 9.2% 8.9% 7.3% 5.0% 8.1%
Carrier/Line Outlying Terminal BNSF UP Amtrak CN NS Metra
Total Route Miles
Total Route Miles
wo Double Counting
BNSF Aurora 36.8 0.8 37.5 37.5
Electric Univ. Park 40.6 40.6 40.6
Heritage Corridor Joliet 1.6 35.6 37.2 37.2
Milwaukee District - North Fox Lake 0.5 49.0 49.5 49.5
Milwaukee District - West* Elgin 34.4 34.4 34.4
North Central Service Antioch **0.5 40.2 **12.1 52.8 40.2
Rock Island Joliet 46.6 46.6 46.6
SouthWest Service Manhattan **1.6 33.3 5.9 40.8 39.2
Union Pacific (3 lines) 162.3 162.3 162.3
Total Route Miles Operated by Metra 501.7
Total Rt. Miles by Owner 36.8 162.3 2.9 75.8 33.3*** 176.5 487.5
Percent of Total Route Miles 7.5% 33.3% 0.6% 15.5% 6.8% 36.2% 100.0%
Notes: 1) Excludes South Shore, preventative maintenance, new lines, and pending grants. 2) Prior expenses are not adjusted for subsequent inflation. 3) Data is subject to budget revisions, audit adjustments, etc. at any time. 4) For many projects, work locations and associated costs have not been identified, so budget amounts are allocated among lines by various criteria. Better, more specific cost information is continually sought to improve data applicability; this will adjust the line-by-line results.
*5.4 miles of the MD-W Line (CUS to A-5 Junction) are included in the MD-N Line total and are not included in the 34.4 number** Totals were adjusted to avoid double counting*** Metra maintains NS-owned trackage
TABLE 1: METRA CAPITAL INVESTMENT HISTORY 1985 — December 2017, in millions of dollars
8 | METRA STATE OF THE SYSTEM — METRA INFRASTRUCTURE
TRACK AND STRUCTURE
Each weekday, Metra commuter trains travel over approximately 1,100 miles of track—the backbone of Metra’s system. A Metra locomotive weighs approximately 130 tons, and each train car weighs between 60 and 70 tons. A tough yet precisely calibrated system sustains this massive weight and the forces it generates. Steel rails—secured by spikes, tie plates and crossties—rest on a bed of crushed rock ballast, stabilized by the subgrade material used to build the rail embankment. These layers work together to anchor the track in place, provide drainage, and distribute the weight of the traffic passing overhead. Supporting structures such as bridges and retaining walls are also critical to track performance. Preventing and repairing damage caused by moisture, temperature extremes, and vandalism are ongoing activities of Metra track crews. Timely renewal and realignment of track components maintains safety and ride quality, reduces wear and tear on rolling stock, preserves on-time performance, and helps manage operating costs. Since 2009, 100% of Metra-owned mainline track has consisted of continuous-welded rail, which is stronger, provides better ride quality, and requires less maintenance than the jointed rail it replaced.
Metra has established inspection and renewal cycles for track and structure elements. Due to budget constraints, however, these cycles are often longer than industry best practice. Metra replaces 80,000 cross ties each year, so that every tie in the system is replaced every 21 years. Track resurfacing—compacting ballast and realigning track—is completed across the system on a four-year cycle. At highway-rail grade crossings, the rate of deterioration varies widely, based on the volume of vehicular traffic. Metra renews 12 road crossings each year, replacing cross ties, crossing material, and ballast, rewiring signals, and resurfacing the track at each location.
Since the agency was formed in 1984, Metra has built or replaced approximately 120 of the 823 bridges across its network, some over a century old. Rehabilitation and replacement of aging bridges is ongoing, and recent bridge projects include replacing a 136-year-old single-track bridge with a new double-track bridge on the MD-W, as well as the continued replacement or repair of century-old bridges at 14 locations along the UP-N line. Retaining wall rehabilitation prevents deterioration, which can destabilize the roadbed and lead to track shifting. Railroad embankments may need to be stabilized to prevent erosion. In addition to scheduled work, broken or deteriorated components must be replaced as needed. Track work takes place during midday, weekend, and overnight periods to minimize risk to employees and reduce delays to passengers.
Like most mainline track mileage in the United States, the majority of Metra’s system qualifies as Class 4 according to the Federal Railroad Administration’s (FRA) track class standards. However, Metra inspects and maintains its track
METRA STATE OF THE SYSTEM — METRA INFRASTRUCTURE | 9
to meet more demanding Class 5 standards. The FRA defines track classes according to a number of criteria, including curvature, inspection frequency, and adherence to mandated parameters (for gauge, height, alignment, and other factors), and a track segment’s FRA rating determines the maximum allowable speed for passenger and freight trains operating on the segment. For example, standard track gauge of North American railroads is 4 feet 8 ½ inches between rails (as measured from 5/8 of an inch below the top of the rail). To qualify as Class 5 track, gauge cannot be less than 4 feet 8 inches or more than 4 feet 9 ½ inches. To ensure that Metra track continues to meet this and other standards, all 190 miles of Metra-owned track are visually inspected two to three times each week, and inspected twice a year using specialized rail equipment. Ongoing track and right-of-way maintenance activities also include electronic rail defect testing, right-of-way fencing repair, and vegetation control.
The availability of multiple tracks, with crossovers at strategic locations, are factors that help determine service frequency and passenger travel time. Within double or triple track segments, Metra trains can pass slower trains and meet traffic in the opposite direction without stopping, which increases throughput and allows for a greater combination of stopping patterns, including express service.
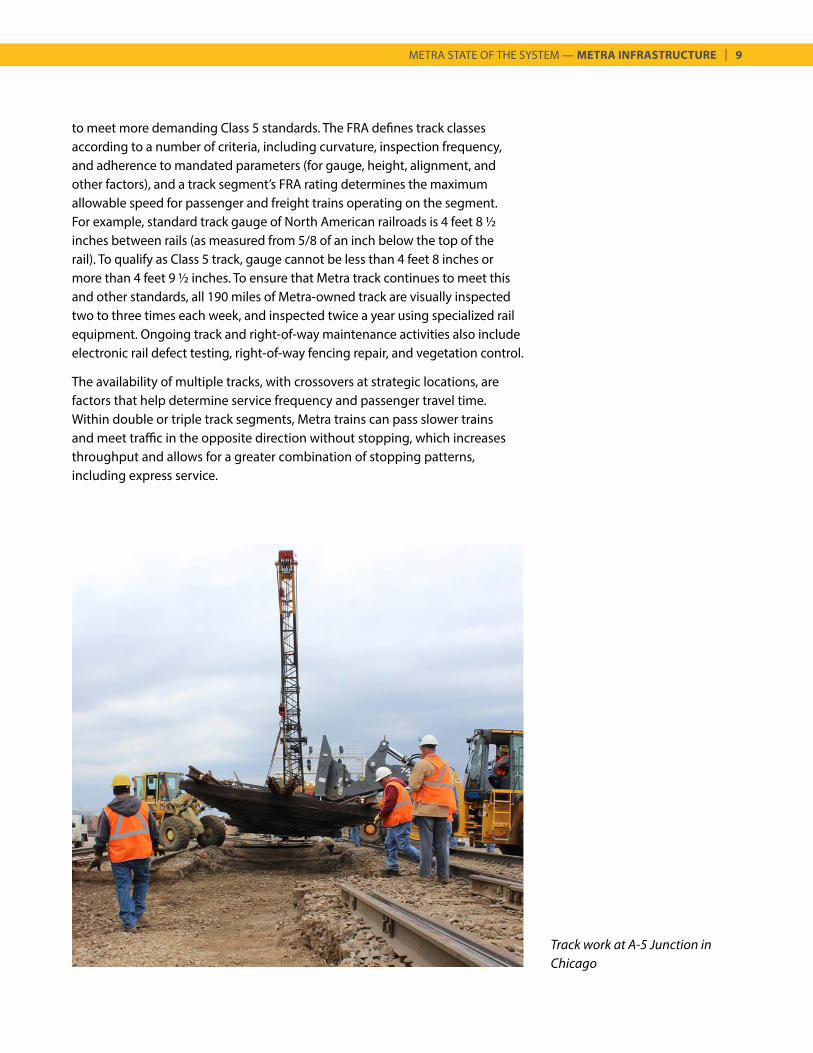
Track work at A-5 Junction in Chicago
10 | METRA STATE OF THE SYSTEM — METRA INFRASTRUCTURE
The BNSF Line and ME main line offer the highest-frequency service of all Metra lines, made possible by triple or quadruple track throughout the lines, high-speed crossovers, and advanced signals that allow closer spacing of trains. Stations on these lines are divided into zones, and many peak-period trains stop at stations within a particular zone before running express to stations in or near downtown Chicago. Where track capacity is more limited, such as on the UP-N, MD-N and MD-W, schedules combine this type of “zone express” service with limited stop service that serves certain stations with alternate trains, to provide faster travel times than all-stop “local” service.
Minimizing trip times allows trainsets to be “recycled” for a greater number of trips during high-demand periods. During the AM peak period, for example, a single trainset on the BNSF completes as many as three inbound trips. Scheduling “short turns” (trips that do not extend the full length of the line), splitting a single consist (or “trainset”) into two, and running “deadhead” trains (non-stop, non-passenger trains traveling in the non-peak direction), are other strategies to maximize service frequency and use rolling stock most productively.
Besides the scheduling benefits they offer, segments of multiple track are less vulnerable to blockages caused by disabled trains, and allow service to recover more quickly following disruptions. However, the costs of track expansion projects can be very high. In addition to the cost of the track and right-of-way work itself, costs of signal system modifications, with land acquisition and bridge widening, if required, must be funded before track expansion projects can be pursued.
Chicago Region Environmental and Transportation Efficiency (CREATE) Program
The CREATE program consists of 70 projects designed to reduce and remove passenger and freight train congestion in the Chicago area. The program has a projected total cost of $4.4 billion. CREATE funding partners include freight railroads, Amtrak, Metra, and the Illinois and Chicago Departments of Transportation. The partners have also pursued federal funding, resulting in an American Recovery and Reinvestment Act (ARRA) high-speed rail grant, two Transportation Investment Generating Economic Recovery (TIGER) grants, and a SAFETEA-LU provision worth approximately $335 million. In 2018, the CREATE partners were awarded a federal INFRA grant for $132 million in funding for the 75th Street Corridor Improvement Program (CIP). As of June 2018, 29 CREATE projects have been completed since 2005 and five projects are under construction. The remainder may be completed as funds become available.
A number of CREATE projects are designed to improve Metra operations and benefit riders. Road-rail grade separations at Belmont Avenue in Downers
METRA STATE OF THE SYSTEM — METRA INFRASTRUCTURE | 11
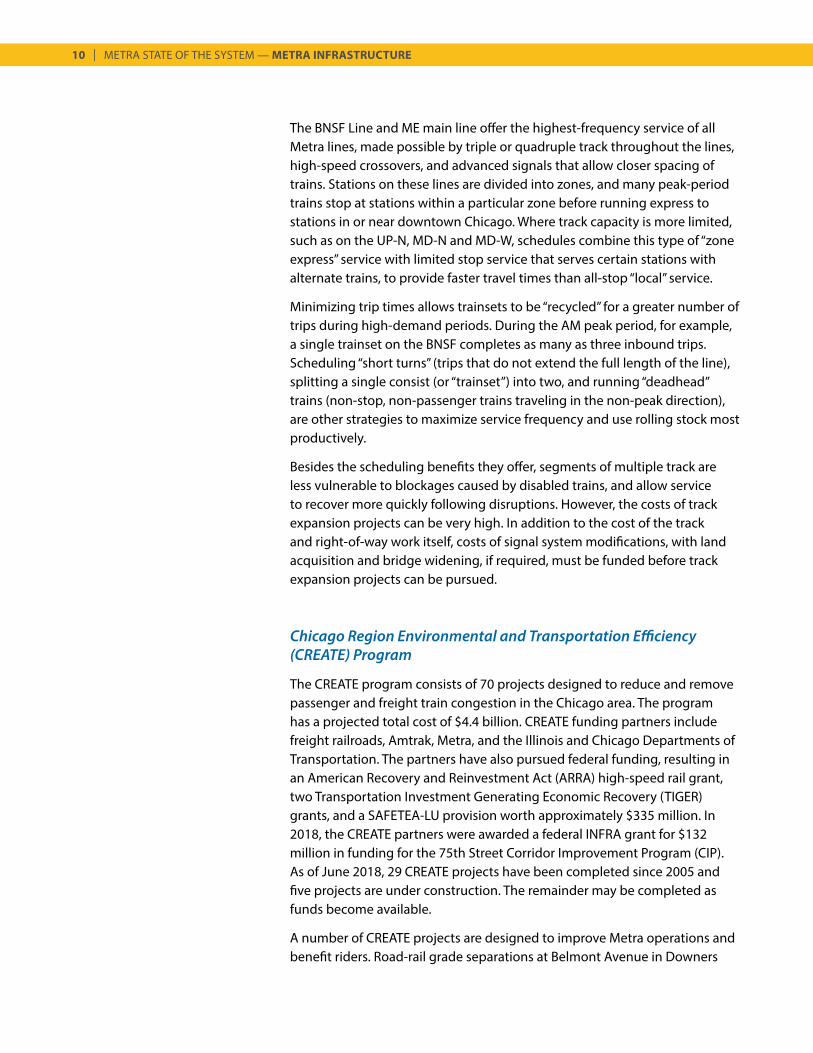
Grove (BNSF) and Roosevelt Road in West Chicago (UP-W) have been completed, and several other road-rail grade separations are planned. A rail-rail grade separation known as the Englewood Flyover, which eliminated conflicts between RI trains and freight and Amtrak trains at a critical junction, was completed in 2014. Crews also recently completed projects to improve the connection between UP and Indiana Harbor Belt tracks near UP’s Proviso freight yard in Melrose Park and to extend third main line track adjacent to the yard. These projects included the construction of new Berkeley and Bellwood Stations on Metra’s UP-W Line, and the addition of pedestrian underpasses at each station.
On the MD-W, a CREATE project will install five crossovers and associated signaling in Franklin Park. The project, set to start construction in spring 2018, will reduce conflicts between Metra trains and slower- moving freight trains near the entrance to CP’s Bensenville Yard. On the SWS, the largest CREATE project, the 75th Street CIP, will decrease the number of freight and commuter train conflicts. Construction of a flyover will re-route SWS trains from Chicago Union Station to LaSalle Street Station, reducing congestion at CUS, Metra’s busiest downtown terminal. Besides the federal INFRA grant award mentioned earlier, additional funding is required to complete this project.
Construction of the Englewood Flyover has eliminated conflicts between RI trains and freight and Amtrak trains at a critical rail junction near 63rd Street in Chicago
12 | METRA STATE OF THE SYSTEM — METRA INFRASTRUCTURE
SIGNAL, ELECTRICAL AND COMMUNICATIONS
Signal
Signals convey information to locomotive engineers about the track ahead using color lights illuminated in various configurations. Signal appliances include wayside signals and track switches that safely guide trains from one track or block to another and help prevent rear end and head on collisions. (An arrangement of signals and signal appliances so interconnected that movements made through them must succeed each other in proper sequence is an interlocking, which may be automatic or controlled by an operator.) In Metra’s system, signals are controlled by dispatchers or operators working at a central control center or control tower. Signals govern the movement of trains as they travel through a series of track segments, or blocks, that make up a line. Power sources and other auxiliary equipment are housed in signal bungalows and cases along the railroad right-of-way.
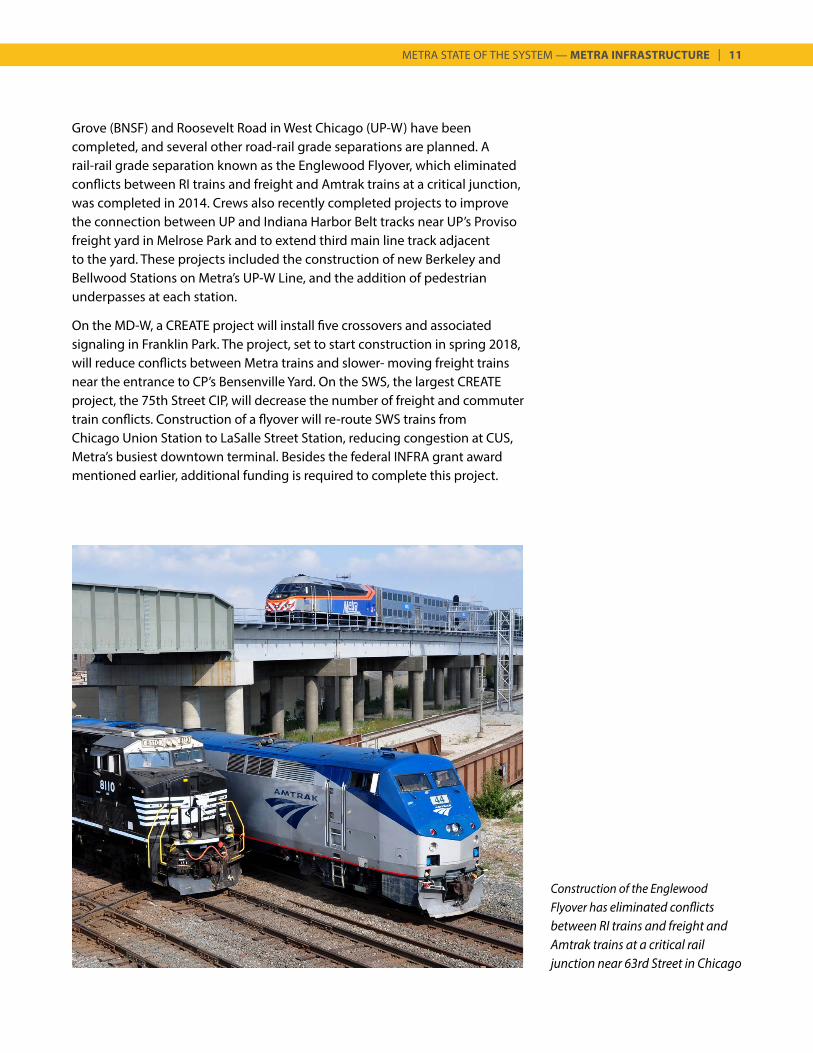
Signal systems allow multiple trains traveling in the same or opposite directions to operate safely between blocks, and the spacing of signal components and the type of technology used impacts the operating efficiency and traffic capacity on a line. Metra train movements are guided by approximately 2,000 wayside signals. Due to differences in operating patterns (e.g., train length, speed, stopping frequency) and safe braking distances, optimal signal spacing and block length varies for passenger and freight trains—an issue in Chicago’s dense rail hub, where Metra, freight,
Signal maintenance worker
METRA STATE OF THE SYSTEM — METRA INFRASTRUCTURE | 13
and Amtrak trains frequently share the same track. Railroad signal systems are integrated with automatic warning devices, such as flashing lights and gate arms, which are activated at roadway and pedestrian crossings when track circuits detect an approaching train.
Much of Metra’s signal infrastructure is outdated and in need of replacement, and Metra has prioritized the replacement of a number of aging interlockings. The A-2 interlocking, where three sets of Milwaukee District tracks cross over four sets of UP-W Line tracks near Grand and Western Avenues in Chicago, is particularly important. More than 350 Metra, freight, and Amtrak trains move through the area each day, and movements are controlled by 31 switches. A-2 failures affect a large number of Metra riders with over one-quarter travelling through the crossing on a typical weekday. On-time service for three other Metra lines (UP-N, UP-NW, and HC) also relies on this interlocking as A-2 directs these trains to and from facilities for maintenance or servicing.
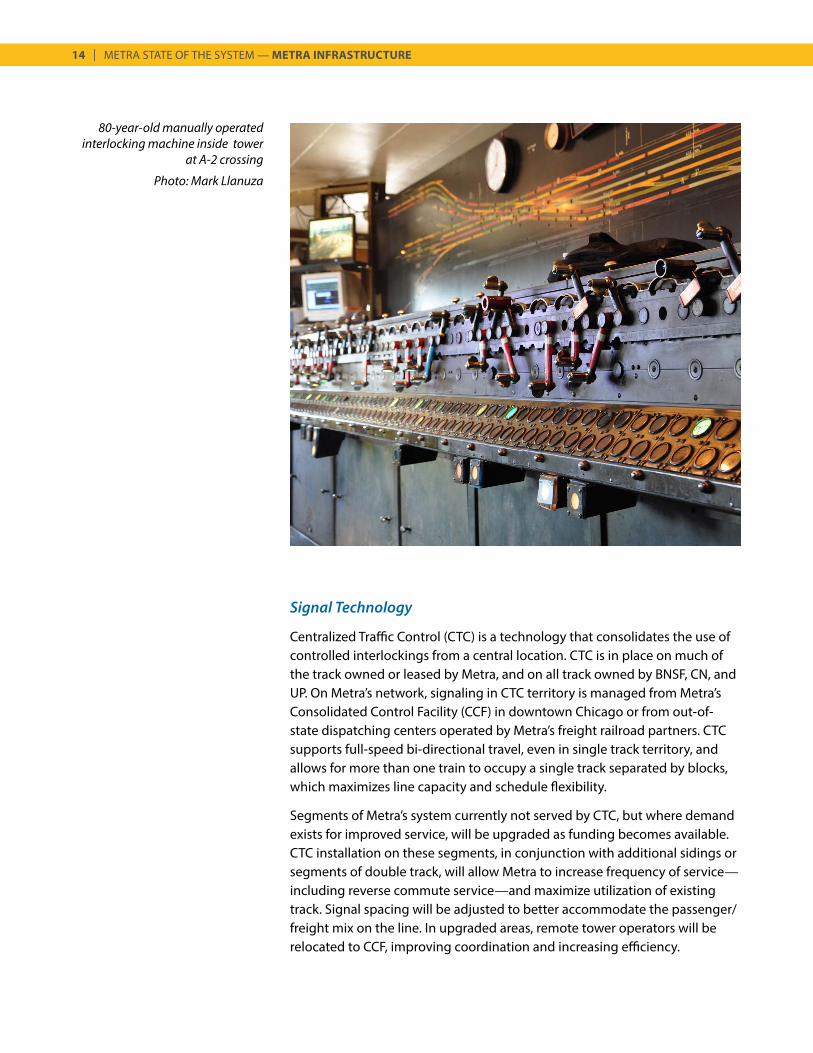
A-2 is controlled by a manually operated interlocking machine so massive that it occupies a large portion of the second floor of the tower next door. The tower operator activates track switches by moving levers on the machine, clearing a protected path for trains through the crossing. The interlocker’s many moving parts require frequent maintenance and are vulnerable to breakdowns. Installed in 1932, it has reached the end of its useful life and needs to be replaced. The configuration of the junction itself is also a source of delay—Metra trains must slow to 20 miles per hour to move through the crossing, and with so much traffic, trains must frequently wait for others to cross.
Several solutions to the issues at A-2 are being evaluated. Potential options—ranging from least to most expensive—include rebuilding the crossing at its current location, relocating the crossing one mile east (away from maintenance facility entrances), or grade separating some or all of the crossing (to significantly reduce or completely eliminate conflicts between cross-traffic).
At A-2 and elsewhere, many replacement parts for Metra’s signal equipment are no longer available from manufacturers or resellers and must be custom-made. Continued use of aging components also prevents Metra from taking advantage of efficiencies built into new equipment including fewer moving parts, automation, remote activation and energy efficiency. New equipment requires less maintenance and experience fewer breakdowns.
14 | METRA STATE OF THE SYSTEM — METRA INFRASTRUCTURE
80-year-old manually operated interlocking machine inside tower
at A-2 crossing
Photo: Mark Llanuza
Signal Technology
Centralized Traffic Control (CTC) is a technology that consolidates the use of controlled interlockings from a central location. CTC is in place on much of the track owned or leased by Metra, and on all track owned by BNSF, CN, and UP. On Metra’s network, signaling in CTC territory is managed from Metra’s Consolidated Control Facility (CCF) in downtown Chicago or from out-of-state dispatching centers operated by Metra’s freight railroad partners. CTC supports full-speed bi-directional travel, even in single track territory, and allows for more than one train to occupy a single track separated by blocks, which maximizes line capacity and schedule flexibility.
Segments of Metra’s system currently not served by CTC, but where demand exists for improved service, will be upgraded as funding becomes available. CTC installation on these segments, in conjunction with additional sidings or segments of double track, will allow Metra to increase frequency of service—including reverse commute service—and maximize utilization of existing track. Signal spacing will be adjusted to better accommodate the passenger/freight mix on the line. In upgraded areas, remote tower operators will be relocated to CCF, improving coordination and increasing efficiency.
METRA STATE OF THE SYSTEM — METRA INFRASTRUCTURE | 15
Lightly used portions of Metra’s system, including the Beverly Branch (RI) and McHenry Branch (UP-NW), are non-signalized (or dark territory). In these areas, train movements are managed by dispatchers using proper permission forms and procedures. Dark territory will be eliminated with the implementation of Positive Train Control (see page 18).
Electrical
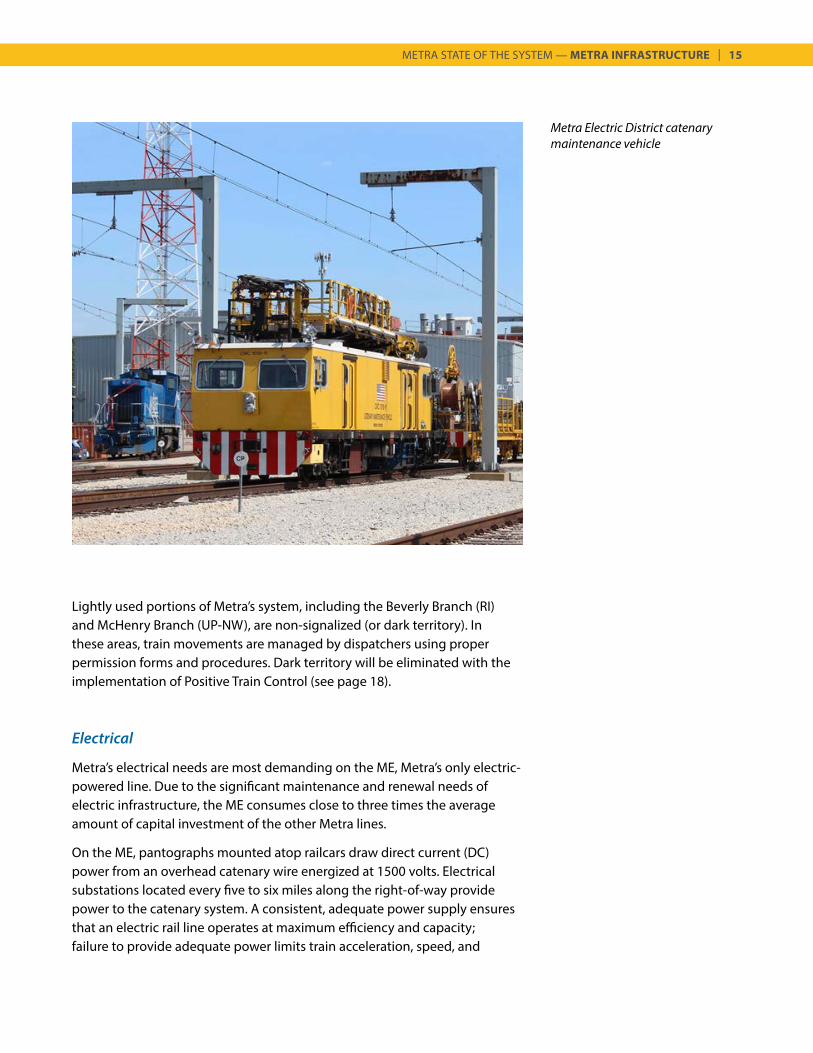
Metra’s electrical needs are most demanding on the ME, Metra’s only electric-powered line. Due to the significant maintenance and renewal needs of electric infrastructure, the ME consumes close to three times the average amount of capital investment of the other Metra lines.
On the ME, pantographs mounted atop railcars draw direct current (DC) power from an overhead catenary wire energized at 1500 volts. Electrical substations located every five to six miles along the right-of-way provide power to the catenary system. A consistent, adequate power supply ensures that an electric rail line operates at maximum efficiency and capacity; failure to provide adequate power limits train acceleration, speed, and
Metra Electric District catenary maintenance vehicle
16 | METRA STATE OF THE SYSTEM — METRA INFRASTRUCTURE
consist length. Underpowered lines are vulnerable to outages and service disruptions, particularly during peak times. Since the new ME railcars are heavier and accelerate faster than the cars they are replacing, Metra is adding substations, and upgrading existing ones, to meet the power demands of the higher-performance equipment.
Metra is working on a number of projects to upgrade electric equipment throughout its system. These include replacement of aging cable reels (used to connect railcars to head-end power supplied by locomotives) and switchgear (part of the system used to power wayside equipment). In rail yards, heaters are being added to switches to ensure functionality in cold weather, and lighting in yards and repair shops will be replaced with modern, more efficient equipment.
Communications
In the Chicago region, the tightly choreographed movements of more than 1,300 commuter, freight and Amtrak trains each day depend on constant communication between rail carriers. Approximately 65% of freight trains operating in the region interact with Metra in some way, either by crossing tracks used by Metra trains or sharing track with commuter service. No other commuter railroad in North America has such a complex interface with other railroads.
Dispatchers manage train movements through an assigned territory, while control operators direct traffic through particular interlockings and determine which train has priority when multiple trains approach an interlocking at the same time. Train priority is based on the class of train (e.g., passenger or freight, and various types of each) and other factors. At rail-rail grade crossings, the railroad in control of the crossing may prioritize its own trains over those of other carriers. Lower priority trains are more vulnerable to delays, since they can be made to wait at junctions until other trains clear the crossing. Freight interference accounts for a significant amount of delay experienced by Metra riders, and Metra lines with many at-grade rail intersections controlled by other railroads, such as the HC and SWS, are most affected by this issue.
For a three-hour period twice each weekday, freight railroads in the Chicago area significantly curtail their operations on track shared with Metra in order to protect peak-period commuter schedules, but some railroads do attempt to move some of their traffic in the small windows between Metra trains. Most freight interference with Metra trains is due to conflicts with cross traffic at at-grade intersections.
Generally, a railroad’s owner is responsible for dispatching the line. Metra’s BNSF Line is dispatched from Fort Worth, Texas, Metra’s three UP lines from Omaha, Nebraska, and the NCS and HC from CN’s facility in Homewood, Illinois.
METRA STATE OF THE SYSTEM — METRA INFRASTRUCTURE | 17
Metra trains near Union Station are dispatched by Amtrak from its Chicago Control Center. Different segments of the SWS, which is leased by Metra from NS, are dispatched by NS, Metra, and Amtrak. Metra dispatches its RI and ME lines. The Milwaukee District, owned and operated by Metra but dispatched by CP from Minneapolis, is a notable exception. CP operates freight trains over Metra-owned track and owns track beyond the extent of commuter service (north of Rondout Junction on the MD-N; west of Big Timber Road Station on the MD-W). This arrangement predates Metra’s acquisition of the Milwaukee District in 1987.
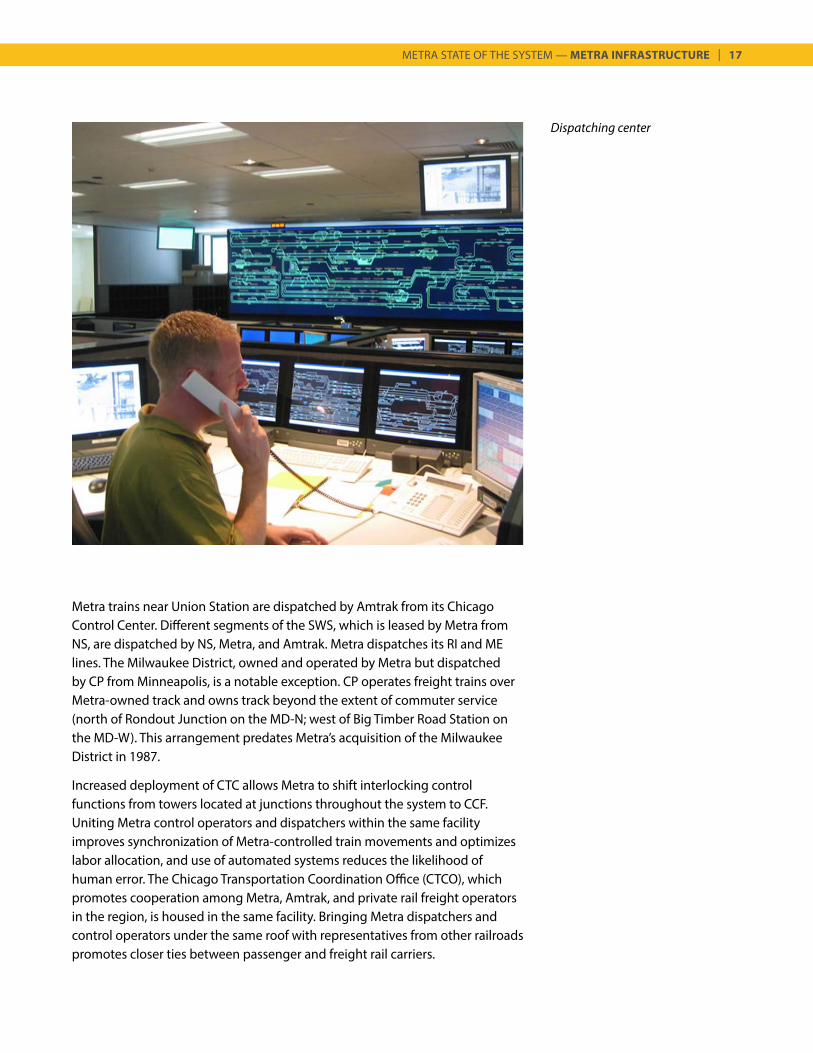
Increased deployment of CTC allows Metra to shift interlocking control functions from towers located at junctions throughout the system to CCF. Uniting Metra control operators and dispatchers within the same facility improves synchronization of Metra-controlled train movements and optimizes labor allocation, and use of automated systems reduces the likelihood of human error. The Chicago Transportation Coordination Office (CTCO), which promotes cooperation among Metra, Amtrak, and private rail freight operators in the region, is housed in the same facility. Bringing Metra dispatchers and control operators under the same roof with representatives from other railroads promotes closer ties between passenger and freight rail carriers.
Dispatching center
18 | METRA STATE OF THE SYSTEM — METRA INFRASTRUCTURE
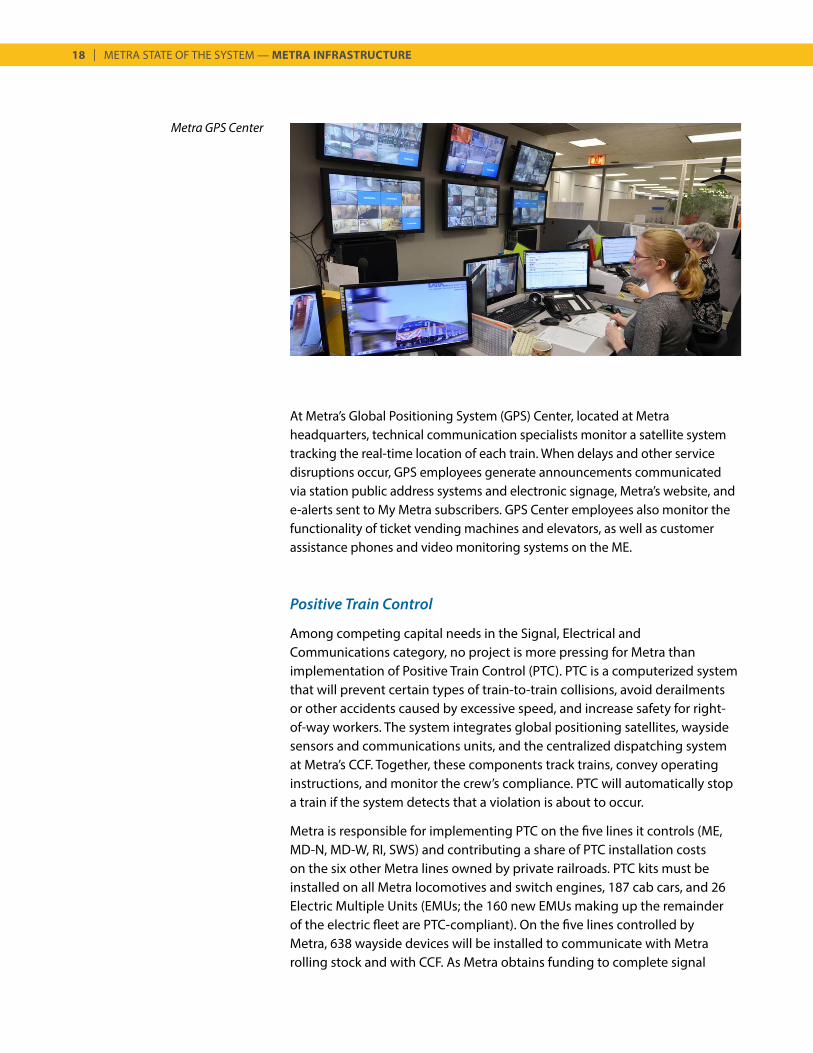
At Metra’s Global Positioning System (GPS) Center, located at Metra headquarters, technical communication specialists monitor a satellite system tracking the real-time location of each train. When delays and other service disruptions occur, GPS employees generate announcements communicated via station public address systems and electronic signage, Metra’s website, and e-alerts sent to My Metra subscribers. GPS Center employees also monitor the functionality of ticket vending machines and elevators, as well as customer assistance phones and video monitoring systems on the ME.
Positive Train Control
Among competing capital needs in the Signal, Electrical and Communications category, no project is more pressing for Metra than implementation of Positive Train Control (PTC). PTC is a computerized system that will prevent certain types of train-to-train collisions, avoid derailments or other accidents caused by excessive speed, and increase safety for right-of-way workers. The system integrates global positioning satellites, wayside sensors and communications units, and the centralized dispatching system at Metra’s CCF. Together, these components track trains, convey operating instructions, and monitor the crew’s compliance. PTC will automatically stop a train if the system detects that a violation is about to occur.
Metra is responsible for implementing PTC on the five lines it controls (ME, MD-N, MD-W, RI, SWS) and contributing a share of PTC installation costs on the six other Metra lines owned by private railroads. PTC kits must be installed on all Metra locomotives and switch engines, 187 cab cars, and 26 Electric Multiple Units (EMUs; the 160 new EMUs making up the remainder of the electric fleet are PTC-compliant). On the five lines controlled by Metra, 638 wayside devices will be installed to communicate with Metra rolling stock and with CCF. As Metra obtains funding to complete signal
Metra GPS Center
METRA STATE OF THE SYSTEM — METRA INFRASTRUCTURE | 19
modernization projects around its system, outdated equipment is replaced with components that are ready to integrate with PTC.
Implementation of the PTC mandate presents Metra with a number of challenges. Installing the system is very expensive, exceeding the amount Metra spends annually on its entire capital program. Since PTC technology is still being developed, systems cannot be purchased off the shelf and certain components are not yet available for purchase. To support PTC-related transmissions, railroads must acquire sufficient radio spectrum bandwidth from existing license holders. PTC systems adopted by various railroads must be able to communicate with each other, so that trains can move seamlessly between tracks controlled by different systems. Achieving PTC interoperability in Chicago is a complicated undertaking, since the region has the most complex railroad network in the country.
The 2008 Rail Safety Improvement Act required implementation of PTC by the end of 2015 on all passenger rail routes and on freight lines carrying certain hazardous materials. Due to delays caused by the complexities of PTC implementation, in late 2015 Congress passed legislation extending the PTC installation deadline to 2018. The legislation allows up to two additional years to finalize implementation and testing if certain conditions are met. Metra plans to have PTC installation completed for the BNSF, UP lines and Rock Island in 2018, while the remaining lines will be completed in 2019.
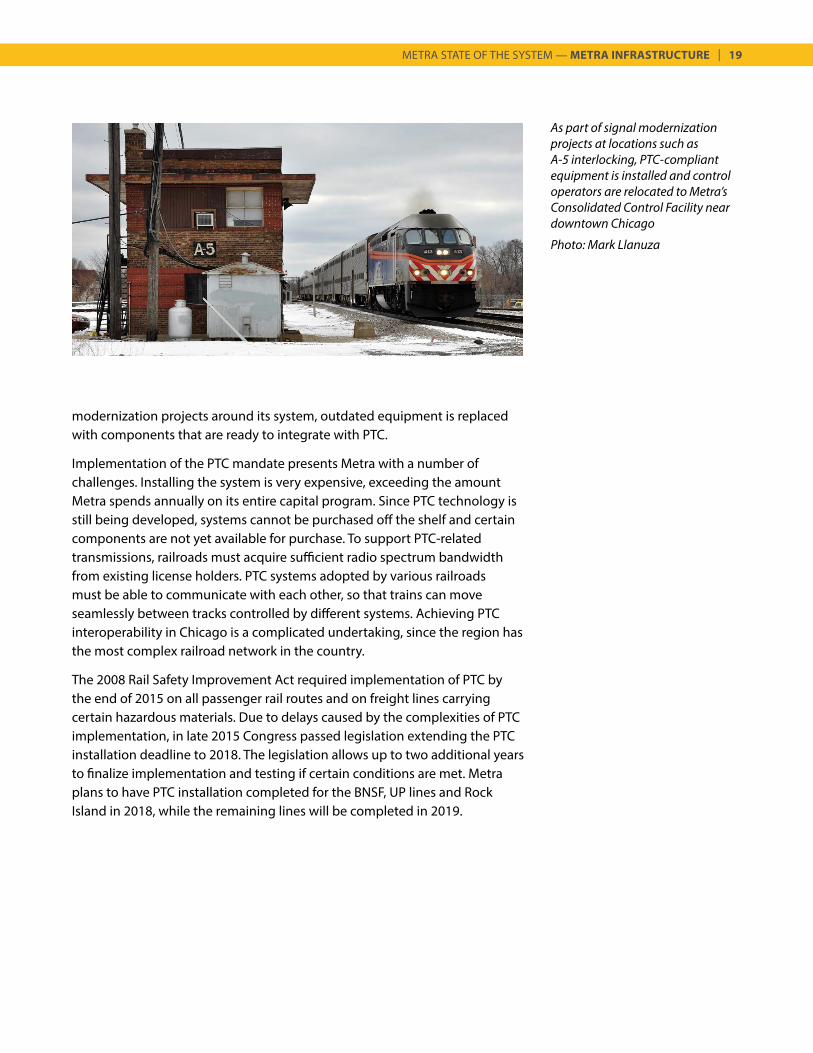
As part of signal modernization projects at locations such as A-5 interlocking, PTC-compliant equipment is installed and control operators are relocated to Metra’s Consolidated Control Facility near downtown Chicago
Photo: Mark Llanuza
20 | METRA STATE OF THE SYSTEM — METRA INFRASTRUCTURE
ROLLING STOCK
Railcars
Metra’s 10 diesel lines are served by 848 rail cars, hauled by 150 locomotives. Engineer controls in the cab car allow push-pull operation of the train: on inbound trips, the locomotive at the rear of the consist pushes the train into Chicago; on outbound trips, trains operate in pull mode with the locomotive in front, to minimize diesel emissions near passenger waiting areas at downtown terminals. (This practice was pioneered on Chicago & NorthWestern Railway’s Chicago commuter lines during the 1960s, eliminating the need to back the trainset into the nearest yard at the end of each run and reposition the locomotive at the front of the train.) The number of cars in a trainset varies by line, but typically ranges from four to 11 cars. Cab cars are often strategically placed throughout Metra’s system so trains can be quickly shortened for midday service, which often requires shorter consists.
The ME is served by 186 EMUs—electric-propelled cars that draw power from an overhead catenary wire system. Use of electric power allows ME trains to accelerate faster and run more quietly than the diesel-powered trains elsewhere in Metra’s system. Metra’s EMUs must operate in permanently coupled “married pairs,” and each pair contains all controls and power systems needed to function. ME trainsets range from two to eight cars.
Metra’s bi-level passenger cars are known as “gallery cars,” with a single row of seating on each side of the upper level, allowing conductors on the lower level to check tickets and collect fares on both levels. This design was introduced in 1950 by the Chicago, Burlington and Quincy Railroad, a predecessor of BNSF, to increase capacity and revenue on their commuter line to Aurora. Cars serving Metra’s diesel lines have approximately 150 seats, with fewer seats on bathroom-equipped cars and on cab cars. On all lines, Metra aims to provide a seat for every rider.
Metra permits bicycles to be stored in the priority seating area on reverse commute and off-peak trains (except during certain special events in downtown Chicago). The number of bicycles allowed per train is printed at the bottom of each timetable. Since accommodating passengers must remain Metra’s priority, if space is needed for disabled passengers or a train is crowded, bicycles may not be allowed on board, even if otherwise permitted. Metra trains have carried bicycles since 1995, and a new shipment of disabled-accessible cars (with flip-up seats in the designated wheelchair-priority area) allowed Metra to significantly expand its Bikes on Trains program in 2008.
Also in response to rider demand, Metra implemented a Quiet Car program on all lines in June 2011, following a successful test on the RI. Each morning
METRA STATE OF THE SYSTEM — METRA INFRASTRUCTURE | 21
inbound and evening outbound peak-period train longer than two cars has one or two designated Quiet Cars, where cell phone calls are not allowed, conversations are discouraged, and electronic devices should be muted. The program is enforced largely by peer pressure, with conductor intervention when necessary.
In early 2013, Metra completed the installation of over 400 automatic external defibrillators (AEDs) on train cars, in major work facilities and in Metra police vehicles. The portable, easy-to-use devices deliver an electrical current to those experiencing sudden cardiac arrest. Installation of the devices was funded by a grant from RTA, with maintenance and employee training made possible by a partnership with Northwestern Medicine.
All Metra trains have been compliant with Americans with Disabilities Act (ADA) standards since 1998, and today, 57% of Metra railcars on diesel lines are equipped with wheelchair lifts, as well as bathrooms to accommodate wheelchairs. Boarding platforms at all ME stations are level with the train floor, meaning that lifts are not necessary on this line. (However, not all ME stations are ADA-compliant.) All new and most recently rehabilitated Metra railcars—on the ME and diesel lines—will be equipped with LCD signs for scrolling announcements, to duplicate announcements made through the audio system.
Metra’s preventive maintenance and rehabilitation programs have proven to be effective in limiting equipment failures and extending the life of rolling stock. Railcars are inspected and cleaned daily, and receive minor repairs as needed. Schedules have been established for preventative maintenance activities, and Metra implements overhaul and remanufacture programs at strategic points in the vehicle’s lifespan. Metra’s general practice is to perform a midlife overhaul after 15 years and complete a second rebuild at the end of a car’s 25-year recommended life expectancy, extending its useful life to 35 years. However, funding constraints in recent years have caused Metra to extend midlife car rehabilitation cycles up to 19 years, which increases maintenance costs and threatens service quality.
In 2017, Metra completed a six-year effort to rehabilitate 176 Amerail trailer and cab cars built between 1995 and 1998. A new car rehabilitation program is underway with 302 Nippon-Sharyo cars manufactured between 2002 and 2008. In addition to replacing existing components—from windows to wheel assemblies—crews are adding power outlets and intercoms and are replacing the toilets and upgrading the seats. Metra workers are rehabilitating the cars to like-new condition for about $650,000 each, less than one-third of the cost of a new car. The work will extend each car’s useful life by 12 to 15 years.
As part of an effort to improve air quality inside railcars serving diesel lines, Metra has installed new hoods over air intakes and upgraded HVAC
22 | METRA STATE OF THE SYSTEM — METRA INFRASTRUCTURE
filters inside train cars. The new high-efficiency filters are typically used in institutions requiring very clean air, such as hospitals, laboratories, LEED-certified green buildings, and other sensitive environments.
Metra recently replaced the entire EMU fleet with new vehicles. Until 2006, when 26 new EMUs entered service, the entire ME fleet predated Metra’s formation. These legacy cars were too old to be cost-effectively rehabilitated. In 2012, the State of Illinois committed $585 million in Bond Program funds to purchase 160 new EMUs. From fall of 2012 until early 2016, four to six new EMUs arrived from the Rochelle, Illinois plant each month, and old cars were retired.
Half of the new cars are equipped with restrooms, an amenity missing from the retired EMUs. The new cars also include a variety of new features: larger windows, better seats with reversible seatbacks, brighter lighting, an improved public address system, and power outlets for customer use. EMU fleet size increased from 171 to 186, to accommodate projected ridership growth and compensate for lost seating capacity in the new cars (due to addition of bathrooms). Each new EMU pair has 128 seats in the restroom-equipped car, and 143 seats in the other car.
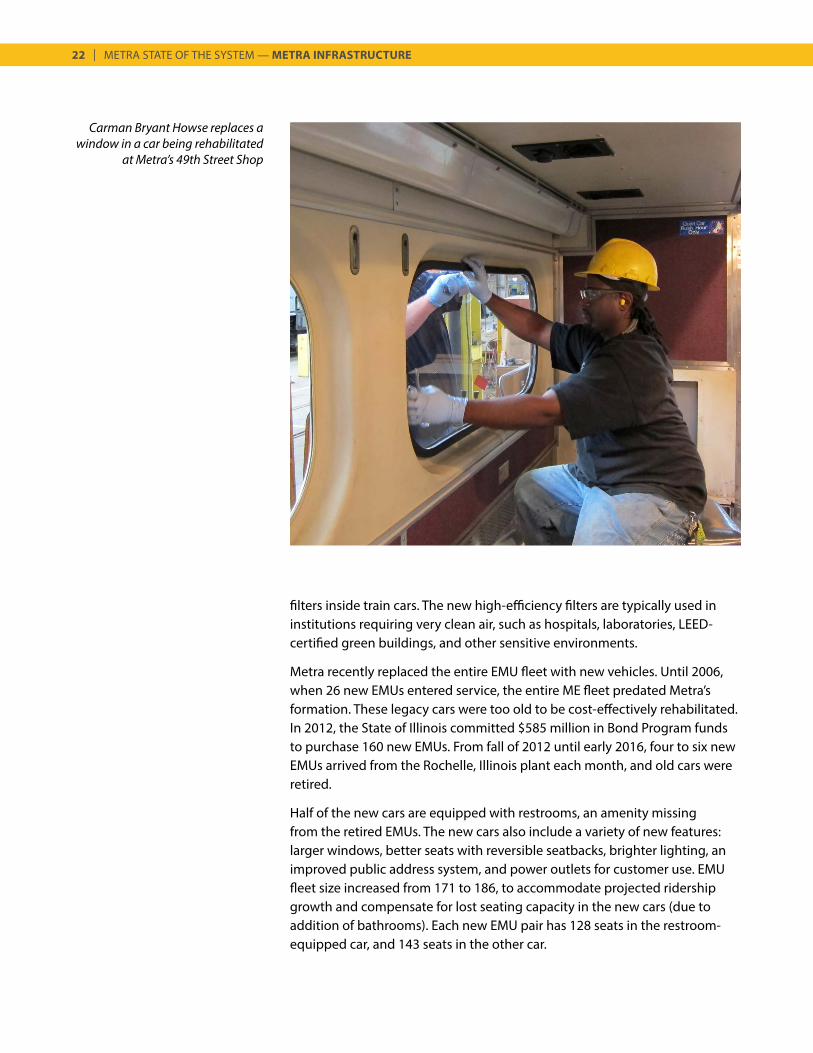
Carman Bryant Howse replaces a window in a car being rehabilitated
at Metra’s 49th Street Shop
METRA STATE OF THE SYSTEM — METRA INFRASTRUCTURE | 23
Locomotives
Metra operates 150 locomotives on its diesel lines. These diesel-electric units use 3000 to 3600-horsepower diesel engines to drive the electric generator powering the traction motors. Metra distributes dual-locomotive “double header” consists throughout the system to provide quick replacement power in case of equipment failure. Federal regulations cap Metra locomotive speeds at 79 miles per hour, though speeds are typically slower due to station spacing, track conditions, and signal system limitations.
As with railcars, Metra keep locomotives in a state of good repair and maximizes their lifespan by adhering to daily and periodic maintenance procedures and equipment rehabilitation schedules. Metra’s goal is to perform a midlife overhaul after ten years, minimizing maintenance needed until locomotives reach the recommended lifespan of 25 years. However, budget constraints in recent years have delayed the midlife rehabilitation up to two years.
Metra is currently halfway through a major rehabilitation of 42 locomotives, 30 of which are F40PHM models from the late 1980s. Working with the original manufacturer, Progress Rail Services (PRS-EMD), Metra shared one of its locomotives for emissions research and testing that resulted in a rehabilitation template for the cleanest emissions possible for the model. The collaboration between Metra and the manufacturer resulted in rehabilitated locomotives which exceed emissions regulations requirements in nearly every category, and is accomplished at minimal cost to Metra as part of the rehabilitation project.
Another program underway is the rehabilitation of 27 MP36 locomotives that is being completed in-house at Metra’s Rock Island facility. This program is the most technical and aggressive rehabilitation program in Metra’s history, including a rebuild of the engine with electric fuel injection and stand-alone, head-end power systems, both of which make the locomotive more reliable, require less fuel, and produce fewer emissions. The program is targeted for completion in 2019.
In early 2018, Metra took advantage of a rare offer to purchase up to 21 used F59PHI locomotives from CalTrans. The locomotives are similar to an existing Metra fleet of EMD F40s, and can therefore be integrated into the Metra system quickly. In fact, these locomotives will be service-ready in 2018 while the others sought in Metra’s 2017 Request for Proposals (for up to 30 new or 27 remanufactured locomotives) will not be ready until 2020.
Other projects focus on reducing the environmental impact of Metra’s locomotive fleet. Automatic Engine Start-Stop (AESS) systems—which improve fuel efficiency by automatically shutting down an idle locomotive engine and restarting it when needed—have been installed on two-thirds of
24 | METRA STATE OF THE SYSTEM — METRA INFRASTRUCTURE
Metra’s locomotive fleet and is in progress on the remaining third. To reduce emissions and fuel consumption, certain engine parts, such as fuel injectors, cylinder heads, liners, pistons and rings, are being upgraded to state-of-the-art components.
Rolling Stock Modernization Plan
In April 2017, Metra released an RFP for new gallery cars, to procure a minimum of 75 cars with options for up to 230 cars, depending on the proposals received. The new cars received will replace some of the oldest cars in the fleet, the oldest of which dates back to 1953. In addition, Metra released an RFP in December 2017 for new or remanufactured locomotives, with budgeting for up to 42 locomotives, based on the proposals received.
FACILITIES AND EQUIPMENT
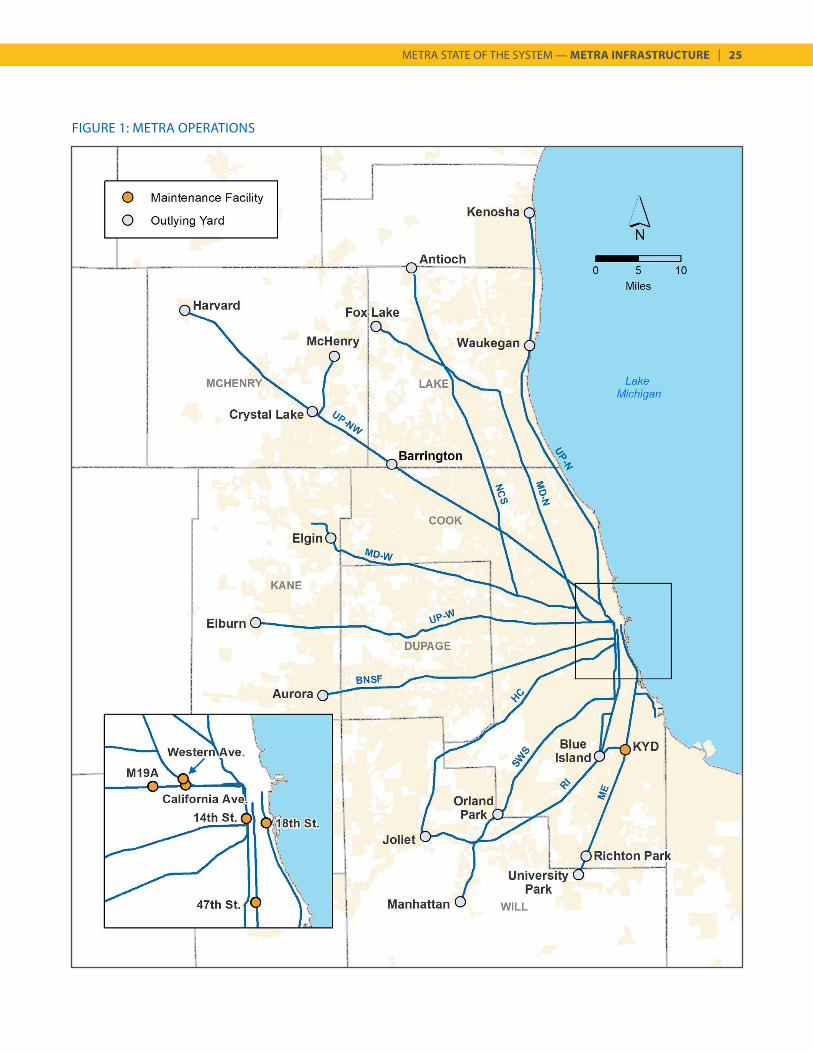
Maintenance, repair, and storage of Metra rolling stock takes place at 18 rail yards and seven maintenance support facilities located throughout the system. Some light maintenance can also be done at Metra’s downtown terminals. Before the morning peak period, all rolling stock receives the required daily inspection, and is tested to ensure that each vehicle is ready to begin service. During the midday, trainsets not needed for service are stored at five layover yards near downtown Chicago. Here, vehicles are inspected, cleaned, and minor repairs or services are completed to prepare equipment for the afternoon peak. At the end of the service day, most trainsets are stored overnight at outlying yards, where the cycle begins the next day.
The expansive network of maintenance and storage facilities allows Metra to place equipment where it is needed and nearly eliminate the need for non-revenue deadhead movements. In addition, crews can respond quickly to equipment failures, reducing service disruptions. Metra’s operating structure provides for a vehicle fleet that is highly intertwined. In some cases, train cycles are coordinated so that a single trainset operates on multiple lines over the course of one day, or multiple days, to maximize efficiencies of equipment and fuel. In addition, most of Metra’s yards are undersized and not designed to service modern equipment, and these constraints limit the potential to expand service.
METRA STATE OF THE SYSTEM — METRA INFRASTRUCTURE | 25
FIGURE 1: METRA OPERATIONS
26 | METRA STATE OF THE SYSTEM — METRA INFRASTRUCTURE
STATIONS AND PARKING
Stations, along with rolling stock, are the most visible parts of Metra’s infrastructure. Metra’s 242 stations have a significant impact on the rider experience, and it is important to keep them functional and as attractive as possible. Station facilities such as depots, warming shelters, platforms, and access routes are in continual need of rehabilitation and/or replacement as they reach the end of their life cycles. Metra has invested $1.1 billion since 1985 to improve station and parking facilities, and host communities have also invested substantial amounts. Since Metra’s formation in 1983, 32 new stations have been added throughout the system, with significant improvements completed at 145 existing stations. The Romeoville station (HC) opened for service in early 2018. The design of infill station Peterson/Ridge (UP-N) is complete while funding for construction has yet to be identified. Another infill station on the horizon is Auburn Park (RI); however, Metra currently lacks funding to pursue the design and construction phases.
Station and parking facilities at Metra stops are managed by a wide variety of legal arrangements. Station structures may be owned, leased, and maintained by separate entities (e.g., Metra, municipalities, freight railroads, and other private or public landowners). Additional parties may be involved in the ownership of the land on which station structures are built, and in the ownership and operation of parking areas. The decentralized nature of Metra station ownership stems from the long history of commuter rail service in the region, and the fact that Metra’s system was assembled from commuter lines previously operated by a number of private railroads that had developed unique relationships with local communities.
Metra utilizes federal and state grants to fund the construction and expansion of station parking facilities, including the cost of land acquisition and/or construction of the parking lots themselves. Station and parking improvements partially or fully funded by these grants are subject to use restrictions and other requirements, until the grantor’s interest in the property expires. In general, Metra prefers that commuter parking facilities are locally maintained, since issues that develop at individual stations can be handled more effectively by the communities rather than at an agency level. Ongoing maintenance of parking facilities is generally funded by fees paid by lot users.
At most stations, Metra has maintenance agreements with host municipalities for cleaning and small repair projects in station buildings and the nearby area. Metra is always responsible for larger repair and rehabilitation projects exceeding a cost threshold that varies among stations, and maintains all passenger communications equipment (e.g., audio equipment and LCD announcement signs). Metra forces maintain and remove snow from all station platforms, except for those at UP stations and certain stations on the BNSF Line.
METRA STATE OF THE SYSTEM — METRA INFRASTRUCTURE | 27
When a station reaches the end of its useful life, Metra seeks to fund the replacement or rehabilitation of station structures at a basic level, based on ridership at the station. Host communities are responsible for the cost of any upgraded materials or structures.
Currently, 184 stations are fully accessible to individuals with hearing, vision, and mobility disabilities and 13 are classified as partially accessible (meaning that ramps, ticket windows, and/or buildings and shelters at these stations may not fully conform to ADA guidelines, but customers who use wheelchairs will be able to access train platforms from the street). These represent Metra’s busiest stations, used by 95% of riders. Metra brings stations into full compliance with federal standards as they are rehabilitated.
A number of stations and parking projects were funded with $135 million between 2009 and 2014 from the Illinois General Assembly State Transit Bond program. However, that critical funding source was terminated by the state in 2017, and Metra has since applied for discretionary grants as they become available.
Parking
At the 213 Metra stations with parking facilities, more than 90,000 spaces are available to commuters. Only a small number of these spaces are owned and controlled by Metra; most commuter parking lots are managed by host municipalities, meaning that Metra has little authority to direct pricing policy or redevelopment near the vast majority of stations. However, Metra and station host communities are committed to coordination and creative thinking to ensure the best management of parking resources.
In 2016, 51% of weekday Metra riders accessed their boarding station in a car they parked at the station. This figure is high relative to other transit modes, but typical of other North American commuter rail systems due to the predominantly suburban nature of the area served by commuter rail. The percentage of Metra riders driving to stations varies widely within Metra’s service area, and is based on station area density and land use, quality of connecting transportation options, and other factors. Automobile access rates rise with distance from downtown Chicago—in 2016, 67% of Metra riders boarding at a station over 25 miles from downtown drove to the station.
28 | METRA STATE OF THE SYSTEM — METRA INFRASTRUCTURE
CAPITAL PLANNING
Each year, Metra makes difficult decisions about which projects to fund in its capital program, since needs always far exceed available funding.
The Capital Programming Department is transitioning to a Transit Asset Management (TAM) system as part of the Federal Transit Administration (FTA) Final Rule effective in October 2016 requiring transit agencies and their capital assets to meet performance measures that will result in safe, reliable transit while lowering operating costs.
The TAM Plan covers nine elements (inventory of capital assets, condition assessments, decision support tools, investment prioritization, TAM and State of Good Repair policy, implementation strategy, list of key annual activities, identification of resources and an evaluation plan) and is subject to FTA audit and review. Metra is currently working to develop its TAM Plan—an agency wide initiative—by Fall 2018.
Thus far, Metra has created a comprehensive inventory of its capital assets along with condition ratings and estimated useful lives for rolling stock, bridges, signals, track infrastructure and equipment. Metra is also developing a Decision Support Tool and Investment Prioritization to inform the capital decision-making process and replace the Capital Optimization Support Tool (COST) previously used.
Several additional factors will influence project selection. Investments must be distributed equitably among Metra lines and across the region. Since most Metra service operates on track not owned by the agency, agreement from host railroads is required for some projects to advance.
METRA STATE OF THE SYSTEM — METRA INFRASTRUCTURE | 29
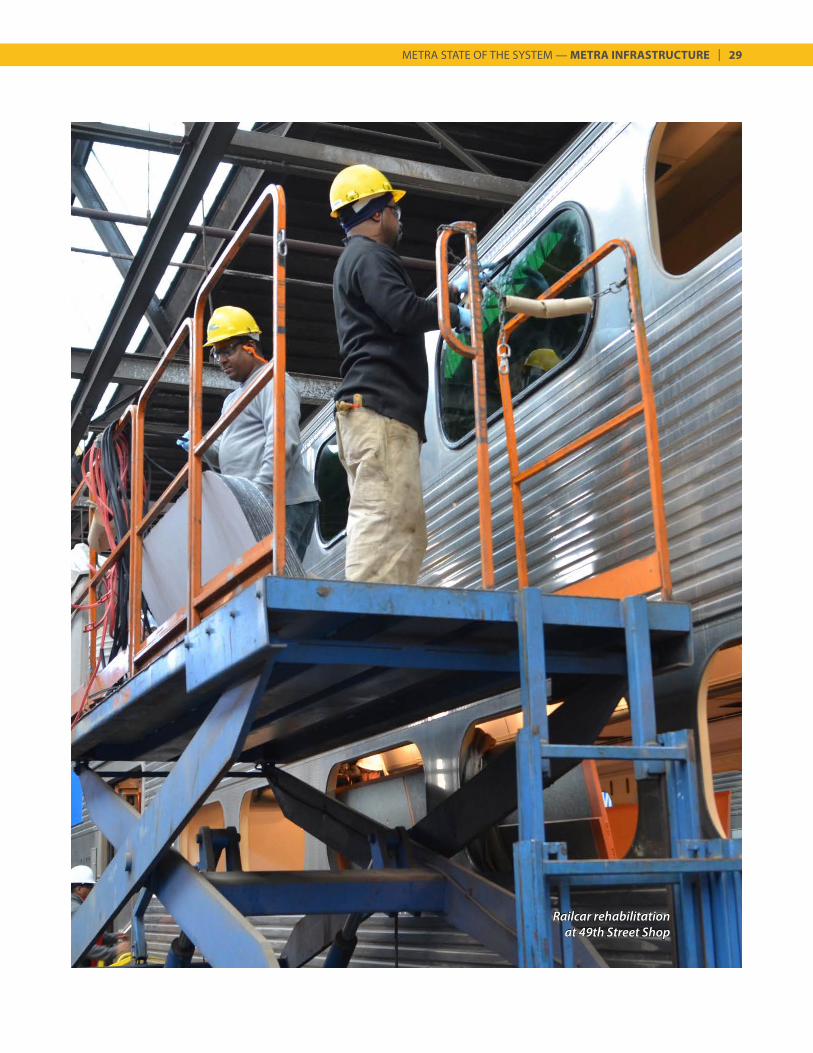
Railcar rehabilitation at 49th Street Shop
Rock Island District riders at LaSalle Street Station CENTRAL BUSINESS DISTRICT
MARKET
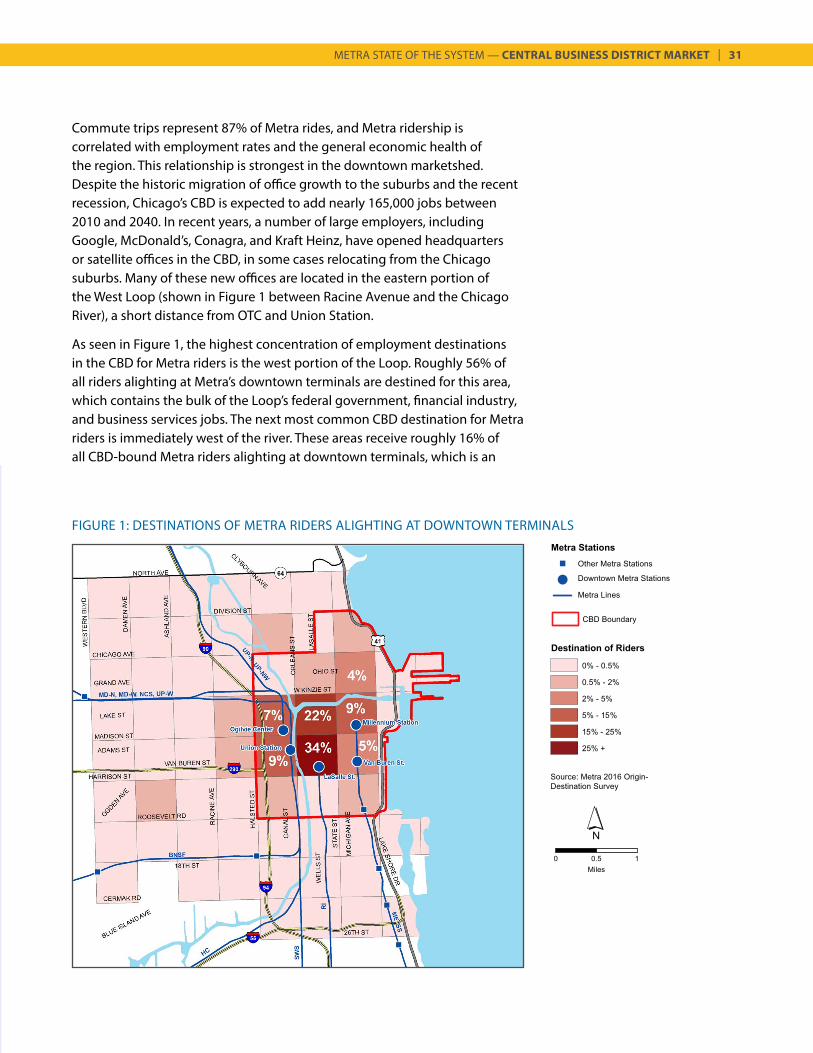
Metra’s network is laid out in a hub and spoke configuration, with eleven lines serving five downtown stations: Chicago Union Station (CUS), Ogilvie Transportation Center (OTC), LaSalle Street Station, Millennium Station and Van Buren Street Station. The system is oriented to serve Metra’s principal customer base: suburban residents working in downtown Chicago. According to Metra’s 2016 Origin-Destination Survey, 86% of all Metra riders are destined for jobs in the Central Business District (CBD) of Chicago. Approximately 70% of Metra riders alighting at the five CBD stations travel to the area known as the Loop—generally south and east of the Chicago River, north of Congress Parkway and adjacent to Grant Park—in the heart of the CBD. Figure 1 shows the CBD stations and percentage of total downtown riders’ destinations by quarter section (a quarter of a square mile).
The economy of the Loop and the CBD, as a whole, is vitally important to Metra. Chicago’s CBD is the second-largest in the country, after Midtown Manhattan in New York. The district is a major center for financial, legal, government, and corporate services, the headquarters of numerous Fortune 500 companies, and home of many of the region’s civic, cultural, and educational institutions.
METRA STATE OF THE SYSTEM — CENTRAL BUSINESS DISTRICT MARKET | 31
FIGURE 1: DESTINATIONS OF METRA RIDERS ALIGHTING AT DOWNTOWN TERMINALS
Commute trips represent 87% of Metra rides, and Metra ridership is correlated with employment rates and the general economic health of the region. This relationship is strongest in the downtown marketshed. Despite the historic migration of office growth to the suburbs and the recent recession, Chicago’s CBD is expected to add nearly 165,000 jobs between 2010 and 2040. In recent years, a number of large employers, including Google, McDonald’s, Conagra, and Kraft Heinz, have opened headquarters or satellite offices in the CBD, in some cases relocating from the Chicago suburbs. Many of these new offices are located in the eastern portion of the West Loop (shown in Figure 1 between Racine Avenue and the Chicago River), a short distance from OTC and Union Station.
As seen in Figure 1, the highest concentration of employment destinations in the CBD for Metra riders is the west portion of the Loop. Roughly 56% of all riders alighting at Metra’s downtown terminals are destined for this area, which contains the bulk of the Loop’s federal government, financial industry, and business services jobs. The next most common CBD destination for Metra riders is immediately west of the river. These areas receive roughly 16% of all CBD-bound Metra riders alighting at downtown terminals, which is an
32 | METRA STATE OF THE SYSTEM — CENTRAL BUSINESS DISTRICT MARKET
increase of 2% since 2014 and has overtaken the east portion of the Loop in rank. The east portion of the Loop accounts for roughly 14% of all CBD-bound Metra riders alighting at downtown terminals, down 1% from 2014. Smaller concentrations of Metra riders travel to areas near North Michigan Avenue and the Northwestern Memorial Hospital complex, and to areas west of the CBD, near the University of Illinois at Chicago (UIC) and the Illinois Medical Center complex.
DOWNTOWN STATIONS
In terms of passenger volume, CUS is the largest Metra station downtown (and in the Metra system as a whole), accounting for 45% of alightings at the five CBD stations. It is the nation’s third-busiest passenger railroad terminal, serving over 300 Metra and Amtrak trains each weekday. Ninety-one percent of the 120,000 people passing through the station each day are Metra riders. CUS serves six Metra lines—the Milwaukee District North and West Lines, the North Central Service, the Heritage Corridor, the SouthWest Service and the BNSF Line. CUS provides convenient access to the West Loop office market that has developed west of the Chicago River and east of the Kennedy Expressway; it is served by 16 Chicago Transit Authority (CTA) bus routes, one Pace express bus route, the CTA Blue Line at Clinton Street, Chicago River water taxis, private shuttle buses, and intercity buses.
The Regional Transportation Authority, Metra, CTA, Amtrak, and Pace collaborated in recent years to design and install a new wayfinding signage system for CUS. The signage guides customers transferring between transit providers, and provides information to help riders find their way to nearby attractions on foot. This improved wayfinding system will be expanded to other Metra stations, including Deerfield, Elgin, Harvey, Lake Cook Road, Lisle, Mayfair, Museum Campus and Naperville. Signs are also in place at the Van Buren Street, Davis Street and Joliet Metra stations, installed as part of the initial demonstration phase in 2012.
The Loop Link project upgraded bus service on four downtown streets by adding dedicated bus lanes, bus-only traffic signals at selected intersections, and covered stations with raised platforms. CTA buses serving CUS—including bus routes using Loop Link—utilize a new off-street transportation center just south of CUS. The transportation center, completed in late 2016, reduces traffic congestion near the station and provides a direct, underground connection to the CUS passenger concourse.
CUS operates at or close to capacity during much of the day, and the Chicago Union Station Master Plan, completed in 2012, made recommendations to address passenger crowding within the station,
METRA STATE OF THE SYSTEM — CENTRAL BUSINESS DISTRICT MARKET | 33
ease street-level congestion, and accommodate additional commuter and intercity passenger service (including high-speed rail). Plans include improving station ventilation, renovating concourses and widening platforms, and adding vertical circulation. To assist in funding these improvements, Amtrak selected a master developer to add retail, office, hotel, and residential space.
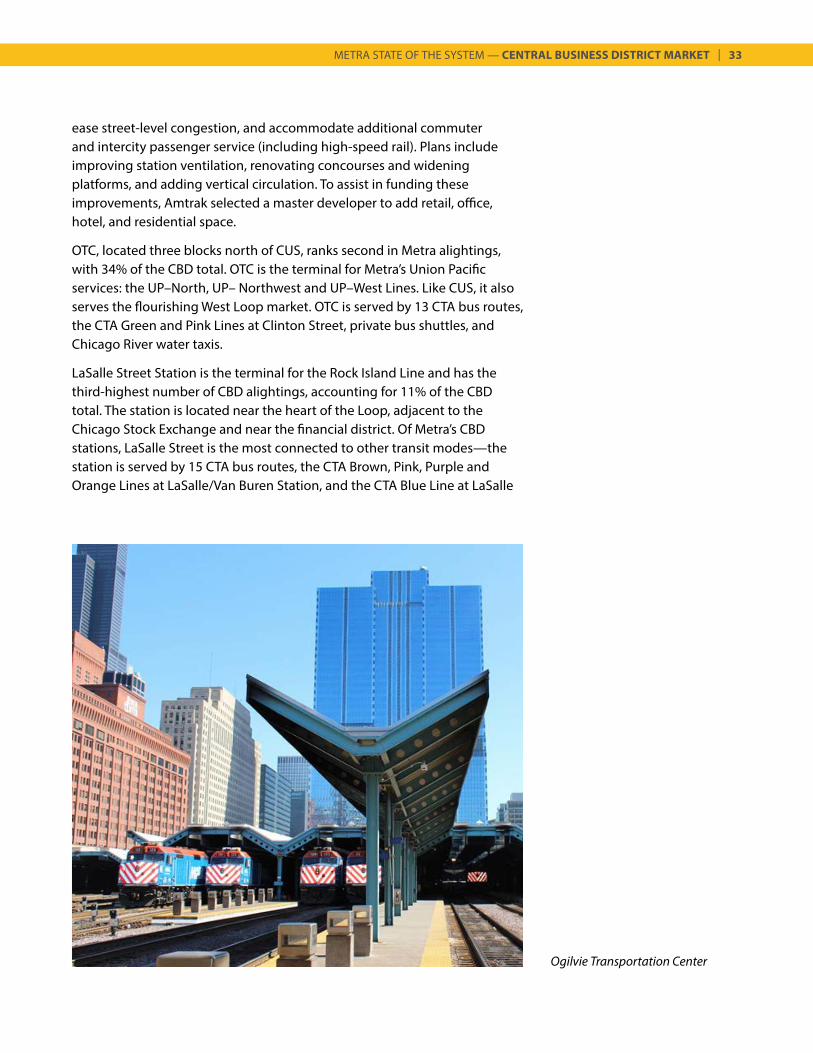
OTC, located three blocks north of CUS, ranks second in Metra alightings, with 34% of the CBD total. OTC is the terminal for Metra’s Union Pacific services: the UP–North, UP– Northwest and UP–West Lines. Like CUS, it also serves the flourishing West Loop market. OTC is served by 13 CTA bus routes, the CTA Green and Pink Lines at Clinton Street, private bus shuttles, and Chicago River water taxis.
LaSalle Street Station is the terminal for the Rock Island Line and has the third-highest number of CBD alightings, accounting for 11% of the CBD total. The station is located near the heart of the Loop, adjacent to the Chicago Stock Exchange and near the financial district. Of Metra’s CBD stations, LaSalle Street is the most connected to other transit modes—the station is served by 15 CTA bus routes, the CTA Brown, Pink, Purple and Orange Lines at LaSalle/Van Buren Station, and the CTA Blue Line at LaSalle
Ogilvie Transportation Center
34 | METRA STATE OF THE SYSTEM — CENTRAL BUSINESS DISTRICT MARKET
Station. In 2011, the City of Chicago completed construction of a bus transfer center at Congress Parkway and Financial Place, enhancing the station’s multi-modal connectivity.
The Metra Electric (ME) is the only Metra line with two downtown stations: Millennium Station and Van Buren Street Station. Millennium Station is the terminal for the ME as well as the South Shore Line from Chicago to South Bend, Indiana. Previously known as Randolph Street Station, the station was rebuilt and renamed in 2005, following the construction of Millennium Park. It accounts for 7% of Metra CBD alightings (not including South Shore trains), the fourth-highest of downtown stations. Its location underneath Millennium Park and adjacent to Michigan Avenue provides access to 23 CTA bus routes, five CTA rail lines at Madison/Wabash Station, and four Pace express bus routes, as well as Chicago’s pedestrian tunnel system that provides access to area retail, office buildings, government offices, and the CTA Red and Blue Lines. Of CBD Metra stations, Millennium Station has the highest share of riders using transit to travel to their final destination.
Van Buren Street Station—the only downtown Metra station that is not a terminal—is located a few blocks south of Millennium Station, at Michigan Avenue and Van Buren Street. Like Millennium Station, Van Buren Station serves both the ME and South Shore Lines and is well-connected to the CTA bus system. Three percent of morning Metra CBD alightings (not including South Shore trains) happen at this station.
STATION ALIGHTINGS/MODE OF EGRESS
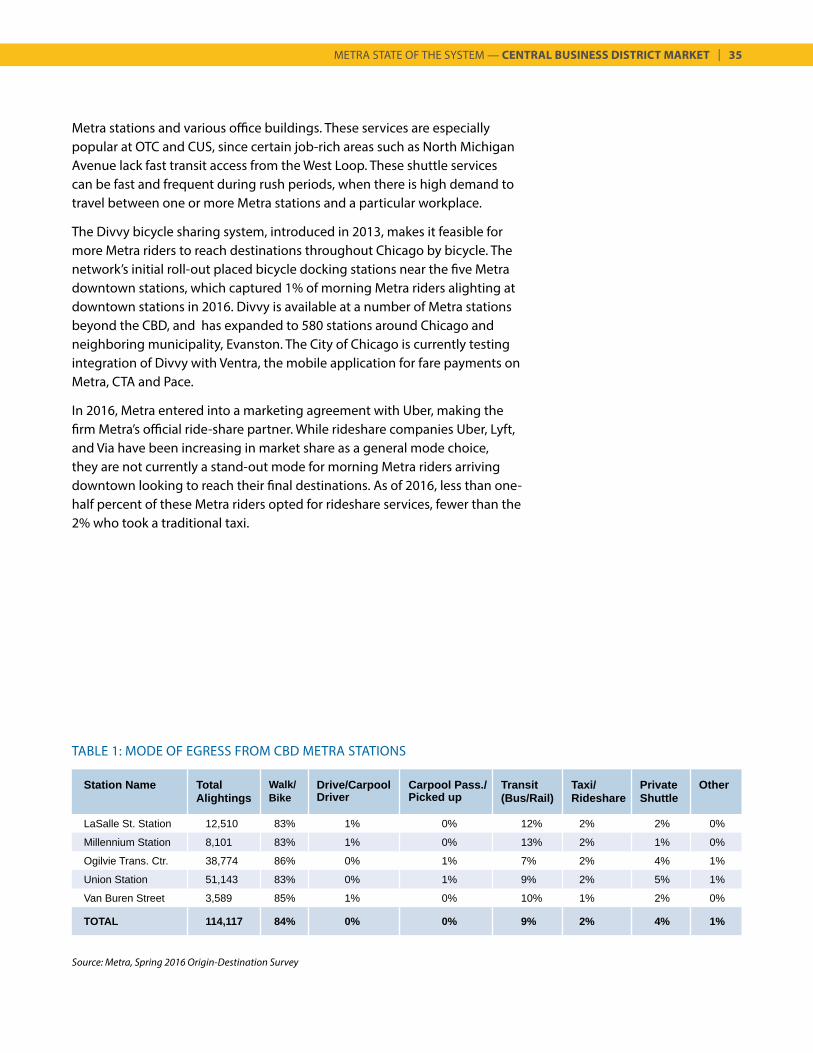
Most Metra riders alighting at the downtown stations walk to their final destinations. However, public transit is the second most popular mode of egress at each downtown station, accounting for a modal share between 7% and 13%. CTA buses are the biggest recipient of Metra riders due to close proximity of bus stops and downtown Metra stations and a lack of direct connections between Metra stations and CTA ‘L’ stations (with the exception of Metra’s LaSalle Street Station). To accommodate Metra riders using CTA trains and buses, both agencies offer the Link-Up pass, which provides Metra monthly pass holders unlimited peak-period access to CTA (and Pace at any time of day) for an additional $55 a month. Table 1 shows total alightings and mode of egress for CBD Metra stations. A number of CTA bus routes provide special rush-period service linking downtown Metra stations to employment centers such as North Michigan Avenue, the Northwestern University medical complex, McCormick Place, and UIC/Illinois Medical District.
Private bus shuttles contracted by major employers fulfill a specific transit need in downtown Chicago, providing a direct connection between CBD
METRA STATE OF THE SYSTEM — CENTRAL BUSINESS DISTRICT MARKET | 35
Source: Metra, Spring 2016 Origin-Destination Survey
TABLE 1: MODE OF EGRESS FROM CBD METRA STATIONS
Station Name Total Alightings
Walk/ Bike
Drive/Carpool Driver
Carpool Pass./ Picked up
Transit(Bus/Rail)
Taxi/Rideshare
Private Shuttle
Other
LaSalle St. Station 12,510 83% 1% 0% 12% 2% 2% 0%
Millennium Station 8,101 83% 1% 0% 13% 2% 1% 0%
Ogilvie Trans. Ctr. 38,774 86% 0% 1% 7% 2% 4% 1%
Union Station 51,143 83% 0% 1% 9% 2% 5% 1%
Van Buren Street 3,589 85% 1% 0% 10% 1% 2% 0%
TOTAL 114,117 84% 0% 0% 9% 2% 4% 1%
Metra stations and various office buildings. These services are especially popular at OTC and CUS, since certain job-rich areas such as North Michigan Avenue lack fast transit access from the West Loop. These shuttle services can be fast and frequent during rush periods, when there is high demand to travel between one or more Metra stations and a particular workplace.
The Divvy bicycle sharing system, introduced in 2013, makes it feasible for more Metra riders to reach destinations throughout Chicago by bicycle. The network’s initial roll-out placed bicycle docking stations near the five Metra downtown stations, which captured 1% of morning Metra riders alighting at downtown stations in 2016. Divvy is available at a number of Metra stations beyond the CBD, and has expanded to 580 stations around Chicago and neighboring municipality, Evanston. The City of Chicago is currently testing integration of Divvy with Ventra, the mobile application for fare payments on Metra, CTA and Pace.
In 2016, Metra entered into a marketing agreement with Uber, making the firm Metra’s official ride-share partner. While rideshare companies Uber, Lyft, and Via have been increasing in market share as a general mode choice, they are not currently a stand-out mode for morning Metra riders arriving downtown looking to reach their final destinations. As of 2016, less than one-half percent of these Metra riders opted for rideshare services, fewer than the 2% who took a traditional taxi.
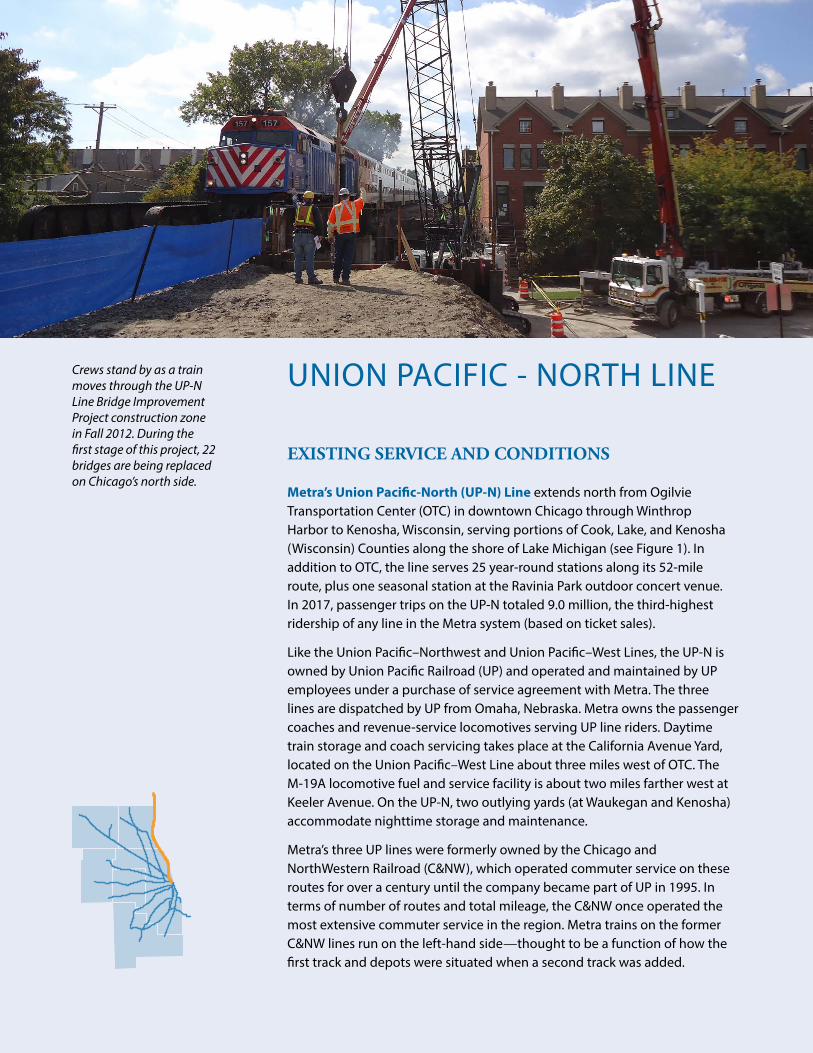
UNION PACIFIC - NORTH LINE
EXISTING SERVICE AND CONDITIONS
Metra’s Union Pacific-North (UP-N) Line extends north from Ogilvie Transportation Center (OTC) in downtown Chicago through Winthrop Harbor to Kenosha, Wisconsin, serving portions of Cook, Lake, and Kenosha (Wisconsin) Counties along the shore of Lake Michigan (see Figure 1). In addition to OTC, the line serves 25 year-round stations along its 52-mile route, plus one seasonal station at the Ravinia Park outdoor concert venue. In 2017, passenger trips on the UP-N totaled 9.0 million, the third-highest ridership of any line in the Metra system (based on ticket sales).
Like the Union Pacific–Northwest and Union Pacific–West Lines, the UP-N is owned by Union Pacific Railroad (UP) and operated and maintained by UP employees under a purchase of service agreement with Metra. The three lines are dispatched by UP from Omaha, Nebraska. Metra owns the passenger coaches and revenue-service locomotives serving UP line riders. Daytime train storage and coach servicing takes place at the California Avenue Yard, located on the Union Pacific–West Line about three miles west of OTC. The M-19A locomotive fuel and service facility is about two miles farther west at Keeler Avenue. On the UP-N, two outlying yards (at Waukegan and Kenosha) accommodate nighttime storage and maintenance.
Metra’s three UP lines were formerly owned by the Chicago and NorthWestern Railroad (C&NW), which operated commuter service on these routes for over a century until the company became part of UP in 1995. In terms of number of routes and total mileage, the C&NW once operated the most extensive commuter service in the region. Metra trains on the former C&NW lines run on the left-hand side—thought to be a function of how the first track and depots were situated when a second track was added.
Crews stand by as a train moves through the UP-N Line Bridge Improvement Project construction zone in Fall 2012. During the first stage of this project, 22 bridges are being replaced on Chicago’s north side.
METRA STATE OF THE SYSTEM — UNION PACIFIC - NORTH LINE | 37
2017 Average trip length:16.8 miles
2017 Average fare paid:$4.21Source: Ridership Trends Report, Dec. 2017
Number of stations:26 †
Route length:51.6 miles
Number of weekday trains (May 2018): 70
2017 On-time performance*:97.2%† Does not include seasonal station at Ravinia Park
* On-time Performance Report, Dec. 2017
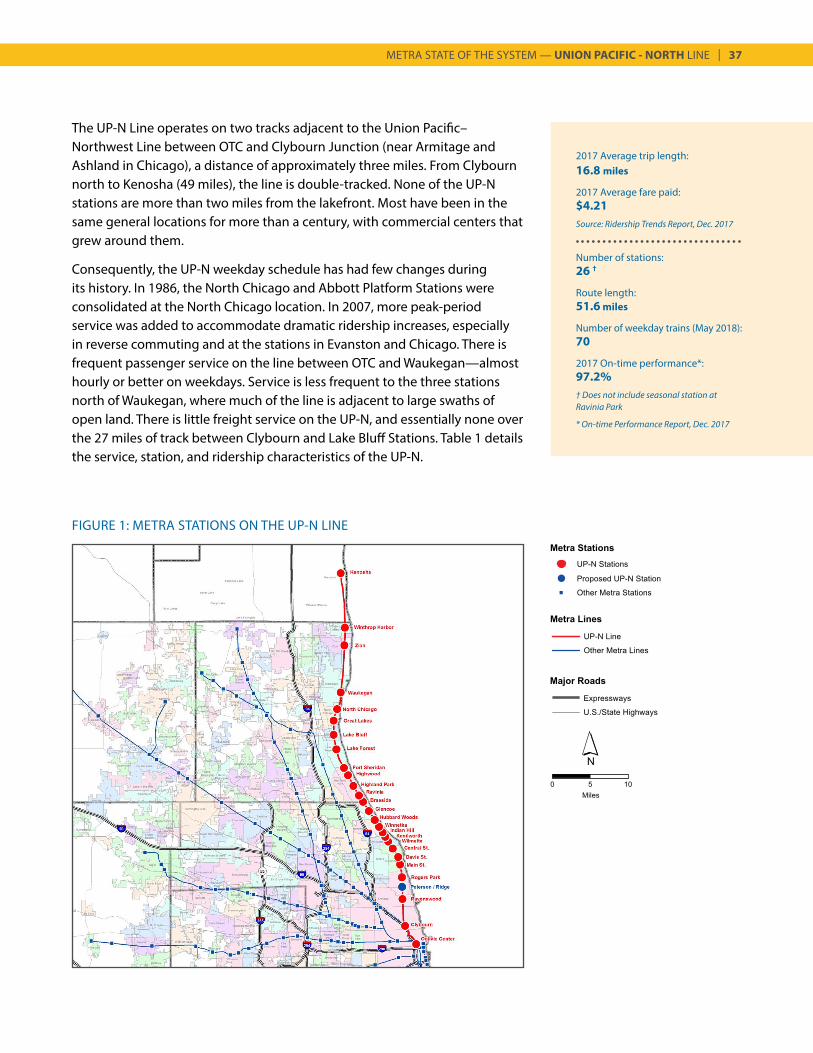
FIGURE 1: METRA STATIONS ON THE UP-N LINE
The UP-N Line operates on two tracks adjacent to the Union Pacific–Northwest Line between OTC and Clybourn Junction (near Armitage and Ashland in Chicago), a distance of approximately three miles. From Clybourn north to Kenosha (49 miles), the line is double-tracked. None of the UP-N stations are more than two miles from the lakefront. Most have been in the same general locations for more than a century, with commercial centers that grew around them.
Consequently, the UP-N weekday schedule has had few changes during its history. In 1986, the North Chicago and Abbott Platform Stations were consolidated at the North Chicago location. In 2007, more peak-period service was added to accommodate dramatic ridership increases, especially in reverse commuting and at the stations in Evanston and Chicago. There is frequent passenger service on the line between OTC and Waukegan—almost hourly or better on weekdays. Service is less frequent to the three stations north of Waukegan, where much of the line is adjacent to large swaths of open land. There is little freight service on the UP-N, and essentially none over the 27 miles of track between Clybourn and Lake Bluff Stations. Table 1 details the service, station, and ridership characteristics of the UP-N.

38 | METRA STATE OF THE SYSTEM — UNION PACIFIC - NORTH LINE
Source: Metra Weekday Station Boardings and Alightings by Time-of-Day and Direction, 2016
TABLE 1A: 2016 UP-N WEEKDAY BOARDINGS
TABLE 1B: UP-N ANNUAL PASSENGER TRIPS1983 — 2017, in millions
Y E A R
Time of Day Inbound Outbound
AM Peak 11,369 2,390
Midday 1,721 1,423
PM Peak 2,541 10,461
Evening 623 1,459
TOTAL 16,254 15,733
Note: from 2008, figures include free Circuit Permit trips. 2008-2011 figures include free senior trips; this program ended September 2011.

METRA STATE OF THE SYSTEM — UNION PACIFIC - NORTH LINE | 39
TABLE 1C: UP-N STATION CHARACTERISTICS
Station Fare Mile Accessibility1 Boardings Station Parking (2017)Time to Chicago
(minutes)1
Zone Post19832 20163 Capacity
(Spaces)4Effective
Use5Observed
Use6Shortest
TripLongest
Trip
Ogilvie Trans. Center A 0.0 Full 8,437 12,566 0 n/a n/a -- --
Clybourn7 A 2.9 None 110 974 25 96% 96% 8 12
Ravenswood B 6.5 None 307 2,721 0 n/a n/a 11 19
Rogers Park B 9.4 Full 464 1,389 139 78% 78% 16 24
Main St./Evanston C 11.0 Full 481 1,133 85 86% 86% 17 28
Davis St./Evanston C 12.0 Full 565 1,939 59 98% 98% 18 31
Central St./Evanston C 13.3 Full 771 1,428 318 99% 78% 21 34
Wilmette C 14.4 Full 1,175 1,614 386 95% 95% 23 37
Kenilworth D 15.2 Full 444 500 99 100% 93% 25 40
Indian Hill D 15.8 None 356 382 90 100% 100% 29 42
Winnetka D 16.6 Full 673 737 265 96% 87% 24 44
Hubbard Woods D 17.7 None 511 374 164 100% 62% 32 48
Glencoe D 19.2 Full 748 715 414 96% 71% 30 51
Braeside E 20.5 Partial 301 442 141 81% 81% 30 54
Ravinia E 21.5 Full 366 295 154 73% 46% 37 56
Highland Park E 23.0 Full 970 978 461 78% 77% 36 59
Highwood E 24.5 Full 230 293 123 24% 24% 47 62
Ft. Sheridan F 25.7 Full 311 274 283 50% 47% 41 65
Lake Forest F 28.3 Full 644 717 696 92% 92% 45 69
Lake Bluff G 30.2 Full 307 681 145 100% 92% 48 73
Great Lakes G 32.0 Full 76 293 146 54% 54% 51 77
North Chicago G 33.7 Full 175 170 50 38% 32% 54 81
Waukegan H 35.9 Full 553 911 439 41% 41% 59 86
Zion I 42.1 Full 81 124 98 65% 65% 68 92
Winthrop Harbor I 44.5 Full 21 61 107 50% 31% 72 97
Kenosha K 51.5 Full 142 276 418 78% 64% 84 105
TOTAL UP-N 19,233 31,987 5,744 79% 72%
1 Union Pacific-North Line Schedule2 Metra 1983 Boarding/Alighting Counts. Total includes 14 boardings from Abbott Platform Station, which closed in 1986.3 Metra, “Commuter Rail System Station Boarding/Alighting Counts,” Fall 2016.4 Metra Station Parking Capacity and Use, 20175 Effective use: all sold permit spaces are assumed to be used, even if unoccupied during parking survey6 Observed use: spaces physically occupied during parking survey7 Parking area at this station serves UP-N and UP-NW LinesNote: Ravinia Park station is not shown; this station is open during Ravinia Festival’s summer outdoor concert season only.
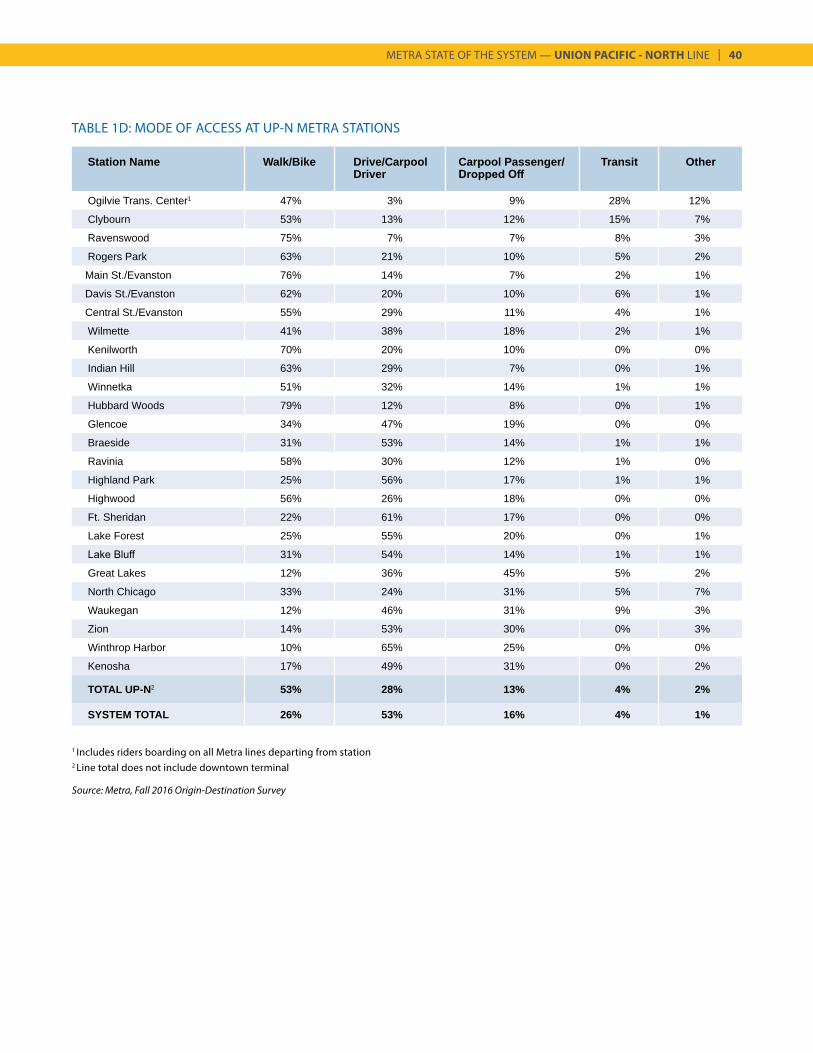
METRA STATE OF THE SYSTEM — UNION PACIFIC - NORTH LINE | 40
TABLE 1D: MODE OF ACCESS AT UP-N METRA STATIONS
Station Name Walk/Bike Drive/Carpool Driver
Carpool Passenger/ Dropped Off
Transit Other
Ogilvie Trans. Center1 47% 3% 9% 28% 12%
Clybourn 53% 13% 12% 15% 7%
Ravenswood 75% 7% 7% 8% 3%
Rogers Park 63% 21% 10% 5% 2%
Main St./Evanston 76% 14% 7% 2% 1%
Davis St./Evanston 62% 20% 10% 6% 1%
Central St./Evanston 55% 29% 11% 4% 1%
Wilmette 41% 38% 18% 2% 1%
Kenilworth 70% 20% 10% 0% 0%
Indian Hill 63% 29% 7% 0% 1%
Winnetka 51% 32% 14% 1% 1%
Hubbard Woods 79% 12% 8% 0% 1%
Glencoe 34% 47% 19% 0% 0%
Braeside 31% 53% 14% 1% 1%
Ravinia 58% 30% 12% 1% 0%
Highland Park 25% 56% 17% 1% 1%
Highwood 56% 26% 18% 0% 0%
Ft. Sheridan 22% 61% 17% 0% 0%
Lake Forest 25% 55% 20% 0% 1%
Lake Bluff 31% 54% 14% 1% 1%
Great Lakes 12% 36% 45% 5% 2%
North Chicago 33% 24% 31% 5% 7%
Waukegan 12% 46% 31% 9% 3%
Zion 14% 53% 30% 0% 3%
Winthrop Harbor 10% 65% 25% 0% 0%
Kenosha 17% 49% 31% 0% 2%
TOTAL UP-N2 53% 28% 13% 4% 2%
SYSTEM TOTAL 26% 53% 16% 4% 1%
1 Includes riders boarding on all Metra lines departing from station2 Line total does not include downtown terminal
Source: Metra, Fall 2016 Origin-Destination Survey
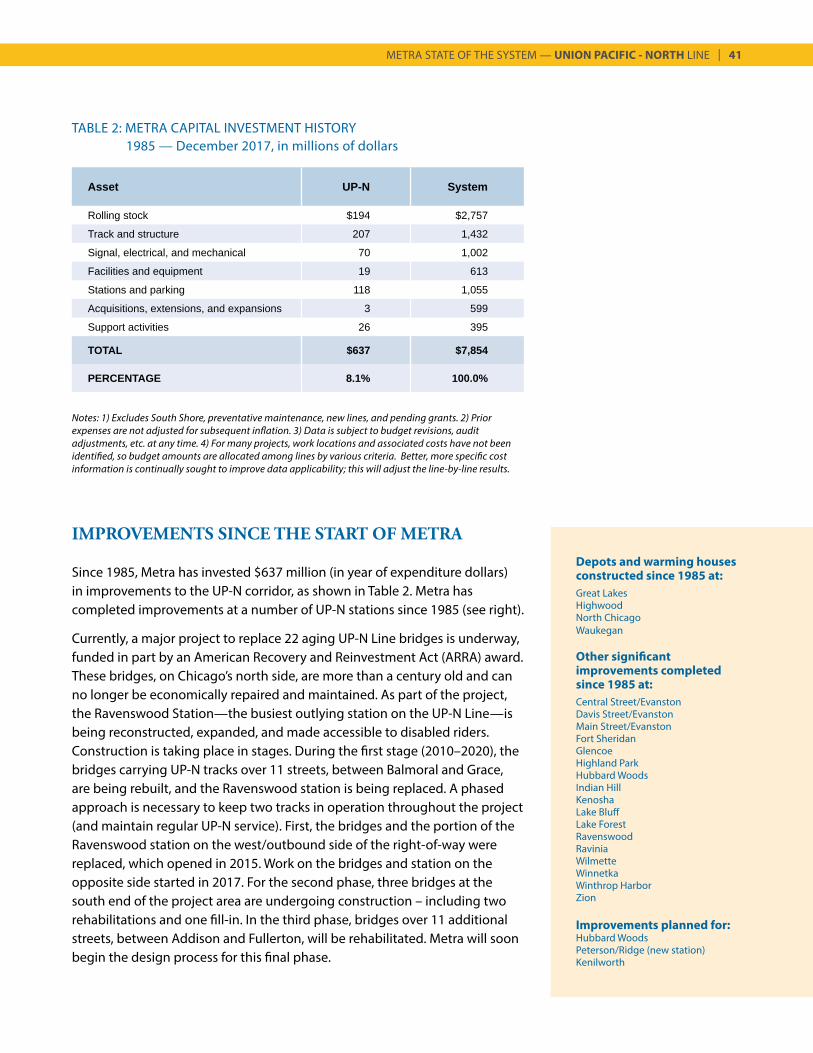
METRA STATE OF THE SYSTEM — UNION PACIFIC - NORTH LINE | 41
TABLE 2: METRA CAPITAL INVESTMENT HISTORY 1985 — December 2017, in millions of dollars
Asset UP-N System
Rolling stock $194 $2,757
Track and structure 207 1,432
Signal, electrical, and mechanical 70 1,002
Facilities and equipment 19 613
Stations and parking 118 1,055
Acquisitions, extensions, and expansions 3 599
Support activities 26 395
TOTAL $637 $7,854
PERCENTAGE 8.1% 100.0%
Depots and warming houses constructed since 1985 at:Great LakesHighwoodNorth ChicagoWaukegan
Other significant improvements completed since 1985 at:Central Street/EvanstonDavis Street/EvanstonMain Street/EvanstonFort SheridanGlencoeHighland ParkHubbard WoodsIndian HillKenoshaLake BluffLake ForestRavenswoodRaviniaWilmetteWinnetkaWinthrop HarborZion
Improvements planned for:Hubbard WoodsPeterson/Ridge (new station)Kenilworth
Notes: 1) Excludes South Shore, preventative maintenance, new lines, and pending grants. 2) Prior expenses are not adjusted for subsequent inflation. 3) Data is subject to budget revisions, audit adjustments, etc. at any time. 4) For many projects, work locations and associated costs have not been identified, so budget amounts are allocated among lines by various criteria. Better, more specific cost information is continually sought to improve data applicability; this will adjust the line-by-line results.
IMPROVEMENTS SINCE THE START OF METRA
Since 1985, Metra has invested $637 million (in year of expenditure dollars) in improvements to the UP-N corridor, as shown in Table 2. Metra has completed improvements at a number of UP-N stations since 1985 (see right).
Currently, a major project to replace 22 aging UP-N Line bridges is underway, funded in part by an American Recovery and Reinvestment Act (ARRA) award. These bridges, on Chicago’s north side, are more than a century old and can no longer be economically repaired and maintained. As part of the project, the Ravenswood Station—the busiest outlying station on the UP-N Line—is being reconstructed, expanded, and made accessible to disabled riders. Construction is taking place in stages. During the first stage (2010–2020), the bridges carrying UP-N tracks over 11 streets, between Balmoral and Grace, are being rebuilt, and the Ravenswood station is being replaced. A phased approach is necessary to keep two tracks in operation throughout the project (and maintain regular UP-N service). First, the bridges and the portion of the Ravenswood station on the west/outbound side of the right-of-way were replaced, which opened in 2015. Work on the bridges and station on the opposite side started in 2017. For the second phase, three bridges at the south end of the project area are undergoing construction – including two rehabilitations and one fill-in. In the third phase, bridges over 11 additional streets, between Addison and Fullerton, will be rehabilitated. Metra will soon begin the design process for this final phase.
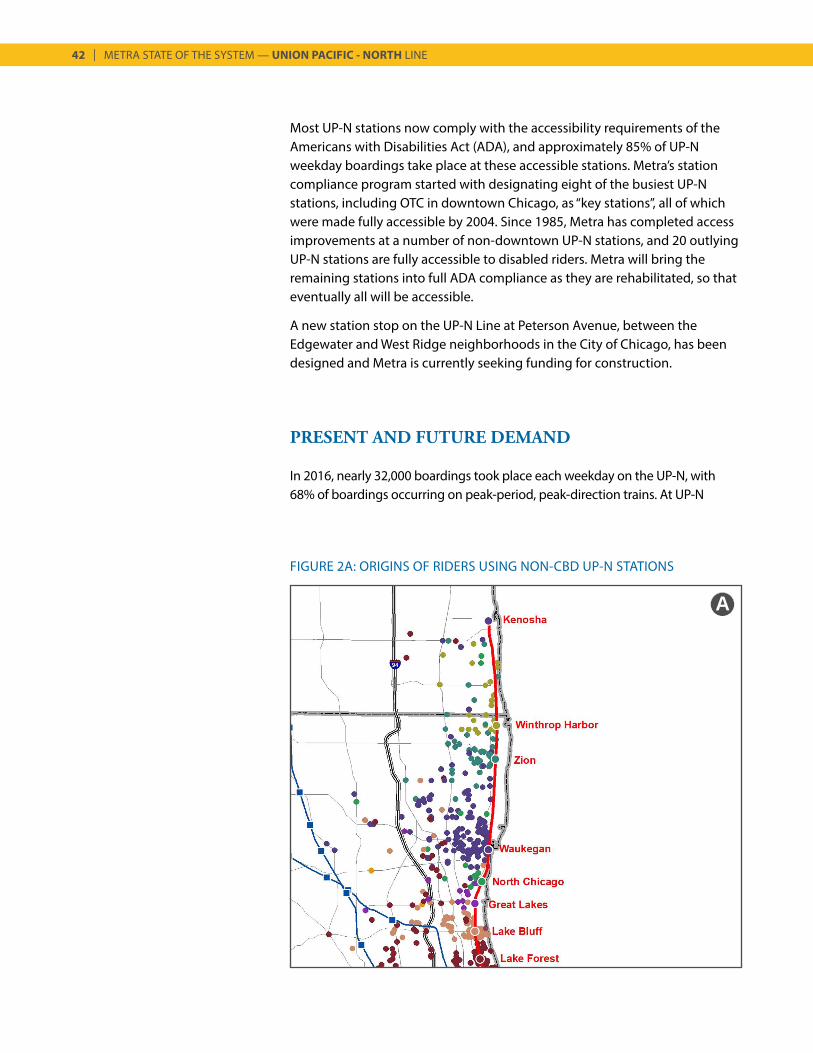
42 | METRA STATE OF THE SYSTEM — UNION PACIFIC - NORTH LINE
A
FIGURE 2A: ORIGINS OF RIDERS USING NON-CBD UP-N STATIONS
Most UP-N stations now comply with the accessibility requirements of the Americans with Disabilities Act (ADA), and approximately 85% of UP-N weekday boardings take place at these accessible stations. Metra’s station compliance program started with designating eight of the busiest UP-N stations, including OTC in downtown Chicago, as “key stations”, all of which were made fully accessible by 2004. Since 1985, Metra has completed access improvements at a number of non-downtown UP-N stations, and 20 outlying UP-N stations are fully accessible to disabled riders. Metra will bring the remaining stations into full ADA compliance as they are rehabilitated, so that eventually all will be accessible.
A new station stop on the UP-N Line at Peterson Avenue, between the Edgewater and West Ridge neighborhoods in the City of Chicago, has been designed and Metra is currently seeking funding for construction.
PRESENT AND FUTURE DEMAND
In 2016, nearly 32,000 boardings took place each weekday on the UP-N, with 68% of boardings occurring on peak-period, peak-direction trains. At UP-N
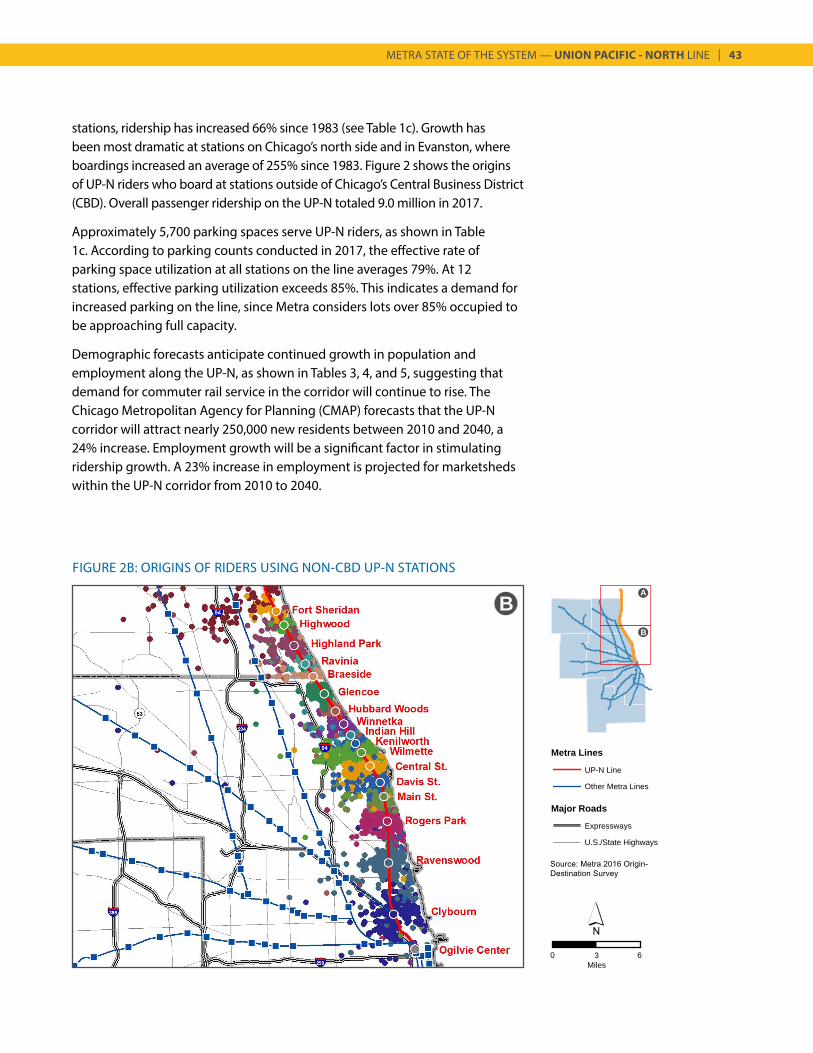
METRA STATE OF THE SYSTEM — UNION PACIFIC - NORTH LINE | 43
FIGURE 2B: ORIGINS OF RIDERS USING NON-CBD UP-N STATIONS
B
0 3Miles
6
A
B
stations, ridership has increased 66% since 1983 (see Table 1c). Growth has been most dramatic at stations on Chicago’s north side and in Evanston, where boardings increased an average of 255% since 1983. Figure 2 shows the origins of UP-N riders who board at stations outside of Chicago’s Central Business District (CBD). Overall passenger ridership on the UP-N totaled 9.0 million in 2017.
Approximately 5,700 parking spaces serve UP-N riders, as shown in Table 1c. According to parking counts conducted in 2017, the effective rate of parking space utilization at all stations on the line averages 79%. At 12 stations, effective parking utilization exceeds 85%. This indicates a demand for increased parking on the line, since Metra considers lots over 85% occupied to be approaching full capacity.
Demographic forecasts anticipate continued growth in population and employment along the UP-N, as shown in Tables 3, 4, and 5, suggesting that demand for commuter rail service in the corridor will continue to rise. The Chicago Metropolitan Agency for Planning (CMAP) forecasts that the UP-N corridor will attract nearly 250,000 new residents between 2010 and 2040, a 24% increase. Employment growth will be a significant factor in stimulating ridership growth. A 23% increase in employment is projected for marketsheds within the UP-N corridor from 2010 to 2040.
UP-N Line
Other Metra Lines
Metra Lines
Expressways
U.S./State Highways
Major Roads
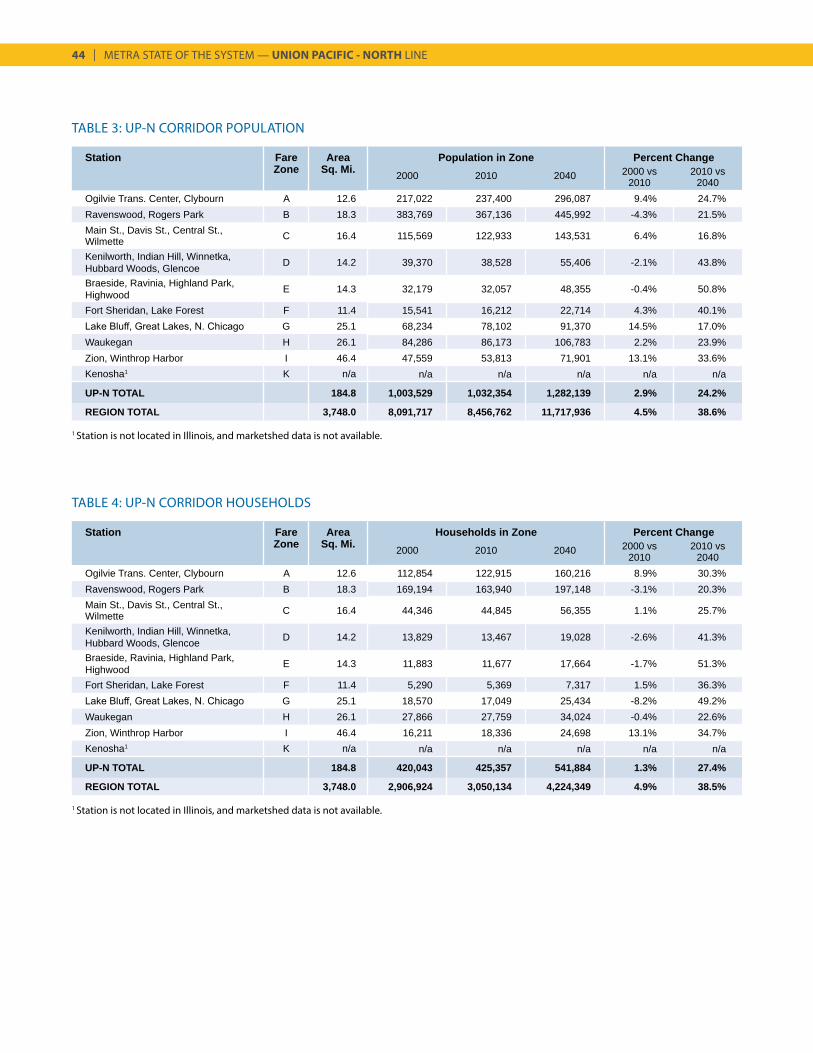
44 | METRA STATE OF THE SYSTEM — UNION PACIFIC - NORTH LINE
TABLE 3: UP-N CORRIDOR POPULATION
TABLE 4: UP-N CORRIDOR HOUSEHOLDS
Station Fare Area Population in Zone Percent ChangeZone Sq. Mi. 2000 2010 2040 2000 vs
20102010 vs
2040Ogilvie Trans. Center, Clybourn A 12.6 217,022 237,400 296,087 9.4% 24.7%Ravenswood, Rogers Park B 18.3 383,769 367,136 445,992 -4.3% 21.5%Main St., Davis St., Central St., Wilmette C 16.4 115,569 122,933 143,531 6.4% 16.8%
Kenilworth, Indian Hill, Winnetka, Hubbard Woods, Glencoe D 14.2 39,370 38,528 55,406 -2.1% 43.8%
Braeside, Ravinia, Highland Park, Highwood E 14.3 32,179 32,057 48,355 -0.4% 50.8%
Fort Sheridan, Lake Forest F 11.4 15,541 16,212 22,714 4.3% 40.1%Lake Bluff, Great Lakes, N. Chicago G 25.1 68,234 78,102 91,370 14.5% 17.0%Waukegan H 26.1 84,286 86,173 106,783 2.2% 23.9%Zion, Winthrop Harbor I 46.4 47,559 53,813 71,901 13.1% 33.6%Kenosha1 K n/a n/a n/a n/a n/a n/a
UP-N TOTAL 184.8 1,003,529 1,032,354 1,282,139 2.9% 24.2%
REGION TOTAL 3,748.0 8,091,717 8,456,762 11,717,936 4.5% 38.6%
Station Fare Area Households in Zone Percent ChangeZone Sq. Mi. 2000 2010 2040 2000 vs
20102010 vs
2040Ogilvie Trans. Center, Clybourn A 12.6 112,854 122,915 160,216 8.9% 30.3%Ravenswood, Rogers Park B 18.3 169,194 163,940 197,148 -3.1% 20.3%Main St., Davis St., Central St., Wilmette C 16.4 44,346 44,845 56,355 1.1% 25.7%
Kenilworth, Indian Hill, Winnetka, Hubbard Woods, Glencoe D 14.2 13,829 13,467 19,028 -2.6% 41.3%
Braeside, Ravinia, Highland Park, Highwood E 14.3 11,883 11,677 17,664 -1.7% 51.3%
Fort Sheridan, Lake Forest F 11.4 5,290 5,369 7,317 1.5% 36.3%Lake Bluff, Great Lakes, N. Chicago G 25.1 18,570 17,049 25,434 -8.2% 49.2%Waukegan H 26.1 27,866 27,759 34,024 -0.4% 22.6%Zion, Winthrop Harbor I 46.4 16,211 18,336 24,698 13.1% 34.7%Kenosha1 K n/a n/a n/a n/a n/a n/a
UP-N TOTAL 184.8 420,043 425,357 541,884 1.3% 27.4%
REGION TOTAL 3,748.0 2,906,924 3,050,134 4,224,349 4.9% 38.5%
1 Station is not located in Illinois, and marketshed data is not available.
1 Station is not located in Illinois, and marketshed data is not available.
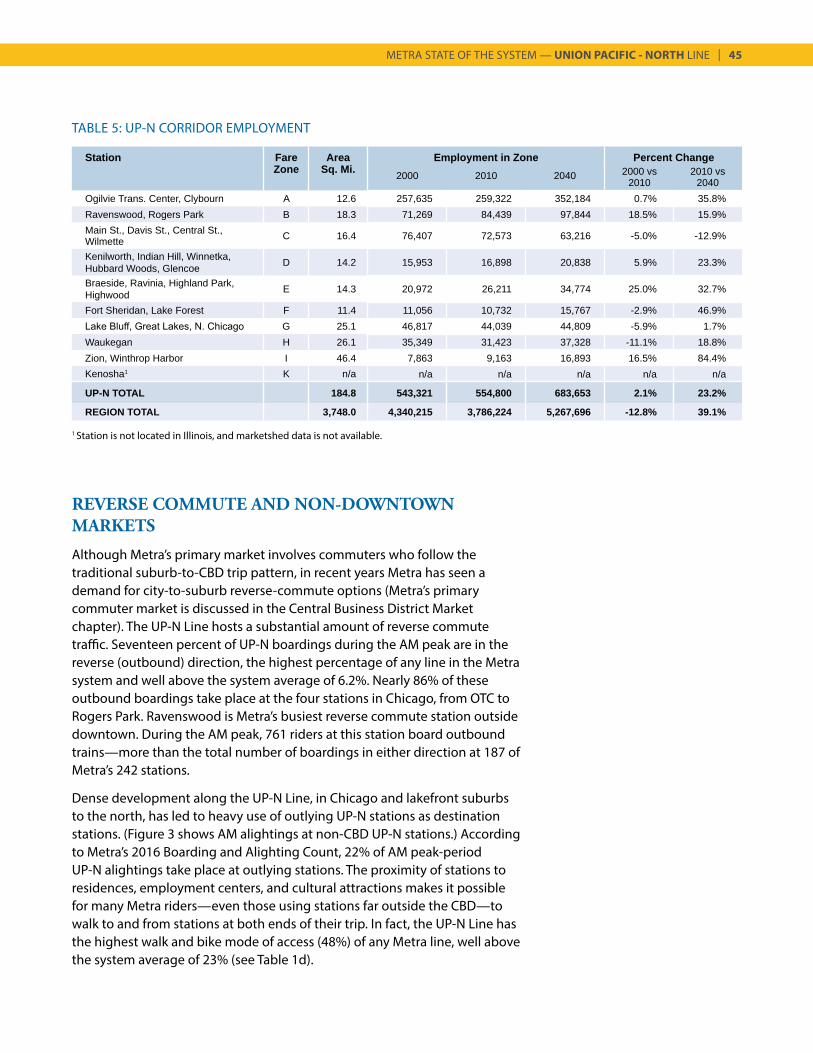
METRA STATE OF THE SYSTEM — UNION PACIFIC - NORTH LINE | 45
TABLE 5: UP-N CORRIDOR EMPLOYMENT
Station Fare Area Employment in Zone Percent ChangeZone Sq. Mi. 2000 2010 2040 2000 vs
20102010 vs
2040Ogilvie Trans. Center, Clybourn A 12.6 257,635 259,322 352,184 0.7% 35.8%Ravenswood, Rogers Park B 18.3 71,269 84,439 97,844 18.5% 15.9%Main St., Davis St., Central St., Wilmette C 16.4 76,407 72,573 63,216 -5.0% -12.9%
Kenilworth, Indian Hill, Winnetka, Hubbard Woods, Glencoe D 14.2 15,953 16,898 20,838 5.9% 23.3%
Braeside, Ravinia, Highland Park, Highwood E 14.3 20,972 26,211 34,774 25.0% 32.7%
Fort Sheridan, Lake Forest F 11.4 11,056 10,732 15,767 -2.9% 46.9%Lake Bluff, Great Lakes, N. Chicago G 25.1 46,817 44,039 44,809 -5.9% 1.7%Waukegan H 26.1 35,349 31,423 37,328 -11.1% 18.8%Zion, Winthrop Harbor I 46.4 7,863 9,163 16,893 16.5% 84.4%Kenosha1 K n/a n/a n/a n/a n/a n/a
UP-N TOTAL 184.8 543,321 554,800 683,653 2.1% 23.2%
REGION TOTAL 3,748.0 4,340,215 3,786,224 5,267,696 -12.8% 39.1%
REVERSE COMMUTE AND NON-DOWNTOWN MARKETS
Although Metra’s primary market involves commuters who follow the traditional suburb-to-CBD trip pattern, in recent years Metra has seen a demand for city-to-suburb reverse-commute options (Metra’s primary commuter market is discussed in the Central Business District Market chapter). The UP-N Line hosts a substantial amount of reverse commute traffic. Seventeen percent of UP-N boardings during the AM peak are in the reverse (outbound) direction, the highest percentage of any line in the Metra system and well above the system average of 6.2%. Nearly 86% of these outbound boardings take place at the four stations in Chicago, from OTC to Rogers Park. Ravenswood is Metra’s busiest reverse commute station outside downtown. During the AM peak, 761 riders at this station board outbound trains—more than the total number of boardings in either direction at 187 of Metra’s 242 stations.
Dense development along the UP-N Line, in Chicago and lakefront suburbs to the north, has led to heavy use of outlying UP-N stations as destination stations. (Figure 3 shows AM alightings at non-CBD UP-N stations.) According to Metra’s 2016 Boarding and Alighting Count, 22% of AM peak-period UP-N alightings take place at outlying stations. The proximity of stations to residences, employment centers, and cultural attractions makes it possible for many Metra riders—even those using stations far outside the CBD—to walk to and from stations at both ends of their trip. In fact, the UP-N Line has the highest walk and bike mode of access (48%) of any Metra line, well above the system average of 23% (see Table 1d).
1 Station is not located in Illinois, and marketshed data is not available.
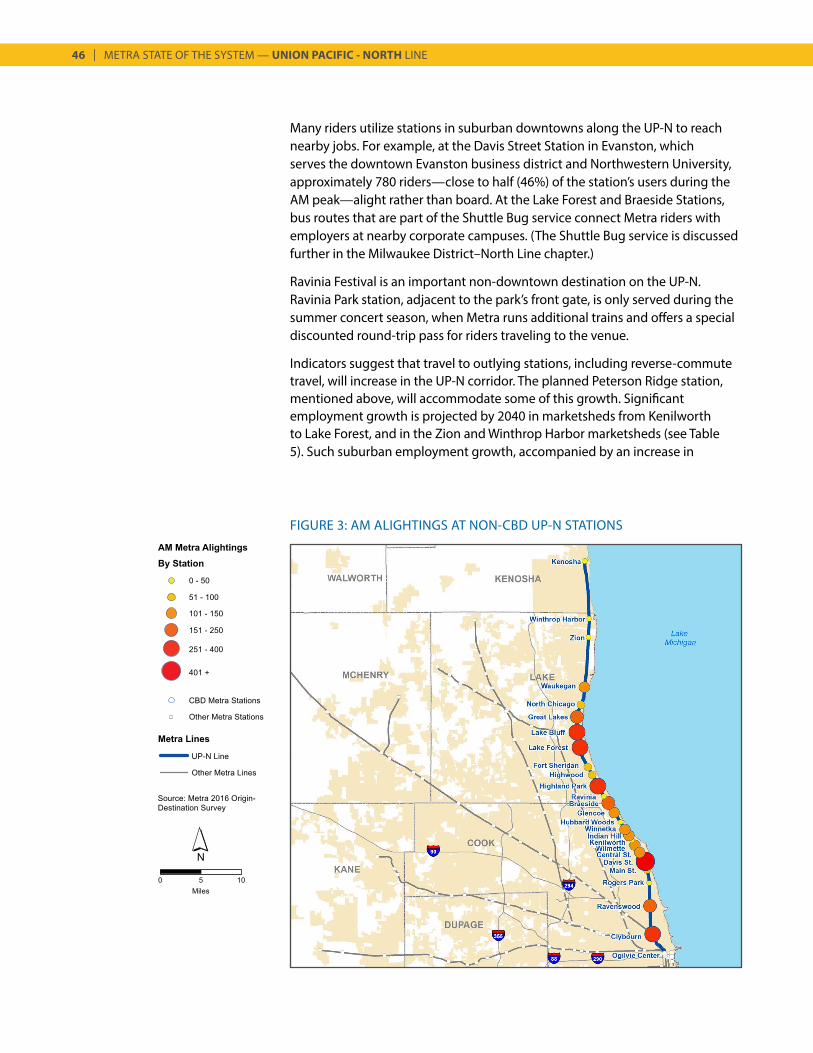
46 | METRA STATE OF THE SYSTEM — UNION PACIFIC - NORTH LINE
FIGURE 3: AM ALIGHTINGS AT NON-CBD UP-N STATIONS
Many riders utilize stations in suburban downtowns along the UP-N to reach nearby jobs. For example, at the Davis Street Station in Evanston, which serves the downtown Evanston business district and Northwestern University, approximately 780 riders—close to half (46%) of the station’s users during the AM peak—alight rather than board. At the Lake Forest and Braeside Stations, bus routes that are part of the Shuttle Bug service connect Metra riders with employers at nearby corporate campuses. (The Shuttle Bug service is discussed further in the Milwaukee District–North Line chapter.)
Ravinia Festival is an important non-downtown destination on the UP-N. Ravinia Park station, adjacent to the park’s front gate, is only served during the summer concert season, when Metra runs additional trains and offers a special discounted round-trip pass for riders traveling to the venue.
Indicators suggest that travel to outlying stations, including reverse-commute travel, will increase in the UP-N corridor. The planned Peterson Ridge station, mentioned above, will accommodate some of this growth. Significant employment growth is projected by 2040 in marketsheds from Kenilworth to Lake Forest, and in the Zion and Winthrop Harbor marketsheds (see Table 5). Such suburban employment growth, accompanied by an increase in
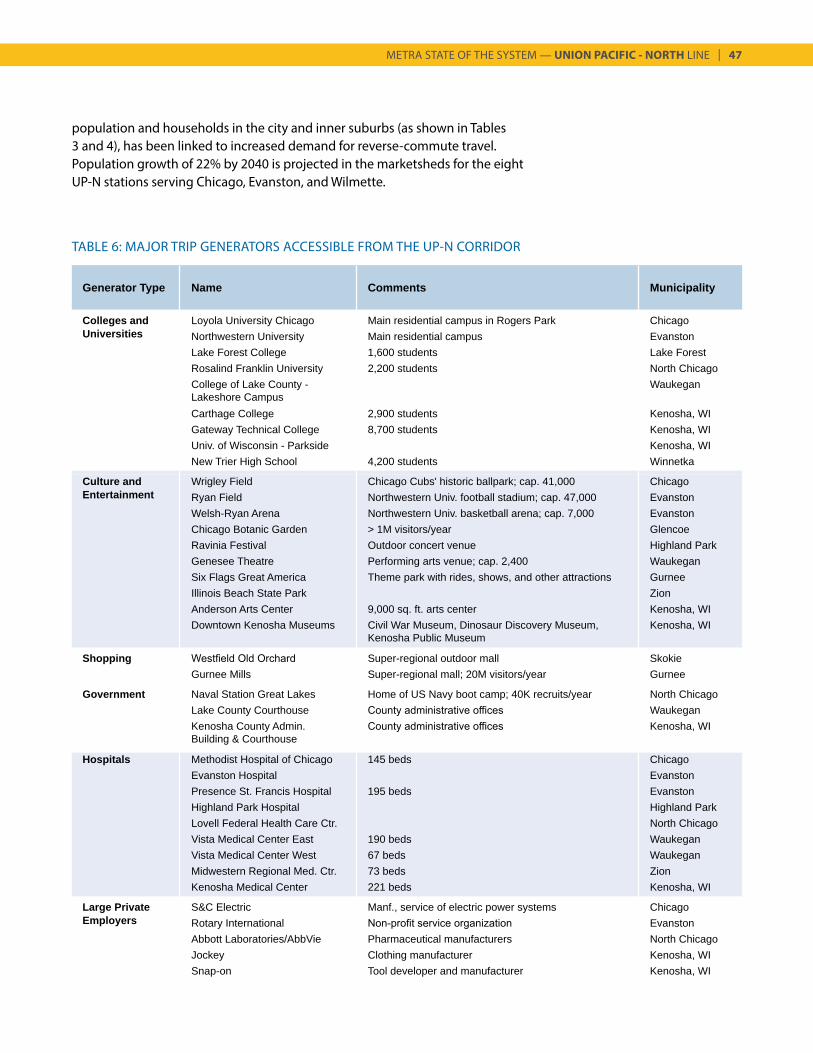
METRA STATE OF THE SYSTEM — UNION PACIFIC - NORTH LINE | 47
population and households in the city and inner suburbs (as shown in Tables 3 and 4), has been linked to increased demand for reverse-commute travel. Population growth of 22% by 2040 is projected in the marketsheds for the eight UP-N stations serving Chicago, Evanston, and Wilmette.
Generator Type Name Comments Municipality
Colleges and Loyola University Chicago Main residential campus in Rogers Park ChicagoUniversities Northwestern University Main residential campus Evanston
Lake Forest College 1,600 students Lake ForestRosalind Franklin University 2,200 students North ChicagoCollege of Lake County - Lakeshore Campus
Waukegan
Carthage College 2,900 students Kenosha, WIGateway Technical College 8,700 students Kenosha, WIUniv. of Wisconsin - Parkside Kenosha, WINew Trier High School 4,200 students Winnetka
Culture and Wrigley Field Chicago Cubs' historic ballpark; cap. 41,000 ChicagoEntertainment Ryan Field Northwestern Univ. football stadium; cap. 47,000 Evanston
Welsh-Ryan Arena Northwestern Univ. basketball arena; cap. 7,000 EvanstonChicago Botanic Garden > 1M visitors/year GlencoeRavinia Festival Outdoor concert venue Highland ParkGenesee Theatre Performing arts venue; cap. 2,400 WaukeganSix Flags Great America Theme park with rides, shows, and other attractions GurneeIllinois Beach State Park ZionAnderson Arts Center 9,000 sq. ft. arts center Kenosha, WIDowntown Kenosha Museums Civil War Museum, Dinosaur Discovery Museum,
Kenosha Public MuseumKenosha, WI
Shopping Westfield Old Orchard Super-regional outdoor mall SkokieGurnee Mills Super-regional mall; 20M visitors/year Gurnee
Government Naval Station Great Lakes Home of US Navy boot camp; 40K recruits/year North ChicagoLake County Courthouse County administrative offices WaukeganKenosha County Admin. Building & Courthouse
County administrative offices Kenosha, WI
Hospitals Methodist Hospital of Chicago 145 beds ChicagoEvanston Hospital EvanstonPresence St. Francis Hospital 195 beds EvanstonHighland Park Hospital Highland ParkLovell Federal Health Care Ctr. North ChicagoVista Medical Center East 190 beds WaukeganVista Medical Center West 67 beds WaukeganMidwestern Regional Med. Ctr. 73 beds ZionKenosha Medical Center 221 beds Kenosha, WI
Large Private S&C Electric Manf., service of electric power systems ChicagoEmployers Rotary International Non-profit service organization Evanston
Abbott Laboratories/AbbVie Pharmaceutical manufacturers North ChicagoJockey Clothing manufacturer Kenosha, WISnap-on Tool developer and manufacturer Kenosha, WI
TABLE 6: MAJOR TRIP GENERATORS ACCESSIBLE FROM THE UP-N CORRIDOR
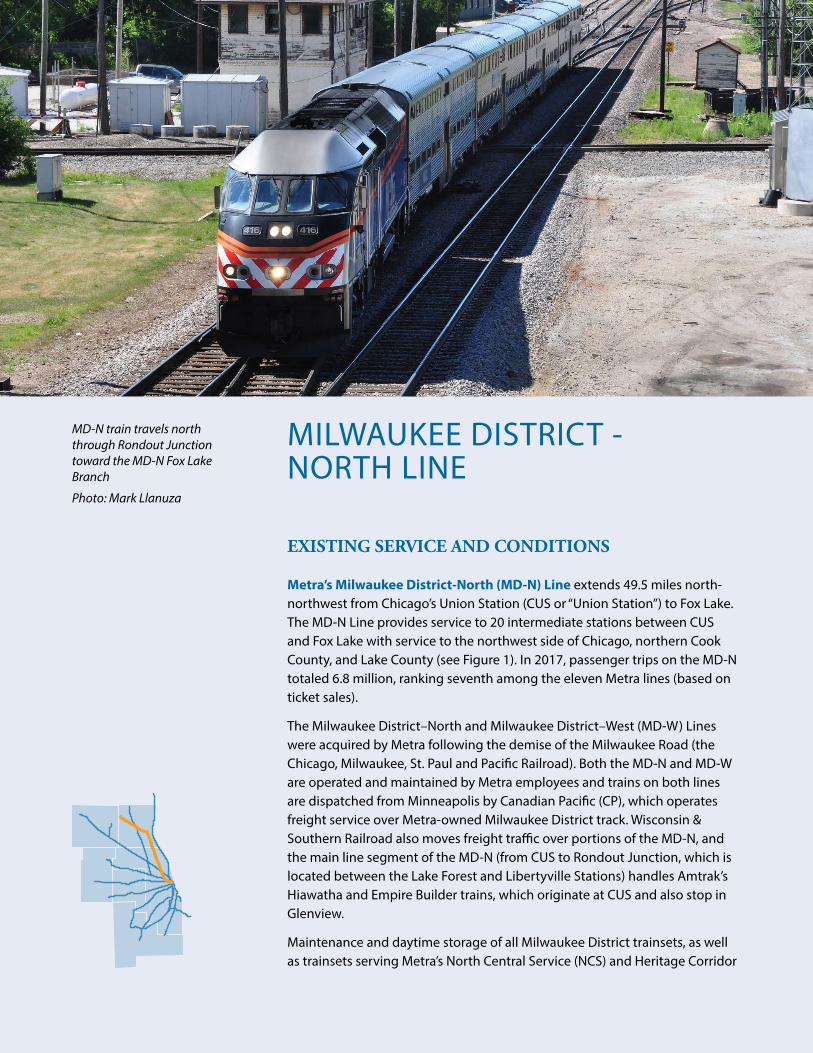
MILWAUKEE DISTRICT - NORTH LINE
EXISTING SERVICE AND CONDITIONS
Metra’s Milwaukee District-North (MD-N) Line extends 49.5 miles north-northwest from Chicago’s Union Station (CUS or “Union Station”) to Fox Lake. The MD-N Line provides service to 20 intermediate stations between CUS and Fox Lake with service to the northwest side of Chicago, northern Cook County, and Lake County (see Figure 1). In 2017, passenger trips on the MD-N totaled 6.8 million, ranking seventh among the eleven Metra lines (based on ticket sales).
The Milwaukee District–North and Milwaukee District–West (MD-W) Lines were acquired by Metra following the demise of the Milwaukee Road (the Chicago, Milwaukee, St. Paul and Pacific Railroad). Both the MD-N and MD-W are operated and maintained by Metra employees and trains on both lines are dispatched from Minneapolis by Canadian Pacific (CP), which operates freight service over Metra-owned Milwaukee District track. Wisconsin & Southern Railroad also moves freight traffic over portions of the MD-N, and the main line segment of the MD-N (from CUS to Rondout Junction, which is located between the Lake Forest and Libertyville Stations) handles Amtrak’s Hiawatha and Empire Builder trains, which originate at CUS and also stop in Glenview.
Maintenance and daytime storage of all Milwaukee District trainsets, as well as trainsets serving Metra’s North Central Service (NCS) and Heritage Corridor
MD-N train travels north through Rondout Junction toward the MD-N Fox Lake Branch
Photo: Mark Llanuza
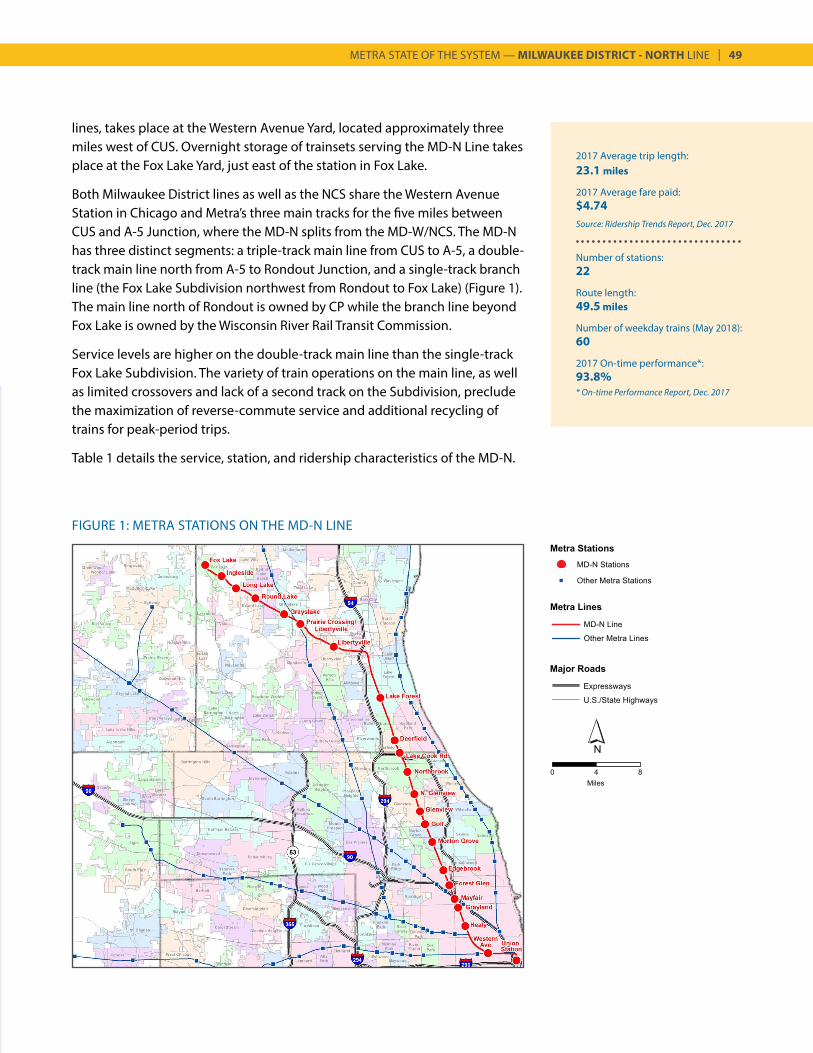
METRA STATE OF THE SYSTEM — MILWAUKEE DISTRICT - NORTH LINE | 49
2017 Average trip length:23.1 miles
2017 Average fare paid:$4.74Source: Ridership Trends Report, Dec. 2017
Number of stations:22
Route length:49.5 miles
Number of weekday trains (May 2018):60
2017 On-time performance*:93.8%* On-time Performance Report, Dec. 2017
FIGURE 1: METRA STATIONS ON THE MD-N LINE
lines, takes place at the Western Avenue Yard, located approximately three miles west of CUS. Overnight storage of trainsets serving the MD-N Line takes place at the Fox Lake Yard, just east of the station in Fox Lake.
Both Milwaukee District lines as well as the NCS share the Western Avenue Station in Chicago and Metra’s three main tracks for the five miles between CUS and A-5 Junction, where the MD-N splits from the MD-W/NCS. The MD-N has three distinct segments: a triple-track main line from CUS to A-5, a double-track main line north from A-5 to Rondout Junction, and a single-track branch line (the Fox Lake Subdivision northwest from Rondout to Fox Lake) (Figure 1). The main line north of Rondout is owned by CP while the branch line beyond Fox Lake is owned by the Wisconsin River Rail Transit Commission.
Service levels are higher on the double-track main line than the single-track Fox Lake Subdivision. The variety of train operations on the main line, as well as limited crossovers and lack of a second track on the Subdivision, preclude the maximization of reverse-commute service and additional recycling of trains for peak-period trips.
Table 1 details the service, station, and ridership characteristics of the MD-N.

50 | METRA STATE OF THE SYSTEM — MILWAUKEE DISTRICT - NORTH LINE
Source: Metra Weekday Station Boardings and Alightings by Time-of-Day and Direction, 2016
TABLE 1A: 2016 MD-N WEEKDAY BOARDINGS
TABLE 1B: MD-N ANNUAL PASSENGER TRIPS1983 — 2017, in millions
Y E A R
Time of Day Inbound Outbound
AM Peak 8,434 1,367
Midday 1,513 1,003
PM Peak 1,642 7,904
Evening 318 1,262
TOTAL 11,907 11,536
Note: from 2008, figures include free Circuit Permit trips. 2008-2011 figures include free senior trips; this program ended September 2011.
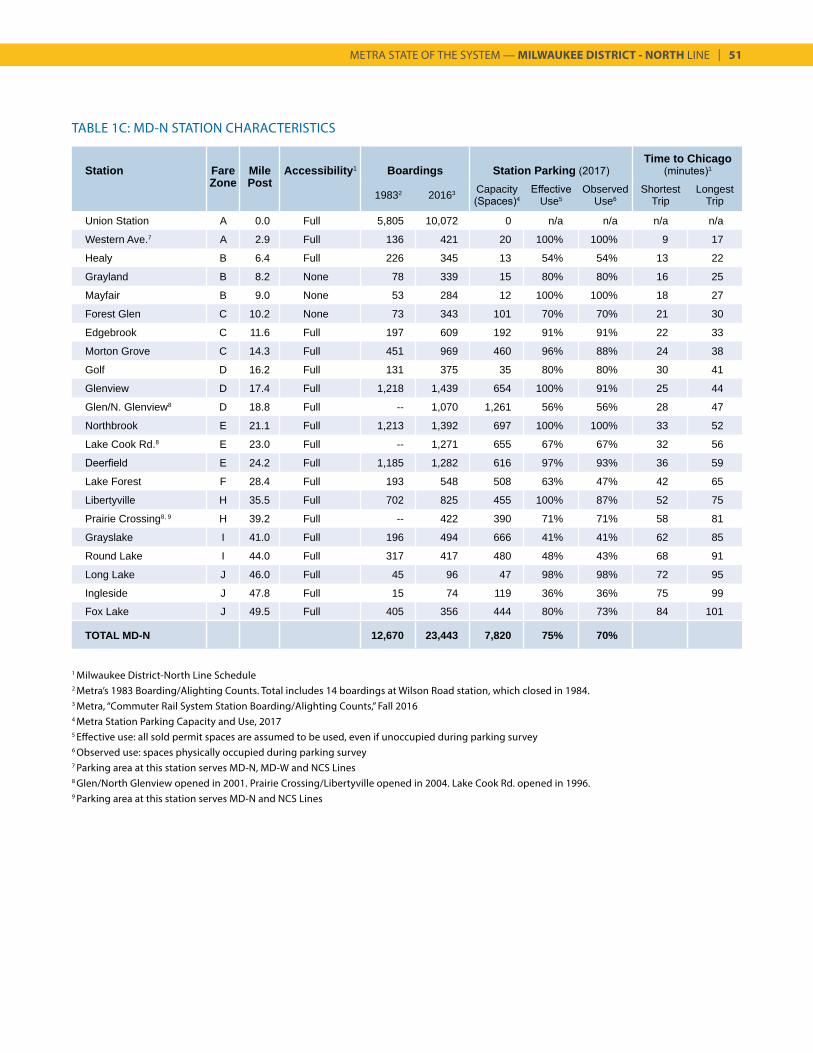
METRA STATE OF THE SYSTEM — MILWAUKEE DISTRICT - NORTH LINE | 51
TABLE 1C: MD-N STATION CHARACTERISTICS
Station Fare Mile Accessibility1 Boardings Station Parking (2017)Time to Chicago
(minutes)1
Zone Post19832 20163 Capacity
(Spaces)4Effective
Use5Observed
Use6Shortest
TripLongest
Trip
Union Station A 0.0 Full 5,805 10,072 0 n/a n/a n/a n/a
Western Ave.7 A 2.9 Full 136 421 20 100% 100% 9 17
Healy B 6.4 Full 226 345 13 54% 54% 13 22
Grayland B 8.2 None 78 339 15 80% 80% 16 25
Mayfair B 9.0 None 53 284 12 100% 100% 18 27
Forest Glen C 10.2 None 73 343 101 70% 70% 21 30
Edgebrook C 11.6 Full 197 609 192 91% 91% 22 33
Morton Grove C 14.3 Full 451 969 460 96% 88% 24 38
Golf D 16.2 Full 131 375 35 80% 80% 30 41
Glenview D 17.4 Full 1,218 1,439 654 100% 91% 25 44
Glen/N. Glenview8 D 18.8 Full -- 1,070 1,261 56% 56% 28 47
Northbrook E 21.1 Full 1,213 1,392 697 100% 100% 33 52
Lake Cook Rd.8 E 23.0 Full -- 1,271 655 67% 67% 32 56
Deerfield E 24.2 Full 1,185 1,282 616 97% 93% 36 59
Lake Forest F 28.4 Full 193 548 508 63% 47% 42 65
Libertyville H 35.5 Full 702 825 455 100% 87% 52 75
Prairie Crossing8, 9 H 39.2 Full -- 422 390 71% 71% 58 81
Grayslake I 41.0 Full 196 494 666 41% 41% 62 85
Round Lake I 44.0 Full 317 417 480 48% 43% 68 91
Long Lake J 46.0 Full 45 96 47 98% 98% 72 95
Ingleside J 47.8 Full 15 74 119 36% 36% 75 99
Fox Lake J 49.5 Full 405 356 444 80% 73% 84 101
TOTAL MD-N 12,670 23,443 7,820 75% 70%
1 Milwaukee District-North Line Schedule2 Metra’s 1983 Boarding/Alighting Counts. Total includes 14 boardings at Wilson Road station, which closed in 1984.3 Metra, “Commuter Rail System Station Boarding/Alighting Counts,” Fall 20164 Metra Station Parking Capacity and Use, 20175 Effective use: all sold permit spaces are assumed to be used, even if unoccupied during parking survey6 Observed use: spaces physically occupied during parking survey7 Parking area at this station serves MD-N, MD-W and NCS Lines8 Glen/North Glenview opened in 2001. Prairie Crossing/Libertyville opened in 2004. Lake Cook Rd. opened in 1996.9 Parking area at this station serves MD-N and NCS Lines
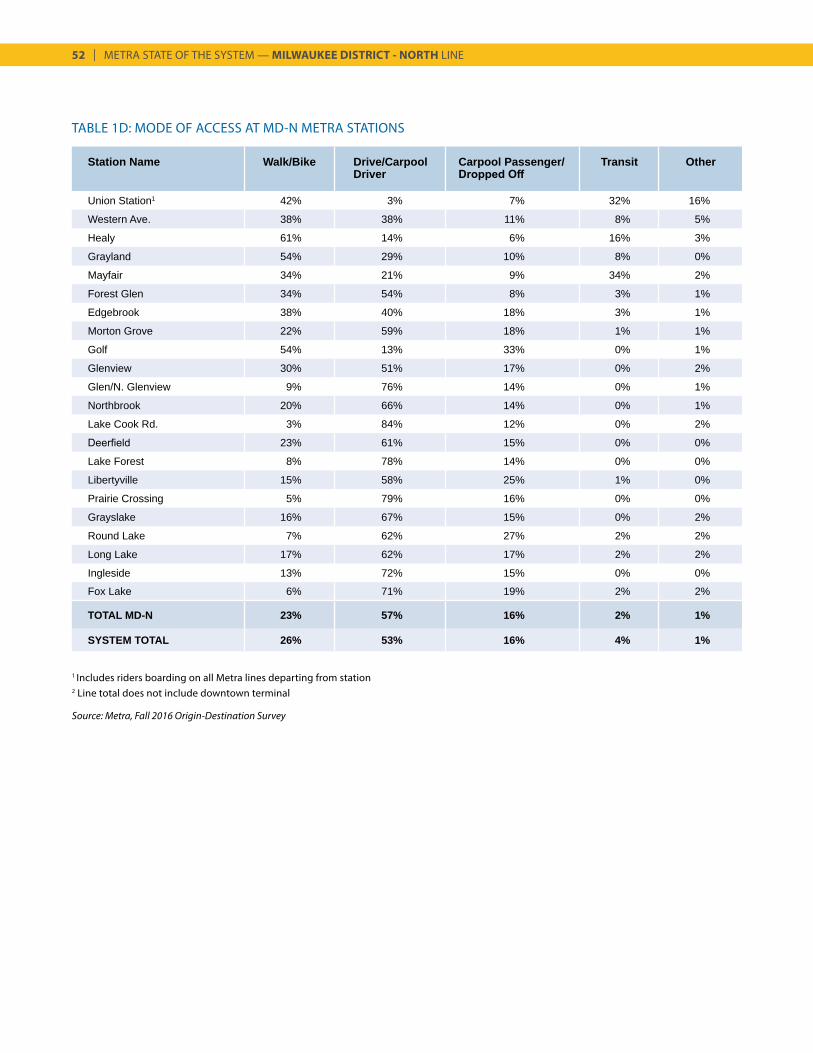
52 | METRA STATE OF THE SYSTEM — MILWAUKEE DISTRICT - NORTH LINE
TABLE 1D: MODE OF ACCESS AT MD-N METRA STATIONS
Station Name Walk/Bike Drive/Carpool Driver
Carpool Passenger/ Dropped Off
Transit Other
Union Station1 42% 3% 7% 32% 16%
Western Ave. 38% 38% 11% 8% 5%
Healy 61% 14% 6% 16% 3%
Grayland 54% 29% 10% 8% 0%
Mayfair 34% 21% 9% 34% 2%
Forest Glen 34% 54% 8% 3% 1%
Edgebrook 38% 40% 18% 3% 1%
Morton Grove 22% 59% 18% 1% 1%
Golf 54% 13% 33% 0% 1%
Glenview 30% 51% 17% 0% 2%
Glen/N. Glenview 9% 76% 14% 0% 1%
Northbrook 20% 66% 14% 0% 1%
Lake Cook Rd. 3% 84% 12% 0% 2%
Deerfield 23% 61% 15% 0% 0%
Lake Forest 8% 78% 14% 0% 0%
Libertyville 15% 58% 25% 1% 0%
Prairie Crossing 5% 79% 16% 0% 0%
Grayslake 16% 67% 15% 0% 2%
Round Lake 7% 62% 27% 2% 2%
Long Lake 17% 62% 17% 2% 2%
Ingleside 13% 72% 15% 0% 0%
Fox Lake 6% 71% 19% 2% 2%
TOTAL MD-N 23% 57% 16% 2% 1%
SYSTEM TOTAL 26% 53% 16% 4% 1%
1 Includes riders boarding on all Metra lines departing from station2 Line total does not include downtown terminal
Source: Metra, Fall 2016 Origin-Destination Survey
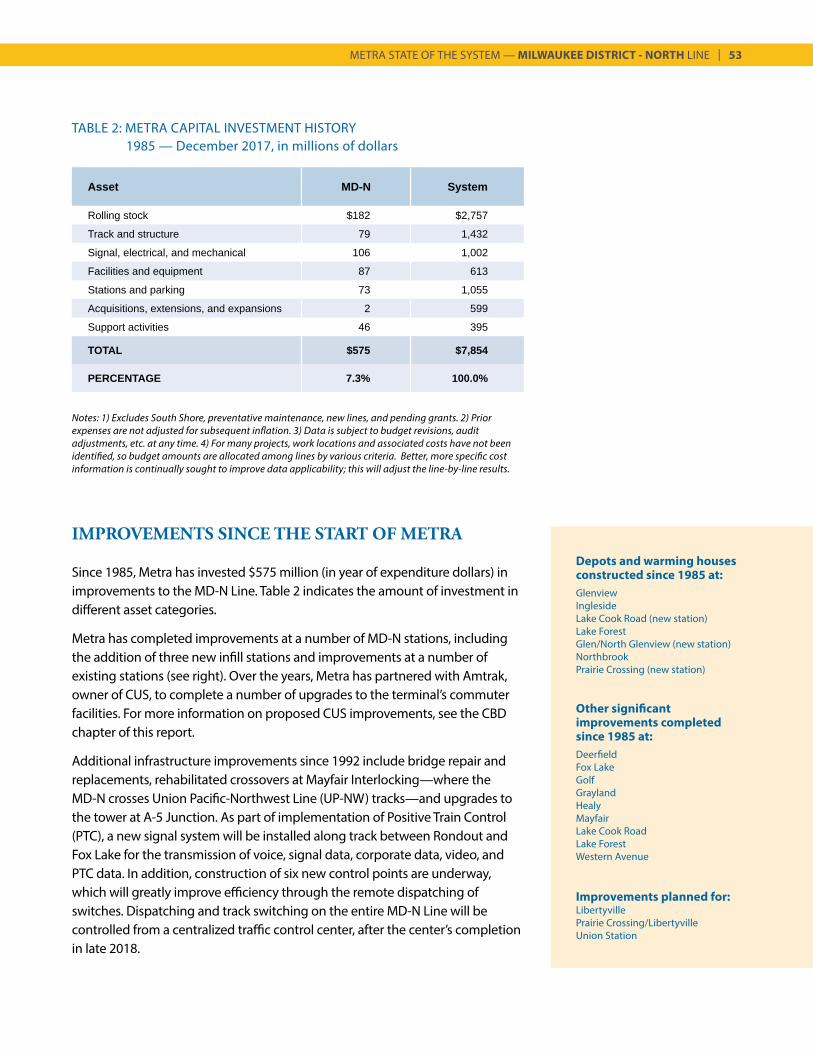
METRA STATE OF THE SYSTEM — MILWAUKEE DISTRICT - NORTH LINE | 53
IMPROVEMENTS SINCE THE START OF METRA
Since 1985, Metra has invested $575 million (in year of expenditure dollars) in improvements to the MD-N Line. Table 2 indicates the amount of investment in different asset categories.
Metra has completed improvements at a number of MD-N stations, including the addition of three new infill stations and improvements at a number of existing stations (see right). Over the years, Metra has partnered with Amtrak, owner of CUS, to complete a number of upgrades to the terminal’s commuter facilities. For more information on proposed CUS improvements, see the CBD chapter of this report.
Additional infrastructure improvements since 1992 include bridge repair and replacements, rehabilitated crossovers at Mayfair Interlocking—where the MD-N crosses Union Pacific-Northwest Line (UP-NW) tracks—and upgrades to the tower at A-5 Junction. As part of implementation of Positive Train Control (PTC), a new signal system will be installed along track between Rondout and Fox Lake for the transmission of voice, signal data, corporate data, video, and PTC data. In addition, construction of six new control points are underway, which will greatly improve efficiency through the remote dispatching of switches. Dispatching and track switching on the entire MD-N Line will be controlled from a centralized traffic control center, after the center’s completion in late 2018.
TABLE 2: METRA CAPITAL INVESTMENT HISTORY 1985 — December 2017, in millions of dollars
Asset MD-N System
Rolling stock $182 $2,757
Track and structure 79 1,432
Signal, electrical, and mechanical 106 1,002
Facilities and equipment 87 613
Stations and parking 73 1,055
Acquisitions, extensions, and expansions 2 599
Support activities 46 395
TOTAL $575 $7,854
PERCENTAGE 7.3% 100.0%
Depots and warming houses constructed since 1985 at:GlenviewInglesideLake Cook Road (new station)Lake ForestGlen/North Glenview (new station)NorthbrookPrairie Crossing (new station)
Other significant improvements completed since 1985 at:DeerfieldFox LakeGolfGraylandHealyMayfairLake Cook RoadLake ForestWestern Avenue
Improvements planned for:LibertyvillePrairie Crossing/LibertyvilleUnion Station
Notes: 1) Excludes South Shore, preventative maintenance, new lines, and pending grants. 2) Prior expenses are not adjusted for subsequent inflation. 3) Data is subject to budget revisions, audit adjustments, etc. at any time. 4) For many projects, work locations and associated costs have not been identified, so budget amounts are allocated among lines by various criteria. Better, more specific cost information is continually sought to improve data applicability; this will adjust the line-by-line results.
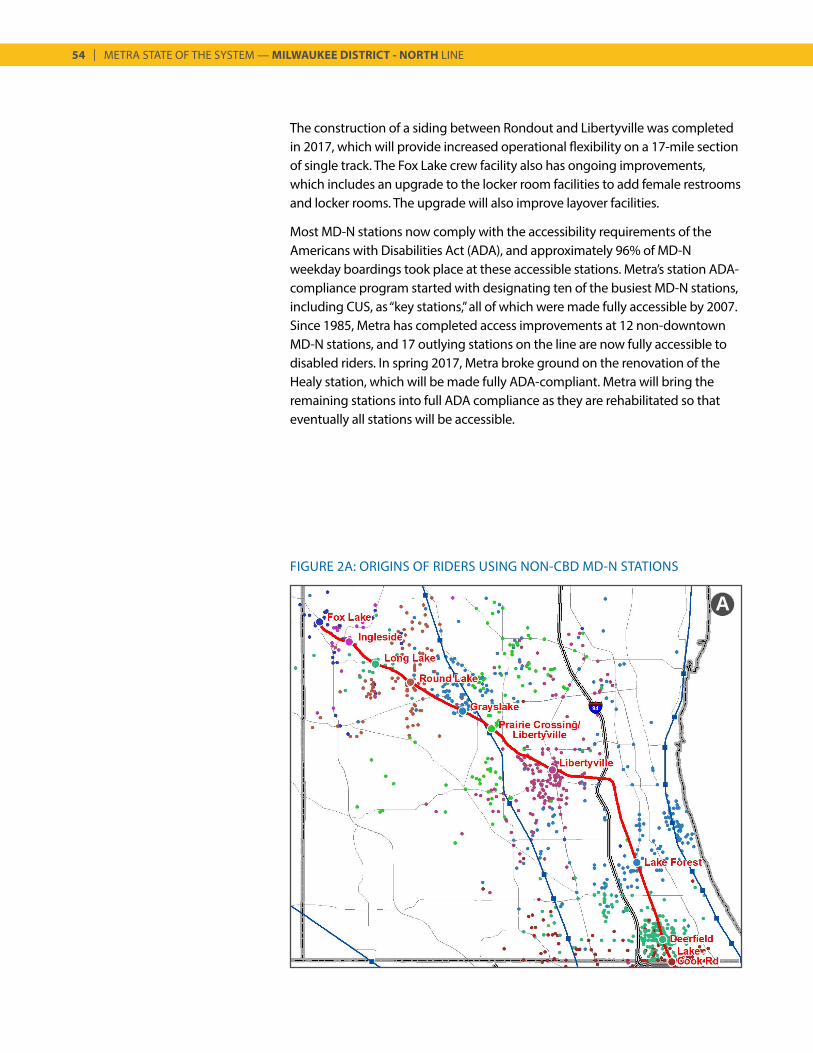
54 | METRA STATE OF THE SYSTEM — MILWAUKEE DISTRICT - NORTH LINE
A
The construction of a siding between Rondout and Libertyville was completed in 2017, which will provide increased operational flexibility on a 17-mile section of single track. The Fox Lake crew facility also has ongoing improvements, which includes an upgrade to the locker room facilities to add female restrooms and locker rooms. The upgrade will also improve layover facilities.
Most MD-N stations now comply with the accessibility requirements of the Americans with Disabilities Act (ADA), and approximately 96% of MD-N weekday boardings took place at these accessible stations. Metra’s station ADA-compliance program started with designating ten of the busiest MD-N stations, including CUS, as “key stations,” all of which were made fully accessible by 2007. Since 1985, Metra has completed access improvements at 12 non-downtown MD-N stations, and 17 outlying stations on the line are now fully accessible to disabled riders. In spring 2017, Metra broke ground on the renovation of the Healy station, which will be made fully ADA-compliant. Metra will bring the remaining stations into full ADA compliance as they are rehabilitated so that eventually all stations will be accessible.
FIGURE 2A: ORIGINS OF RIDERS USING NON-CBD MD-N STATIONS
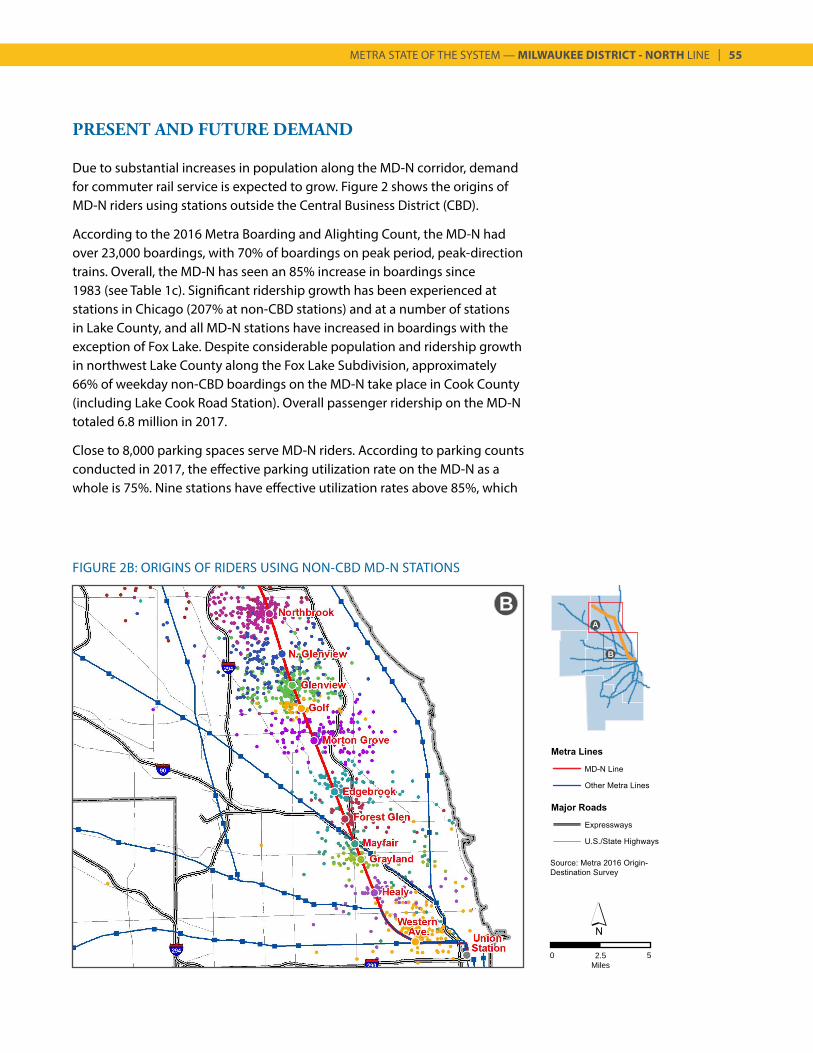
METRA STATE OF THE SYSTEM — MILWAUKEE DISTRICT - NORTH LINE | 55
FIGURE 2B: ORIGINS OF RIDERS USING NON-CBD MD-N STATIONS
0 2.5Miles
5
B
PRESENT AND FUTURE DEMAND
Due to substantial increases in population along the MD-N corridor, demand for commuter rail service is expected to grow. Figure 2 shows the origins of MD-N riders using stations outside the Central Business District (CBD).
According to the 2016 Metra Boarding and Alighting Count, the MD-N had over 23,000 boardings, with 70% of boardings on peak period, peak-direction trains. Overall, the MD-N has seen an 85% increase in boardings since 1983 (see Table 1c). Significant ridership growth has been experienced at stations in Chicago (207% at non-CBD stations) and at a number of stations in Lake County, and all MD-N stations have increased in boardings with the exception of Fox Lake. Despite considerable population and ridership growth in northwest Lake County along the Fox Lake Subdivision, approximately 66% of weekday non-CBD boardings on the MD-N take place in Cook County (including Lake Cook Road Station). Overall passenger ridership on the MD-N totaled 6.8 million in 2017.
Close to 8,000 parking spaces serve MD-N riders. According to parking counts conducted in 2017, the effective parking utilization rate on the MD-N as a whole is 75%. Nine stations have effective utilization rates above 85%, which
A
B
56 | METRA STATE OF THE SYSTEM — MILWAUKEE DISTRICT - NORTH LINE
indicates a demand for increased parking on the line, since Metra considers lots over 85% occupied to be approaching full capacity.
In 2010, the population of the entire MD-N corridor was 653,000. By 2040, the population of the corridor is expected to increase by 32% to 860,000. Stations along the Fox Lake Subdivision are estimated to have the greatest percent increase in population, with projected growth of 50%. In contrast, the main line station marketshed population is estimated to increase by 26%. With heavy population and household growth along the MD-N corridor, it is likely that the MD-N will continue to see ridership gains and increased service demands in the future, particularly along the Fox Lake Subdivision. Tables 3, 4 and 5 describe the population, household and employment demographics for stations along the MD-N corridor.
Employment growth is likely to contribute to increased ridership. A 42% increase in employment is projected for MD-N marketsheds from 2010 to 2040. By 2040, significant job growth is expected to occur in the Lake Cook Road corridor (near the Northbrook, Lake Cook Road, and Deerfield Stations), which is already one of the region’s significant non-CBD employment centers. Significant suburban employment expansion is also anticipated along the Fox Lake Subdivision (Libertyville to Fox Lake Stations). Here, employment is projected to increase by 135% over the 2010 level, compared with a 28% increase in employment in main line station marketsheds. However, main line station marketsheds outside of downtown Chicago are still projected to have over three times as many jobs as Fox Lake Subdivision marketsheds by 2040.
REVERSE COMMUTE AND NON-DOWNTOWN MARKETS
Although traditional suburb-to-CBD commuters are Metra’s primary market, Metra has also seen a demand for city-to-suburb reverse-commute options (Metra’s primary commuter market is discussed in the Central Business District Market chapter). The shift of employment to suburban locations has left many commuters with limited transit accessibility to jobs. Figure 3 shows AM alightings at non-CBD MD-N stations.
In the Lake Cook Road corridor, the Shuttle Bug system of Pace buses links the MD-N Lake Cook Road and Deerfield Stations with nearby corporate campuses. Shuttle Bug service is managed by the Lake Cook Transportation Management Association (a non-profit association of employers) in cooperation with Pace and Metra. Other Shuttle Bug routes serve the MD-N Glen/North Glenview station, and stations on the UP-N and UP-NW Lines and the Chicago Transit Authority Yellow Line. A total of 13 Shuttle Bug routes provide a viable transit solution for reverse commuters. By concentrating

METRA STATE OF THE SYSTEM — MILWAUKEE DISTRICT - NORTH LINE | 57
TABLE 3: MD-N CORRIDOR POPULATION
Station Fare Area Population in Zone Percent ChangeZone Sq. Mi. 2000 2010 2040 2000 vs
20102010 vs
2040Union Station, Western Ave. A 3.6 61,046 56,719 76,351 -7.1% 34.6%Healy, Grayland, Mayfair B 9.2 207,047 189,203 230,090 -8.6% 21.6%Forest Glen, Edgebrook, Morton Grv. C 19.4 110,958 114,518 140,560 3.2% 22.7%Golf, Glenview, Glen/N. Glenview D 20.5 63,705 68,695 82,471 7.8% 20.1%Northbrook, Lake Cook Rd, Deerfield E 22.9 55,891 56,654 78,132 1.4% 37.9%
Lake Forest F 14.6 11,480 12,087 19,539 5.3% 61.7%Libertyville, Prarie Crossing H 35.3 45,702 48,881 62,614 7.0% 28.1%Grayslake, Round Lake I 30.8 28,718 42,917 70,023 49.4% 63.2%Long Lake, Ingleside, Fox Lake J 83.6 46,282 63,097 100,166 36.3% 58.7%
MD-N TOTAL 239.9 630,829 652,771 859,946 3.5% 31.7%
REGION TOTAL 3,748 8,091,717 8,456,762 11,717,936 4.5% 38.6%
Station Fare Area Households in Zone Percent ChangeZone Sq. Mi. 2000 2010 2040 2000 vs
20102010 vs
2040Union Station, Western Ave. A 3.6 24,349 26,143 29,606 7.4% 13.2%Healy, Grayland, Mayfair B 9.2 64,824 63,481 68,608 -2.1% 8.1%Forest Glen, Edgebrook, Morton Grv. C 19.4 42,165 42,399 50,910 0.6% 20.1%Golf, Glenview, Glen/N. Glenview D 20.5 23,429 25,370 29,179 8.3% 15.0%Northbrook, Lake Cook Rd, Deerfield E 22.9 20,117 20,985 27,632 4.3% 31.7%
Lake Forest F 14.6 3,513 3,766 6,373 7.2% 69.2%Libertyville, Prarie Crossing H 35.3 16,477 17,901 22,872 8.6% 27.8%Grayslake, Round Lake I 30.8 9,788 14,366 24,084 46.8% 67.6%Long Lake, Ingleside, Fox Lake J 83.6 16,793 23,771 35,442 41.6% 49.1%
MD-N TOTAL 239.9 221,455 238,182 294,706 7.6% 23.7%
REGION TOTAL 3,748 2,906,924 3,050,134 4,224,349 4.9% 38.5%
Station Fare Area Employment in Zone Percent ChangeZone Sq. Mi. 2000 2010 2040 2000 vs
20102010 vs
2040Union Station, Western Ave. A 3.6 50,855 40,907 53,328 -19.6% 30.4%Healy, Grayland, Mayfair B 9.2 30,054 29,878 35,449 -0.6% 18.6%Forest Glen, Edgebrook, Morton Grv. C 19.4 81,007 71,143 88,636 -12.2% 24.6%Golf, Glenview, Glen/N. Glenview D 20.5 48,557 36,192 43,021 -25.5% 18.9%Northbrook, Lake Cook Rd, Deerfield E 22.9 75,327 59,412 85,705 -21.1% 44.3%
Lake Forest F 14.6 18,923 19,819 24,527 4.7% 23.8%Libertyville, Prarie Crossing H 35.3 26,253 18,554 41,736 -29.3% 124.9%Grayslake, Round Lake I 30.8 14,315 9,897 21,204 -30.9% 114.2%Long Lake, Ingleside, Fox Lake J 83.6 5,517 10,107 27,654 83.2% 173.6%
MD-N TOTAL 239.9 350,808 295,909 421,260 -15.6% 42.4%
REGION TOTAL 3,748 4,340,215 3,786,224 5,267,696 -12.8% 39.1%
TABLE 4: MD-N CORRIDOR HOUSEHOLDS
TABLE 5: MD-N CORRIDOR EMPLOYMENT
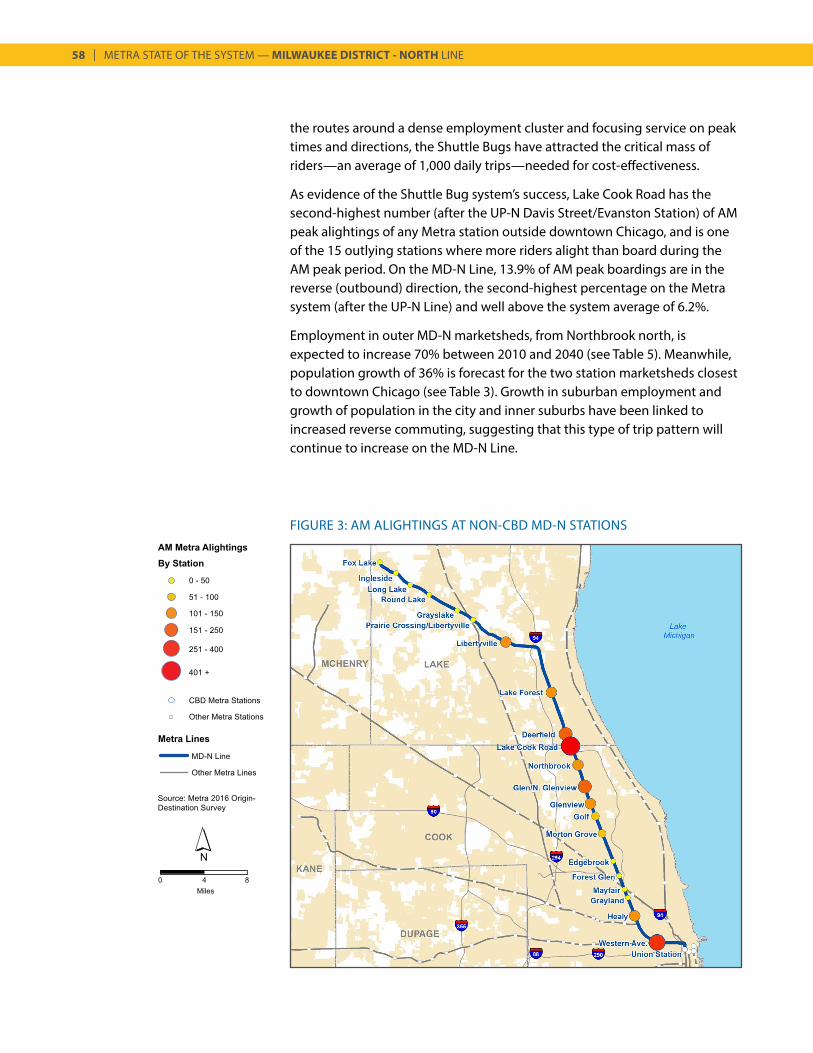
58 | METRA STATE OF THE SYSTEM — MILWAUKEE DISTRICT - NORTH LINE
FIGURE 3: AM ALIGHTINGS AT NON-CBD MD-N STATIONS
the routes around a dense employment cluster and focusing service on peak times and directions, the Shuttle Bugs have attracted the critical mass of riders—an average of 1,000 daily trips—needed for cost-effectiveness.
As evidence of the Shuttle Bug system’s success, Lake Cook Road has the second-highest number (after the UP-N Davis Street/Evanston Station) of AM peak alightings of any Metra station outside downtown Chicago, and is one of the 15 outlying stations where more riders alight than board during the AM peak period. On the MD-N Line, 13.9% of AM peak boardings are in the reverse (outbound) direction, the second-highest percentage on the Metra system (after the UP-N Line) and well above the system average of 6.2%.
Employment in outer MD-N marketsheds, from Northbrook north, is expected to increase 70% between 2010 and 2040 (see Table 5). Meanwhile, population growth of 36% is forecast for the two station marketsheds closest to downtown Chicago (see Table 3). Growth in suburban employment and growth of population in the city and inner suburbs have been linked to increased reverse commuting, suggesting that this type of trip pattern will continue to increase on the MD-N Line.
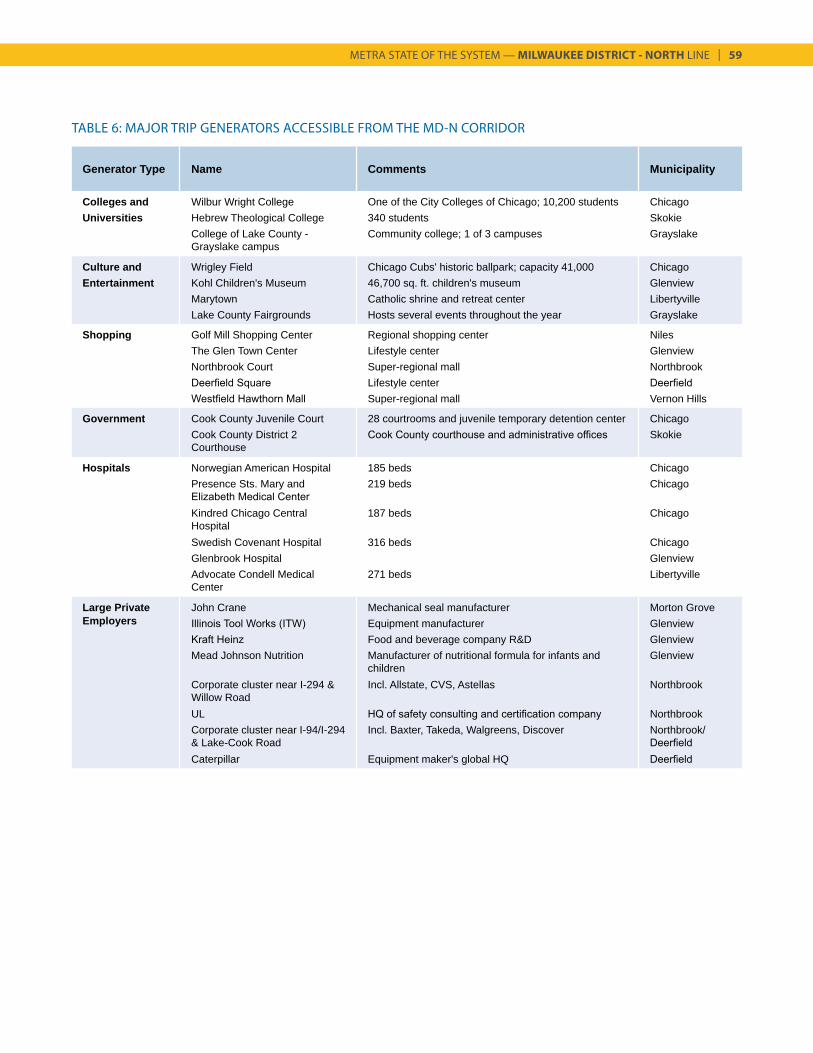
METRA STATE OF THE SYSTEM — MILWAUKEE DISTRICT - NORTH LINE | 59
Generator Type Name Comments Municipality
Colleges and Wilbur Wright College One of the City Colleges of Chicago; 10,200 students ChicagoUniversities Hebrew Theological College 340 students Skokie
College of Lake County - Grayslake campus
Community college; 1 of 3 campuses Grayslake
Culture and Wrigley Field Chicago Cubs' historic ballpark; capacity 41,000 ChicagoEntertainment Kohl Children's Museum 46,700 sq. ft. children's museum Glenview
Marytown Catholic shrine and retreat center LibertyvilleLake County Fairgrounds Hosts several events throughout the year Grayslake
Shopping Golf Mill Shopping Center Regional shopping center NilesThe Glen Town Center Lifestyle center GlenviewNorthbrook Court Super-regional mall NorthbrookDeerfield Square Lifestyle center DeerfieldWestfield Hawthorn Mall Super-regional mall Vernon Hills
Government Cook County Juvenile Court 28 courtrooms and juvenile temporary detention center ChicagoCook County District 2 Courthouse
Cook County courthouse and administrative offices Skokie
Hospitals Norwegian American Hospital 185 beds ChicagoPresence Sts. Mary and Elizabeth Medical Center
219 beds Chicago
Kindred Chicago Central Hospital
187 beds Chicago
Swedish Covenant Hospital 316 beds ChicagoGlenbrook Hospital GlenviewAdvocate Condell Medical Center
271 beds Libertyville
Large Private John Crane Mechanical seal manufacturer Morton GroveEmployers Illinois Tool Works (ITW) Equipment manufacturer Glenview
Kraft Heinz Food and beverage company R&D GlenviewMead Johnson Nutrition Manufacturer of nutritional formula for infants and
childrenGlenview
Corporate cluster near I-294 & Willow Road
Incl. Allstate, CVS, Astellas Northbrook
UL HQ of safety consulting and certification company NorthbrookCorporate cluster near I-94/I-294 & Lake-Cook Road
Incl. Baxter, Takeda, Walgreens, Discover Northbrook/Deerfield
Caterpillar Equipment maker's global HQ Deerfield
TABLE 6: MAJOR TRIP GENERATORS ACCESSIBLE FROM THE MD-N CORRIDOR
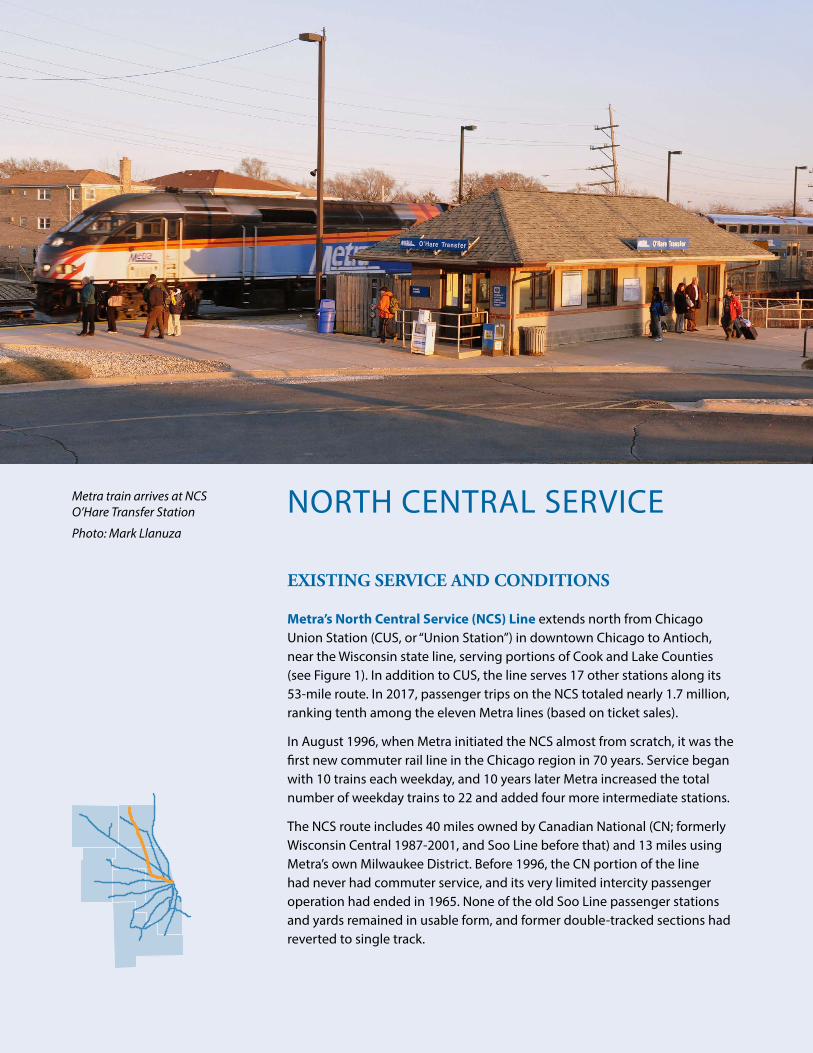
NORTH CENTRAL SERVICE
EXISTING SERVICE AND CONDITIONS
Metra’s North Central Service (NCS) Line extends north from Chicago Union Station (CUS, or “Union Station”) in downtown Chicago to Antioch, near the Wisconsin state line, serving portions of Cook and Lake Counties (see Figure 1). In addition to CUS, the line serves 17 other stations along its 53-mile route. In 2017, passenger trips on the NCS totaled nearly 1.7 million, ranking tenth among the eleven Metra lines (based on ticket sales).
In August 1996, when Metra initiated the NCS almost from scratch, it was the first new commuter rail line in the Chicago region in 70 years. Service began with 10 trains each weekday, and 10 years later Metra increased the total number of weekday trains to 22 and added four more intermediate stations.
The NCS route includes 40 miles owned by Canadian National (CN; formerly Wisconsin Central 1987-2001, and Soo Line before that) and 13 miles using Metra’s own Milwaukee District. Before 1996, the CN portion of the line had never had commuter service, and its very limited intercity passenger operation had ended in 1965. None of the old Soo Line passenger stations and yards remained in usable form, and former double-tracked sections had reverted to single track.
Metra train arrives at NCS O’Hare Transfer Station
Photo: Mark Llanuza
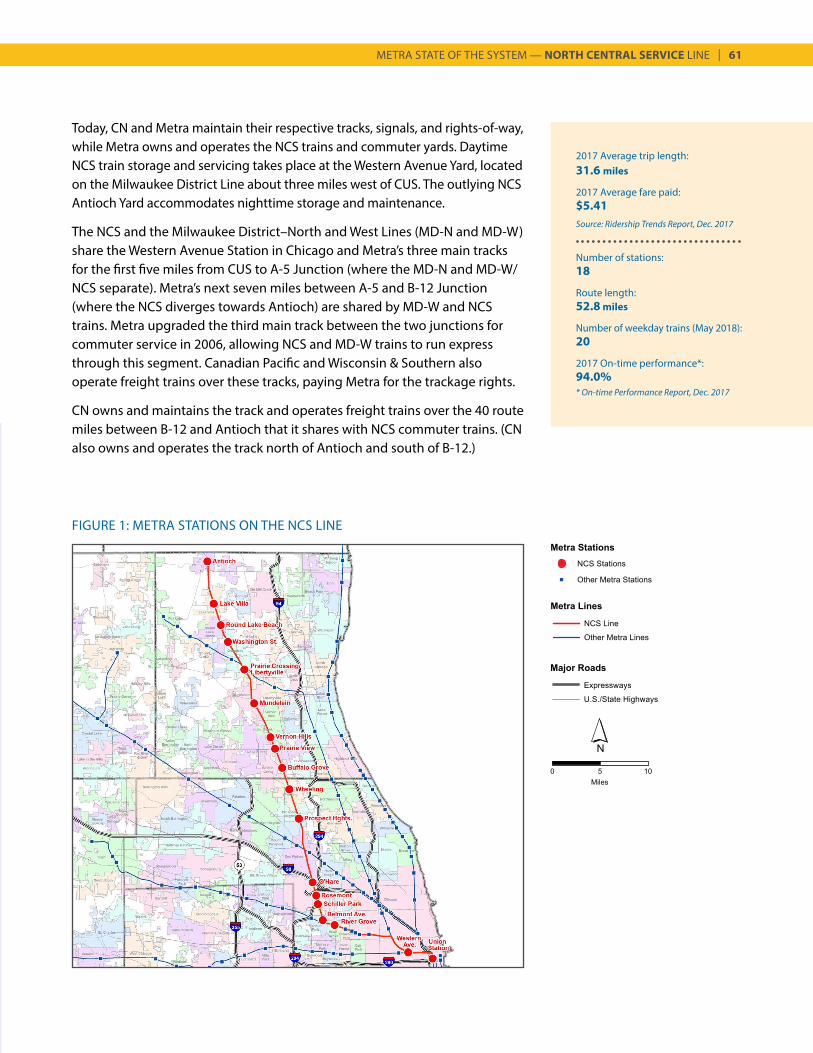
METRA STATE OF THE SYSTEM — NORTH CENTRAL SERVICE LINE | 61
2017 Average trip length:31.6 miles
2017 Average fare paid:$5.41Source: Ridership Trends Report, Dec. 2017
Number of stations:18
Route length:52.8 miles
Number of weekday trains (May 2018):20
2017 On-time performance*:94.0%* On-time Performance Report, Dec. 2017
FIGURE 1: METRA STATIONS ON THE NCS LINE
Today, CN and Metra maintain their respective tracks, signals, and rights-of-way, while Metra owns and operates the NCS trains and commuter yards. Daytime NCS train storage and servicing takes place at the Western Avenue Yard, located on the Milwaukee District Line about three miles west of CUS. The outlying NCS Antioch Yard accommodates nighttime storage and maintenance.
The NCS and the Milwaukee District–North and West Lines (MD-N and MD-W) share the Western Avenue Station in Chicago and Metra’s three main tracks for the first five miles from CUS to A-5 Junction (where the MD-N and MD-W/NCS separate). Metra’s next seven miles between A-5 and B-12 Junction (where the NCS diverges towards Antioch) are shared by MD-W and NCS trains. Metra upgraded the third main track between the two junctions for commuter service in 2006, allowing NCS and MD-W trains to run express through this segment. Canadian Pacific and Wisconsin & Southern also operate freight trains over these tracks, paying Metra for the trackage rights.
CN owns and maintains the track and operates freight trains over the 40 route miles between B-12 and Antioch that it shares with NCS commuter trains. (CN also owns and operates the track north of Antioch and south of B-12.)

62 | METRA STATE OF THE SYSTEM — NORTH CENTRAL SERVICE LINE
Source: Metra Weekday Station Boardings and Alightings by Time-of-Day and Direction, 2016
TABLE 1A: 2016 NCS WEEKDAY BOARDINGS
TABLE 1B: NCS ANNUAL PASSENGER TRIPS1996 — 2017, in millions
Y E A R
Time of Day Inbound Outbound
AM Peak 2,680 112
Midday 225 340
PM Peak 152 2,347
Evening 5 267
TOTAL 3,062 3,066
Note: from 2008, figures include free Circuit Permit trips. 2008-2011 figures include free senior trips; this program ended September 2011.
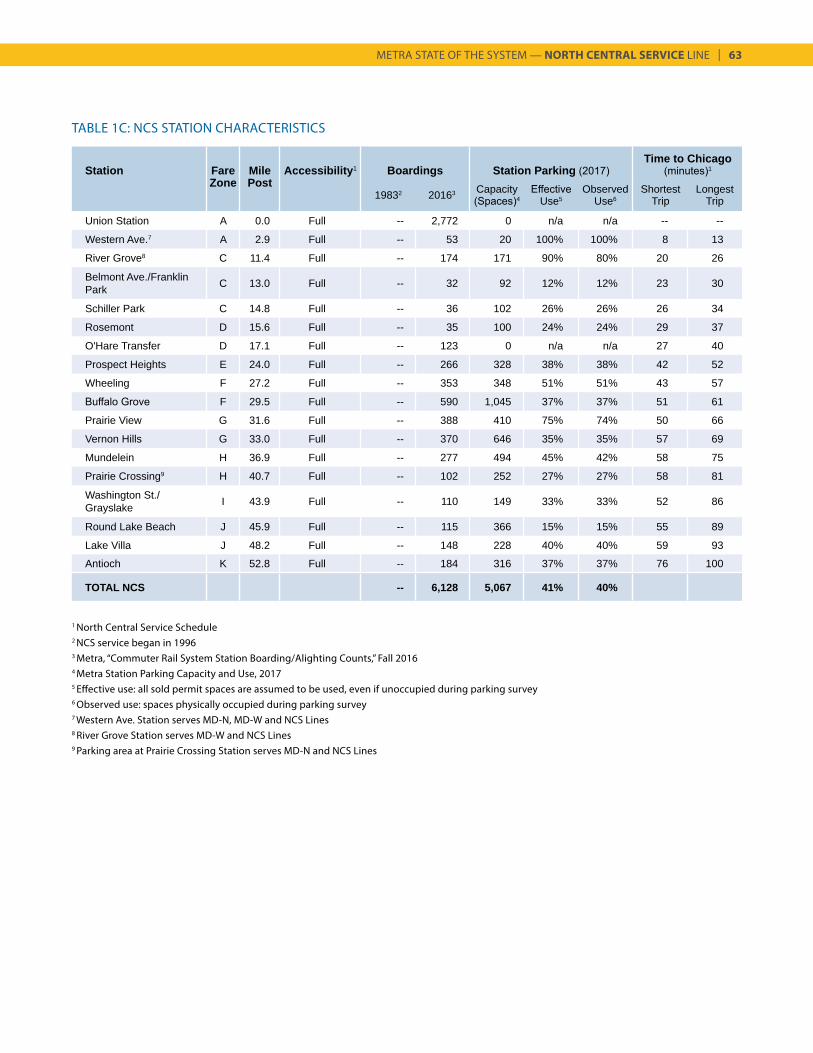
METRA STATE OF THE SYSTEM — NORTH CENTRAL SERVICE LINE | 63
TABLE 1C: NCS STATION CHARACTERISTICS
Station Fare Mile Accessibility1 Boardings Station Parking (2017)Time to Chicago
(minutes)1
Zone Post19832 20163 Capacity
(Spaces)4Effective
Use5Observed
Use6Shortest
TripLongest
Trip
Union Station A 0.0 Full -- 2,772 0 n/a n/a -- --
Western Ave.7 A 2.9 Full -- 53 20 100% 100% 8 13
River Grove8 C 11.4 Full -- 174 171 90% 80% 20 26
Belmont Ave./Franklin Park C 13.0 Full -- 32 92 12% 12% 23 30
Schiller Park C 14.8 Full -- 36 102 26% 26% 26 34
Rosemont D 15.6 Full -- 35 100 24% 24% 29 37
O'Hare Transfer D 17.1 Full -- 123 0 n/a n/a 27 40
Prospect Heights E 24.0 Full -- 266 328 38% 38% 42 52
Wheeling F 27.2 Full -- 353 348 51% 51% 43 57
Buffalo Grove F 29.5 Full -- 590 1,045 37% 37% 51 61
Prairie View G 31.6 Full -- 388 410 75% 74% 50 66
Vernon Hills G 33.0 Full -- 370 646 35% 35% 57 69
Mundelein H 36.9 Full -- 277 494 45% 42% 58 75
Prairie Crossing9 H 40.7 Full -- 102 252 27% 27% 58 81
Washington St./Grayslake I 43.9 Full -- 110 149 33% 33% 52 86
Round Lake Beach J 45.9 Full -- 115 366 15% 15% 55 89
Lake Villa J 48.2 Full -- 148 228 40% 40% 59 93
Antioch K 52.8 Full -- 184 316 37% 37% 76 100
TOTAL NCS -- 6,128 5,067 41% 40%
1 North Central Service Schedule2 NCS service began in 19963 Metra, “Commuter Rail System Station Boarding/Alighting Counts,” Fall 20164 Metra Station Parking Capacity and Use, 20175 Effective use: all sold permit spaces are assumed to be used, even if unoccupied during parking survey6 Observed use: spaces physically occupied during parking survey7 Western Ave. Station serves MD-N, MD-W and NCS Lines8 River Grove Station serves MD-W and NCS Lines9 Parking area at Prairie Crossing Station serves MD-N and NCS Lines
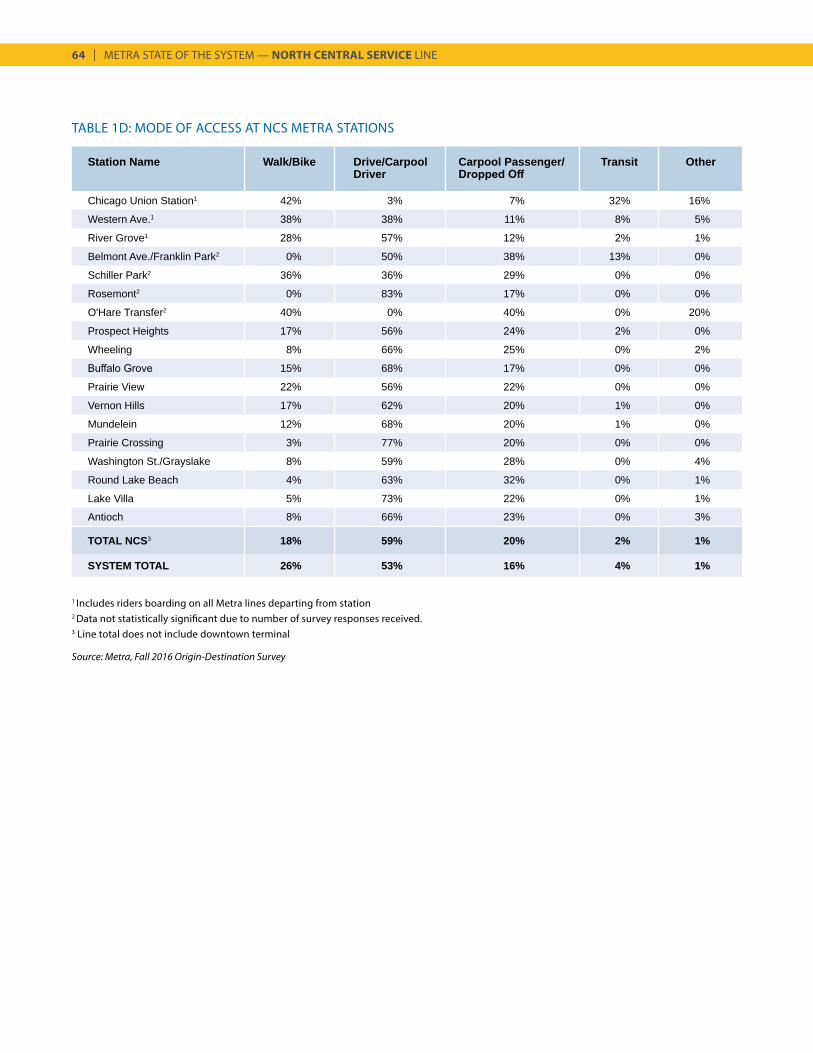
64 | METRA STATE OF THE SYSTEM — NORTH CENTRAL SERVICE LINE
TABLE 1D: MODE OF ACCESS AT NCS METRA STATIONS
Station Name Walk/Bike Drive/Carpool Driver
Carpool Passenger/ Dropped Off
Transit Other
Chicago Union Station1 42% 3% 7% 32% 16%
Western Ave.1 38% 38% 11% 8% 5%
River Grove1 28% 57% 12% 2% 1%
Belmont Ave./Franklin Park2 0% 50% 38% 13% 0%
Schiller Park2 36% 36% 29% 0% 0%
Rosemont2 0% 83% 17% 0% 0%
O'Hare Transfer2 40% 0% 40% 0% 20%
Prospect Heights 17% 56% 24% 2% 0%
Wheeling 8% 66% 25% 0% 2%
Buffalo Grove 15% 68% 17% 0% 0%
Prairie View 22% 56% 22% 0% 0%
Vernon Hills 17% 62% 20% 1% 0%
Mundelein 12% 68% 20% 1% 0%
Prairie Crossing 3% 77% 20% 0% 0%
Washington St./Grayslake 8% 59% 28% 0% 4%
Round Lake Beach 4% 63% 32% 0% 1%
Lake Villa 5% 73% 22% 0% 1%
Antioch 8% 66% 23% 0% 3%
TOTAL NCS3 18% 59% 20% 2% 1%
SYSTEM TOTAL 26% 53% 16% 4% 1%
1 Includes riders boarding on all Metra lines departing from station2 Data not statistically significant due to number of survey responses received.3 Line total does not include downtown terminal
Source: Metra, Fall 2016 Origin-Destination Survey
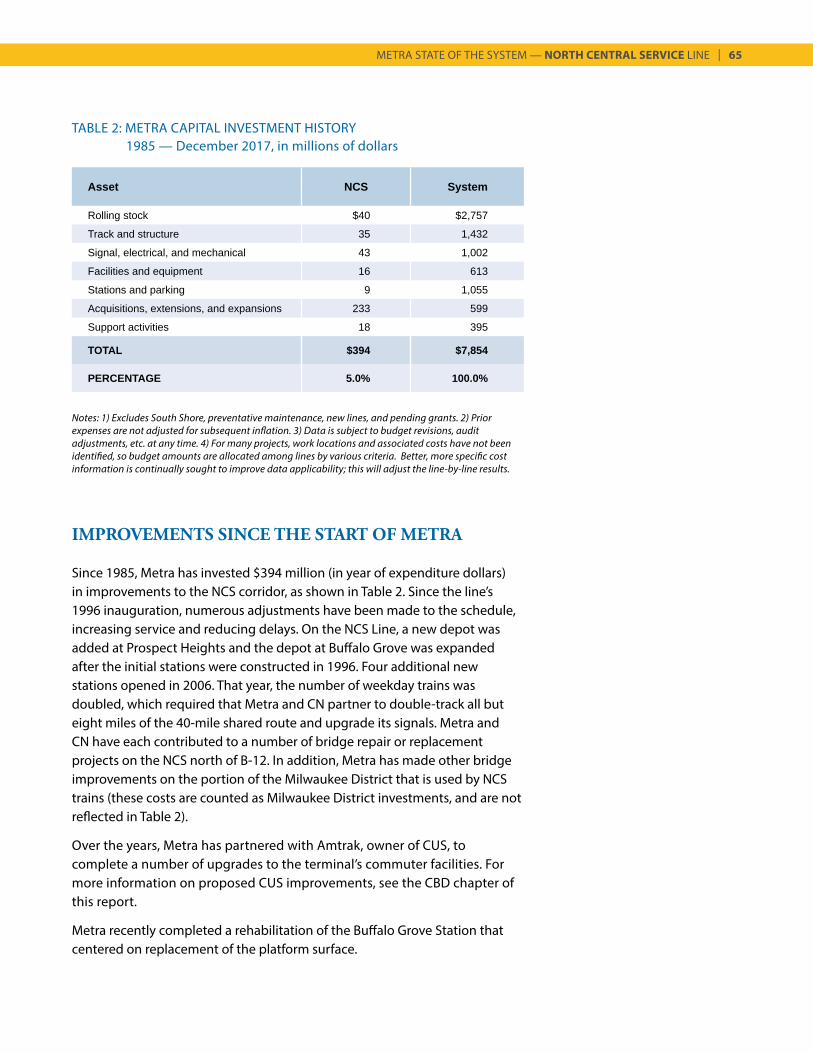
METRA STATE OF THE SYSTEM — NORTH CENTRAL SERVICE LINE | 65
IMPROVEMENTS SINCE THE START OF METRA
Since 1985, Metra has invested $394 million (in year of expenditure dollars) in improvements to the NCS corridor, as shown in Table 2. Since the line’s 1996 inauguration, numerous adjustments have been made to the schedule, increasing service and reducing delays. On the NCS Line, a new depot was added at Prospect Heights and the depot at Buffalo Grove was expanded after the initial stations were constructed in 1996. Four additional new stations opened in 2006. That year, the number of weekday trains was doubled, which required that Metra and CN partner to double-track all but eight miles of the 40-mile shared route and upgrade its signals. Metra and CN have each contributed to a number of bridge repair or replacement projects on the NCS north of B-12. In addition, Metra has made other bridge improvements on the portion of the Milwaukee District that is used by NCS trains (these costs are counted as Milwaukee District investments, and are not reflected in Table 2).
Over the years, Metra has partnered with Amtrak, owner of CUS, to complete a number of upgrades to the terminal’s commuter facilities. For more information on proposed CUS improvements, see the CBD chapter of this report.
Metra recently completed a rehabilitation of the Buffalo Grove Station that centered on replacement of the platform surface.
TABLE 2: METRA CAPITAL INVESTMENT HISTORY 1985 — December 2017, in millions of dollars
Asset NCS System
Rolling stock $40 $2,757
Track and structure 35 1,432
Signal, electrical, and mechanical 43 1,002
Facilities and equipment 16 613
Stations and parking 9 1,055
Acquisitions, extensions, and expansions 233 599
Support activities 18 395
TOTAL $394 $7,854
PERCENTAGE 5.0% 100.0%
Notes: 1) Excludes South Shore, preventative maintenance, new lines, and pending grants. 2) Prior expenses are not adjusted for subsequent inflation. 3) Data is subject to budget revisions, audit adjustments, etc. at any time. 4) For many projects, work locations and associated costs have not been identified, so budget amounts are allocated among lines by various criteria. Better, more specific cost information is continually sought to improve data applicability; this will adjust the line-by-line results.
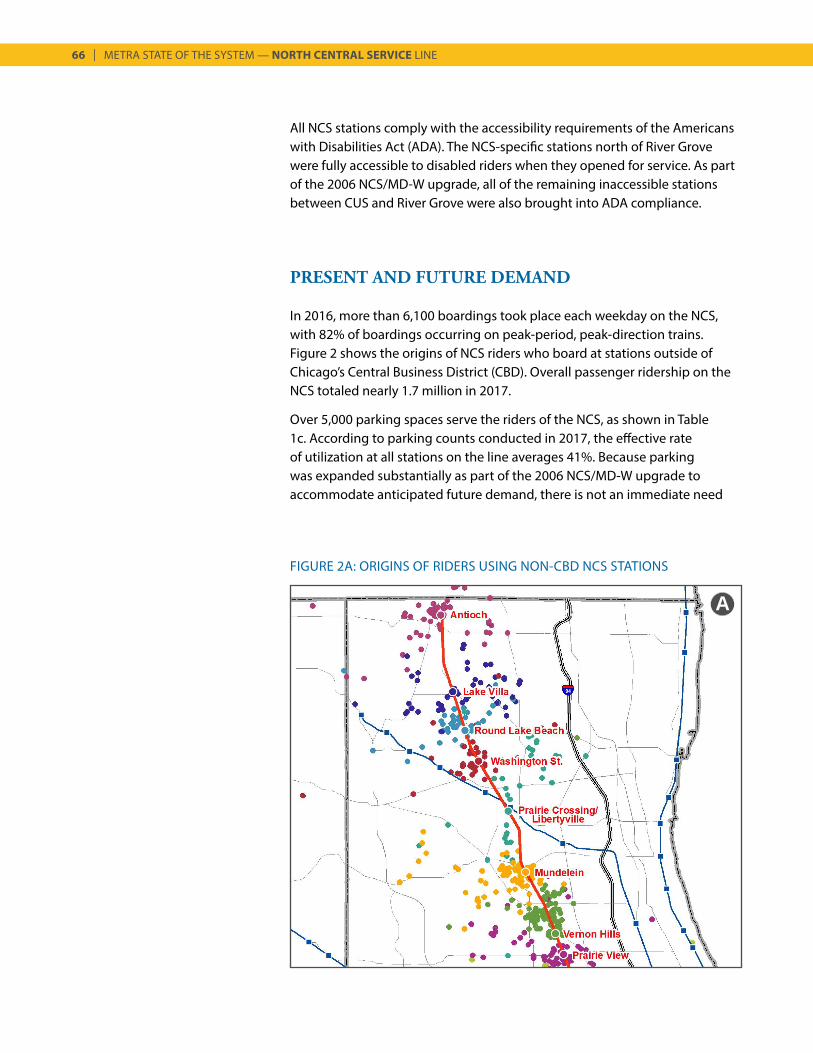
66 | METRA STATE OF THE SYSTEM — NORTH CENTRAL SERVICE LINE
All NCS stations comply with the accessibility requirements of the Americans with Disabilities Act (ADA). The NCS-specific stations north of River Grove were fully accessible to disabled riders when they opened for service. As part of the 2006 NCS/MD-W upgrade, all of the remaining inaccessible stations between CUS and River Grove were also brought into ADA compliance.
PRESENT AND FUTURE DEMAND
In 2016, more than 6,100 boardings took place each weekday on the NCS, with 82% of boardings occurring on peak-period, peak-direction trains. Figure 2 shows the origins of NCS riders who board at stations outside of Chicago’s Central Business District (CBD). Overall passenger ridership on the NCS totaled nearly 1.7 million in 2017.
Over 5,000 parking spaces serve the riders of the NCS, as shown in Table 1c. According to parking counts conducted in 2017, the effective rate of utilization at all stations on the line averages 41%. Because parking was expanded substantially as part of the 2006 NCS/MD-W upgrade to accommodate anticipated future demand, there is not an immediate need
A
FIGURE 2A: ORIGINS OF RIDERS USING NON-CBD NCS STATIONS
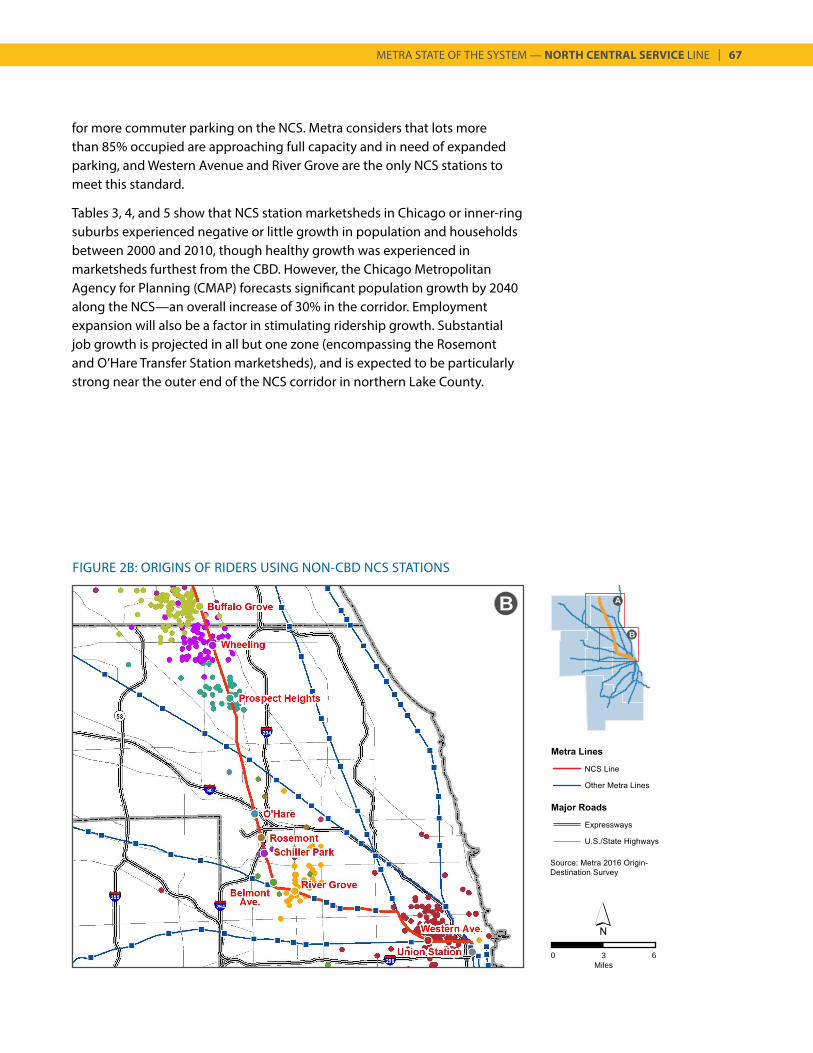
METRA STATE OF THE SYSTEM — NORTH CENTRAL SERVICE LINE | 67
for more commuter parking on the NCS. Metra considers that lots more than 85% occupied are approaching full capacity and in need of expanded parking, and Western Avenue and River Grove are the only NCS stations to meet this standard.
Tables 3, 4, and 5 show that NCS station marketsheds in Chicago or inner-ring suburbs experienced negative or little growth in population and households between 2000 and 2010, though healthy growth was experienced in marketsheds furthest from the CBD. However, the Chicago Metropolitan Agency for Planning (CMAP) forecasts significant population growth by 2040 along the NCS—an overall increase of 30% in the corridor. Employment expansion will also be a factor in stimulating ridership growth. Substantial job growth is projected in all but one zone (encompassing the Rosemont and O’Hare Transfer Station marketsheds), and is expected to be particularly strong near the outer end of the NCS corridor in northern Lake County.
FIGURE 2B: ORIGINS OF RIDERS USING NON-CBD NCS STATIONS
B A
B
0 3Miles
6
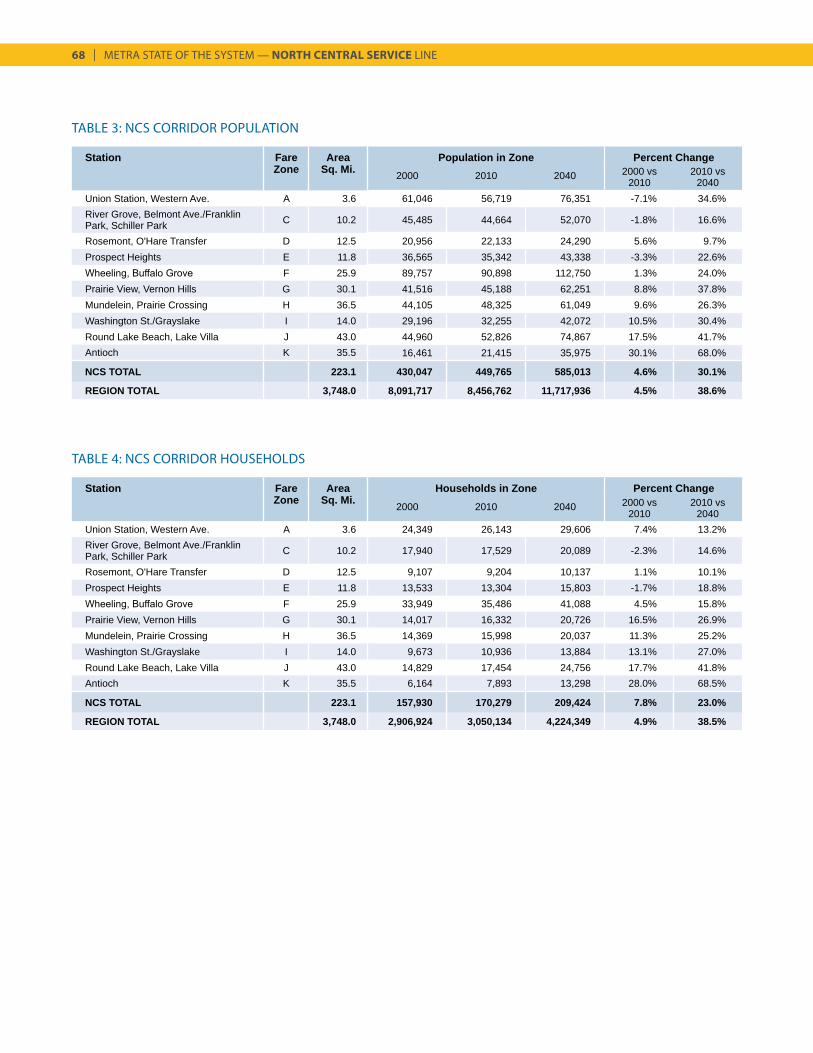
68 | METRA STATE OF THE SYSTEM — NORTH CENTRAL SERVICE LINE
TABLE 3: NCS CORRIDOR POPULATION
Station Fare Area Population in Zone Percent ChangeZone Sq. Mi. 2000 2010 2040 2000 vs
20102010 vs
2040Union Station, Western Ave. A 3.6 61,046 56,719 76,351 -7.1% 34.6%River Grove, Belmont Ave./Franklin Park, Schiller Park C 10.2 45,485 44,664 52,070 -1.8% 16.6%
Rosemont, O'Hare Transfer D 12.5 20,956 22,133 24,290 5.6% 9.7%Prospect Heights E 11.8 36,565 35,342 43,338 -3.3% 22.6%Wheeling, Buffalo Grove F 25.9 89,757 90,898 112,750 1.3% 24.0%Prairie View, Vernon Hills G 30.1 41,516 45,188 62,251 8.8% 37.8%Mundelein, Prairie Crossing H 36.5 44,105 48,325 61,049 9.6% 26.3%Washington St./Grayslake I 14.0 29,196 32,255 42,072 10.5% 30.4%Round Lake Beach, Lake Villa J 43.0 44,960 52,826 74,867 17.5% 41.7%Antioch K 35.5 16,461 21,415 35,975 30.1% 68.0%
NCS TOTAL 223.1 430,047 449,765 585,013 4.6% 30.1%
REGION TOTAL 3,748.0 8,091,717 8,456,762 11,717,936 4.5% 38.6%
Station Fare Area Households in Zone Percent ChangeZone Sq. Mi. 2000 2010 2040 2000 vs
20102010 vs
2040Union Station, Western Ave. A 3.6 24,349 26,143 29,606 7.4% 13.2%River Grove, Belmont Ave./Franklin Park, Schiller Park C 10.2 17,940 17,529 20,089 -2.3% 14.6%
Rosemont, O'Hare Transfer D 12.5 9,107 9,204 10,137 1.1% 10.1%Prospect Heights E 11.8 13,533 13,304 15,803 -1.7% 18.8%Wheeling, Buffalo Grove F 25.9 33,949 35,486 41,088 4.5% 15.8%Prairie View, Vernon Hills G 30.1 14,017 16,332 20,726 16.5% 26.9%Mundelein, Prairie Crossing H 36.5 14,369 15,998 20,037 11.3% 25.2%Washington St./Grayslake I 14.0 9,673 10,936 13,884 13.1% 27.0%Round Lake Beach, Lake Villa J 43.0 14,829 17,454 24,756 17.7% 41.8%Antioch K 35.5 6,164 7,893 13,298 28.0% 68.5%
NCS TOTAL 223.1 157,930 170,279 209,424 7.8% 23.0%
REGION TOTAL 3,748.0 2,906,924 3,050,134 4,224,349 4.9% 38.5%
TABLE 4: NCS CORRIDOR HOUSEHOLDS
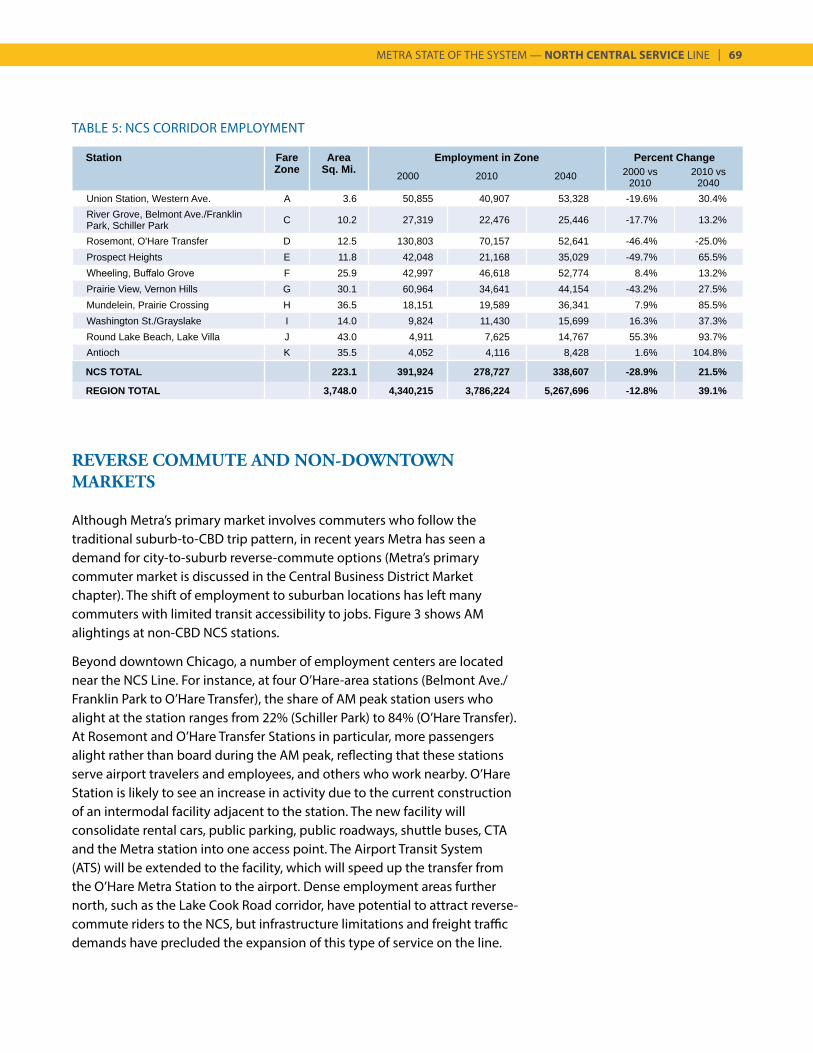
METRA STATE OF THE SYSTEM — NORTH CENTRAL SERVICE LINE | 69
Station Fare Area Employment in Zone Percent ChangeZone Sq. Mi. 2000 2010 2040 2000 vs
20102010 vs
2040Union Station, Western Ave. A 3.6 50,855 40,907 53,328 -19.6% 30.4%River Grove, Belmont Ave./Franklin Park, Schiller Park C 10.2 27,319 22,476 25,446 -17.7% 13.2%
Rosemont, O'Hare Transfer D 12.5 130,803 70,157 52,641 -46.4% -25.0%Prospect Heights E 11.8 42,048 21,168 35,029 -49.7% 65.5%Wheeling, Buffalo Grove F 25.9 42,997 46,618 52,774 8.4% 13.2%Prairie View, Vernon Hills G 30.1 60,964 34,641 44,154 -43.2% 27.5%Mundelein, Prairie Crossing H 36.5 18,151 19,589 36,341 7.9% 85.5%Washington St./Grayslake I 14.0 9,824 11,430 15,699 16.3% 37.3%Round Lake Beach, Lake Villa J 43.0 4,911 7,625 14,767 55.3% 93.7%Antioch K 35.5 4,052 4,116 8,428 1.6% 104.8%
NCS TOTAL 223.1 391,924 278,727 338,607 -28.9% 21.5%
REGION TOTAL 3,748.0 4,340,215 3,786,224 5,267,696 -12.8% 39.1%
TABLE 5: NCS CORRIDOR EMPLOYMENT
REVERSE COMMUTE AND NON-DOWNTOWN MARKETS
Although Metra’s primary market involves commuters who follow the traditional suburb-to-CBD trip pattern, in recent years Metra has seen a demand for city-to-suburb reverse-commute options (Metra’s primary commuter market is discussed in the Central Business District Market chapter). The shift of employment to suburban locations has left many commuters with limited transit accessibility to jobs. Figure 3 shows AM alightings at non-CBD NCS stations.
Beyond downtown Chicago, a number of employment centers are located near the NCS Line. For instance, at four O’Hare-area stations (Belmont Ave./Franklin Park to O’Hare Transfer), the share of AM peak station users who alight at the station ranges from 22% (Schiller Park) to 84% (O’Hare Transfer). At Rosemont and O’Hare Transfer Stations in particular, more passengers alight rather than board during the AM peak, reflecting that these stations serve airport travelers and employees, and others who work nearby. O’Hare Station is likely to see an increase in activity due to the current construction of an intermodal facility adjacent to the station. The new facility will consolidate rental cars, public parking, public roadways, shuttle buses, CTA and the Metra station into one access point. The Airport Transit System (ATS) will be extended to the facility, which will speed up the transfer from the O’Hare Metra Station to the airport. Dense employment areas further north, such as the Lake Cook Road corridor, have potential to attract reverse-commute riders to the NCS, but infrastructure limitations and freight traffic demands have precluded the expansion of this type of service on the line.
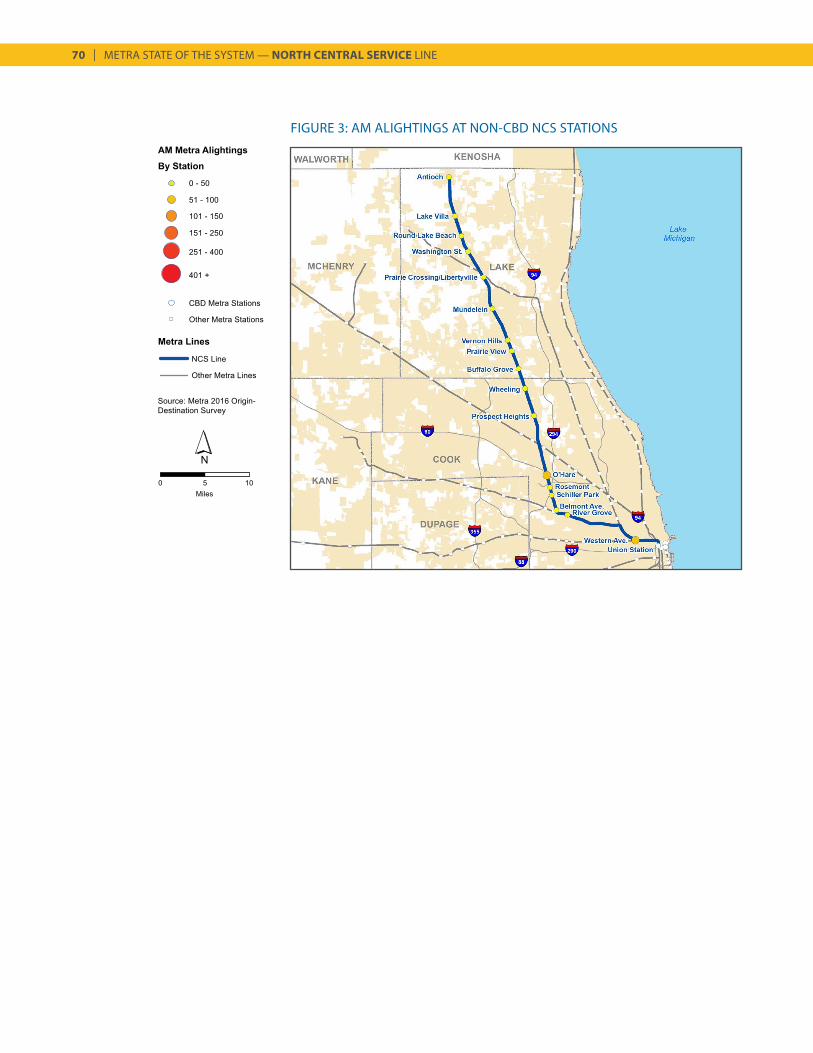
70 | METRA STATE OF THE SYSTEM — NORTH CENTRAL SERVICE LINE
FIGURE 3: AM ALIGHTINGS AT NON-CBD NCS STATIONS
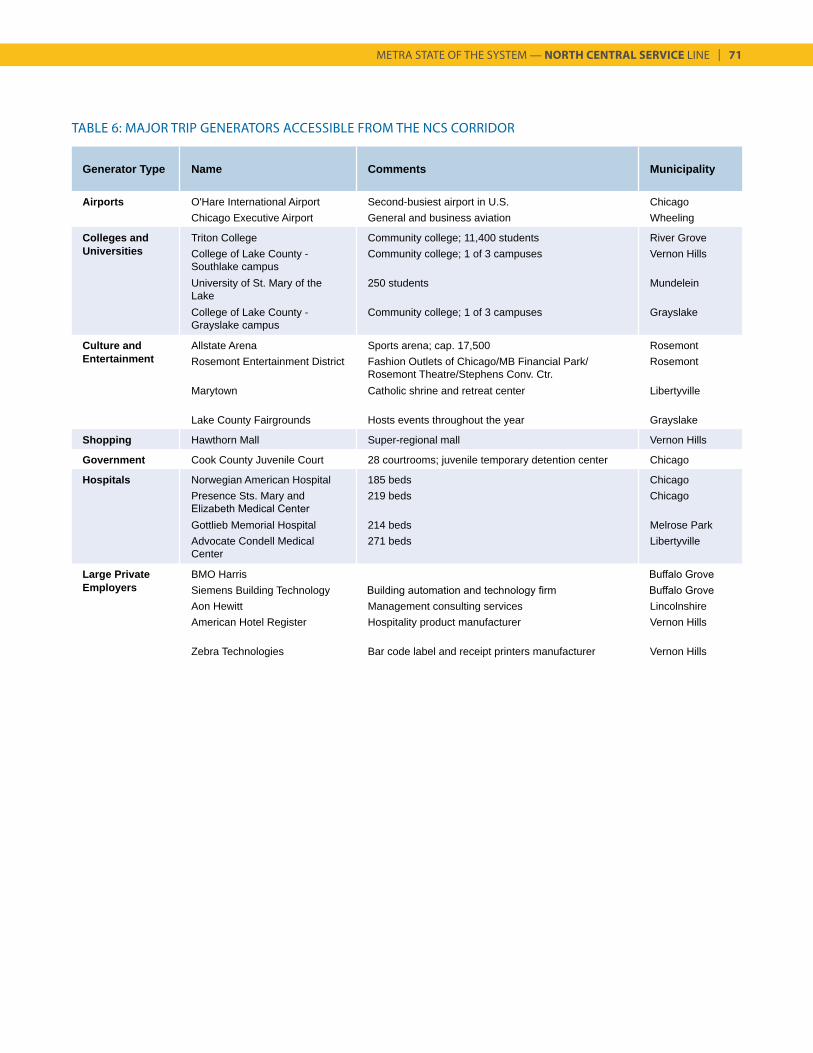
METRA STATE OF THE SYSTEM — NORTH CENTRAL SERVICE LINE | 71
Generator Type Name Comments Municipality
Airports O'Hare International Airport Second-busiest airport in U.S. ChicagoChicago Executive Airport General and business aviation Wheeling
Colleges and Triton College Community college; 11,400 students River GroveUniversities College of Lake County -
Southlake campusCommunity college; 1 of 3 campuses Vernon Hills
University of St. Mary of the Lake
250 students Mundelein
College of Lake County - Grayslake campus
Community college; 1 of 3 campuses Grayslake
Culture and Allstate Arena Sports arena; cap. 17,500 RosemontEntertainment Rosemont Entertainment District Fashion Outlets of Chicago/MB Financial Park/
Rosemont Theatre/Stephens Conv. Ctr.Rosemont
Marytown Catholic shrine and retreat center Libertyville
Lake County Fairgrounds Hosts events throughout the year Grayslake
Shopping Hawthorn Mall Super-regional mall Vernon Hills
Government Cook County Juvenile Court 28 courtrooms; juvenile temporary detention center Chicago
Hospitals Norwegian American Hospital 185 beds ChicagoPresence Sts. Mary and Elizabeth Medical Center
219 beds Chicago
Gottlieb Memorial Hospital 214 beds Melrose ParkAdvocate Condell Medical Center
271 beds Libertyville
Large Private BMO Harris Buffalo GroveEmployers Siemens Building Technology Building automation and technology firm Buffalo Grove
Aon Hewitt Management consulting services LincolnshireAmerican Hotel Register Hospitality product manufacturer Vernon Hills
Zebra Technologies Bar code label and receipt printers manufacturer Vernon Hills
TABLE 6: MAJOR TRIP GENERATORS ACCESSIBLE FROM THE NCS CORRIDOR
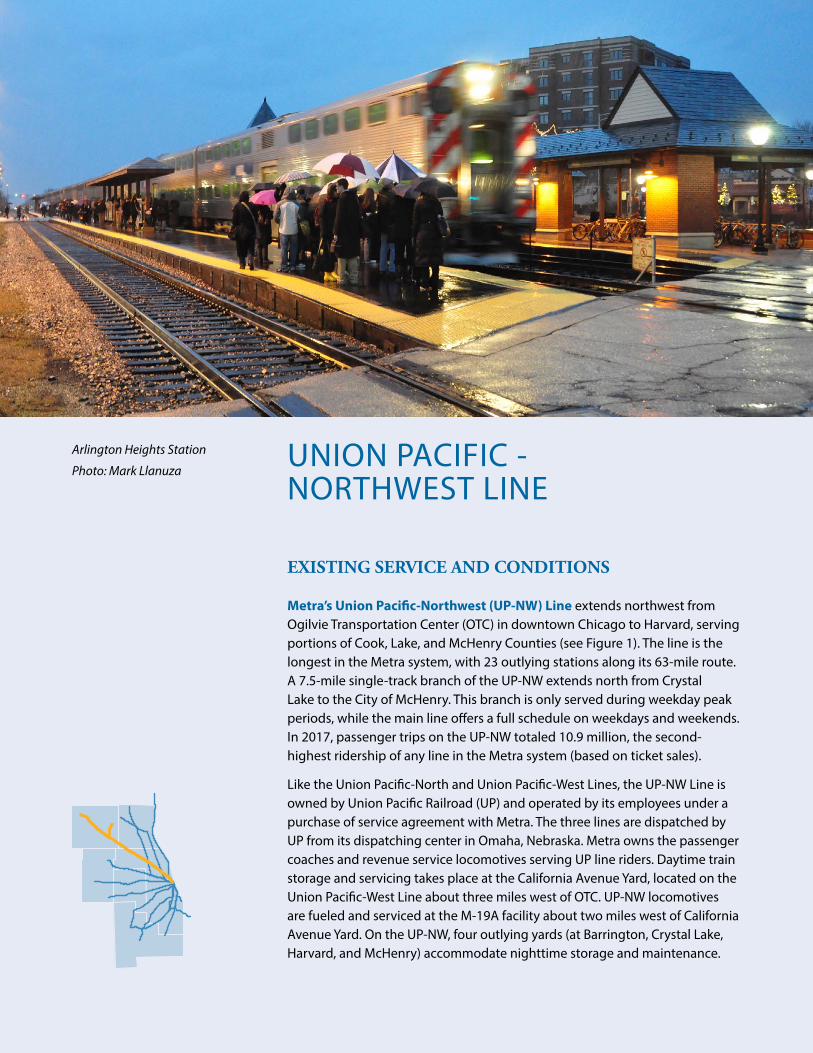
UNION PACIFIC - NORTHWEST LINE
EXISTING SERVICE AND CONDITIONS
Metra’s Union Pacific-Northwest (UP-NW) Line extends northwest from Ogilvie Transportation Center (OTC) in downtown Chicago to Harvard, serving portions of Cook, Lake, and McHenry Counties (see Figure 1). The line is the longest in the Metra system, with 23 outlying stations along its 63-mile route. A 7.5-mile single-track branch of the UP-NW extends north from Crystal Lake to the City of McHenry. This branch is only served during weekday peak periods, while the main line offers a full schedule on weekdays and weekends. In 2017, passenger trips on the UP-NW totaled 10.9 million, the second-highest ridership of any line in the Metra system (based on ticket sales).
Like the Union Pacific-North and Union Pacific-West Lines, the UP-NW Line is owned by Union Pacific Railroad (UP) and operated by its employees under a purchase of service agreement with Metra. The three lines are dispatched by UP from its dispatching center in Omaha, Nebraska. Metra owns the passenger coaches and revenue service locomotives serving UP line riders. Daytime train storage and servicing takes place at the California Avenue Yard, located on the Union Pacific-West Line about three miles west of OTC. UP-NW locomotives are fueled and serviced at the M-19A facility about two miles west of California Avenue Yard. On the UP-NW, four outlying yards (at Barrington, Crystal Lake, Harvard, and McHenry) accommodate nighttime storage and maintenance.
Arlington Heights Station
Photo: Mark Llanuza
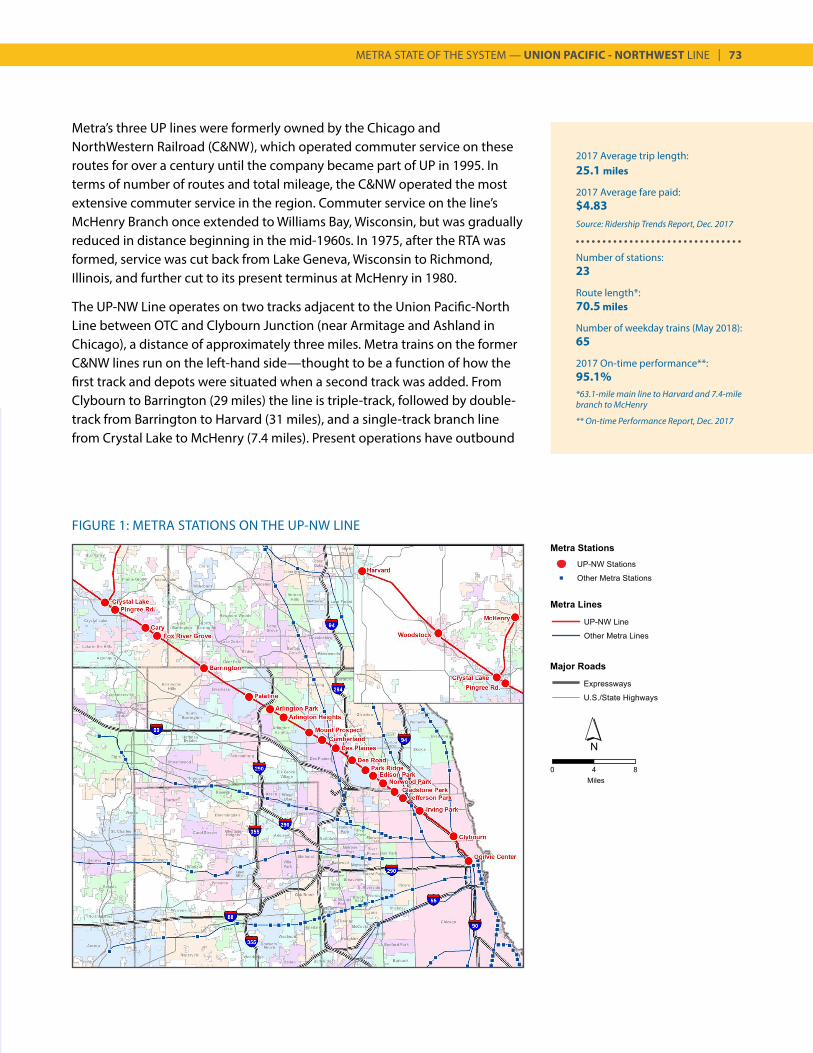
METRA STATE OF THE SYSTEM — UNION PACIFIC - NORTHWEST LINE | 73
2017 Average trip length:25.1 miles
2017 Average fare paid:$4.83Source: Ridership Trends Report, Dec. 2017
Number of stations:23
Route length*:70.5 miles
Number of weekday trains (May 2018):65
2017 On-time performance**:95.1%*63.1-mile main line to Harvard and 7.4-mile branch to McHenry
** On-time Performance Report, Dec. 2017
FIGURE 1: METRA STATIONS ON THE UP-NW LINE
Metra’s three UP lines were formerly owned by the Chicago and NorthWestern Railroad (C&NW), which operated commuter service on these routes for over a century until the company became part of UP in 1995. In terms of number of routes and total mileage, the C&NW operated the most extensive commuter service in the region. Commuter service on the line’s McHenry Branch once extended to Williams Bay, Wisconsin, but was gradually reduced in distance beginning in the mid-1960s. In 1975, after the RTA was formed, service was cut back from Lake Geneva, Wisconsin to Richmond, Illinois, and further cut to its present terminus at McHenry in 1980.
The UP-NW Line operates on two tracks adjacent to the Union Pacific-North Line between OTC and Clybourn Junction (near Armitage and Ashland in Chicago), a distance of approximately three miles. Metra trains on the former C&NW lines run on the left-hand side—thought to be a function of how the first track and depots were situated when a second track was added. From Clybourn to Barrington (29 miles) the line is triple-track, followed by double-track from Barrington to Harvard (31 miles), and a single-track branch line from Crystal Lake to McHenry (7.4 miles). Present operations have outbound
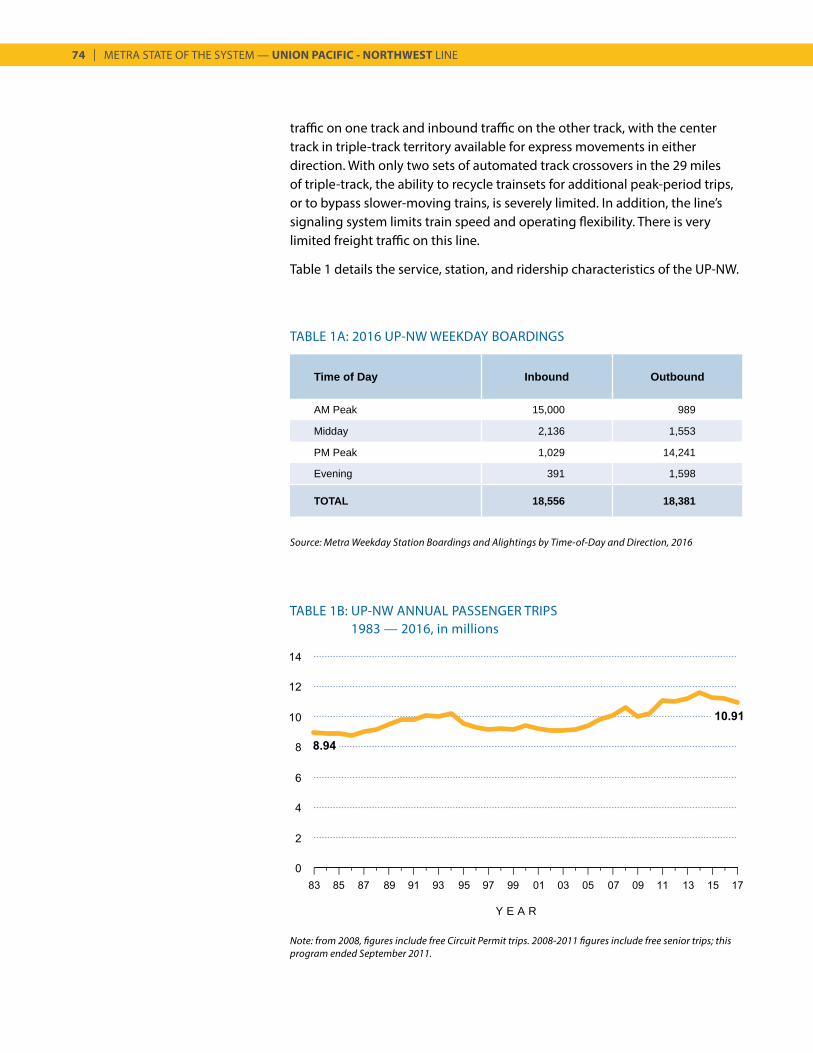
74 | METRA STATE OF THE SYSTEM — UNION PACIFIC - NORTHWEST LINE
Source: Metra Weekday Station Boardings and Alightings by Time-of-Day and Direction, 2016
TABLE 1A: 2016 UP-NW WEEKDAY BOARDINGS
TABLE 1B: UP-NW ANNUAL PASSENGER TRIPS1983 — 2016, in millions
Y E A R
Time of Day Inbound Outbound
AM Peak 15,000 989
Midday 2,136 1,553
PM Peak 1,029 14,241
Evening 391 1,598
TOTAL 18,556 18,381
Note: from 2008, figures include free Circuit Permit trips. 2008-2011 figures include free senior trips; this program ended September 2011.
traffic on one track and inbound traffic on the other track, with the center track in triple-track territory available for express movements in either direction. With only two sets of automated track crossovers in the 29 miles of triple-track, the ability to recycle trainsets for additional peak-period trips, or to bypass slower-moving trains, is severely limited. In addition, the line’s signaling system limits train speed and operating flexibility. There is very limited freight traffic on this line.
Table 1 details the service, station, and ridership characteristics of the UP-NW.
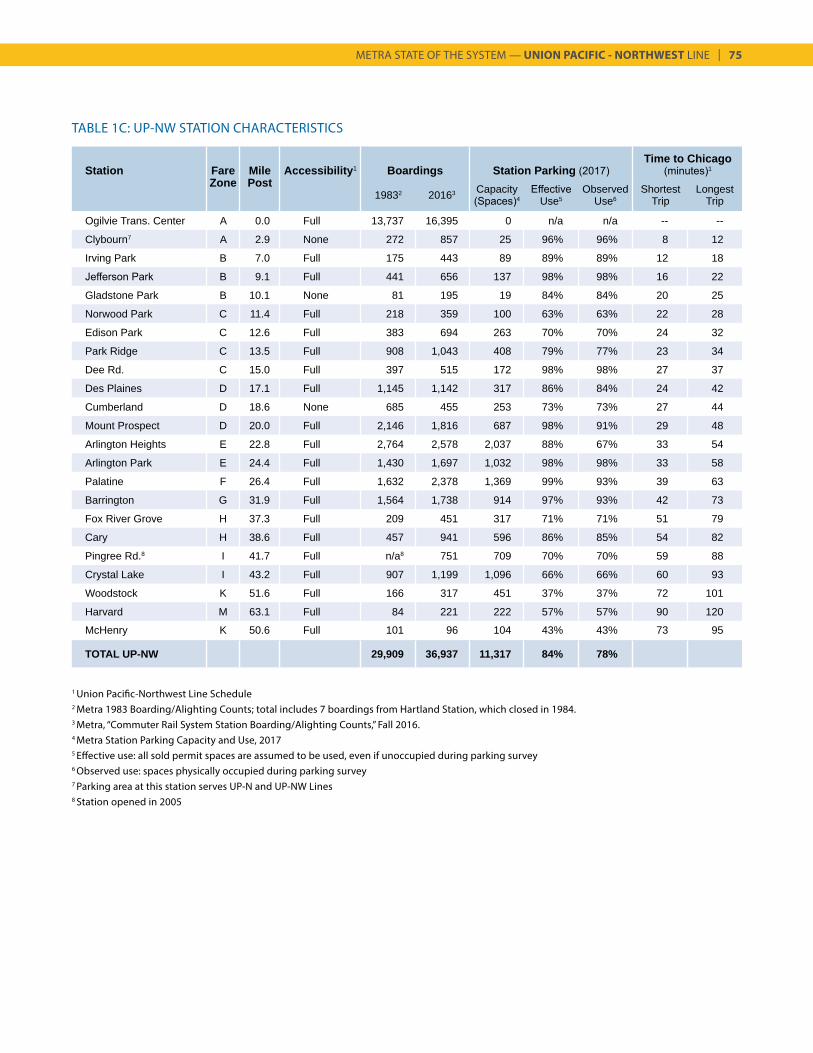
METRA STATE OF THE SYSTEM — UNION PACIFIC - NORTHWEST LINE | 75
TABLE 1C: UP-NW STATION CHARACTERISTICS
Station Fare Mile Accessibility1 Boardings Station Parking (2017)Time to Chicago
(minutes)1
Zone Post19832 20163 Capacity
(Spaces)4Effective
Use5Observed
Use6Shortest
TripLongest
Trip
Ogilvie Trans. Center A 0.0 Full 13,737 16,395 0 n/a n/a -- --
Clybourn7 A 2.9 None 272 857 25 96% 96% 8 12
Irving Park B 7.0 Full 175 443 89 89% 89% 12 18
Jefferson Park B 9.1 Full 441 656 137 98% 98% 16 22
Gladstone Park B 10.1 None 81 195 19 84% 84% 20 25
Norwood Park C 11.4 Full 218 359 100 63% 63% 22 28
Edison Park C 12.6 Full 383 694 263 70% 70% 24 32
Park Ridge C 13.5 Full 908 1,043 408 79% 77% 23 34
Dee Rd. C 15.0 Full 397 515 172 98% 98% 27 37
Des Plaines D 17.1 Full 1,145 1,142 317 86% 84% 24 42
Cumberland D 18.6 None 685 455 253 73% 73% 27 44
Mount Prospect D 20.0 Full 2,146 1,816 687 98% 91% 29 48
Arlington Heights E 22.8 Full 2,764 2,578 2,037 88% 67% 33 54
Arlington Park E 24.4 Full 1,430 1,697 1,032 98% 98% 33 58
Palatine F 26.4 Full 1,632 2,378 1,369 99% 93% 39 63
Barrington G 31.9 Full 1,564 1,738 914 97% 93% 42 73
Fox River Grove H 37.3 Full 209 451 317 71% 71% 51 79
Cary H 38.6 Full 457 941 596 86% 85% 54 82
Pingree Rd.8 I 41.7 Full n/a8 751 709 70% 70% 59 88
Crystal Lake I 43.2 Full 907 1,199 1,096 66% 66% 60 93
Woodstock K 51.6 Full 166 317 451 37% 37% 72 101
Harvard M 63.1 Full 84 221 222 57% 57% 90 120
McHenry K 50.6 Full 101 96 104 43% 43% 73 95
TOTAL UP-NW 29,909 36,937 11,317 84% 78%
1 Union Pacific-Northwest Line Schedule2 Metra 1983 Boarding/Alighting Counts; total includes 7 boardings from Hartland Station, which closed in 1984.3 Metra, “Commuter Rail System Station Boarding/Alighting Counts,” Fall 2016.4 Metra Station Parking Capacity and Use, 20175 Effective use: all sold permit spaces are assumed to be used, even if unoccupied during parking survey6 Observed use: spaces physically occupied during parking survey7 Parking area at this station serves UP-N and UP-NW Lines8 Station opened in 2005
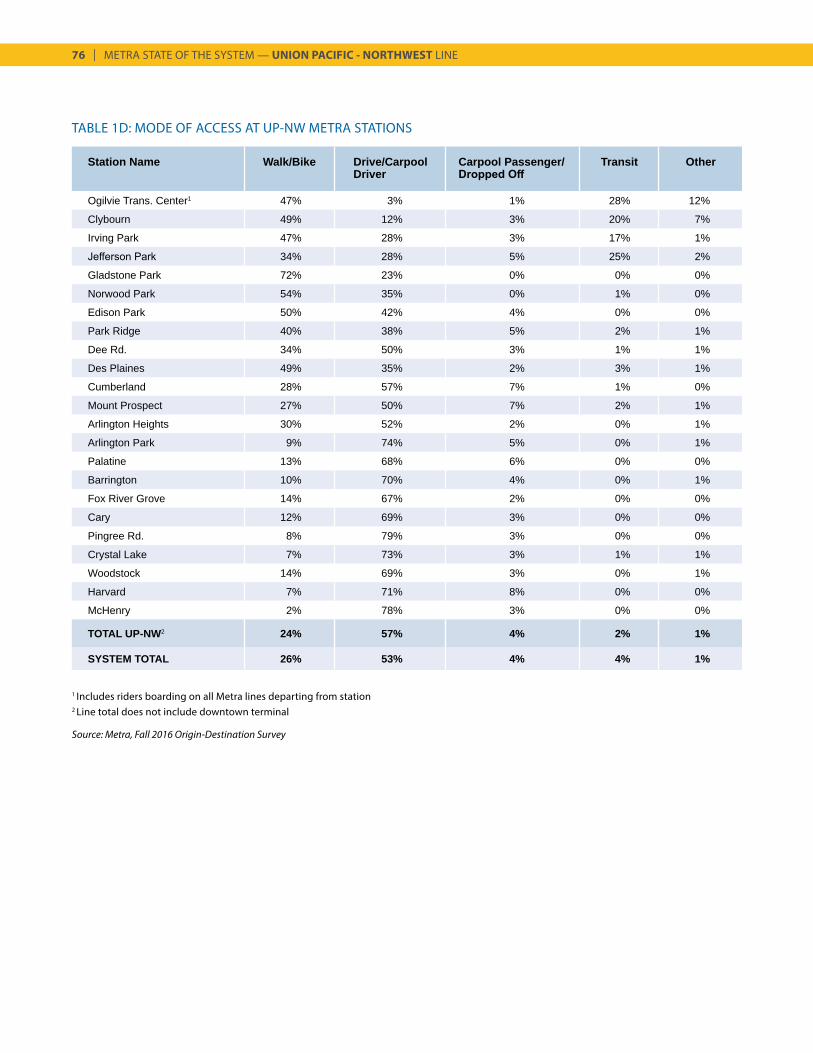
76 | METRA STATE OF THE SYSTEM — UNION PACIFIC - NORTHWEST LINE
TABLE 1D: MODE OF ACCESS AT UP-NW METRA STATIONS
Station Name Walk/Bike Drive/Carpool Driver
Carpool Passenger/ Dropped Off
Transit Other
Ogilvie Trans. Center1 47% 3% 1% 28% 12%
Clybourn 49% 12% 3% 20% 7%
Irving Park 47% 28% 3% 17% 1%
Jefferson Park 34% 28% 5% 25% 2%
Gladstone Park 72% 23% 0% 0% 0%
Norwood Park 54% 35% 0% 1% 0%
Edison Park 50% 42% 4% 0% 0%
Park Ridge 40% 38% 5% 2% 1%
Dee Rd. 34% 50% 3% 1% 1%
Des Plaines 49% 35% 2% 3% 1%
Cumberland 28% 57% 7% 1% 0%
Mount Prospect 27% 50% 7% 2% 1%
Arlington Heights 30% 52% 2% 0% 1%
Arlington Park 9% 74% 5% 0% 1%
Palatine 13% 68% 6% 0% 0%
Barrington 10% 70% 4% 0% 1%
Fox River Grove 14% 67% 2% 0% 0%
Cary 12% 69% 3% 0% 0%
Pingree Rd. 8% 79% 3% 0% 0%
Crystal Lake 7% 73% 3% 1% 1%
Woodstock 14% 69% 3% 0% 1%
Harvard 7% 71% 8% 0% 0%
McHenry 2% 78% 3% 0% 0%
TOTAL UP-NW2 24% 57% 4% 2% 1%
SYSTEM TOTAL 26% 53% 4% 4% 1%
1 Includes riders boarding on all Metra lines departing from station 2 Line total does not include downtown terminal
Source: Metra, Fall 2016 Origin-Destination Survey
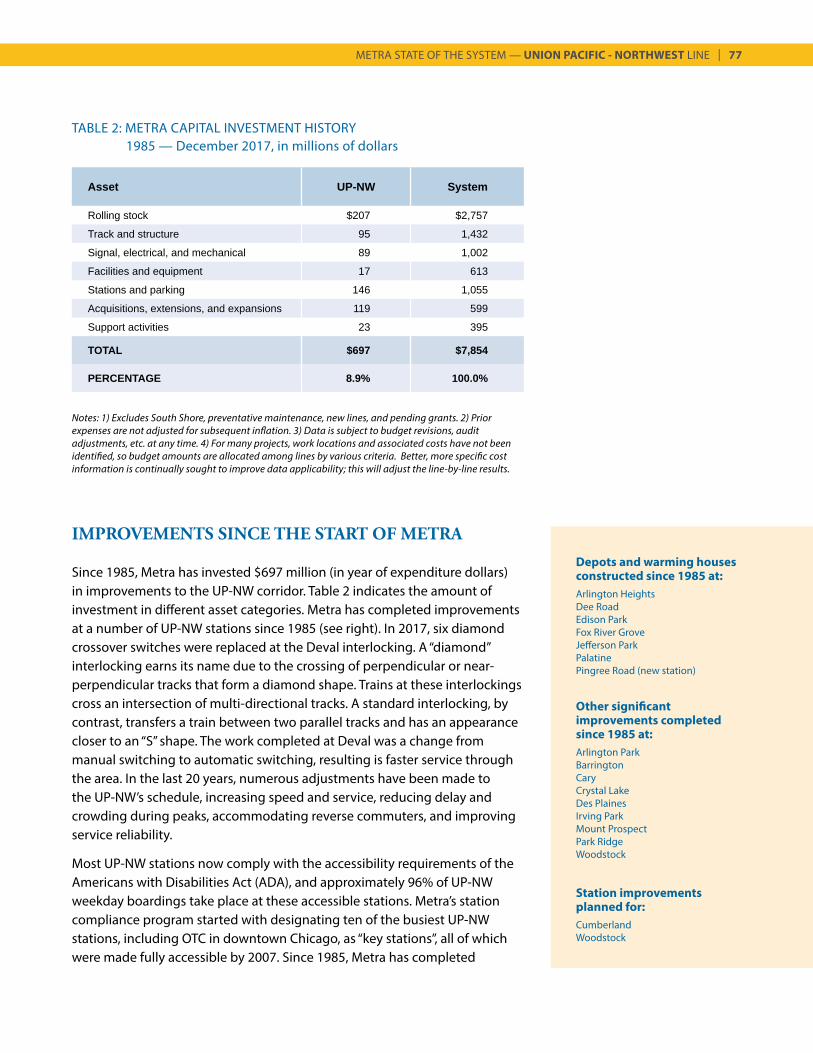
METRA STATE OF THE SYSTEM — UNION PACIFIC - NORTHWEST LINE | 77
IMPROVEMENTS SINCE THE START OF METRA
Since 1985, Metra has invested $697 million (in year of expenditure dollars) in improvements to the UP-NW corridor. Table 2 indicates the amount of investment in different asset categories. Metra has completed improvements at a number of UP-NW stations since 1985 (see right). In 2017, six diamond crossover switches were replaced at the Deval interlocking. A “diamond” interlocking earns its name due to the crossing of perpendicular or near-perpendicular tracks that form a diamond shape. Trains at these interlockings cross an intersection of multi-directional tracks. A standard interlocking, by contrast, transfers a train between two parallel tracks and has an appearance closer to an “S” shape. The work completed at Deval was a change from manual switching to automatic switching, resulting is faster service through the area. In the last 20 years, numerous adjustments have been made to the UP-NW’s schedule, increasing speed and service, reducing delay and crowding during peaks, accommodating reverse commuters, and improving service reliability.
Most UP-NW stations now comply with the accessibility requirements of the Americans with Disabilities Act (ADA), and approximately 96% of UP-NW weekday boardings take place at these accessible stations. Metra’s station compliance program started with designating ten of the busiest UP-NW stations, including OTC in downtown Chicago, as “key stations”, all of which were made fully accessible by 2007. Since 1985, Metra has completed
TABLE 2: METRA CAPITAL INVESTMENT HISTORY 1985 — December 2017, in millions of dollars
Asset UP-NW System
Rolling stock $207 $2,757
Track and structure 95 1,432
Signal, electrical, and mechanical 89 1,002
Facilities and equipment 17 613
Stations and parking 146 1,055
Acquisitions, extensions, and expansions 119 599
Support activities 23 395
TOTAL $697 $7,854
PERCENTAGE 8.9% 100.0%
Depots and warming houses constructed since 1985 at:Arlington HeightsDee RoadEdison ParkFox River GroveJefferson ParkPalatinePingree Road (new station)
Other significant improvements completed since 1985 at:Arlington ParkBarringtonCaryCrystal LakeDes PlainesIrving ParkMount ProspectPark RidgeWoodstock
Station improvements planned for:CumberlandWoodstock
Notes: 1) Excludes South Shore, preventative maintenance, new lines, and pending grants. 2) Prior expenses are not adjusted for subsequent inflation. 3) Data is subject to budget revisions, audit adjustments, etc. at any time. 4) For many projects, work locations and associated costs have not been identified, so budget amounts are allocated among lines by various criteria. Better, more specific cost information is continually sought to improve data applicability; this will adjust the line-by-line results.
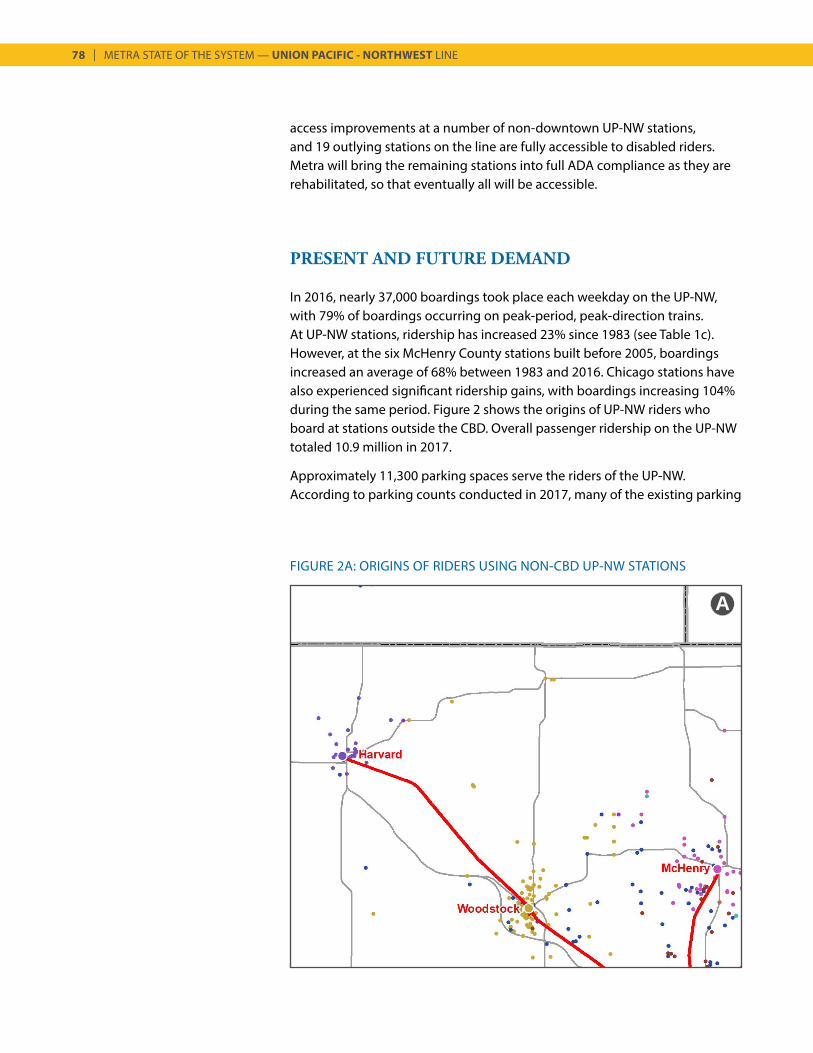
78 | METRA STATE OF THE SYSTEM — UNION PACIFIC - NORTHWEST LINE
FIGURE 2A: ORIGINS OF RIDERS USING NON-CBD UP-NW STATIONS
A
access improvements at a number of non-downtown UP-NW stations, and 19 outlying stations on the line are fully accessible to disabled riders. Metra will bring the remaining stations into full ADA compliance as they are rehabilitated, so that eventually all will be accessible.
PRESENT AND FUTURE DEMAND
In 2016, nearly 37,000 boardings took place each weekday on the UP-NW, with 79% of boardings occurring on peak-period, peak-direction trains. At UP-NW stations, ridership has increased 23% since 1983 (see Table 1c). However, at the six McHenry County stations built before 2005, boardings increased an average of 68% between 1983 and 2016. Chicago stations have also experienced significant ridership gains, with boardings increasing 104% during the same period. Figure 2 shows the origins of UP-NW riders who board at stations outside the CBD. Overall passenger ridership on the UP-NW totaled 10.9 million in 2017.
Approximately 11,300 parking spaces serve the riders of the UP-NW. According to parking counts conducted in 2017, many of the existing parking
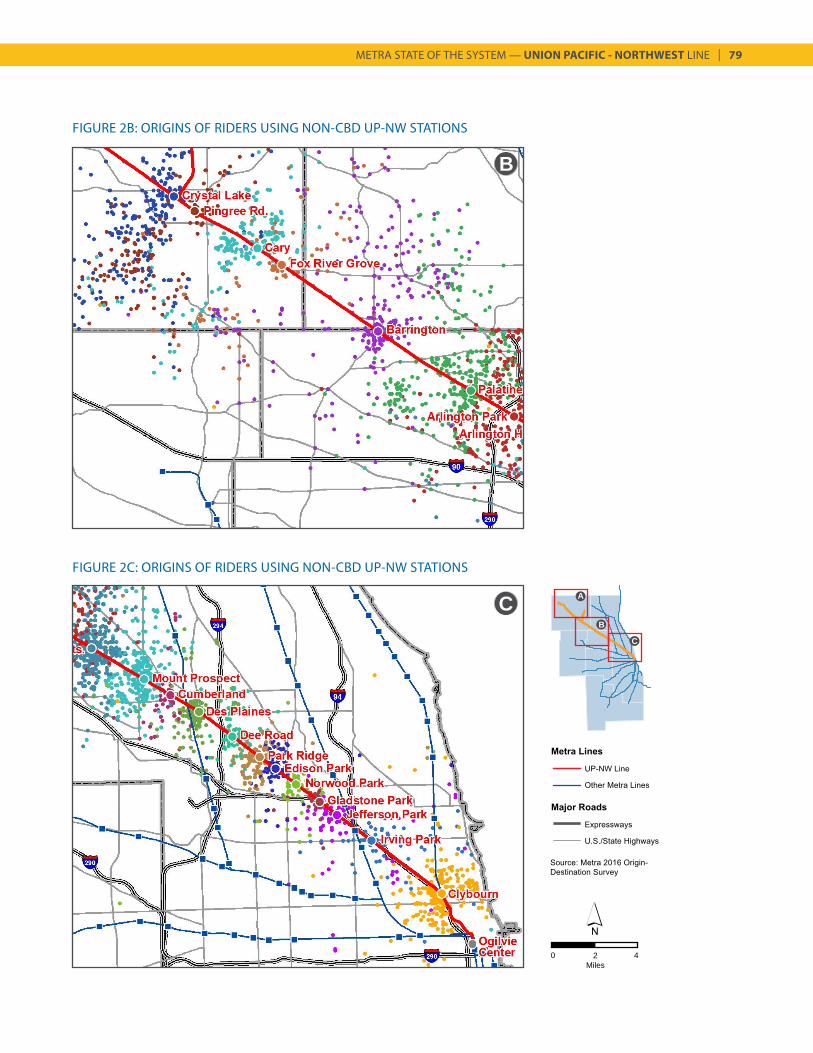
METRA STATE OF THE SYSTEM — UNION PACIFIC - NORTHWEST LINE | 79
FIGURE 2C: ORIGINS OF RIDERS USING NON-CBD UP-NW STATIONS
FIGURE 2B: ORIGINS OF RIDERS USING NON-CBD UP-NW STATIONS
C
B
A
B
C
0 2Miles
4
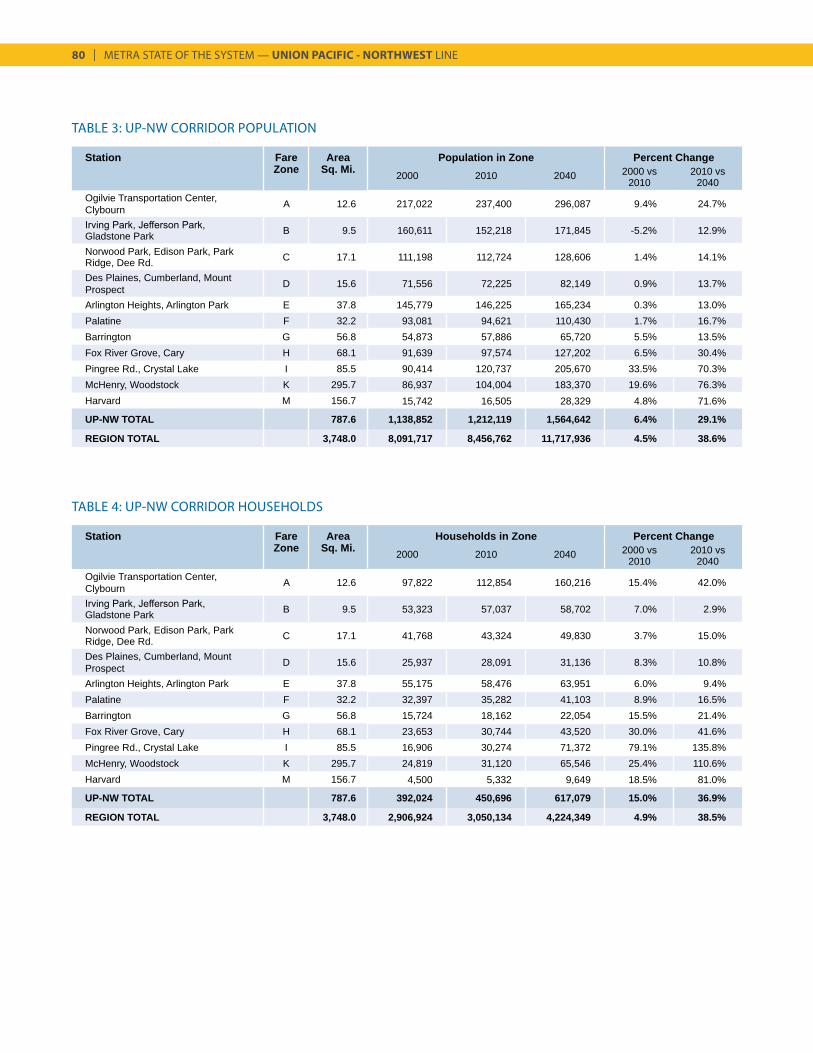
80 | METRA STATE OF THE SYSTEM — UNION PACIFIC - NORTHWEST LINE
TABLE 3: UP-NW CORRIDOR POPULATION
TABLE 4: UP-NW CORRIDOR HOUSEHOLDS
Station Fare Area Population in Zone Percent ChangeZone Sq. Mi. 2000 2010 2040 2000 vs
20102010 vs
2040Ogilvie Transportation Center, Clybourn A 12.6 217,022 237,400 296,087 9.4% 24.7%
Irving Park, Jefferson Park, Gladstone Park B 9.5 160,611 152,218 171,845 -5.2% 12.9%
Norwood Park, Edison Park, Park Ridge, Dee Rd. C 17.1 111,198 112,724 128,606 1.4% 14.1%
Des Plaines, Cumberland, Mount Prospect D 15.6 71,556 72,225 82,149 0.9% 13.7%
Arlington Heights, Arlington Park E 37.8 145,779 146,225 165,234 0.3% 13.0%Palatine F 32.2 93,081 94,621 110,430 1.7% 16.7%Barrington G 56.8 54,873 57,886 65,720 5.5% 13.5%Fox River Grove, Cary H 68.1 91,639 97,574 127,202 6.5% 30.4%Pingree Rd., Crystal Lake I 85.5 90,414 120,737 205,670 33.5% 70.3%McHenry, Woodstock K 295.7 86,937 104,004 183,370 19.6% 76.3%Harvard M 156.7 15,742 16,505 28,329 4.8% 71.6%
UP-NW TOTAL 787.6 1,138,852 1,212,119 1,564,642 6.4% 29.1%
REGION TOTAL 3,748.0 8,091,717 8,456,762 11,717,936 4.5% 38.6%
Station Fare Area Households in Zone Percent ChangeZone Sq. Mi. 2000 2010 2040 2000 vs
20102010 vs
2040Ogilvie Transportation Center, Clybourn A 12.6 97,822 112,854 160,216 15.4% 42.0%
Irving Park, Jefferson Park, Gladstone Park B 9.5 53,323 57,037 58,702 7.0% 2.9%
Norwood Park, Edison Park, Park Ridge, Dee Rd. C 17.1 41,768 43,324 49,830 3.7% 15.0%
Des Plaines, Cumberland, Mount Prospect D 15.6 25,937 28,091 31,136 8.3% 10.8%
Arlington Heights, Arlington Park E 37.8 55,175 58,476 63,951 6.0% 9.4%Palatine F 32.2 32,397 35,282 41,103 8.9% 16.5%Barrington G 56.8 15,724 18,162 22,054 15.5% 21.4%Fox River Grove, Cary H 68.1 23,653 30,744 43,520 30.0% 41.6%Pingree Rd., Crystal Lake I 85.5 16,906 30,274 71,372 79.1% 135.8%McHenry, Woodstock K 295.7 24,819 31,120 65,546 25.4% 110.6%Harvard M 156.7 4,500 5,332 9,649 18.5% 81.0%
UP-NW TOTAL 787.6 392,024 450,696 617,079 15.0% 36.9%
REGION TOTAL 3,748.0 2,906,924 3,050,134 4,224,349 4.9% 38.5%
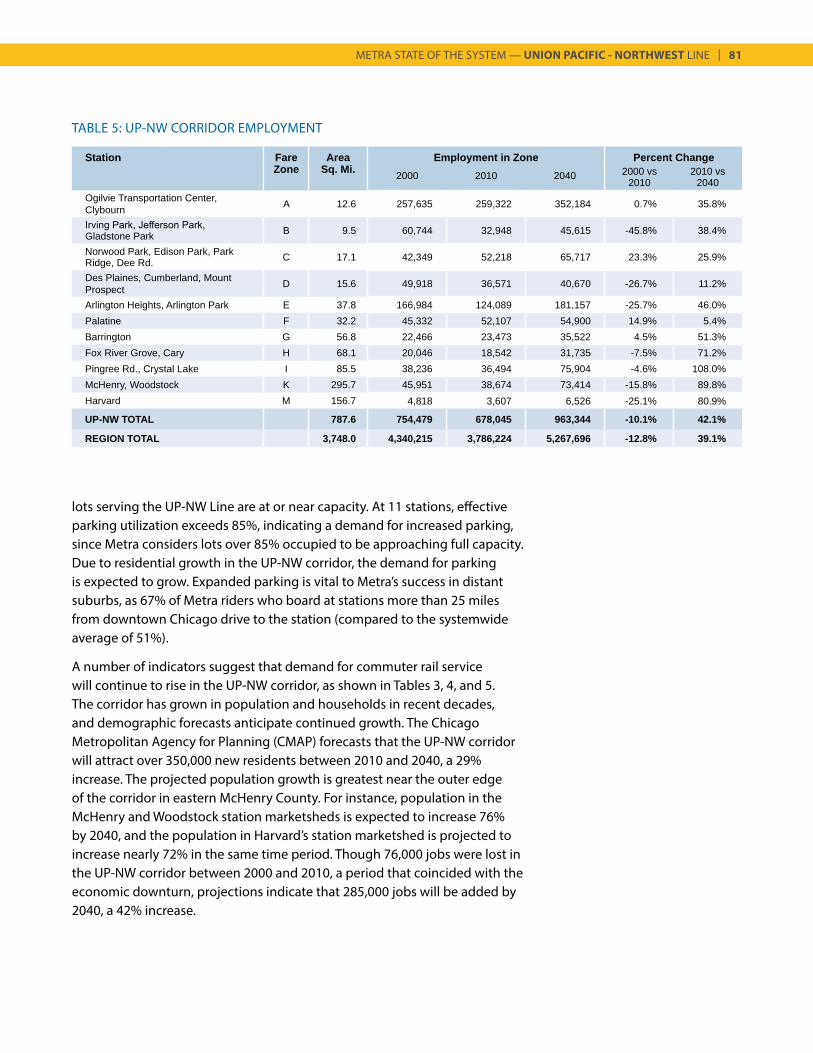
METRA STATE OF THE SYSTEM — UNION PACIFIC - NORTHWEST LINE | 81
TABLE 5: UP-NW CORRIDOR EMPLOYMENT
Station Fare Area Employment in Zone Percent ChangeZone Sq. Mi. 2000 2010 2040 2000 vs
20102010 vs
2040Ogilvie Transportation Center, Clybourn A 12.6 257,635 259,322 352,184 0.7% 35.8%
Irving Park, Jefferson Park, Gladstone Park B 9.5 60,744 32,948 45,615 -45.8% 38.4%
Norwood Park, Edison Park, Park Ridge, Dee Rd. C 17.1 42,349 52,218 65,717 23.3% 25.9%
Des Plaines, Cumberland, Mount Prospect D 15.6 49,918 36,571 40,670 -26.7% 11.2%
Arlington Heights, Arlington Park E 37.8 166,984 124,089 181,157 -25.7% 46.0%Palatine F 32.2 45,332 52,107 54,900 14.9% 5.4%Barrington G 56.8 22,466 23,473 35,522 4.5% 51.3%Fox River Grove, Cary H 68.1 20,046 18,542 31,735 -7.5% 71.2%Pingree Rd., Crystal Lake I 85.5 38,236 36,494 75,904 -4.6% 108.0%McHenry, Woodstock K 295.7 45,951 38,674 73,414 -15.8% 89.8%Harvard M 156.7 4,818 3,607 6,526 -25.1% 80.9%
UP-NW TOTAL 787.6 754,479 678,045 963,344 -10.1% 42.1%
REGION TOTAL 3,748.0 4,340,215 3,786,224 5,267,696 -12.8% 39.1%
lots serving the UP-NW Line are at or near capacity. At 11 stations, effective parking utilization exceeds 85%, indicating a demand for increased parking, since Metra considers lots over 85% occupied to be approaching full capacity. Due to residential growth in the UP-NW corridor, the demand for parking is expected to grow. Expanded parking is vital to Metra’s success in distant suburbs, as 67% of Metra riders who board at stations more than 25 miles from downtown Chicago drive to the station (compared to the systemwide average of 51%).
A number of indicators suggest that demand for commuter rail service will continue to rise in the UP-NW corridor, as shown in Tables 3, 4, and 5. The corridor has grown in population and households in recent decades, and demographic forecasts anticipate continued growth. The Chicago Metropolitan Agency for Planning (CMAP) forecasts that the UP-NW corridor will attract over 350,000 new residents between 2010 and 2040, a 29% increase. The projected population growth is greatest near the outer edge of the corridor in eastern McHenry County. For instance, population in the McHenry and Woodstock station marketsheds is expected to increase 76% by 2040, and the population in Harvard’s station marketshed is projected to increase nearly 72% in the same time period. Though 76,000 jobs were lost in the UP-NW corridor between 2000 and 2010, a period that coincided with the economic downturn, projections indicate that 285,000 jobs will be added by 2040, a 42% increase.
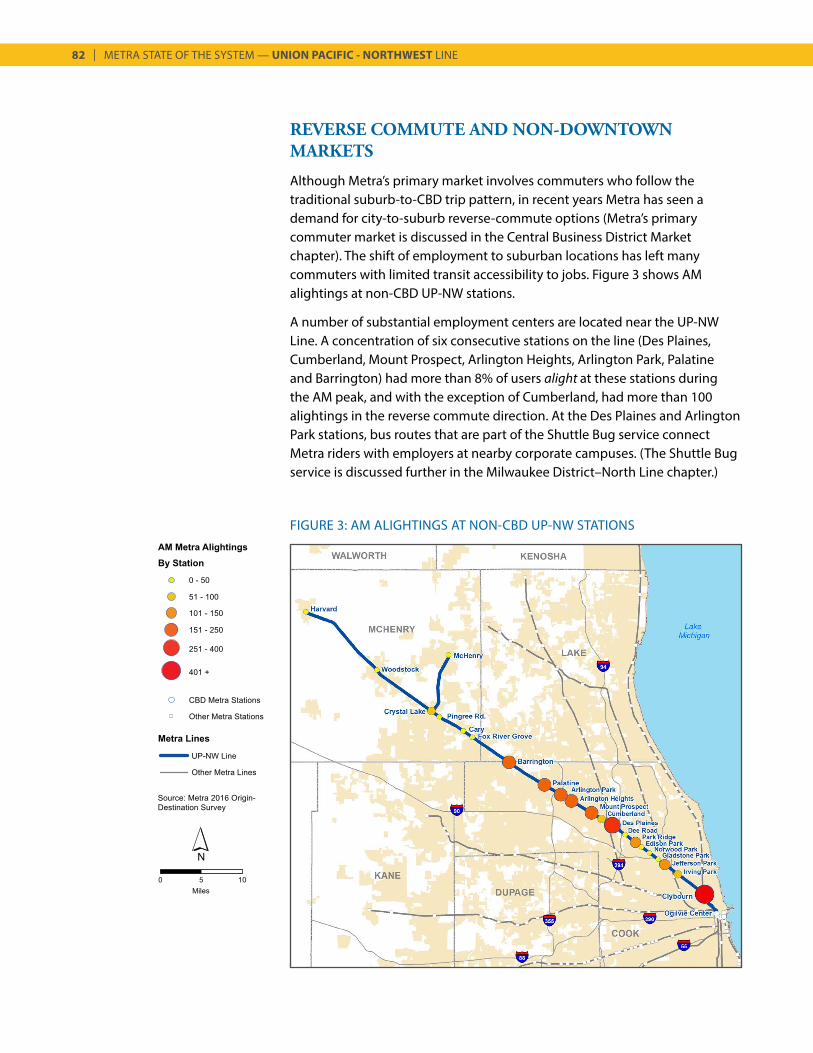
82 | METRA STATE OF THE SYSTEM — UNION PACIFIC - NORTHWEST LINE
FIGURE 3: AM ALIGHTINGS AT NON-CBD UP-NW STATIONS
REVERSE COMMUTE AND NON-DOWNTOWN MARKETS
Although Metra’s primary market involves commuters who follow the traditional suburb-to-CBD trip pattern, in recent years Metra has seen a demand for city-to-suburb reverse-commute options (Metra’s primary commuter market is discussed in the Central Business District Market chapter). The shift of employment to suburban locations has left many commuters with limited transit accessibility to jobs. Figure 3 shows AM alightings at non-CBD UP-NW stations.
A number of substantial employment centers are located near the UP-NW Line. A concentration of six consecutive stations on the line (Des Plaines, Cumberland, Mount Prospect, Arlington Heights, Arlington Park, Palatine and Barrington) had more than 8% of users alight at these stations during the AM peak, and with the exception of Cumberland, had more than 100 alightings in the reverse commute direction. At the Des Plaines and Arlington Park stations, bus routes that are part of the Shuttle Bug service connect Metra riders with employers at nearby corporate campuses. (The Shuttle Bug service is discussed further in the Milwaukee District–North Line chapter.)
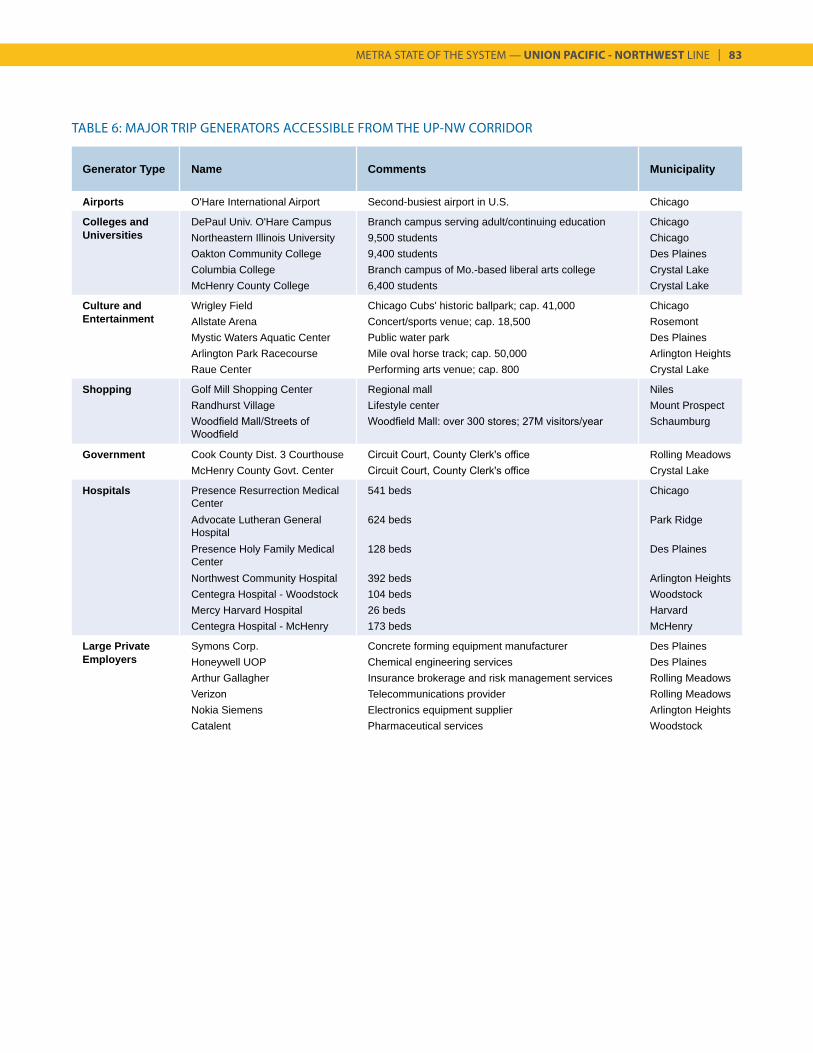
METRA STATE OF THE SYSTEM — UNION PACIFIC - NORTHWEST LINE | 83
Generator Type Name Comments Municipality
Airports O'Hare International Airport Second-busiest airport in U.S. Chicago
Colleges and DePaul Univ. O'Hare Campus Branch campus serving adult/continuing education ChicagoUniversities Northeastern Illinois University 9,500 students Chicago
Oakton Community College 9,400 students Des PlainesColumbia College Branch campus of Mo.-based liberal arts college Crystal LakeMcHenry County College 6,400 students Crystal Lake
Culture and Wrigley Field Chicago Cubs' historic ballpark; cap. 41,000 ChicagoEntertainment Allstate Arena Concert/sports venue; cap. 18,500 Rosemont
Mystic Waters Aquatic Center Public water park Des PlainesArlington Park Racecourse Mile oval horse track; cap. 50,000 Arlington HeightsRaue Center Performing arts venue; cap. 800 Crystal Lake
Shopping Golf Mill Shopping Center Regional mall NilesRandhurst Village Lifestyle center Mount ProspectWoodfield Mall/Streets of Woodfield
Woodfield Mall: over 300 stores; 27M visitors/year Schaumburg
Government Cook County Dist. 3 Courthouse Circuit Court, County Clerk's office Rolling MeadowsMcHenry County Govt. Center Circuit Court, County Clerk's office Crystal Lake
Hospitals Presence Resurrection Medical Center
541 beds Chicago
Advocate Lutheran General Hospital
624 beds Park Ridge
Presence Holy Family Medical Center
128 beds Des Plaines
Northwest Community Hospital 392 beds Arlington HeightsCentegra Hospital - Woodstock 104 beds WoodstockMercy Harvard Hospital 26 beds HarvardCentegra Hospital - McHenry 173 beds McHenry
Large Private Symons Corp. Concrete forming equipment manufacturer Des PlainesEmployers Honeywell UOP Chemical engineering services Des Plaines
Arthur Gallagher Insurance brokerage and risk management services Rolling MeadowsVerizon Telecommunications provider Rolling MeadowsNokia Siemens Electronics equipment supplier Arlington HeightsCatalent Pharmaceutical services Woodstock
TABLE 6: MAJOR TRIP GENERATORS ACCESSIBLE FROM THE UP-NW CORRIDOR
84 | METRA STATE OF THE SYSTEM — UNION PACIFIC - NORTHWEST LINE
Though many station marketsheds experienced a net employment loss between 2000 and 2010, CMAP forecasts job growth in every UP-NW marketshed by 2040, with an increase of 42%, or 285,000 jobs. Certain areas on the route are projected to experience phenomenal job growth. For instance, employment is expected to more than double in the Pingree Road and Crystal Lake marketsheds between 2000 and 2040, adding nearly 40,000 jobs. In addition, since the UP-NW is Metra’s longest line, it has greater potential for growth of ridership to locations outside of downtown Chicago than other Metra lines. While few riders will choose to travel by train rather than automobile for a short suburb-to-suburb commute, they are more likely to do so for a longer, non-CBD commute. See Table 6 for a list of major trip generators accessible from the UP-NW corridor, including large employers.
PROPOSED LINE IMPROVEMENTS
Despite the significant economic and population growth expected to take place within the UP-NW corridor, the line’s capacity is currently constrained on several fronts, including rail capacity, rolling stock capacity, and commuter parking capacity. Operations on the line are affected by the existing track configuration and the lack of a signal system on the McHenry Branch, the aged signal system on other portions of the corridor, and a lack of capacity at the existing outlying yards to support expansion. These limitations prevent further incremental improvements in the system needed to support future demand increases beyond those substantial investments in the UP-NW Line that have been already made by Metra. In order to address these issues, Metra proposed a series of upgrades to the UP-NW Line.
This project consists of a core capacity upgrade of the entire UP-NW Line, a 1.6-mile extension of the McHenry Branch from its existing terminus at McHenry to Johnsburg, and the addition of three new stations. Two new coach yards—at Woodstock and Johnsburg—would be constructed, and the existing Harvard Yard would be rebuilt. New rolling stock would be acquired. The existing signal system would be upgraded from OTC to Crystal Lake, and signalization would be added on the McHenry Branch. New crossovers would be added, and track, ties and ballast would be added in portions of the line. This combination of improvements would allow for expanded service and faster service throughout the line.
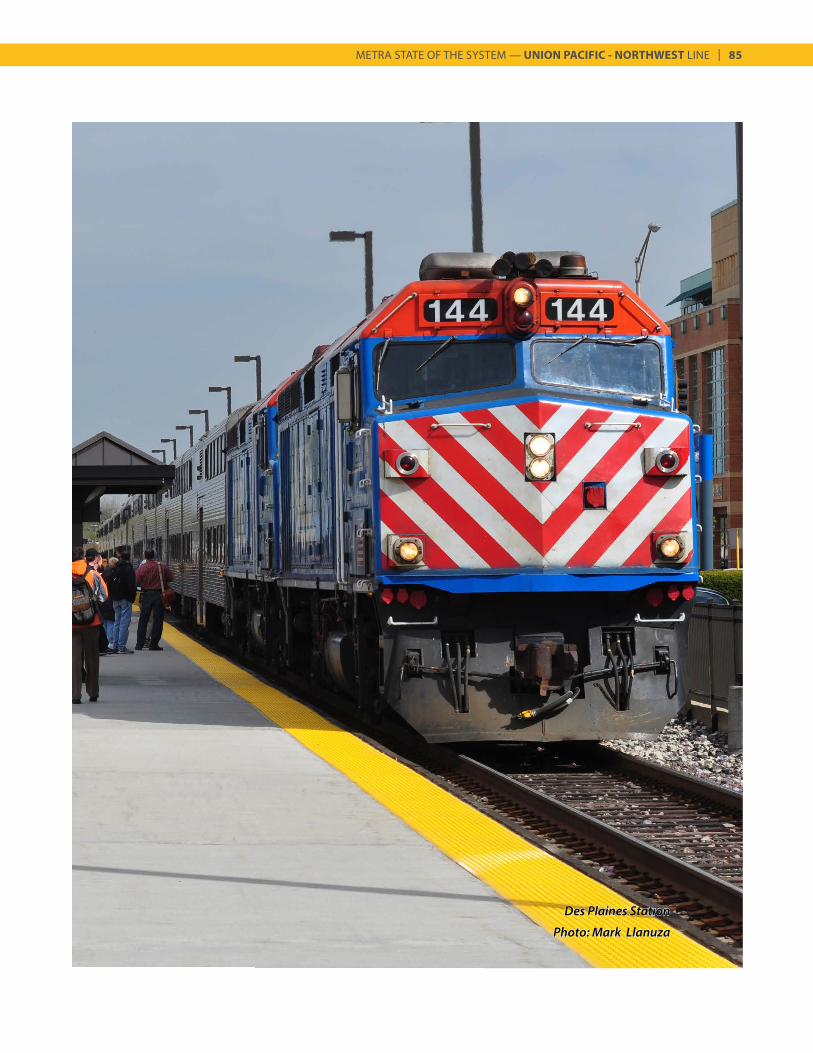
METRA STATE OF THE SYSTEM — UNION PACIFIC - NORTHWEST LINE | 85
Des Plaines Station
Photo: Mark Llanuza
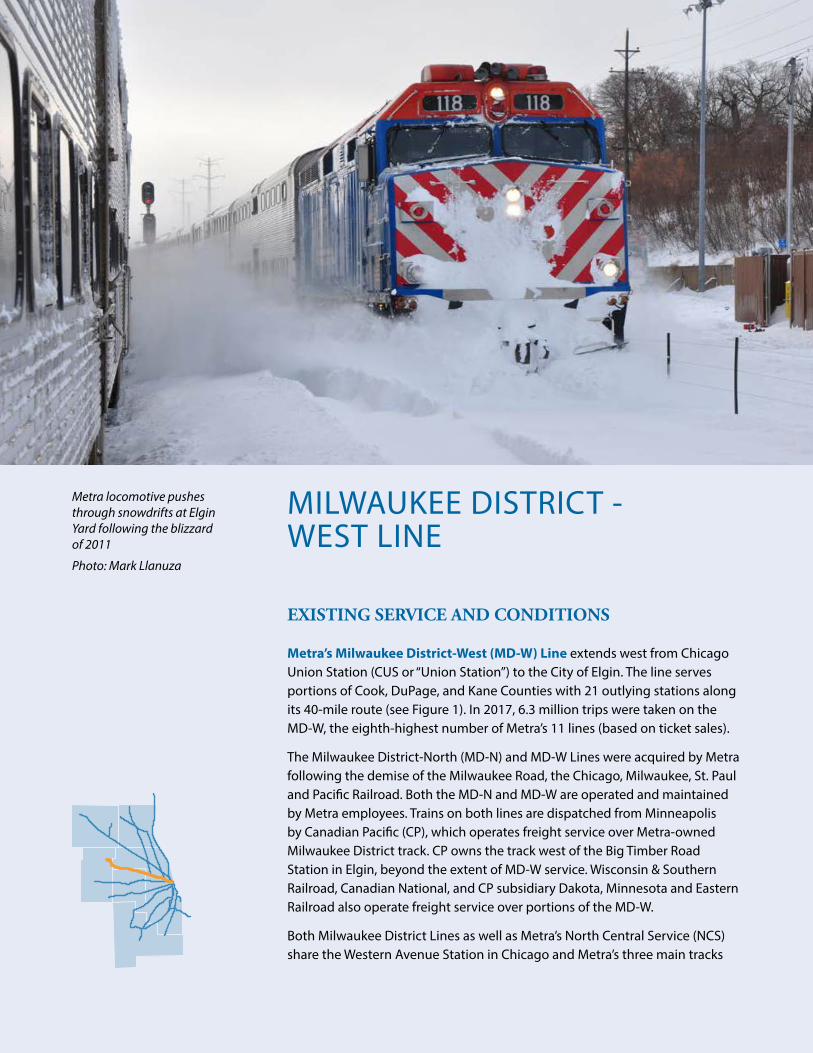
MILWAUKEE DISTRICT - WEST LINE
EXISTING SERVICE AND CONDITIONS
Metra’s Milwaukee District-West (MD-W) Line extends west from Chicago Union Station (CUS or “Union Station”) to the City of Elgin. The line serves portions of Cook, DuPage, and Kane Counties with 21 outlying stations along its 40-mile route (see Figure 1). In 2017, 6.3 million trips were taken on the MD-W, the eighth-highest number of Metra’s 11 lines (based on ticket sales).
The Milwaukee District-North (MD-N) and MD-W Lines were acquired by Metra following the demise of the Milwaukee Road, the Chicago, Milwaukee, St. Paul and Pacific Railroad. Both the MD-N and MD-W are operated and maintained by Metra employees. Trains on both lines are dispatched from Minneapolis by Canadian Pacific (CP), which operates freight service over Metra-owned Milwaukee District track. CP owns the track west of the Big Timber Road Station in Elgin, beyond the extent of MD-W service. Wisconsin & Southern Railroad, Canadian National, and CP subsidiary Dakota, Minnesota and Eastern Railroad also operate freight service over portions of the MD-W.
Both Milwaukee District Lines as well as Metra’s North Central Service (NCS) share the Western Avenue Station in Chicago and Metra’s three main tracks
Metra locomotive pushes through snowdrifts at Elgin Yard following the blizzard of 2011
Photo: Mark Llanuza
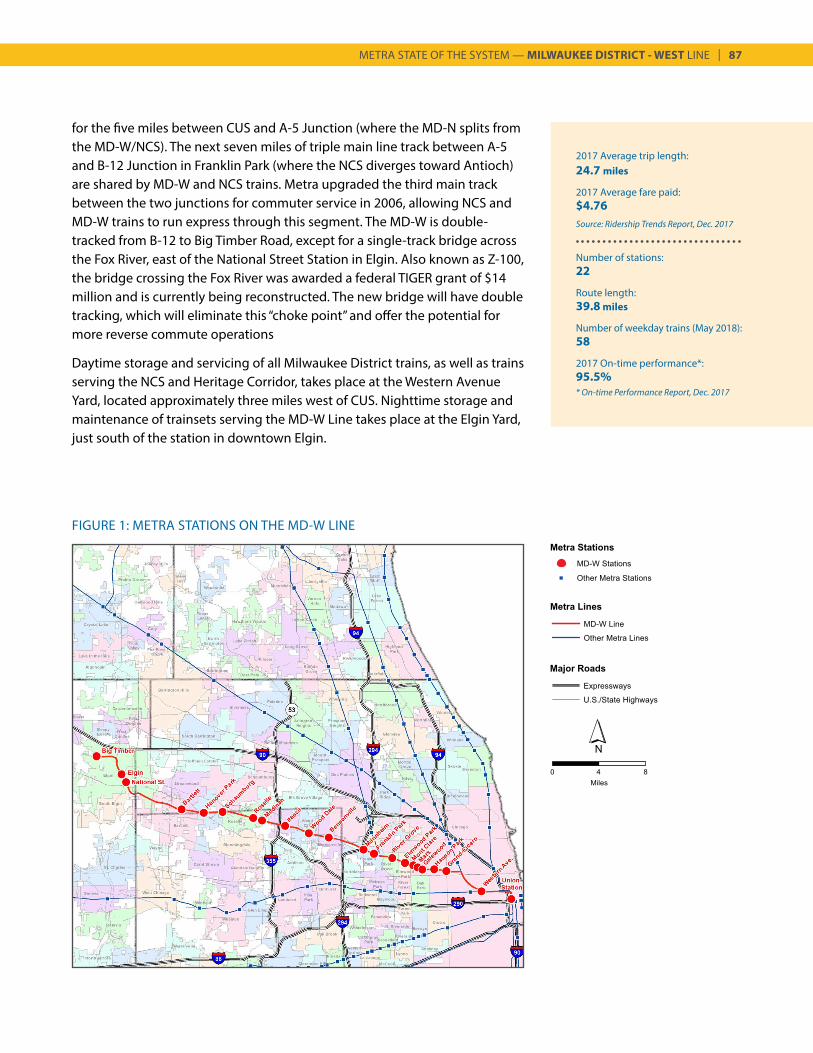
METRA STATE OF THE SYSTEM — MILWAUKEE DISTRICT - WEST LINE | 87
2017 Average trip length:24.7 miles
2017 Average fare paid:$4.76Source: Ridership Trends Report, Dec. 2017
Number of stations:22
Route length:39.8 miles
Number of weekday trains (May 2018):58
2017 On-time performance*:95.5%* On-time Performance Report, Dec. 2017
FIGURE 1: METRA STATIONS ON THE MD-W LINE
for the five miles between CUS and A-5 Junction (where the MD-N splits from the MD-W/NCS). The next seven miles of triple main line track between A-5 and B-12 Junction in Franklin Park (where the NCS diverges toward Antioch) are shared by MD-W and NCS trains. Metra upgraded the third main track between the two junctions for commuter service in 2006, allowing NCS and MD-W trains to run express through this segment. The MD-W is double-tracked from B-12 to Big Timber Road, except for a single-track bridge across the Fox River, east of the National Street Station in Elgin. Also known as Z-100, the bridge crossing the Fox River was awarded a federal TIGER grant of $14 million and is currently being reconstructed. The new bridge will have double tracking, which will eliminate this “choke point” and offer the potential for more reverse commute operations
Daytime storage and servicing of all Milwaukee District trains, as well as trains serving the NCS and Heritage Corridor, takes place at the Western Avenue Yard, located approximately three miles west of CUS. Nighttime storage and maintenance of trainsets serving the MD-W Line takes place at the Elgin Yard, just south of the station in downtown Elgin.
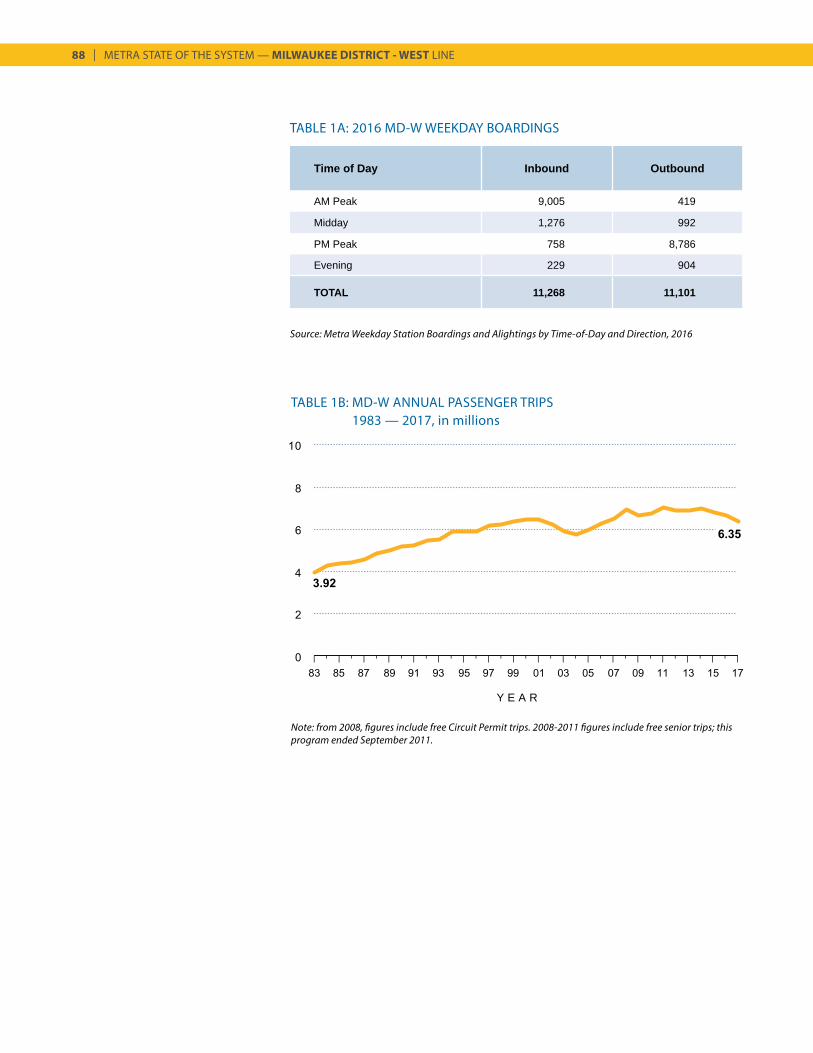
88 | METRA STATE OF THE SYSTEM — MILWAUKEE DISTRICT - WEST LINE
TABLE 1B: MD-W ANNUAL PASSENGER TRIPS1983 — 2017, in millions
Y E A R
Note: from 2008, figures include free Circuit Permit trips. 2008-2011 figures include free senior trips; this program ended September 2011.
Source: Metra Weekday Station Boardings and Alightings by Time-of-Day and Direction, 2016
TABLE 1A: 2016 MD-W WEEKDAY BOARDINGS
Time of Day Inbound Outbound
AM Peak 9,005 419
Midday 1,276 992
PM Peak 758 8,786
Evening 229 904
TOTAL 11,268 11,101
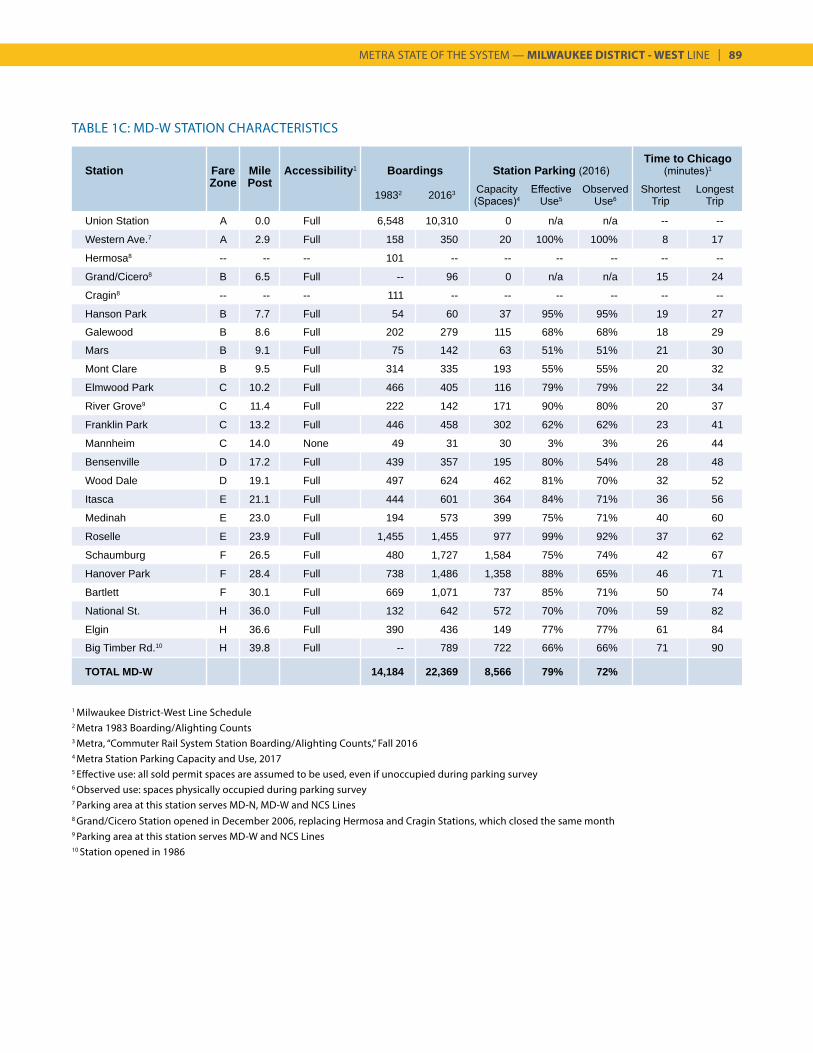
METRA STATE OF THE SYSTEM — MILWAUKEE DISTRICT - WEST LINE | 89
TABLE 1C: MD-W STATION CHARACTERISTICS
Station Fare Mile Accessibility1 Boardings Station Parking (2016)Time to Chicago
(minutes)1
Zone Post19832 20163 Capacity
(Spaces)4Effective
Use5Observed
Use6Shortest
TripLongest
Trip
Union Station A 0.0 Full 6,548 10,310 0 n/a n/a -- --
Western Ave.7 A 2.9 Full 158 350 20 100% 100% 8 17
Hermosa8 -- -- -- 101 -- -- -- -- -- --
Grand/Cicero8 B 6.5 Full -- 96 0 n/a n/a 15 24
Cragin8 -- -- -- 111 -- -- -- -- -- --
Hanson Park B 7.7 Full 54 60 37 95% 95% 19 27
Galewood B 8.6 Full 202 279 115 68% 68% 18 29
Mars B 9.1 Full 75 142 63 51% 51% 21 30
Mont Clare B 9.5 Full 314 335 193 55% 55% 20 32
Elmwood Park C 10.2 Full 466 405 116 79% 79% 22 34
River Grove9 C 11.4 Full 222 142 171 90% 80% 20 37
Franklin Park C 13.2 Full 446 458 302 62% 62% 23 41
Mannheim C 14.0 None 49 31 30 3% 3% 26 44
Bensenville D 17.2 Full 439 357 195 80% 54% 28 48
Wood Dale D 19.1 Full 497 624 462 81% 70% 32 52
Itasca E 21.1 Full 444 601 364 84% 71% 36 56
Medinah E 23.0 Full 194 573 399 75% 71% 40 60
Roselle E 23.9 Full 1,455 1,455 977 99% 92% 37 62
Schaumburg F 26.5 Full 480 1,727 1,584 75% 74% 42 67
Hanover Park F 28.4 Full 738 1,486 1,358 88% 65% 46 71
Bartlett F 30.1 Full 669 1,071 737 85% 71% 50 74
National St. H 36.0 Full 132 642 572 70% 70% 59 82
Elgin H 36.6 Full 390 436 149 77% 77% 61 84
Big Timber Rd.10 H 39.8 Full -- 789 722 66% 66% 71 90
TOTAL MD-W 14,184 22,369 8,566 79% 72%
1 Milwaukee District-West Line Schedule 2 Metra 1983 Boarding/Alighting Counts3 Metra, “Commuter Rail System Station Boarding/Alighting Counts,” Fall 20164 Metra Station Parking Capacity and Use, 20175 Effective use: all sold permit spaces are assumed to be used, even if unoccupied during parking survey6 Observed use: spaces physically occupied during parking survey7 Parking area at this station serves MD-N, MD-W and NCS Lines8 Grand/Cicero Station opened in December 2006, replacing Hermosa and Cragin Stations, which closed the same month 9 Parking area at this station serves MD-W and NCS Lines10 Station opened in 1986
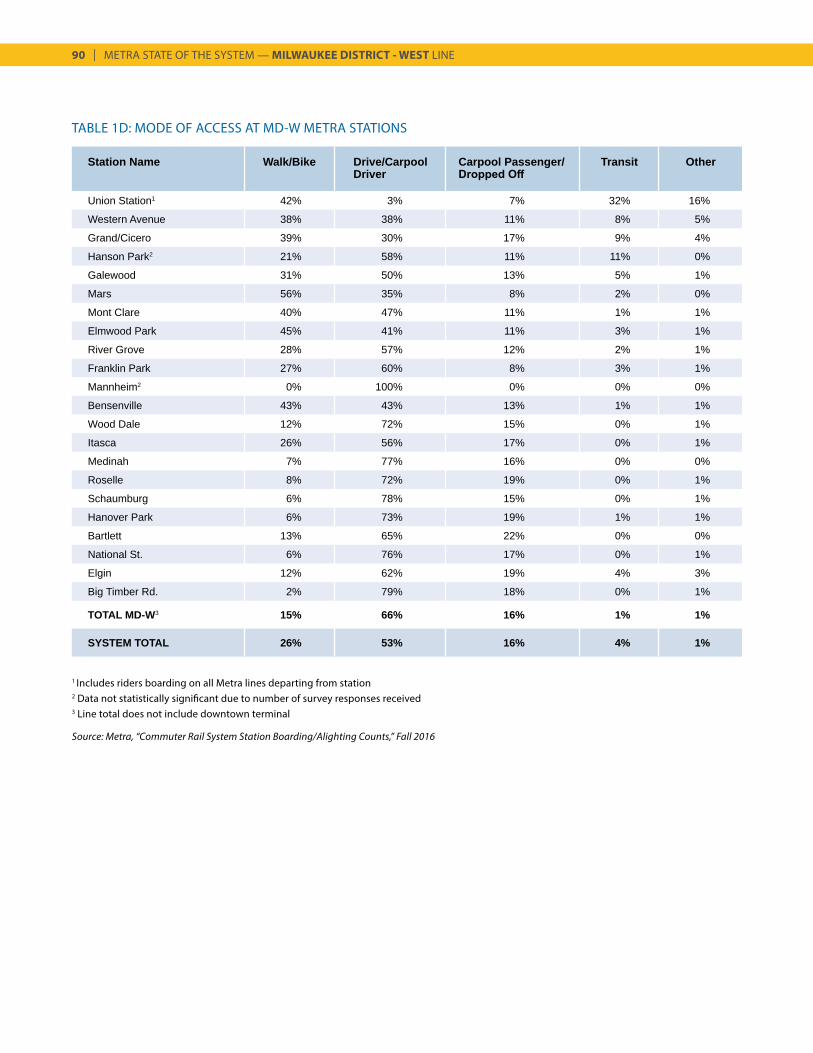
90 | METRA STATE OF THE SYSTEM — MILWAUKEE DISTRICT - WEST LINE
TABLE 1D: MODE OF ACCESS AT MD-W METRA STATIONS
Station Name Walk/Bike Drive/Carpool Driver
Carpool Passenger/ Dropped Off
Transit Other
Union Station1 42% 3% 7% 32% 16%
Western Avenue 38% 38% 11% 8% 5%
Grand/Cicero 39% 30% 17% 9% 4%
Hanson Park2 21% 58% 11% 11% 0%
Galewood 31% 50% 13% 5% 1%
Mars 56% 35% 8% 2% 0%
Mont Clare 40% 47% 11% 1% 1%
Elmwood Park 45% 41% 11% 3% 1%
River Grove 28% 57% 12% 2% 1%
Franklin Park 27% 60% 8% 3% 1%
Mannheim2 0% 100% 0% 0% 0%
Bensenville 43% 43% 13% 1% 1%
Wood Dale 12% 72% 15% 0% 1%
Itasca 26% 56% 17% 0% 1%
Medinah 7% 77% 16% 0% 0%
Roselle 8% 72% 19% 0% 1%
Schaumburg 6% 78% 15% 0% 1%
Hanover Park 6% 73% 19% 1% 1%
Bartlett 13% 65% 22% 0% 0%
National St. 6% 76% 17% 0% 1%
Elgin 12% 62% 19% 4% 3%
Big Timber Rd. 2% 79% 18% 0% 1%
TOTAL MD-W3 15% 66% 16% 1% 1%
SYSTEM TOTAL 26% 53% 16% 4% 1%
1 Includes riders boarding on all Metra lines departing from station2 Data not statistically significant due to number of survey responses received3 Line total does not include downtown terminal
Source: Metra, “Commuter Rail System Station Boarding/Alighting Counts,” Fall 2016
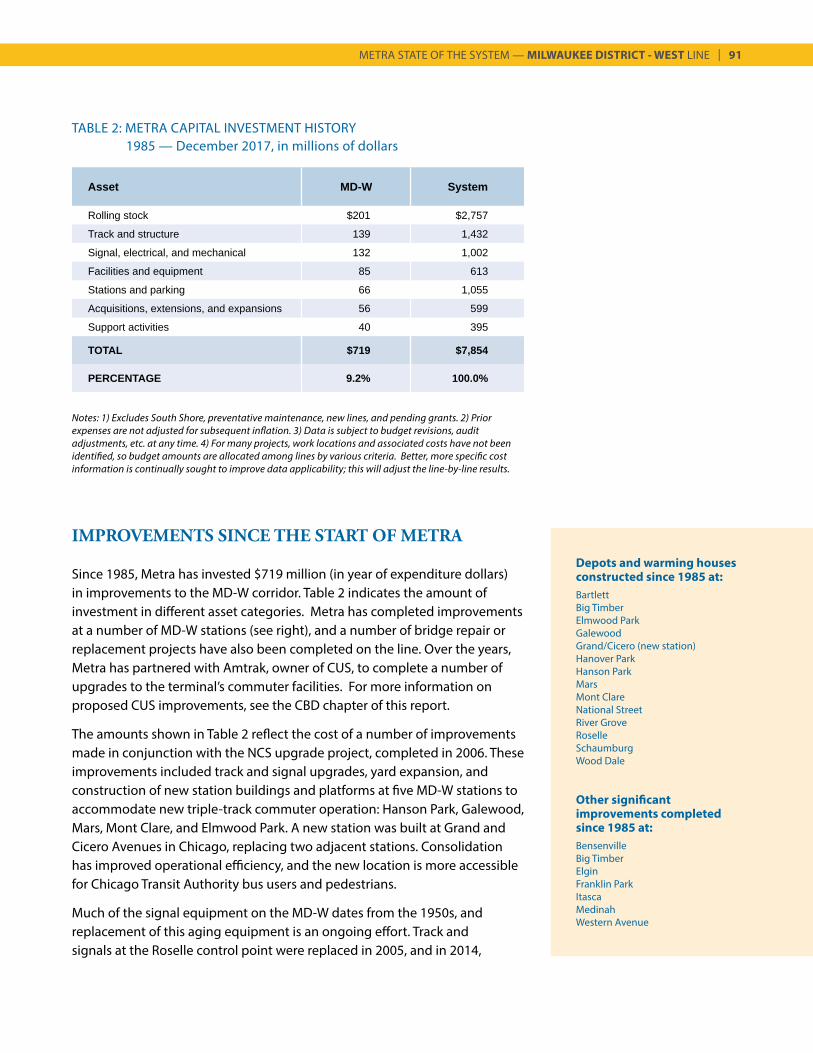
METRA STATE OF THE SYSTEM — MILWAUKEE DISTRICT - WEST LINE | 91
Asset MD-W System
Rolling stock $201 $2,757
Track and structure 139 1,432
Signal, electrical, and mechanical 132 1,002
Facilities and equipment 85 613
Stations and parking 66 1,055
Acquisitions, extensions, and expansions 56 599
Support activities 40 395
TOTAL $719 $7,854
PERCENTAGE 9.2% 100.0%
IMPROVEMENTS SINCE THE START OF METRA
Since 1985, Metra has invested $719 million (in year of expenditure dollars) in improvements to the MD-W corridor. Table 2 indicates the amount of investment in different asset categories. Metra has completed improvements at a number of MD-W stations (see right), and a number of bridge repair or replacement projects have also been completed on the line. Over the years, Metra has partnered with Amtrak, owner of CUS, to complete a number of upgrades to the terminal’s commuter facilities. For more information on proposed CUS improvements, see the CBD chapter of this report.
The amounts shown in Table 2 reflect the cost of a number of improvements made in conjunction with the NCS upgrade project, completed in 2006. These improvements included track and signal upgrades, yard expansion, and construction of new station buildings and platforms at five MD-W stations to accommodate new triple-track commuter operation: Hanson Park, Galewood, Mars, Mont Clare, and Elmwood Park. A new station was built at Grand and Cicero Avenues in Chicago, replacing two adjacent stations. Consolidation has improved operational efficiency, and the new location is more accessible for Chicago Transit Authority bus users and pedestrians.
Much of the signal equipment on the MD-W dates from the 1950s, and replacement of this aging equipment is an ongoing effort. Track and signals at the Roselle control point were replaced in 2005, and in 2014,
TABLE 2: METRA CAPITAL INVESTMENT HISTORY 1985 — December 2017, in millions of dollars
Depots and warming houses constructed since 1985 at:BartlettBig TimberElmwood ParkGalewoodGrand/Cicero (new station)Hanover ParkHanson ParkMarsMont ClareNational StreetRiver GroveRoselleSchaumburgWood Dale
Other significant improvements completed since 1985 at:BensenvilleBig TimberElginFranklin ParkItascaMedinahWestern Avenue
Notes: 1) Excludes South Shore, preventative maintenance, new lines, and pending grants. 2) Prior expenses are not adjusted for subsequent inflation. 3) Data is subject to budget revisions, audit adjustments, etc. at any time. 4) For many projects, work locations and associated costs have not been identified, so budget amounts are allocated among lines by various criteria. Better, more specific cost information is continually sought to improve data applicability; this will adjust the line-by-line results.
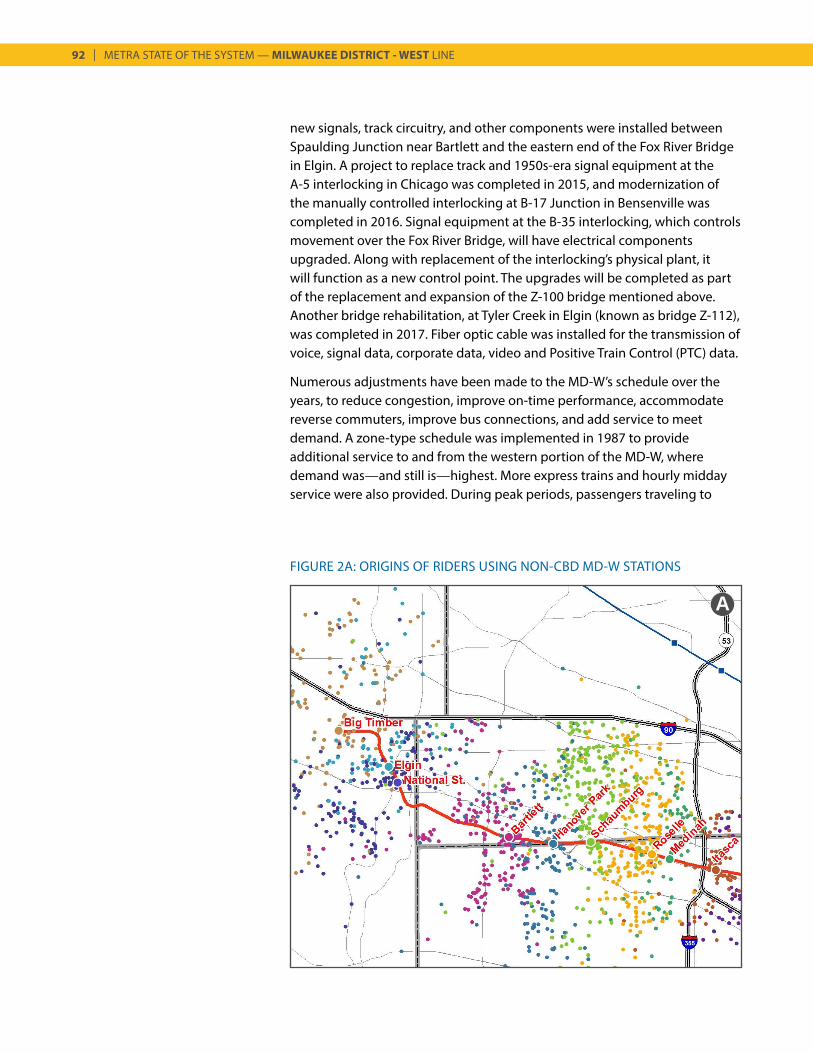
92 | METRA STATE OF THE SYSTEM — MILWAUKEE DISTRICT - WEST LINE
A
new signals, track circuitry, and other components were installed between Spaulding Junction near Bartlett and the eastern end of the Fox River Bridge in Elgin. A project to replace track and 1950s-era signal equipment at the A-5 interlocking in Chicago was completed in 2015, and modernization of the manually controlled interlocking at B-17 Junction in Bensenville was completed in 2016. Signal equipment at the B-35 interlocking, which controls movement over the Fox River Bridge, will have electrical components upgraded. Along with replacement of the interlocking’s physical plant, it will function as a new control point. The upgrades will be completed as part of the replacement and expansion of the Z-100 bridge mentioned above. Another bridge rehabilitation, at Tyler Creek in Elgin (known as bridge Z-112), was completed in 2017. Fiber optic cable was installed for the transmission of voice, signal data, corporate data, video and Positive Train Control (PTC) data.
Numerous adjustments have been made to the MD-W’s schedule over the years, to reduce congestion, improve on-time performance, accommodate reverse commuters, improve bus connections, and add service to meet demand. A zone-type schedule was implemented in 1987 to provide additional service to and from the western portion of the MD-W, where demand was—and still is—highest. More express trains and hourly midday service were also provided. During peak periods, passengers traveling to
FIGURE 2A: ORIGINS OF RIDERS USING NON-CBD MD-W STATIONS
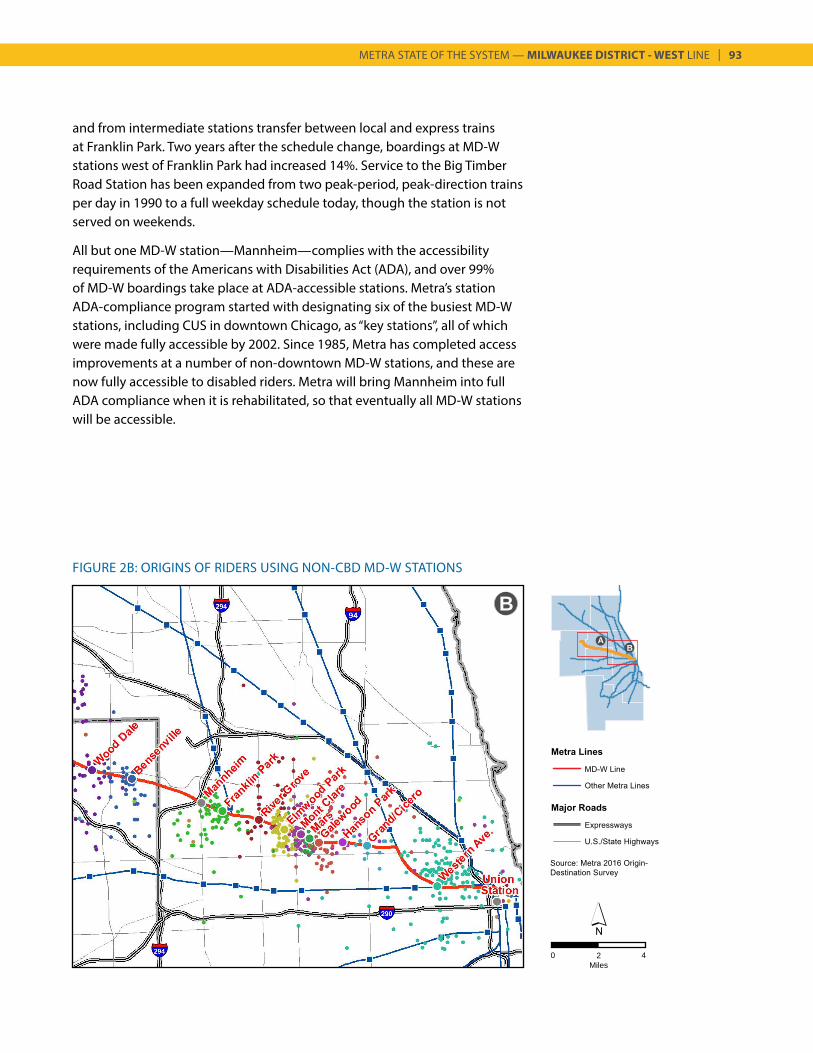
METRA STATE OF THE SYSTEM — MILWAUKEE DISTRICT - WEST LINE | 93
FIGURE 2B: ORIGINS OF RIDERS USING NON-CBD MD-W STATIONS
0 2Miles
4
AB
B
and from intermediate stations transfer between local and express trains at Franklin Park. Two years after the schedule change, boardings at MD-W stations west of Franklin Park had increased 14%. Service to the Big Timber Road Station has been expanded from two peak-period, peak-direction trains per day in 1990 to a full weekday schedule today, though the station is not served on weekends.
All but one MD-W station—Mannheim—complies with the accessibility requirements of the Americans with Disabilities Act (ADA), and over 99% of MD-W boardings take place at ADA-accessible stations. Metra’s station ADA-compliance program started with designating six of the busiest MD-W stations, including CUS in downtown Chicago, as “key stations”, all of which were made fully accessible by 2002. Since 1985, Metra has completed access improvements at a number of non-downtown MD-W stations, and these are now fully accessible to disabled riders. Metra will bring Mannheim into full ADA compliance when it is rehabilitated, so that eventually all MD-W stations will be accessible.
94 | METRA STATE OF THE SYSTEM — MILWAUKEE DISTRICT - WEST LINE
PRESENT AND FUTURE DEMAND
In 2016, 22,000 boardings took place each weekday on the MD-W, with 80% of boardings occurring on peak-period, peak-direction trains. On the MD-W, ridership has increased 58% since 1983 (see Table 1c), with the most significant ridership gains occurring at stations near the western end of the line. Since 1983, boardings have increased 72% at stations from Wood Dale westward (excluding the Big Timber Road Station, which opened in 1986). Ridership in this segment accounts for 71% of boardings at non-downtown MD-W stations.
Figure 2 shows the origins of MD-W riders who board at stations outside of the Central Business District (CBD). Overall passenger ridership on the MD-W totaled 6.6 million in 2016.
Demographic forecasts suggest that demand for commuter rail service on the MD-W will continue to rise (see Tables 3, 4 and 5). Though most of the corridor experienced a modest loss of population or only modest growth between 2000 and 2010, the Chicago Metropolitan Agency for Planning (CMAP) forecasts that the MD-W corridor will attract 264,000 new residents between 2010 and 2040, a 28% increase. Nearly 195,000 jobs are projected to be added, a 51% rise.
Projected population growth is especially significant at the outer end of the corridor in eastern Kane County. Population in the Elgin station marketsheds (National Street, Elgin, and Big Timber Road) is forecasted to increase 62% from 2010 to 2040. Employment growth in the Elgin area, as well as most marketsheds in the corridor, is also anticipated to be strong.
Currently, over 8,500 parking spaces serve the riders of the MD-W, as shown in Table 1c. According to parking counts conducted in 2017, the effective utilization rate at all stations on the line is 79%. When utilization of station parking areas exceeds 85%, Metra considers that they are approaching full capacity. Five MD-W stations exceed this threshold, indicating a demand for increased parking at these stations. Due to residential growth in the MD-W corridor, the demand for parking is expected to grow.
REVERSE COMMUTE AND NON-DOWNTOWN MARKETS
Although Metra’s primary market involves commuters who follow the tradi-tional suburb-to-CBD trip pattern, in recent years Metra has seen a demand for city-to-suburb reverse-commute options (Metra’s primary commuter market is discussed in the Central Business District Market chapter). The shift of employment to suburban locations has left many commuters with limited
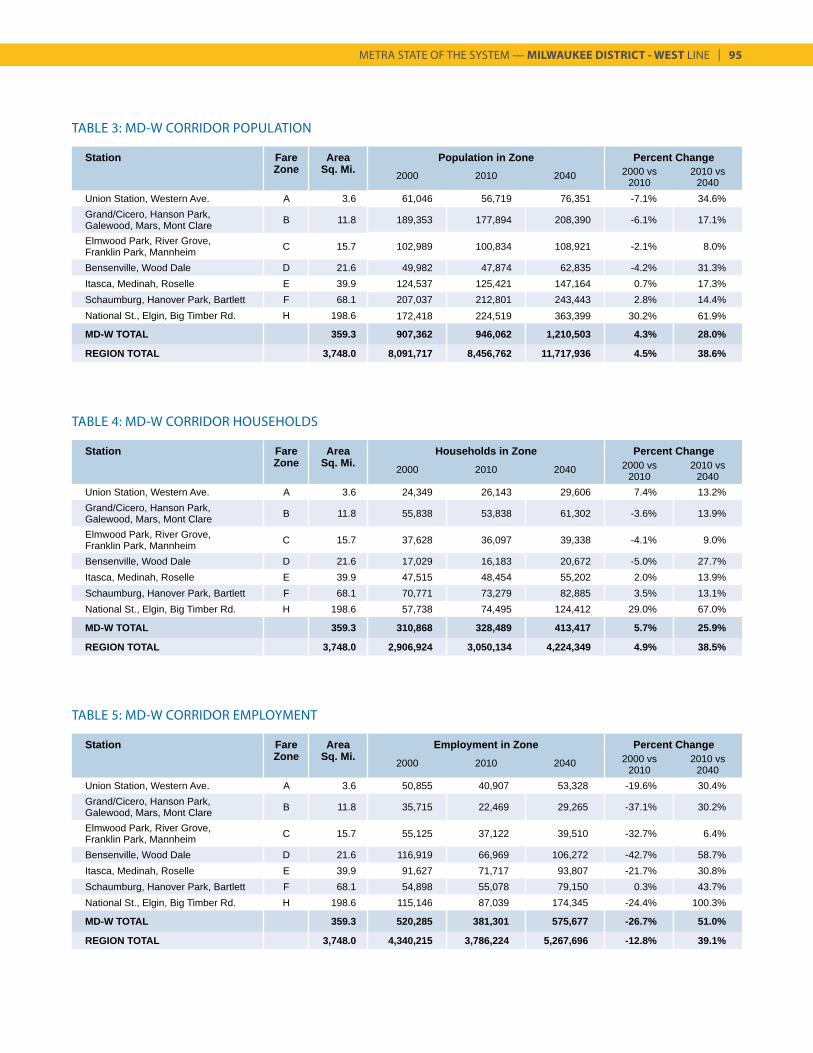
METRA STATE OF THE SYSTEM — MILWAUKEE DISTRICT - WEST LINE | 95
TABLE 3: MD-W CORRIDOR POPULATION
Station Fare Area Employment in Zone Percent ChangeZone Sq. Mi. 2000 2010 2040 2000 vs
20102010 vs
2040Union Station, Western Ave. A 3.6 50,855 40,907 53,328 -19.6% 30.4%Grand/Cicero, Hanson Park, Galewood, Mars, Mont Clare B 11.8 35,715 22,469 29,265 -37.1% 30.2%
Elmwood Park, River Grove, Franklin Park, Mannheim C 15.7 55,125 37,122 39,510 -32.7% 6.4%
Bensenville, Wood Dale D 21.6 116,919 66,969 106,272 -42.7% 58.7%Itasca, Medinah, Roselle E 39.9 91,627 71,717 93,807 -21.7% 30.8%Schaumburg, Hanover Park, Bartlett F 68.1 54,898 55,078 79,150 0.3% 43.7%National St., Elgin, Big Timber Rd. H 198.6 115,146 87,039 174,345 -24.4% 100.3%
MD-W TOTAL 359.3 520,285 381,301 575,677 -26.7% 51.0%
REGION TOTAL 3,748.0 4,340,215 3,786,224 5,267,696 -12.8% 39.1%
Station Fare Area Population in Zone Percent ChangeZone Sq. Mi. 2000 2010 2040 2000 vs
20102010 vs
2040Union Station, Western Ave. A 3.6 61,046 56,719 76,351 -7.1% 34.6%Grand/Cicero, Hanson Park, Galewood, Mars, Mont Clare B 11.8 189,353 177,894 208,390 -6.1% 17.1%
Elmwood Park, River Grove, Franklin Park, Mannheim C 15.7 102,989 100,834 108,921 -2.1% 8.0%
Bensenville, Wood Dale D 21.6 49,982 47,874 62,835 -4.2% 31.3%Itasca, Medinah, Roselle E 39.9 124,537 125,421 147,164 0.7% 17.3%Schaumburg, Hanover Park, Bartlett F 68.1 207,037 212,801 243,443 2.8% 14.4%National St., Elgin, Big Timber Rd. H 198.6 172,418 224,519 363,399 30.2% 61.9%
MD-W TOTAL 359.3 907,362 946,062 1,210,503 4.3% 28.0%
REGION TOTAL 3,748.0 8,091,717 8,456,762 11,717,936 4.5% 38.6%
Station Fare Area Households in Zone Percent ChangeZone Sq. Mi. 2000 2010 2040 2000 vs
20102010 vs
2040Union Station, Western Ave. A 3.6 24,349 26,143 29,606 7.4% 13.2%Grand/Cicero, Hanson Park, Galewood, Mars, Mont Clare B 11.8 55,838 53,838 61,302 -3.6% 13.9%
Elmwood Park, River Grove, Franklin Park, Mannheim C 15.7 37,628 36,097 39,338 -4.1% 9.0%
Bensenville, Wood Dale D 21.6 17,029 16,183 20,672 -5.0% 27.7%Itasca, Medinah, Roselle E 39.9 47,515 48,454 55,202 2.0% 13.9%Schaumburg, Hanover Park, Bartlett F 68.1 70,771 73,279 82,885 3.5% 13.1%National St., Elgin, Big Timber Rd. H 198.6 57,738 74,495 124,412 29.0% 67.0%
MD-W TOTAL 359.3 310,868 328,489 413,417 5.7% 25.9%
REGION TOTAL 3,748.0 2,906,924 3,050,134 4,224,349 4.9% 38.5%
TABLE 5: MD-W CORRIDOR EMPLOYMENT
TABLE 4: MD-W CORRIDOR HOUSEHOLDS
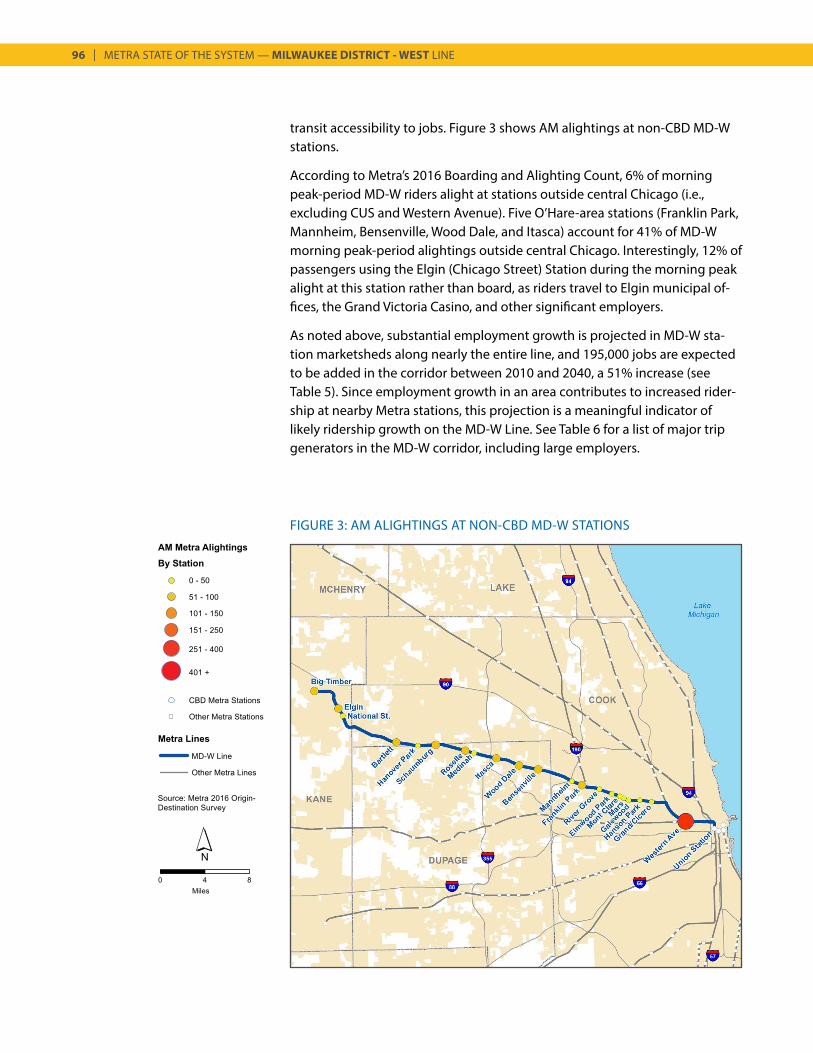
96 | METRA STATE OF THE SYSTEM — MILWAUKEE DISTRICT - WEST LINE
FIGURE 3: AM ALIGHTINGS AT NON-CBD MD-W STATIONS
transit accessibility to jobs. Figure 3 shows AM alightings at non-CBD MD-W stations.
According to Metra’s 2016 Boarding and Alighting Count, 6% of morning peak-period MD-W riders alight at stations outside central Chicago (i.e., excluding CUS and Western Avenue). Five O’Hare-area stations (Franklin Park, Mannheim, Bensenville, Wood Dale, and Itasca) account for 41% of MD-W morning peak-period alightings outside central Chicago. Interestingly, 12% of passengers using the Elgin (Chicago Street) Station during the morning peak alight at this station rather than board, as riders travel to Elgin municipal of-fices, the Grand Victoria Casino, and other significant employers.
As noted above, substantial employment growth is projected in MD-W sta-tion marketsheds along nearly the entire line, and 195,000 jobs are expected to be added in the corridor between 2010 and 2040, a 51% increase (see Table 5). Since employment growth in an area contributes to increased rider-ship at nearby Metra stations, this projection is a meaningful indicator of likely ridership growth on the MD-W Line. See Table 6 for a list of major trip generators in the MD-W corridor, including large employers.
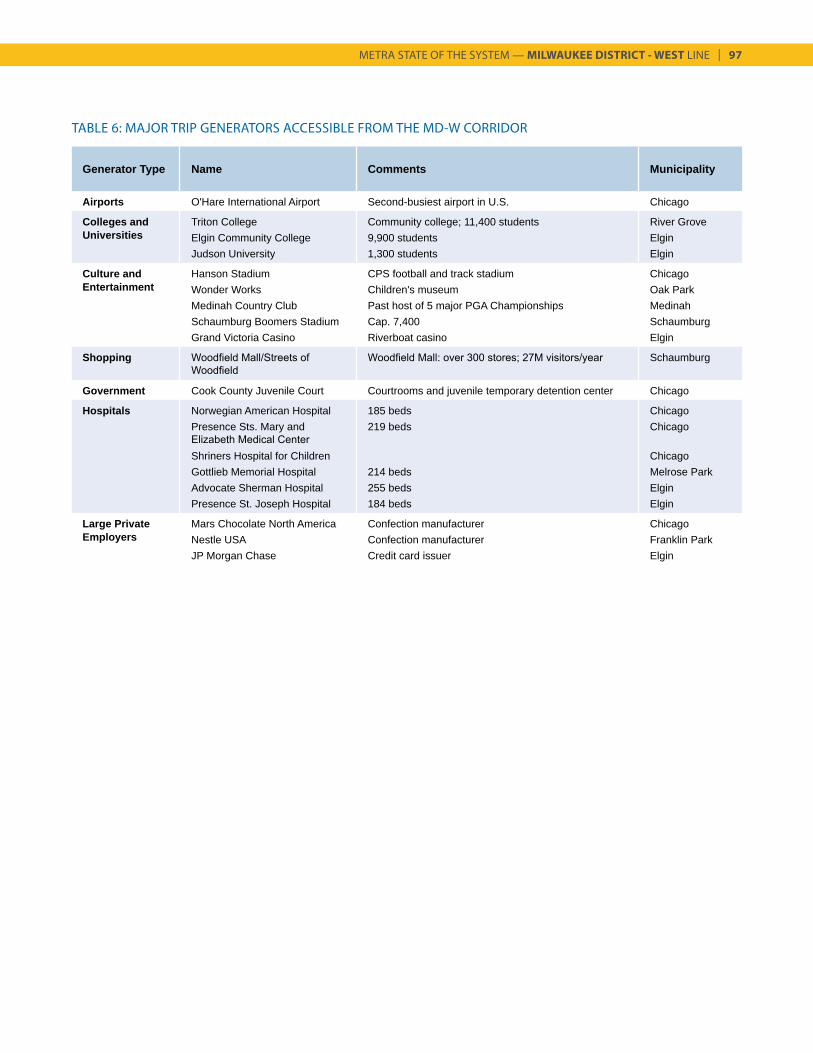
METRA STATE OF THE SYSTEM — MILWAUKEE DISTRICT - WEST LINE | 97
Generator Type Name Comments Municipality
Airports O'Hare International Airport Second-busiest airport in U.S. Chicago
Colleges and Triton College Community college; 11,400 students River GroveUniversities Elgin Community College 9,900 students Elgin
Judson University 1,300 students Elgin
Culture and Hanson Stadium CPS football and track stadium ChicagoEntertainment Wonder Works Children's museum Oak Park
Medinah Country Club Past host of 5 major PGA Championships MedinahSchaumburg Boomers Stadium Cap. 7,400 SchaumburgGrand Victoria Casino Riverboat casino Elgin
Shopping Woodfield Mall/Streets of Woodfield
Woodfield Mall: over 300 stores; 27M visitors/year Schaumburg
Government Cook County Juvenile Court Courtrooms and juvenile temporary detention center Chicago
Hospitals Norwegian American Hospital 185 beds ChicagoPresence Sts. Mary and Elizabeth Medical Center
219 beds Chicago
Shriners Hospital for Children ChicagoGottlieb Memorial Hospital 214 beds Melrose ParkAdvocate Sherman Hospital 255 beds ElginPresence St. Joseph Hospital 184 beds Elgin
Large Private Mars Chocolate North America Confection manufacturer ChicagoEmployers Nestle USA Confection manufacturer Franklin Park
JP Morgan Chase Credit card issuer Elgin
TABLE 6: MAJOR TRIP GENERATORS ACCESSIBLE FROM THE MD-W CORRIDOR
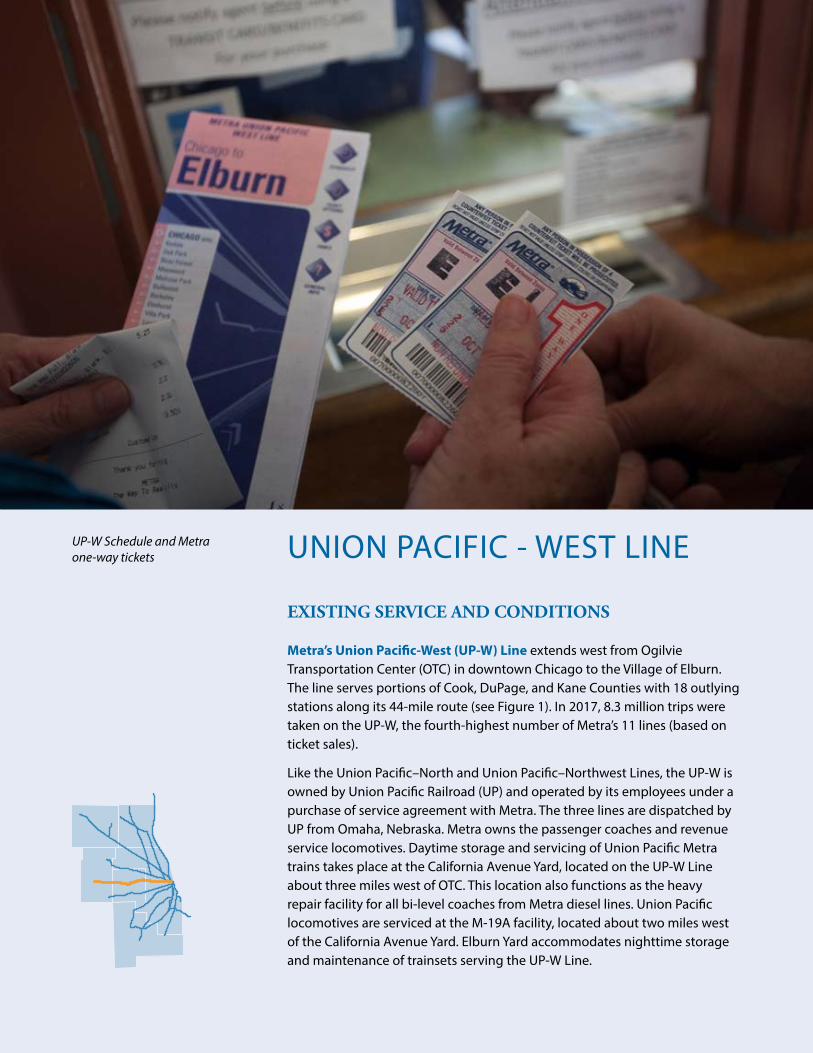
UNION PACIFIC - WEST LINE
EXISTING SERVICE AND CONDITIONS
Metra’s Union Pacific-West (UP-W) Line extends west from Ogilvie Transportation Center (OTC) in downtown Chicago to the Village of Elburn. The line serves portions of Cook, DuPage, and Kane Counties with 18 outlying stations along its 44-mile route (see Figure 1). In 2017, 8.3 million trips were taken on the UP-W, the fourth-highest number of Metra’s 11 lines (based on ticket sales).
Like the Union Pacific–North and Union Pacific–Northwest Lines, the UP-W is owned by Union Pacific Railroad (UP) and operated by its employees under a purchase of service agreement with Metra. The three lines are dispatched by UP from Omaha, Nebraska. Metra owns the passenger coaches and revenue service locomotives. Daytime storage and servicing of Union Pacific Metra trains takes place at the California Avenue Yard, located on the UP-W Line about three miles west of OTC. This location also functions as the heavy repair facility for all bi-level coaches from Metra diesel lines. Union Pacific locomotives are serviced at the M-19A facility, located about two miles west of the California Avenue Yard. Elburn Yard accommodates nighttime storage and maintenance of trainsets serving the UP-W Line.
UP-W Schedule and Metra one-way tickets
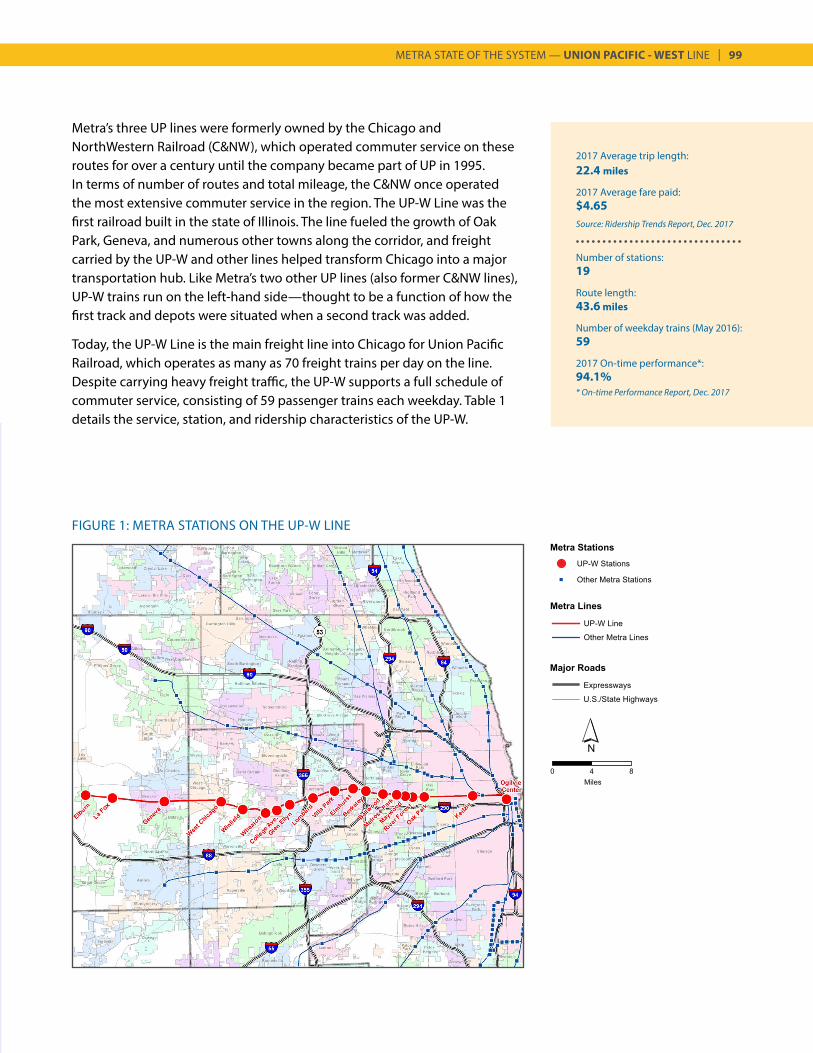
METRA STATE OF THE SYSTEM — UNION PACIFIC - WEST LINE | 99
2017 Average trip length:22.4 miles
2017 Average fare paid:$4.65Source: Ridership Trends Report, Dec. 2017
Number of stations:19
Route length:43.6 miles
Number of weekday trains (May 2016):59
2017 On-time performance*:94.1%* On-time Performance Report, Dec. 2017
FIGURE 1: METRA STATIONS ON THE UP-W LINE
Metra’s three UP lines were formerly owned by the Chicago and NorthWestern Railroad (C&NW), which operated commuter service on these routes for over a century until the company became part of UP in 1995. In terms of number of routes and total mileage, the C&NW once operated the most extensive commuter service in the region. The UP-W Line was the first railroad built in the state of Illinois. The line fueled the growth of Oak Park, Geneva, and numerous other towns along the corridor, and freight carried by the UP-W and other lines helped transform Chicago into a major transportation hub. Like Metra’s two other UP lines (also former C&NW lines), UP-W trains run on the left-hand side—thought to be a function of how the first track and depots were situated when a second track was added.
Today, the UP-W Line is the main freight line into Chicago for Union Pacific Railroad, which operates as many as 70 freight trains per day on the line. Despite carrying heavy freight traffic, the UP-W supports a full schedule of commuter service, consisting of 59 passenger trains each weekday. Table 1 details the service, station, and ridership characteristics of the UP-W.
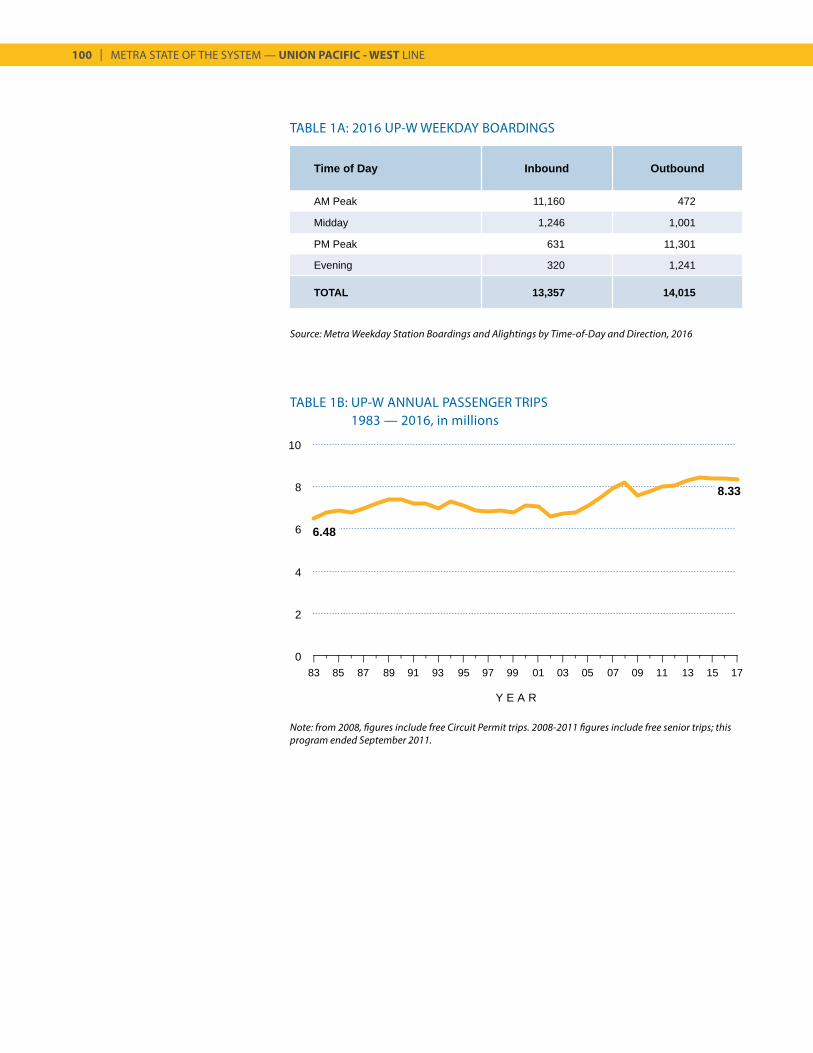
100 | METRA STATE OF THE SYSTEM — UNION PACIFIC - WEST LINE
Source: Metra Weekday Station Boardings and Alightings by Time-of-Day and Direction, 2016
TABLE 1A: 2016 UP-W WEEKDAY BOARDINGS
TABLE 1B: UP-W ANNUAL PASSENGER TRIPS1983 — 2016, in millions
Y E A R
Time of Day Inbound Outbound
AM Peak 11,160 472
Midday 1,246 1,001
PM Peak 631 11,301
Evening 320 1,241
TOTAL 13,357 14,015
Note: from 2008, figures include free Circuit Permit trips. 2008-2011 figures include free senior trips; this program ended September 2011.
0
2
4
6
8
10
6.48
8.33
6.48
8.33
83 85 87 89 91 93 95 97 99 01 03 05 07 09 11 13 15 17
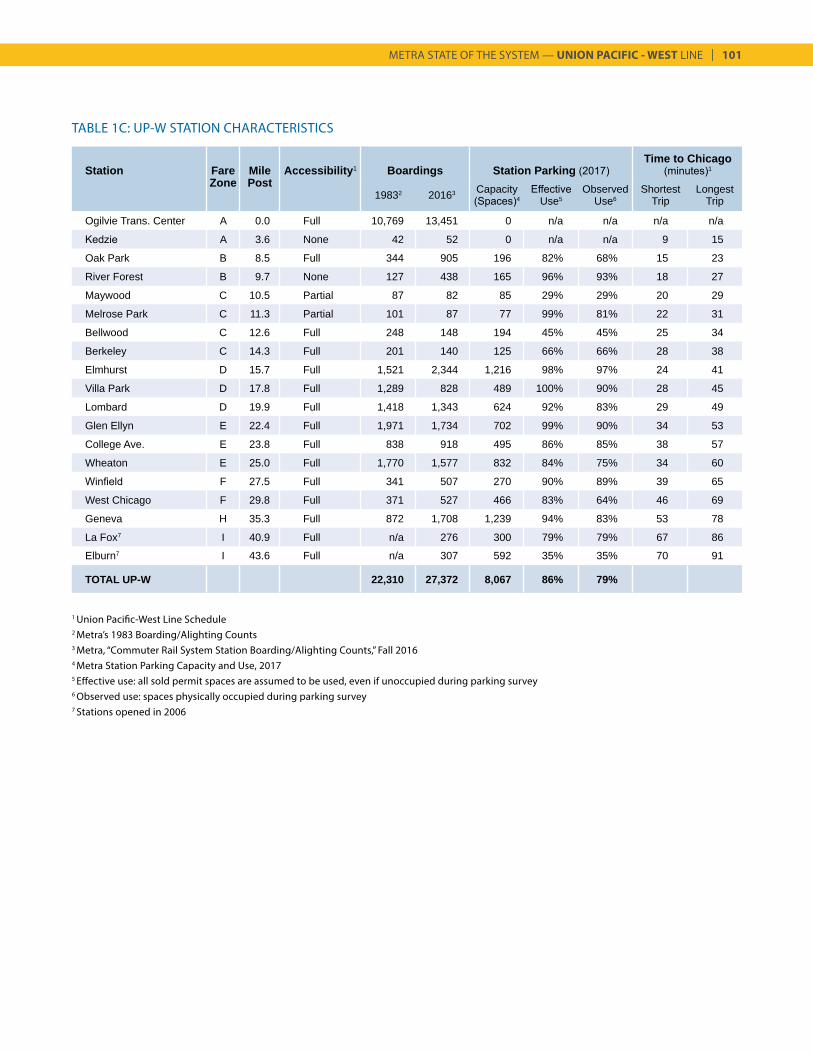
METRA STATE OF THE SYSTEM — UNION PACIFIC - WEST LINE | 101
TABLE 1C: UP-W STATION CHARACTERISTICS
Station Fare Mile Accessibility1 Boardings Station Parking (2017)Time to Chicago
(minutes)1
Zone Post19832 20163 Capacity
(Spaces)4Effective
Use5Observed
Use6Shortest
TripLongest
Trip
Ogilvie Trans. Center A 0.0 Full 10,769 13,451 0 n/a n/a n/a n/a
Kedzie A 3.6 None 42 52 0 n/a n/a 9 15
Oak Park B 8.5 Full 344 905 196 82% 68% 15 23
River Forest B 9.7 None 127 438 165 96% 93% 18 27
Maywood C 10.5 Partial 87 82 85 29% 29% 20 29
Melrose Park C 11.3 Partial 101 87 77 99% 81% 22 31
Bellwood C 12.6 Full 248 148 194 45% 45% 25 34
Berkeley C 14.3 Full 201 140 125 66% 66% 28 38
Elmhurst D 15.7 Full 1,521 2,344 1,216 98% 97% 24 41
Villa Park D 17.8 Full 1,289 828 489 100% 90% 28 45
Lombard D 19.9 Full 1,418 1,343 624 92% 83% 29 49
Glen Ellyn E 22.4 Full 1,971 1,734 702 99% 90% 34 53
College Ave. E 23.8 Full 838 918 495 86% 85% 38 57
Wheaton E 25.0 Full 1,770 1,577 832 84% 75% 34 60
Winfield F 27.5 Full 341 507 270 90% 89% 39 65
West Chicago F 29.8 Full 371 527 466 83% 64% 46 69
Geneva H 35.3 Full 872 1,708 1,239 94% 83% 53 78
La Fox7 I 40.9 Full n/a 276 300 79% 79% 67 86
Elburn7 I 43.6 Full n/a 307 592 35% 35% 70 91
TOTAL UP-W 22,310 27,372 8,067 86% 79%
1 Union Pacific-West Line Schedule2 Metra’s 1983 Boarding/Alighting Counts3 Metra, “Commuter Rail System Station Boarding/Alighting Counts,” Fall 20164 Metra Station Parking Capacity and Use, 20175 Effective use: all sold permit spaces are assumed to be used, even if unoccupied during parking survey6 Observed use: spaces physically occupied during parking survey7 Stations opened in 2006
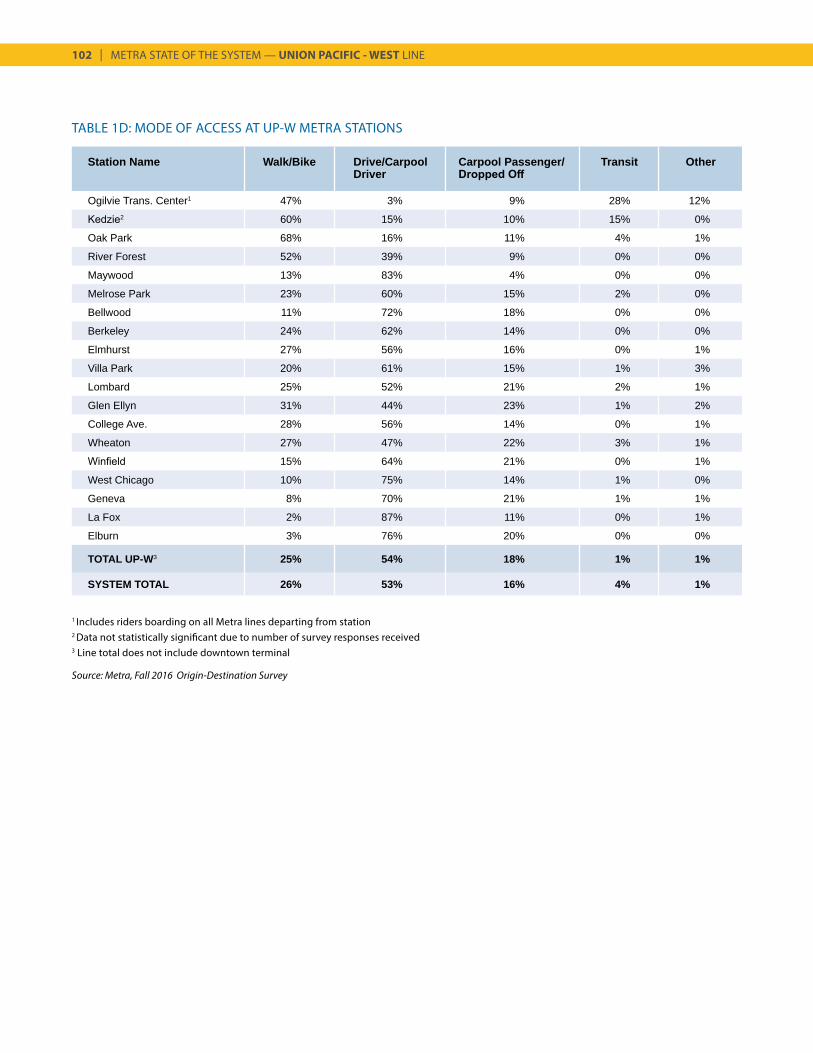
102 | METRA STATE OF THE SYSTEM — UNION PACIFIC - WEST LINE
TABLE 1D: MODE OF ACCESS AT UP-W METRA STATIONS
Station Name Walk/Bike Drive/Carpool Driver
Carpool Passenger/ Dropped Off
Transit Other
Ogilvie Trans. Center1 47% 3% 9% 28% 12%
Kedzie2 60% 15% 10% 15% 0%
Oak Park 68% 16% 11% 4% 1%
River Forest 52% 39% 9% 0% 0%
Maywood 13% 83% 4% 0% 0%
Melrose Park 23% 60% 15% 2% 0%
Bellwood 11% 72% 18% 0% 0%
Berkeley 24% 62% 14% 0% 0%
Elmhurst 27% 56% 16% 0% 1%
Villa Park 20% 61% 15% 1% 3%
Lombard 25% 52% 21% 2% 1%
Glen Ellyn 31% 44% 23% 1% 2%
College Ave. 28% 56% 14% 0% 1%
Wheaton 27% 47% 22% 3% 1%
Winfield 15% 64% 21% 0% 1%
West Chicago 10% 75% 14% 1% 0%
Geneva 8% 70% 21% 1% 1%
La Fox 2% 87% 11% 0% 1%
Elburn 3% 76% 20% 0% 0%
TOTAL UP-W3 25% 54% 18% 1% 1%
SYSTEM TOTAL 26% 53% 16% 4% 1%
1 Includes riders boarding on all Metra lines departing from station2 Data not statistically significant due to number of survey responses received3 Line total does not include downtown terminal
Source: Metra, Fall 2016 Origin-Destination Survey
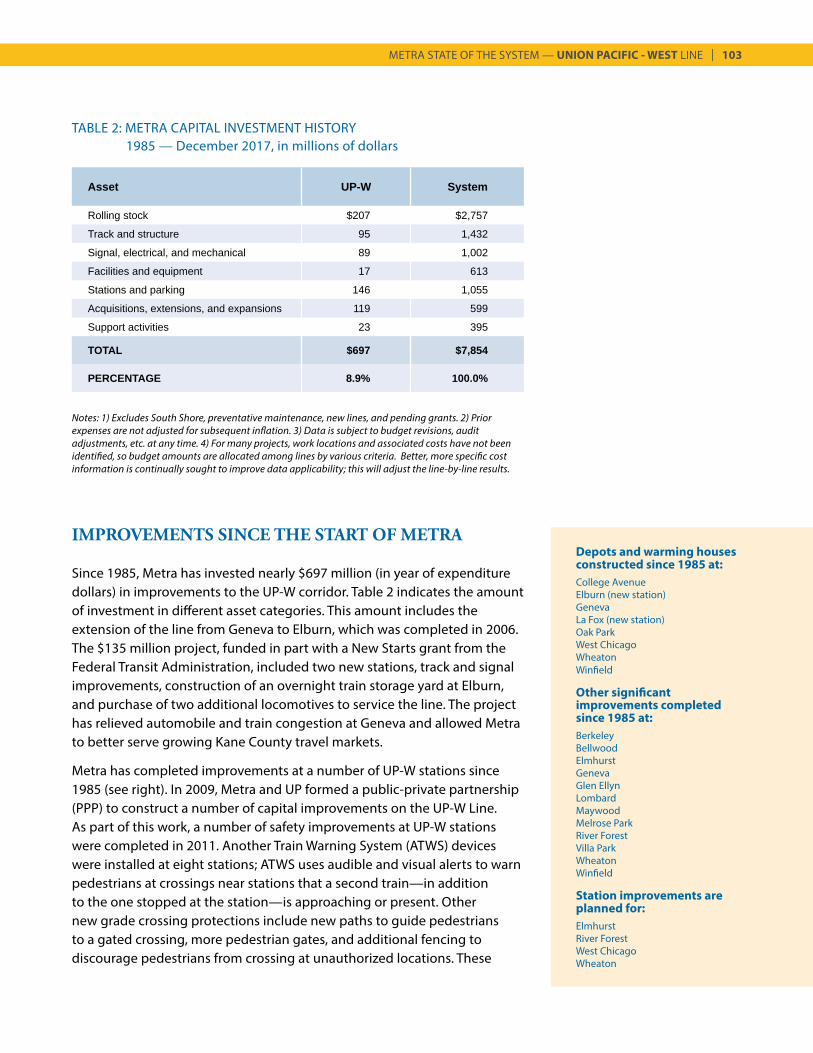
METRA STATE OF THE SYSTEM — UNION PACIFIC - WEST LINE | 103
IMPROVEMENTS SINCE THE START OF METRA
Since 1985, Metra has invested nearly $697 million (in year of expenditure dollars) in improvements to the UP-W corridor. Table 2 indicates the amount of investment in different asset categories. This amount includes the extension of the line from Geneva to Elburn, which was completed in 2006. The $135 million project, funded in part with a New Starts grant from the Federal Transit Administration, included two new stations, track and signal improvements, construction of an overnight train storage yard at Elburn, and purchase of two additional locomotives to service the line. The project has relieved automobile and train congestion at Geneva and allowed Metra to better serve growing Kane County travel markets.
Metra has completed improvements at a number of UP-W stations since 1985 (see right). In 2009, Metra and UP formed a public-private partnership (PPP) to construct a number of capital improvements on the UP-W Line. As part of this work, a number of safety improvements at UP-W stations were completed in 2011. Another Train Warning System (ATWS) devices were installed at eight stations; ATWS uses audible and visual alerts to warn pedestrians at crossings near stations that a second train—in addition to the one stopped at the station—is approaching or present. Other new grade crossing protections include new paths to guide pedestrians to a gated crossing, more pedestrian gates, and additional fencing to discourage pedestrians from crossing at unauthorized locations. These
TABLE 2: METRA CAPITAL INVESTMENT HISTORY 1985 — December 2017, in millions of dollars
Asset UP-W System
Rolling stock $207 $2,757
Track and structure 95 1,432
Signal, electrical, and mechanical 89 1,002
Facilities and equipment 17 613
Stations and parking 146 1,055
Acquisitions, extensions, and expansions 119 599
Support activities 23 395
TOTAL $697 $7,854
PERCENTAGE 8.9% 100.0%
Depots and warming houses constructed since 1985 at:College AvenueElburn (new station)GenevaLa Fox (new station)Oak ParkWest ChicagoWheatonWinfield
Other significant improvements completed since 1985 at:BerkeleyBellwoodElmhurstGenevaGlen EllynLombardMaywoodMelrose ParkRiver ForestVilla ParkWheatonWinfield
Station improvements are planned for:ElmhurstRiver ForestWest ChicagoWheaton
Notes: 1) Excludes South Shore, preventative maintenance, new lines, and pending grants. 2) Prior expenses are not adjusted for subsequent inflation. 3) Data is subject to budget revisions, audit adjustments, etc. at any time. 4) For many projects, work locations and associated costs have not been identified, so budget amounts are allocated among lines by various criteria. Better, more specific cost information is continually sought to improve data applicability; this will adjust the line-by-line results.
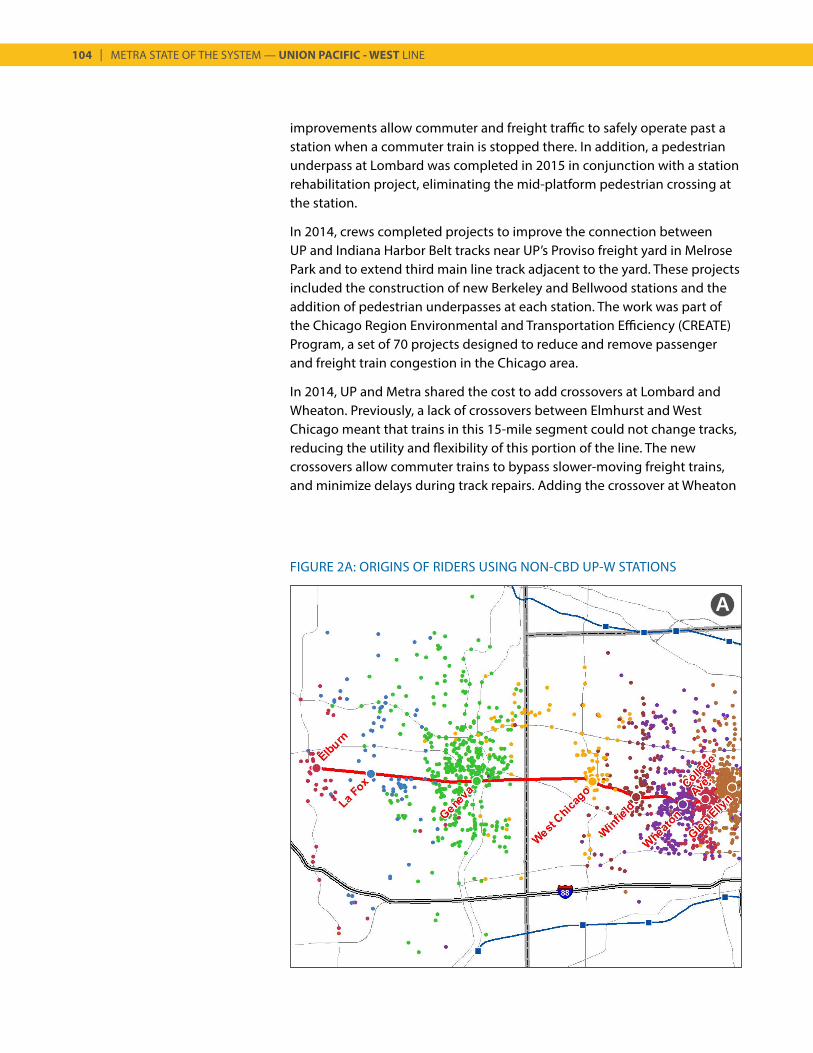
104 | METRA STATE OF THE SYSTEM — UNION PACIFIC - WEST LINE
A
FIGURE 2A: ORIGINS OF RIDERS USING NON-CBD UP-W STATIONS
improvements allow commuter and freight traffic to safely operate past a station when a commuter train is stopped there. In addition, a pedestrian underpass at Lombard was completed in 2015 in conjunction with a station rehabilitation project, eliminating the mid-platform pedestrian crossing at the station.
In 2014, crews completed projects to improve the connection between UP and Indiana Harbor Belt tracks near UP’s Proviso freight yard in Melrose Park and to extend third main line track adjacent to the yard. These projects included the construction of new Berkeley and Bellwood stations and the addition of pedestrian underpasses at each station. The work was part of the Chicago Region Environmental and Transportation Efficiency (CREATE) Program, a set of 70 projects designed to reduce and remove passenger and freight train congestion in the Chicago area.
In 2014, UP and Metra shared the cost to add crossovers at Lombard and Wheaton. Previously, a lack of crossovers between Elmhurst and West Chicago meant that trains in this 15-mile segment could not change tracks, reducing the utility and flexibility of this portion of the line. The new crossovers allow commuter trains to bypass slower-moving freight trains, and minimize delays during track repairs. Adding the crossover at Wheaton
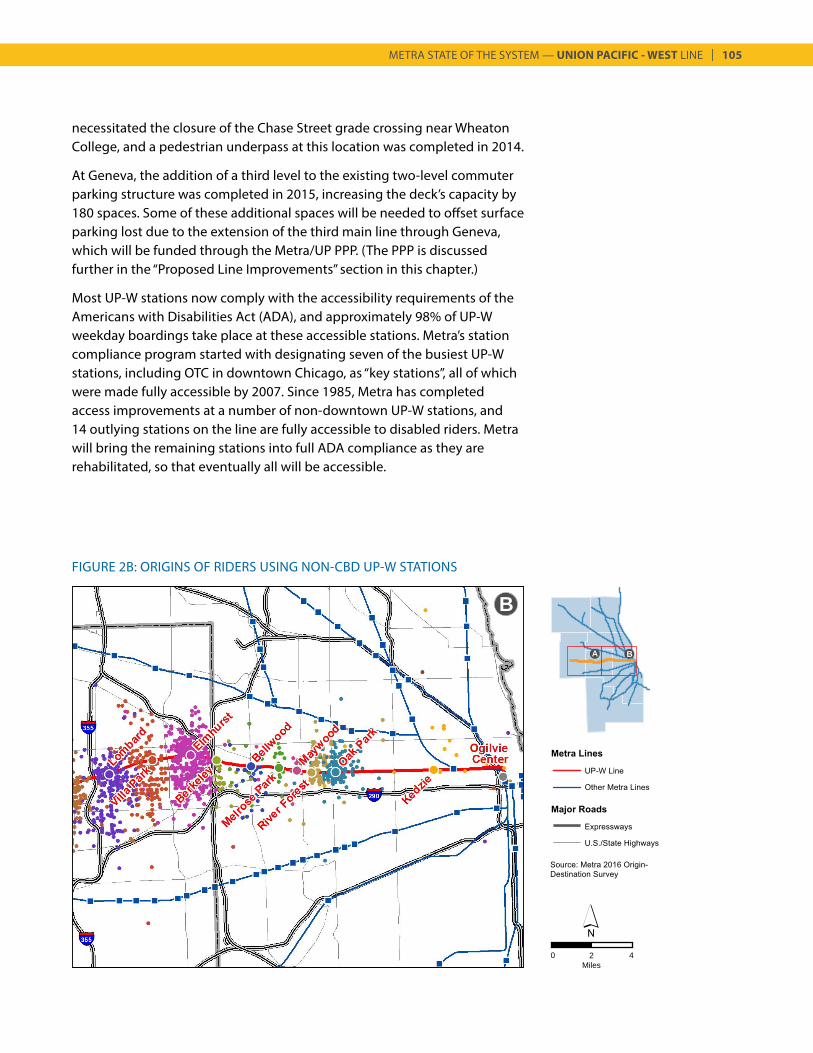
METRA STATE OF THE SYSTEM — UNION PACIFIC - WEST LINE | 105
necessitated the closure of the Chase Street grade crossing near Wheaton College, and a pedestrian underpass at this location was completed in 2014.
At Geneva, the addition of a third level to the existing two-level commuter parking structure was completed in 2015, increasing the deck’s capacity by 180 spaces. Some of these additional spaces will be needed to offset surface parking lost due to the extension of the third main line through Geneva, which will be funded through the Metra/UP PPP. (The PPP is discussed further in the “Proposed Line Improvements” section in this chapter.)
Most UP-W stations now comply with the accessibility requirements of the Americans with Disabilities Act (ADA), and approximately 98% of UP-W weekday boardings take place at these accessible stations. Metra’s station compliance program started with designating seven of the busiest UP-W stations, including OTC in downtown Chicago, as “key stations”, all of which were made fully accessible by 2007. Since 1985, Metra has completed access improvements at a number of non-downtown UP-W stations, and 14 outlying stations on the line are fully accessible to disabled riders. Metra will bring the remaining stations into full ADA compliance as they are rehabilitated, so that eventually all will be accessible.
FIGURE 2B: ORIGINS OF RIDERS USING NON-CBD UP-W STATIONS
B
A B
0 2Miles
4
106 | METRA STATE OF THE SYSTEM — UNION PACIFIC - WEST LINE
PRESENT AND FUTURE DEMAND
In 2016, nearly 27,400 boardings took place each weekday on the UP-W, with 82% of boardings occurring on peak-period, peak-direction trains. On the UP-W, ridership has increased 23% since 1983 (see Table 1c). Ridership gains are most significant at stations near the eastern and western ends of the line, while ridership has decreased at eight of the ten stations between Maywood and Wheaton. This decrease could be attributed to the expanding suburban job market, with many workers shifting from the Central Business District (CBD) to suburb-to-suburb commutes.
At the three westernmost stations built before 2005 (Winfield, West Chicago, and Geneva) boardings increased 73% between 1983 and 2014, which reflects the population and employment growth that has taken place in this area. Ridership increased 185% in the same time period at the Oak Park and River Forest Stations, an example of the significant ridership growth that has been experienced at many of Metra’s stations close to the CBD. Overall passenger ridership on the UP-W totaled 8.3 million in 2017.
Currently, approximately 8,000 parking spaces serve UP-W riders. According to parking counts conducted in 2017, the average rate of utilization at all stations on the line is 86%. At nine stations, effective parking utilization exceeds 85%, the threshold used by Metra to determine if a station is in need of additional parking.
A number of indicators suggest that demand for commuter rail service will continue to rise in the UP-W corridor, as shown in Tables 3, 4, and 5. The corridor has been growing rapidly in recent decades, and demographic forecasts anticipate continued growth in population and employment. The Chicago Metropolitan Agency for Planning (CMAP) forecasts that the UP-W corridor will attract nearly 160,000 new residents between 2010 and 2040, a 20% increase. Population growth is expected to be most significant near the outer end of the UP-W corridor in eastern Kane County. Population in Geneva’s station marketshed is expected to increase 36% from 2010 to 2040 and population in the La Fox and Elburn marketsheds is expected to increase 35% during the same period (see Table 3).
Similarly, the greatest gains in suburban employment on the UP-W corridor, in terms of percentage and absolute numbers, are expected to occur in the marketsheds from Geneva west. CMAP forecasts a 242% increase in employment in the La Fox and Elburn marketsheds, with an addition of 17,200 jobs. Employment growth of 64%, representing over 35,000 jobs, is projected for the Geneva marketshed. Along the entire corridor, over 190,000 jobs are projected to be added, a 33% rise.
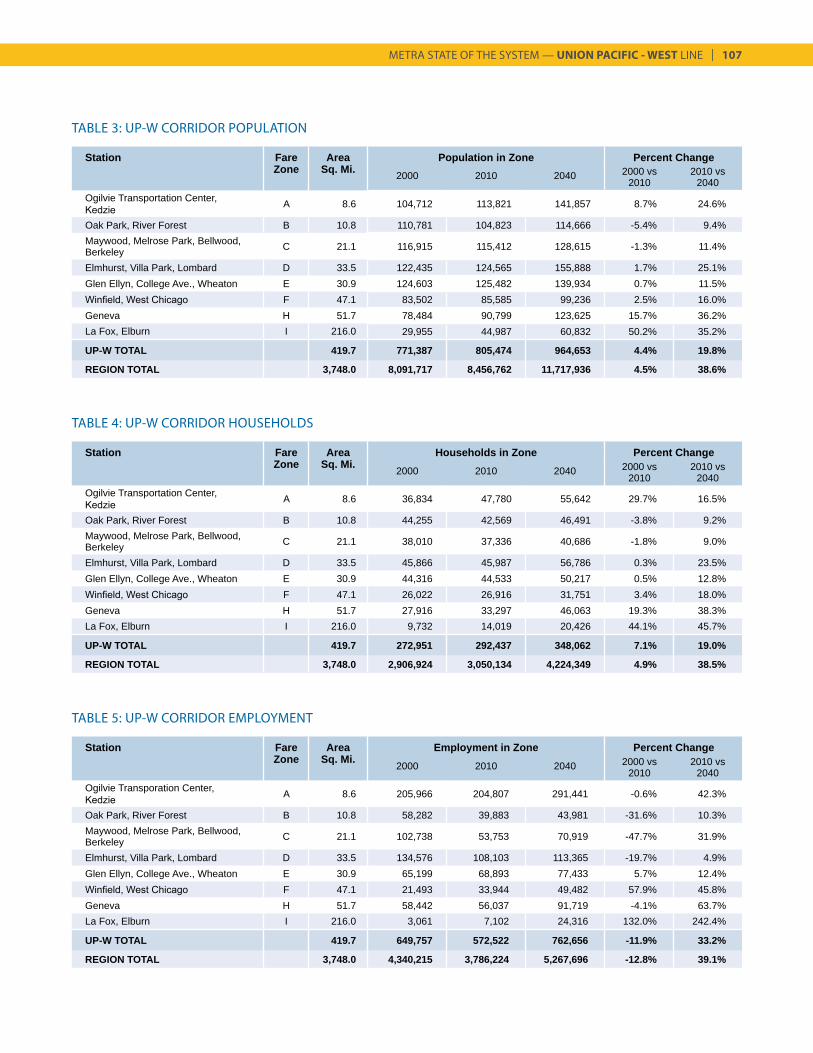
METRA STATE OF THE SYSTEM — UNION PACIFIC - WEST LINE | 107
TABLE 3: UP-W CORRIDOR POPULATION
Station Fare Area Employment in Zone Percent ChangeZone Sq. Mi. 2000 2010 2040 2000 vs
20102010 vs
2040Ogilvie Transporation Center, Kedzie A 8.6 205,966 204,807 291,441 -0.6% 42.3%
Oak Park, River Forest B 10.8 58,282 39,883 43,981 -31.6% 10.3%Maywood, Melrose Park, Bellwood, Berkeley C 21.1 102,738 53,753 70,919 -47.7% 31.9%
Elmhurst, Villa Park, Lombard D 33.5 134,576 108,103 113,365 -19.7% 4.9%Glen Ellyn, College Ave., Wheaton E 30.9 65,199 68,893 77,433 5.7% 12.4%Winfield, West Chicago F 47.1 21,493 33,944 49,482 57.9% 45.8%Geneva H 51.7 58,442 56,037 91,719 -4.1% 63.7%La Fox, Elburn I 216.0 3,061 7,102 24,316 132.0% 242.4%
UP-W TOTAL 419.7 649,757 572,522 762,656 -11.9% 33.2%
REGION TOTAL 3,748.0 4,340,215 3,786,224 5,267,696 -12.8% 39.1%
Station Fare Area Population in Zone Percent ChangeZone Sq. Mi. 2000 2010 2040 2000 vs
20102010 vs
2040Ogilvie Transportation Center, Kedzie A 8.6 104,712 113,821 141,857 8.7% 24.6%
Oak Park, River Forest B 10.8 110,781 104,823 114,666 -5.4% 9.4%Maywood, Melrose Park, Bellwood, Berkeley C 21.1 116,915 115,412 128,615 -1.3% 11.4%
Elmhurst, Villa Park, Lombard D 33.5 122,435 124,565 155,888 1.7% 25.1%Glen Ellyn, College Ave., Wheaton E 30.9 124,603 125,482 139,934 0.7% 11.5%Winfield, West Chicago F 47.1 83,502 85,585 99,236 2.5% 16.0%Geneva H 51.7 78,484 90,799 123,625 15.7% 36.2%La Fox, Elburn I 216.0 29,955 44,987 60,832 50.2% 35.2%
UP-W TOTAL 419.7 771,387 805,474 964,653 4.4% 19.8%
REGION TOTAL 3,748.0 8,091,717 8,456,762 11,717,936 4.5% 38.6%
TABLE 5: UP-W CORRIDOR EMPLOYMENT
Station Fare Area Households in Zone Percent ChangeZone Sq. Mi. 2000 2010 2040 2000 vs
20102010 vs
2040Ogilvie Transportation Center, Kedzie A 8.6 36,834 47,780 55,642 29.7% 16.5%
Oak Park, River Forest B 10.8 44,255 42,569 46,491 -3.8% 9.2%Maywood, Melrose Park, Bellwood, Berkeley C 21.1 38,010 37,336 40,686 -1.8% 9.0%
Elmhurst, Villa Park, Lombard D 33.5 45,866 45,987 56,786 0.3% 23.5%Glen Ellyn, College Ave., Wheaton E 30.9 44,316 44,533 50,217 0.5% 12.8%Winfield, West Chicago F 47.1 26,022 26,916 31,751 3.4% 18.0%Geneva H 51.7 27,916 33,297 46,063 19.3% 38.3%La Fox, Elburn I 216.0 9,732 14,019 20,426 44.1% 45.7%
UP-W TOTAL 419.7 272,951 292,437 348,062 7.1% 19.0%
REGION TOTAL 3,748.0 2,906,924 3,050,134 4,224,349 4.9% 38.5%
TABLE 4: UP-W CORRIDOR HOUSEHOLDS
108 | METRA STATE OF THE SYSTEM — UNION PACIFIC - WEST LINE
REVERSE COMMUTE AND NON-DOWNTOWN MARKETS
Although Metra’s primary market involves commuters who follow the traditional suburb-to-CBD trip pattern, in recent years Metra has seen a demand for city-to-suburb reverse-commute options (Metra’s primary commuter market is discussed in the Central Business District Market chapter). The shift of employment to suburban locations has left many commuters with limited transit accessibility to jobs. Figure 3 shows AM alightings at non-CBD UP-W stations.
Factors that increase reverse-commute trip patterns are the growth of employment in the suburbs as well as the growth of population and households in the city and inner ring suburbs. Significant population and household growth is expected near the CBD and in western UP-W marketsheds, as shown in Tables 3 and 4. In terms of employment, CMAP projects the greatest employment growth to occur in UP-W marketsheds closest to the CBD and near the western end of the UP-W Line (see Table 5). This forecast suggests that some residents living in between may need to commute to job centers elsewhere in the UP-W corridor.
Boardings on UP-W AM peak-period outbound trains decreased by 14 percent between 2006 and 2016, whereas between 2006 and 2014, this market had been increasing by the same amount . The downward trend in reverse commute between 2014 and 2016 will likely switch back to a positive trend with projected employment growth in suburbs served by the UP-W. See Table 6 for a list of major trip generators accessible from the UP-W corridor, including large employers.
PROPOSED LINE IMPROVEMENTS
Two complementary projects are proposed for the UP-W Line in order to improve reliability of passenger and freight operations.
Metra and UP have each committed $45 million for the construction of two segments of new third main line track on the UP-W, from River Forest to Melrose Park, and from West Chicago to Geneva. This work is the final piece of the Metra/UP PPP, and will create continuous triple track from Chicago to Elburn and alleviate conflicts between freight and Metra trains. Construction on the River Forest-to-Melrose Park began in spring 2018 and construction for the West Chicago-to-Geneva portion is expected to start in Fall 2018.
A second set of improvements are required to work in conjunction with the PPP upgrades to facilitate service expansion on the UP-W. These improvements include relocating the A-2 crossing away from coach yard
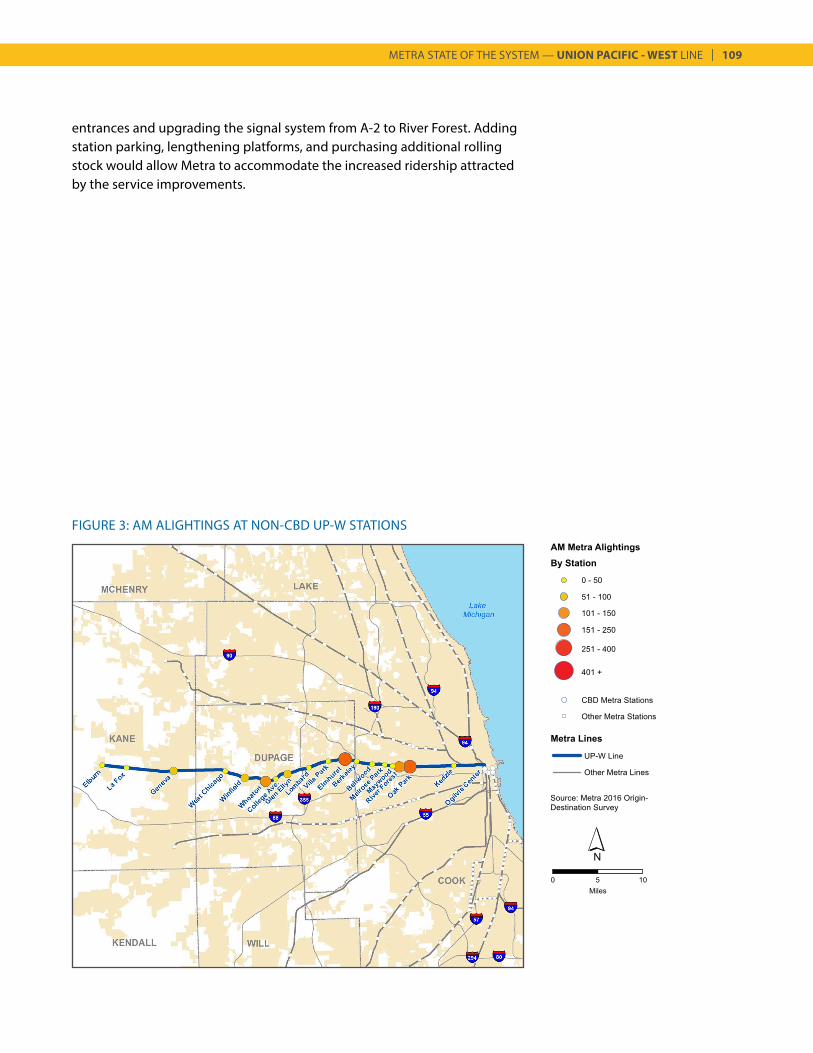
METRA STATE OF THE SYSTEM — UNION PACIFIC - WEST LINE | 109
FIGURE 3: AM ALIGHTINGS AT NON-CBD UP-W STATIONS
entrances and upgrading the signal system from A-2 to River Forest. Adding station parking, lengthening platforms, and purchasing additional rolling stock would allow Metra to accommodate the increased ridership attracted by the service improvements.
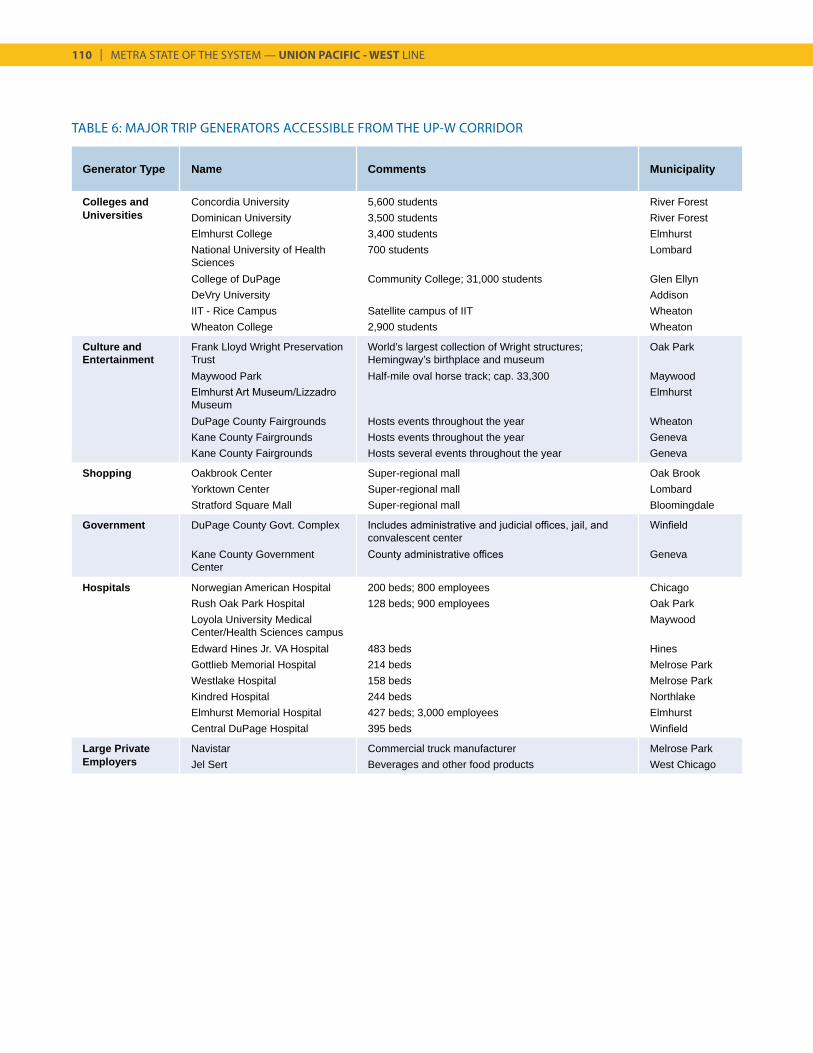
110 | METRA STATE OF THE SYSTEM — UNION PACIFIC - WEST LINE
Generator Type Name Comments Municipality
Colleges and Concordia University 5,600 students River ForestUniversities Dominican University 3,500 students River Forest
Elmhurst College 3,400 students ElmhurstNational University of Health Sciences
700 students Lombard
College of DuPage Community College; 31,000 students Glen EllynDeVry University AddisonIIT - Rice Campus Satellite campus of IIT WheatonWheaton College 2,900 students Wheaton
Culture and Entertainment
Frank Lloyd Wright Preservation Trust
World’s largest collection of Wright structures; Hemingway’s birthplace and museum
Oak Park
Maywood Park Half-mile oval horse track; cap. 33,300 MaywoodElmhurst Art Museum/Lizzadro Museum
Elmhurst
DuPage County Fairgrounds Hosts events throughout the year WheatonKane County Fairgrounds Hosts events throughout the year GenevaKane County Fairgrounds Hosts several events throughout the year Geneva
Shopping Oakbrook Center Super-regional mall Oak BrookYorktown Center Super-regional mall LombardStratford Square Mall Super-regional mall Bloomingdale
Government DuPage County Govt. Complex Includes administrative and judicial offices, jail, and convalescent center
Winfield
Kane County Government Center
County administrative offices Geneva
Hospitals Norwegian American Hospital 200 beds; 800 employees ChicagoRush Oak Park Hospital 128 beds; 900 employees Oak ParkLoyola University Medical Center/Health Sciences campus
Maywood
Edward Hines Jr. VA Hospital 483 beds HinesGottlieb Memorial Hospital 214 beds Melrose ParkWestlake Hospital 158 beds Melrose ParkKindred Hospital 244 beds NorthlakeElmhurst Memorial Hospital 427 beds; 3,000 employees ElmhurstCentral DuPage Hospital 395 beds Winfield
Large Private Navistar Commercial truck manufacturer Melrose ParkEmployers Jel Sert Beverages and other food products West Chicago
TABLE 6: MAJOR TRIP GENERATORS ACCESSIBLE FROM THE UP-W CORRIDOR
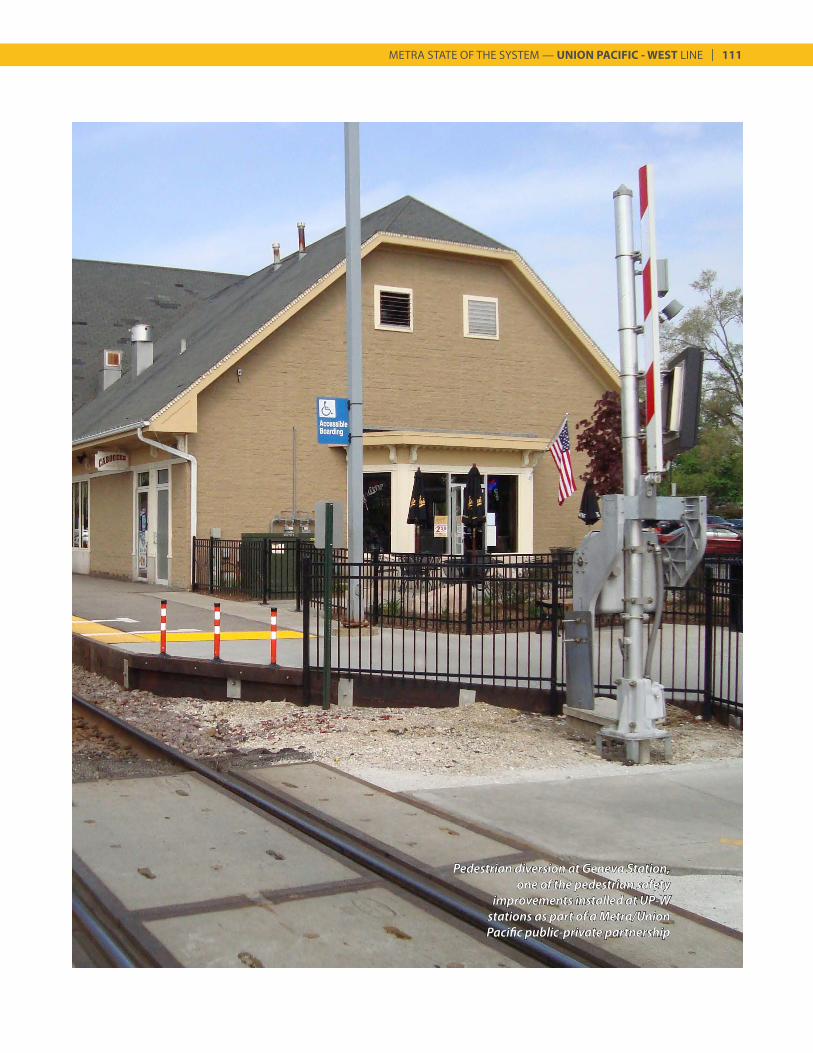
METRA STATE OF THE SYSTEM — UNION PACIFIC - WEST LINE | 111
Pedestrian diversion at Geneva Station,one of the pedestrian safety
improvements installed at UP-W stations as part of a Metra/Union Pacific public-private partnership
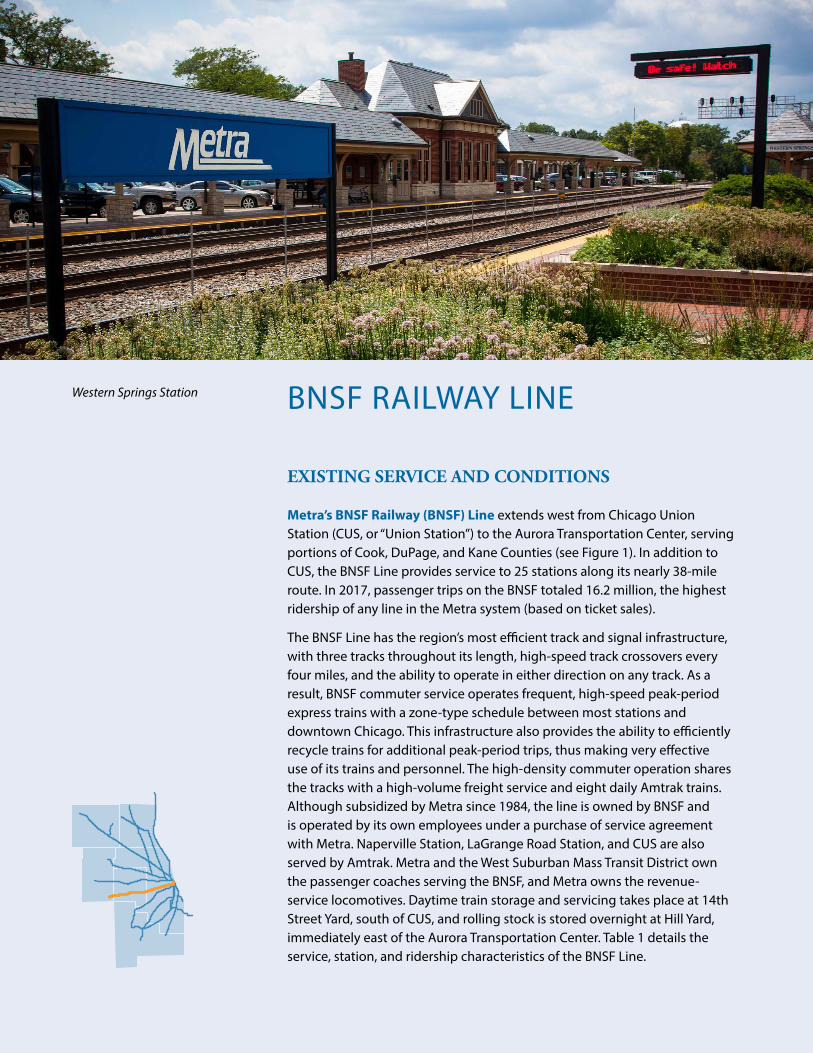
BNSF RAILWAY LINE
EXISTING SERVICE AND CONDITIONS
Metra’s BNSF Railway (BNSF) Line extends west from Chicago Union Station (CUS, or “Union Station”) to the Aurora Transportation Center, serving portions of Cook, DuPage, and Kane Counties (see Figure 1). In addition to CUS, the BNSF Line provides service to 25 stations along its nearly 38-mile route. In 2017, passenger trips on the BNSF totaled 16.2 million, the highest ridership of any line in the Metra system (based on ticket sales).
The BNSF Line has the region’s most efficient track and signal infrastructure, with three tracks throughout its length, high-speed track crossovers every four miles, and the ability to operate in either direction on any track. As a result, BNSF commuter service operates frequent, high-speed peak-period express trains with a zone-type schedule between most stations and downtown Chicago. This infrastructure also provides the ability to efficiently recycle trains for additional peak-period trips, thus making very effective use of its trains and personnel. The high-density commuter operation shares the tracks with a high-volume freight service and eight daily Amtrak trains. Although subsidized by Metra since 1984, the line is owned by BNSF and is operated by its own employees under a purchase of service agreement with Metra. Naperville Station, LaGrange Road Station, and CUS are also served by Amtrak. Metra and the West Suburban Mass Transit District own the passenger coaches serving the BNSF, and Metra owns the revenue-service locomotives. Daytime train storage and servicing takes place at 14th Street Yard, south of CUS, and rolling stock is stored overnight at Hill Yard, immediately east of the Aurora Transportation Center. Table 1 details the service, station, and ridership characteristics of the BNSF Line.
Western Springs Station
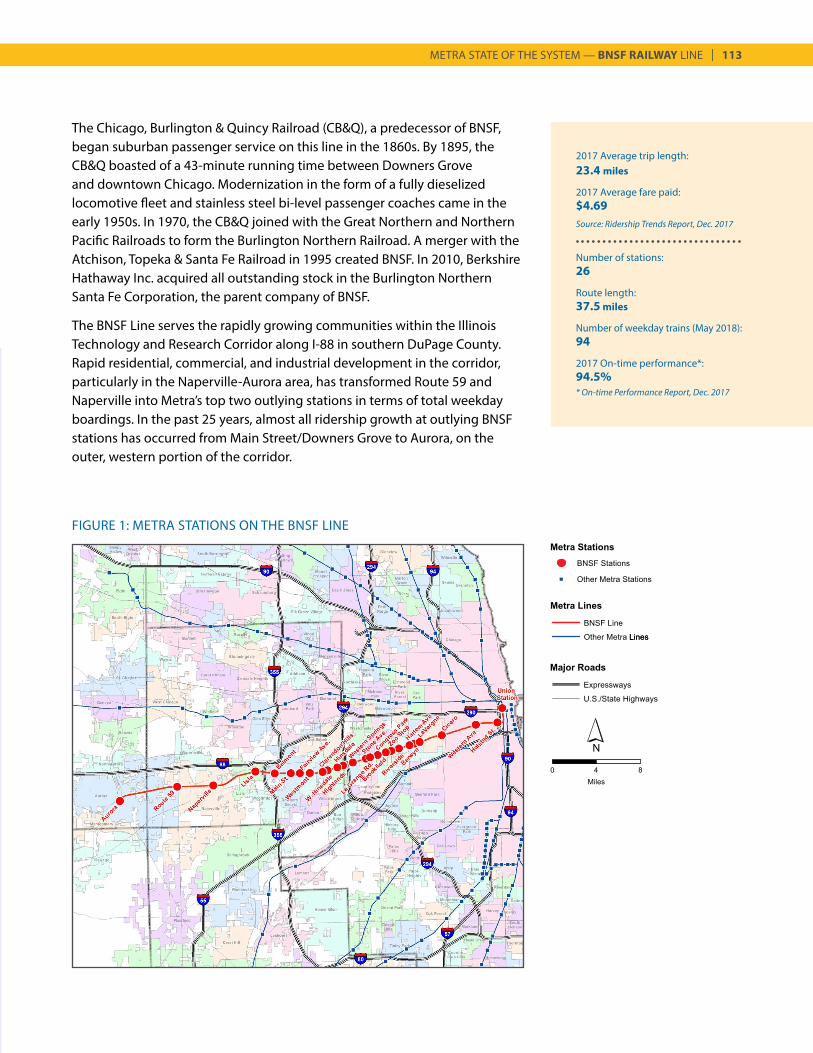
METRA STATE OF THE SYSTEM — BNSF RAILWAY LINE | 113
2017 Average trip length:23.4 miles
2017 Average fare paid:$4.69Source: Ridership Trends Report, Dec. 2017
Number of stations:26
Route length:37.5 miles
Number of weekday trains (May 2018):94
2017 On-time performance*:94.5%* On-time Performance Report, Dec. 2017
FIGURE 1: METRA STATIONS ON THE BNSF LINE
The Chicago, Burlington & Quincy Railroad (CB&Q), a predecessor of BNSF, began suburban passenger service on this line in the 1860s. By 1895, the CB&Q boasted of a 43-minute running time between Downers Grove and downtown Chicago. Modernization in the form of a fully dieselized locomotive fleet and stainless steel bi-level passenger coaches came in the early 1950s. In 1970, the CB&Q joined with the Great Northern and Northern Pacific Railroads to form the Burlington Northern Railroad. A merger with the Atchison, Topeka & Santa Fe Railroad in 1995 created BNSF. In 2010, Berkshire Hathaway Inc. acquired all outstanding stock in the Burlington Northern Santa Fe Corporation, the parent company of BNSF.
The BNSF Line serves the rapidly growing communities within the Illinois Technology and Research Corridor along I-88 in southern DuPage County. Rapid residential, commercial, and industrial development in the corridor, particularly in the Naperville-Aurora area, has transformed Route 59 and Naperville into Metra’s top two outlying stations in terms of total weekday boardings. In the past 25 years, almost all ridership growth at outlying BNSF stations has occurred from Main Street/Downers Grove to Aurora, on the outer, western portion of the corridor.
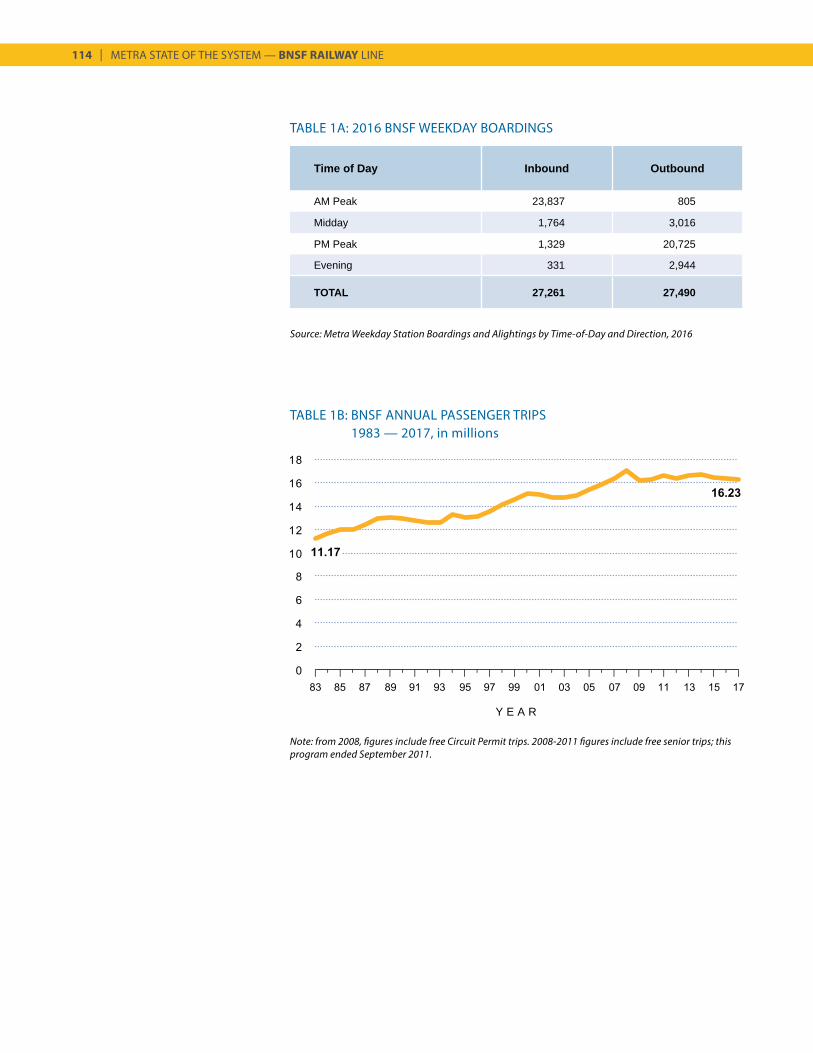
114 | METRA STATE OF THE SYSTEM — BNSF RAILWAY LINE
TABLE 1A: 2016 BNSF WEEKDAY BOARDINGS
TABLE 1B: BNSF ANNUAL PASSENGER TRIPS1983 — 2017, in millions
Y E A R
Time of Day Inbound Outbound
AM Peak 23,837 805
Midday 1,764 3,016
PM Peak 1,329 20,725
Evening 331 2,944
TOTAL 27,261 27,490
Note: from 2008, figures include free Circuit Permit trips. 2008-2011 figures include free senior trips; this program ended September 2011.
Source: Metra Weekday Station Boardings and Alightings by Time-of-Day and Direction, 2016
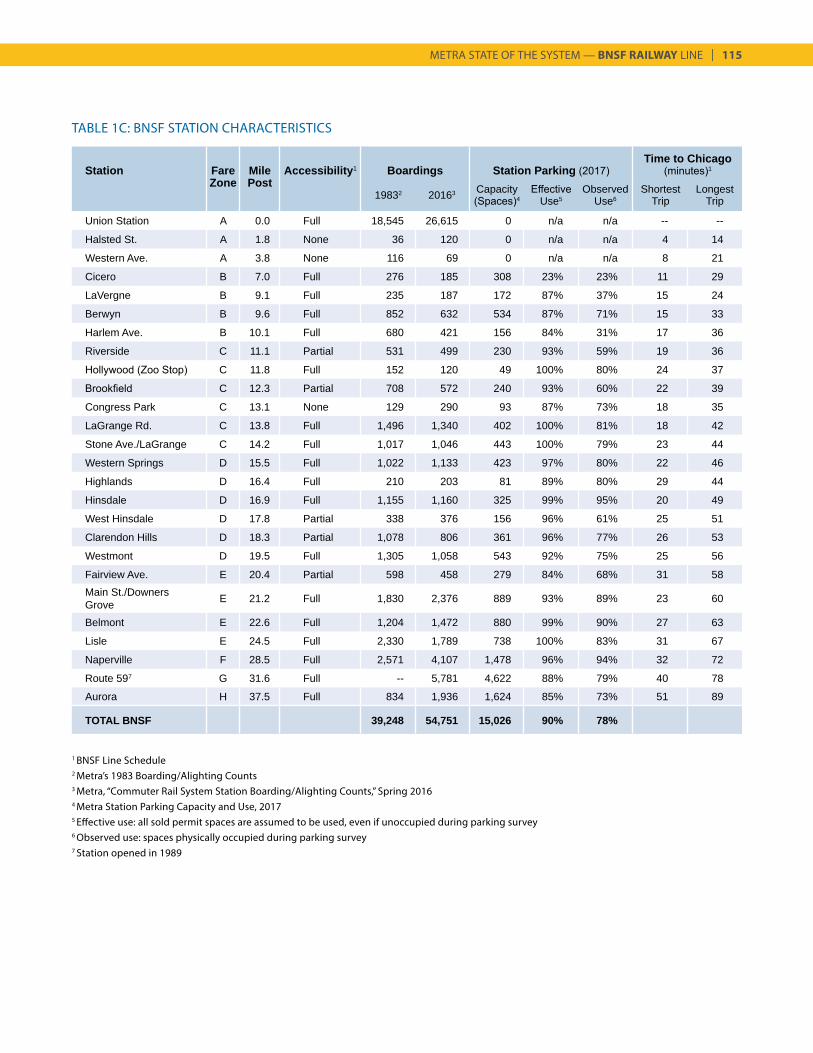
METRA STATE OF THE SYSTEM — BNSF RAILWAY LINE | 115
TABLE 1C: BNSF STATION CHARACTERISTICS
Station Fare Mile Accessibility1 Boardings Station Parking (2017)Time to Chicago
(minutes)1
Zone Post19832 20163 Capacity
(Spaces)4Effective
Use5Observed
Use6Shortest
TripLongest
Trip
Union Station A 0.0 Full 18,545 26,615 0 n/a n/a -- --
Halsted St. A 1.8 None 36 120 0 n/a n/a 4 14
Western Ave. A 3.8 None 116 69 0 n/a n/a 8 21
Cicero B 7.0 Full 276 185 308 23% 23% 11 29
LaVergne B 9.1 Full 235 187 172 87% 37% 15 24
Berwyn B 9.6 Full 852 632 534 87% 71% 15 33
Harlem Ave. B 10.1 Full 680 421 156 84% 31% 17 36
Riverside C 11.1 Partial 531 499 230 93% 59% 19 36
Hollywood (Zoo Stop) C 11.8 Full 152 120 49 100% 80% 24 37
Brookfield C 12.3 Partial 708 572 240 93% 60% 22 39
Congress Park C 13.1 None 129 290 93 87% 73% 18 35
LaGrange Rd. C 13.8 Full 1,496 1,340 402 100% 81% 18 42
Stone Ave./LaGrange C 14.2 Full 1,017 1,046 443 100% 79% 23 44
Western Springs D 15.5 Full 1,022 1,133 423 97% 80% 22 46
Highlands D 16.4 Full 210 203 81 89% 80% 29 44
Hinsdale D 16.9 Full 1,155 1,160 325 99% 95% 20 49
West Hinsdale D 17.8 Partial 338 376 156 96% 61% 25 51
Clarendon Hills D 18.3 Partial 1,078 806 361 96% 77% 26 53
Westmont D 19.5 Full 1,305 1,058 543 92% 75% 25 56
Fairview Ave. E 20.4 Partial 598 458 279 84% 68% 31 58Main St./Downers Grove E 21.2 Full 1,830 2,376 889 93% 89% 23 60
Belmont E 22.6 Full 1,204 1,472 880 99% 90% 27 63
Lisle E 24.5 Full 2,330 1,789 738 100% 83% 31 67
Naperville F 28.5 Full 2,571 4,107 1,478 96% 94% 32 72
Route 597 G 31.6 Full -- 5,781 4,622 88% 79% 40 78
Aurora H 37.5 Full 834 1,936 1,624 85% 73% 51 89
TOTAL BNSF 39,248 54,751 15,026 90% 78%
1 BNSF Line Schedule2 Metra’s 1983 Boarding/Alighting Counts3 Metra, “Commuter Rail System Station Boarding/Alighting Counts,” Spring 20164 Metra Station Parking Capacity and Use, 20175 Effective use: all sold permit spaces are assumed to be used, even if unoccupied during parking survey6 Observed use: spaces physically occupied during parking survey7 Station opened in 1989
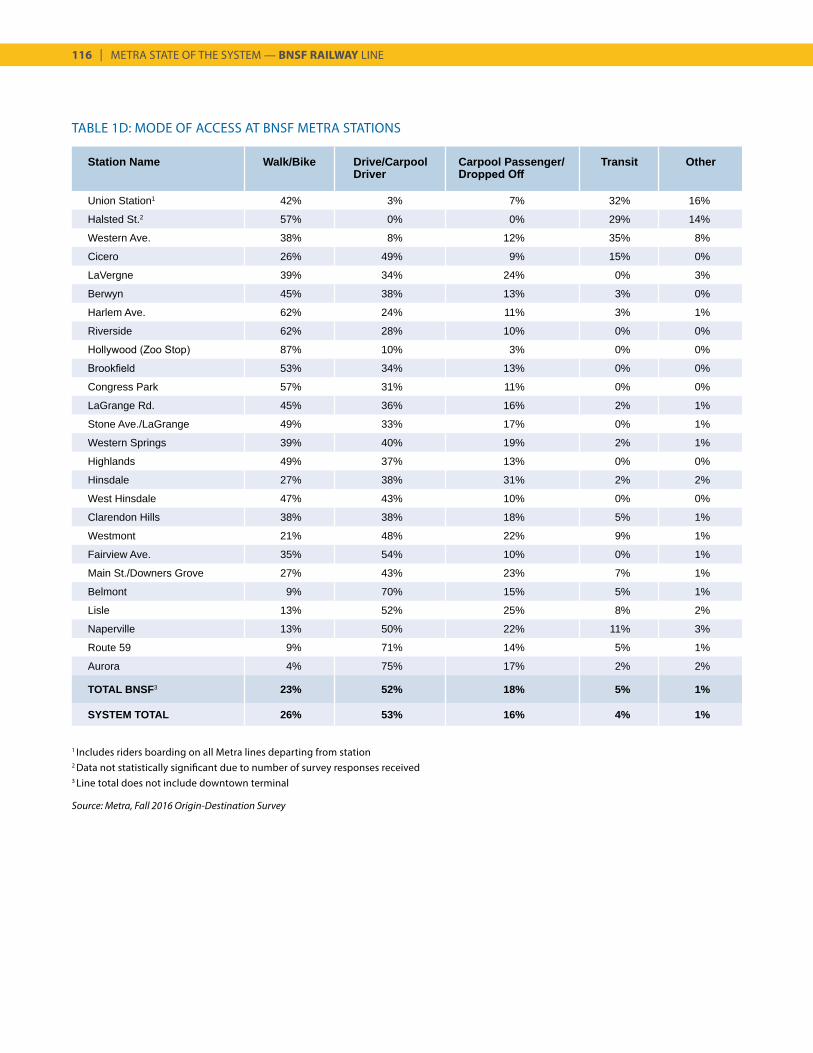
116 | METRA STATE OF THE SYSTEM — BNSF RAILWAY LINE
TABLE 1D: MODE OF ACCESS AT BNSF METRA STATIONS
Station Name Walk/Bike Drive/Carpool Driver
Carpool Passenger/ Dropped Off
Transit Other
Union Station1 42% 3% 7% 32% 16%
Halsted St.2 57% 0% 0% 29% 14%
Western Ave. 38% 8% 12% 35% 8%
Cicero 26% 49% 9% 15% 0%
LaVergne 39% 34% 24% 0% 3%
Berwyn 45% 38% 13% 3% 0%
Harlem Ave. 62% 24% 11% 3% 1%
Riverside 62% 28% 10% 0% 0%
Hollywood (Zoo Stop) 87% 10% 3% 0% 0%
Brookfield 53% 34% 13% 0% 0%
Congress Park 57% 31% 11% 0% 0%
LaGrange Rd. 45% 36% 16% 2% 1%
Stone Ave./LaGrange 49% 33% 17% 0% 1%
Western Springs 39% 40% 19% 2% 1%
Highlands 49% 37% 13% 0% 0%
Hinsdale 27% 38% 31% 2% 2%
West Hinsdale 47% 43% 10% 0% 0%
Clarendon Hills 38% 38% 18% 5% 1%
Westmont 21% 48% 22% 9% 1%
Fairview Ave. 35% 54% 10% 0% 1%
Main St./Downers Grove 27% 43% 23% 7% 1%
Belmont 9% 70% 15% 5% 1%
Lisle 13% 52% 25% 8% 2%
Naperville 13% 50% 22% 11% 3%
Route 59 9% 71% 14% 5% 1%
Aurora 4% 75% 17% 2% 2%
TOTAL BNSF3 23% 52% 18% 5% 1%
SYSTEM TOTAL 26% 53% 16% 4% 1%
1 Includes riders boarding on all Metra lines departing from station2 Data not statistically significant due to number of survey responses received3 Line total does not include downtown terminal
Source: Metra, Fall 2016 Origin-Destination Survey
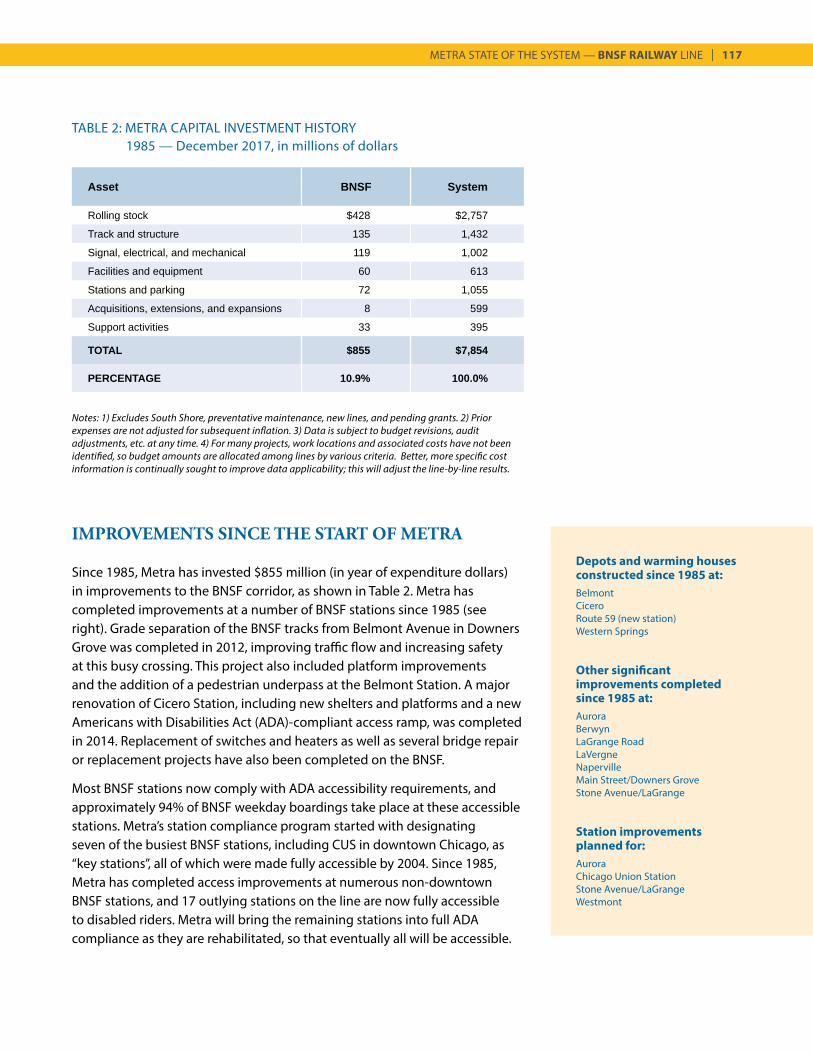
METRA STATE OF THE SYSTEM — BNSF RAILWAY LINE | 117
IMPROVEMENTS SINCE THE START OF METRA
Since 1985, Metra has invested $855 million (in year of expenditure dollars) in improvements to the BNSF corridor, as shown in Table 2. Metra has completed improvements at a number of BNSF stations since 1985 (see right). Grade separation of the BNSF tracks from Belmont Avenue in Downers Grove was completed in 2012, improving traffic flow and increasing safety at this busy crossing. This project also included platform improvements and the addition of a pedestrian underpass at the Belmont Station. A major renovation of Cicero Station, including new shelters and platforms and a new Americans with Disabilities Act (ADA)-compliant access ramp, was completed in 2014. Replacement of switches and heaters as well as several bridge repair or replacement projects have also been completed on the BNSF.
Most BNSF stations now comply with ADA accessibility requirements, and approximately 94% of BNSF weekday boardings take place at these accessible stations. Metra’s station compliance program started with designating seven of the busiest BNSF stations, including CUS in downtown Chicago, as “key stations”, all of which were made fully accessible by 2004. Since 1985, Metra has completed access improvements at numerous non-downtown BNSF stations, and 17 outlying stations on the line are now fully accessible to disabled riders. Metra will bring the remaining stations into full ADA compliance as they are rehabilitated, so that eventually all will be accessible.
TABLE 2: METRA CAPITAL INVESTMENT HISTORY 1985 — December 2017, in millions of dollars
Asset BNSF System
Rolling stock $428 $2,757
Track and structure 135 1,432
Signal, electrical, and mechanical 119 1,002
Facilities and equipment 60 613
Stations and parking 72 1,055
Acquisitions, extensions, and expansions 8 599
Support activities 33 395
TOTAL $855 $7,854
PERCENTAGE 10.9% 100.0%
Depots and warming houses constructed since 1985 at:BelmontCiceroRoute 59 (new station)Western Springs
Other significant improvements completed since 1985 at:AuroraBerwynLaGrange RoadLaVergneNapervilleMain Street/Downers GroveStone Avenue/LaGrange
Station improvements planned for:AuroraChicago Union StationStone Avenue/LaGrangeWestmont
Notes: 1) Excludes South Shore, preventative maintenance, new lines, and pending grants. 2) Prior expenses are not adjusted for subsequent inflation. 3) Data is subject to budget revisions, audit adjustments, etc. at any time. 4) For many projects, work locations and associated costs have not been identified, so budget amounts are allocated among lines by various criteria. Better, more specific cost information is continually sought to improve data applicability; this will adjust the line-by-line results.
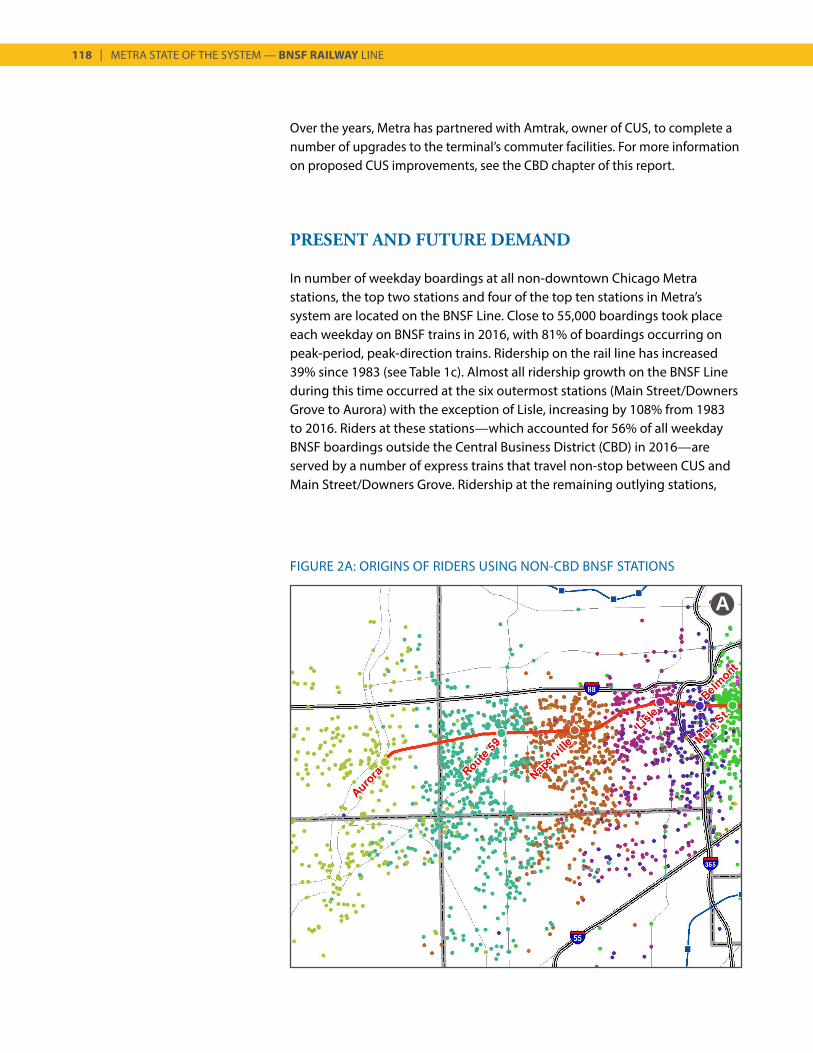
118 | METRA STATE OF THE SYSTEM — BNSF RAILWAY LINE
Over the years, Metra has partnered with Amtrak, owner of CUS, to complete a number of upgrades to the terminal’s commuter facilities. For more information on proposed CUS improvements, see the CBD chapter of this report.
PRESENT AND FUTURE DEMAND
In number of weekday boardings at all non-downtown Chicago Metra stations, the top two stations and four of the top ten stations in Metra’s system are located on the BNSF Line. Close to 55,000 boardings took place each weekday on BNSF trains in 2016, with 81% of boardings occurring on peak-period, peak-direction trains. Ridership on the rail line has increased 39% since 1983 (see Table 1c). Almost all ridership growth on the BNSF Line during this time occurred at the six outermost stations (Main Street/Downers Grove to Aurora) with the exception of Lisle, increasing by 108% from 1983 to 2016. Riders at these stations—which accounted for 56% of all weekday BNSF boardings outside the Central Business District (CBD) in 2016—are served by a number of express trains that travel non-stop between CUS and Main Street/Downers Grove. Ridership at the remaining outlying stations,
A
FIGURE 2A: ORIGINS OF RIDERS USING NON-CBD BNSF STATIONS
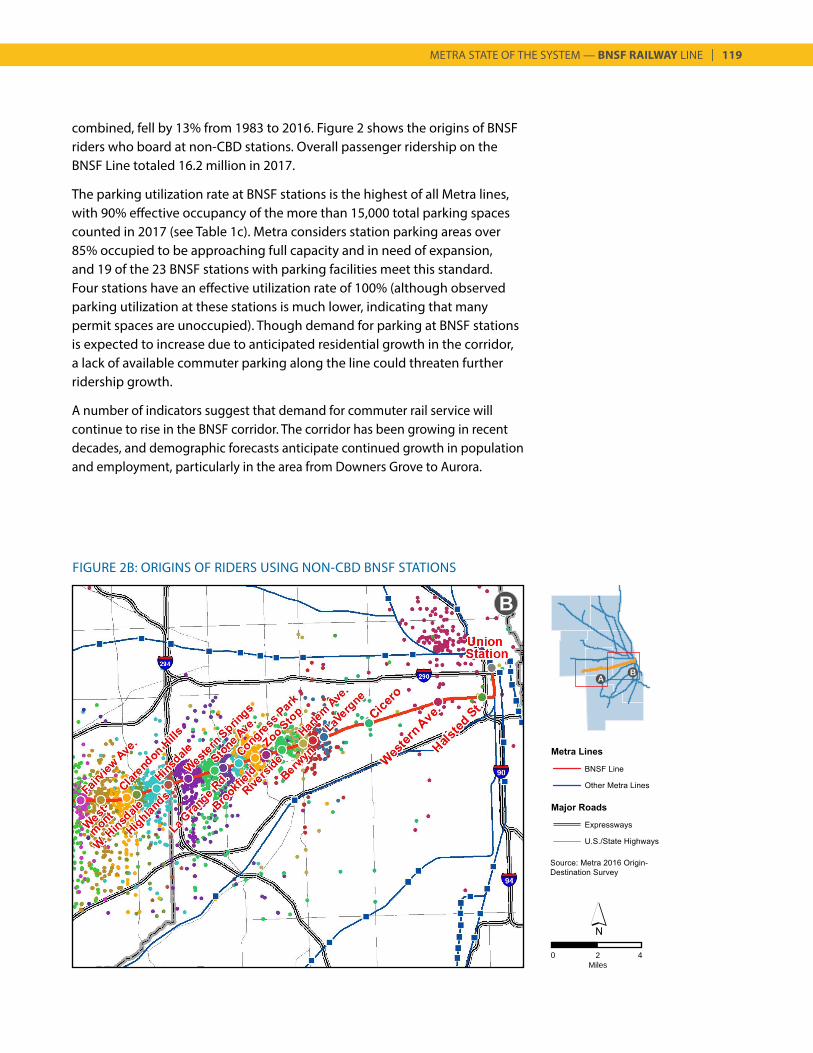
METRA STATE OF THE SYSTEM — BNSF RAILWAY LINE | 119
0 2Miles
4
combined, fell by 13% from 1983 to 2016. Figure 2 shows the origins of BNSF riders who board at non-CBD stations. Overall passenger ridership on the BNSF Line totaled 16.2 million in 2017.
The parking utilization rate at BNSF stations is the highest of all Metra lines, with 90% effective occupancy of the more than 15,000 total parking spaces counted in 2017 (see Table 1c). Metra considers station parking areas over 85% occupied to be approaching full capacity and in need of expansion, and 19 of the 23 BNSF stations with parking facilities meet this standard. Four stations have an effective utilization rate of 100% (although observed parking utilization at these stations is much lower, indicating that many permit spaces are unoccupied). Though demand for parking at BNSF stations is expected to increase due to anticipated residential growth in the corridor, a lack of available commuter parking along the line could threaten further ridership growth.
A number of indicators suggest that demand for commuter rail service will continue to rise in the BNSF corridor. The corridor has been growing in recent decades, and demographic forecasts anticipate continued growth in population and employment, particularly in the area from Downers Grove to Aurora.
FIGURE 2B: ORIGINS OF RIDERS USING NON-CBD BNSF STATIONS
B
AB
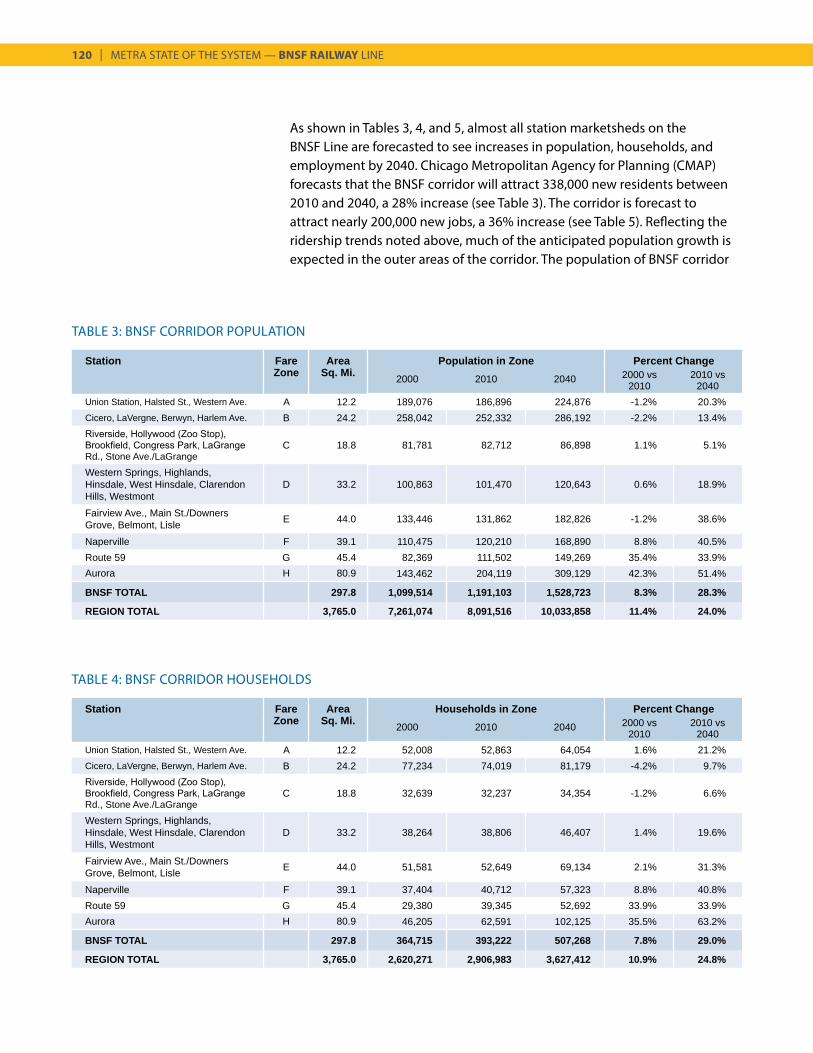
120 | METRA STATE OF THE SYSTEM — BNSF RAILWAY LINE
TABLE 3: BNSF CORRIDOR POPULATION
Station Fare Area Population in Zone Percent ChangeZone Sq. Mi. 2000 2010 2040 2000 vs
20102010 vs
2040Union Station, Halsted St., Western Ave. A 12.2 189,076 186,896 224,876 -1.2% 20.3%Cicero, LaVergne, Berwyn, Harlem Ave. B 24.2 258,042 252,332 286,192 -2.2% 13.4%Riverside, Hollywood (Zoo Stop), Brookfield, Congress Park, LaGrange Rd., Stone Ave./LaGrange
C 18.8 81,781 82,712 86,898 1.1% 5.1%
Western Springs, Highlands, Hinsdale, West Hinsdale, Clarendon Hills, Westmont
D 33.2 100,863 101,470 120,643 0.6% 18.9%
Fairview Ave., Main St./Downers Grove, Belmont, Lisle E 44.0 133,446 131,862 182,826 -1.2% 38.6%
Naperville F 39.1 110,475 120,210 168,890 8.8% 40.5%Route 59 G 45.4 82,369 111,502 149,269 35.4% 33.9%Aurora H 80.9 143,462 204,119 309,129 42.3% 51.4%
BNSF TOTAL 297.8 1,099,514 1,191,103 1,528,723 8.3% 28.3%
REGION TOTAL 3,765.0 7,261,074 8,091,516 10,033,858 11.4% 24.0%
Station Fare Area Households in Zone Percent ChangeZone Sq. Mi. 2000 2010 2040 2000 vs
20102010 vs
2040Union Station, Halsted St., Western Ave. A 12.2 52,008 52,863 64,054 1.6% 21.2%Cicero, LaVergne, Berwyn, Harlem Ave. B 24.2 77,234 74,019 81,179 -4.2% 9.7%Riverside, Hollywood (Zoo Stop), Brookfield, Congress Park, LaGrange Rd., Stone Ave./LaGrange
C 18.8 32,639 32,237 34,354 -1.2% 6.6%
Western Springs, Highlands, Hinsdale, West Hinsdale, Clarendon Hills, Westmont
D 33.2 38,264 38,806 46,407 1.4% 19.6%
Fairview Ave., Main St./Downers Grove, Belmont, Lisle E 44.0 51,581 52,649 69,134 2.1% 31.3%
Naperville F 39.1 37,404 40,712 57,323 8.8% 40.8%Route 59 G 45.4 29,380 39,345 52,692 33.9% 33.9%Aurora H 80.9 46,205 62,591 102,125 35.5% 63.2%
BNSF TOTAL 297.8 364,715 393,222 507,268 7.8% 29.0%
REGION TOTAL 3,765.0 2,620,271 2,906,983 3,627,412 10.9% 24.8%
TABLE 4: BNSF CORRIDOR HOUSEHOLDS
As shown in Tables 3, 4, and 5, almost all station marketsheds on the BNSF Line are forecasted to see increases in population, households, and employment by 2040. Chicago Metropolitan Agency for Planning (CMAP) forecasts that the BNSF corridor will attract 338,000 new residents between 2010 and 2040, a 28% increase (see Table 3). The corridor is forecast to attract nearly 200,000 new jobs, a 36% increase (see Table 5). Reflecting the ridership trends noted above, much of the anticipated population growth is expected in the outer areas of the corridor. The population of BNSF corridor
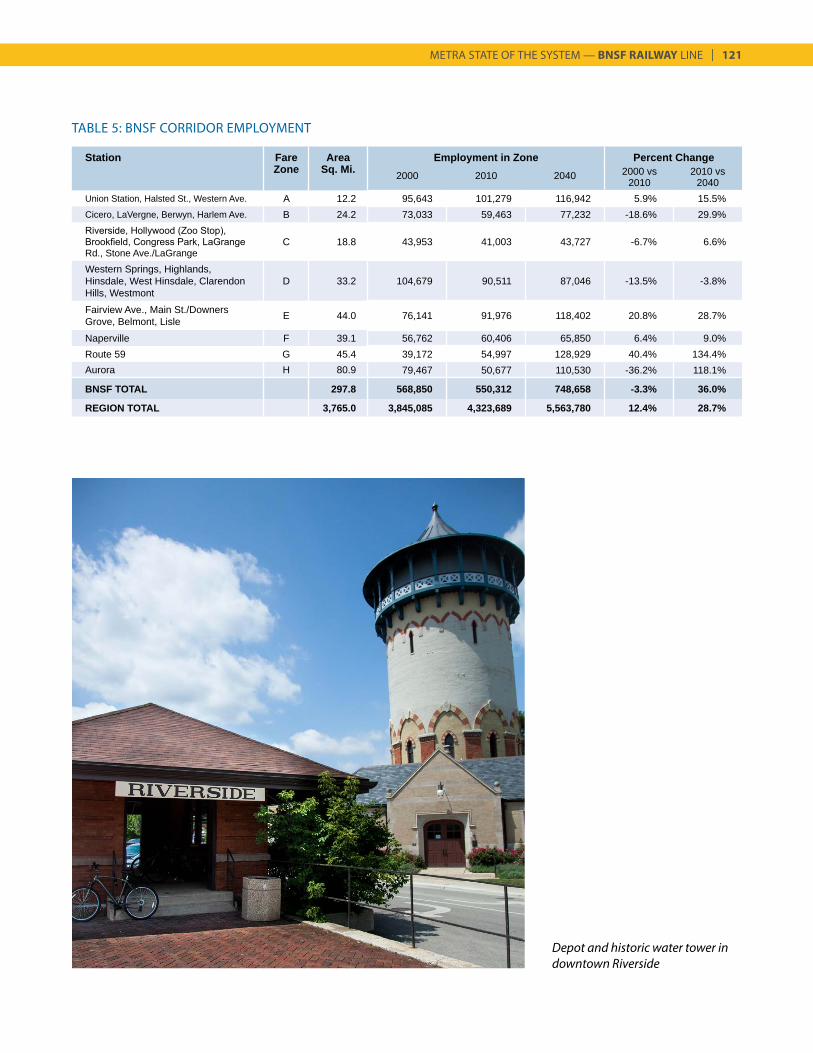
METRA STATE OF THE SYSTEM — BNSF RAILWAY LINE | 121
Station Fare Area Employment in Zone Percent ChangeZone Sq. Mi. 2000 2010 2040 2000 vs
20102010 vs
2040Union Station, Halsted St., Western Ave. A 12.2 95,643 101,279 116,942 5.9% 15.5%Cicero, LaVergne, Berwyn, Harlem Ave. B 24.2 73,033 59,463 77,232 -18.6% 29.9%Riverside, Hollywood (Zoo Stop), Brookfield, Congress Park, LaGrange Rd., Stone Ave./LaGrange
C 18.8 43,953 41,003 43,727 -6.7% 6.6%
Western Springs, Highlands, Hinsdale, West Hinsdale, Clarendon Hills, Westmont
D 33.2 104,679 90,511 87,046 -13.5% -3.8%
Fairview Ave., Main St./Downers Grove, Belmont, Lisle E 44.0 76,141 91,976 118,402 20.8% 28.7%
Naperville F 39.1 56,762 60,406 65,850 6.4% 9.0%Route 59 G 45.4 39,172 54,997 128,929 40.4% 134.4%Aurora H 80.9 79,467 50,677 110,530 -36.2% 118.1%
BNSF TOTAL 297.8 568,850 550,312 748,658 -3.3% 36.0%
REGION TOTAL 3,765.0 3,845,085 4,323,689 5,563,780 12.4% 28.7%
TABLE 5: BNSF CORRIDOR EMPLOYMENT
Depot and historic water tower in downtown Riverside
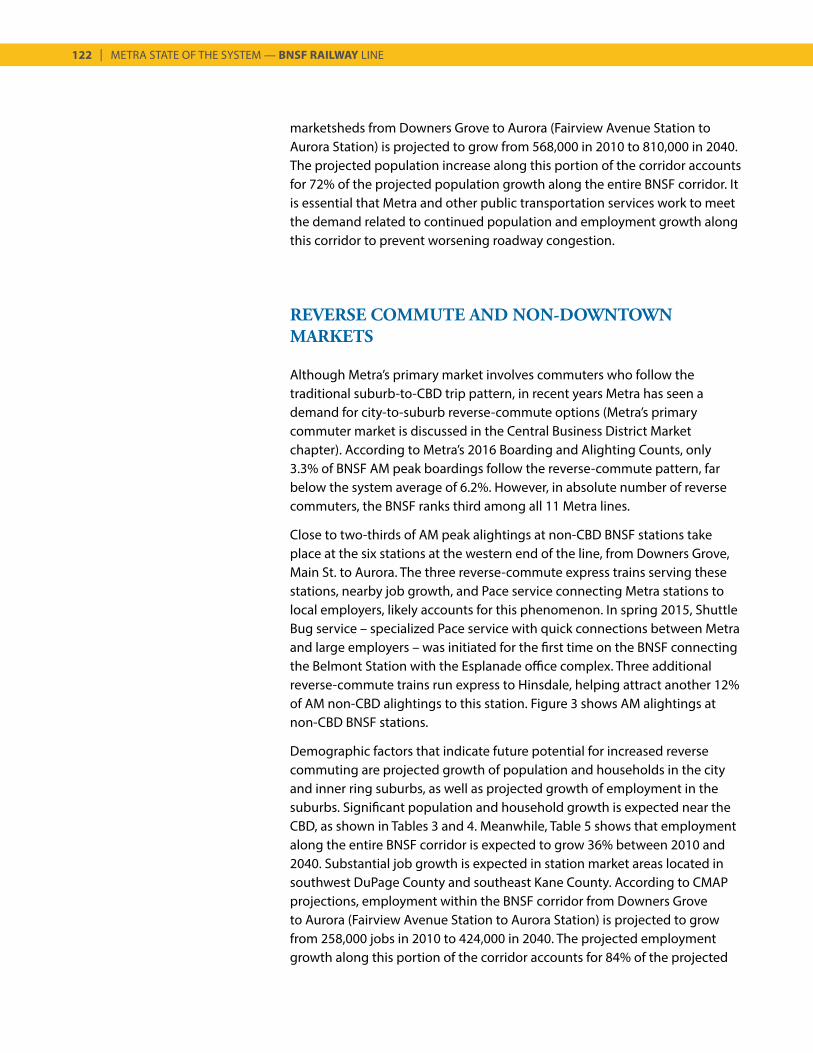
122 | METRA STATE OF THE SYSTEM — BNSF RAILWAY LINE
marketsheds from Downers Grove to Aurora (Fairview Avenue Station to Aurora Station) is projected to grow from 568,000 in 2010 to 810,000 in 2040. The projected population increase along this portion of the corridor accounts for 72% of the projected population growth along the entire BNSF corridor. It is essential that Metra and other public transportation services work to meet the demand related to continued population and employment growth along this corridor to prevent worsening roadway congestion.
REVERSE COMMUTE AND NON-DOWNTOWN MARKETS
Although Metra’s primary market involves commuters who follow the traditional suburb-to-CBD trip pattern, in recent years Metra has seen a demand for city-to-suburb reverse-commute options (Metra’s primary commuter market is discussed in the Central Business District Market chapter). According to Metra’s 2016 Boarding and Alighting Counts, only 3.3% of BNSF AM peak boardings follow the reverse-commute pattern, far below the system average of 6.2%. However, in absolute number of reverse commuters, the BNSF ranks third among all 11 Metra lines.
Close to two-thirds of AM peak alightings at non-CBD BNSF stations take place at the six stations at the western end of the line, from Downers Grove, Main St. to Aurora. The three reverse-commute express trains serving these stations, nearby job growth, and Pace service connecting Metra stations to local employers, likely accounts for this phenomenon. In spring 2015, Shuttle Bug service – specialized Pace service with quick connections between Metra and large employers – was initiated for the first time on the BNSF connecting the Belmont Station with the Esplanade office complex. Three additional reverse-commute trains run express to Hinsdale, helping attract another 12% of AM non-CBD alightings to this station. Figure 3 shows AM alightings at non-CBD BNSF stations.
Demographic factors that indicate future potential for increased reverse commuting are projected growth of population and households in the city and inner ring suburbs, as well as projected growth of employment in the suburbs. Significant population and household growth is expected near the CBD, as shown in Tables 3 and 4. Meanwhile, Table 5 shows that employment along the entire BNSF corridor is expected to grow 36% between 2010 and 2040. Substantial job growth is expected in station market areas located in southwest DuPage County and southeast Kane County. According to CMAP projections, employment within the BNSF corridor from Downers Grove to Aurora (Fairview Avenue Station to Aurora Station) is projected to grow from 258,000 jobs in 2010 to 424,000 in 2040. The projected employment growth along this portion of the corridor accounts for 84% of the projected
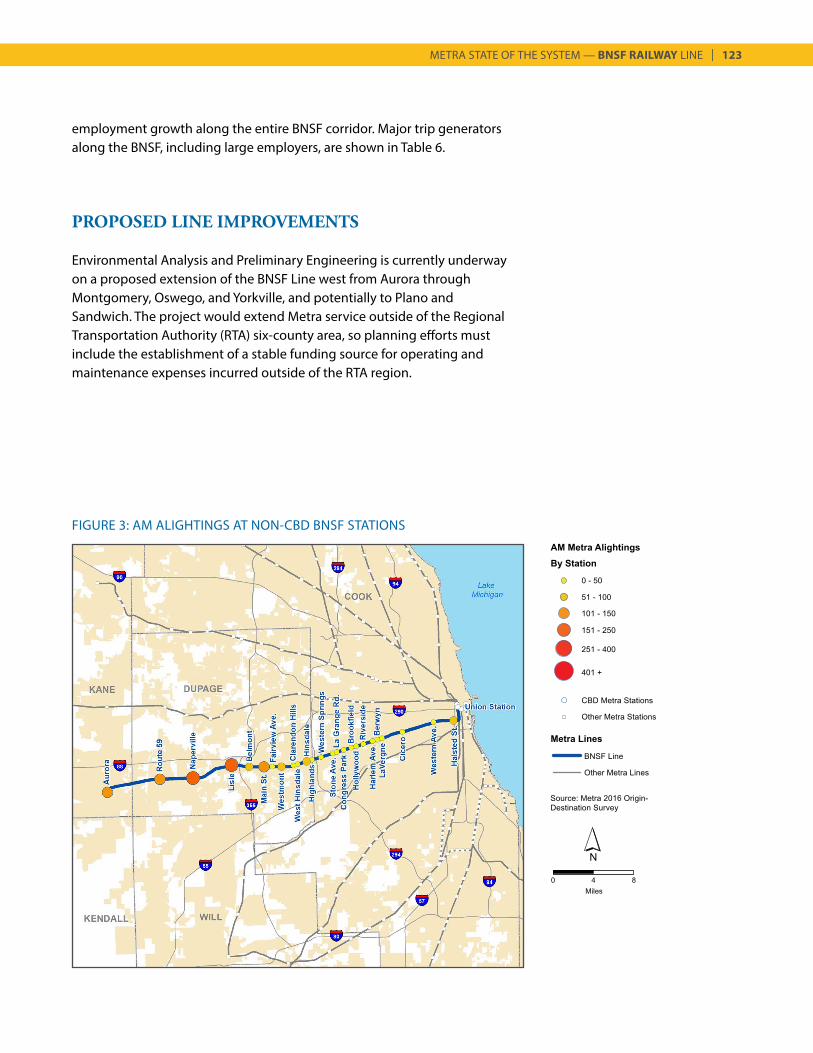
METRA STATE OF THE SYSTEM — BNSF RAILWAY LINE | 123
FIGURE 3: AM ALIGHTINGS AT NON-CBD BNSF STATIONS
employment growth along the entire BNSF corridor. Major trip generators along the BNSF, including large employers, are shown in Table 6.
PROPOSED LINE IMPROVEMENTS
Environmental Analysis and Preliminary Engineering is currently underway on a proposed extension of the BNSF Line west from Aurora through Montgomery, Oswego, and Yorkville, and potentially to Plano and Sandwich. The project would extend Metra service outside of the Regional Transportation Authority (RTA) six-county area, so planning efforts must include the establishment of a stable funding source for operating and maintenance expenses incurred outside of the RTA region.
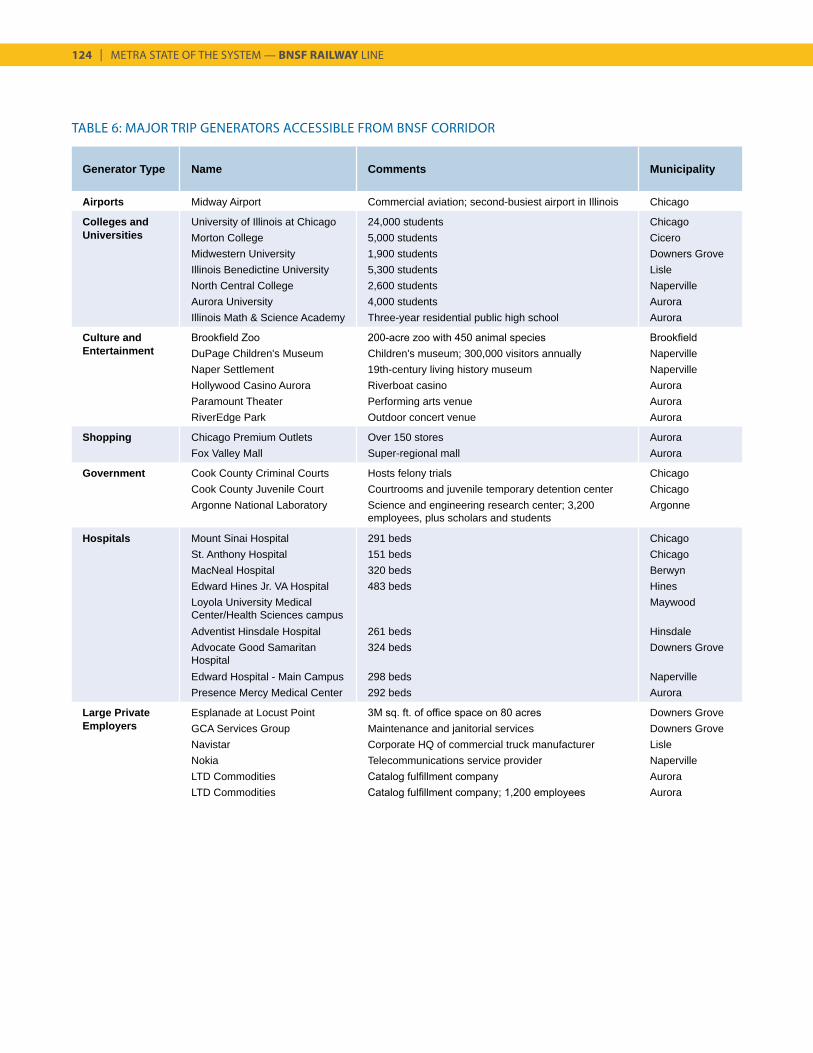
124 | METRA STATE OF THE SYSTEM — BNSF RAILWAY LINE
Generator Type Name Comments Municipality
Airports Midway Airport Commercial aviation; second-busiest airport in Illinois Chicago
Colleges and University of Illinois at Chicago 24,000 students ChicagoUniversities Morton College 5,000 students Cicero
Midwestern University 1,900 students Downers GroveIllinois Benedictine University 5,300 students LisleNorth Central College 2,600 students NapervilleAurora University 4,000 students AuroraIllinois Math & Science Academy Three-year residential public high school Aurora
Culture and Brookfield Zoo 200-acre zoo with 450 animal species BrookfieldEntertainment DuPage Children's Museum Children's museum; 300,000 visitors annually Naperville
Naper Settlement 19th-century living history museum NapervilleHollywood Casino Aurora Riverboat casino AuroraParamount Theater Performing arts venue AuroraRiverEdge Park Outdoor concert venue Aurora
Shopping Chicago Premium Outlets Over 150 stores AuroraFox Valley Mall Super-regional mall Aurora
Government Cook County Criminal Courts Hosts felony trials ChicagoCook County Juvenile Court Courtrooms and juvenile temporary detention center ChicagoArgonne National Laboratory Science and engineering research center; 3,200
employees, plus scholars and studentsArgonne
Hospitals Mount Sinai Hospital 291 beds ChicagoSt. Anthony Hospital 151 beds ChicagoMacNeal Hospital 320 beds BerwynEdward Hines Jr. VA Hospital 483 beds HinesLoyola University Medical Center/Health Sciences campus
Maywood
Adventist Hinsdale Hospital 261 beds HinsdaleAdvocate Good Samaritan Hospital
324 beds Downers Grove
Edward Hospital - Main Campus 298 beds NapervillePresence Mercy Medical Center 292 beds Aurora
Large Private Esplanade at Locust Point 3M sq. ft. of office space on 80 acres Downers GroveEmployers GCA Services Group Maintenance and janitorial services Downers Grove
Navistar Corporate HQ of commercial truck manufacturer LisleNokia Telecommunications service provider NapervilleLTD Commodities Catalog fulfillment company AuroraLTD Commodities Catalog fulfillment company; 1,200 employees Aurora
TABLE 6: MAJOR TRIP GENERATORS ACCESSIBLE FROM BNSF CORRIDOR
METRA STATE OF THE SYSTEM — BNSF RAILWAY LINE | 125
Photo: Mark Llanuza
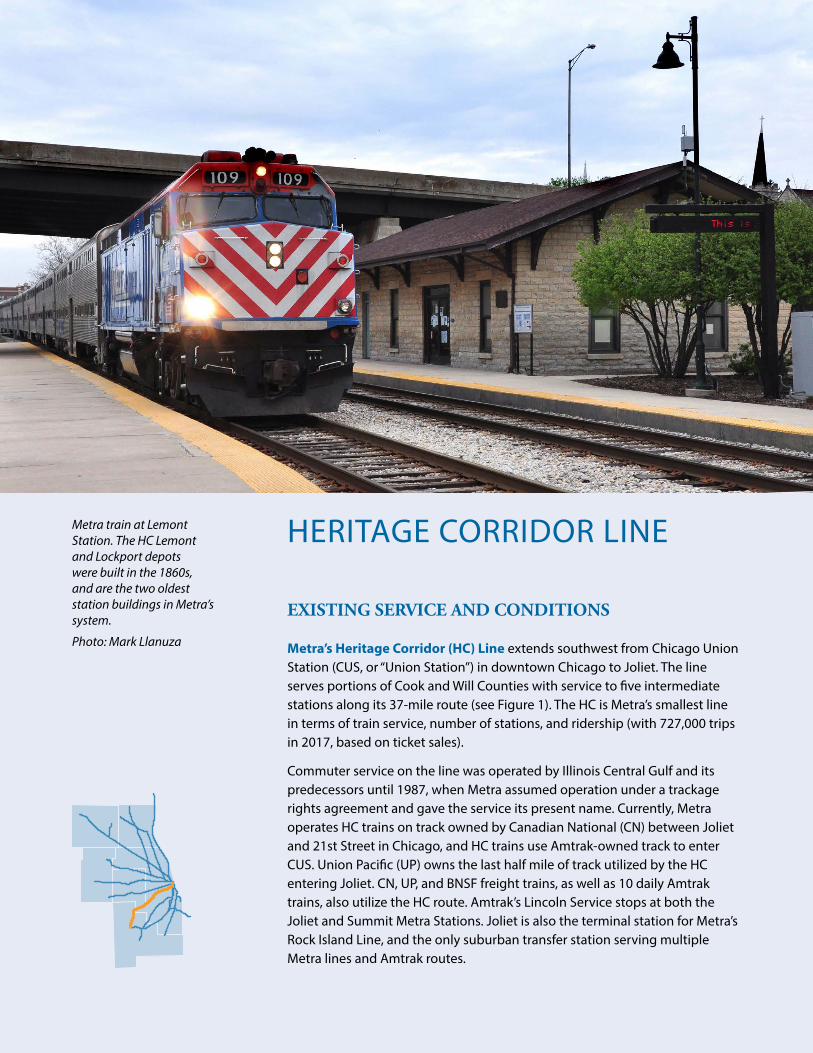
HERITAGE CORRIDOR LINE
EXISTING SERVICE AND CONDITIONS
Metra’s Heritage Corridor (HC) Line extends southwest from Chicago Union Station (CUS, or “Union Station”) in downtown Chicago to Joliet. The line serves portions of Cook and Will Counties with service to five intermediate stations along its 37-mile route (see Figure 1). The HC is Metra’s smallest line in terms of train service, number of stations, and ridership (with 727,000 trips in 2017, based on ticket sales).
Commuter service on the line was operated by Illinois Central Gulf and its predecessors until 1987, when Metra assumed operation under a trackage rights agreement and gave the service its present name. Currently, Metra operates HC trains on track owned by Canadian National (CN) between Joliet and 21st Street in Chicago, and HC trains use Amtrak-owned track to enter CUS. Union Pacific (UP) owns the last half mile of track utilized by the HC entering Joliet. CN, UP, and BNSF freight trains, as well as 10 daily Amtrak trains, also utilize the HC route. Amtrak’s Lincoln Service stops at both the Joliet and Summit Metra Stations. Joliet is also the terminal station for Metra’s Rock Island Line, and the only suburban transfer station serving multiple Metra lines and Amtrak routes.
Metra train at Lemont Station. The HC Lemont and Lockport depots were built in the 1860s, and are the two oldest station buildings in Metra’s system.
Photo: Mark Llanuza
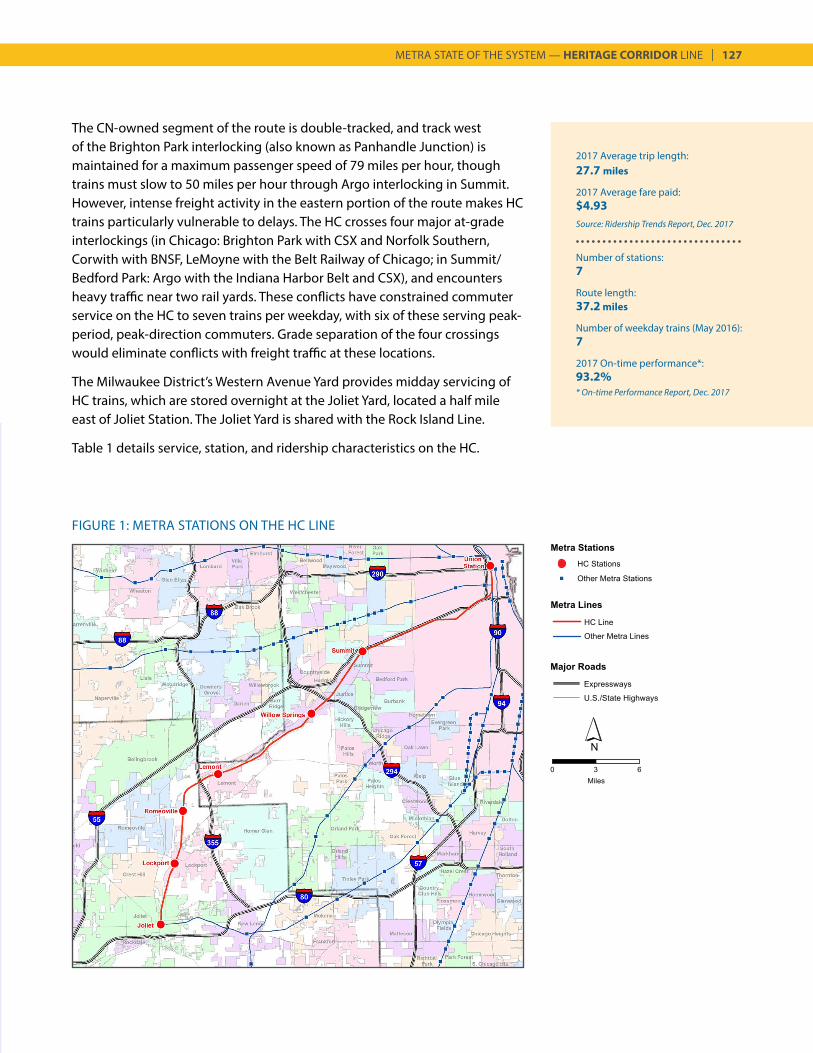
METRA STATE OF THE SYSTEM — HERITAGE CORRIDOR LINE | 127
2017 Average trip length:27.7 miles
2017 Average fare paid:$4.93Source: Ridership Trends Report, Dec. 2017
Number of stations:7
Route length:37.2 miles
Number of weekday trains (May 2016):7
2017 On-time performance*:93.2%* On-time Performance Report, Dec. 2017
FIGURE 1: METRA STATIONS ON THE HC LINE
The CN-owned segment of the route is double-tracked, and track west of the Brighton Park interlocking (also known as Panhandle Junction) is maintained for a maximum passenger speed of 79 miles per hour, though trains must slow to 50 miles per hour through Argo interlocking in Summit. However, intense freight activity in the eastern portion of the route makes HC trains particularly vulnerable to delays. The HC crosses four major at-grade interlockings (in Chicago: Brighton Park with CSX and Norfolk Southern, Corwith with BNSF, LeMoyne with the Belt Railway of Chicago; in Summit/Bedford Park: Argo with the Indiana Harbor Belt and CSX), and encounters heavy traffic near two rail yards. These conflicts have constrained commuter service on the HC to seven trains per weekday, with six of these serving peak-period, peak-direction commuters. Grade separation of the four crossings would eliminate conflicts with freight traffic at these locations.
The Milwaukee District’s Western Avenue Yard provides midday servicing of HC trains, which are stored overnight at the Joliet Yard, located a half mile east of Joliet Station. The Joliet Yard is shared with the Rock Island Line.
Table 1 details service, station, and ridership characteristics on the HC.

128 | METRA STATE OF THE SYSTEM — HERITAGE CORRIDOR LINE
Source: Metra Weekday Station Boardings and Alightings by Time-of-Day and Direction, 2016
TABLE 1A: 2016 HC WEEKDAY BOARDINGS
TABLE 1B: HC ANNUAL PASSENGER TRIPS1983 — 2017, in millions
Y E A R
Time of Day Inbound Outbound
AM Peak 1,320 0
Midday 0 52
PM Peak 0 1,175
Evening 0 0
TOTAL 1,320 1,227
Note: from 2008, figures include free Circuit Permit trips. 2008-2011 figures include free senior trips; this program ended September 2011.
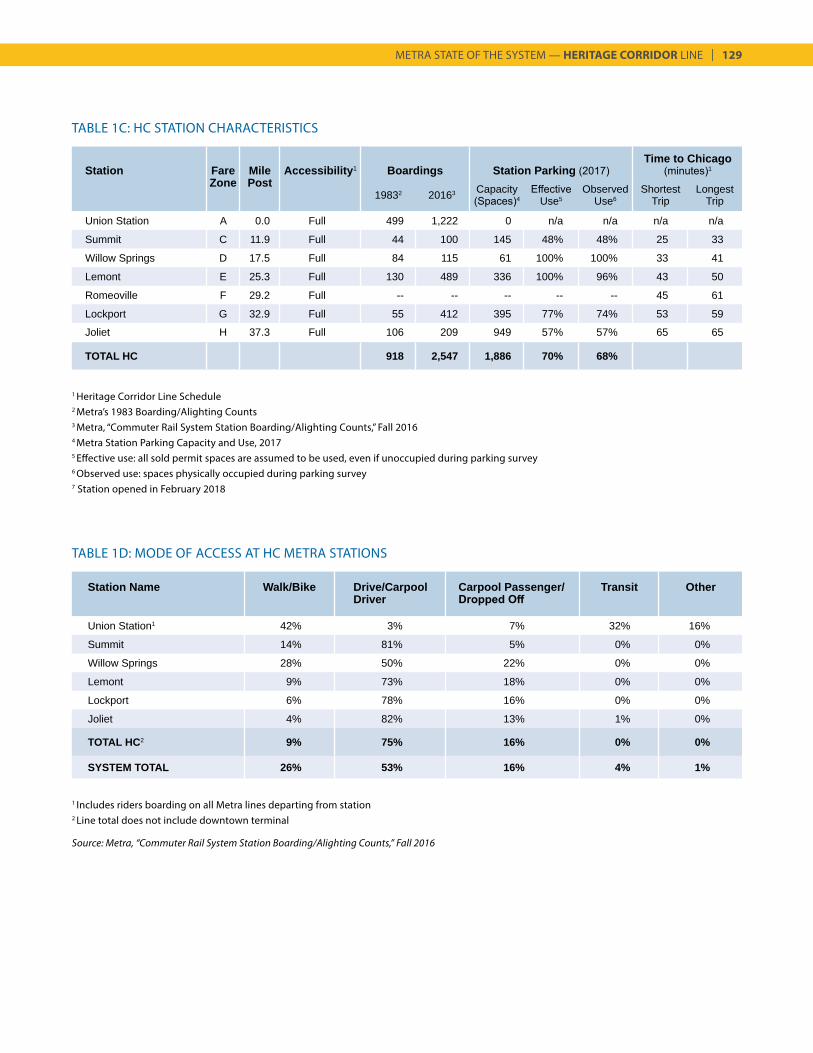
METRA STATE OF THE SYSTEM — HERITAGE CORRIDOR LINE | 129
TABLE 1C: HC STATION CHARACTERISTICS
Station Fare Mile Accessibility1 Boardings Station Parking (2017)Time to Chicago
(minutes)1
Zone Post19832 20163 Capacity
(Spaces)4Effective
Use5Observed
Use6Shortest
TripLongest
Trip
Union Station A 0.0 Full 499 1,222 0 n/a n/a n/a n/a
Summit C 11.9 Full 44 100 145 48% 48% 25 33
Willow Springs D 17.5 Full 84 115 61 100% 100% 33 41
Lemont E 25.3 Full 130 489 336 100% 96% 43 50
Romeoville F 29.2 Full -- -- -- -- -- 45 61
Lockport G 32.9 Full 55 412 395 77% 74% 53 59
Joliet H 37.3 Full 106 209 949 57% 57% 65 65
TOTAL HC 918 2,547 1,886 70% 68%
1 Heritage Corridor Line Schedule2 Metra’s 1983 Boarding/Alighting Counts3 Metra, “Commuter Rail System Station Boarding/Alighting Counts,” Fall 20164 Metra Station Parking Capacity and Use, 20175 Effective use: all sold permit spaces are assumed to be used, even if unoccupied during parking survey6 Observed use: spaces physically occupied during parking survey7 Station opened in February 2018
TABLE 1D: MODE OF ACCESS AT HC METRA STATIONS
Station Name Walk/Bike Drive/Carpool Driver
Carpool Passenger/ Dropped Off
Transit Other
Union Station1 42% 3% 7% 32% 16%
Summit 14% 81% 5% 0% 0%
Willow Springs 28% 50% 22% 0% 0%
Lemont 9% 73% 18% 0% 0%
Lockport 6% 78% 16% 0% 0%
Joliet 4% 82% 13% 1% 0%
TOTAL HC2 9% 75% 16% 0% 0%
SYSTEM TOTAL 26% 53% 16% 4% 1%
1 Includes riders boarding on all Metra lines departing from station2 Line total does not include downtown terminal
Source: Metra, “Commuter Rail System Station Boarding/Alighting Counts,” Fall 2016
130 | METRA STATE OF THE SYSTEM — HERITAGE CORRIDOR LINE
IMPROVEMENTS SINCE THE START OF METRA
Since 1985, Metra has invested $92 million (in year of expenditure dollars) in improvements to the HC corridor. Table 2 indicates the amount of investment in different asset categories. This amount includes costs of a track and signal upgrade project completed in 2002, new warming houses at Summit and Willow Springs, and restoration of the historic depots at Lemont and Lockport (the oldest depots in the Metra system). American Recovery and Reinvestment Act (ARRA) grants funded platform improvements at Lockport and Joliet Stations. Over the years, Metra has partnered with Amtrak, owner of CUS, to complete a number of upgrades to the terminal’s commuter facilities. For more information on proposed CUS improvements, see the CBD chapter of this report.
Due to capacity constraints on the HC, Metra has had limited opportunities to adjust the service schedule on the line. In April 1999, the number of trains was increased from four to six, to better serve existing riders and add capacity during reconstruction of the Stevenson Expressway. The ridership impact of this improvement can be seen in Table 1b, as HC boardings increased 31% between 1999 and 2002. A seventh daily train, departing Chicago in mid-afternoon, was added in 2016.
In 2018, a new station opened near 135th Street and New Avenue in Romeoville. This new station was funded by the federal Congestion Mitigation and Air Quality Improvement (CMAQ) Program and a grant awarded to the village of Romeoville from the Illinois Transportation Enhancement Program (ITEP).
Also in 2018, a new multimodal transportation center opened in Joliet, to accommodate Metra, Amtrak, Pace, intercity and shuttle buses, bicycles, taxis, and intercity passenger rail (existing Amtrak service, as well as planned high-speed rail service between Chicago and St. Louis) and streamline transfers between the services. A new bus station is planned to be added to the transportation center, and will be built once funding is available. The HC platform portion of the project now allows passengers to approach the platform through two new pedestrian tunnels, instead of crossing freight tracks to board the train. The tunnels have both stairs and an elevator for ADA access to the platform. Major funding for the transportation center was provided by the State of Illinois, with additional funding from the City of Joliet and BNSF.
Metra has evaluated separating the HC’s four major at-grade crossings as long-term improvements, due to the cost, complexity and service disruptions involved with these projects. Several improvements have been completed in this corridor as part of the CREATE Program in order to improve operations without construction of more costly flyovers. The improvements included the installation of a modern remote-controlled signal system and replacement
Depots and warming houses constructed since 1985 at:SummitWillow Springs
Other significant improvements completed since 1985 at:LemontLockportRomeoville (new station)Joliet
Improvements planned for:Union Station
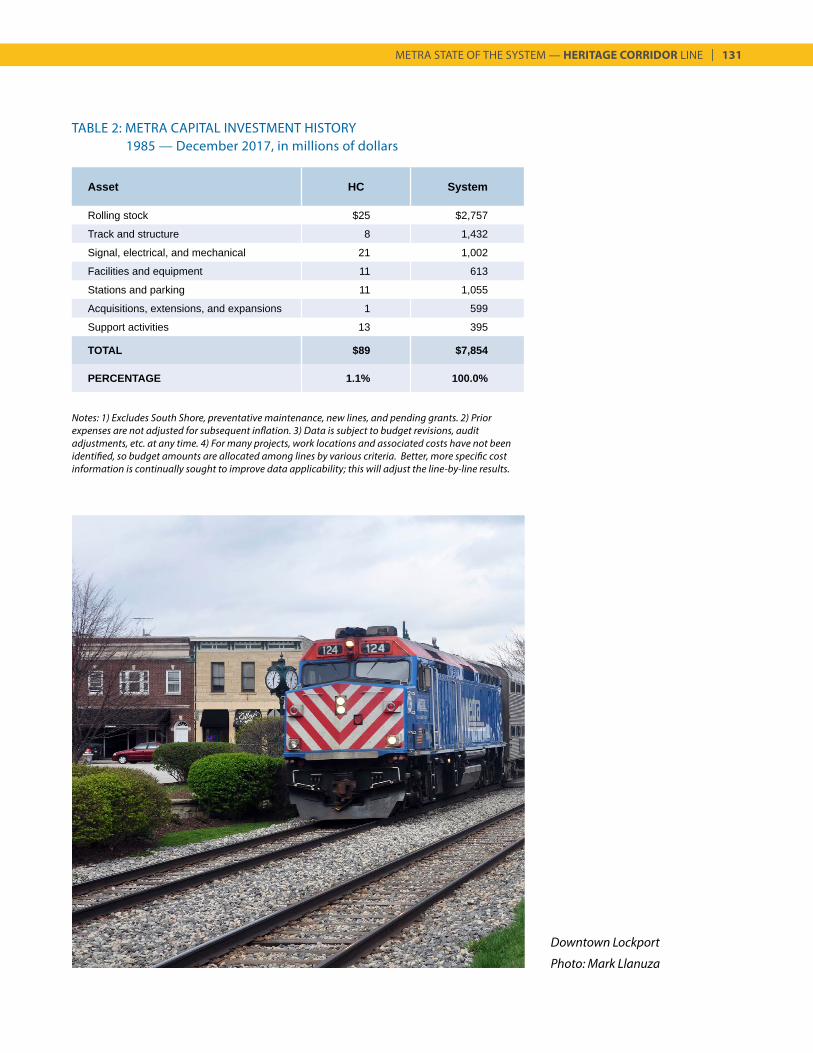
METRA STATE OF THE SYSTEM — HERITAGE CORRIDOR LINE | 131
TABLE 2: METRA CAPITAL INVESTMENT HISTORY 1985 — December 2017, in millions of dollars
Asset HC System
Rolling stock $25 $2,757
Track and structure 8 1,432
Signal, electrical, and mechanical 21 1,002
Facilities and equipment 11 613
Stations and parking 11 1,055
Acquisitions, extensions, and expansions 1 599
Support activities 13 395
TOTAL $89 $7,854
PERCENTAGE 1.1% 100.0%
Notes: 1) Excludes South Shore, preventative maintenance, new lines, and pending grants. 2) Prior expenses are not adjusted for subsequent inflation. 3) Data is subject to budget revisions, audit adjustments, etc. at any time. 4) For many projects, work locations and associated costs have not been identified, so budget amounts are allocated among lines by various criteria. Better, more specific cost information is continually sought to improve data applicability; this will adjust the line-by-line results.
Downtown Lockport
Photo: Mark Llanuza
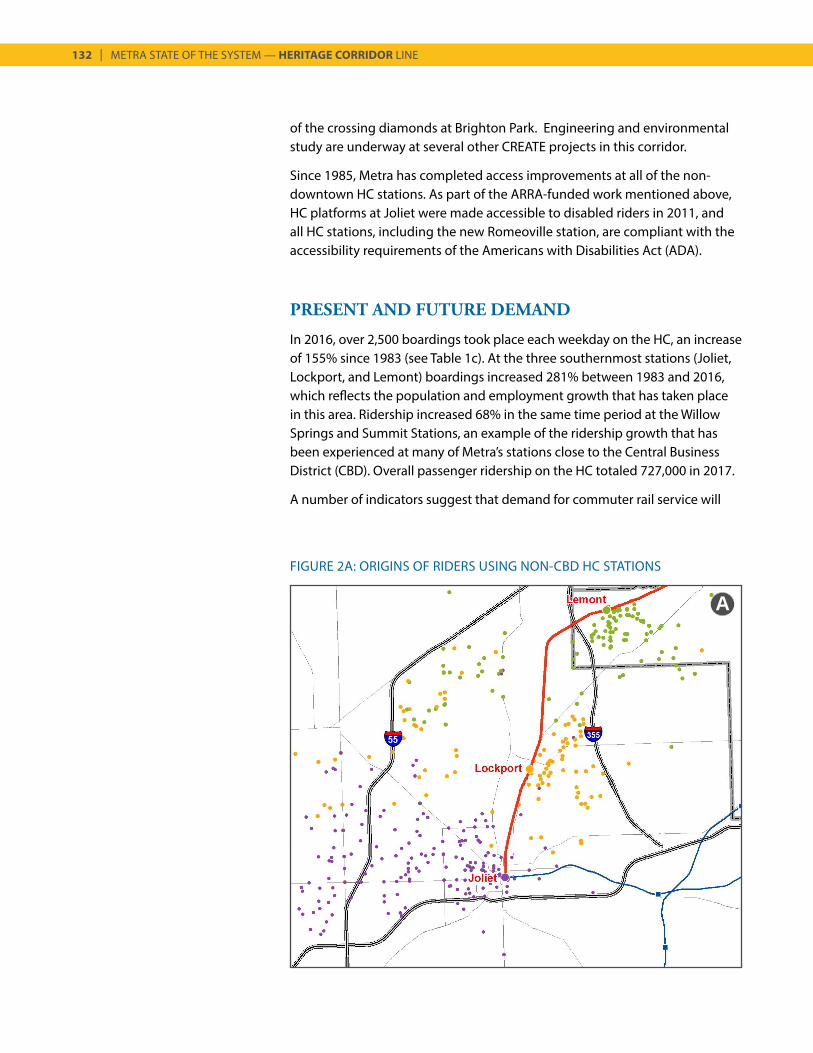
132 | METRA STATE OF THE SYSTEM — HERITAGE CORRIDOR LINE
A
FIGURE 2A: ORIGINS OF RIDERS USING NON-CBD HC STATIONS
of the crossing diamonds at Brighton Park. Engineering and environmental study are underway at several other CREATE projects in this corridor.
Since 1985, Metra has completed access improvements at all of the non-downtown HC stations. As part of the ARRA-funded work mentioned above, HC platforms at Joliet were made accessible to disabled riders in 2011, and all HC stations, including the new Romeoville station, are compliant with the accessibility requirements of the Americans with Disabilities Act (ADA).
PRESENT AND FUTURE DEMAND
In 2016, over 2,500 boardings took place each weekday on the HC, an increase of 155% since 1983 (see Table 1c). At the three southernmost stations (Joliet, Lockport, and Lemont) boardings increased 281% between 1983 and 2016, which reflects the population and employment growth that has taken place in this area. Ridership increased 68% in the same time period at the Willow Springs and Summit Stations, an example of the ridership growth that has been experienced at many of Metra’s stations close to the Central Business District (CBD). Overall passenger ridership on the HC totaled 727,000 in 2017.
A number of indicators suggest that demand for commuter rail service will
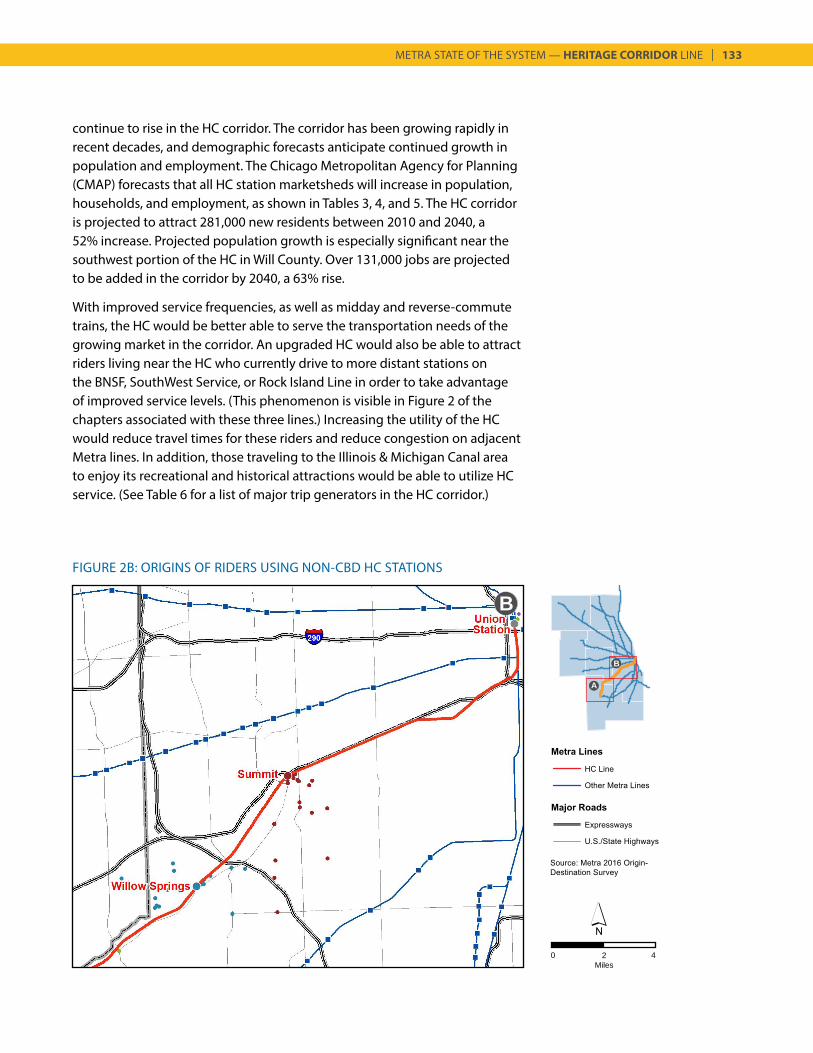
METRA STATE OF THE SYSTEM — HERITAGE CORRIDOR LINE | 133
0 2Miles
4
continue to rise in the HC corridor. The corridor has been growing rapidly in recent decades, and demographic forecasts anticipate continued growth in population and employment. The Chicago Metropolitan Agency for Planning (CMAP) forecasts that all HC station marketsheds will increase in population, households, and employment, as shown in Tables 3, 4, and 5. The HC corridor is projected to attract 281,000 new residents between 2010 and 2040, a 52% increase. Projected population growth is especially significant near the southwest portion of the HC in Will County. Over 131,000 jobs are projected to be added in the corridor by 2040, a 63% rise.
With improved service frequencies, as well as midday and reverse-commute trains, the HC would be better able to serve the transportation needs of the growing market in the corridor. An upgraded HC would also be able to attract riders living near the HC who currently drive to more distant stations on the BNSF, SouthWest Service, or Rock Island Line in order to take advantage of improved service levels. (This phenomenon is visible in Figure 2 of the chapters associated with these three lines.) Increasing the utility of the HC would reduce travel times for these riders and reduce congestion on adjacent Metra lines. In addition, those traveling to the Illinois & Michigan Canal area to enjoy its recreational and historical attractions would be able to utilize HC service. (See Table 6 for a list of major trip generators in the HC corridor.)
FIGURE 2B: ORIGINS OF RIDERS USING NON-CBD HC STATIONS
B
A
B
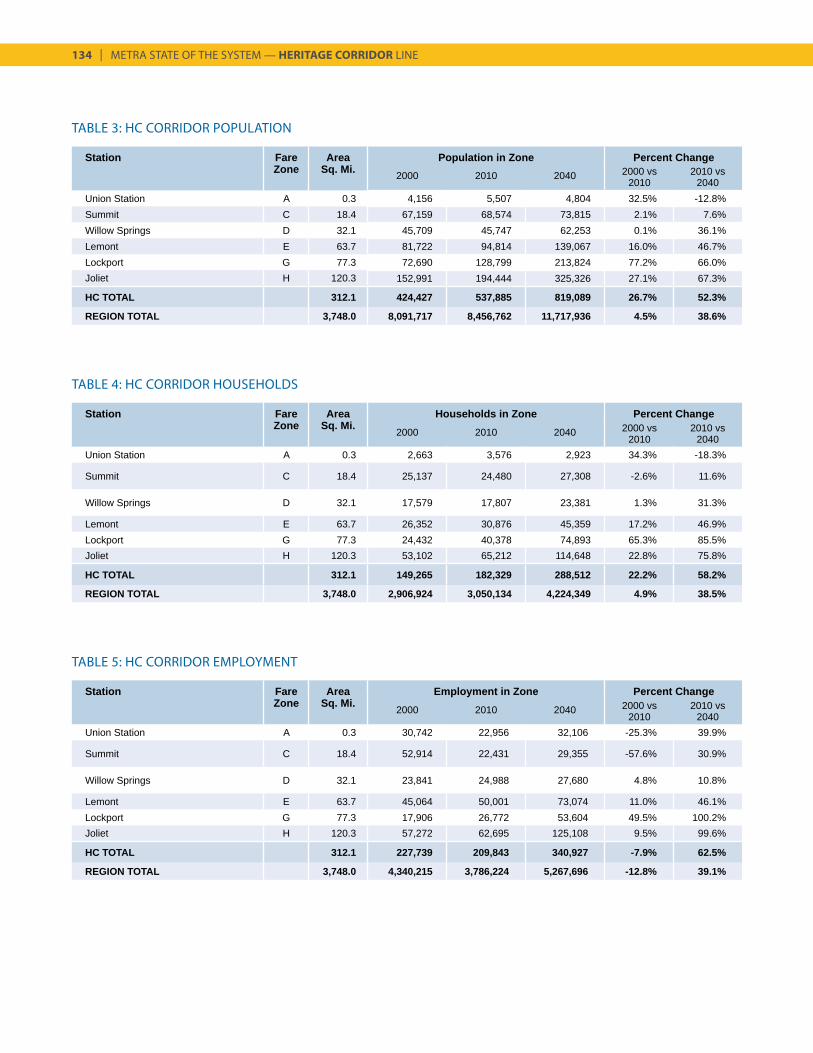
134 | METRA STATE OF THE SYSTEM — HERITAGE CORRIDOR LINE
TABLE 3: HC CORRIDOR POPULATION
Station Fare Area Employment in Zone Percent ChangeZone Sq. Mi. 2000 2010 2040 2000 vs
20102010 vs
2040Union Station A 0.3 30,742 22,956 32,106 -25.3% 39.9%
Summit C 18.4 52,914 22,431 29,355 -57.6% 30.9%
Willow Springs D 32.1 23,841 24,988 27,680 4.8% 10.8%
Lemont E 63.7 45,064 50,001 73,074 11.0% 46.1%Lockport G 77.3 17,906 26,772 53,604 49.5% 100.2%Joliet H 120.3 57,272 62,695 125,108 9.5% 99.6%
HC TOTAL 312.1 227,739 209,843 340,927 -7.9% 62.5%
REGION TOTAL 3,748.0 4,340,215 3,786,224 5,267,696 -12.8% 39.1%
Station Fare Area Population in Zone Percent ChangeZone Sq. Mi. 2000 2010 2040 2000 vs
20102010 vs
2040Union Station A 0.3 4,156 5,507 4,804 32.5% -12.8%Summit C 18.4 67,159 68,574 73,815 2.1% 7.6%Willow Springs D 32.1 45,709 45,747 62,253 0.1% 36.1%Lemont E 63.7 81,722 94,814 139,067 16.0% 46.7%Lockport G 77.3 72,690 128,799 213,824 77.2% 66.0%Joliet H 120.3 152,991 194,444 325,326 27.1% 67.3%
HC TOTAL 312.1 424,427 537,885 819,089 26.7% 52.3%
REGION TOTAL 3,748.0 8,091,717 8,456,762 11,717,936 4.5% 38.6%
Station Fare Area Households in Zone Percent ChangeZone Sq. Mi. 2000 2010 2040 2000 vs
20102010 vs
2040Union Station A 0.3 2,663 3,576 2,923 34.3% -18.3%
Summit C 18.4 25,137 24,480 27,308 -2.6% 11.6%
Willow Springs D 32.1 17,579 17,807 23,381 1.3% 31.3%
Lemont E 63.7 26,352 30,876 45,359 17.2% 46.9%Lockport G 77.3 24,432 40,378 74,893 65.3% 85.5%Joliet H 120.3 53,102 65,212 114,648 22.8% 75.8%
HC TOTAL 312.1 149,265 182,329 288,512 22.2% 58.2%
REGION TOTAL 3,748.0 2,906,924 3,050,134 4,224,349 4.9% 38.5%
TABLE 5: HC CORRIDOR EMPLOYMENT
TABLE 4: HC CORRIDOR HOUSEHOLDS
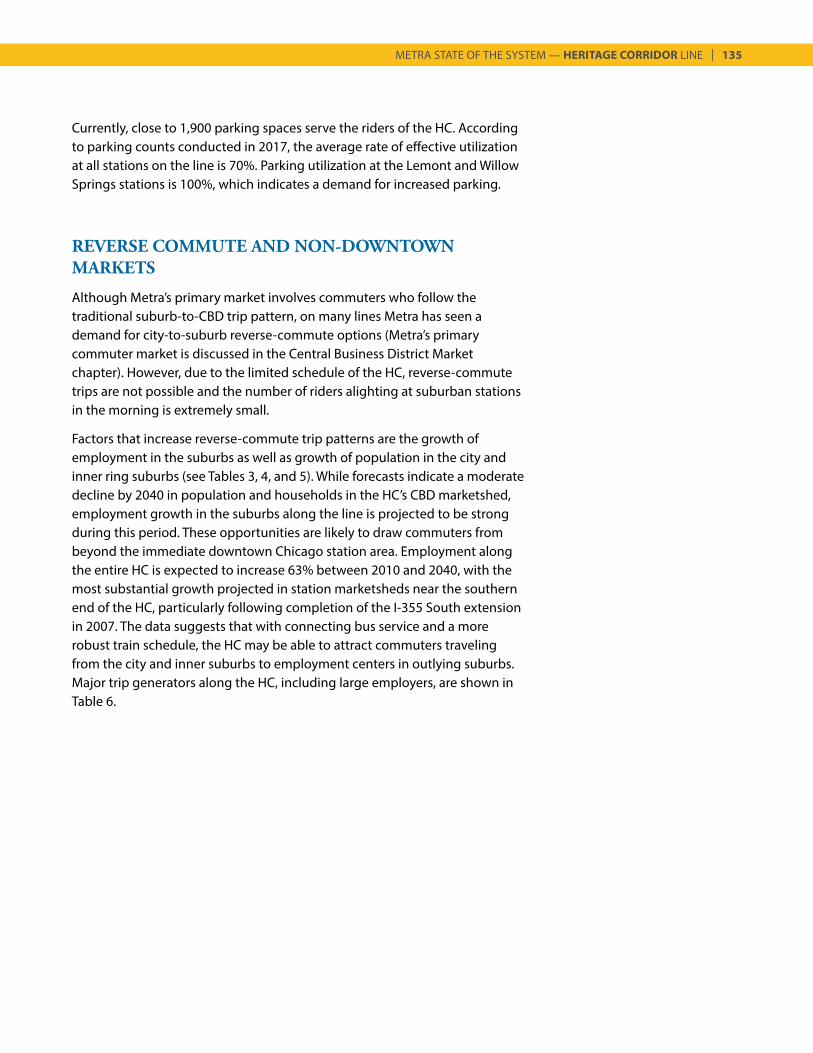
METRA STATE OF THE SYSTEM — HERITAGE CORRIDOR LINE | 135
Currently, close to 1,900 parking spaces serve the riders of the HC. According to parking counts conducted in 2017, the average rate of effective utilization at all stations on the line is 70%. Parking utilization at the Lemont and Willow Springs stations is 100%, which indicates a demand for increased parking.
REVERSE COMMUTE AND NON-DOWNTOWN MARKETS
Although Metra’s primary market involves commuters who follow the traditional suburb-to-CBD trip pattern, on many lines Metra has seen a demand for city-to-suburb reverse-commute options (Metra’s primary commuter market is discussed in the Central Business District Market chapter). However, due to the limited schedule of the HC, reverse-commute trips are not possible and the number of riders alighting at suburban stations in the morning is extremely small.
Factors that increase reverse-commute trip patterns are the growth of employment in the suburbs as well as growth of population in the city and inner ring suburbs (see Tables 3, 4, and 5). While forecasts indicate a moderate decline by 2040 in population and households in the HC’s CBD marketshed, employment growth in the suburbs along the line is projected to be strong during this period. These opportunities are likely to draw commuters from beyond the immediate downtown Chicago station area. Employment along the entire HC is expected to increase 63% between 2010 and 2040, with the most substantial growth projected in station marketsheds near the southern end of the HC, particularly following completion of the I-355 South extension in 2007. The data suggests that with connecting bus service and a more robust train schedule, the HC may be able to attract commuters traveling from the city and inner suburbs to employment centers in outlying suburbs. Major trip generators along the HC, including large employers, are shown in Table 6.
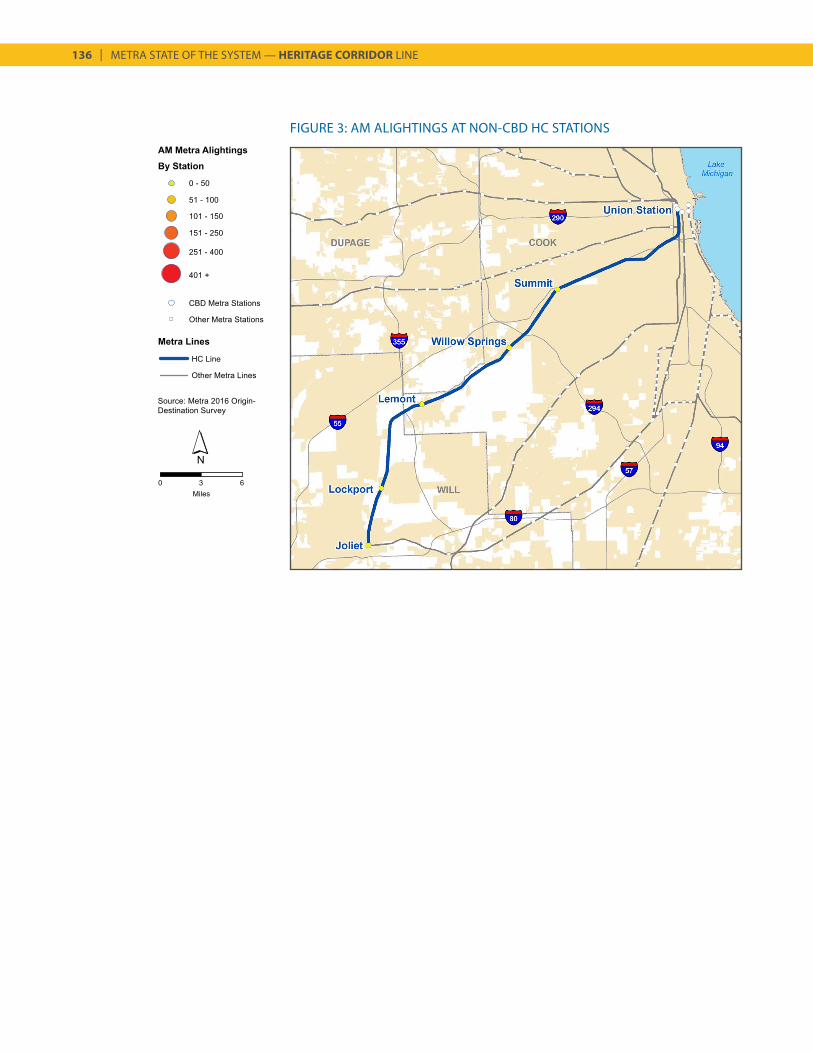
136 | METRA STATE OF THE SYSTEM — HERITAGE CORRIDOR LINE
FIGURE 3: AM ALIGHTINGS AT NON-CBD HC STATIONS
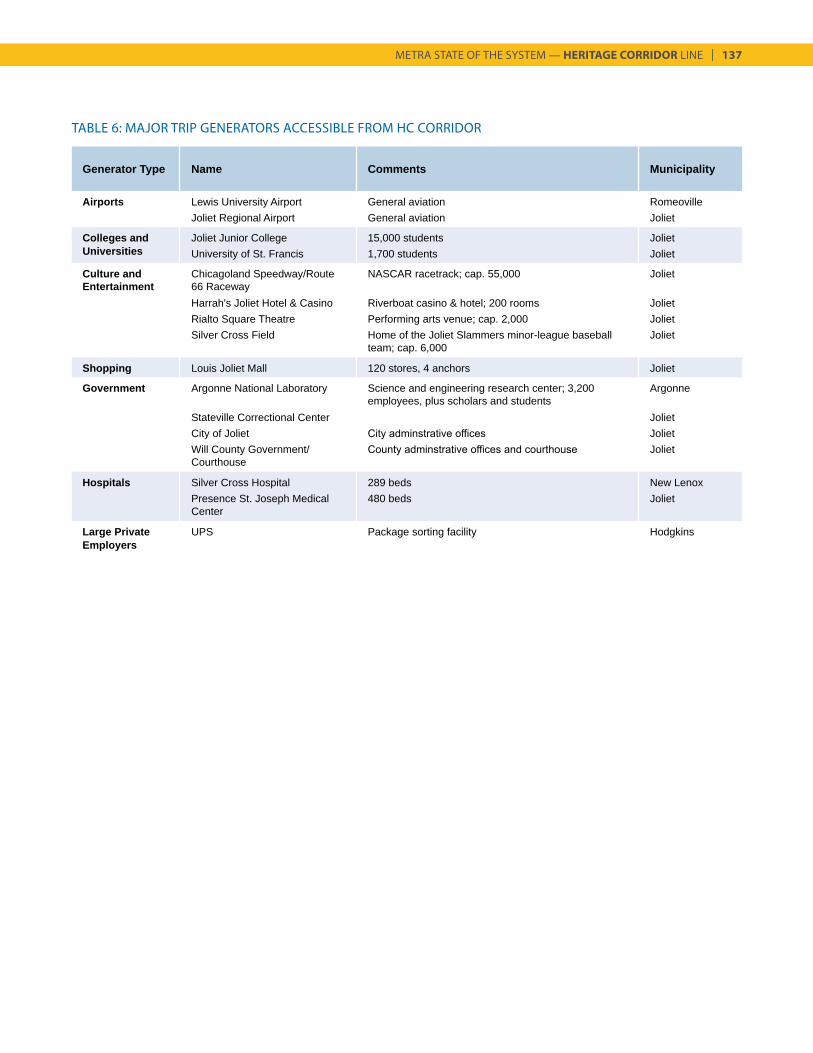
METRA STATE OF THE SYSTEM — HERITAGE CORRIDOR LINE | 137
Generator Type Name Comments Municipality
Airports Lewis University Airport General aviation RomeovilleJoliet Regional Airport General aviation Joliet
Colleges and Joliet Junior College 15,000 students JolietUniversities University of St. Francis 1,700 students Joliet
Culture and Entertainment
Chicagoland Speedway/Route 66 Raceway
NASCAR racetrack; cap. 55,000 Joliet
Harrah's Joliet Hotel & Casino Riverboat casino & hotel; 200 rooms JolietRialto Square Theatre Performing arts venue; cap. 2,000 JolietSilver Cross Field Home of the Joliet Slammers minor-league baseball
team; cap. 6,000Joliet
Shopping Louis Joliet Mall 120 stores, 4 anchors Joliet
Government Argonne National Laboratory Science and engineering research center; 3,200 employees, plus scholars and students
Argonne
Stateville Correctional Center JolietCity of Joliet City adminstrative offices JolietWill County Government/Courthouse
County adminstrative offices and courthouse Joliet
Hospitals Silver Cross Hospital 289 beds New LenoxPresence St. Joseph Medical Center
480 beds Joliet
Large Private UPS Package sorting facility HodgkinsEmployers
TABLE 6: MAJOR TRIP GENERATORS ACCESSIBLE FROM HC CORRIDOR
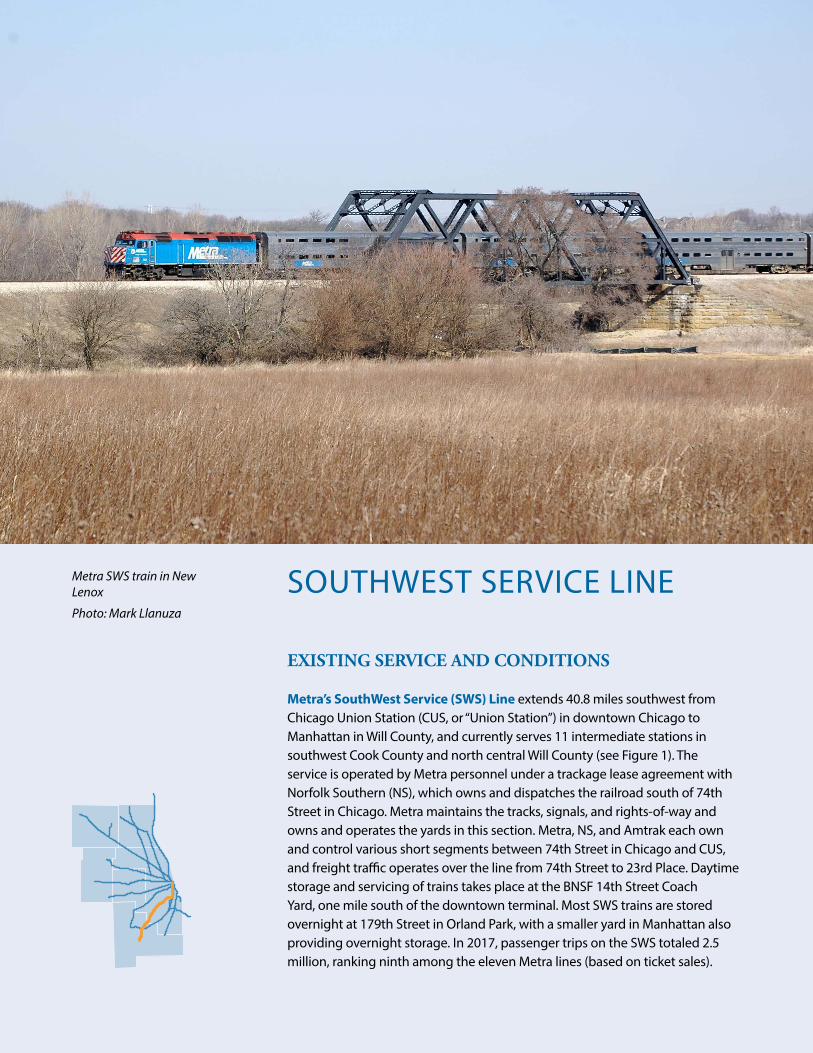
SOUTHWEST SERVICE LINE
EXISTING SERVICE AND CONDITIONS
Metra’s SouthWest Service (SWS) Line extends 40.8 miles southwest from Chicago Union Station (CUS, or “Union Station”) in downtown Chicago to Manhattan in Will County, and currently serves 11 intermediate stations in southwest Cook County and north central Will County (see Figure 1). The service is operated by Metra personnel under a trackage lease agreement with Norfolk Southern (NS), which owns and dispatches the railroad south of 74th Street in Chicago. Metra maintains the tracks, signals, and rights-of-way and owns and operates the yards in this section. Metra, NS, and Amtrak each own and control various short segments between 74th Street in Chicago and CUS, and freight traffic operates over the line from 74th Street to 23rd Place. Daytime storage and servicing of trains takes place at the BNSF 14th Street Coach Yard, one mile south of the downtown terminal. Most SWS trains are stored overnight at 179th Street in Orland Park, with a smaller yard in Manhattan also providing overnight storage. In 2017, passenger trips on the SWS totaled 2.5 million, ranking ninth among the eleven Metra lines (based on ticket sales).
Metra SWS train in New Lenox
Photo: Mark Llanuza
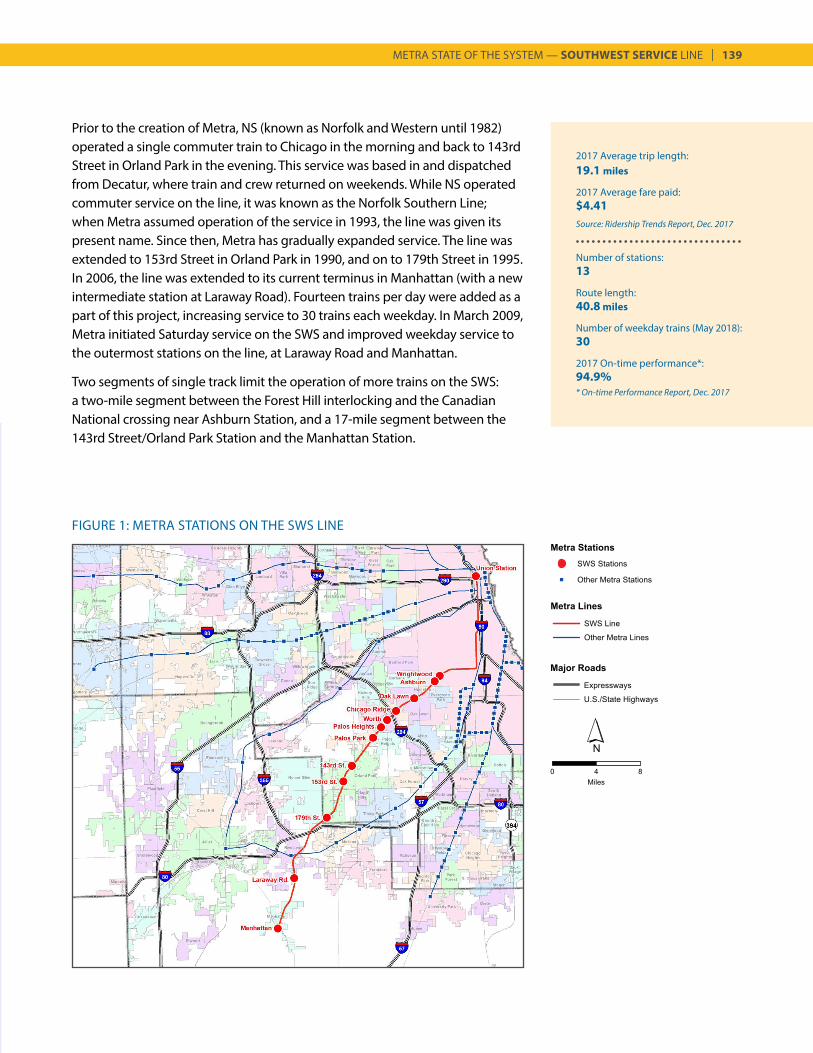
METRA STATE OF THE SYSTEM — SOUTHWEST SERVICE LINE | 139
2017 Average trip length:19.1 miles
2017 Average fare paid:$4.41Source: Ridership Trends Report, Dec. 2017
Number of stations:13
Route length:40.8 miles
Number of weekday trains (May 2018):30
2017 On-time performance*:94.9%* On-time Performance Report, Dec. 2017
FIGURE 1: METRA STATIONS ON THE SWS LINE
Prior to the creation of Metra, NS (known as Norfolk and Western until 1982) operated a single commuter train to Chicago in the morning and back to 143rd Street in Orland Park in the evening. This service was based in and dispatched from Decatur, where train and crew returned on weekends. While NS operated commuter service on the line, it was known as the Norfolk Southern Line; when Metra assumed operation of the service in 1993, the line was given its present name. Since then, Metra has gradually expanded service. The line was extended to 153rd Street in Orland Park in 1990, and on to 179th Street in 1995. In 2006, the line was extended to its current terminus in Manhattan (with a new intermediate station at Laraway Road). Fourteen trains per day were added as a part of this project, increasing service to 30 trains each weekday. In March 2009, Metra initiated Saturday service on the SWS and improved weekday service to the outermost stations on the line, at Laraway Road and Manhattan.
Two segments of single track limit the operation of more trains on the SWS: a two-mile segment between the Forest Hill interlocking and the Canadian National crossing near Ashburn Station, and a 17-mile segment between the 143rd Street/Orland Park Station and the Manhattan Station.
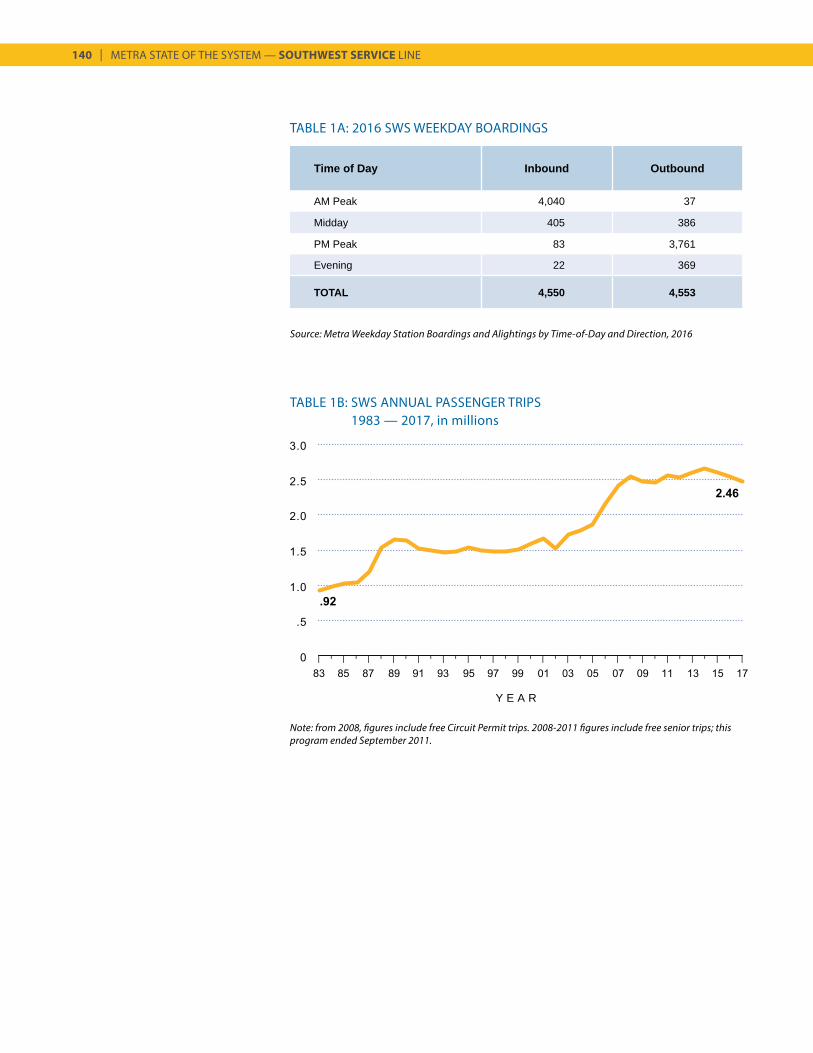
140 | METRA STATE OF THE SYSTEM — SOUTHWEST SERVICE LINE
Source: Metra Weekday Station Boardings and Alightings by Time-of-Day and Direction, 2016
TABLE 1A: 2016 SWS WEEKDAY BOARDINGS
TABLE 1B: SWS ANNUAL PASSENGER TRIPS1983 — 2017, in millions
Y E A R
Time of Day Inbound Outbound
AM Peak 4,040 37
Midday 405 386
PM Peak 83 3,761
Evening 22 369
TOTAL 4,550 4,553
Note: from 2008, figures include free Circuit Permit trips. 2008-2011 figures include free senior trips; this program ended September 2011.
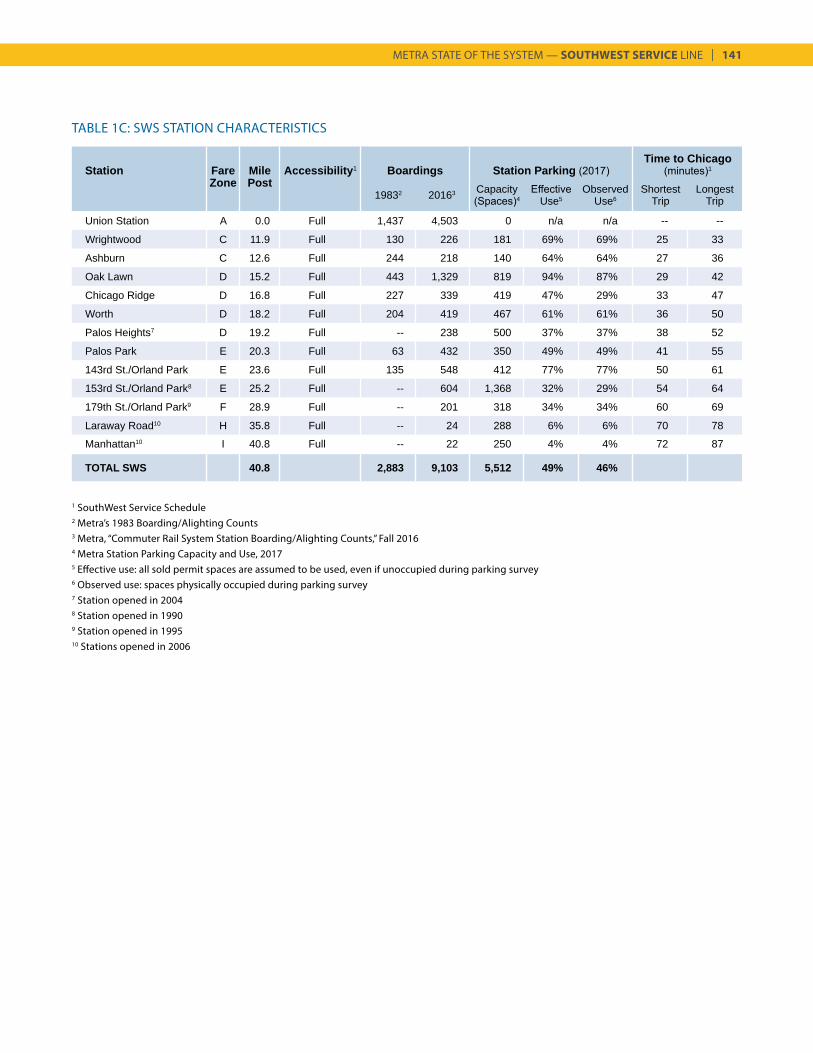
METRA STATE OF THE SYSTEM — SOUTHWEST SERVICE LINE | 141
TABLE 1C: SWS STATION CHARACTERISTICS
Station Fare Mile Accessibility1 Boardings Station Parking (2017)Time to Chicago
(minutes)1
Zone Post19832 20163 Capacity
(Spaces)4Effective
Use5Observed
Use6Shortest
TripLongest
Trip
Union Station A 0.0 Full 1,437 4,503 0 n/a n/a -- --
Wrightwood C 11.9 Full 130 226 181 69% 69% 25 33
Ashburn C 12.6 Full 244 218 140 64% 64% 27 36
Oak Lawn D 15.2 Full 443 1,329 819 94% 87% 29 42
Chicago Ridge D 16.8 Full 227 339 419 47% 29% 33 47
Worth D 18.2 Full 204 419 467 61% 61% 36 50
Palos Heights7 D 19.2 Full -- 238 500 37% 37% 38 52
Palos Park E 20.3 Full 63 432 350 49% 49% 41 55
143rd St./Orland Park E 23.6 Full 135 548 412 77% 77% 50 61
153rd St./Orland Park8 E 25.2 Full -- 604 1,368 32% 29% 54 64
179th St./Orland Park9 F 28.9 Full -- 201 318 34% 34% 60 69
Laraway Road10 H 35.8 Full -- 24 288 6% 6% 70 78
Manhattan10 I 40.8 Full -- 22 250 4% 4% 72 87
TOTAL SWS 40.8 2,883 9,103 5,512 49% 46%
1 SouthWest Service Schedule2 Metra’s 1983 Boarding/Alighting Counts3 Metra, “Commuter Rail System Station Boarding/Alighting Counts,” Fall 20164 Metra Station Parking Capacity and Use, 20175 Effective use: all sold permit spaces are assumed to be used, even if unoccupied during parking survey6 Observed use: spaces physically occupied during parking survey7 Station opened in 20048 Station opened in 19909 Station opened in 199510 Stations opened in 2006
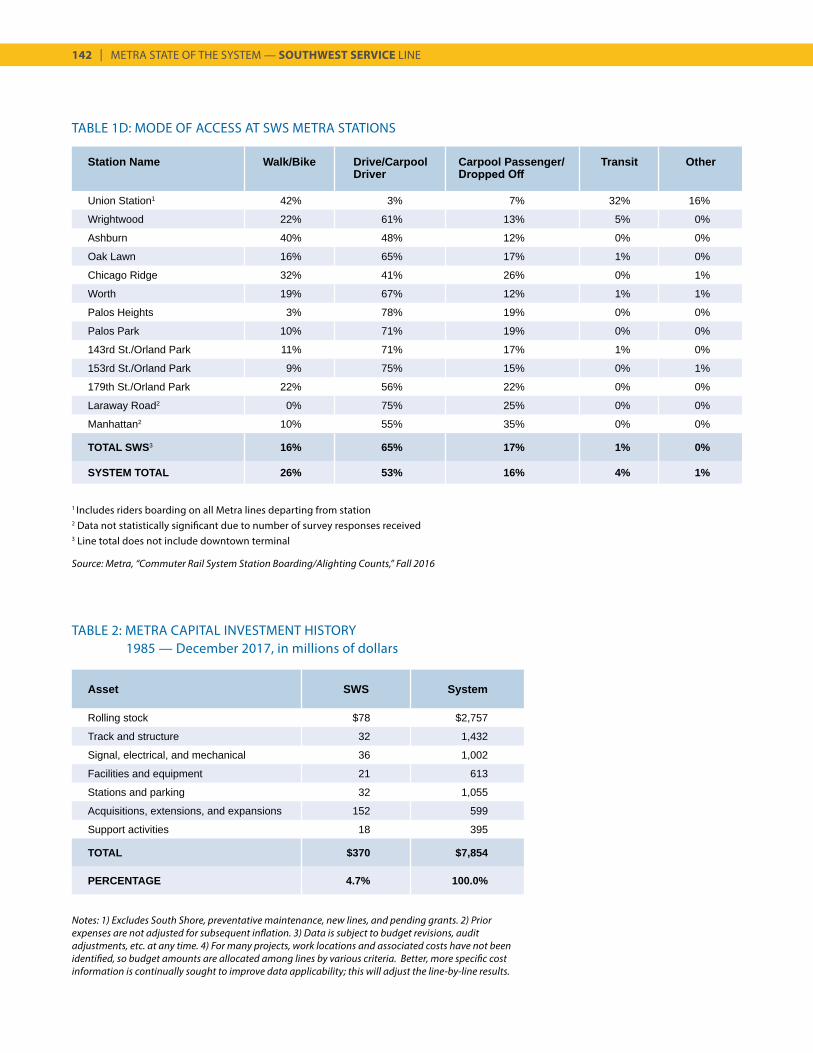
142 | METRA STATE OF THE SYSTEM — SOUTHWEST SERVICE LINE
TABLE 2: METRA CAPITAL INVESTMENT HISTORY 1985 — December 2017, in millions of dollars
Asset SWS System
Rolling stock $78 $2,757
Track and structure 32 1,432
Signal, electrical, and mechanical 36 1,002
Facilities and equipment 21 613
Stations and parking 32 1,055
Acquisitions, extensions, and expansions 152 599
Support activities 18 395
TOTAL $370 $7,854
PERCENTAGE 4.7% 100.0%
TABLE 1D: MODE OF ACCESS AT SWS METRA STATIONS
Station Name Walk/Bike Drive/Carpool Driver
Carpool Passenger/ Dropped Off
Transit Other
Union Station1 42% 3% 7% 32% 16%
Wrightwood 22% 61% 13% 5% 0%
Ashburn 40% 48% 12% 0% 0%
Oak Lawn 16% 65% 17% 1% 0%
Chicago Ridge 32% 41% 26% 0% 1%
Worth 19% 67% 12% 1% 1%
Palos Heights 3% 78% 19% 0% 0%
Palos Park 10% 71% 19% 0% 0%
143rd St./Orland Park 11% 71% 17% 1% 0%
153rd St./Orland Park 9% 75% 15% 0% 1%
179th St./Orland Park 22% 56% 22% 0% 0%
Laraway Road2 0% 75% 25% 0% 0%
Manhattan2 10% 55% 35% 0% 0%
TOTAL SWS3 16% 65% 17% 1% 0%
SYSTEM TOTAL 26% 53% 16% 4% 1%
Notes: 1) Excludes South Shore, preventative maintenance, new lines, and pending grants. 2) Prior expenses are not adjusted for subsequent inflation. 3) Data is subject to budget revisions, audit adjustments, etc. at any time. 4) For many projects, work locations and associated costs have not been identified, so budget amounts are allocated among lines by various criteria. Better, more specific cost information is continually sought to improve data applicability; this will adjust the line-by-line results.
1 Includes riders boarding on all Metra lines departing from station2 Data not statistically significant due to number of survey responses received3 Line total does not include downtown terminal
Source: Metra, “Commuter Rail System Station Boarding/Alighting Counts,” Fall 2016
METRA STATE OF THE SYSTEM — SOUTHWEST SERVICE LINE | 143
IMPROVEMENTS SINCE THE START OF METRA
Since 1985, Metra has invested $370 million (in year of expenditure dollars) in improvements to the SWS corridor. Table 2 indicates the amount of investment in different asset categories. This amount includes the 1990 and 1995 extensions, as well as the 2006 line upgrade and extension to Manhattan. Metra has completed improvements at a number of SWS stations since 1985 (see right), and over a dozen bridges have been repaired or replaced. Over the years, Metra has partnered with Amtrak, owner of CUS, to complete a number of upgrades to the terminal’s commuter facilities. For more information on proposed CUS improvements, see the CBD chapter of this report.
The 2006 upgrade project, which cost a total of $198 million, was funded in large part with a New Starts grant from the Federal Transit Administration. The project included extension of the route to Manhattan with an intermediate station at Laraway Road/New Lenox, doubling of service to 30 trains per day, a new coach yard in Manhattan to supplement the existing yard at 179th Street in Orland Park, installation of a second track between Palos Park and 143rd Street in Orland Park, and other track and signal improvements. The project also included the extension of station platforms with significant improvements at several stations, major parking expansion, and two new trainsets. As part of the project, 143rd Street, 153rd Street, Ashburn, Oak Lawn, and Palos Park Stations were rehabilitated and expanded to accommodate the ridership growth projected to follow the doubling in service.
In March 2009, Metra initiated Saturday service on the SWS, with three inbound and three outbound trains serving the line that day. Weekday service to the Laraway Road and Manhattan Stations was also improved, with a midday trip now serving both stations.
All SWS stations comply with the accessibility requirements of the Americans with Disabilities Act (ADA). Metra’s station compliance program started with designating four of the busiest SWS stations, including CUS in downtown Chicago, as “key stations”, all of which were made fully accessible by 2001.
All of the stations and platforms outside of downtown Chicago along the SWS Line were improved before or in 2006, so there are no plans at this time for improvements at these locations. However, additional facility expansions at these stations are possible in the long term, as ridership growth warrants.
Depots and warming houses constructed since 1985 at:143rd Street/Orland Park153rd St./Orland Park (new station)179th St./Orland Park (new station)AshburnChicago RidgeLaraway Rd./New Lenox (new station)Manhattan (new station)Oak LawnPalos Heights (new station)Palos ParkWorthWrightwood
Improvements planned for:Union Station
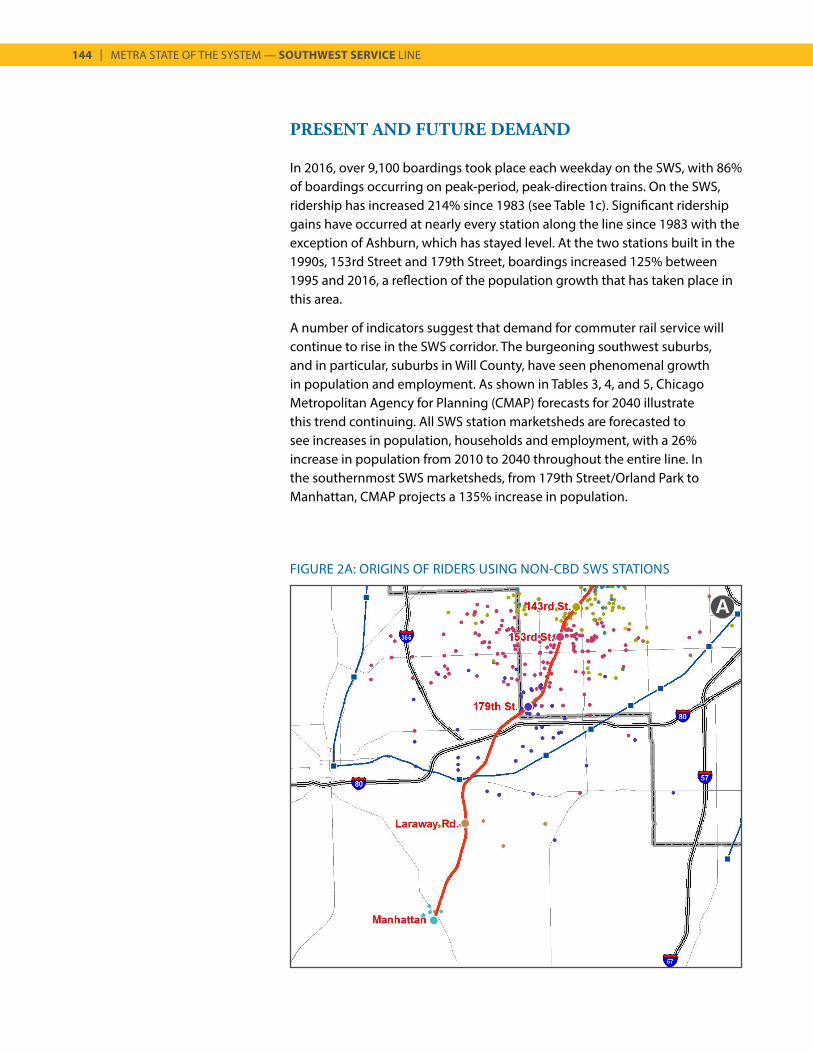
144 | METRA STATE OF THE SYSTEM — SOUTHWEST SERVICE LINE
PRESENT AND FUTURE DEMAND
In 2016, over 9,100 boardings took place each weekday on the SWS, with 86% of boardings occurring on peak-period, peak-direction trains. On the SWS, ridership has increased 214% since 1983 (see Table 1c). Significant ridership gains have occurred at nearly every station along the line since 1983 with the exception of Ashburn, which has stayed level. At the two stations built in the 1990s, 153rd Street and 179th Street, boardings increased 125% between 1995 and 2016, a reflection of the population growth that has taken place in this area.
A number of indicators suggest that demand for commuter rail service will continue to rise in the SWS corridor. The burgeoning southwest suburbs, and in particular, suburbs in Will County, have seen phenomenal growth in population and employment. As shown in Tables 3, 4, and 5, Chicago Metropolitan Agency for Planning (CMAP) forecasts for 2040 illustrate this trend continuing. All SWS station marketsheds are forecasted to see increases in population, households and employment, with a 26% increase in population from 2010 to 2040 throughout the entire line. In the southernmost SWS marketsheds, from 179th Street/Orland Park to Manhattan, CMAP projects a 135% increase in population.
A
FIGURE 2A: ORIGINS OF RIDERS USING NON-CBD SWS STATIONS
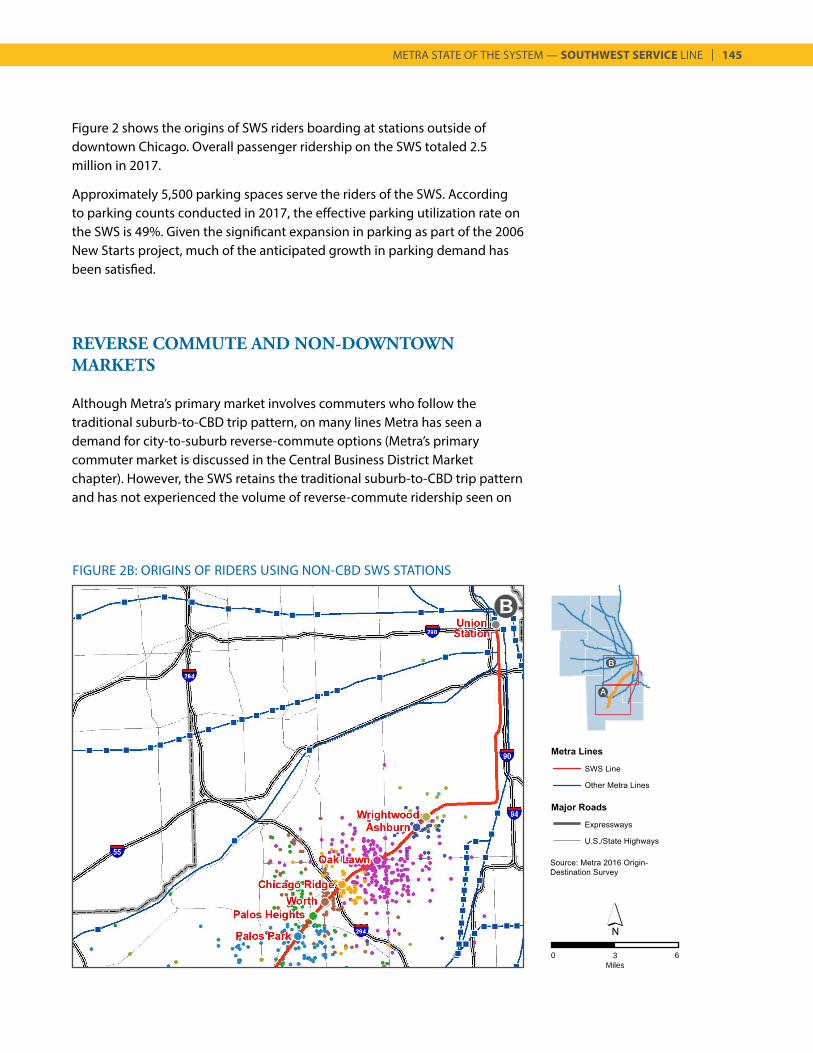
METRA STATE OF THE SYSTEM — SOUTHWEST SERVICE LINE | 145
Figure 2 shows the origins of SWS riders boarding at stations outside of downtown Chicago. Overall passenger ridership on the SWS totaled 2.5 million in 2017.
Approximately 5,500 parking spaces serve the riders of the SWS. According to parking counts conducted in 2017, the effective parking utilization rate on the SWS is 49%. Given the significant expansion in parking as part of the 2006 New Starts project, much of the anticipated growth in parking demand has been satisfied.
REVERSE COMMUTE AND NON-DOWNTOWN MARKETS
Although Metra’s primary market involves commuters who follow the traditional suburb-to-CBD trip pattern, on many lines Metra has seen a demand for city-to-suburb reverse-commute options (Metra’s primary commuter market is discussed in the Central Business District Market chapter). However, the SWS retains the traditional suburb-to-CBD trip pattern and has not experienced the volume of reverse-commute ridership seen on
FIGURE 2B: ORIGINS OF RIDERS USING NON-CBD SWS STATIONS
B
A
B
0 3Miles
6
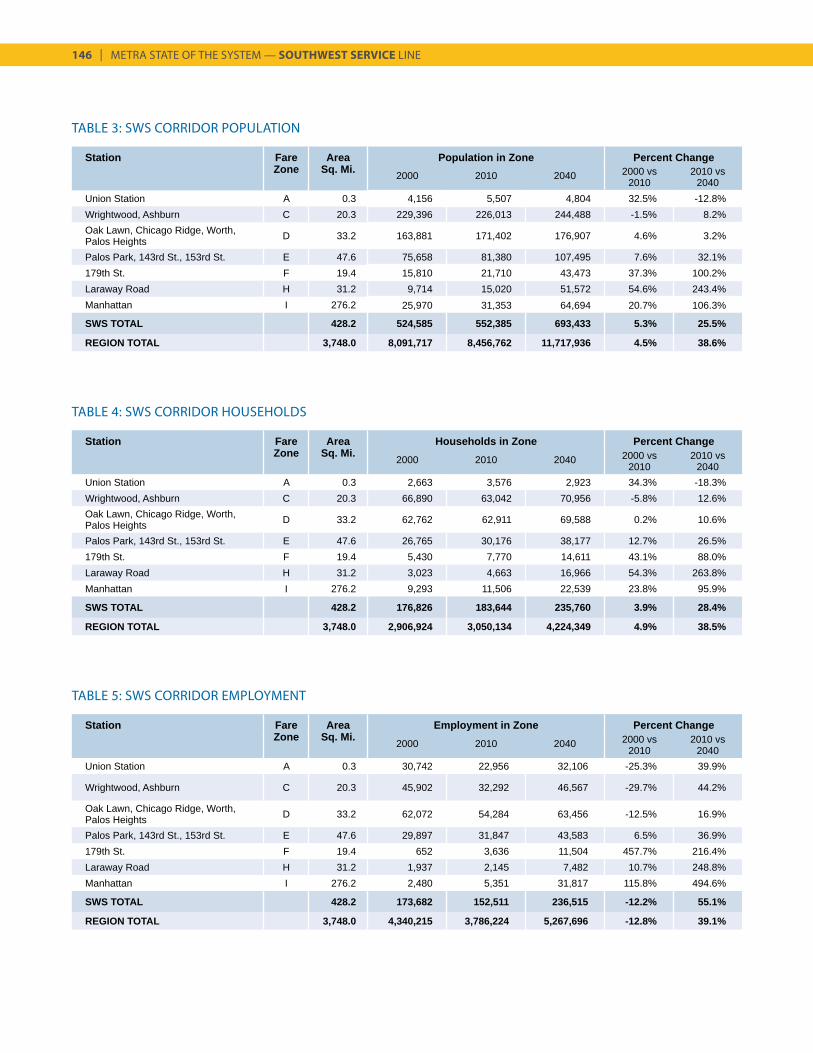
146 | METRA STATE OF THE SYSTEM — SOUTHWEST SERVICE LINE
TABLE 3: SWS CORRIDOR POPULATION
Station Fare Area Employment in Zone Percent ChangeZone Sq. Mi. 2000 2010 2040 2000 vs
20102010 vs
2040Union Station A 0.3 30,742 22,956 32,106 -25.3% 39.9%
Wrightwood, Ashburn C 20.3 45,902 32,292 46,567 -29.7% 44.2%
Oak Lawn, Chicago Ridge, Worth, Palos Heights D 33.2 62,072 54,284 63,456 -12.5% 16.9%
Palos Park, 143rd St., 153rd St. E 47.6 29,897 31,847 43,583 6.5% 36.9%179th St. F 19.4 652 3,636 11,504 457.7% 216.4%Laraway Road H 31.2 1,937 2,145 7,482 10.7% 248.8%Manhattan I 276.2 2,480 5,351 31,817 115.8% 494.6%
SWS TOTAL 428.2 173,682 152,511 236,515 -12.2% 55.1%
REGION TOTAL 3,748.0 4,340,215 3,786,224 5,267,696 -12.8% 39.1%
Station Fare Area Population in Zone Percent ChangeZone Sq. Mi. 2000 2010 2040 2000 vs
20102010 vs
2040Union Station A 0.3 4,156 5,507 4,804 32.5% -12.8%Wrightwood, Ashburn C 20.3 229,396 226,013 244,488 -1.5% 8.2%Oak Lawn, Chicago Ridge, Worth, Palos Heights D 33.2 163,881 171,402 176,907 4.6% 3.2%
Palos Park, 143rd St., 153rd St. E 47.6 75,658 81,380 107,495 7.6% 32.1%179th St. F 19.4 15,810 21,710 43,473 37.3% 100.2%Laraway Road H 31.2 9,714 15,020 51,572 54.6% 243.4%Manhattan I 276.2 25,970 31,353 64,694 20.7% 106.3%
SWS TOTAL 428.2 524,585 552,385 693,433 5.3% 25.5%
REGION TOTAL 3,748.0 8,091,717 8,456,762 11,717,936 4.5% 38.6%
Station Fare Area Households in Zone Percent ChangeZone Sq. Mi. 2000 2010 2040 2000 vs
20102010 vs
2040Union Station A 0.3 2,663 3,576 2,923 34.3% -18.3%Wrightwood, Ashburn C 20.3 66,890 63,042 70,956 -5.8% 12.6%Oak Lawn, Chicago Ridge, Worth, Palos Heights D 33.2 62,762 62,911 69,588 0.2% 10.6%
Palos Park, 143rd St., 153rd St. E 47.6 26,765 30,176 38,177 12.7% 26.5%179th St. F 19.4 5,430 7,770 14,611 43.1% 88.0%Laraway Road H 31.2 3,023 4,663 16,966 54.3% 263.8%Manhattan I 276.2 9,293 11,506 22,539 23.8% 95.9%
SWS TOTAL 428.2 176,826 183,644 235,760 3.9% 28.4%
REGION TOTAL 3,748.0 2,906,924 3,050,134 4,224,349 4.9% 38.5%
TABLE 5: SWS CORRIDOR EMPLOYMENT
TABLE 4: SWS CORRIDOR HOUSEHOLDS
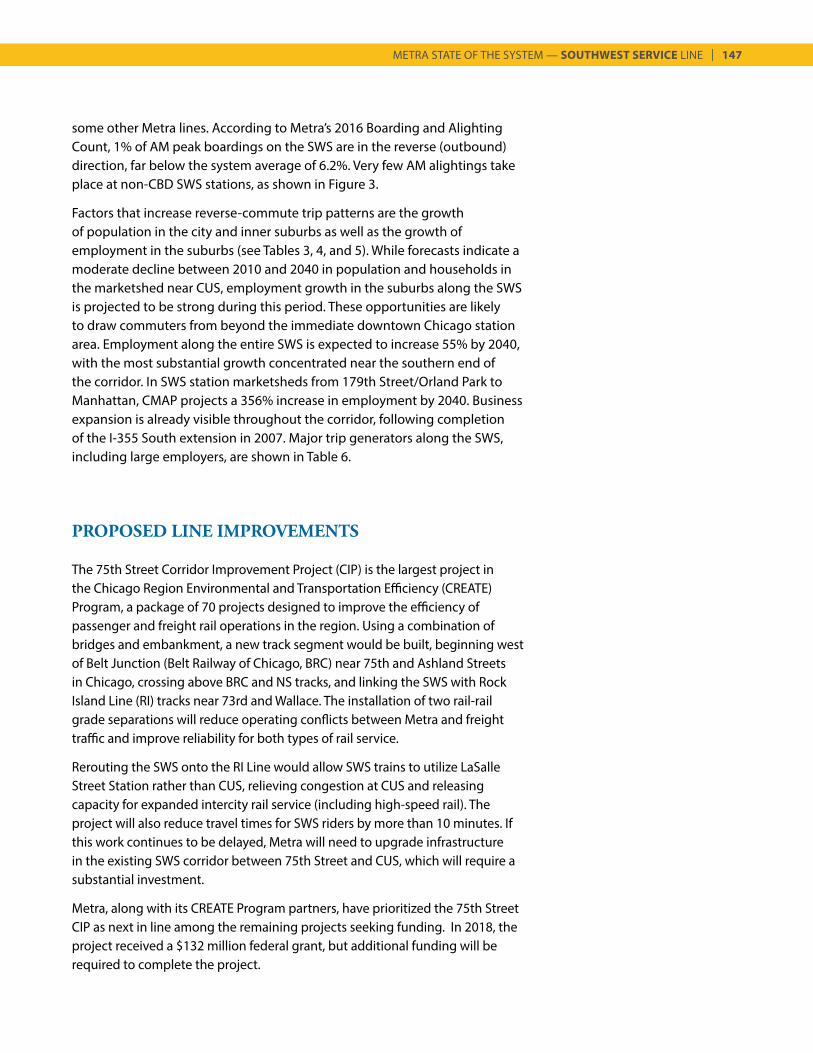
METRA STATE OF THE SYSTEM — SOUTHWEST SERVICE LINE | 147
some other Metra lines. According to Metra’s 2016 Boarding and Alighting Count, 1% of AM peak boardings on the SWS are in the reverse (outbound) direction, far below the system average of 6.2%. Very few AM alightings take place at non-CBD SWS stations, as shown in Figure 3.
Factors that increase reverse-commute trip patterns are the growth of population in the city and inner suburbs as well as the growth of employment in the suburbs (see Tables 3, 4, and 5). While forecasts indicate a moderate decline between 2010 and 2040 in population and households in the marketshed near CUS, employment growth in the suburbs along the SWS is projected to be strong during this period. These opportunities are likely to draw commuters from beyond the immediate downtown Chicago station area. Employment along the entire SWS is expected to increase 55% by 2040, with the most substantial growth concentrated near the southern end of the corridor. In SWS station marketsheds from 179th Street/Orland Park to Manhattan, CMAP projects a 356% increase in employment by 2040. Business expansion is already visible throughout the corridor, following completion of the I-355 South extension in 2007. Major trip generators along the SWS, including large employers, are shown in Table 6.
PROPOSED LINE IMPROVEMENTS
The 75th Street Corridor Improvement Project (CIP) is the largest project in the Chicago Region Environmental and Transportation Efficiency (CREATE) Program, a package of 70 projects designed to improve the efficiency of passenger and freight rail operations in the region. Using a combination of bridges and embankment, a new track segment would be built, beginning west of Belt Junction (Belt Railway of Chicago, BRC) near 75th and Ashland Streets in Chicago, crossing above BRC and NS tracks, and linking the SWS with Rock Island Line (RI) tracks near 73rd and Wallace. The installation of two rail-rail grade separations will reduce operating conflicts between Metra and freight traffic and improve reliability for both types of rail service.
Rerouting the SWS onto the RI Line would allow SWS trains to utilize LaSalle Street Station rather than CUS, relieving congestion at CUS and releasing capacity for expanded intercity rail service (including high-speed rail). The project will also reduce travel times for SWS riders by more than 10 minutes. If this work continues to be delayed, Metra will need to upgrade infrastructure in the existing SWS corridor between 75th Street and CUS, which will require a substantial investment.
Metra, along with its CREATE Program partners, have prioritized the 75th Street CIP as next in line among the remaining projects seeking funding. In 2018, the project received a $132 million federal grant, but additional funding will be required to complete the project.
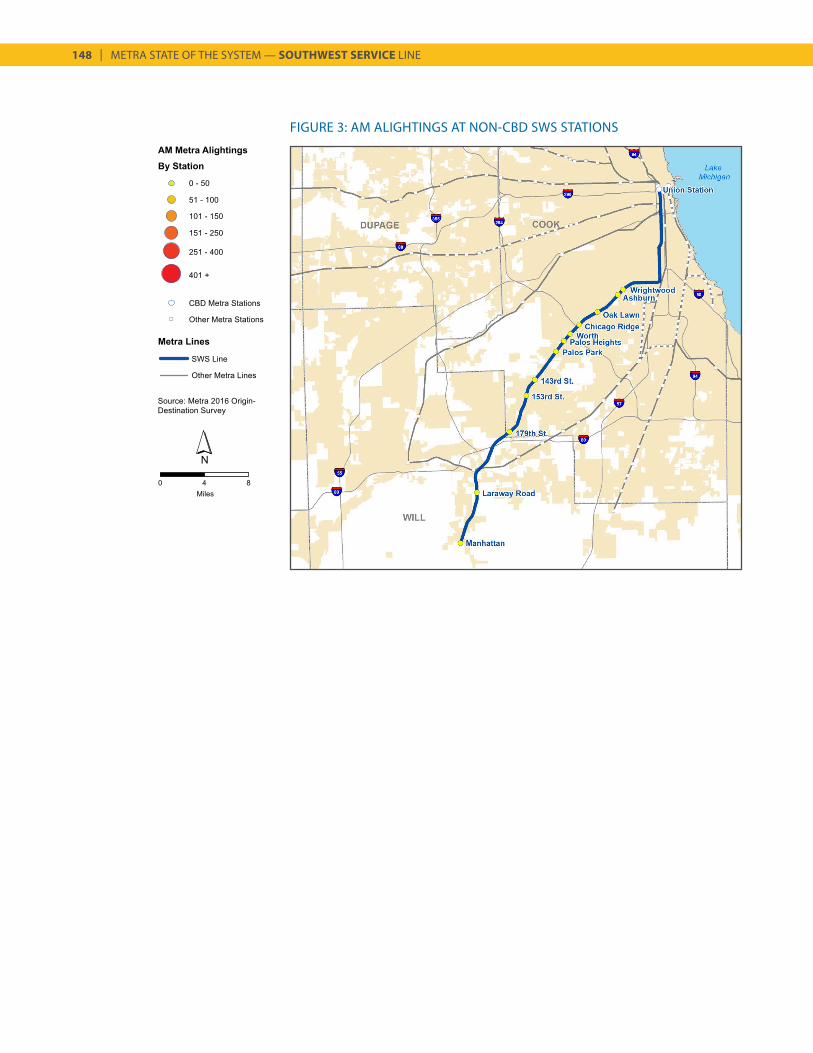
148 | METRA STATE OF THE SYSTEM — SOUTHWEST SERVICE LINE
FIGURE 3: AM ALIGHTINGS AT NON-CBD SWS STATIONS
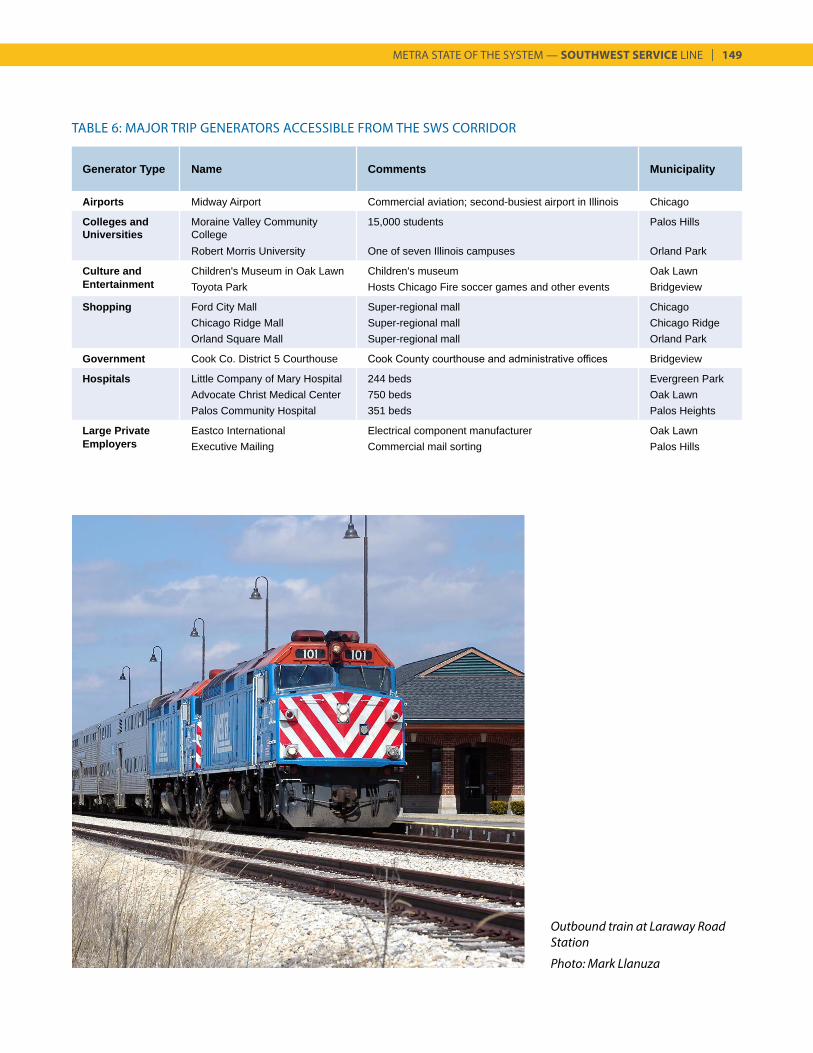
METRA STATE OF THE SYSTEM — SOUTHWEST SERVICE LINE | 149
Generator Type Name Comments Municipality
Airports Midway Airport Commercial aviation; second-busiest airport in Illinois Chicago
Colleges and Universities
Moraine Valley Community College
15,000 students Palos Hills
Robert Morris University One of seven Illinois campuses Orland Park
Culture and Children's Museum in Oak Lawn Children's museum Oak LawnEntertainment Toyota Park Hosts Chicago Fire soccer games and other events Bridgeview
Shopping Ford City Mall Super-regional mall ChicagoChicago Ridge Mall Super-regional mall Chicago RidgeOrland Square Mall Super-regional mall Orland Park
Government Cook Co. District 5 Courthouse Cook County courthouse and administrative offices Bridgeview
Hospitals Little Company of Mary Hospital 244 beds Evergreen ParkAdvocate Christ Medical Center 750 beds Oak LawnPalos Community Hospital 351 beds Palos Heights
Large Private Eastco International Electrical component manufacturer Oak LawnEmployers Executive Mailing Commercial mail sorting Palos Hills
TABLE 6: MAJOR TRIP GENERATORS ACCESSIBLE FROM THE SWS CORRIDOR
Outbound train at Laraway Road Station
Photo: Mark Llanuza
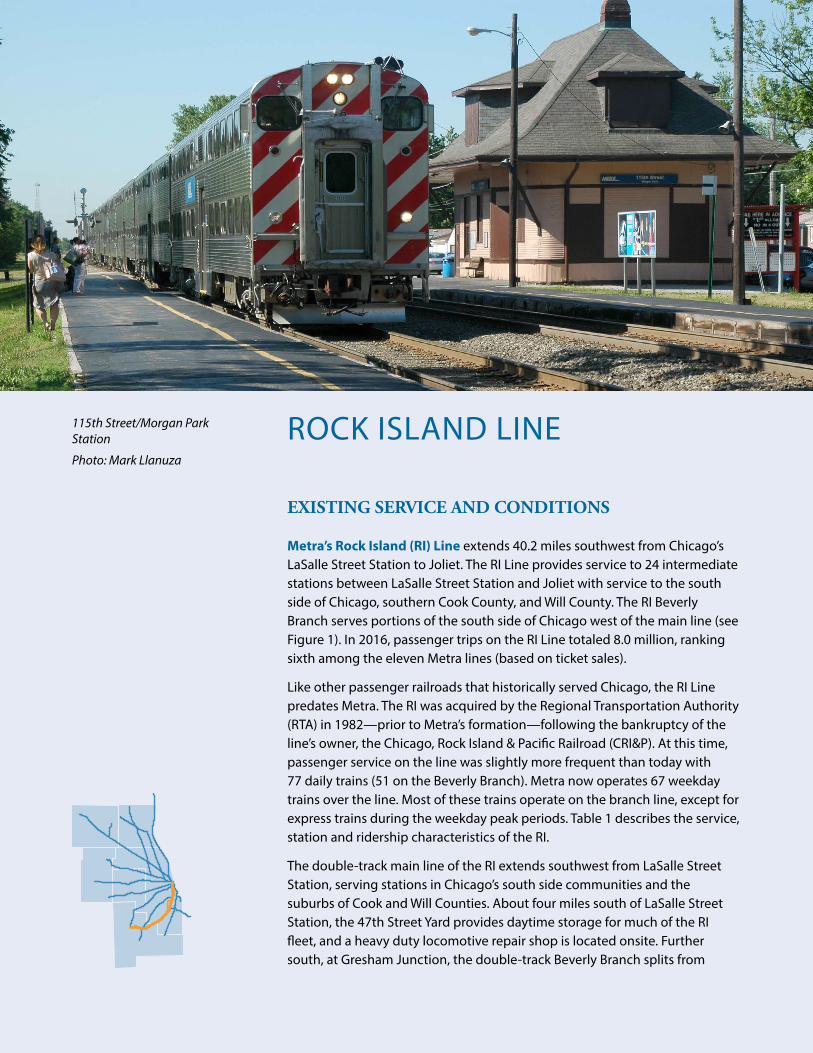
ROCK ISLAND LINE
EXISTING SERVICE AND CONDITIONS
Metra’s Rock Island (RI) Line extends 40.2 miles southwest from Chicago’s LaSalle Street Station to Joliet. The RI Line provides service to 24 intermediate stations between LaSalle Street Station and Joliet with service to the south side of Chicago, southern Cook County, and Will County. The RI Beverly Branch serves portions of the south side of Chicago west of the main line (see Figure 1). In 2016, passenger trips on the RI Line totaled 8.0 million, ranking sixth among the eleven Metra lines (based on ticket sales).
Like other passenger railroads that historically served Chicago, the RI Line predates Metra. The RI was acquired by the Regional Transportation Authority (RTA) in 1982—prior to Metra’s formation—following the bankruptcy of the line’s owner, the Chicago, Rock Island & Pacific Railroad (CRI&P). At this time, passenger service on the line was slightly more frequent than today with 77 daily trains (51 on the Beverly Branch). Metra now operates 67 weekday trains over the line. Most of these trains operate on the branch line, except for express trains during the weekday peak periods. Table 1 describes the service, station and ridership characteristics of the RI.
The double-track main line of the RI extends southwest from LaSalle Street Station, serving stations in Chicago’s south side communities and the suburbs of Cook and Will Counties. About four miles south of LaSalle Street Station, the 47th Street Yard provides daytime storage for much of the RI fleet, and a heavy duty locomotive repair shop is located onsite. Further south, at Gresham Junction, the double-track Beverly Branch splits from
115th Street/Morgan Park Station
Photo: Mark Llanuza
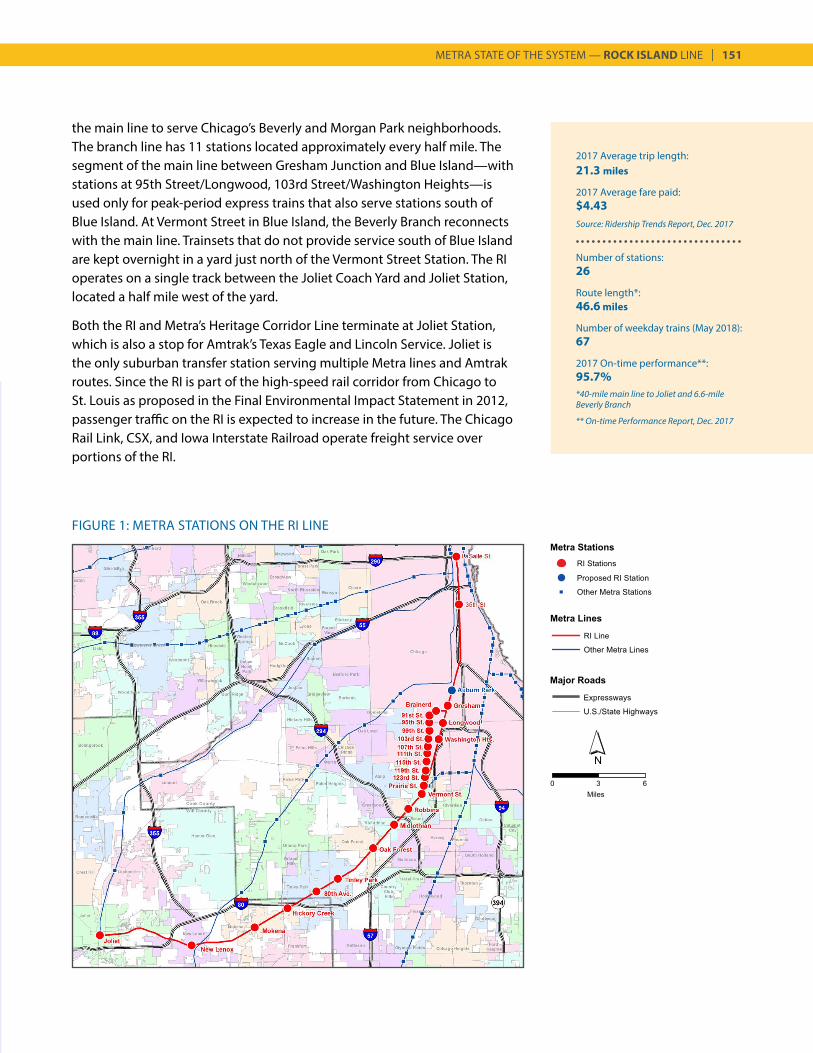
METRA STATE OF THE SYSTEM — ROCK ISLAND LINE | 151
2017 Average trip length:21.3 miles
2017 Average fare paid:$4.43Source: Ridership Trends Report, Dec. 2017
Number of stations:26
Route length*:46.6 miles
Number of weekday trains (May 2018):67
2017 On-time performance**:95.7%*40-mile main line to Joliet and 6.6-mile Beverly Branch
** On-time Performance Report, Dec. 2017
FIGURE 1: METRA STATIONS ON THE RI LINE
the main line to serve Chicago’s Beverly and Morgan Park neighborhoods. The branch line has 11 stations located approximately every half mile. The segment of the main line between Gresham Junction and Blue Island—with stations at 95th Street/Longwood, 103rd Street/Washington Heights—is used only for peak-period express trains that also serve stations south of Blue Island. At Vermont Street in Blue Island, the Beverly Branch reconnects with the main line. Trainsets that do not provide service south of Blue Island are kept overnight in a yard just north of the Vermont Street Station. The RI operates on a single track between the Joliet Coach Yard and Joliet Station, located a half mile west of the yard.
Both the RI and Metra’s Heritage Corridor Line terminate at Joliet Station, which is also a stop for Amtrak’s Texas Eagle and Lincoln Service. Joliet is the only suburban transfer station serving multiple Metra lines and Amtrak routes. Since the RI is part of the high-speed rail corridor from Chicago to St. Louis as proposed in the Final Environmental Impact Statement in 2012, passenger traffic on the RI is expected to increase in the future. The Chicago Rail Link, CSX, and Iowa Interstate Railroad operate freight service over portions of the RI.
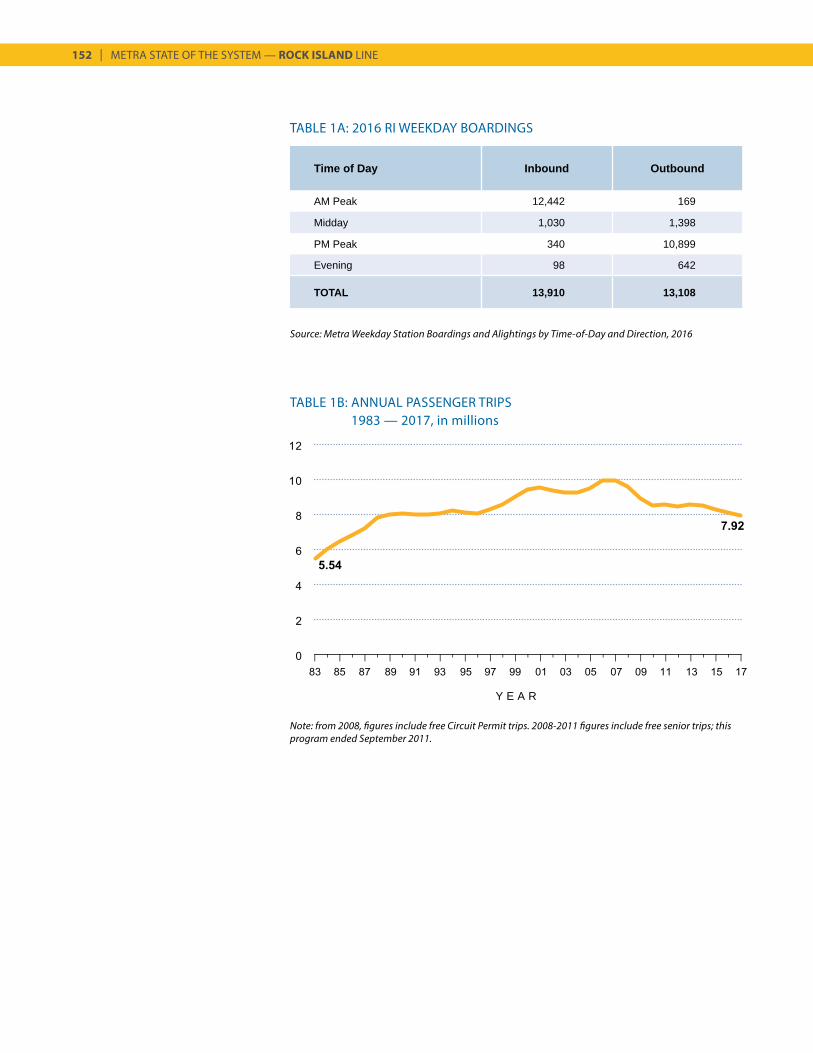
152 | METRA STATE OF THE SYSTEM — ROCK ISLAND LINE
Source: Metra Weekday Station Boardings and Alightings by Time-of-Day and Direction, 2016
TABLE 1A: 2016 RI WEEKDAY BOARDINGS
TABLE 1B: ANNUAL PASSENGER TRIPS1983 — 2017, in millions
Y E A R
Time of Day Inbound Outbound
AM Peak 12,442 169
Midday 1,030 1,398
PM Peak 340 10,899
Evening 98 642
TOTAL 13,910 13,108
Note: from 2008, figures include free Circuit Permit trips. 2008-2011 figures include free senior trips; this program ended September 2011.
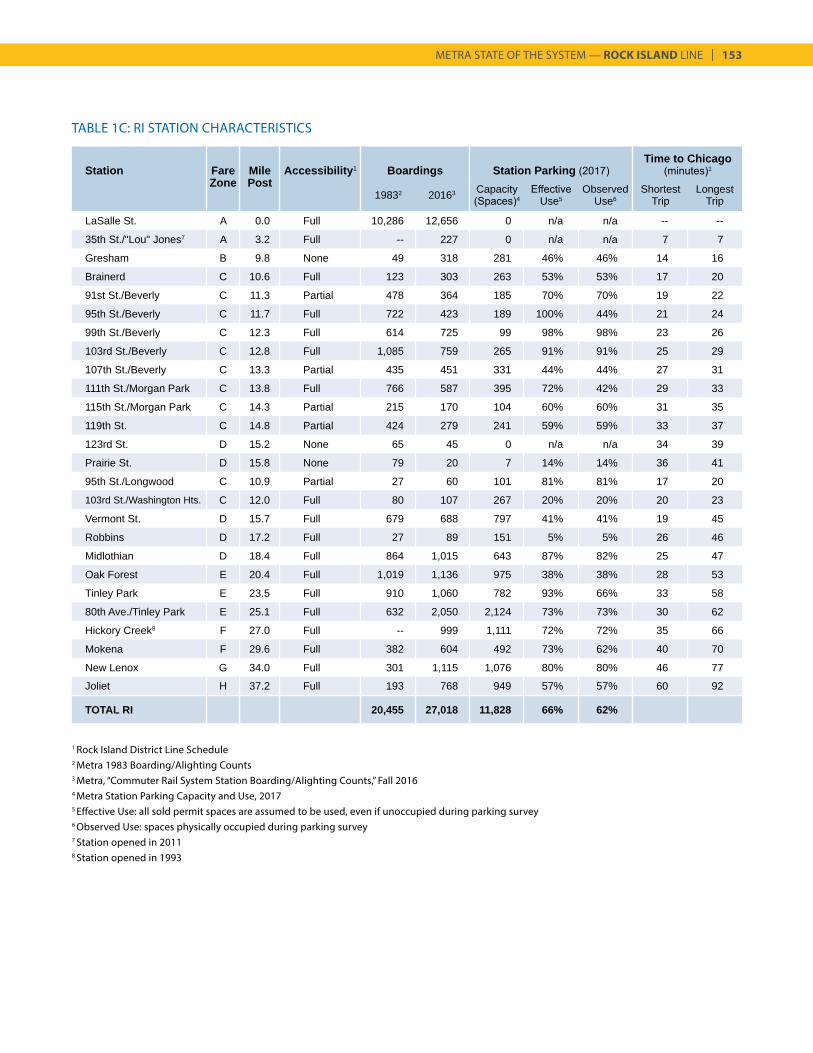
METRA STATE OF THE SYSTEM — ROCK ISLAND LINE | 153
TABLE 1C: RI STATION CHARACTERISTICS
Station Fare Mile Accessibility1 Boardings Station Parking (2017)Time to Chicago
(minutes)1
Zone Post19832 20163 Capacity
(Spaces)4Effective
Use5Observed
Use6Shortest
TripLongest
Trip
LaSalle St. A 0.0 Full 10,286 12,656 0 n/a n/a -- --
35th St./"Lou" Jones7 A 3.2 Full -- 227 0 n/a n/a 7 7
Gresham B 9.8 None 49 318 281 46% 46% 14 16
Brainerd C 10.6 Full 123 303 263 53% 53% 17 20
91st St./Beverly C 11.3 Partial 478 364 185 70% 70% 19 22
95th St./Beverly C 11.7 Full 722 423 189 100% 44% 21 24
99th St./Beverly C 12.3 Full 614 725 99 98% 98% 23 26
103rd St./Beverly C 12.8 Full 1,085 759 265 91% 91% 25 29
107th St./Beverly C 13.3 Partial 435 451 331 44% 44% 27 31
111th St./Morgan Park C 13.8 Full 766 587 395 72% 42% 29 33
115th St./Morgan Park C 14.3 Partial 215 170 104 60% 60% 31 35
119th St. C 14.8 Partial 424 279 241 59% 59% 33 37
123rd St. D 15.2 None 65 45 0 n/a n/a 34 39
Prairie St. D 15.8 None 79 20 7 14% 14% 36 41
95th St./Longwood C 10.9 Partial 27 60 101 81% 81% 17 20
103rd St./Washington Hts. C 12.0 Full 80 107 267 20% 20% 20 23
Vermont St. D 15.7 Full 679 688 797 41% 41% 19 45
Robbins D 17.2 Full 27 89 151 5% 5% 26 46
Midlothian D 18.4 Full 864 1,015 643 87% 82% 25 47
Oak Forest E 20.4 Full 1,019 1,136 975 38% 38% 28 53
Tinley Park E 23.5 Full 910 1,060 782 93% 66% 33 58
80th Ave./Tinley Park E 25.1 Full 632 2,050 2,124 73% 73% 30 62
Hickory Creek8 F 27.0 Full -- 999 1,111 72% 72% 35 66
Mokena F 29.6 Full 382 604 492 73% 62% 40 70
New Lenox G 34.0 Full 301 1,115 1,076 80% 80% 46 77
Joliet H 37.2 Full 193 768 949 57% 57% 60 92
TOTAL RI 20,455 27,018 11,828 66% 62%
1 Rock Island District Line Schedule2 Metra 1983 Boarding/Alighting Counts3 Metra, “Commuter Rail System Station Boarding/Alighting Counts,” Fall 20164 Metra Station Parking Capacity and Use, 20175 Effective Use: all sold permit spaces are assumed to be used, even if unoccupied during parking survey6 Observed Use: spaces physically occupied during parking survey7 Station opened in 20118 Station opened in 1993
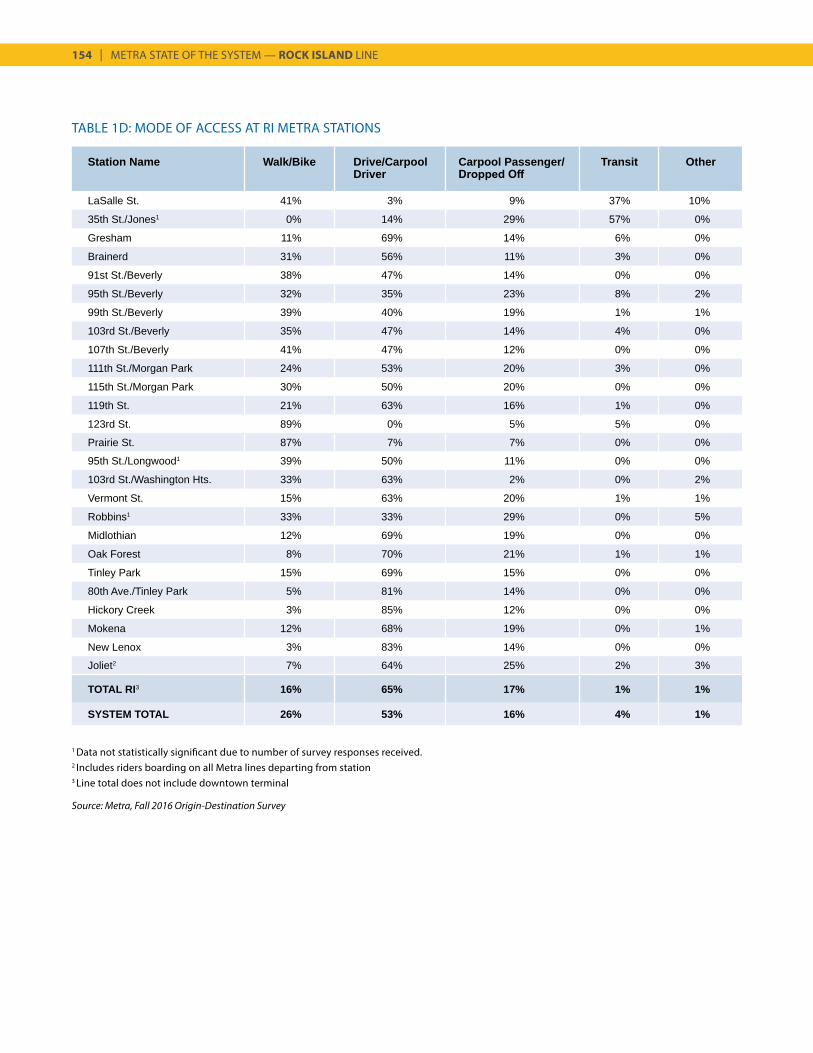
154 | METRA STATE OF THE SYSTEM — ROCK ISLAND LINE
TABLE 1D: MODE OF ACCESS AT RI METRA STATIONS
Station Name Walk/Bike Drive/Carpool Driver
Carpool Passenger/ Dropped Off
Transit Other
LaSalle St. 41% 3% 9% 37% 10%
35th St./Jones1 0% 14% 29% 57% 0%
Gresham 11% 69% 14% 6% 0%
Brainerd 31% 56% 11% 3% 0%
91st St./Beverly 38% 47% 14% 0% 0%
95th St./Beverly 32% 35% 23% 8% 2%
99th St./Beverly 39% 40% 19% 1% 1%
103rd St./Beverly 35% 47% 14% 4% 0%
107th St./Beverly 41% 47% 12% 0% 0%
111th St./Morgan Park 24% 53% 20% 3% 0%
115th St./Morgan Park 30% 50% 20% 0% 0%
119th St. 21% 63% 16% 1% 0%
123rd St. 89% 0% 5% 5% 0%
Prairie St. 87% 7% 7% 0% 0%
95th St./Longwood1 39% 50% 11% 0% 0%
103rd St./Washington Hts. 33% 63% 2% 0% 2%
Vermont St. 15% 63% 20% 1% 1%
Robbins1 33% 33% 29% 0% 5%
Midlothian 12% 69% 19% 0% 0%
Oak Forest 8% 70% 21% 1% 1%
Tinley Park 15% 69% 15% 0% 0%
80th Ave./Tinley Park 5% 81% 14% 0% 0%
Hickory Creek 3% 85% 12% 0% 0%
Mokena 12% 68% 19% 0% 1%
New Lenox 3% 83% 14% 0% 0%
Joliet2 7% 64% 25% 2% 3%
TOTAL RI3 16% 65% 17% 1% 1%
SYSTEM TOTAL 26% 53% 16% 4% 1%
1 Data not statistically significant due to number of survey responses received.2 Includes riders boarding on all Metra lines departing from station3 Line total does not include downtown terminal
Source: Metra, Fall 2016 Origin-Destination Survey
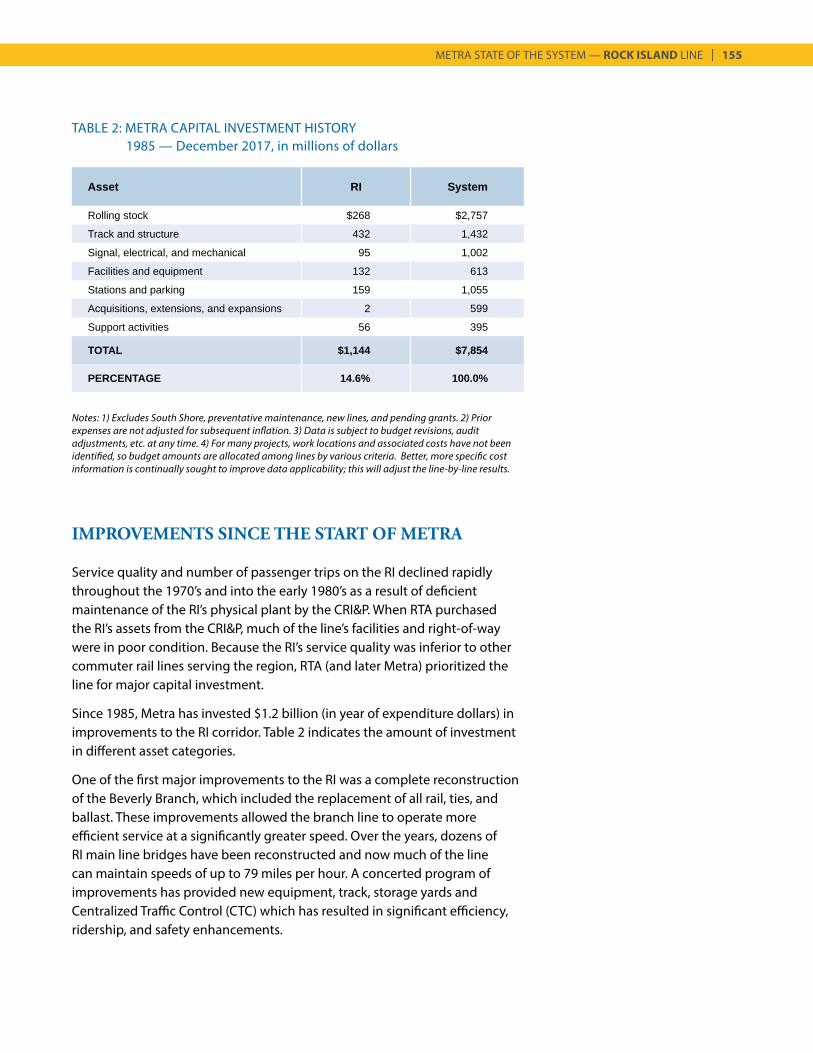
METRA STATE OF THE SYSTEM — ROCK ISLAND LINE | 155
IMPROVEMENTS SINCE THE START OF METRA
Service quality and number of passenger trips on the RI declined rapidly throughout the 1970’s and into the early 1980’s as a result of deficient maintenance of the RI’s physical plant by the CRI&P. When RTA purchased the RI’s assets from the CRI&P, much of the line’s facilities and right-of-way were in poor condition. Because the RI’s service quality was inferior to other commuter rail lines serving the region, RTA (and later Metra) prioritized the line for major capital investment.
Since 1985, Metra has invested $1.2 billion (in year of expenditure dollars) in improvements to the RI corridor. Table 2 indicates the amount of investment in different asset categories.
One of the first major improvements to the RI was a complete reconstruction of the Beverly Branch, which included the replacement of all rail, ties, and ballast. These improvements allowed the branch line to operate more efficient service at a significantly greater speed. Over the years, dozens of RI main line bridges have been reconstructed and now much of the line can maintain speeds of up to 79 miles per hour. A concerted program of improvements has provided new equipment, track, storage yards and Centralized Traffic Control (CTC) which has resulted in significant efficiency, ridership, and safety enhancements.
TABLE 2: METRA CAPITAL INVESTMENT HISTORY 1985 — December 2017, in millions of dollars
Asset RI System
Rolling stock $268 $2,757
Track and structure 432 1,432
Signal, electrical, and mechanical 95 1,002
Facilities and equipment 132 613
Stations and parking 159 1,055
Acquisitions, extensions, and expansions 2 599
Support activities 56 395
TOTAL $1,144 $7,854
PERCENTAGE 14.6% 100.0%
Notes: 1) Excludes South Shore, preventative maintenance, new lines, and pending grants. 2) Prior expenses are not adjusted for subsequent inflation. 3) Data is subject to budget revisions, audit adjustments, etc. at any time. 4) For many projects, work locations and associated costs have not been identified, so budget amounts are allocated among lines by various criteria. Better, more specific cost information is continually sought to improve data applicability; this will adjust the line-by-line results.
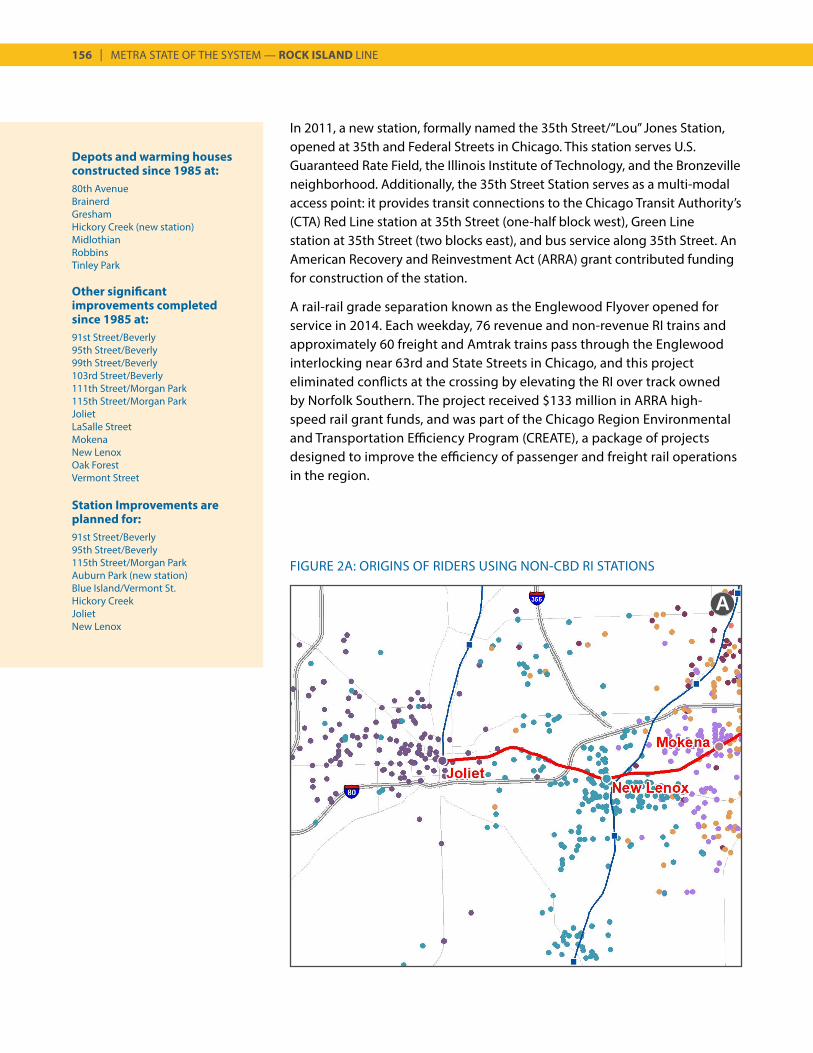
156 | METRA STATE OF THE SYSTEM — ROCK ISLAND LINE
A
FIGURE 2A: ORIGINS OF RIDERS USING NON-CBD RI STATIONS
In 2011, a new station, formally named the 35th Street/“Lou” Jones Station, opened at 35th and Federal Streets in Chicago. This station serves U.S. Guaranteed Rate Field, the Illinois Institute of Technology, and the Bronzeville neighborhood. Additionally, the 35th Street Station serves as a multi-modal access point: it provides transit connections to the Chicago Transit Authority’s (CTA) Red Line station at 35th Street (one-half block west), Green Line station at 35th Street (two blocks east), and bus service along 35th Street. An American Recovery and Reinvestment Act (ARRA) grant contributed funding for construction of the station.
A rail-rail grade separation known as the Englewood Flyover opened for service in 2014. Each weekday, 76 revenue and non-revenue RI trains and approximately 60 freight and Amtrak trains pass through the Englewood interlocking near 63rd and State Streets in Chicago, and this project eliminated conflicts at the crossing by elevating the RI over track owned by Norfolk Southern. The project received $133 million in ARRA high-speed rail grant funds, and was part of the Chicago Region Environmental and Transportation Efficiency Program (CREATE), a package of projects designed to improve the efficiency of passenger and freight rail operations in the region.
Depots and warming houses constructed since 1985 at:80th AvenueBrainerd Gresham Hickory Creek (new station)MidlothianRobbinsTinley Park
Other significant improvements completed since 1985 at:91st Street/Beverly95th Street/Beverly99th Street/Beverly103rd Street/Beverly111th Street/Morgan Park115th Street/Morgan ParkJolietLaSalle StreetMokenaNew LenoxOak ForestVermont Street
Station Improvements are planned for:91st Street/Beverly95th Street/Beverly115th Street/Morgan ParkAuburn Park (new station) Blue Island/Vermont St.Hickory Creek Joliet New Lenox
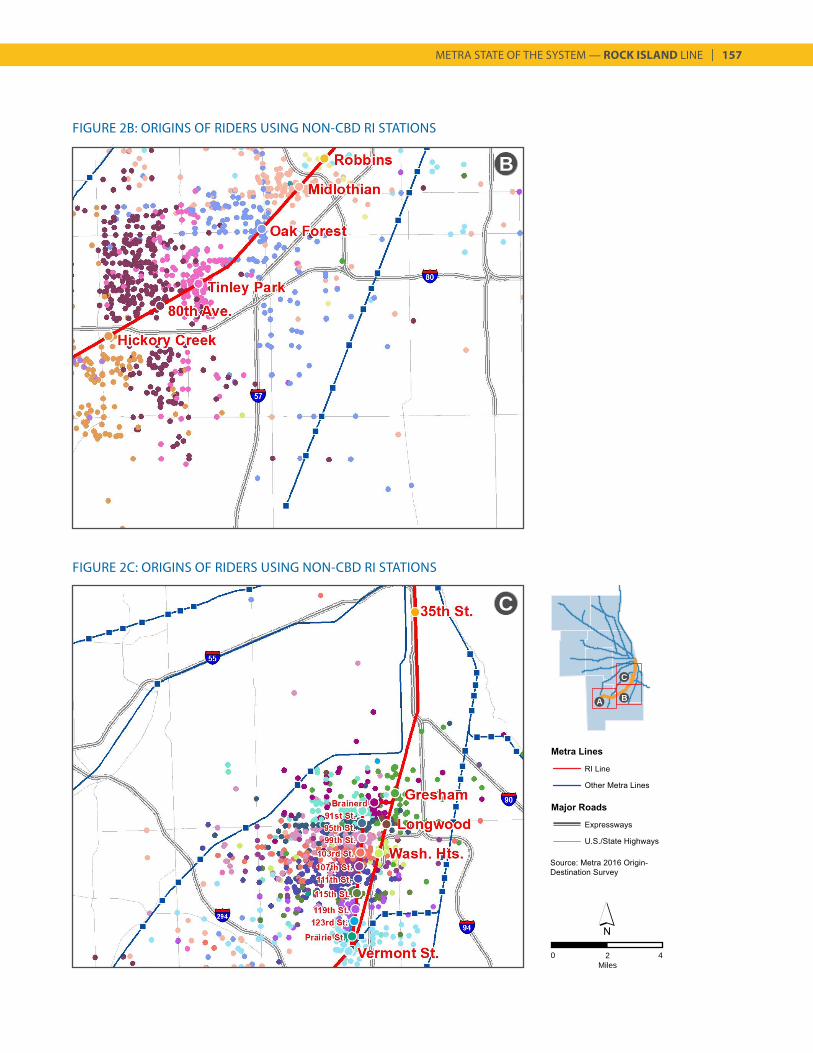
METRA STATE OF THE SYSTEM — ROCK ISLAND LINE | 157
0 2Miles
4
FIGURE 2C: ORIGINS OF RIDERS USING NON-CBD RI STATIONS
FIGURE 2B: ORIGINS OF RIDERS USING NON-CBD RI STATIONS
C
B
A B
C
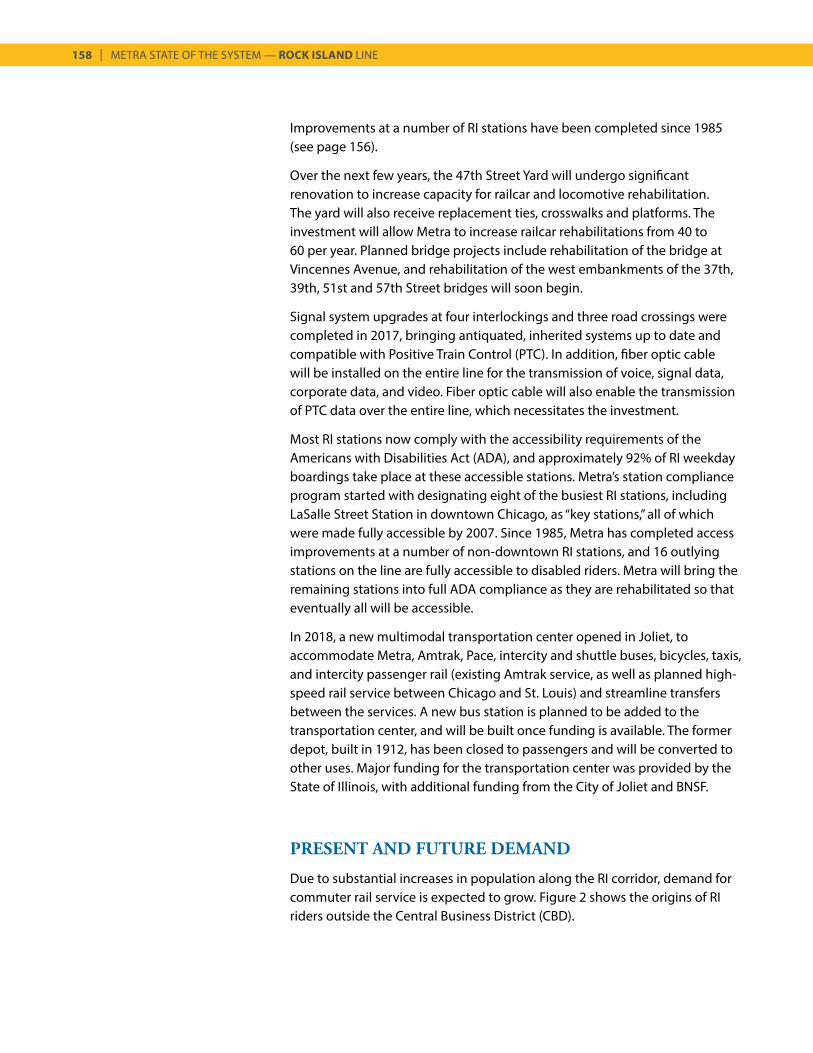
158 | METRA STATE OF THE SYSTEM — ROCK ISLAND LINE
Improvements at a number of RI stations have been completed since 1985 (see page 156).
Over the next few years, the 47th Street Yard will undergo significant renovation to increase capacity for railcar and locomotive rehabilitation. The yard will also receive replacement ties, crosswalks and platforms. The investment will allow Metra to increase railcar rehabilitations from 40 to 60 per year. Planned bridge projects include rehabilitation of the bridge at Vincennes Avenue, and rehabilitation of the west embankments of the 37th, 39th, 51st and 57th Street bridges will soon begin.
Signal system upgrades at four interlockings and three road crossings were completed in 2017, bringing antiquated, inherited systems up to date and compatible with Positive Train Control (PTC). In addition, fiber optic cable will be installed on the entire line for the transmission of voice, signal data, corporate data, and video. Fiber optic cable will also enable the transmission of PTC data over the entire line, which necessitates the investment.
Most RI stations now comply with the accessibility requirements of the Americans with Disabilities Act (ADA), and approximately 92% of RI weekday boardings take place at these accessible stations. Metra’s station compliance program started with designating eight of the busiest RI stations, including LaSalle Street Station in downtown Chicago, as “key stations,” all of which were made fully accessible by 2007. Since 1985, Metra has completed access improvements at a number of non-downtown RI stations, and 16 outlying stations on the line are fully accessible to disabled riders. Metra will bring the remaining stations into full ADA compliance as they are rehabilitated so that eventually all will be accessible.
In 2018, a new multimodal transportation center opened in Joliet, to accommodate Metra, Amtrak, Pace, intercity and shuttle buses, bicycles, taxis, and intercity passenger rail (existing Amtrak service, as well as planned high-speed rail service between Chicago and St. Louis) and streamline transfers between the services. A new bus station is planned to be added to the transportation center, and will be built once funding is available. The former depot, built in 1912, has been closed to passengers and will be converted to other uses. Major funding for the transportation center was provided by the State of Illinois, with additional funding from the City of Joliet and BNSF.
PRESENT AND FUTURE DEMAND
Due to substantial increases in population along the RI corridor, demand for commuter rail service is expected to grow. Figure 2 shows the origins of RI riders outside the Central Business District (CBD).
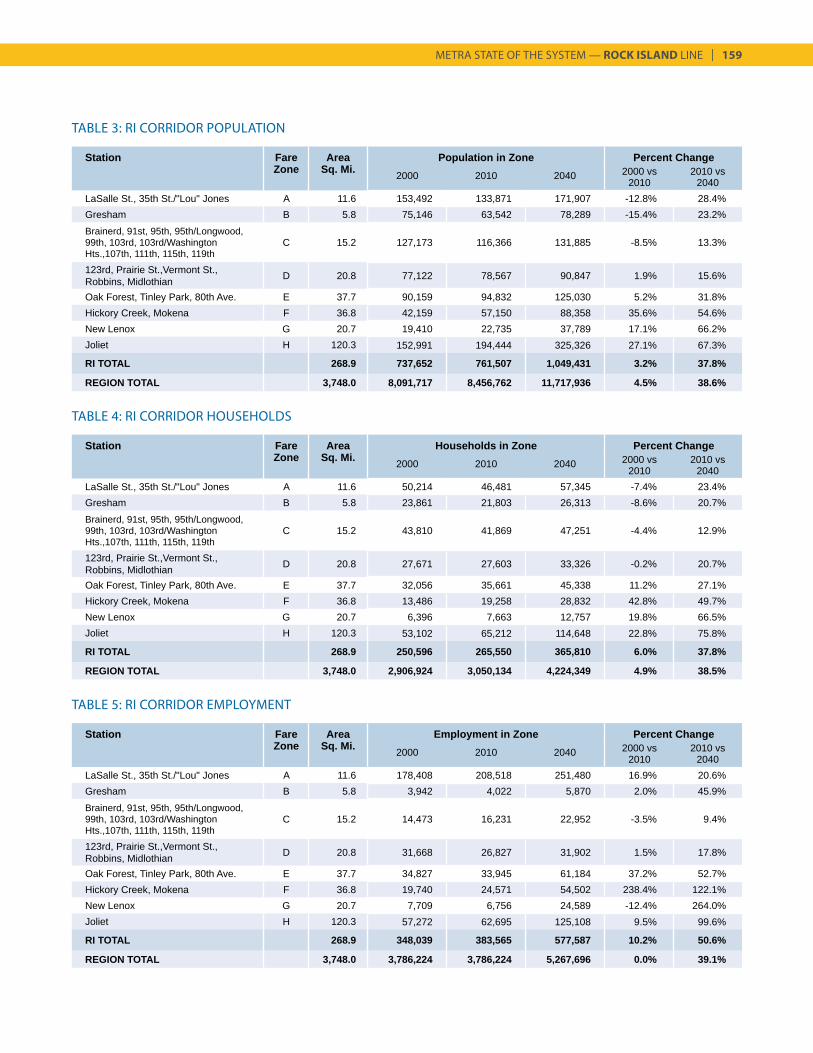
METRA STATE OF THE SYSTEM — ROCK ISLAND LINE | 159
TABLE 3: RI CORRIDOR POPULATION
Station Fare Area Population in Zone Percent ChangeZone Sq. Mi. 2000 2010 2040 2000 vs
20102010 vs
2040LaSalle St., 35th St./"Lou" Jones A 11.6 153,492 133,871 171,907 -12.8% 28.4%Gresham B 5.8 75,146 63,542 78,289 -15.4% 23.2%Brainerd, 91st, 95th, 95th/Longwood, 99th, 103rd, 103rd/Washington Hts.,107th, 111th, 115th, 119th
C 15.2 127,173 116,366 131,885 -8.5% 13.3%
123rd, Prairie St.,Vermont St., Robbins, Midlothian D 20.8 77,122 78,567 90,847 1.9% 15.6%
Oak Forest, Tinley Park, 80th Ave. E 37.7 90,159 94,832 125,030 5.2% 31.8%Hickory Creek, Mokena F 36.8 42,159 57,150 88,358 35.6% 54.6%New Lenox G 20.7 19,410 22,735 37,789 17.1% 66.2%Joliet H 120.3 152,991 194,444 325,326 27.1% 67.3%
RI TOTAL 268.9 737,652 761,507 1,049,431 3.2% 37.8%
REGION TOTAL 3,748.0 8,091,717 8,456,762 11,717,936 4.5% 38.6%
Station Fare Area Households in Zone Percent ChangeZone Sq. Mi. 2000 2010 2040 2000 vs
20102010 vs
2040LaSalle St., 35th St./"Lou" Jones A 11.6 50,214 46,481 57,345 -7.4% 23.4%Gresham B 5.8 23,861 21,803 26,313 -8.6% 20.7%Brainerd, 91st, 95th, 95th/Longwood, 99th, 103rd, 103rd/Washington Hts.,107th, 111th, 115th, 119th
C 15.2 43,810 41,869 47,251 -4.4% 12.9%
123rd, Prairie St.,Vermont St., Robbins, Midlothian D 20.8 27,671 27,603 33,326 -0.2% 20.7%
Oak Forest, Tinley Park, 80th Ave. E 37.7 32,056 35,661 45,338 11.2% 27.1%Hickory Creek, Mokena F 36.8 13,486 19,258 28,832 42.8% 49.7%New Lenox G 20.7 6,396 7,663 12,757 19.8% 66.5%Joliet H 120.3 53,102 65,212 114,648 22.8% 75.8%
RI TOTAL 268.9 250,596 265,550 365,810 6.0% 37.8%
REGION TOTAL 3,748.0 2,906,924 3,050,134 4,224,349 4.9% 38.5%
Station Fare Area Employment in Zone Percent ChangeZone Sq. Mi. 2000 2010 2040 2000 vs
20102010 vs
2040LaSalle St., 35th St./"Lou" Jones A 11.6 178,408 208,518 251,480 16.9% 20.6%Gresham B 5.8 3,942 4,022 5,870 2.0% 45.9%Brainerd, 91st, 95th, 95th/Longwood, 99th, 103rd, 103rd/Washington Hts.,107th, 111th, 115th, 119th
C 15.2 14,473 16,231 22,952 -3.5% 9.4%
123rd, Prairie St.,Vermont St., Robbins, Midlothian D 20.8 31,668 26,827 31,902 1.5% 17.8%
Oak Forest, Tinley Park, 80th Ave. E 37.7 34,827 33,945 61,184 37.2% 52.7%Hickory Creek, Mokena F 36.8 19,740 24,571 54,502 238.4% 122.1%New Lenox G 20.7 7,709 6,756 24,589 -12.4% 264.0%Joliet H 120.3 57,272 62,695 125,108 9.5% 99.6%
RI TOTAL 268.9 348,039 383,565 577,587 10.2% 50.6%
REGION TOTAL 3,748.0 3,786,224 3,786,224 5,267,696 0.0% 39.1%
TABLE 5: RI CORRIDOR EMPLOYMENT
TABLE 4: RI CORRIDOR HOUSEHOLDS
160 | METRA STATE OF THE SYSTEM — ROCK ISLAND LINE
According to Metra’s 2016 Metra Boarding and Alighting Count, the RI had over 27,000 boardings on 67 trains serving 25 stations between Joliet and Chicago, with 86% of boardings on peak-period, peak-direction trains. Overall, the RI has seen a 32% increase in boardings since 1983 (see Table 1c). Ridership has grown most significantly at stations nearest downtown Chicago (Gresham, 549%; Brainerd, 146%) as well as in the burgeoning suburbs of Will County (New Lenox, 270%; Joliet, 298%). Except for Brainerd, 107th Street/Beverly Hills and 99th Street/Beverly Hills, however, ridership at Beverly Branch stations has remained even or diminished, with a decline of 22% at Beverly Branch stations south of Brainerd. Meanwhile, 95th Street/Longwood, and 103rd Street/Washington Heights—on the RI main line directly east of the Beverly Branch—have seen increases in ridership (an average increase of 56%). These trends suggest a shift in ridership towards the main line, which provides express service on the south side of Chicago, and an increase in passengers from the suburban stations. The largest increases in ridership on the southwest end of the RI have occurred at Robbins, 80th Avenue, New Lenox, and Joliet. Overall passenger ridership on the RI totaled 8.0 million in 2016.
Approximately 11,800 parking spaces serve riders on the RI. According to parking counts conducted in 2017, the effective utilization rate on the RI is 66%. When utilization of station parking areas exceeds 85%, Metra considers that they are approaching full capacity. Five RI stations exceed this threshold, indicating a demand for increased parking at these stations.
RI ridership is likely to see ridership gains in the future. The south suburbs, and suburbs in Will County in particular, have seen phenomenal growth in population and employment. Chicago Metropolitan Agency for Planning (CMAP) forecasts for 2040 show this trend continuing, and all station marketsheds on the RI are forecasted to see increases in population, households and employment. In fact, CMAP forecasts suggest a 38% increase in population from 2010 to 2040 throughout the entire corridor.
Employment growth will be a significant factor in ridership. A 51% increase in employment is projected for marketsheds in the RI corridor from 2010 to 2040. Projections indicate that the RI marketsheds with the biggest percentage increases in population, households and employment in the RI corridor will continue to be in Will County. Tables 3, 4 and 5 describe the demographics in the RI corridor.
REVERSE COMMUTE AND NON-DOWNTOWN MARKETS
Although Metra’s primary market involves commuters who follow the traditional suburb-to-CBD trip pattern, in recent years Metra has seen a
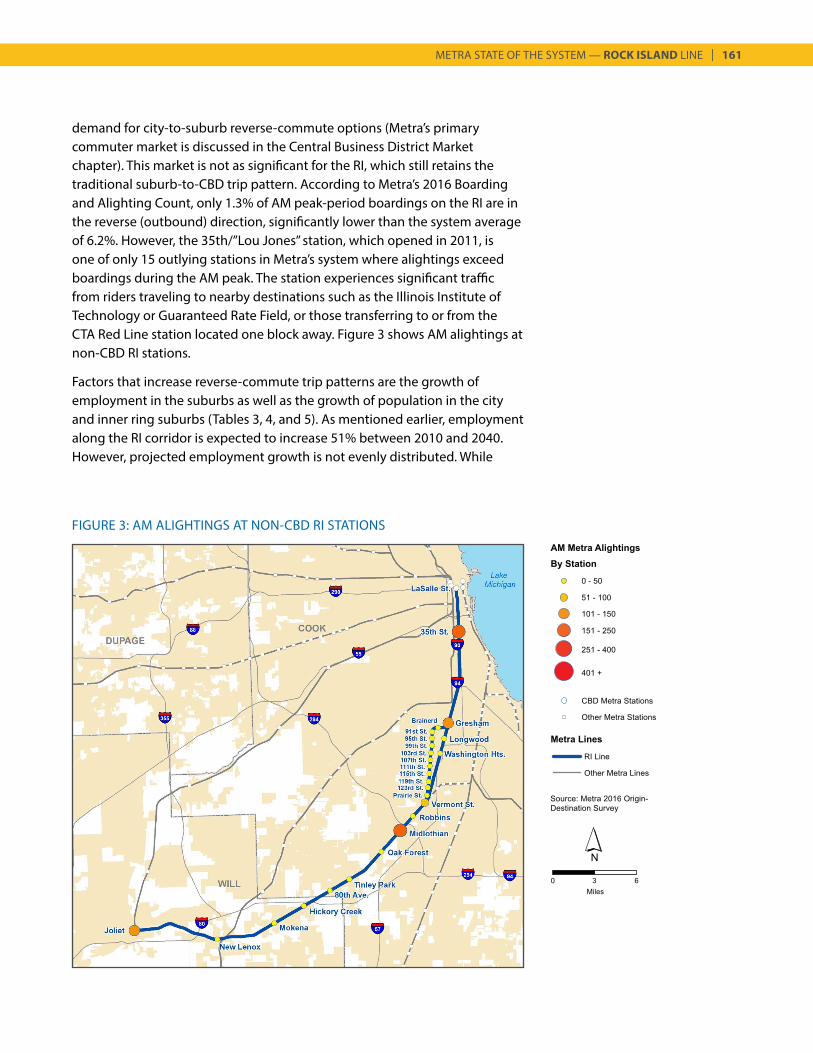
METRA STATE OF THE SYSTEM — ROCK ISLAND LINE | 161
FIGURE 3: AM ALIGHTINGS AT NON-CBD RI STATIONS
demand for city-to-suburb reverse-commute options (Metra’s primary commuter market is discussed in the Central Business District Market chapter). This market is not as significant for the RI, which still retains the traditional suburb-to-CBD trip pattern. According to Metra’s 2016 Boarding and Alighting Count, only 1.3% of AM peak-period boardings on the RI are in the reverse (outbound) direction, significantly lower than the system average of 6.2%. However, the 35th/”Lou Jones” station, which opened in 2011, is one of only 15 outlying stations in Metra’s system where alightings exceed boardings during the AM peak. The station experiences significant traffic from riders traveling to nearby destinations such as the Illinois Institute of Technology or Guaranteed Rate Field, or those transferring to or from the CTA Red Line station located one block away. Figure 3 shows AM alightings at non-CBD RI stations.
Factors that increase reverse-commute trip patterns are the growth of employment in the suburbs as well as the growth of population in the city and inner ring suburbs (Tables 3, 4, and 5). As mentioned earlier, employment along the RI corridor is expected to increase 51% between 2010 and 2040. However, projected employment growth is not evenly distributed. While
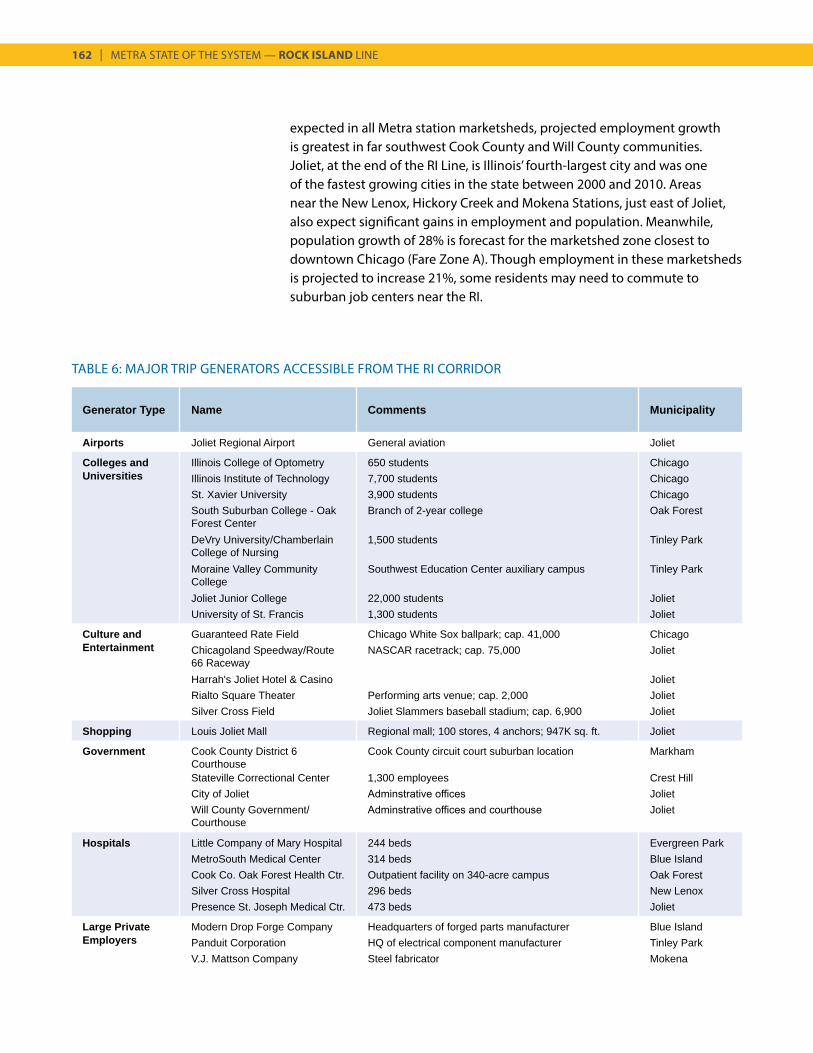
162 | METRA STATE OF THE SYSTEM — ROCK ISLAND LINE
Generator Type Name Comments Municipality
Airports Joliet Regional Airport General aviation Joliet
Colleges and Illinois College of Optometry 650 students ChicagoUniversities Illinois Institute of Technology 7,700 students Chicago
St. Xavier University 3,900 students ChicagoSouth Suburban College - Oak Forest Center
Branch of 2-year college Oak Forest
DeVry University/Chamberlain College of Nursing
1,500 students Tinley Park
Moraine Valley Community College
Southwest Education Center auxiliary campus Tinley Park
Joliet Junior College 22,000 students JolietUniversity of St. Francis 1,300 students Joliet
Culture and Guaranteed Rate Field Chicago White Sox ballpark; cap. 41,000 ChicagoEntertainment Chicagoland Speedway/Route
66 RacewayNASCAR racetrack; cap. 75,000 Joliet
Harrah's Joliet Hotel & Casino JolietRialto Square Theater Performing arts venue; cap. 2,000 JolietSilver Cross Field Joliet Slammers baseball stadium; cap. 6,900 Joliet
Shopping Louis Joliet Mall Regional mall; 100 stores, 4 anchors; 947K sq. ft. Joliet
Government Cook County District 6 Courthouse
Cook County circuit court suburban location Markham
Stateville Correctional Center 1,300 employees Crest HillCity of Joliet Adminstrative offices JolietWill County Government/Courthouse
Adminstrative offices and courthouse Joliet
Hospitals Little Company of Mary Hospital 244 beds Evergreen ParkMetroSouth Medical Center 314 beds Blue IslandCook Co. Oak Forest Health Ctr. Outpatient facility on 340-acre campus Oak ForestSilver Cross Hospital 296 beds New LenoxPresence St. Joseph Medical Ctr. 473 beds Joliet
Large Private Modern Drop Forge Company Headquarters of forged parts manufacturer Blue IslandEmployers Panduit Corporation HQ of electrical component manufacturer Tinley Park
V.J. Mattson Company Steel fabricator Mokena
TABLE 6: MAJOR TRIP GENERATORS ACCESSIBLE FROM THE RI CORRIDOR
expected in all Metra station marketsheds, projected employment growth is greatest in far southwest Cook County and Will County communities. Joliet, at the end of the RI Line, is Illinois’ fourth-largest city and was one of the fastest growing cities in the state between 2000 and 2010. Areas near the New Lenox, Hickory Creek and Mokena Stations, just east of Joliet, also expect significant gains in employment and population. Meanwhile, population growth of 28% is forecast for the marketshed zone closest to downtown Chicago (Fare Zone A). Though employment in these marketsheds is projected to increase 21%, some residents may need to commute to suburban job centers near the RI.
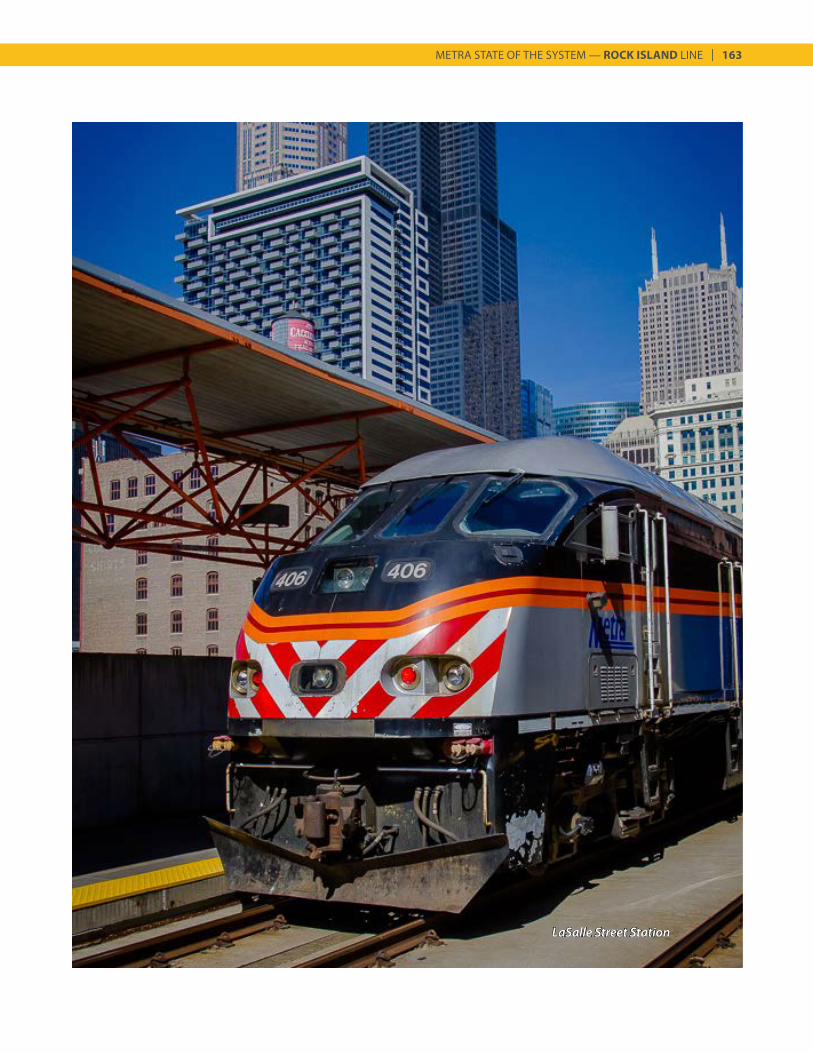
METRA STATE OF THE SYSTEM — ROCK ISLAND LINE | 163
LaSalle Street Station
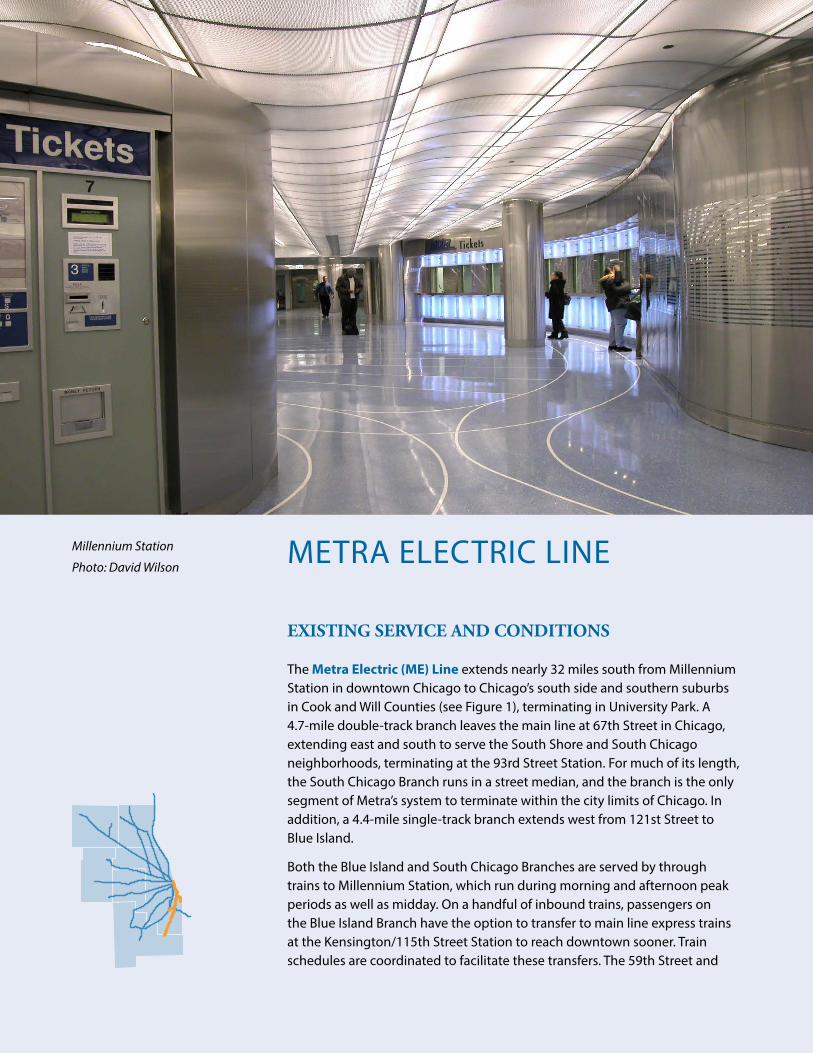
METRA ELECTRIC LINE
EXISTING SERVICE AND CONDITIONS
The Metra Electric (ME) Line extends nearly 32 miles south from Millennium Station in downtown Chicago to Chicago’s south side and southern suburbs in Cook and Will Counties (see Figure 1), terminating in University Park. A 4.7-mile double-track branch leaves the main line at 67th Street in Chicago, extending east and south to serve the South Shore and South Chicago neighborhoods, terminating at the 93rd Street Station. For much of its length, the South Chicago Branch runs in a street median, and the branch is the only segment of Metra’s system to terminate within the city limits of Chicago. In addition, a 4.4-mile single-track branch extends west from 121st Street to Blue Island.
Both the Blue Island and South Chicago Branches are served by through trains to Millennium Station, which run during morning and afternoon peak periods as well as midday. On a handful of inbound trains, passengers on the Blue Island Branch have the option to transfer to main line express trains at the Kensington/115th Street Station to reach downtown sooner. Train schedules are coordinated to facilitate these transfers. The 59th Street and
Millennium Station
Photo: David Wilson
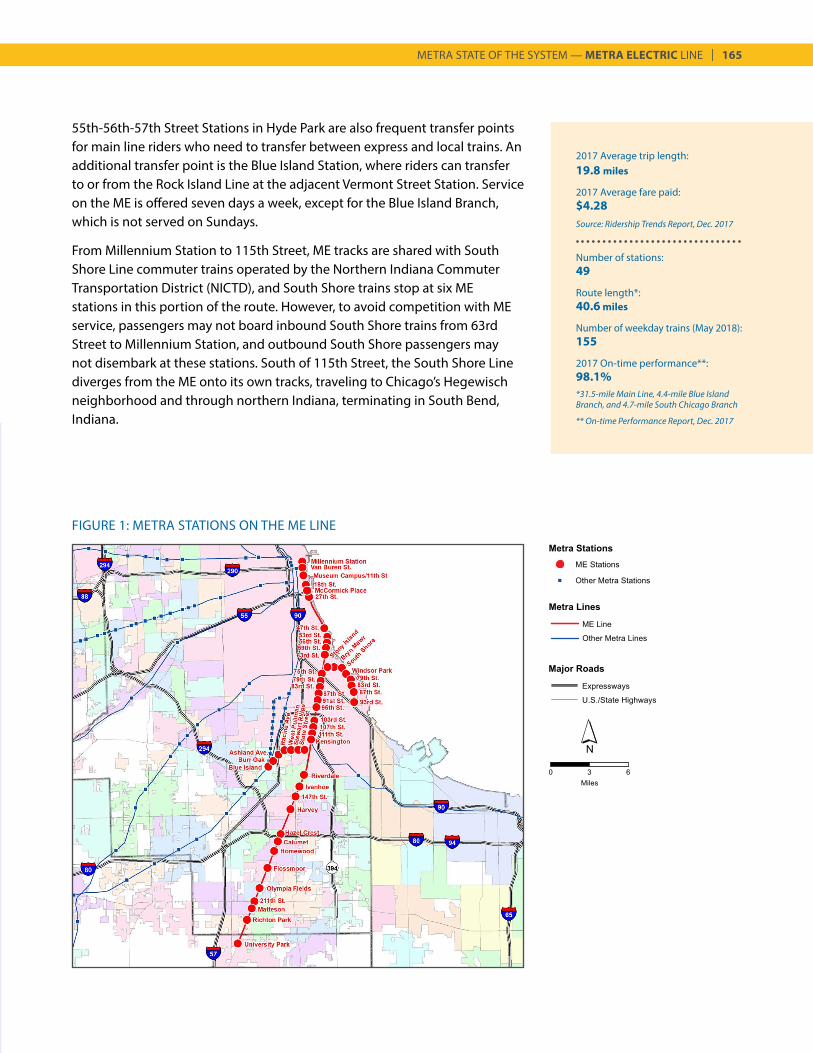
METRA STATE OF THE SYSTEM — METRA ELECTRIC LINE | 165
2017 Average trip length:19.8 miles
2017 Average fare paid:$4.28Source: Ridership Trends Report, Dec. 2017
Number of stations:49
Route length*:40.6 miles
Number of weekday trains (May 2018):155
2017 On-time performance**:98.1%*31.5-mile Main Line, 4.4-mile Blue Island Branch, and 4.7-mile South Chicago Branch
** On-time Performance Report, Dec. 2017
FIGURE 1: METRA STATIONS ON THE ME LINE
55th-56th-57th Street Stations in Hyde Park are also frequent transfer points for main line riders who need to transfer between express and local trains. An additional transfer point is the Blue Island Station, where riders can transfer to or from the Rock Island Line at the adjacent Vermont Street Station. Service on the ME is offered seven days a week, except for the Blue Island Branch, which is not served on Sundays.
From Millennium Station to 115th Street, ME tracks are shared with South Shore Line commuter trains operated by the Northern Indiana Commuter Transportation District (NICTD), and South Shore trains stop at six ME stations in this portion of the route. However, to avoid competition with ME service, passengers may not board inbound South Shore trains from 63rd Street to Millennium Station, and outbound South Shore passengers may not disembark at these stations. South of 115th Street, the South Shore Line diverges from the ME onto its own tracks, traveling to Chicago’s Hegewisch neighborhood and through northern Indiana, terminating in South Bend, Indiana.
166 | METRA STATE OF THE SYSTEM — METRA ELECTRIC LINE
Unique among Metra lines, the ME is served by two downtown stations: Millennium Station, located between Randolph Street and South Water Street, and Van Buren Street Station, less than a mile to the south. Among riders utilizing the two stations, approximately three-quarters use Millennium Station, with the remainder using Van Buren Street. The ME has the highest number of stations of any line in the Metra system, and is served by the highest number of trains. In 2017, passenger trips on the ME totaled 8.1 million, ranking fifth among all Metra lines (based on ticket sales).
Table 1 details the service, station, and ridership characteristics of the ME.
Some unique features distinguish the ME from Metra’s ten other lines:
1. ME trainsets consist of bi-level electric self-propelled coaches, called electric-multiple units (EMUs), that draw power from a dedicated overhead catenary wire system. Because of this, ME trains accelerate faster and run more quietly than the diesel locomotives and unpowered coaches used elsewhere in Metra’s system.
2. The ME main line is grade-separated from intersecting streets and highways and its tracks are segregated from freight and Amtrak service on adjacent track. This increases safety and reduces delays.
3. All stations are built with high-level platforms. This means that passengers do not climb steps from the platform to board train cars, which reduces station dwell time.
4. Most stations are unstaffed and tickets are purchased from vending machines.
In 1856, the Illinois Central Railroad (IC) initiated commuter rail service on what is now the ME main line. The success of this service led to the construction of the South Chicago and Blue Island Branches in 1883 and 1892, respectively. The main line and both branches were converted to electric power in 1926 after passage of a City of Chicago ordinance requiring IC to electrify its operations in order to eliminate coal emissions from steam engines along the lakefront. Grade separation of the main line from Richton Park to the Chicago terminal coincided with electrification. The line was extended to its current terminus at University Park in 1977, one year after RTA began subsidizing IC commuter service. In 2001, the South Chicago Branch terminus at 91st Street was relocated to 93rd Street so that commuter parking could be provided. IC—then known as Illinois Central Gulf—sold its commuter rail operations, equipment, and right-of-way to Metra in 1987. The freight tracks that parallel the ME main line between McCormick Place and University Park are now owned by Canadian National (CN). Although CN has trackage rights to serve industries located on Metra’s corridor, no freight trains currently operate on the ME itself. The CN tracks are also used by Amtrak trains to Carbondale and New Orleans, and passengers can transfer
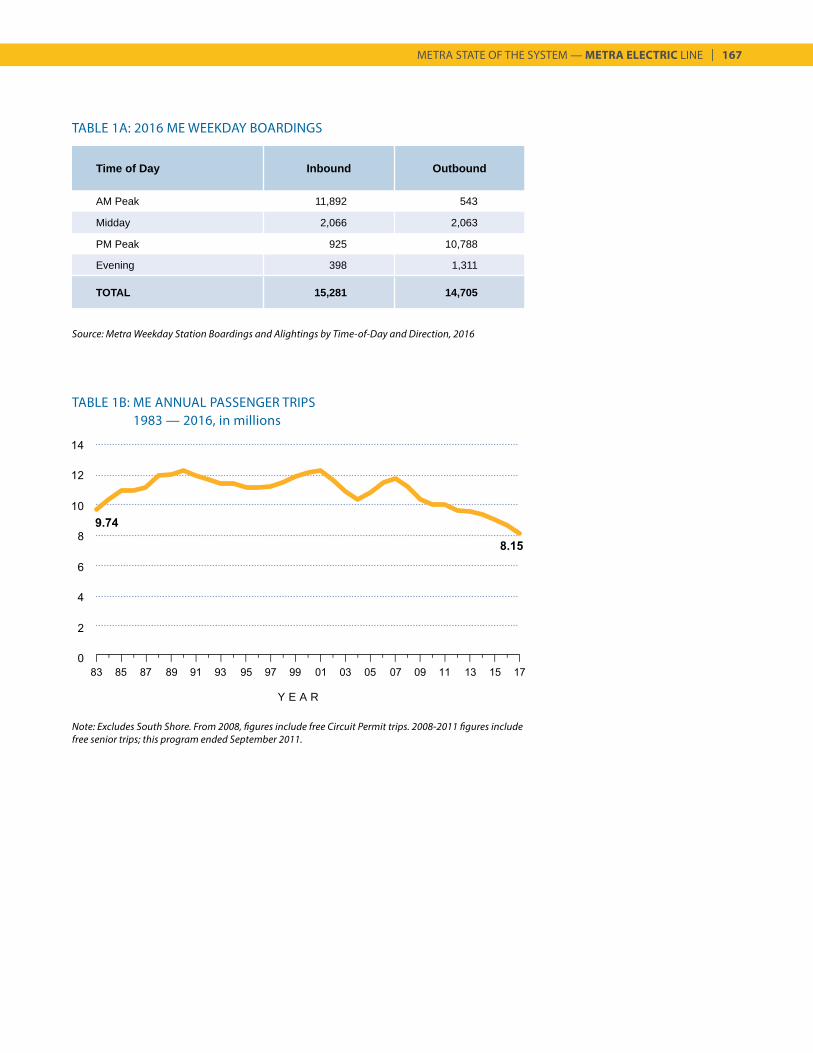
METRA STATE OF THE SYSTEM — METRA ELECTRIC LINE | 167
Source: Metra Weekday Station Boardings and Alightings by Time-of-Day and Direction, 2016
TABLE 1A: 2016 ME WEEKDAY BOARDINGS
TABLE 1B: ME ANNUAL PASSENGER TRIPS1983 — 2016, in millions
Y E A R
Time of Day Inbound Outbound
AM Peak 11,892 543
Midday 2,066 2,063
PM Peak 925 10,788
Evening 398 1,311
TOTAL 15,281 14,705
Note: Excludes South Shore. From 2008, figures include free Circuit Permit trips. 2008-2011 figures include free senior trips; this program ended September 2011.
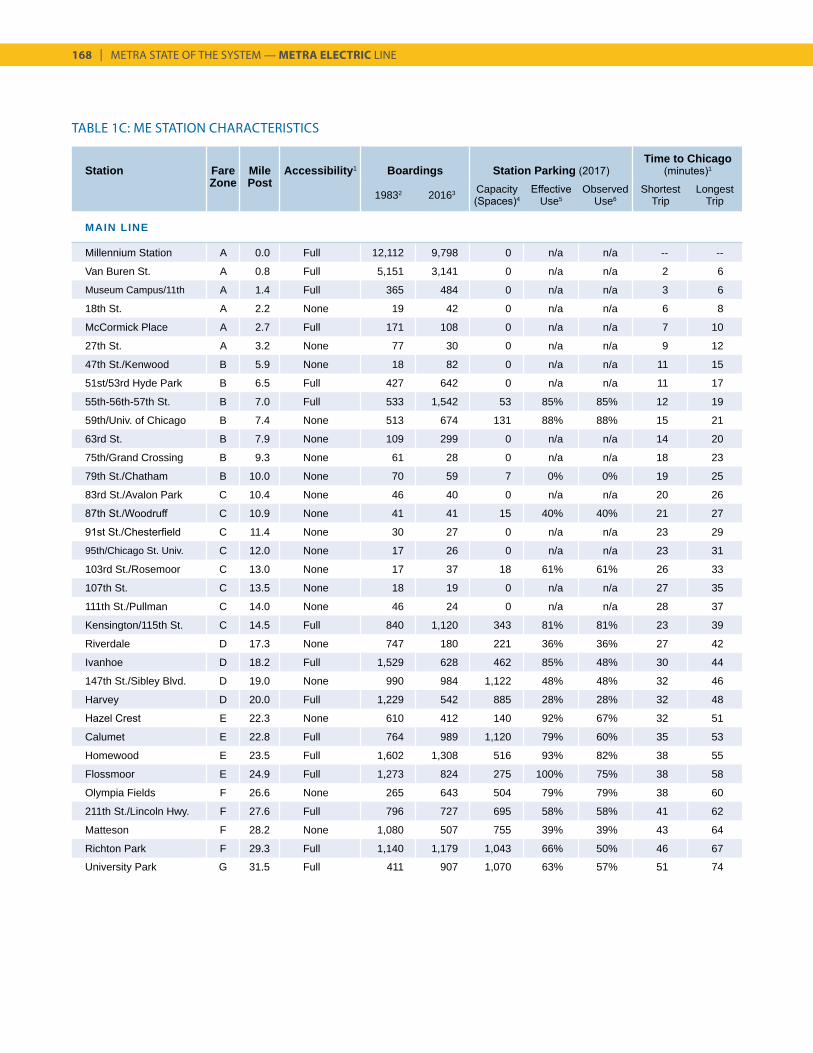
168 | METRA STATE OF THE SYSTEM — METRA ELECTRIC LINE
TABLE 1C: ME STATION CHARACTERISTICS
Station Fare Mile Accessibility1 Boardings Station Parking (2017)Time to Chicago
(minutes)1
Zone Post19832 20163 Capacity
(Spaces)4Effective
Use5Observed
Use6Shortest
TripLongest
Trip
MAIN LINE
Millennium Station A 0.0 Full 12,112 9,798 0 n/a n/a -- --
Van Buren St. A 0.8 Full 5,151 3,141 0 n/a n/a 2 6
Museum Campus/11th A 1.4 Full 365 484 0 n/a n/a 3 6
18th St. A 2.2 None 19 42 0 n/a n/a 6 8
McCormick Place A 2.7 Full 171 108 0 n/a n/a 7 10
27th St. A 3.2 None 77 30 0 n/a n/a 9 12
47th St./Kenwood B 5.9 None 18 82 0 n/a n/a 11 15
51st/53rd Hyde Park B 6.5 Full 427 642 0 n/a n/a 11 17
55th-56th-57th St. B 7.0 Full 533 1,542 53 85% 85% 12 19
59th/Univ. of Chicago B 7.4 None 513 674 131 88% 88% 15 21
63rd St. B 7.9 None 109 299 0 n/a n/a 14 20
75th/Grand Crossing B 9.3 None 61 28 0 n/a n/a 18 23
79th St./Chatham B 10.0 None 70 59 7 0% 0% 19 25
83rd St./Avalon Park C 10.4 None 46 40 0 n/a n/a 20 26
87th St./Woodruff C 10.9 None 41 41 15 40% 40% 21 27
91st St./Chesterfield C 11.4 None 30 27 0 n/a n/a 23 29
95th/Chicago St. Univ. C 12.0 None 17 26 0 n/a n/a 23 31
103rd St./Rosemoor C 13.0 None 17 37 18 61% 61% 26 33
107th St. C 13.5 None 18 19 0 n/a n/a 27 35
111th St./Pullman C 14.0 None 46 24 0 n/a n/a 28 37
Kensington/115th St. C 14.5 Full 840 1,120 343 81% 81% 23 39
Riverdale D 17.3 None 747 180 221 36% 36% 27 42
Ivanhoe D 18.2 Full 1,529 628 462 85% 48% 30 44
147th St./Sibley Blvd. D 19.0 None 990 984 1,122 48% 48% 32 46
Harvey D 20.0 Full 1,229 542 885 28% 28% 32 48
Hazel Crest E 22.3 None 610 412 140 92% 67% 32 51
Calumet E 22.8 Full 764 989 1,120 79% 60% 35 53
Homewood E 23.5 Full 1,602 1,308 516 93% 82% 38 55
Flossmoor E 24.9 Full 1,273 824 275 100% 75% 38 58
Olympia Fields F 26.6 None 265 643 504 79% 79% 38 60
211th St./Lincoln Hwy. F 27.6 Full 796 727 695 58% 58% 41 62
Matteson F 28.2 None 1,080 507 755 39% 39% 43 64
Richton Park F 29.3 Full 1,140 1,179 1,043 66% 50% 46 67
University Park G 31.5 Full 411 907 1,070 63% 57% 51 74
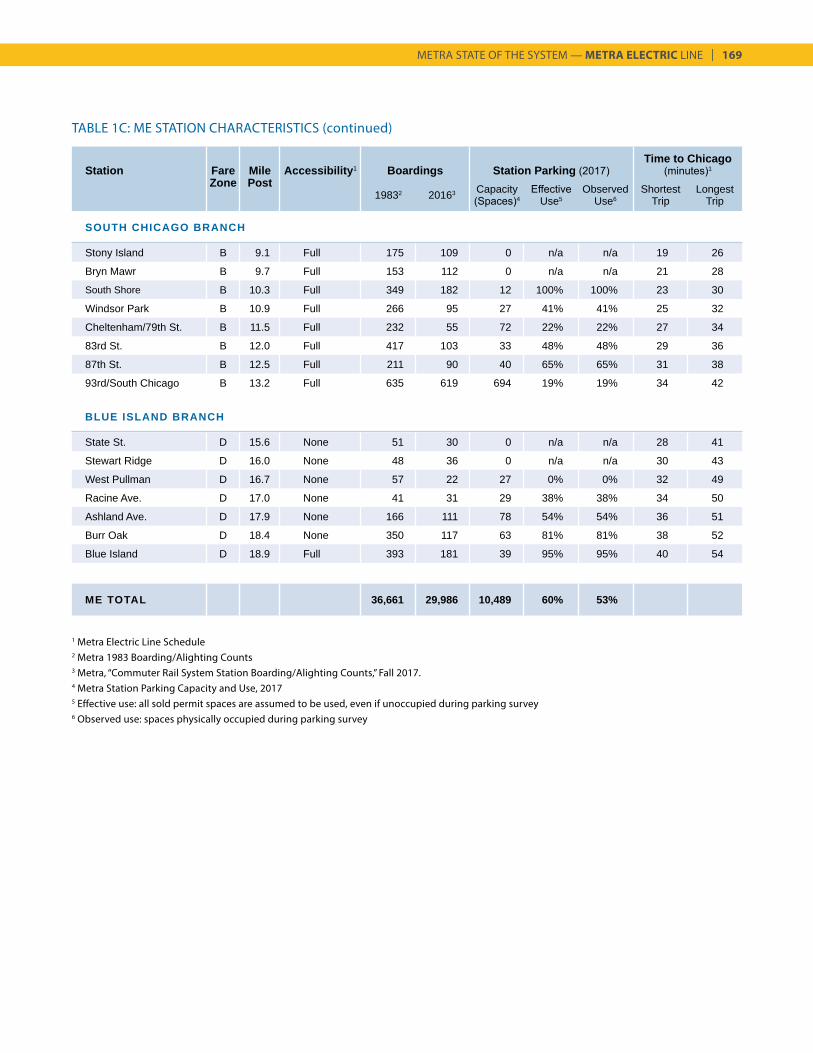
METRA STATE OF THE SYSTEM — METRA ELECTRIC LINE | 169
TABLE 1C: ME STATION CHARACTERISTICS (continued)
Station Fare Mile Accessibility1 Boardings Station Parking (2017)Time to Chicago
(minutes)1
Zone Post19832 20163 Capacity
(Spaces)4Effective
Use5Observed
Use6Shortest
TripLongest
Trip
SOUTH CHICAGO BRANCH
Stony Island B 9.1 Full 175 109 0 n/a n/a 19 26
Bryn Mawr B 9.7 Full 153 112 0 n/a n/a 21 28
South Shore B 10.3 Full 349 182 12 100% 100% 23 30
Windsor Park B 10.9 Full 266 95 27 41% 41% 25 32
Cheltenham/79th St. B 11.5 Full 232 55 72 22% 22% 27 34
83rd St. B 12.0 Full 417 103 33 48% 48% 29 36
87th St. B 12.5 Full 211 90 40 65% 65% 31 38
93rd/South Chicago B 13.2 Full 635 619 694 19% 19% 34 42
BLUE ISLAND BRANCH
State St. D 15.6 None 51 30 0 n/a n/a 28 41
Stewart Ridge D 16.0 None 48 36 0 n/a n/a 30 43
West Pullman D 16.7 None 57 22 27 0% 0% 32 49
Racine Ave. D 17.0 None 41 31 29 38% 38% 34 50
Ashland Ave. D 17.9 None 166 111 78 54% 54% 36 51
Burr Oak D 18.4 None 350 117 63 81% 81% 38 52
Blue Island D 18.9 Full 393 181 39 95% 95% 40 54
ME TOTAL 36,661 29,986 10,489 60% 53%
1 Metra Electric Line Schedule 2 Metra 1983 Boarding/Alighting Counts 3 Metra, “Commuter Rail System Station Boarding/Alighting Counts,” Fall 2017. 4 Metra Station Parking Capacity and Use, 20175 Effective use: all sold permit spaces are assumed to be used, even if unoccupied during parking survey 6 Observed use: spaces physically occupied during parking survey
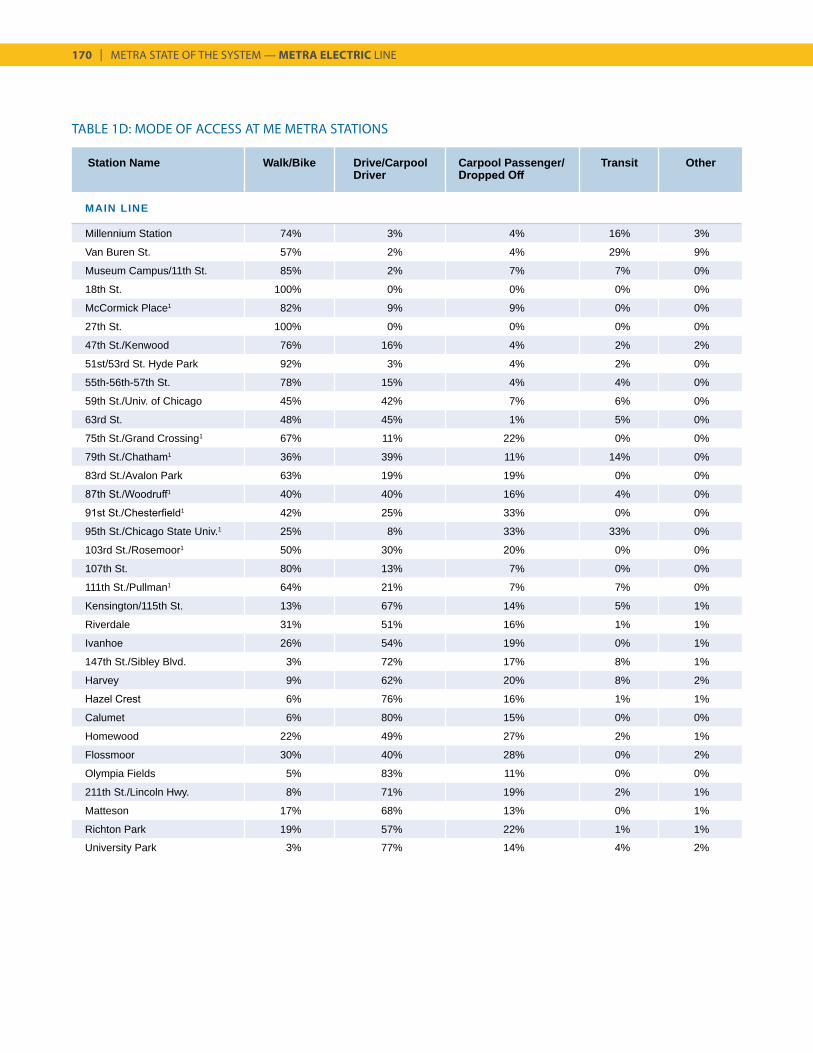
170 | METRA STATE OF THE SYSTEM — METRA ELECTRIC LINE
TABLE 1D: MODE OF ACCESS AT ME METRA STATIONS
Station Name Walk/Bike Drive/Carpool Driver
Carpool Passenger/ Dropped Off
Transit Other
MAIN LINE
Millennium Station 74% 3% 4% 16% 3%
Van Buren St. 57% 2% 4% 29% 9%
Museum Campus/11th St. 85% 2% 7% 7% 0%
18th St. 100% 0% 0% 0% 0%
McCormick Place1 82% 9% 9% 0% 0%
27th St. 100% 0% 0% 0% 0%
47th St./Kenwood 76% 16% 4% 2% 2%
51st/53rd St. Hyde Park 92% 3% 4% 2% 0%
55th-56th-57th St. 78% 15% 4% 4% 0%
59th St./Univ. of Chicago 45% 42% 7% 6% 0%
63rd St. 48% 45% 1% 5% 0%
75th St./Grand Crossing1 67% 11% 22% 0% 0%
79th St./Chatham1 36% 39% 11% 14% 0%
83rd St./Avalon Park 63% 19% 19% 0% 0%
87th St./Woodruff1 40% 40% 16% 4% 0%
91st St./Chesterfield1 42% 25% 33% 0% 0%
95th St./Chicago State Univ.1 25% 8% 33% 33% 0%
103rd St./Rosemoor1 50% 30% 20% 0% 0%
107th St. 80% 13% 7% 0% 0%
111th St./Pullman1 64% 21% 7% 7% 0%
Kensington/115th St. 13% 67% 14% 5% 1%
Riverdale 31% 51% 16% 1% 1%
Ivanhoe 26% 54% 19% 0% 1%
147th St./Sibley Blvd. 3% 72% 17% 8% 1%
Harvey 9% 62% 20% 8% 2%
Hazel Crest 6% 76% 16% 1% 1%
Calumet 6% 80% 15% 0% 0%
Homewood 22% 49% 27% 2% 1%
Flossmoor 30% 40% 28% 0% 2%
Olympia Fields 5% 83% 11% 0% 0%
211th St./Lincoln Hwy. 8% 71% 19% 2% 1%
Matteson 17% 68% 13% 0% 1%
Richton Park 19% 57% 22% 1% 1%
University Park 3% 77% 14% 4% 2%
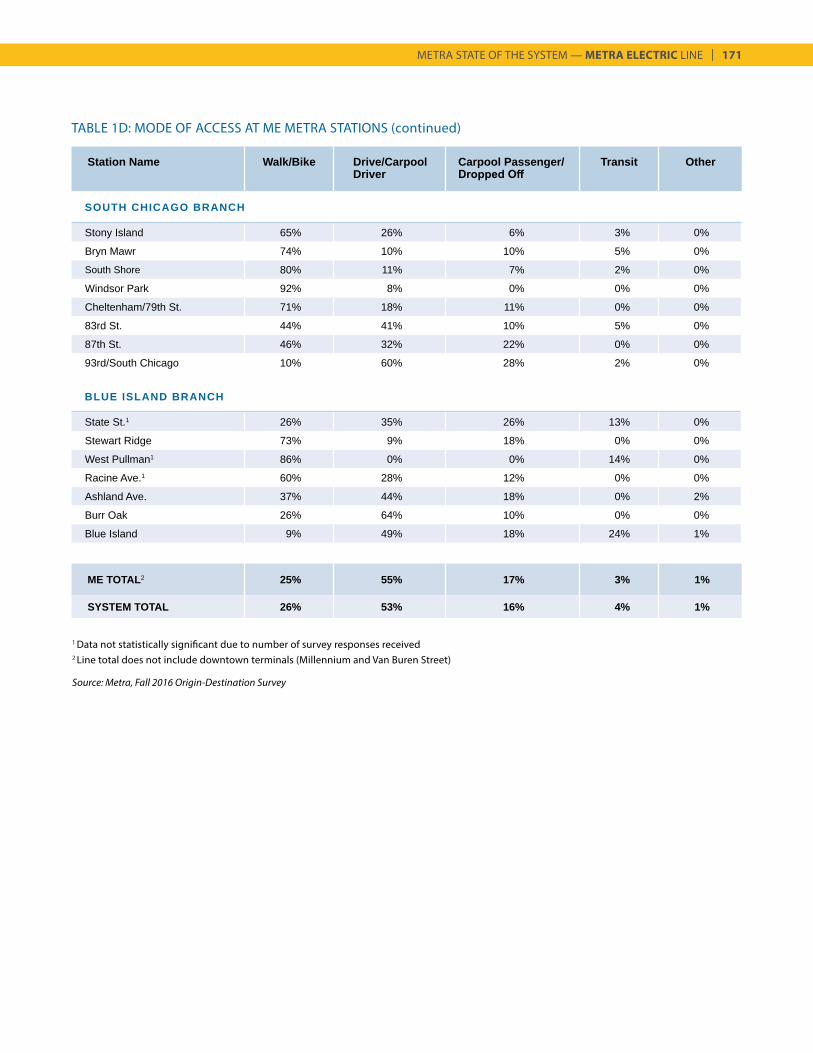
METRA STATE OF THE SYSTEM — METRA ELECTRIC LINE | 171
TABLE 1D: MODE OF ACCESS AT ME METRA STATIONS (continued)
Station Name Walk/Bike Drive/Carpool Driver
Carpool Passenger/ Dropped Off
Transit Other
SOUTH CHICAGO BRANCH
Stony Island 65% 26% 6% 3% 0%
Bryn Mawr 74% 10% 10% 5% 0%
South Shore 80% 11% 7% 2% 0%
Windsor Park 92% 8% 0% 0% 0%
Cheltenham/79th St. 71% 18% 11% 0% 0%
83rd St. 44% 41% 10% 5% 0%
87th St. 46% 32% 22% 0% 0%
93rd/South Chicago 10% 60% 28% 2% 0%
BLUE ISLAND BRANCH
State St.1 26% 35% 26% 13% 0%
Stewart Ridge 73% 9% 18% 0% 0%
West Pullman1 86% 0% 0% 14% 0%
Racine Ave.1 60% 28% 12% 0% 0%
Ashland Ave. 37% 44% 18% 0% 2%
Burr Oak 26% 64% 10% 0% 0%
Blue Island 9% 49% 18% 24% 1%
ME TOTAL2 25% 55% 17% 3% 1%
SYSTEM TOTAL 26% 53% 16% 4% 1%
1 Data not statistically significant due to number of survey responses received2 Line total does not include downtown terminals (Millennium and Van Buren Street)
Source: Metra, Fall 2016 Origin-Destination Survey
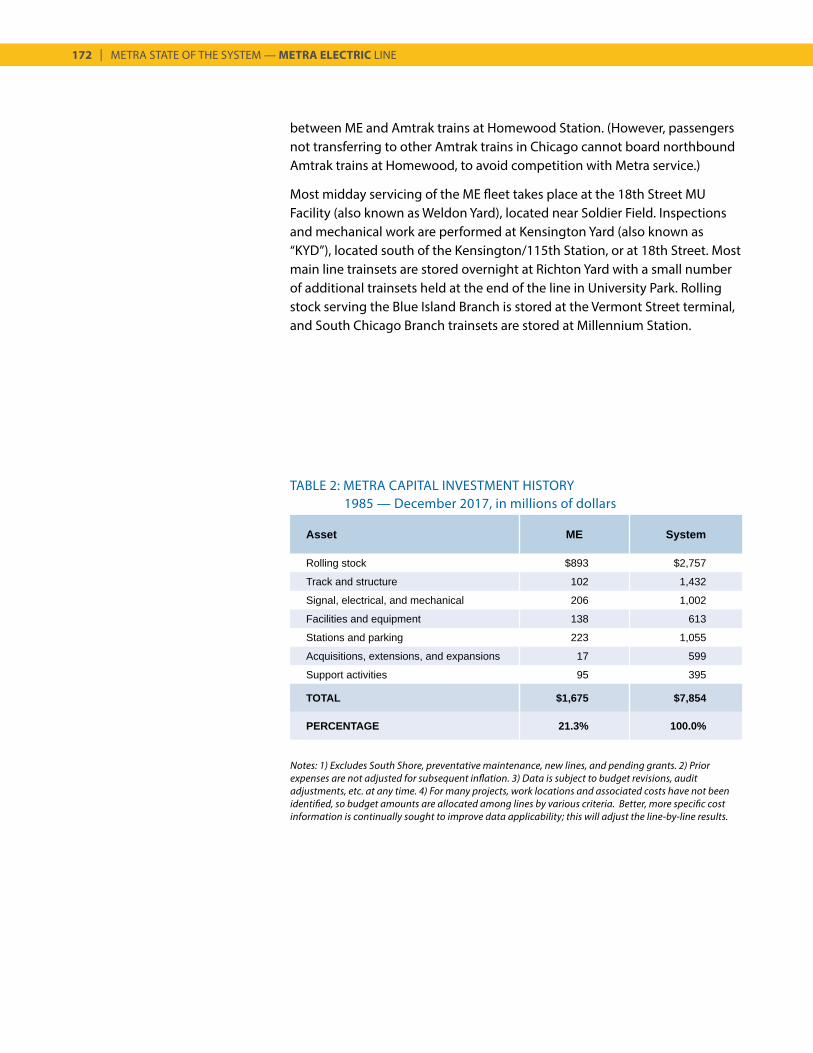
172 | METRA STATE OF THE SYSTEM — METRA ELECTRIC LINE
TABLE 2: METRA CAPITAL INVESTMENT HISTORY 1985 — December 2017, in millions of dollars
Asset ME System
Rolling stock $893 $2,757
Track and structure 102 1,432
Signal, electrical, and mechanical 206 1,002
Facilities and equipment 138 613
Stations and parking 223 1,055
Acquisitions, extensions, and expansions 17 599
Support activities 95 395
TOTAL $1,675 $7,854
PERCENTAGE 21.3% 100.0%
Notes: 1) Excludes South Shore, preventative maintenance, new lines, and pending grants. 2) Prior expenses are not adjusted for subsequent inflation. 3) Data is subject to budget revisions, audit adjustments, etc. at any time. 4) For many projects, work locations and associated costs have not been identified, so budget amounts are allocated among lines by various criteria. Better, more specific cost information is continually sought to improve data applicability; this will adjust the line-by-line results.
between ME and Amtrak trains at Homewood Station. (However, passengers not transferring to other Amtrak trains in Chicago cannot board northbound Amtrak trains at Homewood, to avoid competition with Metra service.)
Most midday servicing of the ME fleet takes place at the 18th Street MU Facility (also known as Weldon Yard), located near Soldier Field. Inspections and mechanical work are performed at Kensington Yard (also known as “KYD”), located south of the Kensington/115th Station, or at 18th Street. Most main line trainsets are stored overnight at Richton Yard with a small number of additional trainsets held at the end of the line in University Park. Rolling stock serving the Blue Island Branch is stored at the Vermont Street terminal, and South Chicago Branch trainsets are stored at Millennium Station.
METRA STATE OF THE SYSTEM — METRA ELECTRIC LINE | 173
Depots and warming houses constructed since 1985 at:47th/Kenwood53rd/Hyde Park55th-56th-57th Street83rd Street (South Chicago)87th Street (South Chicago)93rd/South Chicago111th/PullmanBlue IslandBryn MawrCalumetCheltenham/79thFlossmoorHarveyHazel CrestHomewoodIvanhoeKensington/115thMattesonMcCormick PlaceMillennium StationMuseum Campus/11thOlympia FieldsRichton ParkRiverdaleSouth ShoreStony IslandUniversity ParkVan Buren StreetWest PullmanWindsor Park
Other significant improvements completed since 1985 at:63rd Street95th/Chicago State University211th/Lincoln HighwayAshland AvenueBurr OakRacine AvenueState StreetStewart Ridge
Improvements planned for:59th/Univ. of Chicago63rd StreetAshland AvenueBurr OakHazel CrestHomewoodMcCormick PlaceRacine
IMPROVEMENTS SINCE THE START OF METRA
Since 1985, Metra has invested $1.8 billion (in year of expenditure dollars) in improvements to the ME corridor. The ME consumed 22% of Metra’s total capital spending during that time. In addition to the track, signal, and other components found on Metra’s diesel lines, operation of the ME depends on an extensive electrical infrastructure, which accounts for the line’s increased capital needs. Indeed, the overhead catenary and other elements of the ME’s power supply have been likened to a “second railroad” requiring ongoing investment.
Table 2 indicates the amount of investment in different asset categories. The amounts shown reflect the cost of replacing interlockings at 67th Street, Kensington, and the Millennium Station terminal, upgrading customer and operations communications systems, and replacing the entire ME railcar fleet. In addition, Metra has completed improvements at a number of ME stations since 1985 (see right).
Until 2006, when 26 new EMUs entered service, the entire ME fleet dated from the 1970s, and had been inherited from the IC. Replacing the ME fleet was a long-time agency priority, and in 2010, the State of Illinois committed $585 million in Bond Program funds to purchase 160 new EMUs. From fall of 2012 until early 2016, four to six new EMUs arrived from the Rochelle, Illinois plant each month, and old cars were retired.
The 2016 rehabilitation of the 111th/Pullman Station included replacement of the warming houses, which were painted to thematically represent the historic Pullman district and celebrate the Pullman National Monument designation by the National Park Service. In 2017, Metra replaced the crossing at Stony Island Ave and the South Chicago Branch, rehabilitated the 63rd and 64th Street bridges, upgraded the signal system at the 11th Place interlocking in service of Positive Train Control (PTC), and replaced six switches at the Richton Park Yard. Fiber optic cable will be installed for conducting voice and signal data. Another noteworthy improvement is the increase in electrical power through installation of new substations, which will allow the new EMUs to accelerate faster and increase maximum operating speed.
In the last 20 years, numerous adjustments have been made to the ME’s schedule, increasing midday service on the main line, reducing crowding during peaks, adding through-trains to Millennium Station from the branch lines, improving transfer opportunities, and improving efficiency. In an effort to reverse ridership decline on the line and better serve demand, Metra revised the ME schedule in the fall of 2017 to improve midday, weekday service to Hyde Park with inbound and outbound train arrivals every 20 minutes. In addition, midday service frequency to mainline stops from 75th to 111th Streets improved to every one hour (instead of every two). The
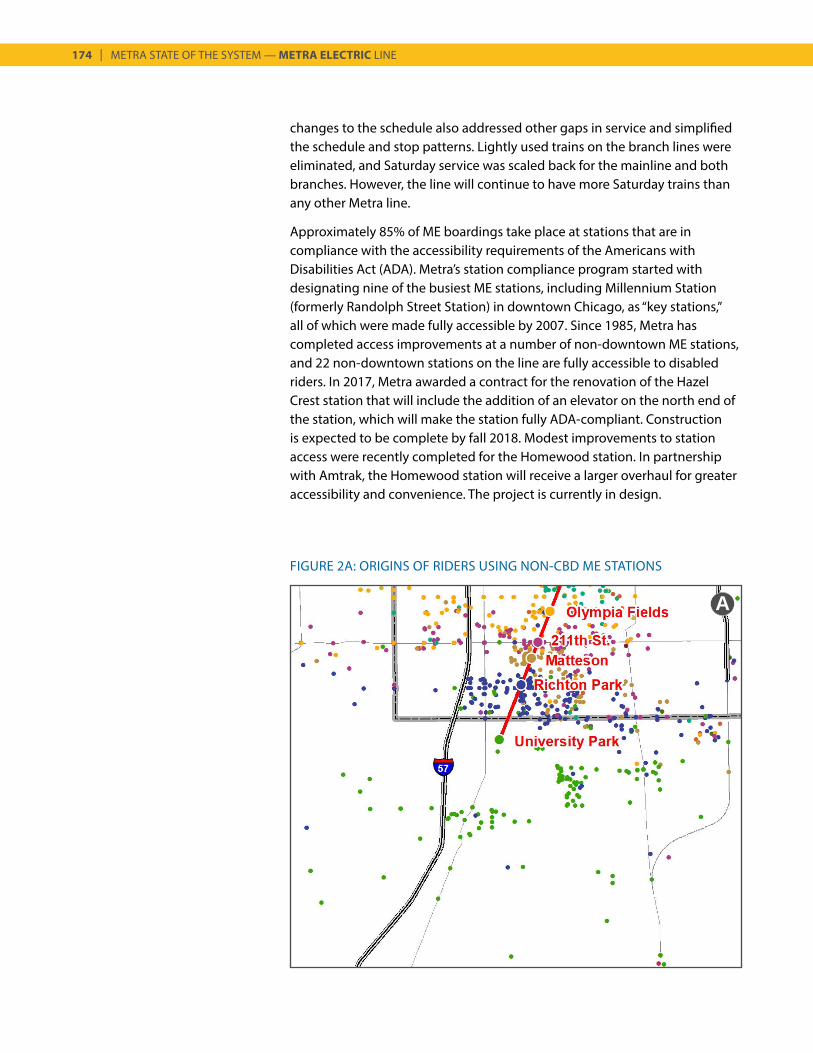
174 | METRA STATE OF THE SYSTEM — METRA ELECTRIC LINE
A
FIGURE 2A: ORIGINS OF RIDERS USING NON-CBD ME STATIONS
changes to the schedule also addressed other gaps in service and simplified the schedule and stop patterns. Lightly used trains on the branch lines were eliminated, and Saturday service was scaled back for the mainline and both branches. However, the line will continue to have more Saturday trains than any other Metra line.
Approximately 85% of ME boardings take place at stations that are in compliance with the accessibility requirements of the Americans with Disabilities Act (ADA). Metra’s station compliance program started with designating nine of the busiest ME stations, including Millennium Station (formerly Randolph Street Station) in downtown Chicago, as “key stations,” all of which were made fully accessible by 2007. Since 1985, Metra has completed access improvements at a number of non-downtown ME stations, and 22 non-downtown stations on the line are fully accessible to disabled riders. In 2017, Metra awarded a contract for the renovation of the Hazel Crest station that will include the addition of an elevator on the north end of the station, which will make the station fully ADA-compliant. Construction is expected to be complete by fall 2018. Modest improvements to station access were recently completed for the Homewood station. In partnership with Amtrak, the Homewood station will receive a larger overhaul for greater accessibility and convenience. The project is currently in design.
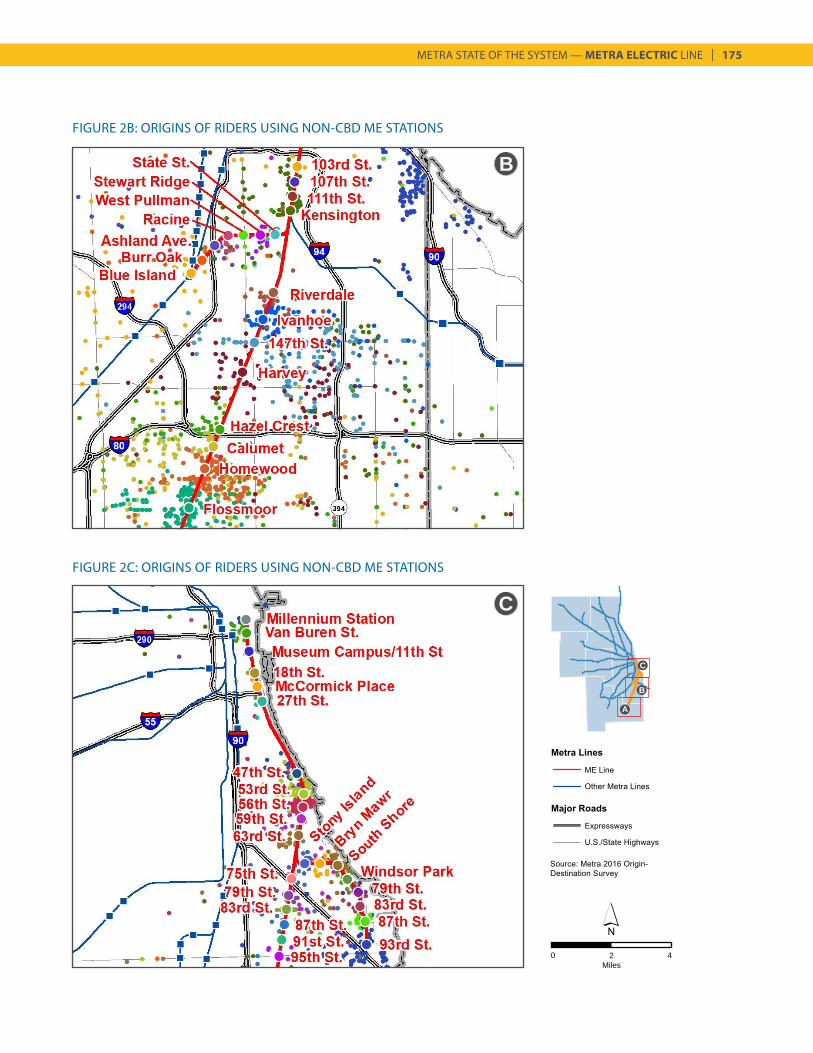
METRA STATE OF THE SYSTEM — METRA ELECTRIC LINE | 175
FIGURE 2C: ORIGINS OF RIDERS USING NON-CBD ME STATIONS
FIGURE 2B: ORIGINS OF RIDERS USING NON-CBD ME STATIONS
C
B
A
B
C
0 2Miles
4
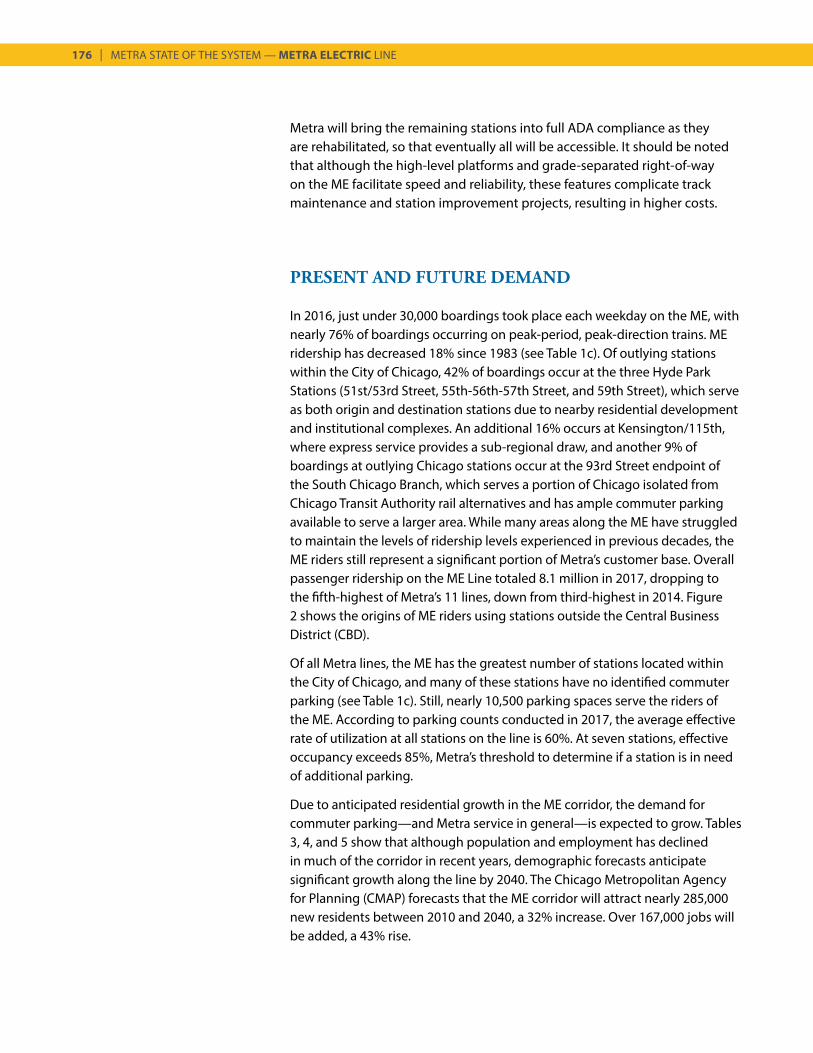
176 | METRA STATE OF THE SYSTEM — METRA ELECTRIC LINE
Metra will bring the remaining stations into full ADA compliance as they are rehabilitated, so that eventually all will be accessible. It should be noted that although the high-level platforms and grade-separated right-of-way on the ME facilitate speed and reliability, these features complicate track maintenance and station improvement projects, resulting in higher costs.
PRESENT AND FUTURE DEMAND
In 2016, just under 30,000 boardings took place each weekday on the ME, with nearly 76% of boardings occurring on peak-period, peak-direction trains. ME ridership has decreased 18% since 1983 (see Table 1c). Of outlying stations within the City of Chicago, 42% of boardings occur at the three Hyde Park Stations (51st/53rd Street, 55th-56th-57th Street, and 59th Street), which serve as both origin and destination stations due to nearby residential development and institutional complexes. An additional 16% occurs at Kensington/115th, where express service provides a sub-regional draw, and another 9% of boardings at outlying Chicago stations occur at the 93rd Street endpoint of the South Chicago Branch, which serves a portion of Chicago isolated from Chicago Transit Authority rail alternatives and has ample commuter parking available to serve a larger area. While many areas along the ME have struggled to maintain the levels of ridership levels experienced in previous decades, the ME riders still represent a significant portion of Metra’s customer base. Overall passenger ridership on the ME Line totaled 8.1 million in 2017, dropping to the fifth-highest of Metra’s 11 lines, down from third-highest in 2014. Figure 2 shows the origins of ME riders using stations outside the Central Business District (CBD).
Of all Metra lines, the ME has the greatest number of stations located within the City of Chicago, and many of these stations have no identified commuter parking (see Table 1c). Still, nearly 10,500 parking spaces serve the riders of the ME. According to parking counts conducted in 2017, the average effective rate of utilization at all stations on the line is 60%. At seven stations, effective occupancy exceeds 85%, Metra’s threshold to determine if a station is in need of additional parking.
Due to anticipated residential growth in the ME corridor, the demand for commuter parking—and Metra service in general—is expected to grow. Tables 3, 4, and 5 show that although population and employment has declined in much of the corridor in recent years, demographic forecasts anticipate significant growth along the line by 2040. The Chicago Metropolitan Agency for Planning (CMAP) forecasts that the ME corridor will attract nearly 285,000 new residents between 2010 and 2040, a 32% increase. Over 167,000 jobs will be added, a 43% rise.
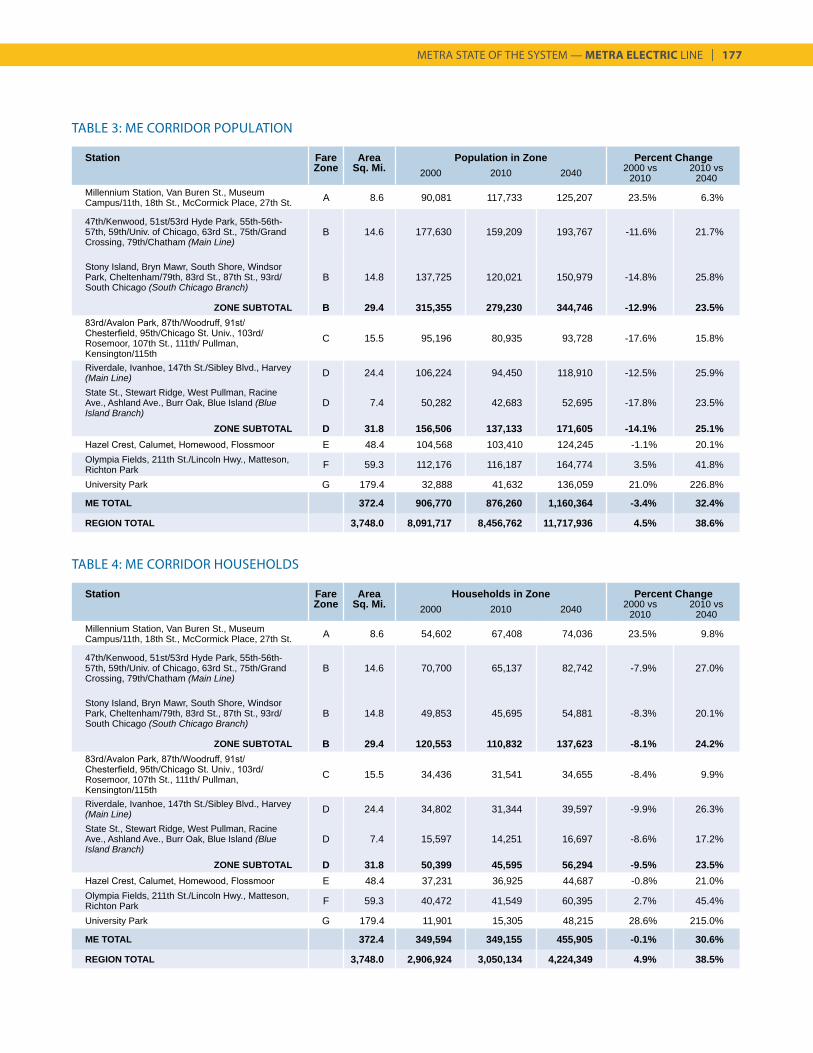
METRA STATE OF THE SYSTEM — METRA ELECTRIC LINE | 177
TABLE 3: ME CORRIDOR POPULATION
TABLE 4: ME CORRIDOR HOUSEHOLDS
Station Fare Area Population in Zone Percent ChangeZone Sq. Mi. 2000 2010 2040 2000 vs
20102010 vs
2040Millennium Station, Van Buren St., Museum Campus/11th, 18th St., McCormick Place, 27th St. A 8.6 90,081 117,733 125,207 23.5% 6.3%
47th/Kenwood, 51st/53rd Hyde Park, 55th-56th-57th, 59th/Univ. of Chicago, 63rd St., 75th/Grand Crossing, 79th/Chatham (Main Line)
B 14.6 177,630 159,209 193,767 -11.6% 21.7%
Stony Island, Bryn Mawr, South Shore, Windsor Park, Cheltenham/79th, 83rd St., 87th St., 93rd/South Chicago (South Chicago Branch)
B 14.8 137,725 120,021 150,979 -14.8% 25.8%
ZONE SUBTOTAL B 29.4 315,355 279,230 344,746 -12.9% 23.5%83rd/Avalon Park, 87th/Woodruff, 91st/Chesterfield, 95th/Chicago St. Univ., 103rd/Rosemoor, 107th St., 111th/ Pullman, Kensington/115th
C 15.5 95,196 80,935 93,728 -17.6% 15.8%
Riverdale, Ivanhoe, 147th St./Sibley Blvd., Harvey (Main Line) D 24.4 106,224 94,450 118,910 -12.5% 25.9%
State St., Stewart Ridge, West Pullman, Racine Ave., Ashland Ave., Burr Oak, Blue Island (Blue Island Branch)
D 7.4 50,282 42,683 52,695 -17.8% 23.5%
ZONE SUBTOTAL D 31.8 156,506 137,133 171,605 -14.1% 25.1%Hazel Crest, Calumet, Homewood, Flossmoor E 48.4 104,568 103,410 124,245 -1.1% 20.1%Olympia Fields, 211th St./Lincoln Hwy., Matteson, Richton Park F 59.3 112,176 116,187 164,774 3.5% 41.8%
University Park G 179.4 32,888 41,632 136,059 21.0% 226.8%
ME TOTAL 372.4 906,770 876,260 1,160,364 -3.4% 32.4%
REGION TOTAL 3,748.0 8,091,717 8,456,762 11,717,936 4.5% 38.6%
Station Fare Area Households in Zone Percent ChangeZone Sq. Mi. 2000 2010 2040 2000 vs
20102010 vs
2040Millennium Station, Van Buren St., Museum Campus/11th, 18th St., McCormick Place, 27th St. A 8.6 54,602 67,408 74,036 23.5% 9.8%
47th/Kenwood, 51st/53rd Hyde Park, 55th-56th-57th, 59th/Univ. of Chicago, 63rd St., 75th/Grand Crossing, 79th/Chatham (Main Line)
B 14.6 70,700 65,137 82,742 -7.9% 27.0%
Stony Island, Bryn Mawr, South Shore, Windsor Park, Cheltenham/79th, 83rd St., 87th St., 93rd/South Chicago (South Chicago Branch)
B 14.8 49,853 45,695 54,881 -8.3% 20.1%
ZONE SUBTOTAL B 29.4 120,553 110,832 137,623 -8.1% 24.2%83rd/Avalon Park, 87th/Woodruff, 91st/Chesterfield, 95th/Chicago St. Univ., 103rd/Rosemoor, 107th St., 111th/ Pullman, Kensington/115th
C 15.5 34,436 31,541 34,655 -8.4% 9.9%
Riverdale, Ivanhoe, 147th St./Sibley Blvd., Harvey (Main Line) D 24.4 34,802 31,344 39,597 -9.9% 26.3%
State St., Stewart Ridge, West Pullman, Racine Ave., Ashland Ave., Burr Oak, Blue Island (Blue Island Branch)
D 7.4 15,597 14,251 16,697 -8.6% 17.2%
ZONE SUBTOTAL D 31.8 50,399 45,595 56,294 -9.5% 23.5%Hazel Crest, Calumet, Homewood, Flossmoor E 48.4 37,231 36,925 44,687 -0.8% 21.0%Olympia Fields, 211th St./Lincoln Hwy., Matteson, Richton Park F 59.3 40,472 41,549 60,395 2.7% 45.4%
University Park G 179.4 11,901 15,305 48,215 28.6% 215.0%
ME TOTAL 372.4 349,594 349,155 455,905 -0.1% 30.6%
REGION TOTAL 3,748.0 2,906,924 3,050,134 4,224,349 4.9% 38.5%
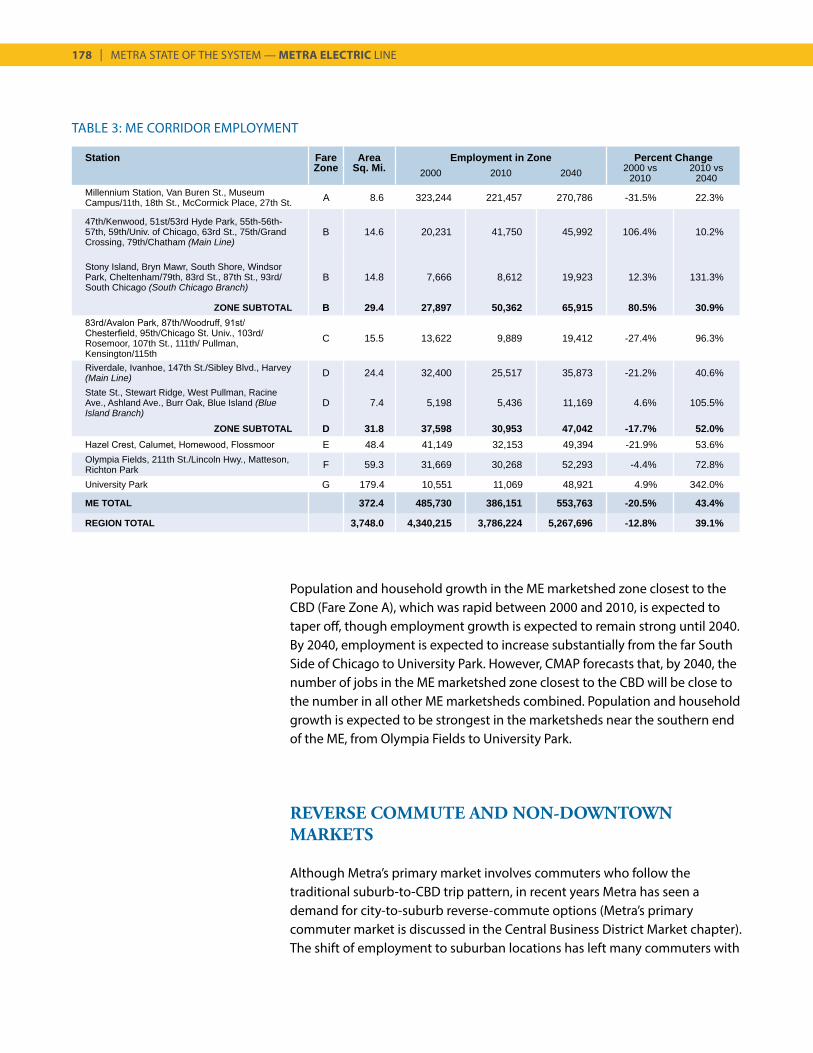
178 | METRA STATE OF THE SYSTEM — METRA ELECTRIC LINE
TABLE 3: ME CORRIDOR EMPLOYMENT
Station Fare Area Employment in Zone Percent ChangeZone Sq. Mi. 2000 2010 2040 2000 vs
20102010 vs
2040Millennium Station, Van Buren St., Museum Campus/11th, 18th St., McCormick Place, 27th St. A 8.6 323,244 221,457 270,786 -31.5% 22.3%
47th/Kenwood, 51st/53rd Hyde Park, 55th-56th-57th, 59th/Univ. of Chicago, 63rd St., 75th/Grand Crossing, 79th/Chatham (Main Line)
B 14.6 20,231 41,750 45,992 106.4% 10.2%
Stony Island, Bryn Mawr, South Shore, Windsor Park, Cheltenham/79th, 83rd St., 87th St., 93rd/South Chicago (South Chicago Branch)
B 14.8 7,666 8,612 19,923 12.3% 131.3%
ZONE SUBTOTAL B 29.4 27,897 50,362 65,915 80.5% 30.9%83rd/Avalon Park, 87th/Woodruff, 91st/Chesterfield, 95th/Chicago St. Univ., 103rd/Rosemoor, 107th St., 111th/ Pullman, Kensington/115th
C 15.5 13,622 9,889 19,412 -27.4% 96.3%
Riverdale, Ivanhoe, 147th St./Sibley Blvd., Harvey (Main Line) D 24.4 32,400 25,517 35,873 -21.2% 40.6%
State St., Stewart Ridge, West Pullman, Racine Ave., Ashland Ave., Burr Oak, Blue Island (Blue Island Branch)
D 7.4 5,198 5,436 11,169 4.6% 105.5%
ZONE SUBTOTAL D 31.8 37,598 30,953 47,042 -17.7% 52.0%Hazel Crest, Calumet, Homewood, Flossmoor E 48.4 41,149 32,153 49,394 -21.9% 53.6%Olympia Fields, 211th St./Lincoln Hwy., Matteson, Richton Park F 59.3 31,669 30,268 52,293 -4.4% 72.8%
University Park G 179.4 10,551 11,069 48,921 4.9% 342.0%
ME TOTAL 372.4 485,730 386,151 553,763 -20.5% 43.4%
REGION TOTAL 3,748.0 4,340,215 3,786,224 5,267,696 -12.8% 39.1%
Population and household growth in the ME marketshed zone closest to the CBD (Fare Zone A), which was rapid between 2000 and 2010, is expected to taper off, though employment growth is expected to remain strong until 2040. By 2040, employment is expected to increase substantially from the far South Side of Chicago to University Park. However, CMAP forecasts that, by 2040, the number of jobs in the ME marketshed zone closest to the CBD will be close to the number in all other ME marketsheds combined. Population and household growth is expected to be strongest in the marketsheds near the southern end of the ME, from Olympia Fields to University Park.
REVERSE COMMUTE AND NON-DOWNTOWN MARKETS
Although Metra’s primary market involves commuters who follow the traditional suburb-to-CBD trip pattern, in recent years Metra has seen a demand for city-to-suburb reverse-commute options (Metra’s primary commuter market is discussed in the Central Business District Market chapter). The shift of employment to suburban locations has left many commuters with
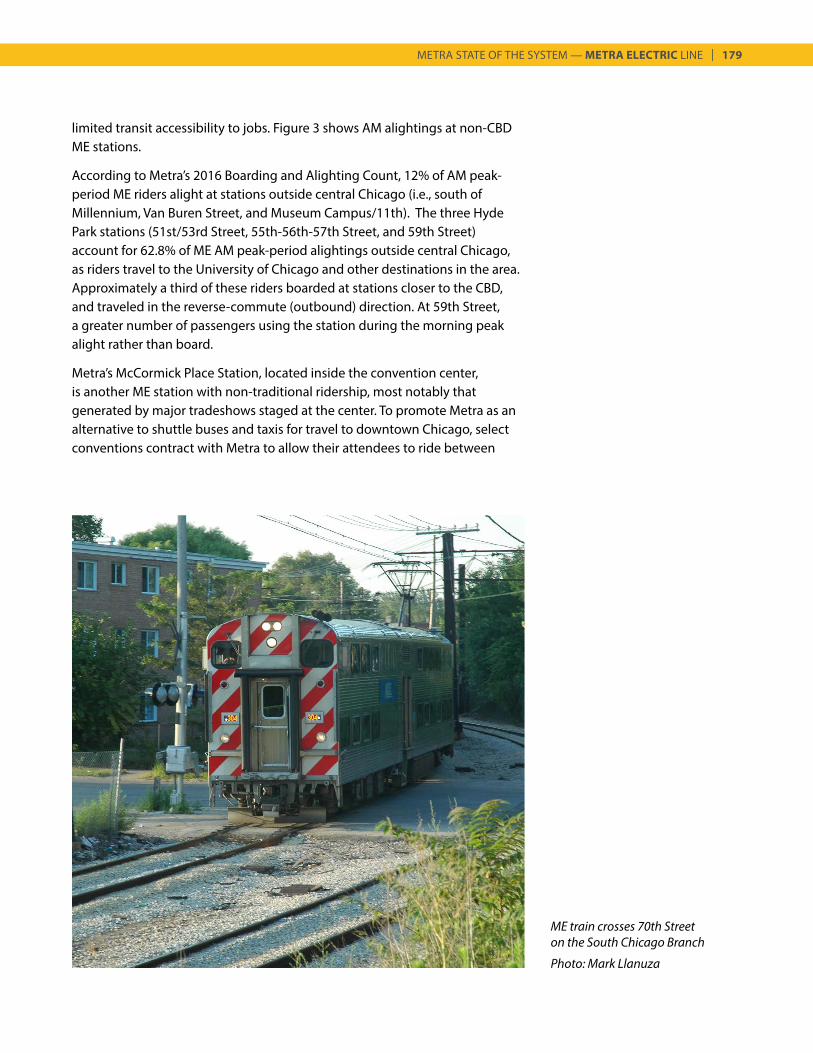
METRA STATE OF THE SYSTEM — METRA ELECTRIC LINE | 179
limited transit accessibility to jobs. Figure 3 shows AM alightings at non-CBD ME stations.
According to Metra’s 2016 Boarding and Alighting Count, 12% of AM peak-period ME riders alight at stations outside central Chicago (i.e., south of Millennium, Van Buren Street, and Museum Campus/11th). The three Hyde Park stations (51st/53rd Street, 55th-56th-57th Street, and 59th Street) account for 62.8% of ME AM peak-period alightings outside central Chicago, as riders travel to the University of Chicago and other destinations in the area. Approximately a third of these riders boarded at stations closer to the CBD, and traveled in the reverse-commute (outbound) direction. At 59th Street, a greater number of passengers using the station during the morning peak alight rather than board.
Metra’s McCormick Place Station, located inside the convention center, is another ME station with non-traditional ridership, most notably that generated by major tradeshows staged at the center. To promote Metra as an alternative to shuttle buses and taxis for travel to downtown Chicago, select conventions contract with Metra to allow their attendees to ride between
ME train crosses 70th Street on the South Chicago Branch
Photo: Mark Llanuza
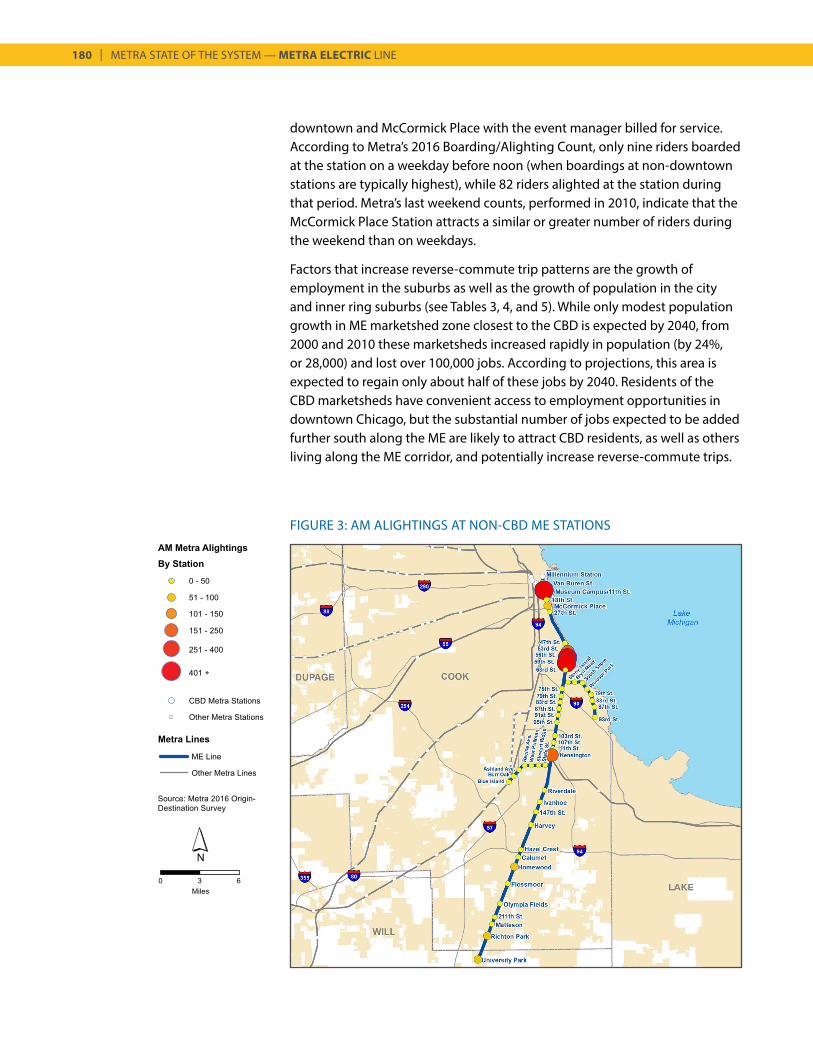
180 | METRA STATE OF THE SYSTEM — METRA ELECTRIC LINE
FIGURE 3: AM ALIGHTINGS AT NON-CBD ME STATIONS
downtown and McCormick Place with the event manager billed for service. According to Metra’s 2016 Boarding/Alighting Count, only nine riders boarded at the station on a weekday before noon (when boardings at non-downtown stations are typically highest), while 82 riders alighted at the station during that period. Metra’s last weekend counts, performed in 2010, indicate that the McCormick Place Station attracts a similar or greater number of riders during the weekend than on weekdays.
Factors that increase reverse-commute trip patterns are the growth of employment in the suburbs as well as the growth of population in the city and inner ring suburbs (see Tables 3, 4, and 5). While only modest population growth in ME marketshed zone closest to the CBD is expected by 2040, from 2000 and 2010 these marketsheds increased rapidly in population (by 24%, or 28,000) and lost over 100,000 jobs. According to projections, this area is expected to regain only about half of these jobs by 2040. Residents of the CBD marketsheds have convenient access to employment opportunities in downtown Chicago, but the substantial number of jobs expected to be added further south along the ME are likely to attract CBD residents, as well as others living along the ME corridor, and potentially increase reverse-commute trips.
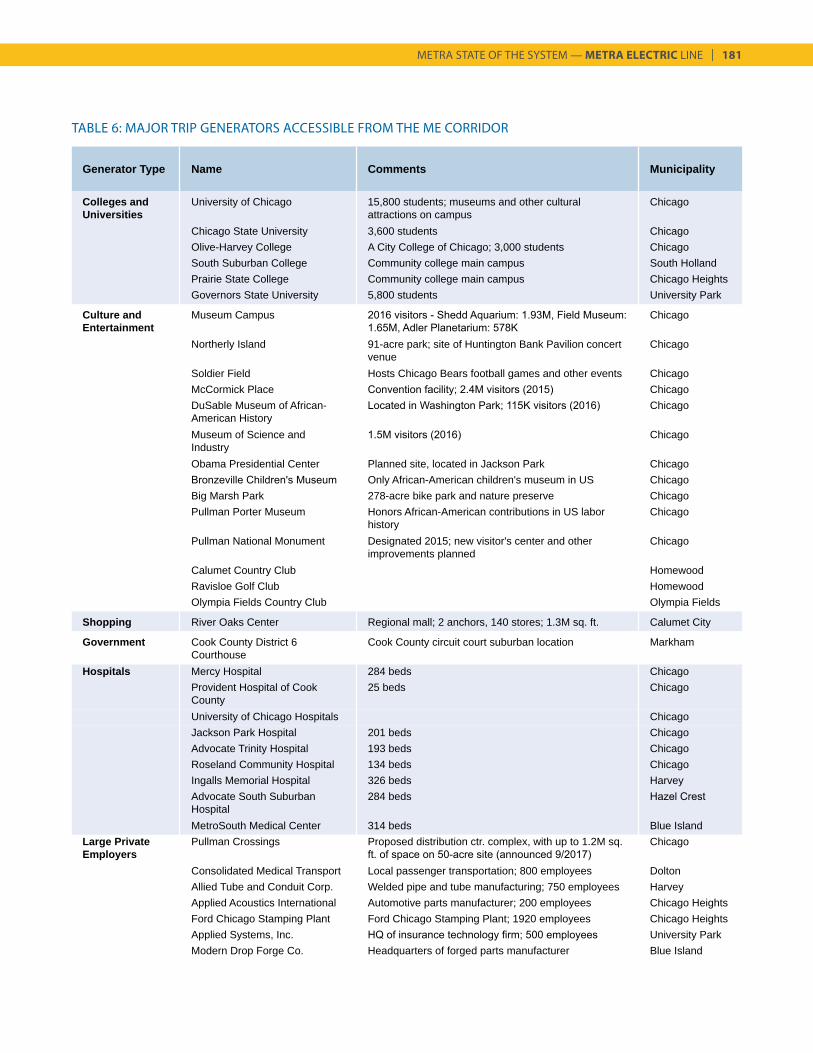
METRA STATE OF THE SYSTEM — METRA ELECTRIC LINE | 181
Generator Type Name Comments Municipality
Colleges and Universities
University of Chicago 15,800 students; museums and other cultural attractions on campus
Chicago
Chicago State University 3,600 students ChicagoOlive-Harvey College A City College of Chicago; 3,000 students ChicagoSouth Suburban College Community college main campus South HollandPrairie State College Community college main campus Chicago HeightsGovernors State University 5,800 students University Park
Culture and Entertainment
Museum Campus 2016 visitors - Shedd Aquarium: 1.93M, Field Museum: 1.65M, Adler Planetarium: 578K
Chicago
Northerly Island 91-acre park; site of Huntington Bank Pavilion concert venue
Chicago
Soldier Field Hosts Chicago Bears football games and other events ChicagoMcCormick Place Convention facility; 2.4M visitors (2015) ChicagoDuSable Museum of African-American History
Located in Washington Park; 115K visitors (2016) Chicago
Museum of Science and Industry
1.5M visitors (2016) Chicago
Obama Presidential Center Planned site, located in Jackson Park ChicagoBronzeville Children's Museum Only African-American children's museum in US ChicagoBig Marsh Park 278-acre bike park and nature preserve ChicagoPullman Porter Museum Honors African-American contributions in US labor
historyChicago
Pullman National Monument Designated 2015; new visitor's center and other improvements planned
Chicago
Calumet Country Club HomewoodRavisloe Golf Club HomewoodOlympia Fields Country Club Olympia Fields
Shopping River Oaks Center Regional mall; 2 anchors, 140 stores; 1.3M sq. ft. Calumet City
Government Cook County District 6 Courthouse
Cook County circuit court suburban location Markham
Hospitals Mercy Hospital 284 beds ChicagoProvident Hospital of Cook County
25 beds Chicago
University of Chicago Hospitals ChicagoJackson Park Hospital 201 beds ChicagoAdvocate Trinity Hospital 193 beds ChicagoRoseland Community Hospital 134 beds ChicagoIngalls Memorial Hospital 326 beds HarveyAdvocate South Suburban Hospital
284 beds Hazel Crest
MetroSouth Medical Center 314 beds Blue IslandLarge Private Employers
Pullman Crossings Proposed distribution ctr. complex, with up to 1.2M sq. ft. of space on 50-acre site (announced 9/2017)
Chicago
Consolidated Medical Transport Local passenger transportation; 800 employees DoltonAllied Tube and Conduit Corp. Welded pipe and tube manufacturing; 750 employees HarveyApplied Acoustics International Automotive parts manufacturer; 200 employees Chicago HeightsFord Chicago Stamping Plant Ford Chicago Stamping Plant; 1920 employees Chicago HeightsApplied Systems, Inc. HQ of insurance technology firm; 500 employees University ParkModern Drop Forge Co. Headquarters of forged parts manufacturer Blue Island
TABLE 6: MAJOR TRIP GENERATORS ACCESSIBLE FROM THE ME CORRIDOR
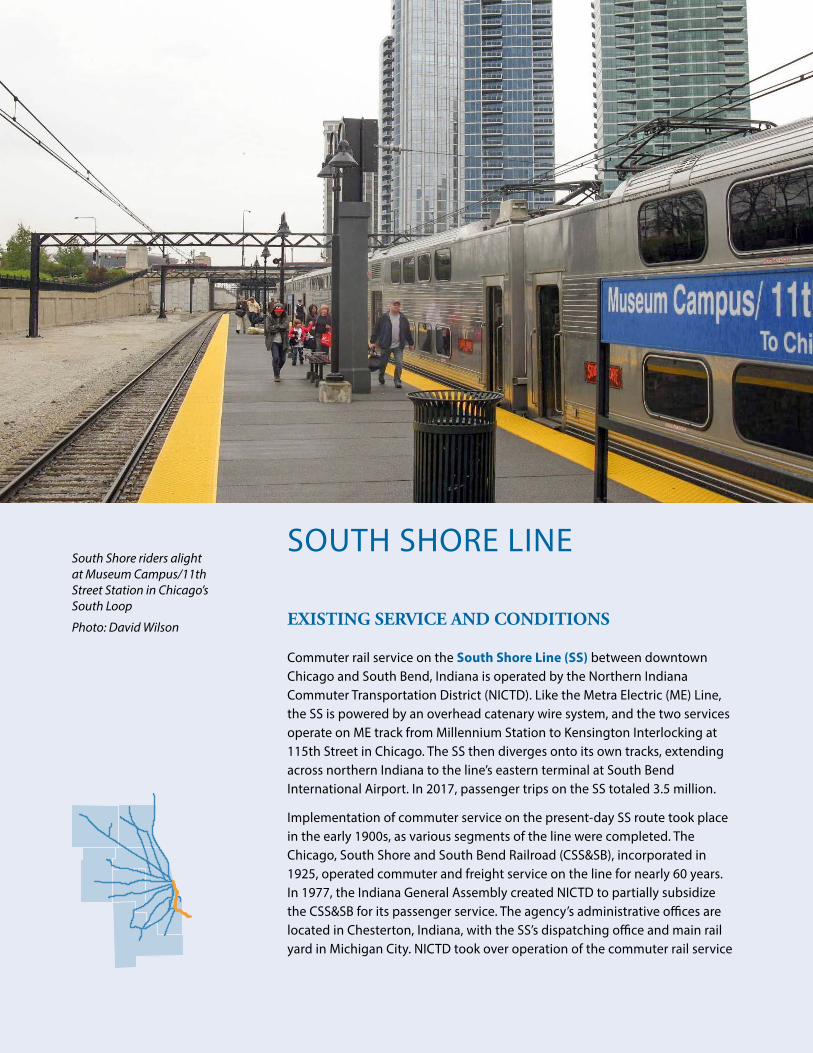
SOUTH SHORE LINE
EXISTING SERVICE AND CONDITIONS
Commuter rail service on the South Shore Line (SS) between downtown Chicago and South Bend, Indiana is operated by the Northern Indiana Commuter Transportation District (NICTD). Like the Metra Electric (ME) Line, the SS is powered by an overhead catenary wire system, and the two services operate on ME track from Millennium Station to Kensington Interlocking at 115th Street in Chicago. The SS then diverges onto its own tracks, extending across northern Indiana to the line’s eastern terminal at South Bend International Airport. In 2017, passenger trips on the SS totaled 3.5 million.
Implementation of commuter service on the present-day SS route took place in the early 1900s, as various segments of the line were completed. The Chicago, South Shore and South Bend Railroad (CSS&SB), incorporated in 1925, operated commuter and freight service on the line for nearly 60 years. In 1977, the Indiana General Assembly created NICTD to partially subsidize the CSS&SB for its passenger service. The agency’s administrative offices are located in Chesterton, Indiana, with the SS’s dispatching office and main rail yard in Michigan City. NICTD took over operation of the commuter rail service
South Shore riders alight at Museum Campus/11th Street Station in Chicago’s South Loop
Photo: David Wilson
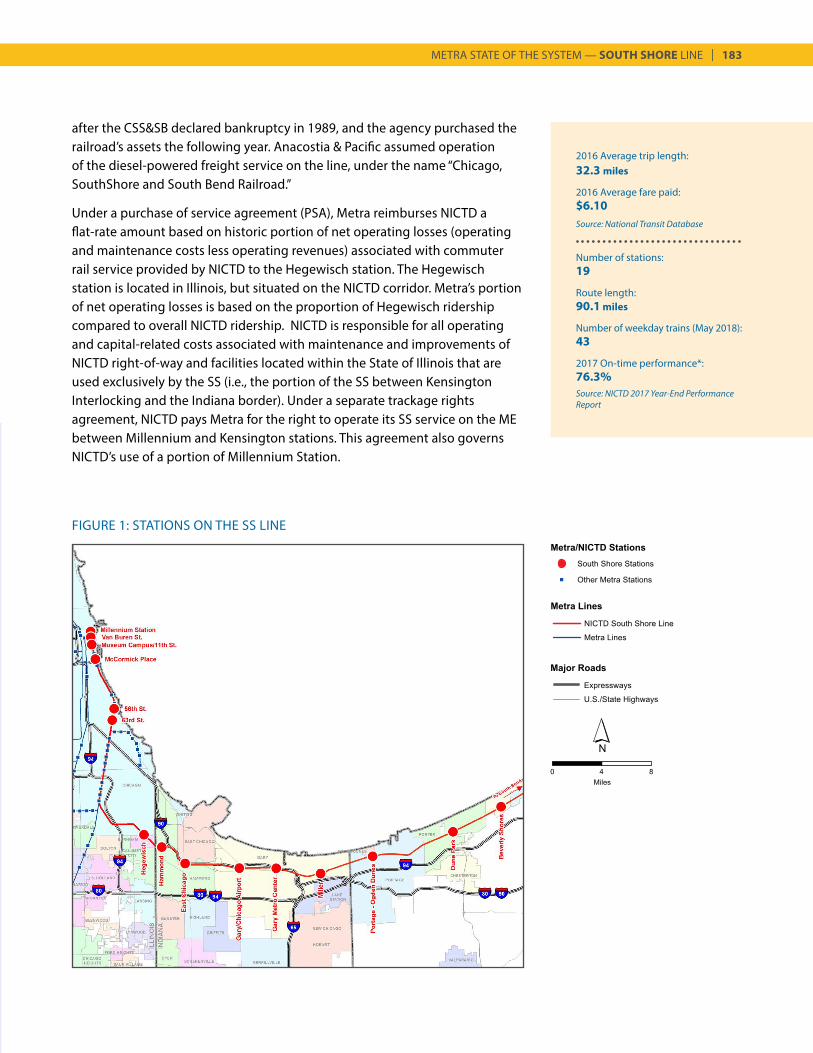
METRA STATE OF THE SYSTEM — SOUTH SHORE LINE | 183
2016 Average trip length:32.3 miles
2016 Average fare paid:$6.10Source: National Transit Database
Number of stations:19
Route length:90.1 miles
Number of weekday trains (May 2018):43
2017 On-time performance*:76.3%Source: NICTD 2017 Year-End Performance Report
FIGURE 1: STATIONS ON THE SS LINE
after the CSS&SB declared bankruptcy in 1989, and the agency purchased the railroad’s assets the following year. Anacostia & Pacific assumed operation of the diesel-powered freight service on the line, under the name “Chicago, SouthShore and South Bend Railroad.”
Under a purchase of service agreement (PSA), Metra reimburses NICTD a flat-rate amount based on historic portion of net operating losses (operating and maintenance costs less operating revenues) associated with commuter rail service provided by NICTD to the Hegewisch station. The Hegewisch station is located in Illinois, but situated on the NICTD corridor. Metra’s portion of net operating losses is based on the proportion of Hegewisch ridership compared to overall NICTD ridership. NICTD is responsible for all operating and capital-related costs associated with maintenance and improvements of NICTD right-of-way and facilities located within the State of Illinois that are used exclusively by the SS (i.e., the portion of the SS between Kensington Interlocking and the Indiana border). Under a separate trackage rights agreement, NICTD pays Metra for the right to operate its SS service on the ME between Millennium and Kensington stations. This agreement also governs NICTD’s use of a portion of Millennium Station.
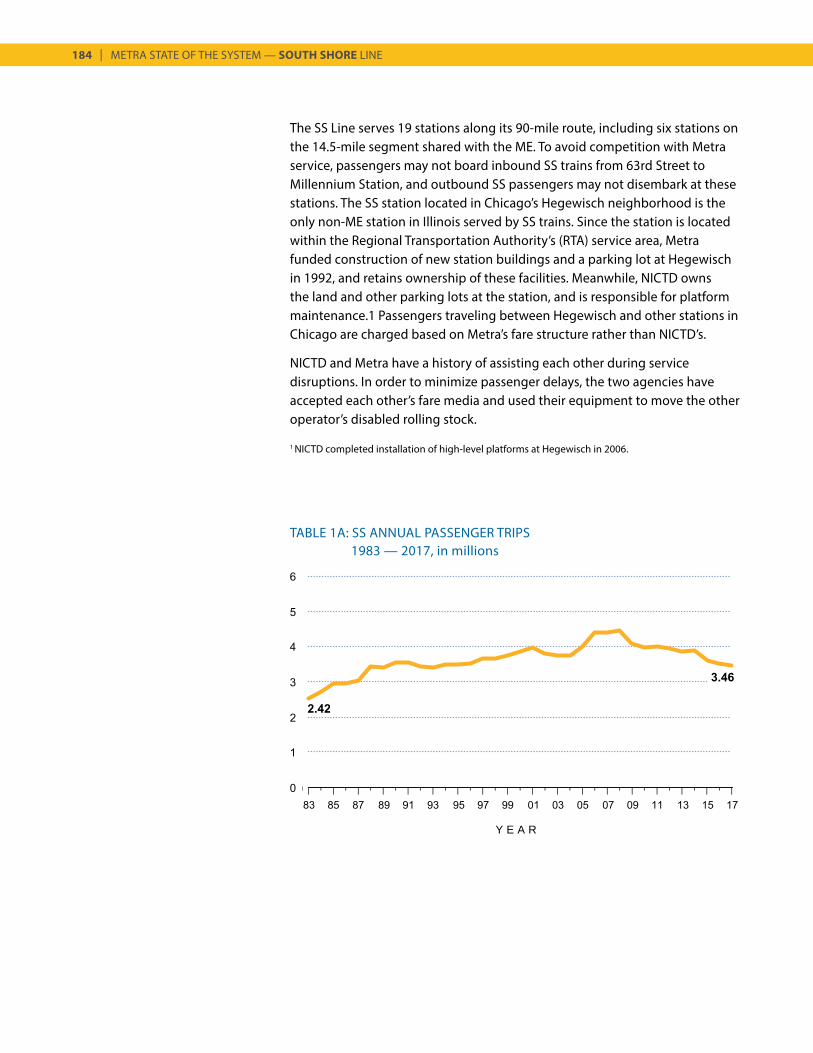
184 | METRA STATE OF THE SYSTEM — SOUTH SHORE LINE
TABLE 1A: SS ANNUAL PASSENGER TRIPS1983 — 2017, in millions
The SS Line serves 19 stations along its 90-mile route, including six stations on the 14.5-mile segment shared with the ME. To avoid competition with Metra service, passengers may not board inbound SS trains from 63rd Street to Millennium Station, and outbound SS passengers may not disembark at these stations. The SS station located in Chicago’s Hegewisch neighborhood is the only non-ME station in Illinois served by SS trains. Since the station is located within the Regional Transportation Authority’s (RTA) service area, Metra funded construction of new station buildings and a parking lot at Hegewisch in 1992, and retains ownership of these facilities. Meanwhile, NICTD owns the land and other parking lots at the station, and is responsible for platform maintenance.1 Passengers traveling between Hegewisch and other stations in Chicago are charged based on Metra’s fare structure rather than NICTD’s.
NICTD and Metra have a history of assisting each other during service disruptions. In order to minimize passenger delays, the two agencies have accepted each other’s fare media and used their equipment to move the other operator’s disabled rolling stock.
1 NICTD completed installation of high-level platforms at Hegewisch in 2006.
Y E A R
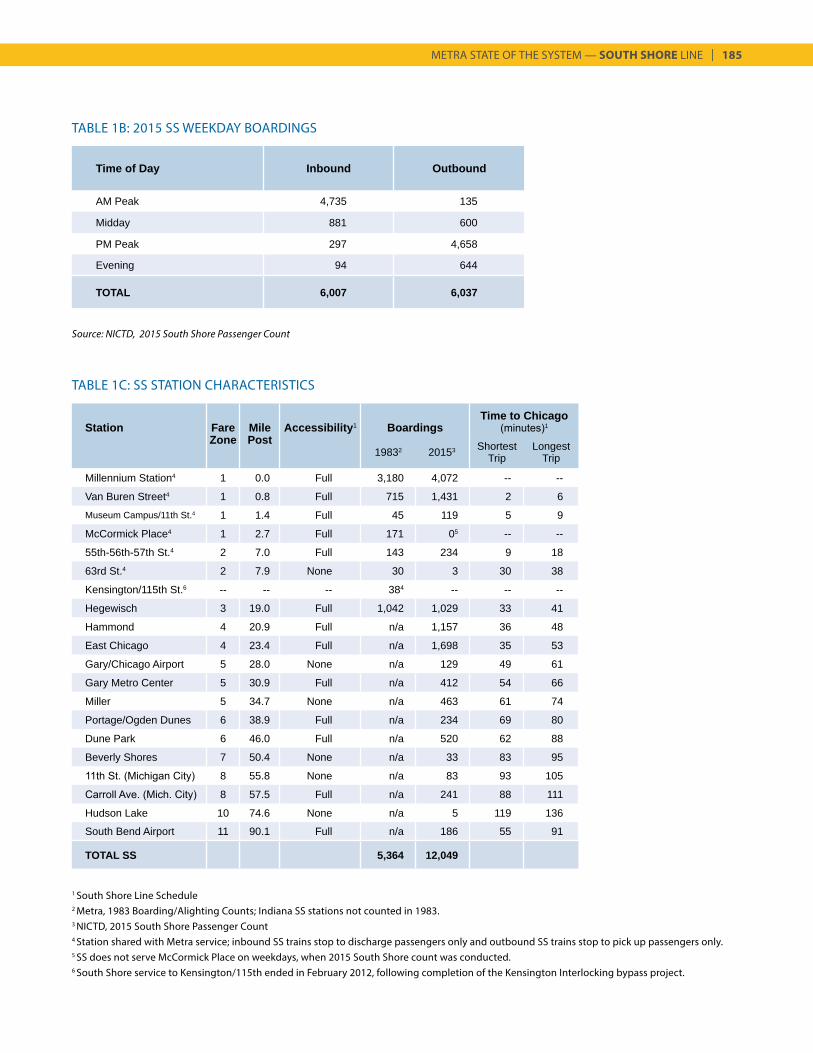
METRA STATE OF THE SYSTEM — SOUTH SHORE LINE | 185
Source: NICTD, 2015 South Shore Passenger Count
TABLE 1B: 2015 SS WEEKDAY BOARDINGS
Time of Day Inbound Outbound
AM Peak 4,735 135
Midday 881 600
PM Peak 297 4,658
Evening 94 644
TOTAL 6,007 6,037
TABLE 1C: SS STATION CHARACTERISTICS
Station Fare Mile Accessibility1 BoardingsTime to Chicago
(minutes)1
Zone Post19832 20153 Shortest
TripLongest
Trip
Millennium Station4 1 0.0 Full 3,180 4,072 -- --
Van Buren Street4 1 0.8 Full 715 1,431 2 6Museum Campus/11th St.4 1 1.4 Full 45 119 5 9
McCormick Place4 1 2.7 Full 171 05 -- --
55th-56th-57th St.4 2 7.0 Full 143 234 9 18
63rd St.4 2 7.9 None 30 3 30 38
Kensington/115th St.6 -- -- -- 384 -- -- --
Hegewisch 3 19.0 Full 1,042 1,029 33 41
Hammond 4 20.9 Full n/a 1,157 36 48
East Chicago 4 23.4 Full n/a 1,698 35 53
Gary/Chicago Airport 5 28.0 None n/a 129 49 61
Gary Metro Center 5 30.9 Full n/a 412 54 66
Miller 5 34.7 None n/a 463 61 74
Portage/Ogden Dunes 6 38.9 Full n/a 234 69 80
Dune Park 6 46.0 Full n/a 520 62 88
Beverly Shores 7 50.4 None n/a 33 83 95
11th St. (Michigan City) 8 55.8 None n/a 83 93 105
Carroll Ave. (Mich. City) 8 57.5 Full n/a 241 88 111
Hudson Lake 10 74.6 None n/a 5 119 136
South Bend Airport 11 90.1 Full n/a 186 55 91
TOTAL SS 5,364 12,049
1 South Shore Line Schedule 2 Metra, 1983 Boarding/Alighting Counts; Indiana SS stations not counted in 1983. 3 NICTD, 2015 South Shore Passenger Count 4 Station shared with Metra service; inbound SS trains stop to discharge passengers only and outbound SS trains stop to pick up passengers only.5 SS does not serve McCormick Place on weekdays, when 2015 South Shore count was conducted. 6 South Shore service to Kensington/115th ended in February 2012, following completion of the Kensington Interlocking bypass project.
186 | METRA STATE OF THE SYSTEM — SOUTH SHORE LINE
IMPROVEMENTS SINCE THE START OF NICTD
Since its creation, NICTD has invested hundreds of millions of dollars in maintaining and upgrading the SS Line. Among NICTD’s first activities was the acquisition of new rolling stock in the early 1980s, which allowed the line’s oldest vehicles—dating from the 1920s—to be retired. The RTA contributed funding towards the purchase, and eight single-level cars used on the SS are still owned by Metra, though they are operated, stored, and maintained by NICTD. Other rolling stock purchases have been made in the following years. The SS fleet consists of approximately 70 electric self-propelled coaches and a small number of unpowered trailer cars that are placed between cab cars in a trainset. Most SS cars are single-level, but 14 bi-level gallery cars—similar to the new ME cars—entered service in 2009.
In 1992, the SS was extended 3.2 miles to the airport in South Bend. Since the 1990s, NICTD has rebuilt a number of SS stations with high-level platforms, giving passengers step-free access to train cars and reducing dwell time. At these stations, gauntlet tracks allow SS trains to align with the platform while providing freight trains the extra width needed to clear the platform edge.
NICTD completed installation of Centralized Traffic Control (CTC) signaling from Michigan City to South Bend in 2007, and in 2011 finished replacement of nearly 70 miles of catenary from Kensington to Michigan City. In 2012, NICTD and Metra completed a new bypass track for SS trains through Kensington Interlocking (funded by NICTD). The project streamlines the SS connection with ME tracks, cutting travel times and improving on-time performance on the SS, and adding operational flexibility on the high-volume portion of the ME north of Kensington. As a result of this project, SS trains no longer serve the Kensington/115th Street Station on the ME.
NICTD completed a preliminary engineering study that considered options for realignment of the SS through Michigan City, where the SS currently runs on a single track embedded in the middle of a roadway, which is shared with other traffic. The selected alternative retains the existing route, but the roadway would be narrowed to a one-way, single-lane street, while the SS would be expanded to two tracks. Relocation of the terminal station at the South Bend Airport has been proposed in order to accommodate runway expansion and cut travel times for SS passengers. The study is currently on hold while the City of South Bend considers five alternatives for the realignment of the rail line through the city. NICTD is currently pursuing funding for two expansion projects, Double Track Northwest Indiana (NWI) and the West Lake Corridor and. In September 2017, NICTD completed an Environmental Assessment for the Double Track NWI Project, which would add a second track to a 25-mile segment between Gary and Michigan City to allow for express trains and expanded service. In March 2018, NICTD completed a Final Environmental Impact Statement and received a Record
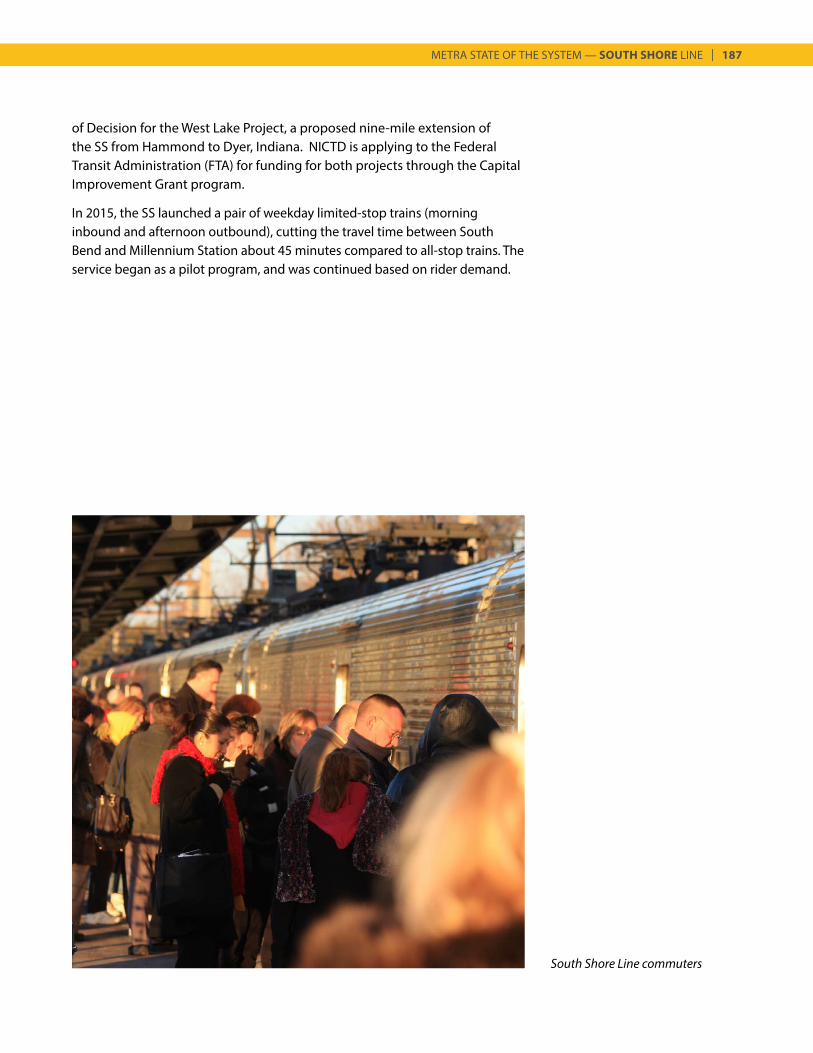
METRA STATE OF THE SYSTEM — SOUTH SHORE LINE | 187
South Shore Line commuters
of Decision for the West Lake Project, a proposed nine-mile extension of the SS from Hammond to Dyer, Indiana. NICTD is applying to the Federal Transit Administration (FTA) for funding for both projects through the Capital Improvement Grant program.
In 2015, the SS launched a pair of weekday limited-stop trains (morning inbound and afternoon outbound), cutting the travel time between South Bend and Millennium Station about 45 minutes compared to all-stop trains. The service began as a pilot program, and was continued based on rider demand.
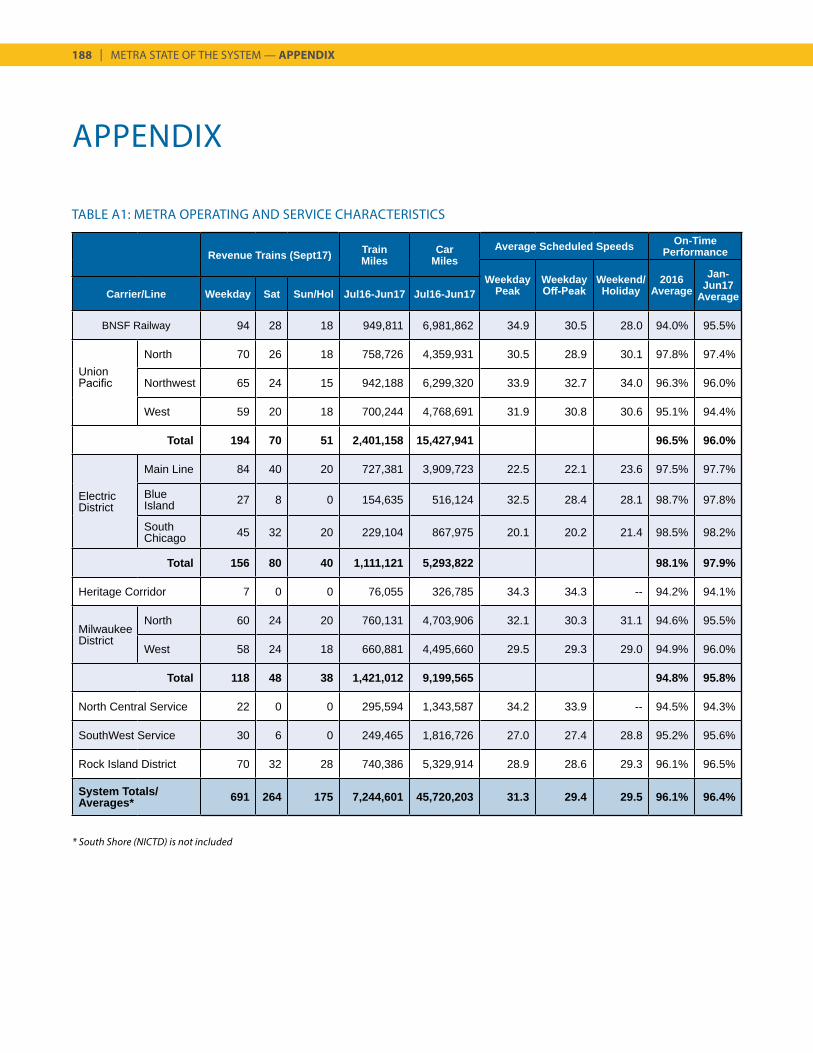
188 | METRA STATE OF THE SYSTEM — APPENDIX
TABLE A1: METRA OPERATING AND SERVICE CHARACTERISTICS
* South Shore (NICTD) is not included
Revenue Trains (Sept17) TrainMiles
CarMiles
Average Scheduled Speeds On-Time Performance
WeekdayPeak
WeekdayOff-Peak
Weekend/Holiday
2016Average
Jan-Jun17
AverageCarrier/Line Weekday Sat Sun/Hol Jul16-Jun17 Jul16-Jun17
BNSF Railway 94 28 18 949,811 6,981,862 34.9 30.5 28.0 94.0% 95.5%
Union Pacific
North 70 26 18 758,726 4,359,931 30.5 28.9 30.1 97.8% 97.4%
Northwest 65 24 15 942,188 6,299,320 33.9 32.7 34.0 96.3% 96.0%
West 59 20 18 700,244 4,768,691 31.9 30.8 30.6 95.1% 94.4%
Total 194 70 51 2,401,158 15,427,941 96.5% 96.0%
Electric District
Main Line 84 40 20 727,381 3,909,723 22.5 22.1 23.6 97.5% 97.7%
Blue Island 27 8 0 154,635 516,124 32.5 28.4 28.1 98.7% 97.8%
South Chicago 45 32 20 229,104 867,975 20.1 20.2 21.4 98.5% 98.2%
Total 156 80 40 1,111,121 5,293,822 98.1% 97.9%
Heritage Corridor 7 0 0 76,055 326,785 34.3 34.3 -- 94.2% 94.1%
Milwaukee District
North 60 24 20 760,131 4,703,906 32.1 30.3 31.1 94.6% 95.5%
West 58 24 18 660,881 4,495,660 29.5 29.3 29.0 94.9% 96.0%
Total 118 48 38 1,421,012 9,199,565 94.8% 95.8%
North Central Service 22 0 0 295,594 1,343,587 34.2 33.9 -- 94.5% 94.3%
SouthWest Service 30 6 0 249,465 1,816,726 27.0 27.4 28.8 95.2% 95.6%
Rock Island District 70 32 28 740,386 5,329,914 28.9 28.6 29.3 96.1% 96.5%
System Totals/Averages* 691 264 175 7,244,601 45,720,203 31.3 29.4 29.5 96.1% 96.4%
APPENDIX
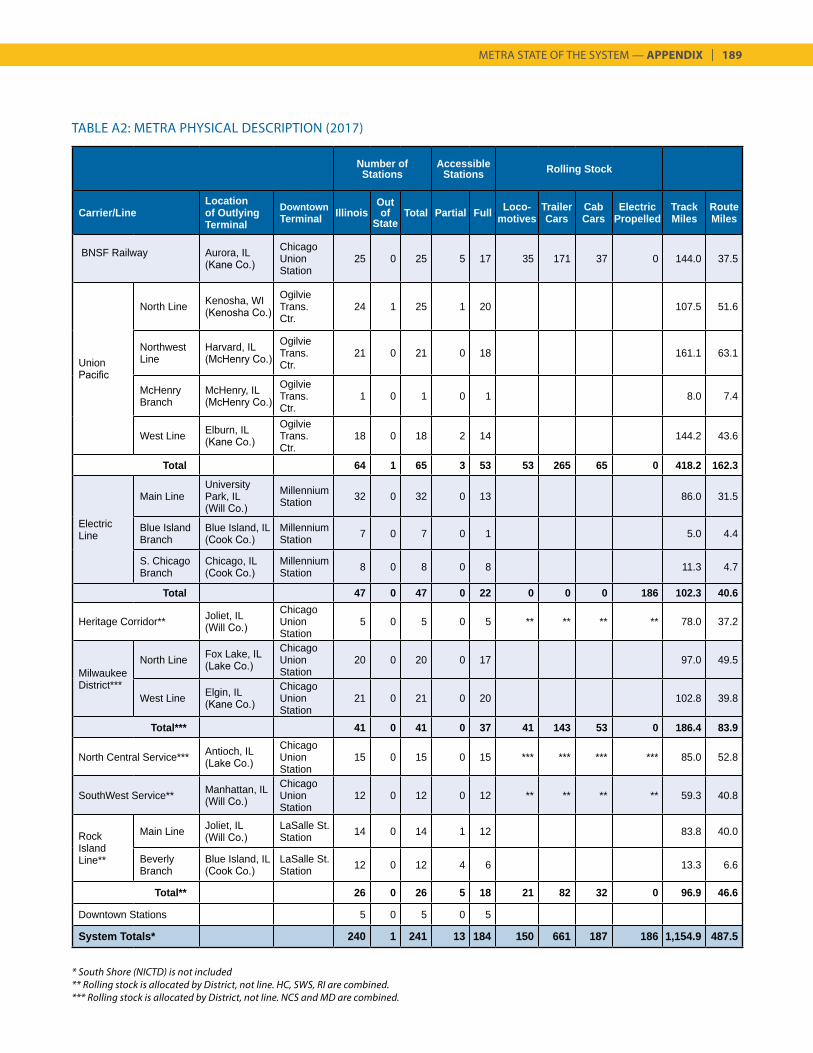
METRA STATE OF THE SYSTEM — APPENDIX | 189
Number of Stations
Accessible Stations Rolling Stock
Carrier/LineLocation of Outlying Terminal
Downtown Terminal Illinois
Out of
StateTotal Partial Full Loco-
motivesTrailer Cars
Cab Cars
Electric Propelled
Track Miles
Route Miles
BNSF Railway Aurora, IL (Kane Co.)
Chicago Union Station
25 0 25 5 17 35 171 37 0 144.0 37.5
Union Pacific
North Line Kenosha, WI (Kenosha Co.)
Ogilvie Trans. Ctr.
24 1 25 1 20 107.5 51.6
Northwest Line
Harvard, IL (McHenry Co.)
Ogilvie Trans. Ctr.
21 0 21 0 18 161.1 63.1
McHenry Branch
McHenry, IL (McHenry Co.)
Ogilvie Trans. Ctr.
1 0 1 0 1 8.0 7.4
West Line Elburn, IL (Kane Co.)
Ogilvie Trans. Ctr.
18 0 18 2 14 144.2 43.6
Total 64 1 65 3 53 53 265 65 0 418.2 162.3
Electric Line
Main LineUniversity Park, IL (Will Co.)
Millennium Station 32 0 32 0 13 86.0 31.5
Blue Island Branch
Blue Island, IL (Cook Co.)
Millennium Station 7 0 7 0 1 5.0 4.4
S. Chicago Branch
Chicago, IL (Cook Co.)
Millennium Station 8 0 8 0 8 11.3 4.7
Total 47 0 47 0 22 0 0 0 186 102.3 40.6
Heritage Corridor** Joliet, IL (Will Co.)
Chicago Union Station
5 0 5 0 5 ** ** ** ** 78.0 37.2
Milwaukee District***
North Line Fox Lake, IL (Lake Co.)
Chicago Union Station
20 0 20 0 17 97.0 49.5
West Line Elgin, IL (Kane Co.)
Chicago Union Station
21 0 21 0 20 102.8 39.8
Total*** 41 0 41 0 37 41 143 53 0 186.4 83.9
North Central Service*** Antioch, IL (Lake Co.)
Chicago Union Station
15 0 15 0 15 *** *** *** *** 85.0 52.8
SouthWest Service** Manhattan, IL (Will Co.)
Chicago Union Station
12 0 12 0 12 ** ** ** ** 59.3 40.8
Rock Island Line**
Main Line Joliet, IL (Will Co.)
LaSalle St. Station 14 0 14 1 12 83.8 40.0
Beverly Branch
Blue Island, IL (Cook Co.)
LaSalle St. Station 12 0 12 4 6 13.3 6.6
Total** 26 0 26 5 18 21 82 32 0 96.9 46.6
Downtown Stations 5 0 5 0 5
System Totals* 240 1 241 13 184 150 661 187 186 1,154.9 487.5
TABLE A2: METRA PHYSICAL DESCRIPTION (2017)
* South Shore (NICTD) is not included** Rolling stock is allocated by District, not line. HC, SWS, RI are combined.*** Rolling stock is allocated by District, not line. NCS and MD are combined.
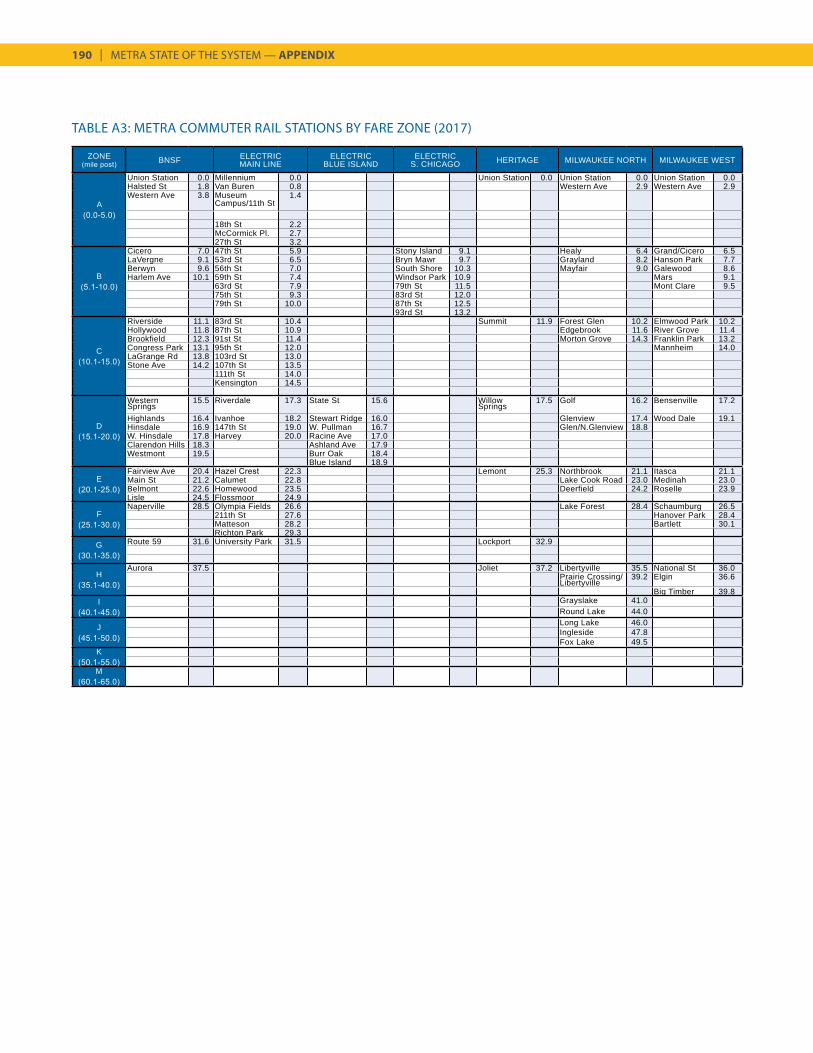
190 | METRA STATE OF THE SYSTEM — APPENDIX
ZONE(mile post) BNSF ELECTRIC
MAIN LINEELECTRIC
BLUE ISLANDELECTRIC
S. CHICAGO HERITAGE MILWAUKEE NORTH MILWAUKEE WEST
A(0.0-5.0)
Union Station 0.0 Millennium 0.0 Union Station 0.0 Union Station 0.0 Union Station 0.0 Halsted St 1.8 Van Buren 0.8 Western Ave 2.9 Western Ave 2.9 Western Ave 3.8 Museum
Campus/11th St1.4
18th St 2.2 McCormick Pl. 2.7 27th St 3.2
B(5.1-10.0)
Cicero 7.0 47th St 5.9 Stony Island 9.1 Healy 6.4 Grand/Cicero 6.5 LaVergne 9.1 53rd St 6.5 Bryn Mawr 9.7 Grayland 8.2 Hanson Park 7.7 Berwyn 9.6 56th St 7.0 South Shore 10.3 Mayfair 9.0 Galewood 8.6 Harlem Ave 10.1 59th St 7.4 Windsor Park 10.9 Mars 9.1
63rd St 7.9 79th St 11.5 Mont Clare 9.5 75th St 9.3 83rd St 12.0 79th St 10.0 87th St 12.5
93rd St 13.2
C(10.1-15.0)
Riverside 11.1 83rd St 10.4 Summit 11.9 Forest Glen 10.2 Elmwood Park 10.2 Hollywood 11.8 87th St 10.9 Edgebrook 11.6 River Grove 11.4 Brookfield 12.3 91st St 11.4 Morton Grove 14.3 Franklin Park 13.2 Congress Park 13.1 95th St 12.0 Mannheim 14.0 LaGrange Rd 13.8 103rd St 13.0 Stone Ave 14.2 107th St 13.5
111th St 14.0 Kensington 14.5
D(15.1-20.0)
Western Springs
15.5 Riverdale 17.3 State St 15.6 Willow Springs
17.5 Golf 16.2 Bensenville 17.2
Highlands 16.4 Ivanhoe 18.2 Stewart Ridge 16.0 Glenview 17.4 Wood Dale 19.1 Hinsdale 16.9 147th St 19.0 W. Pullman 16.7 Glen/N.Glenview 18.8 W. Hinsdale 17.8 Harvey 20.0 Racine Ave 17.0 Clarendon Hills 18.3 Ashland Ave 17.9 Westmont 19.5 Burr Oak 18.4
Blue Island 18.9
E(20.1-25.0)
Fairview Ave 20.4 Hazel Crest 22.3 Lemont 25.3 Northbrook 21.1 Itasca 21.1 Main St 21.2 Calumet 22.8 Lake Cook Road 23.0 Medinah 23.0 Belmont 22.6 Homewood 23.5 Deerfield 24.2 Roselle 23.9 Lisle 24.5 Flossmoor 24.9
F(25.1-30.0)
Naperville 28.5 Olympia Fields 26.6 Lake Forest 28.4 Schaumburg 26.5 211th St 27.6 Hanover Park 28.4 Matteson 28.2 Bartlett 30.1 Richton Park 29.3
G(30.1-35.0)
Route 59 31.6 University Park 31.5 Lockport 32.9
H(35.1-40.0)
Aurora 37.5 Joliet 37.2 Libertyville 35.5 National St 36.0 Prairie Crossing/ Libertyville
39.2 Elgin 36.6
Big Timber 39.8 I
(40.1-45.0)Grayslake 41.0 Round Lake 44.0
J(45.1-50.0)
Long Lake 46.0 Ingleside 47.8 Fox Lake 49.5
K(50.1-55.0)
M(60.1-65.0)
TABLE A3: METRA COMMUTER RAIL STATIONS BY FARE ZONE (2017)
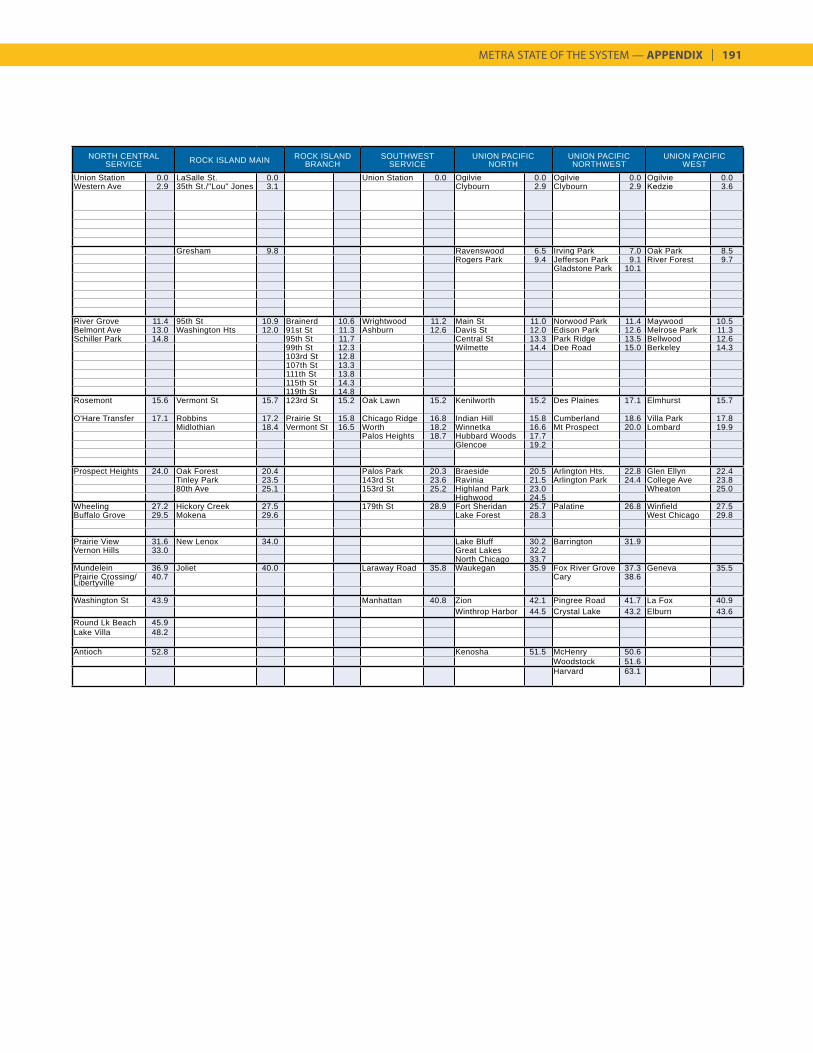
METRA STATE OF THE SYSTEM — APPENDIX | 191
NORTH CENTRAL SERVICE ROCK ISLAND MAIN ROCK ISLAND
BRANCHSOUTHWEST
SERVICEUNION PACIFIC
NORTHUNION PACIFICNORTHWEST
UNION PACIFIC WEST
Union Station 0.0 LaSalle St. 0.0 Union Station 0.0 Ogilvie 0.0 Ogilvie 0.0 Ogilvie 0.0 Western Ave 2.9 35th St./"Lou" Jones 3.1 Clybourn 2.9 Clybourn 2.9 Kedzie 3.6
Gresham 9.8 Ravenswood 6.5 Irving Park 7.0 Oak Park 8.5 Rogers Park 9.4 Jefferson Park 9.1 River Forest 9.7
Gladstone Park 10.1
River Grove 11.4 95th St 10.9 Brainerd 10.6 Wrightwood 11.2 Main St 11.0 Norwood Park 11.4 Maywood 10.5 Belmont Ave 13.0 Washington Hts 12.0 91st St 11.3 Ashburn 12.6 Davis St 12.0 Edison Park 12.6 Melrose Park 11.3 Schiller Park 14.8 95th St 11.7 Central St 13.3 Park Ridge 13.5 Bellwood 12.6
99th St 12.3 Wilmette 14.4 Dee Road 15.0 Berkeley 14.3 103rd St 12.8 107th St 13.3 111th St 13.8 115th St 14.3 119th St 14.8
Rosemont 15.6 Vermont St 15.7 123rd St 15.2 Oak Lawn 15.2 Kenilworth 15.2 Des Plaines 17.1 Elmhurst 15.7
O'Hare Transfer 17.1 Robbins 17.2 Prairie St 15.8 Chicago Ridge 16.8 Indian Hill 15.8 Cumberland 18.6 Villa Park 17.8 Midlothian 18.4 Vermont St 16.5 Worth 18.2 Winnetka 16.6 Mt Prospect 20.0 Lombard 19.9
Palos Heights 18.7 Hubbard Woods 17.7 Glencoe 19.2
Prospect Heights 24.0 Oak Forest 20.4 Palos Park 20.3 Braeside 20.5 Arlington Hts. 22.8 Glen Ellyn 22.4 Tinley Park 23.5 143rd St 23.6 Ravinia 21.5 Arlington Park 24.4 College Ave 23.8 80th Ave 25.1 153rd St 25.2 Highland Park 23.0 Wheaton 25.0
Highwood 24.5 Wheeling 27.2 Hickory Creek 27.5 179th St 28.9 Fort Sheridan 25.7 Palatine 26.8 Winfield 27.5 Buffalo Grove 29.5 Mokena 29.6 Lake Forest 28.3 West Chicago 29.8
Prairie View 31.6 New Lenox 34.0 Lake Bluff 30.2 Barrington 31.9 Vernon Hills 33.0 Great Lakes 32.2
North Chicago 33.7 Mundelein 36.9 Joliet 40.0 Laraway Road 35.8 Waukegan 35.9 Fox River Grove 37.3 Geneva 35.5 Prairie Crossing/ Libertyville
40.7 Cary 38.6
Washington St 43.9 Manhattan 40.8 Zion 42.1 Pingree Road 41.7 La Fox 40.9 Winthrop Harbor 44.5 Crystal Lake 43.2 Elburn 43.6
Round Lk Beach 45.9 Lake Villa 48.2
Antioch 52.8 Kenosha 51.5 McHenry 50.6 Woodstock 51.6 Harvard 63.1

METRA STATE OF THE SYSTEM — APPENDIX | 192
Related Documents