OPERATORS STRUGGLE WITH MARKET DEMANDS page 44 www.AMonline.com 08.07 State of the Vending Industry Report

Welcome message from author
This document is posted to help you gain knowledge. Please leave a comment to let me know what you think about it! Share it to your friends and learn new things together.
Transcript
OperatOrs struggle with market demands page 44
www.AMonline.com 08.07
state of the Vending
industry report

2006: Operators battle rising costs, challenging market
iscal 2006 was not a year of great expectations for
the vending industry.
The industry remained constrained by the same
forces that have stymied its growth since the end of the
“dotcom” implosion of the late 1990s, which was its last
prosperous period. Worksite downsizing ebbed after 2002,
but the vending industry has not been able to share in the
nation’s economic growth due to several industry specific
challenges.
Fiscal 2006 matched 2005’s growth rate; aggregate
sales increased by 3 percentage points to a total $22.54
billion.
The industry’s challenges, identified by Automatic Mer-chandiser in a special “Wake Up Vending” series in 2006,
rest on its reliance on an operating model that evolved in
the old industrial economy. That was an economy domi-
nated by large work sites with captive audiences.
As the manufacturing base has given way to a service
and technology economy, the vending industry must adapt
to new customer needs.
New market realities emergeIn the current operating environment, locations have
fewer employees, employees have more diverse lifestyles
and product preferences, and they typically are free to leave
the work site for meals. Hence, the vending operator, to be
competitive, must cater to a demographically diverse audi-
ence with products that are competitive with other retail
outlets.
The State of the Industry Report in recent years has
examined the industry’s performance in comparison to that
of the overall foodservice industry. Based on this criterion,
the vending industry once again trailed its retail competition
in 2006.
According to the National Restaurant Association,
foodservice sales rose by 5 percentage points in 2006. This
marked the second consecutive 5-point gain for foodser-
vice, and a total 16-point gain for a 3-year period, com-
pared to the vending industry’s seven points in this 3-year
period.
Automatic Merchandiser magazine does not regard sales
growth as the most important financial measurement. How-
ever, given the increasing operating costs, industry observ-
ers recognize that vending operators must increase sales in
order to maintain profitability.
Historically, vending revenues reflected overall economic
output. The last four years, by contrast, represents the first
period in which vending revenues have failed to keep pace
with gains in industrial growth.
The vending industry’s aggregate revenue, indicated in
chart 1, largely tracked the nations’ economic productivity
up until 2002.
the vending industry still fails to win its fair share of growth in a prosperous economy. Operators remain slow to invest in new technology that will strengthen their competitive position. By Elliot Maras, Editor
F Chart 1: iNdustry reveNue iN billiONs, 10-year review
1997
1998
1999
2000
2001
2002
2003
2004
2005
2006
B i l l i o n s o f D o l l a r s0 5 10 15 20 25
22.54
22.02
22.11
23.29
24.49
23.20
22.10
21.05
21.26
21.89
44 Automatic Merchandiser AMonline.com 08.07
S t A t e o f t h e v e n d i n g i n d u S t r y r e p o r t

C o n t i n u e d ▶
veNdiNg NO lONger traCks the eCONOmyAn examination of three recent economic cycles dem-
onstrates the recent slowdown in vending sales relative to
overall economic conditions.
From 1997 to 2000, the nation’s gross domestic
product (GDP), the value of goods and services produced
in the U.S., averaged about 4.2 percentage points per year,
according to the U.S. Commerce Department.
Vending industry revenues, based on Automatic Merchan-diser’s historical data, slightly exceeded this growth rate.
When GDP plummeted below 2 points in both 2000 and
2001, vending performance reflected the downward trend.
In 2004 through 2006, GDP rebounded, averaging
about 3.45 points growth per year while vending sales only
averaged 2.33 points.
In retrospect, vending industry revenues rose in concert
with the U.S. economy in the 1997 to 2000 period, suf-
fered with the economy during the 2000/2001 recession,
but did not keep pace during the 2002 to 2006 expansion.
COmpetiNg retail ChaNNels OutpaCe veNdiNgAutomatic Merchandiser, in its “Wake Up Vending”
series, noted that competing foodservice channels, by
contrast, posted strong sales growth in the recent period.
Foodservice sales increased about 5 points annually for the
past four years.
The vending industry’s 3 percentage point revenue
increase in 2006 largely reflected price increases driven by
product manufacturers. This was the second consecutive
year the report noted that revenue increases were mainly
due to operators passing on higher prices from their sup-
pliers, as opposed to adding customers or selling more to
existing customers.
The Automatic Merchandiser “Wake Up Vending” series
called for a stronger commitment to professionalism in
response to a more demanding business environment. The
series noted that vending operators need to invest more in
equipment, technology, personnel and education in order
to compete with retailers who are capturing more of the
consumer’s spending.
The “Wake Up Vending” series noted that the equip-
ment, technology and product suppliers have given the
industry tools to compete more effectively, but that vending
operators need to be willing to make longer term invest-
ments in order to use these new tools.
The survey indicated that not a lot of progress was
made in investing in new equipment or technology.
2006: u.s. eCONOmy prOspersThe nation’s economy continued to grow in 2006, but
the growth did not come from larger work sites. The Bureau
of Labor Statistics reported that about 1.9 million new jobs
were created in 2006, marking the third straight year of
overall job growth.
For several years, economists have noted that most U.S.
work sites employ less than 100 workers, which means
most are not viable locations for vending banks based on
existing operating cost structures.
About the survey
survey participants were limited to full-line, candy/snack and self-operated vending businesses that sold candy, snacks, confections, cigarettes, hot beverages, cold beverages, refrigerated food, frozen food, ice cream and manually served food. the sampling did not include music and game operators whose main business was not consumable vending merchandise, soft drink bottlers whose main business was not vending, or ice cream distributors whose main business was not vending.
aggregate revenue and equipment figures for the report were based on a total operator universe of 9,000 vending operations in the u.s., along with data from government, product suppliers, and equipment suppliers.
For the fourth straight year, pittsburgh, pa.-based management science associates (msa) inc. provided input on vending sales for the state of the vending industry report. msa receives machine level data from several route automation software providers with the goal of analyzing machine activity.
msa markets two data services to report on industry performance; intelliven™, which monitors machine level sales activity, and proven™, a dollar based projection service which calculates item volume, turns and distribution at the total u.s., region and class of trade levels.
the state of the vending industry report’s revenue and equipment figures include machines operated by business locations for their own use, known as in-house and self-operated machines. this portion is estimated to be about 5 percent of the total industry.
08.07 AMonline.com Automatic Merchandiser 45
S t A t e o f t h e v e n d i n g i n d u S t r y r e p o r t

JOb grOwth bOth helps aNd hurtsThe nation’s comparatively low unemployment – the un-
employment rate remained well below 5 percentage points
in 2006 – affected vending operators in both positive and
negative ways.
This historically low unemployment resulted in up-
ward pressure on wages, which resulted in high consumer
confidence in 2006. Higher consumer confidence creates
a greater willingness to spend discretionary income, which
benefits all retailers.
Wages rose about 4 percent in 2006, according to The
Conference Board.
At the same time, stronger wage pressure typically
makes it harder for vending operators to retain good workers
without raising their salaries.
The National Automatic Merchandising Association
(NAMA) Operating Ratio Report found that payroll as a per-
cent of sales increased in 2006 – however slightly – from
25.1 to 25.2.
eCONOmy beCOmes mOre white COllageAnother reason that the nation’s economic growth did
not help the vending industry is that the employer base is
becoming more service and technology driven as opposed to
manufacturing based. Vending operators have long noticed
that blue collar accounts, on average, generate 20 percent
to 50 percent more sales than white collar accounts.
The automotive sector, a large manufacturing segment
that historically generated plenty of work for vending and
foodservice operators, experienced its third consecutive
poor year in 2006, according to the Detroit, Mich.-based
Automotive Information Center. Automotive production in
North America actually declined by 2.6 percentage points
in 2006, following two years of very weak gains.
Manufacturing accounts continued to represent the larg-
est single share of vending machines, as indicated in chart
3 on page 48. What this actually indicates, however, is that
the vending industry has not been able to shift its customer
base in tandem with the nation’s overall economy.
The Labor Department reported that non-manufacturing
sectors have been growing at the expense of manufacturing
for several years.
eNvirONmeNt ChalleNges medium-size FirmsWith costs continuing to rise and location population
counts not following suite, the operating environment con-
tinued to favor the larger and smaller operating companies
in 2006. Medium-size companies, those with $1 million to
$4.9 million in sales, lost market share to their smaller and
larger competitors, as indicated in chart 2.
Many operators noted there were fewer medium-size
companies in most major markets compared to several
years ago.
The largest companies have the resources to compete in
a more challenging environment while the smallest compa-
nies enjoy the benefits of less overhead.
Larger firms also have the ability to offer a wider variety
of services, particularly manual foodservice, which has ac-
counted for the largest share of the industry’s volume in the
last six years.
OperatOr CONsOlidatiON CONtiNuesConsolidation among operating companies continued in
2006 as many operators viewed acquisition as the only way
to grow. However, there were fewer acquisitions among extra
large companies (companies with more than $10 million in
Chart 2: OperatOr sales
size revenue range % of 2006 Operators projected 2006 sales % of 2006 sales projected 2005 sales % of 2005 sales
small under $1 m 75% $1.006 b 4.7% $936 m 4.5%
medium $1m - $4.9m 17 2.355 b 11 2.41 b 11.6
large $5m - $9.9m 5 2.526 b 11.8 2.35 b 11.3
extra large $10m + 3 15.524 b 72.5 15.1 b 72.6
total* $21.413 b $20.79 b *does not include 5 percent of total industry revenue for machines owned and operated by locations.
46 Automatic Merchandiser AMonline.com 08.07
S t A t e o f t h e v e n d i n g i n d u S t r y r e p o r t
C o n t i n u e d ▶

annual sales) than in previous years. This was because most
extra large companies interested in selling had already sold.
The only multi-state operator acquisition in 2006 was
Overland Park, Kan.-based Treat America’s purchase of
Omaha, Neb.-based The Swanson Corp.
The national operations continued to expand through
acquisition in 2006. The largest of the largest, Compass
Group, continued to sign more independents as franchisees.
sOme extra large OperatiONs divestThere were also divestitures in 2006 of some extra
large operations, indicating the challenges that even extra
large companies face in the current operating environment.
Clairvest Group Inc., a Toronto, Canada-based merchant
bank, divested Consolidated Vendors Corp. (CVC), a
Muskegon, Mich.-based vending operation with branches
throughout Michigan. The company reported estimated an-
nual sales over $50 million in 2001. Clairvest sold the CVC
business to four Michigan vending operations.
Lance Inc., a Charlotte, N.C.-based snack manufacturer
which operated vending routes throughout the Southeast,
divested most of its route business in 2006. Lance had
acquired Tom’s Foods Inc., a Columbus, Ga.-based snack
manufacturer that also operated vending routes, in 2005.
There was more than usual acquisition activity among
equipment suppliers in 2006, which reflected the chal-
lenged state of the industry. Crane Merchandising Systems
acquired two major equipment manufacturers: Automatic
Products International ltd. and Dixie Narco Inc. These
acquisitions resulted in a major consolidation of equipment
manufacturers.
OperatOrs slOw tO iNvestThe survey indicated that operators did not invest
heavily in new technology in 2006, which many observers
believe holds the key to future growth. There was little in-
crease in either of the two technologies that suppliers have
noted as promising: cashless card readers and telemetry-
based remote machine monitoring systems.
While only a handful of operators invested in these
technologies, system suppliers continued to conduct experi-
ments designed to demonstrate growth opportunities for
operators.
MasterCard PayPass™ introduced its contactless credit
card to vending, in cooperation with USA Technologies Inc.
The two companies announced plans to equip 5,000 vend-
ing machines with contactless payment capability in 12
major cities.
“Open” credit and debit card systems for vending have
been available for several years. While the percentage of
operators utilizing these systems increased each of the
past two years, the growth was not significant. The majority
of operators, when asked, did not believe the investment
needed justified the potential return.
In addition to a need for hardware, operators must
also pay processing fees for “open” credit and debit card
systems.
C o n t i n u e d ▶
33.8%
10.7%12.2%
21% 11.5%23.5%
4.4%1.7%
7%
1.7%2.3% 1.2% 0.2%2.9%3.3% 3.3%2.7% 1.6% 4.2%3.2% 2.4%
3.8%
9%7.1%
12.3%11%16.3%
9.6%
1.7%5.1% 4.8% 2.1%
1.5%3%
14.2% 26.8% 26.6%
30.2% 28.4% 31.6%
2006200520042003
Chart 3: maChiNes by lOCatiON, 4-year review● manufacturing● Offices
● hotels/motels● restaurants, bars,
clubs
● retail sites● hospitals, nursing
homes
● schools, colleges● military bases
● Correctional facilities● Other
* Cooperative service vending, music, games, bulk vending, bottled water, sundries, toiletries, condoms, kiddie rides, other foodservice revenue.)
48 Automatic Merchandiser AMonline.com 08.07
S t A t e o f t h e v e n d i n g i n d u S t r y r e p o r t

The majority of operators who installed “open” card
systems did not report enough increase in sales to warrant
installing card readers on more machines. The majority
did not report double digit sales increases, even when the
credit card readers were installed in their largest locations.
The slow acceptance of “open” credit card systems
indicates the vending industry faces a “Catch 22”; many
operators say they are waiting for these systems to become
more established before investing in them, but they cannot
become better established until more operators invest.
Cashless FaCes ChalleNgesOne reason why “open” cashless systems did not gener-
ate higher sales is that consumers are not accustomed to
seeing card readers on vending machines. Some speculated
that consumers need to become accustomed to seeing and
using credit cards in vending machines.
Providers of “closed” cashless systems designed for
captive audiences also introduced enhancements in 2006.
teChNOlOgy iNNOvatiONs CONtiNueBill recyclers that allow customers to receive bills as
change from vending machines increased in 2006, making
it easier for customers to use larger bill denominations.
Some operators reported that bill recyclers were es-
pecially useful in food machines, which have larger value
transactions. Some claimed that providing $5 bills in
change encouraged more purchases.
Some also noted that bill recyclers reduced the need for
free-standing bill changers.
Other technological innovations were introduced in 2006.
Digital touch screens that offer interactive and promo-
tional capabilities were demonstrated on vending machines
at vending trade shows.
A fully-automated, self checkout market that uses radio
frequency identification (RFID) technology was introduced
to a handful of vending customers in 2006.
All of these technologies require an upfront investment.
Many require modern machines or special retrofits.
3.3% 4.55%3.8%3.8%
3.6%
0.5%0.6%0.6%0.6%
1.1%1.1%
1.5%1.5%
1.4%1.5%1.6%1.6%
4%4.1%
4.5%4.5%
5.1%4.9%4.8%
4.6%
6.4%6.2%6.2%
6%
29.3%30%30%30%
18.95%19%19%19.1%
28.7%28.8%29%
28.5%
ColdBeverages
Candy/Snack/
Confections
ManualFoodservice
Vend Food
HotBeverages
OCS
Milk
Ice Cream
Cigarettes
Other
Chart 4a: share OF sales by CategOry, 4-year review● 2003 ● 2004 ● 2005 ● 2006
Chart 4b: prOJeCted sales by CategOry, 4-year review 2003 2004 2005 2006 percent revenue changes, 2006 over 2005
Cold beverages $6.04b $6.12b $6.35b $6.42b 1.2%Candy/snacks/confections 3.99 4.04 4.16 4.30 3.5manual foodservice 6.17 6.38 6.57 6.76 2.9vend food 1.35 1.32 1.36 1.35 -0.03hot beverages 1.07 1.04 1.05 1.03 -1.2OCs 0.84 0.87 0.98 1.01 3.5milk 0.29 0.32 0.35 0.36 2.8ice cream 0.23 0.23 0.33 0.33 3Cigarettes 0.10 0.13 0.13 0.13 3Other 0.95 0.80 0.83 0.85 3
50 Automatic Merchandiser AMonline.com 08.07
S t A t e o f t h e v e n d i n g i n d u S t r y r e p o r t

NAMA released a consumer survey in 2006 that
indicated the public remains largely unaware of vending
technology. The survey, not coincidentally, also reported
that consumers continue to hold vending in low esteem
compared to other retail venues.
The consumer survey found that the most positive
perceptions consumers hold of vending have to do with con-
venience while negative perceptions focus on lack of healthy
products, lack of variety and overall poor value.
health issues CONtiNue tO alarm CONsumersFiscal 2006 was a challenging year from a public rela-
tions standpoint as the media continued to focus attention
on nutrition issues.
Much of the news in 2004 and 2005 focused on
schools. In 2006, the move to mandate nutrition restric-
tions extended to other government buildings and, to a
lesser extent, business and industry locations.
While most of the nutrition restrictions were not directed
at vending locations, the publicity caused more loca-
tion managers to ask questions about nutrition. Vending
operators almost unanimously agreed in 2006 that more
customers raised questions about the nutritional content of
their offerings.
To help operators address these concerns, NAMA
extended its Balanced for Life program to business and
industry customers in 2006. In addition, product manufac-
turers introduced more products that were associated with
better nutrition in 2006.
Vending operators mostly viewed the nutrition issue as
a distraction. While more customers asked for healthier op-
tions, vending operators did not report any increase in sales
for these items, with the exception of bottled water.
Following is a more detailed analysis of the major prod-
uct segments.
COld beverages: priCe iNCreases hurtCold beverages, historically one of the most profitable
vend product segments, became one of the most price
competitive categories in 2006 due to manufacturer price
increases, a trend that gained momentum in 2007.
The cold drink segment declined as a percent of total
sales in 2006, due mainly to operators’ inability to raise
prices. Most operators claimed they were not able to raise
prices as much as needed to sustain profits.
Operators reported being unable to increase the prices
above a certain ceiling due to competitive pressure and
customer resistance.
The pricing situation largely reflected the pressure the
major bottling companies faced due to a declining demand
for soda, the lion’s share of their business. The current em-
phasis on health and nutrition, driven strongly by aggressive
marketing by noncarbonated product manufacturers, re-
sulted in less consumption of soda in favor of bottled water,
ready-to-drink iced teas, energy drinks and even coffee.
The Beverage Marketing Corp. (BMC), which tracks bev-
erage trends, reported that Cadbury Schweppes, the third
largest carbonated drink manufacturer, was the only soda
maker to increase soda sales in 2006.
Many vending operators noted that Cadbury Schweppes
gained market share due to more favorable pricing on many
products. Many operators increased their use of Cadbury
Schweppes’ products for secondary facings, although not
the core products.
bOttle grOwth tapersThe increase in bottles at the expense of cans leveled
off in 2006, having achieved more than three quarters of all
vend beverage sales.
In some cases, operators opted for bottles due to more
favorable pricing.
Operators also noted that customer package prefer-
ence varied. Certain customers preferred cans while others
preferred bottles. Preferences were noticed among both
location managers and end users.
Many operators continued to prefer cans since they
found them easier to work with.
glassFrONts expaNd slOwlyGlassfront beverage machines continued to gain place-
ments in 2006, but still only represented a small percent-
age of machines. The slow growth of glassfronts continued
Chart 5a: COld beverage maChiNes by type, bOttlers aNd veNdOrs, 3-year review
bottler owned vendor owned 2004 2005 2006 2004 2005 2006
Can closed front 1.06m 1m 1m 842,000 830,000 830,000
bottle closed front 1.04m 1.03m 1.03m 115,500 115,000 115,000Combo bottle and can closed front 378,000 378,000 378,000 42,000 42,000 42,000
glassfront 40,000 92,715 118,800 8,000 12,285 16,200
Cup 0 0 0 30,000 20,000 15,000
tOtal 2.518m 2.5m 2.527m 1.037m 1.019m 1.018m
C o n t i n u e d ▶
08.07 AMonline.com Automatic Merchandiser 51
S t A t e o f t h e v e n d i n g i n d u S t r y r e p o r t
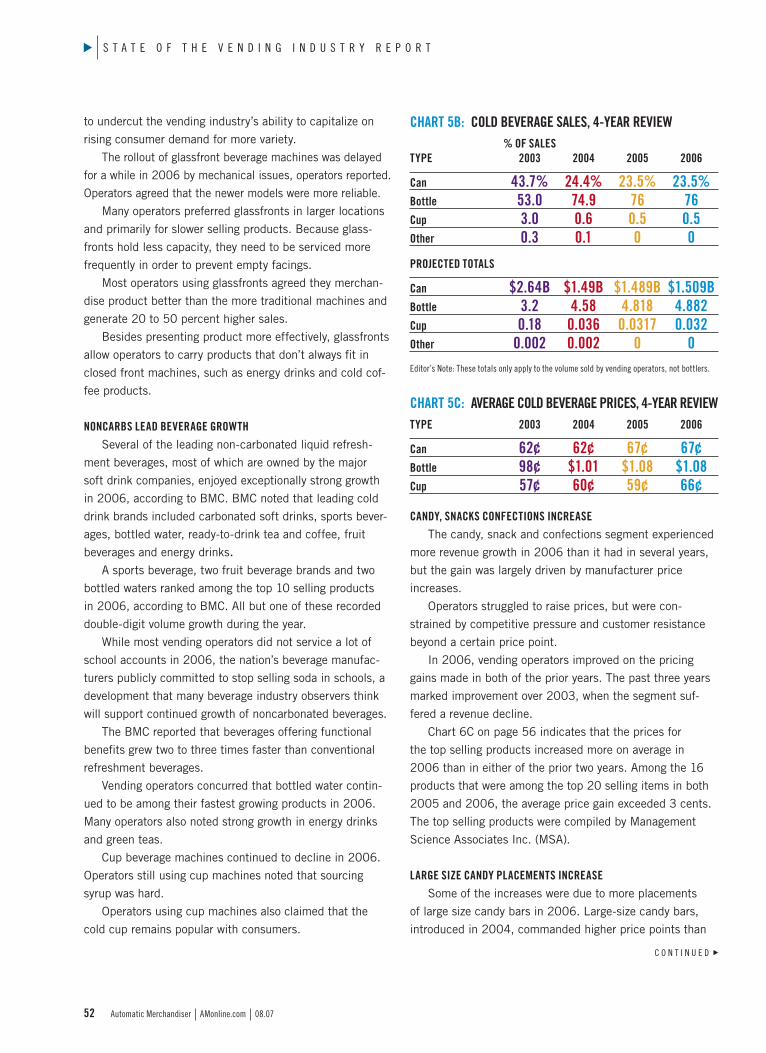
to undercut the vending industry’s ability to capitalize on
rising consumer demand for more variety.
The rollout of glassfront beverage machines was delayed
for a while in 2006 by mechanical issues, operators reported.
Operators agreed that the newer models were more reliable.
Many operators preferred glassfronts in larger locations
and primarily for slower selling products. Because glass-
fronts hold less capacity, they need to be serviced more
frequently in order to prevent empty facings.
Most operators using glassfronts agreed they merchan-
dise product better than the more traditional machines and
generate 20 to 50 percent higher sales.
Besides presenting product more effectively, glassfronts
allow operators to carry products that don’t always fit in
closed front machines, such as energy drinks and cold cof-
fee products.
NONCarbs lead beverage grOwthSeveral of the leading non-carbonated liquid refresh-
ment beverages, most of which are owned by the major
soft drink companies, enjoyed exceptionally strong growth
in 2006, according to BMC. BMC noted that leading cold
drink brands included carbonated soft drinks, sports bever-
ages, bottled water, ready-to-drink tea and coffee, fruit
beverages and energy drinks. A sports beverage, two fruit beverage brands and two
bottled waters ranked among the top 10 selling products
in 2006, according to BMC. All but one of these recorded
double-digit volume growth during the year.
While most vending operators did not service a lot of
school accounts in 2006, the nation’s beverage manufac-
turers publicly committed to stop selling soda in schools, a
development that many beverage industry observers think
will support continued growth of noncarbonated beverages.
The BMC reported that beverages offering functional
benefits grew two to three times faster than conventional
refreshment beverages.
Vending operators concurred that bottled water contin-
ued to be among their fastest growing products in 2006.
Many operators also noted strong growth in energy drinks
and green teas.
Cup beverage machines continued to decline in 2006.
Operators still using cup machines noted that sourcing
syrup was hard.
Operators using cup machines also claimed that the
cold cup remains popular with consumers.
CaNdy, sNaCks CONFeCtiONs iNCreaseThe candy, snack and confections segment experienced
more revenue growth in 2006 than it had in several years,
but the gain was largely driven by manufacturer price
increases.
Operators struggled to raise prices, but were con-
strained by competitive pressure and customer resistance
beyond a certain price point.
In 2006, vending operators improved on the pricing
gains made in both of the prior years. The past three years
marked improvement over 2003, when the segment suf-
fered a revenue decline.
Chart 6C on page 56 indicates that the prices for
the top selling products increased more on average in
2006 than in either of the prior two years. Among the 16
products that were among the top 20 selling items in both
2005 and 2006, the average price gain exceeded 3 cents.
The top selling products were compiled by Management
Science Associates Inc. (MSA).
large size CaNdy plaCemeNts iNCreaseSome of the increases were due to more placements
of large size candy bars in 2006. Large-size candy bars,
introduced in 2004, commanded higher price points than
Chart 5b: COld beverage sales, 4-year review % OF sales type 2003 2004 2005 2006
Can 43.7% 24.4% 23.5% 23.5%bottle 53.0 74.9 76 76Cup 3.0 0.6 0.5 0.5Other 0.3 0.1 0 0
prOJeCted tOtals
Can $2.64b $1.49b $1.489b $1.509bbottle 3.2 4.58 4.818 4.882Cup 0.18 0.036 0.0317 0.032Other 0.002 0.002 0 0editor’s note: these totals only apply to the volume sold by vending operators, not bottlers.
Chart 5C: average COld beverage priCes, 4-year reviewtype 2003 2004 2005 2006
Can 62¢ 62¢ 67¢ 67¢bottle 98¢ $1.01 $1.08 $1.08Cup 57¢ 60¢ 59¢ 66¢
C o n t i n u e d ▶
52 Automatic Merchandiser AMonline.com 08.07
S t A t e o f t h e v e n d i n g i n d u S t r y r e p o r t
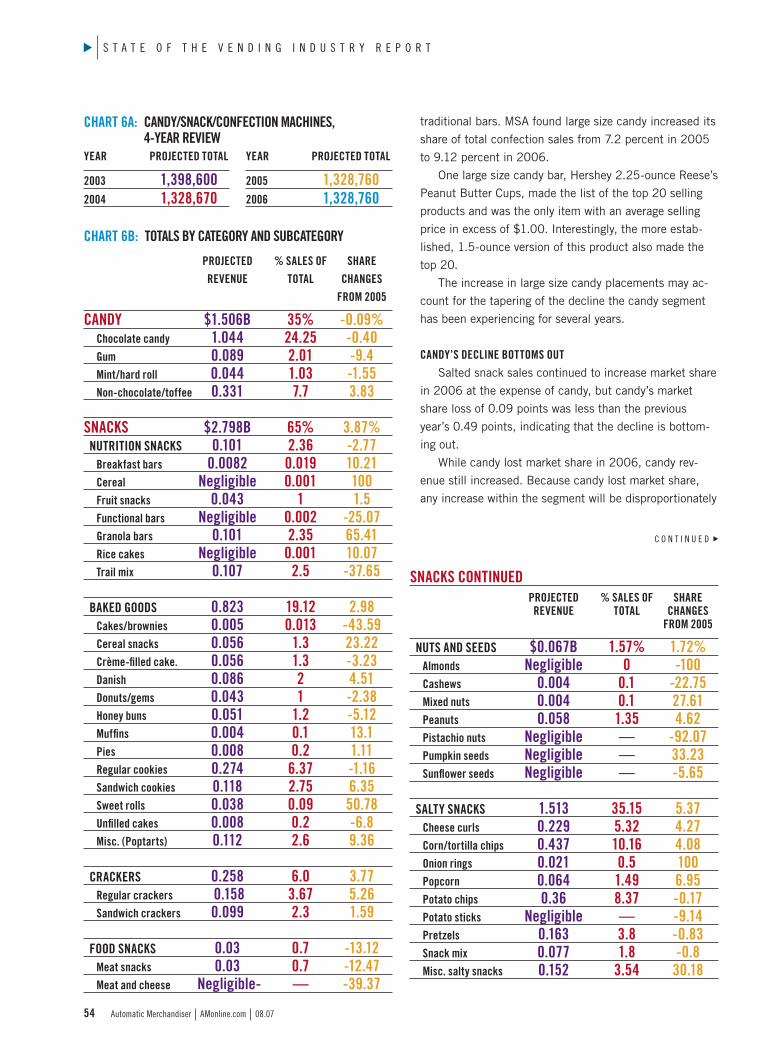
traditional bars. MSA found large size candy increased its
share of total confection sales from 7.2 percent in 2005
to 9.12 percent in 2006.
One large size candy bar, Hershey 2.25-ounce Reese’s
Peanut Butter Cups, made the list of the top 20 selling
products and was the only item with an average selling
price in excess of $1.00. Interestingly, the more estab-
lished, 1.5-ounce version of this product also made the
top 20.
The increase in large size candy placements may ac-
count for the tapering of the decline the candy segment
has been experiencing for several years.
CaNdy’s deCliNe bOttOms OutSalted snack sales continued to increase market share
in 2006 at the expense of candy, but candy’s market
share loss of 0.09 points was less than the previous
year’s 0.49 points, indicating that the decline is bottom-
ing out.
While candy lost market share in 2006, candy rev-
enue still increased. Because candy lost market share,
any increase within the segment will be disproportionately
Chart 6a: CaNdy/sNaCk/CONFeCtiON maChiNes, 4-year review
Chart 6b: tOtals by CategOry aNd subCategOry
prOJeCted % sales OF share reveNue tOtal ChaNges FrOm 2005
CaNdy $1.506b 35% -0.09% Chocolate candy 1.044 24.25 -0.40 gum 0.089 2.01 -9.4 mint/hard roll 0.044 1.03 -1.55 Non-chocolate/toffee 0.331 7.7 3.83
sNaCks $2.798b 65% 3.87% NutritiON sNaCks 0.101 2.36 -2.77 breakfast bars 0.0082 0.019 10.21 Cereal Negligible 0.001 100 Fruit snacks 0.043 1 1.5 Functional bars Negligible 0.002 -25.07 granola bars 0.101 2.35 65.41 rice cakes Negligible 0.001 10.07 trail mix 0.107 2.5 -37.65
baked gOOds 0.823 19.12 2.98 Cakes/brownies 0.005 0.013 -43.59 Cereal snacks 0.056 1.3 23.22 Crème-filled cake. 0.056 1.3 -3.23 danish 0.086 2 4.51 donuts/gems 0.043 1 -2.38 honey buns 0.051 1.2 -5.12 muffins 0.004 0.1 13.1 pies 0.008 0.2 1.11 regular cookies 0.274 6.37 -1.16 sandwich cookies 0.118 2.75 6.35 sweet rolls 0.038 0.09 50.78 unfilled cakes 0.008 0.2 -6.8 misc. (poptarts) 0.112 2.6 9.36
CraCkers 0.258 6.0 3.77 regular crackers 0.158 3.67 5.26 sandwich crackers 0.099 2.3 1.59
FOOd sNaCks 0.03 0.7 -13.12 meat snacks 0.03 0.7 -12.47 meat and cheese Negligible- — -39.37
sNaCks CONtiNued
prOJeCted % sales OF share reveNue tOtal ChaNges FrOm 2005
Nuts aNd seeds $0.067b 1.57% 1.72% almonds Negligible 0 -100 Cashews 0.004 0.1 -22.75 mixed nuts 0.004 0.1 27.61 peanuts 0.058 1.35 4.62 pistachio nuts Negligible — -92.07 pumpkin seeds Negligible — 33.23 sunflower seeds Negligible — -5.65
salty sNaCks 1.513 35.15 5.37 Cheese curls 0.229 5.32 4.27 Corn/tortilla chips 0.437 10.16 4.08 Onion rings 0.021 0.5 100 popcorn 0.064 1.49 6.95 potato chips 0.36 8.37 -0.17 potato sticks Negligible — -9.14 pretzels 0.163 3.8 -0.83 snack mix 0.077 1.8 -0.8 misc. salty snacks 0.152 3.54 30.18
year prOJeCted tOtal
2003 1,398,6002004 1,328,670
year prOJeCted tOtal
2005 1,328,7602006 1,328,760
C o n t i n u e d ▶
54 Automatic Merchandiser AMonline.com 08.07
S t A t e o f t h e v e n d i n g i n d u S t r y r e p o r t

Chart 6d: CaNdy/sNaCk/CONFeCtiONs gaiNiNg the mOst distributiON iN 2006
# prOduCt
1 hershey 1.5-oz. kissables
2 Frito-lay 1.5-oz.wavy Chips ranch
3 Frito-lay 1.5-oz. kC master hot & spicy bbQ
4 Just born 2.12-oz. mike & ike Original
5 kraft Nabisco 1.5-oz. ritz bits Cheese
6 Frito-lay 2.75-oz. doritos blazin’ buffalo ranch
7 top marketing group 1.74-oz. garfield Chocobites peanut
8 Frito-lay 1.75-oz. Fiery habanero
9 hershey 1.61-oz. kit kat extra krispy
10 Frito-lay 1.25-oz. Funyuns
11 Frito-lay 1.5-oz. sunchips garden salsa
12 Nestle 1.5-oz. 100 grand bar
13 kellogg/keebler 3.6-oz. pop tarts Frosted strawberry
14 hershey 0.75-oz. breathsavers wintergreen
15 Frito-lay 1.39-oz. Cheetos Cheddar Crackers
Chart 6C: tOp 20 CaNdy/sNaCk/CONFeCtiONs iN dOllar sales, 4-year review
average selliNg priCe# prOduCt 2003 2004 2005 2006
1 masterfoods usa 2-oz. snickers Original 65¢ 66¢ 67¢ 70¢2 Frito-lay 1.75-oz. doritos 75 76 76 78 Nacho Cheesier big grab
3 masterfoods usa 1.74-oz. m&m’s peanut 65 67 67 714 Frito-lay 2.125-oz. Cheetos Crunchy 75 76 76 795 kellogg/keebler 1.5-oz. Cheez-it Original 54 52 52 556 masterfoods usa 2-oz. twix bar 66 67 67 717 kellogg/keebler 3.6-oz. 79 79 77 81 pop tarts Frosted strawberry
8 kellogg/keebler 1.7-oz.rice krispies treat Na 68 70 749 Frito-lay 1.5-oz. lay’s Chips 73 75 74 7610 mrs. Freshley’s 4.5-oz. Jumbo honey bun Na Na 73 7711 masterfoods usa 2.17-oz. skittles 68 70 70 7412 hershey 2.25-oz. reese’s Na Na Na 1.04 peanut butter Cups
13 Frito-lay 1.125-oz. Cheetos Crunchy 53 54 54 5914 Frito-lay 3-oz. Fritos Na 73 73 7615 Frito-lay 2.25-oz. Fritos Chili Cheese Na 73 73 7616 hershey 1.5-oz. reese’s peanut butter Cups 64 65 74 7617 masterfoods usa 1.69-oz. 64 66 67 70 m&m’s milk Chocolate
18 Nestle 2.1-oz. butterfinger Na Na Na 7119 kellogg/keebler 2-oz. Famous amos 68 67 65 68 Chocolate Chip Cookies
20 masterfoods usa 2.13-oz. 64 65 66 68 three musketeers Original
Chart 6e: Number OF New CaNdy/sNaCk/CONFeCtiON prOduCts iNtrOduCed tO veNdiNg
2003: 109 2004: 159 2005: 206 2006: 181Source: Management Science Associates inc. proven data.
larger than if the segment’s market share remained the
same size.
Some candy manufacturers positioned large size candy
bars as an opportunity to improve candy sales in response to
higher prices being charged for traditional candy.
Some operators added large size candy in response to
rising manufacturer prices beginning in late 2005. The
strategy was to offer a better value in order to justify a
higher price point. However, not all operators responded to
the higher prices this way.
Many operators opted to limit their candy offerings to
the top selling items and allocate more facings to snacks.
While large size candy sales increased in each of the
last three years, the use of this type of item, designed to
fetch a $1.00 or more selling price, did not become stan-
dard. As noted, only one of the top 20 selling items listed in
chart 6C was a large size candy product.
Some operators found that as candy prices gradually
increased in each of the last two years, consumer accep-
tance for the larger size offering improved. Operators noted
that manufacturer prices did not increase for the “dollar”
candies.
Operators who reported success with large size candy
noted the importance of allocating a sufficient number
of facings to these items. Some noted that if there were
too few facings, such products looked out of place in a
machine.
Some operators noted that it is necessary to have more
than four facings to create a perception of legitimacy for
C o n t i n u e d ▶
56 Automatic Merchandiser AMonline.com 08.07
S t A t e o f t h e v e n d i n g i n d u S t r y r e p o r t

large size candy. Some said that it helped to group the
products together.
Many operators became discouraged when they first of-
fered large size candy bars due to poor customer response.
Hence, they were not willing to give them the “second
chance” that some operators found successful in 2006.
Some operators also felt that it made no sense to add
large size candy when they were trying to accommodate
customer requests for “healthier” offerings, a movement
that most operators agreed gained momentum in 2006.
NutritiON restriCtiONs aFFeCt sNaCksSchools and governments continued to enact nutrition
restrictions for school vending machines in 2006.
While schools only represented a small percentage
of vending locations, the publicity about the issue made
location managers in traditional vending accounts more
concerned about employee wellness.
Several major food and snack manufacturers in 2006
publicly stated their support for school nutrition guide-
lines adopted by the Alliance for a Healthier Generation, a
joint initiative of the William J. Clinton Foundation and the
American Heart Association.
Many U.S. businesses adopted employee wellness
programs which included an emphasis on healthier food
choices in the work place.
NAMA responded to this by adapting its “Balanced for
Life” materials from the school environment to the work place.
Operators did not report significant growth in “better for
you” items in general.
MSA data revealed a mixed record.
Sales of products identified as “nutritional” snacks were
flat in 2006, as indicated in chart 6B on page 54. “Nutri-
tional” snacks collectively lost 2.77 category share points
in 2006. The most noteworthy losses were in functional
bars and trail mixes. Granola bars and breakfast bars, in
contrast, posted gains, as did cereal snacks.
Nuts and seeds, which also have a healthy connotation
with many consumers, posted a slight gain in 2006, ac-
cording to MSA.
hOt beverages keep struggliNgCoffee, once a thriving vending category, continued to
struggle in 2006, as the segment’s sales trended below
that of the vending industry as a whole. The hot beverage
segment has yet to find a way to participate in the consum-
er’s rediscovery of coffee as a refreshment of choice.
Chart 7a: hOt beverage maChiNes, 4-year review 2003 2004 2005 2006
350,000 345,000 344,000 343,000
Chart 7b: hOt beverage sales, 4-year review % OF tOtal type 2003 2004 2005 2006
Fresh-brew regular 47.2% 49.4% 45.11% 47.08%Fresh-brew decaf 7.4 4.8 9.68 4.99Fresh-brew specialty/flavored 17.6 12.1 8.37 10.17Freeze-dried regular 4.0 11.7 7.42 4.99Freeze-dried decaf 1.1 1.0 Na NaFreeze-dried specialty 7.4 3.5 5.16 8.75tea 1.7 1.6 1.47 2.37hot chocolate 9.1 10.8 13.26 13.24soup 1.1 1.4 0.79 2.51Other 3.4 3.7 8.74 5.88
prOJeCted tOtals
Fresh-brew regular $505m $513.7m 473.6m $488.2mFresh-brew decaf 79.18 49.92 101.6 51.76Fresh-brew specialty/flavored 188.32 125.84 87.88 105.46Freeze-dried regular 42.8 121.68 77.7 51.74Freeze-dried decaf 11.77 10.4 Na NaFreeze-dried specialty 79.18 36.4 54.12 90.74tea 18.19 16.64 15.43 24.57hot chocolate 97.37 112.32 139.23 137.29soup 11.77 14.56 8.29 26.02Other 36.38 38.48 91.77 60.97
Chart 7C: average hOt beverage priCes, 4-year reviewtype 2003 2004 2005 2006
Fresh-brew regular 46¢ 48¢ 50¢ 53¢Fresh-brew decaf 46 49 60 48Fresh-brew specialty/flavored 56 65 61 59Freeze-dried regular 42 40 48 48Freeze-dried decaf 43 41 Na NaFreeze-dried specialty 50 41 55 56tea 44 54 44 48hot chocolate 48 51 50 51soup 45 45 46 60
C o n t i n u e d ▶
58 Automatic Merchandiser AMonline.com 08.07
S t A t e o f t h e v e n d i n g i n d u S t r y r e p o r t

Vending operators have not, as a whole, invested in the
latest state-of-the-art equipment that allows more variety,
better quality products and more modern aesthetics.
This is mainly due to the high cost of the equipment
and the decline in work site populations necessary to justify
such an investment. The report indicated vending operators
did not raise prices in the hot beverage segment as much
as they did in some other product categories.
Coffee retailers, by contrast, raised prices in 2006. As
noted in the Automatic Merchandiser’s State of the Coffee
Service Industry Report in July, the OCS industry took
advantage of this opportunity.
OCs grOws agaiNOCS was among the vending industry’s brighter spots
for the second consecutive year in 2006. Vending operators
active in OCS, like dedicated OCS operators, upgraded their
product and equipment offerings to meet a more demand-
ing coffee consumer. They were thereby able to increase
their OCS sales.
The NAMA Operating Ratio Report, like the State of the
Vending Industry Report, also found a gain in OCS revenue
as a percent of vending sales for the third straight year
in 2006. The NAMA survey participants increased OCS
and cooperative vending service sales from 12.5 percent
to 13.5 percent to 17.4 percent, respectively, from 2004
through 2006.
Vending operators active in OCS found that market
offered more growth opportunities than vending, both in
terms of adding sales to existing accounts and in finding
new accounts.
Because coffee retailers nationwide raised prices in
2006, operators encountered less resistance to price in-
creases for office coffee than they did for candy and soda.
In addition, operators were able to increase sales by
offering countertop, single-cup brewers. These systems
proved popular among locations interested in offering cof-
fee house quality coffee in the work place.
COFFee serviCe helps lOCatiONs keep emplOyees ON siteVending operators active in OCS, like dedicated OCS
operators, offered location managers a way to prevent em-
ployees from leaving the office to get coffee at a restaurant
or coffee house.
The OCS market also offered more opportunity for
finding new customers since there are lower population re-
quirements for OCS than for vending. While work sites with
population counts in excess of 100 have become harder to
find, sites with as few as 50 people are considerably more
plentiful. Most vending operators with a dedicated OCS
organization can profitably serve an OCS account with 50
employees.
veNd FOOd strugglesFood sales were unable to sustain the improvement
posted in 2005 and returned to the downward trend that
began in 2000. Last year, the report claimed a 2.9-point
sales gain, ending an erosion in vend food sales caused by
Chart 8a: FOOd maChiNes, 4-year reviewtype 2003 2004 2005 2006
refrigerated 144,700 141,500 140,000 138,500Frozen* 46,280 48,500 51,000 54,300heated 1,500 1,500 1,500 1,500ambient 800 800 800 800Food systems (pizza, french fries) 2,300 2,500 2,900 3,100tOtal 195,580 194,800 196,200 198,200Frozen food machines as a percent of total 23.6% 24.8% 25.9% 27.4%* Most were used for ice cream.
Chart 8b: FOOd maChiNe sales, 4-year review % OF sales type 2003 2004 2005 2006
Freshly-prepared 50.7% 26.7% 30% 28%Frozen-prepared 44.5 57.1 57 57shelf stable 4.4 16 13 15Other 0.4 0.2 0 0
prOJeCted tOtals
Freshly-prepared $68.4m $35.2m $40.7m $37.85mFrozen 60.1 75.3 77.3 77.06shelf stable 5.9 21.1 17.6 20.28Other 0.04 0.02 0 0
Chart 8C: average veNd FOOd priCes, 4-year reviewtype 2003 2004 2005 2006
Freshly-prepared $1.78 $1.80 $1.90 $1.93Frozen-prepared 1.71 1.72 1.85 1.86shelf stable 1.36 1.36 1.67 1.71
C o n t i n u e d ▶
60 Automatic Merchandiser AMonline.com 08.07
S t A t e o f t h e v e n d i n g i n d u S t r y r e p o r t

account downsizing. The 1-year upward change reversed in
2006.
The decline in vend food sales can be viewed either
negatively or positively.
Many operators welcomed less food since the category
is generally unprofitable.
However, lower food sales also reflected fewer machines
in the field and less activity in locations that have food
machines. Lower food sales indicated activity in all product
segments was less than it would have been if food sales
were higher.
The decline in food sales can be directly traced to a
continuing slide in the number of refrigerated food ma-
chines, which dominated food vending.
The decline in refrigerated food machines was more
than matched by an increase in frozen food machines and
integrated food systems. However, frozen food machines
and integrated food systems, which are newer, remained a
much smaller segment of the food business.
OperatOrs raise FOOd priCesThe food business was one of the few segments where
operators were able to raise selling prices in 2006. Opera-
tors usually find it easier to raise food prices than snack or
beverage prices since the offerings do not lend themselves
to easy comparisons to products in other retail channels.
Operators also have more flexibility in what products they
offer since the category isn’t ruled by specific “core” items
like the snack and soda segments.
Operators found it important to raise food prices in
2006 to attempt to compensate for the profit squeeze they
suffered.
The food segment itself did not experience the cost in-
flation that operators suffered in other categories in 2006.
According to the National Restaurant Association,
wholesale food costs rose 0.6 percent in 2006. This
brought relief following higher increases in each of the prior
three years. Wholesale food prices increased 1.8 points in
2005, 5.6 points in 2005 and 5.5 points in 2003.
C o n t i n u e d ▶
Chart 8d: tOp 20 FrOzeN FOOd prOduCts iN 2006, dOllar sales
# prOduCt
1 white Castle distributing white Castle twin Cheeseburger
2 pierre Foods buffalo style wings
3 pierre Foods big az beef Charbroil with Cheese
4 Nestle hot pocket pepperoni pizza
5 Jimmy dean Foods rudy’s Farm sausage twin biscuit
6 schwan Foods tony’s pepperoni pizza
7 pierre Foods bacon Cheeseburger
8 don miguel mini beef tacos
9 pierre Foods barbecue wings
10 Chef america hot pockets ham & Cheese
11 pierre Foods a-1 Chopped beefsteak sandwich
12 best express Foods Oscar mayer lunchables turkey & Cheddar
13 Jimmy dean Foods sausage twin biscuit
14 Chef america hot pockets meatball mozzarella
15 schwan’s Foods tony’s supreme pizza
16 pierre Foods big az bubba twin Chili dogs with Cheese
17 pierre Foods southern Fried Chicken breast
18 pierre Foods Fast Choice double beef stacker with Cheese
19 pierre Foods Jumbo Cheeseburger
20 ruiz Foods el monterrey beef & bean
Chart 8e: tOp 20 reFrigerated FOOd prOduCts iN 2006, dOllar sales
# prOduCt
1 kraft Foods Oscar mayer turkey/Cheddar lunchables
2 kraft Foods Oscar mayer ham/Cheddar lunchables
3 kraft Foods Oscar mayer ham/swiss lunchables
4 kraft Foods handisnacks butterscotch pudding
5 kraft Foods Original easy mac Cups
6 Nestle Nesquik Chocolate milk shake
7 dannon yogurt blended variety pack
8 Nestle Nesquik strawberry milk shake
9 Nestle Nesquik 14-oz. 1% Chocolate pet
10 Nestle Nesquik 14-oz. 1% double Chocolate pet
11 kraft Foods easy mac Cups triple Cheese
12 kraft Foods handisnacks banana split pudding
13 Nestle Nesquik 16-oz. double Chocolate pet
14 Nestle Nesquik 14-oz. 1% strawberry pet
15 breyer’s Fruit On bottom strawberry yogurt
16 general mills yoplait strawberry yogurt
17 Nestle Nesquik 16-oz. very vanilla pet
18 general mills yoplait strawberry/banana yogurt
19 kraft Foods breyer’s Fruit On bottom strawberry/banana yogurt
20 Nestle Nesquik 1% 14-oz. vanilla pet
Source: vendchannel, 800-999-4271
62 Automatic Merchandiser AMonline.com 08.07
S t A t e o f t h e v e n d i n g i n d u S t r y r e p o r t

Fiscal 2006 marked the third straight year that frozen
food as a percent of sales did not increase. This occurred
despite the fact that more frozen food machines were
added in 2006.
The gain in frozen food machines didn’t benefit frozen
food sales as much as it might have because these ma-
chines were also used to vend ice cream.
Frozen food machines offered some operators a way to
continue to provide food economically in locations that suf-
fered population losses. Frozen food machines do not need
to be serviced as frequently as refrigerated food machines
since frozen product does not spoil.
For accounts too small to support a full-size refrigerated
machine that insisted on fresh food, operators also had the
option of using dual temperature machines that have both
ambient and refrigerated areas. These machines, however,
do not offer the advantage of reduced service frequency
due to the requirements of refrigerated food.
Operators serving accounts large enough to support re-
frigerated machines usually found locations preferred having
both fresh and frozen-prepared food in the machine rather
than only frozen-prepared food. Many customers preferred
freshly-prepared food because they think it tastes better.
Many also find it more convenient since it heats faster.
Integrated food systems also increased in 2006. These
systems that keep food in a frozen state and heat it at the
point of sale are expensive and service intensive, but they
meet the needs of consumers eating on the run in high traffic
locations.
maNual FOOdserviCe maiNtaiNs its shareManual foodservice maintained its share of business in
2006 but, as in 2005, this segment did not grow as much
as it had in prior years. The NAMA Operating Ratio Report
found that manual foodservice actually declined as a per-
cent of vending sales in each of the last two years.
The stabilization of manual foodservice within the vend-
ing industry largely reflected the condition of the extra large
operations that dominated this segment.
Extra large operations have not been able to expand
sales by adding customers since the availability of large
work sites has decreased. Nor were they able to grow by
adding additional services because they already added as
many new services as deemed possible.
As with smaller size operators, extra large operators had
to rely on raising prices to grow in 2006.
The manual foodservice segment did allow more op-
tions for raising prices than vending since main entrees are
prepared from scratch.
Manual foodservice operations can respond to new
consumer trends with new products faster than vending
operators. Many offered more ethnic items such as Mexican
and Asian entrees, along with deli style, vegetarian and
gourmet offerings.
milk hOlds its OwNMilk remained a healthy segment in 2006, capital-
izing on a recovering market. Milk continued to benefit
from rising consumer perception as a healthy product. The
dairy industry continued its aggressive marketing of milk in
2006. The national media campaign in 2006 emphasized
milk’s benefit as an alternative to soda.
Chart 9a: maNaged COmmerCial FOOdserviCe sales, 2-year review
2005
2006
$31,942,275
$34,000,429
Chart 9b: average aNNual sales iNCrease FOr maNaged COmmerCial FOOdserviCe FrOm 2004 tO 2007
Business and industry
Offices
Hospitals andnursing homes
Colleges and universities
Primary andsecondary schools
Airlines
Sports and recreationcenters 4.3%
-1.9%
10%
8.2%
6.5%
4.5%
4.2%
Chart 9C: maNaged COmmerCial FOOdserviCe by aCCOuNt type iN 2006
● business and industry● Offices● hospitals and nursing homes● Colleges and universities● primary and secondary schools● airlines● sports and recreation centers
Source: national restaurant Association
20.3%
6.86%11.27%
29.51%
13.53%
5.65% 12.84%
C o n t i n u e d ▶
64 Automatic Merchandiser AMonline.com 08.07
S t A t e o f t h e v e n d i n g i n d u S t r y r e p o r t
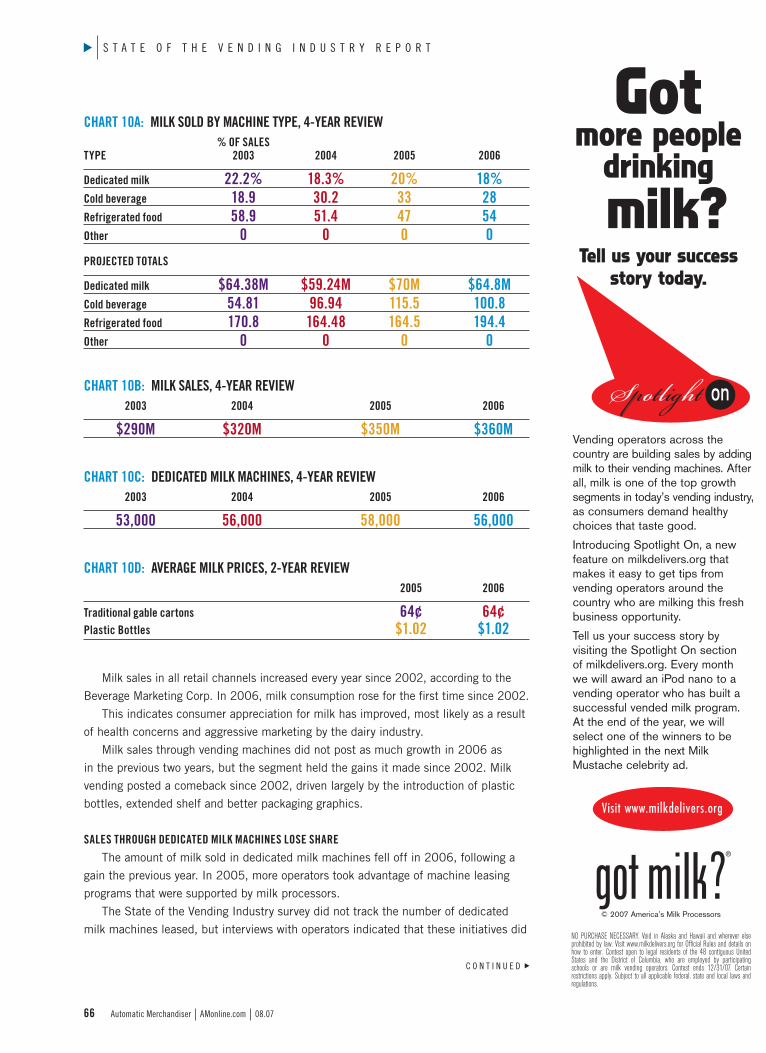
Milk sales in all retail channels increased every year since 2002, according to the
Beverage Marketing Corp. In 2006, milk consumption rose for the first time since 2002.
This indicates consumer appreciation for milk has improved, most likely as a result
of health concerns and aggressive marketing by the dairy industry.
Milk sales through vending machines did not post as much growth in 2006 as
in the previous two years, but the segment held the gains it made since 2002. Milk
vending posted a comeback since 2002, driven largely by the introduction of plastic
bottles, extended shelf and better packaging graphics.
sales thrOugh dediCated milk maChiNes lOse shareThe amount of milk sold in dedicated milk machines fell off in 2006, following a
gain the previous year. In 2005, more operators took advantage of machine leasing
programs that were supported by milk processors.
The State of the Vending Industry survey did not track the number of dedicated
milk machines leased, but interviews with operators indicated that these initiatives did
Chart 10a: milk sOld by maChiNe type, 4-year review % OF sales type 2003 2004 2005 2006
dedicated milk 22.2% 18.3% 20% 18%Cold beverage 18.9 30.2 33 28refrigerated food 58.9 51.4 47 54Other 0 0 0 0
prOJeCted tOtals
dedicated milk $64.38m $59.24m $70m $64.8mCold beverage 54.81 96.94 115.5 100.8refrigerated food 170.8 164.48 164.5 194.4Other 0 0 0 0
Chart 10b: milk sales, 4-year review 2003 2004 2005 2006
$290m $320m $350m $360m
Chart 10C: dediCated milk maChiNes, 4-year review 2003 2004 2005 2006
53,000 56,000 58,000 56,000
Chart 10d: average milk priCes, 2-year review 2005 2006
traditional gable cartons 64¢ 64¢ plastic bottles $1.02 $1.02
Gotmore people
drinking
milk?
Vending operators across the country are building sales by addingmilk to their vending machines. Afterall, milk is one of the top growthsegments in today’s vending industry,as consumers demand healthychoices that taste good.
Introducing Spotlight On, a newfeature on milkdelivers.org thatmakes it easy to get tips from vending operators around thecountry who are milking this freshbusiness opportunity.
Tell us your success story by visiting the Spotlight On section of milkdelivers.org. Every month we will award an iPod nano to a vending operator who has built asuccessful vended milk program. At the end of the year, we willselect one of the winners to behighlighted in the next MilkMustache celebrity ad.
© 2007 America’s Milk Processors
Visit www.milkdelivers.org
NO PURCHASE NECESSARY. Void in Alaska and Hawaii and wherever else prohibited by law. Visit www.milkdelivers.org for Official Rules and details onhow to enter. Contest open to legal residents of the 48 contiguous UnitedStates and the District of Columbia, who are employed by participatingschools or are milk vending operators. Contest ends 12/31/07. Certainrestrictions apply. Subject to all applicable federal, state and local laws andregulations.
Tell us your successstory today.
C o n t i n u e d ▶
66 Automatic Merchandiser AMonline.com 08.07
S t A t e o f t h e v e n d i n g i n d u S t r y r e p o r t
SWO
PD
igita
l Pro
ofin
g Ba
r
SWO
PD
igita
l Pro
ofin
g Ba
r
Celebrity Almakias (Vending Ad) Automatic Merchandiser
Page 4C Trim: 7-7/8” x 10-3/4” Live: 7-3/8” x 10-1/4” Vicki RothProduction Services RepresentativeAM Vending Media Group/Feed & Grain1233 Janesville Ave, Fort Atkinson WI 53538PHONE: (920) 563-1654FAX: (866) 465-4203
Beth Guthriedirect dial 410.464.5407fax 410.464.5410cell phone 443.326.4832
Outloud,llcMt. Washington Mill1405 Forge AvenueSuite 200Baltimore, MD 21209
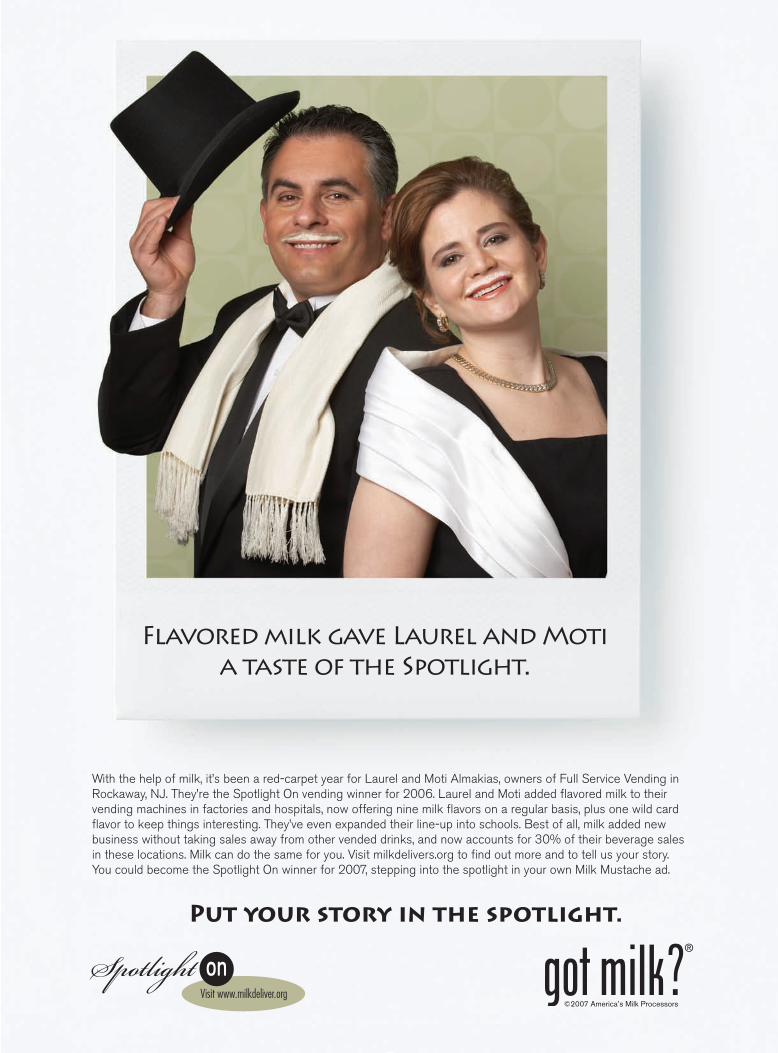
With the help of milk, it’s been a red-carpet year for Laurel and Moti Almakias, owners of Full Service Vending in Rockaway, NJ. They’re the Spotlight On vending winner for 2006. Laurel and Moti added flavored milk to their vending machines in factories and hospitals, now offering nine milk flavors on a regular basis, plus one wild card flavor to keep things interesting. They’ve even expanded their line-up into schools. Best of all, milk added new business without taking sales away from other vended drinks, and now accounts for 30% of their beverage sales in these locations. Milk can do the same for you. Visit milkdelivers.org to find out more and to tell us your story. You could become the Spotlight On winner for 2007, stepping into the spotlight in your own Milk Mustache ad.
Put your story in the spotlight.
Visit www.milkdeliver.org
Flavored milk gave Laurel and Moti a taste of the Spotlight.
Almakias_AutoMerch.indd 1 7/3/07 11:36:58 AM

not grow in 2006. Operators also reported that it was dif-
ficult to sustain dedicated milk machines without ongoing
supplier support.
Refrigerated food machines continued to account for the
majority of vend milk sales in 2006. Milk sold in refrigerated
food machines declined at the expense of cold beverage ma-
chines beginning in 2002, but this trend reversed in 2006.
The survey did not track the different types of milk sold
in vending; i.e., extended shelf life (ESL) versus regular
milk, regular versus flavored, or different size packages.
More ESL products were introduced in 2006, offering
the advantages of longer shelf life and not requiring tem-
perature controlled transport or warehousing. ESL offerings
also featured national name brands and more professional
graphics.
OperatOrs preFer Fresh milkMost vending operators indicated they continued to
source milk from local dairies and opted for fresh milk as
opposed to ESL products. This was true despite the fact
that a survey sponsored by the Milk Processor Education
Program (MilkPEP) and conducted by the Beverage Market-
ing Corp. in 2006 found vending operators were more open
to using ESL milk than in the past. The survey found opera-
tor concerns about ESL decreased in 2005.
In addition, both the Coca-Cola Co. and Pepsi-Cola Co.
bottling organizations introduced initiatives for branded,
14-ounce, shelf stable milk in 2006.
Many operators claimed that ESL milk, despite its ad-
vantages, was less profitable than fresh milk. ESL products
cost more than fresh milk but could not necessarily fetch a
higher selling price.
Many operators also noted that regular milk continued to
be more popular than flavored varieties, which comprised the
majority of ESL offerings.
Some operators further noted that flavored milk sales
did not sustain over time. This was true in both school and
non-school locations.
In school locations, operators noted that not all flavored
milk offerings met nutrition requirements.
Most operators also noted that the big bottling organiza-
tions did not win business because of the branded milk pro-
grams mentioned above. Operators said they did not notice
these milk offerings in bottler operated machines.
iCe Cream keeps grOwiNgIce cream, while not a large segment, grew at the same
rate of the industry overall in 2006. Ice cream continued to
benefit from the steady increase in frozen vending machine
placements that began in the mid 1990s.
It is estimated that as many as half of all frozen food ma-
chine facings went to ice cream in 2006. In many instances,
operators placed frozen food machines in response to re-
quests for food, but found it more profitable to use ice cream.
Chart 11b: iCe Cream sales by maChiNe type, 4-year review
% OF sales type 2003 2004 2005 2006
Combination food/ ice cream 48.6% 50.8% 48% 47%Old style, 3- and 4-select 11.4 10.3 11 10dedicated, new style multiproduct 29.7 34.8 37 40dual temperature machine 9.9 4.1 4 3Other 0.4 0 0 0
prOJeCted tOtals
Combination food/ ice cream $111.8m $116.8m $157.4m $158.8mOld style, 3- and 4-select 26.22 23.69 36.08 33.8dedicated, new-style multiproduct 68.31 80.84 121.36 135.2dual temperature machine 22.77 9.43 12.12 10.14Other 92.0 0 0 0
Chart 11C: dediCated iCe Cream maChiNes, 4-year review
2003 2004 2005 2006
54,835* 55,935** 57,935*** $60,935****
* of 46,280 frozen food machines in 2003, 35,054 are included in this number. ** of 48,500 frozen food machines in 2004, 37,100 are included in this number. *** of 51,000 frozen food machines in 2005, 39,000 are included in this number. **** of 54,300 frozen food machines in 2006, 42,000 are included in this number.
Chart 11d: iCe Cream priCes, 4-year reviewtype 2003 2004 2005 2006
ice cream 97¢ $1.09 $1.14 $1.15Frozen confections $1.31 $1.12 $1.27 $1.27
Chart 11a: iCe Cream sales, 4-year review 2003 2004 2005 2006
$230m $230m $328m $338m
68 Automatic Merchandiser AMonline.com 08.07
S t A t e o f t h e v e n d i n g i n d u S t r y r e p o r t
The ice cream category also benefited from improved
product distribution. Ice cream manufacturers were able to
take advantage of a network of vend product distribution
centers that became established nationally in 2005.
Consumer trends also supported ice cream sales. Ap-
preciation for ice cream has improved in recent years due
to the popularity of higher priced, gourmet type items and
fat-free and low-fat ice cream.
Overall consumption of ice cream increased in the mid
single digits, according to ice cream manufacturers.
The development of frozen machines that offer multiple
products and price points in recent years created a new
group of dedicated ice cream vending specialists. Many of
these specialists served as ice cream subcontractors for
full-line vending operators.
Due to the cost of investment in ice cream inventory
and the liabilities involved in potential melt downs, many
full-line operators found it easier to subcontract the ice
cream business to dedicated ice cream specialists.
Integrated, point-of-sale, ice cream preparation and delivery
systems were also introduced to vending in 2006. This technol-
ogy, which has been used in traditional retail establishments,
enables instantaneous aeration, flavoring and freezing of ice
cream mixes that can be served in less than a minute.
2007: OutlOOk ChalleNgiNgWith 2007 at the mid point, vending operators continue
to face a challenging environment, with cost pressures ris-
ing even more than in 2006.
Early in 2007, cold beverage suppliers socked vend-
ing operators with what many called unprecedented price
increases of as much as 25 percent. Coca-Cola Enterprises,
the nation’s largest bottler, said increases were necessary
due to higher costs for raw goods and aluminum.
Many vending operators felt it was impossible to pass on
the soda price increases needed to sustain a reasonable profit.
Other product manufacturers also raised prices as the
year progressed.
C o n t i n u e d ▶
NAMA operating ratio report notes improvement in 2006
the National automatic merchandising association (Nama) 2007 Operating ratio report found that its vending operator members made some financial improvement in 2006. the Nama report is based on results from a select group of operators. this year’s report included 109 firms.
the Nama report found that aggregate sales rose 4.3 percentage points in 2006, surpassing the 3 points that Automatic Merchandiser reported.
the Nama report, which measures numerous financial ratios, found that operators posted a 1.7 point pre-tax profit in 2006. this marked the second straight year of profit recovery, and surpassed the 1.5-point profit reported in the previous year
while the Nama reports indicated financial progress, operator performance remained poor in comparison to other periods. pre-tax profit was in the high single digits in 1998 and 1999.
the Nama report also found that return on assets increased in 2006 to 5.6 points. return on assets in both 2005 and 2006 was only slightly above the 5-point figure that most financial analysts view as the minimum acceptable level of profitability.
08.07 AMonline.com Automatic Merchandiser 69
S t A t e o f t h e v e n d i n g i n d u S t r y r e p o r t
Simple & Straightforward.
“We’ve learned when you find something that works, stick with it.That’s why our vending business has financed with Firestone for 20 years.
We trust Firestone Financial for true Annual Percentage Rates, nosurprises, and prompt turnaround.
Firestone knows the industry, our business and us. They’llfinance all types and brands of equipment. And repayment plansare tailored to our seasonal business. They treat us as a businesspartner. We all succeed and grow together.”
“When It Comes To EquipmentFinancing,We Trust Firestone.”
- Jeff & Steve MargetOwners, M.G. Vending Inc. of Lowell, MA
Firestone Customers since 1986
Tel. 800.851.1001 | Fax 617.332.8032 | www.firestonefinancial.com27 Christina Street, P.O. Box 610325, Newton, MA 02461-0325

In addition to higher product costs,
gasoline prices shot up in 2007. Aver-
age price for a gallon of gasoline rose
from $2.30 in January to $3.20 in
June, according to the Energy Informa-
tion Administration. This further hurt
vending operators’ bottom lines.
iNFlatiON hurts dispOsable iNCOmeHigher gasoline prices affected
vending operators in another way
as well; the higher prices cut into
consumers’ disposable income. Many
operators claimed they noticed a direct
correlation between higher gasoline
prices and lower vending sales.
Some operators noticed the op-
posite effect; higher gasoline prices
encouraged customers to take more
meals at work rather than driving off to
a restaurant.
The higher energy costs are also
expected to add more costs to food
prices, which will result in even more
product price inflation.
Rising employee benefit costs,
particularly health care and workers
compensation, also continue to plague
vending operators.
Still another challenging factor is
continued job growth. The nation’s un-
employment remained at 4.5 percent
through the first half of the year, a
near record low.
While higher employment helps
retail industries because consumers
have money to spend, it also drives up
wages, hurting operators’ bottom lines.
The Conference Board reported that
the annual 4 percent increase in wages
carried over from 2006 into 2007.
COmpetitiON FrOm Other ChaNNelsVending operators will continue
to face stiff competition from other
foodservice channels. The National
Restaurant Association reported that
fast food restaurant sales, which
outpaced overall foodservice sales in
2006, is expected to leap by 6 points
in 2007.
Fast food restaurants have been
quick to introduce consumer conve-
niences such as contactless credit
card acceptance.
Health and nutrition continue to be
an issue as more consumers ask for
healthier products.
The many challenges affecting
vending operators offered no indica-
tion of subsiding in 2007. To improve
their profitability, vending operators
need to evaluate their assumptions
about how much they need to invest in
equipment, technology, personnel and
training.
In order for vending operators to
succeed in the new market, they need
to utilize state-of-the art equipment
and technology, which requires a
greater upfront investment than was
needed in the past.
Automatic Merchandiser ‘Wake Up Vending’ Action Plan:
• raise prices.
• Cut commissions
• partner with your customers, but for real
• invest in your employees
• get up to speed on health and nutrition
• get back in the coffee business
• become an industry leader
70 Automatic Merchandiser AMonline.com 08.07

Economic conditions vary by region
as always, there were regional variances in economic conditions in 2006, as noted by the National restaurant association.
the mountain region (montana, idaho, wyoming, Nevada, utah, Colorado, arizona and New mexico), while one of the smallest in population, was one of the fastest growing economies, led by las vegas, one of the nation’s fastest growing cities.
the pacific region (California, Oregon, washington, alaska and hawaii) also continued to post strong economic growth, regaining much of the productivity lost during the “dotcom” implosion in 2000 and 2001.
the south atlantic region (delaware, maryland, washington, d.C., west virginia, virginia, North Carolina, south Carolina, georgia and Florida) was one of the stronger regional economies.
the west south Central region (texas, Oklahoma, arkansas and louisiana) also posted strong growth, recovering from hurricane katrina in 2005.
the west North Central region (North dakota, south dakota, minnesota, Nebraska, iowa, kansas and missouri) experienced flat growth.
the east south Central region (kentucky, tennessee, mississippi and alabama) posted moderate growth.
New england (vermont, New hampshire, maine, massachusetts, rhode island and Connecticut), middle atlantic (New york, New Jersey and pennsylvania) and east North Central (wisconsin, michigan, illinois, indiana and Ohio) were slow growth regions in terms of jobs and population.
08.07 AMonline.com Automatic Merchandiser 71
S t A t e o f t h e v e n d i n g i n d u S t r y r e p o r t
Phone: (800)348-6543 • Fax: (864)228-6102 • [email protected]
New Truck BodiesNew & Used Chassis
Coolers
SAFE
1 - 2 - 3Doors
Each Side
SnackShelving
MAIL AD COPY TO: Automatic Merchandiser, Attn: Denise Singsime, P.O. Box 803, Fort Atkinson, WI 53538-0803.Inquiries to Denise Singsime: Toll Free: (800)547-7377 ext. 1680 • Direct Line: (920)563-1680 • Fax: (920)568-2244 • E-mail: [email protected]
Marketplace
71
Related Documents