State Highway Congestion Monitoring Program (HICOMP) Annual Data Compilation September 2007

Welcome message from author
This document is posted to help you gain knowledge. Please leave a comment to let me know what you think about it! Share it to your friends and learn new things together.
Transcript

State Highway Congestion Monitoring Program (HICOMP)
Annual Data Compilation
September 2007
Table of Contents Table of Contents i List of Exhibits ii Foreword iii Acronyms iv 1. Introduction 1-1 1.1 Definition of Recurrent Congestion 1-1 1.2 Data Collection Methodologies 1-2 2. Statewide Summary 2-1 3. District Level Findings and Analysis 3-1 3.1 District 3: Sacramento Area 3-1 3.2 District 4: San Francisco Bay Area 3-6 3.3 District 5: Central Coast Area 3-11 3.4 District 6: Fresno Area 3-16 3.5 District 7: Los Angeles-Ventura Area 3-21 3.6 District 8: San Bernardino-Riverside Area 3-26 3.7 District 10: Stockton Area 3-31 3.8 District 11: San Diego Area 3-36 3.9 District 12: Orange County 3-41 Appendix A: Department District and County Map A-1 Appendix B: Department Contacts B-1 Appendix C: Glossary of Terms C-1
i

List of Exhibits Exhibit 1-1: Data Collection Methodology by District Reporting HICOMP Results 1-3 Exhibit 2-1: Daily Vehicle-Hours of Delay by District 1995-2005 2-3 Exhibit 2-2: Urban Area Freeway Congested Directional Miles by District 1995-2005 2-4 Exhibit 2-3: Urban Area Freeway Total Directional Miles by District 1995-2005 2-5 Exhibit 2-4: Congested Directional Miles to Total Directional Miles by District 1995-2005 2-6 Exhibit 2-5: Daily Vehicle-Hours of Delay Trends by District 1987-2005 2-7 Exhibit 2-6: Congested Directional Mile Trends by District 1987-2005 2-8 Exhibit 2-7: Statewide Vehicle-Hours of Delay and Congested Directional Miles 1987-2005 2-9 Exhibit 2-8: Daily Delay and Congested Directional Miles County Rankings 2004-2005 2-10 Exhibit 2-9: 2005 Excess Fuel Consumption, Travel Cost, and Emissions due to Congestion 2-11 Exhibit 2-10: California State Highway Vehicle Miles Traveled (VMT) 1987-2005 2-12 Exhibit 3-1: District 3 Highway Congestion Summary 3-2 Exhibit 3-2: District 3 Congestion Trends 1987-2005 3-3 Exhibit 3-3: District 3 Sacramento Area 2005 Morning Congestion Map 3-4 Exhibit 3-4: District 3 Sacramento Area 2005 Evening Congestion Map 3-5 Exhibit 3-5: District 4 Highway Congestion Summary 3-7 Exhibit 3-6: District 4 Congestion Trends 1987-2005 3-8 Exhibit 3-7: District 4 San Francisco Bay Area 2005 Morning Congestion Map 3-9 Exhibit 3-8: District 4 San Francisco Bay Area 2005 Evening Congestion Map 3-10 Exhibit 3-9: District 5 Highway Congestion Summary 3-12 Exhibit 3-10: District 5 Congestion Trends 1987-2005 3-13 Exhibit 3-11: District 5 Central Coast Area 2005 Morning Congestion Map 3-14 Exhibit 3-12: District 5 Central Coast Area 2005 Evening Congestion Map 3-15 Exhibit 3-13: District 6 Highway Congestion Summary 3-17 Exhibit 3-14: District 6 Congestion Trends 1987-2005 3-18 Exhibit 3-15: District 6 Fresno Area 2005 Morning Congestion Map 3-19 Exhibit 3-16: District 6 Fresno Area 2005 Evening Congestion Map 3-20 Exhibit 3-17: District 7 Highway Congestion Summary 3-22 Exhibit 3-18: District 7 Congestion Trends 1987-2005 3-23 Exhibit 3-19: District 7 Los Angeles-Ventura Area 2005 Morning Congestion Map 3-24 Exhibit 3-20: District 7 Los Angeles-Ventura Area 2005 Evening Congestion Map 3-25 Exhibit 3-21: District 8 Highway Congestion Summary 3-27 Exhibit 3-22: District 8 Congestion Trends 1987-2005 3-28 Exhibit 3-23: District 8 San Bernardino-Riverside Area 2005 Morning Congestion Map3-29 Exhibit 3-24: District 8 San Bernardino-Riverside Area 2005 Evening Congestion Map3-30 Exhibit 3-25: District 10 Highway Congestion Summary 3-32 Exhibit 3-26: District 10 Congestion Trends 1987-2005 3-33 Exhibit 3-27: District 10 Stockton Area 2005 Morning Congestion Map 3-34 Exhibit 3-28: District 10 Stockton Area 2005 Evening Congestion Map 3-35 Exhibit 3-29: District 11 Highway Congestion Summary 3-37 Exhibit 3-30: District 11 Congestion Trends 1987-2005 3-38 Exhibit 3-31: District 11 San Diego Area 2005 Morning Congestion Map 3-39 Exhibit 3-32: District 11 San Diego Area 2005 Evening Congestion Map 3-40 Exhibit 3-33: District 12 Highway Congestion Summary 3-42 Exhibit 3-34: District 12 Congestion Trends 1987-2005 3-43 Exhibit 3-35: District 12 Orange County 2005 Morning Congestion Map 3-44 Exhibit 3-36: District 12 Orange County 2005 Evening Congestion Map 3-45
ii

Foreword The purpose of the State Highway Congestion Monitoring Program (HICOMP) annual data compilation is to measure congestion occurring on urban area freeways in California. The California Department of Transportation (Department) has been publishing the HICOMP data compilation since 1987.
The congestion information is currently required by statute. In September 2002, the Governor signed into law Assembly Bill 2535 (Diaz) which states:
“The Department shall, within existing resources, collect, analyze, and summarize highway congestion data and make it available upon request to California regional transportation planning agencies, congestion management agencies, and transit agencies.” (California Government Code Section 14032.6) The 2005 HICOMP data compilation presents congestion data on California urban freeway segments with a history of recurrent congestion. It does not include congestion on other State highways or local surface streets. Non-recurrent congestion such as holiday, maintenance or special-event generated traffic congestion is also not included. This document represents weekday traffic conditions and is useful for finding general trends and making regional comparisons of freeway performance.
Estimates presented herein rely on a limited number of observations. Probe vehicles are driven on congested segments of the urban freeways in the spring and fall in the morning and the evening peak commuter traffic to collect the average daily congestion figures. This is labor intensive and only a minimal number of actual runs are conducted. Actual conditions vary daily and seasonally.
iii

Acronyms Annual Vehicle Miles of Travel = AVMT California Department of Transportation = Department Congested Directional Miles = CDM Daily Vehicle Hours of Delay = DVHD Global Positioning System = GPS Highway Congestion Monitoring Program = HICOMP High Occupancy Vehicle = HOV Metropolitan Transportation Commission = MTC Traffic Accident Surveillance and Analysis System = TASAS Vehicle Miles of Travel = VMT
iv

1. Introduction Transportation facility construction and expansion have not kept pace with the growth in travel demand. This has resulted in an increase in urban freeway congestion over the past decade in most of California’s metropolitan areas. From the public’s perspective, the most noticeable effect of congestion on urban mobility is increased traffic delay. “Rush-hour” traffic in larger cities no longer occurs only during the traditional morning and evening peak periods, but extends into the normal day.
Congestion can be described as either recurrent or non-recurrent. Recurrent congestion is regular, everyday peak period delays that occur when the capacity of a freeway is exceeded by travel demands and low speeds result. Irregular events such as accidents, sporting events, maintenance, or short-term construction, can cause non-recurrent congestion. The purpose of HICOMP is to present recurrent congestion data, but assumes that non-recurrent congestion is roughly equal to recurrent congestion. In some cases, this document discusses non-recurrent congestion, but only to arrive at an approximation of the impacts of total congestion.
An objective of the Department is to increase the efficiency of existing roads and other transportation facilities to reduce delays. The data compiled in this document helps the Department to meet this objective by identifying the locations and extent of recurrent congestion on California’s urban freeways. The HICOMP database provides the information needed to evaluate freeway performance, so the Department can establish priorities and direct resources to areas with the most congestion. Data obtained from congestion monitoring may also be used to evaluate the effectiveness of technologies and strategies used to reduce congestion by comparing the changes in congestion before and after the implementation of new systems and programs.
1.1 Definition of Recurrent Congestion HICOMP defines recurrent congestion as: a condition lasting for 15 minutes or longer where travel demand exceeds freeway capacity and vehicular speeds are 35 miles per hour (mph) or less during peak commute periods on a typical incident-free weekday. This document uses three parameters to describe recurrent congestion:
1. Magnitude: The difference in time between the time it takes to travel a segment at the recorded congested speed and the travel time at 35 mph. Daily vehicle-hours of delay (DVHD) is the term used to express the magnitude of the delay.
2. Extent: The length of a freeway segment, by direction, that experiences speeds below 35 mph for 15 minutes or more. Extent is expressed in terms of congested directional miles (CDM). It is important to note that a one-mile stretch of roadway contains two directional miles (one mile for each direction of travel). Directional miles differ from lane-miles, which is the number of lanes in a given direction multiplied by the length of the segment in that direction.
1-1

3. Duration: The length of time expressed in hours that the directional segment remains congested.
The HICOMP reports the magnitude and extent of congestion. Maps included in this document show the location and duration of congestion for all the Department’s districts experiencing congestion on freeways. Districts 1, 2, and 9 are not included in the documents as traffic conditions in those districts lack the congestion magnitude of the other districts.
1.2 Data Collection Methodologies The Department uses two principal methods to collect congestion data on urban freeways. The most common method is to drive specially equipped cars at regular intervals along freeways during the hours of recurrent peak period congestion. This is called the floating vehicle method because the vehicles “float” with the traffic flow. It is also sometimes called the probe vehicle method because the vehicles are “probes” in the traffic flow.
A floating vehicle system consists of either a fixed transmission sensor mounted in the engine compartment or a global positioning system (GPS). The transmission sensor or tachometer, counts the number of wheel rotations in one second and sends that data to a laptop computer. Software on the computer then translates this data into meaningful time, distance, and travel speed information. A GPS system uses satellite technology to identify the location of the vehicle. Computer software identifies the freeway, direction of travel, and average speed of the vehicle.
The second method is to use automatic detection that collects data from fixed, regularly spaced electronic sensors embedded in or placed alongside urban area freeways. Currently, over 3,100 directional miles of California’s freeways are monitored using automatic detection.
The most common type of automatic detection uses inductive loops (commonly referred to as “loop detectors”). New technologies are also being employed including radar, infrared sensors, and vehicle transponder tags, such as those used for toll roads or bridges.
Exhibit 1-1 shows each district that reports congestion for the HICOMP, the counties monitored in that district, and the type of technology used to collect congestion data. Appendix “A” at the end of this compilation contains a map showing all the Department’s districts and the counties that make up those districts.
1-2
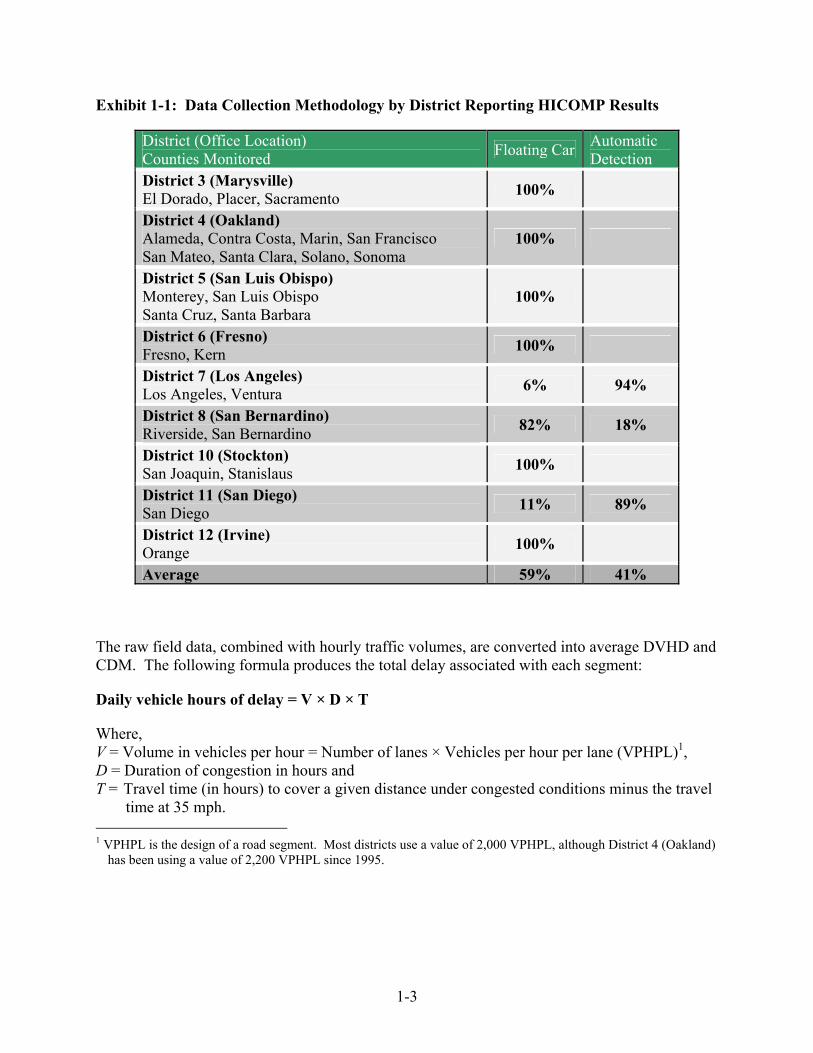
Exhibit 1-1: Data Collection Methodology by District Reporting HICOMP Results
District (Office Location) Counties Monitored Floating Car Automatic
Detection District 3 (Marysville) El Dorado, Placer, Sacramento 100%
District 4 (Oakland) Alameda, Contra Costa, Marin, San Francisco San Mateo, Santa Clara, Solano, Sonoma
100%
District 5 (San Luis Obispo) Monterey, San Luis Obispo Santa Cruz, Santa Barbara
100%
District 6 (Fresno) Fresno, Kern 100%
District 7 (Los Angeles) Los Angeles, Ventura 6% 94%
District 8 (San Bernardino) Riverside, San Bernardino 82% 18%
District 10 (Stockton) San Joaquin, Stanislaus 100%
District 11 (San Diego) San Diego 11% 89%
District 12 (Irvine) Orange 100%
Average 59% 41%
The raw field data, combined with hourly traffic volumes, are converted into average DVHD and CDM. The following formula produces the total delay associated with each segment:
Daily vehicle hours of delay = V × D × T
Where, V = Volume in vehicles per hour = Number of lanes × Vehicles per hour per lane (VPHPL)1, D = Duration of congestion in hours and T = Travel time (in hours) to cover a given distance under congested conditions minus the travel
time at 35 mph. 1 VPHPL is the design of a road segment. Most districts use a value of 2,000 VPHPL, although District 4 (Oakland)
has been using a value of 2,200 VPHPL since 1995.
1-3

2. Statewide Summary Since last year's HICOMP data compilation, California urban freeway recurrent congestion increased by three percent from 513,539 DVHD to 530,091 DVHD. The CDM of urban area freeways showed an increase of around six percent over the same period, growing from 1,916 in 2004 to 2,028 in 2005.
Exhibits 2-1 through 2-4 summarize these congestion results for each district:
Daily vehicle-hours of delay (Exhibit 2-1) Congested directional miles (Exhibit 2-2) Total directional miles (Exhibit 2-3) Congested directional miles to total directional miles (Exhibit 2-4)
As shown in Exhibit 2-1, delay statewide increased to 530,091 DVHD in 2005 compared to 513,539 in 2004. Districts 7 (Los Angeles) and 11 (San Diego) show declines in delay, no change was reported in District 5 (San Luis Obispo) because of a lack of data collection, and the remaining districts all show increases in congestion.
Two districts make up 57 percent of all DVHD in California. District 7 accounts for around 31 percent of all delay, while District 4 contributes another 26 percent. Districts 11 and 12 account for 30 percent of delay, and the remaining districts contribute about 13 percent.
Exhibit 2-2 shows the CDM for each district. The CDM statewide grew by six percent from last year to 2,028 miles in 2005. District 12 contributed the most to this increase by adding 64 CDM between 2004 and 2005 (34 percent increase), District 8 added 32 miles (33 percent increase), District 3 added 24 CDM (20 percent increase), and District 4 added 17 miles (4 percent increase). District 11 declined by 42 miles (13 percent decrease), and District 6 declined by 16 miles (42 percent decrease). District 7 makes up 33 percent of all congested miles statewide with District 4 adding 20 percent. The Southern California Districts 11 and 12 make up 27 percent of CDM with the remaining districts making up the remaining 20 percent.
Exhibit 2-3 shows total urban area freeway directional miles for each district. Between 1995 and 2005, statewide total directional miles grew by 294 miles (nearly seven percent). This increase is due to a number of factors; principally because new freeway miles were built and existing urban road miles were upgraded to "freeway" status. In 1995, the Department restructured district boundaries to match county lines. This change meant that some districts “lost” miles that were allocated to other districts. District 10 was most affected by this change.
Exhibit 2-4 illustrates the extent to which congestion is present on the State’s freeway network. These results are calculated by taking the CDM (Exhibit 2-2) and dividing by the total directional miles (Exhibit 2-3).
As shown in Exhibit 2-4, 44 percent of the State's total urban freeway miles in 2005 were congested during typical peak hours, which is three percent higher than in the year 2004. Two-thirds of District 12’s urban freeway miles were congested during peak hours. Around 62
2-1

percent of District 7’s urban freeway miles were congested, and 61 percent of District 11’s urban freeway miles were congested during peak hours. For each of the remaining districts, less than 45 percent of all urban freeway miles were congested during peak hours.
Exhibit 2-5 and Exhibit 2-6 display the delay and congested mile trends for each district. Exhibit 2-5 shows that District 7 leads the State in DVHD, but delay in District 4 grew rapidly between 1994 and 2000. Between 2000 and 2003, District 4’s delay declined dramatically, but has increased since that time. District 12 has been showing consistent delay increases since 2001.
Exhibit 2-6 shows District 7 accounting for the most CDM with District 4 showing steady growth between 1994 and 2000. Unlike its delay, District 4’s CDM has remained somewhat flat since the year 2000. District 11’s CDM grew dramatically during the late 1990s, but has shown relatively flat growth on average since the year 2000.
As illustrated in Exhibit 2-7, statewide DVHD generally grew steadily between 1987 and 2000. Since 2000, growth in both delay and CDM has remained relatively flat.
Exhibit 2-8 shows how counties compare in 2004 and 2005 in terms of delay. The top ten most congested counties remained largely unchanged since last year with Los Angeles, Orange, San Diego, and Alameda counties remaining the most congested. Riverside and Santa Clara Counties switched positions in 2005 and San Bernardino moved into the list replacing San Mateo County.
Exhibit 2-9 shows approximate costs that congestion imposes on Californians. It is assumed that non-recurrent congestion is equal to recurrent congestion. Therefore, total delay is twice the measured recurrent delay. In 2005, the estimated delay cost California drivers and passengers more than $18.9 million per day in lost time and excess fuel consumption. This estimated delay added 530 tons of emissions to the air, compared to what would have been emitted at un-congested speeds. These estimates are based on the most recent available data.
Exhibit 2-10 shows changes in annual vehicle miles traveled (VMT) from 1987 to 2005 on highways operated by the State. Despite fluctuations in congestion levels, the State’s VMT has increased steadily since the late 1980s.
2-2
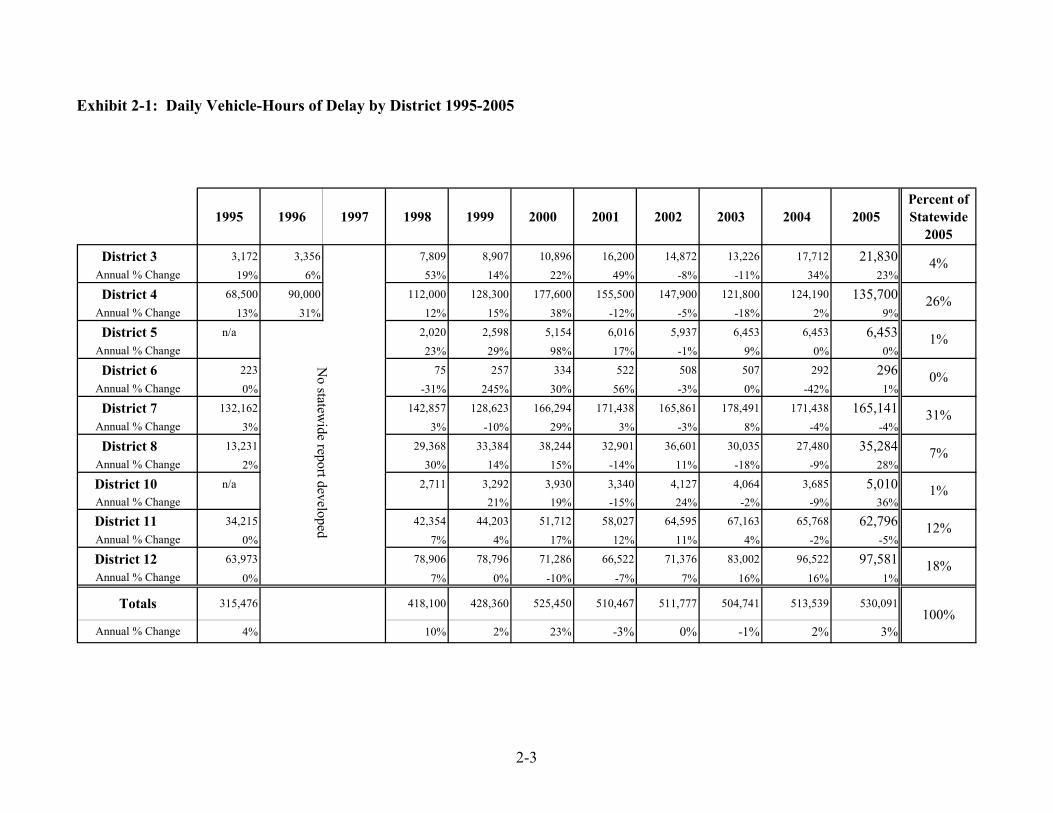
Exhibit 2-1: Daily Vehicle-Hours of Delay by District 1995-2005
1995 1996 1997 1998 1999 2000 2001 2002 2003 2004 2005Percent of Statewide
2005District 3 3,172 3,356 7,809 8,907 10,896 16,200 14,872 13,226 17,712 21,830
19% 6% 53% 14% 22% 49% -8% -11% 34% 23%
District 4 68,500 90,000 112,000 128,300 177,600 155,500 147,900 121,800 124,190 135,70013% 31% 12% 15% 38% -12% -5% -18% 2% 9%
District 5 n/a 2,020 2,598 5,154 6,016 5,937 6,453 6,453 6,45323% 29% 98% 17% -1% 9% 0% 0%
District 6 223 75 257 334 522 508 507 292 2960% -31% 245% 30% 56% -3% 0% -42% 1%
District 7 132,162 142,857 128,623 166,294 171,438 165,861 178,491 171,438 165,1413% 3% -10% 29% 3% -3% 8% -4% -4%
District 8 13,231 29,368 33,384 38,244 32,901 36,601 30,035 27,480 35,2842% 30% 14% 15% -14% 11% -18% -9% 28%
District 10 n/a 2,711 3,292 3,930 3,340 4,127 4,064 3,685 5,01021% 19% -15% 24% -2% -9% 36%
District 11 34,215 42,354 44,203 51,712 58,027 64,595 67,163 65,768 62,7960% 7% 4% 17% 12% 11% 4% -2% -5%
District 12 63,973 78,906 78,796 71,286 66,522 71,376 83,002 96,522 97,5810% 7% 0% -10% -7% 7% 16% 16% 1%
315,476 418,100 428,360 525,450 510,467 511,777 504,741 513,539 530,091
4% 10% 2% 23% -3% 0% -1% 2% 3%
1%
Annual % Change
Annual % Change
Annual % Change
Annual % Change
Annual % Change
7%
1%
Annual % Change
Annual % Change
4%
26%Annual % Change
No statew
ide report developed 12%
18%
0%
31%
Annual % Change
Annual % Change
Totals100%
2-3

Exhibit 2-2: Urban Area Freeway Congested Directional Miles by District 1995-2005
1995 1996 1997 1998 1999 2000 2001 2002 2003 2004 2005Percent of Statewide
2005District 3 55 60 98 83 95 121 112 124 121 145
2% 9% 28% -15% 14% 28% -8% 11% -2% 20%
District 4 268 284 327 338 390 379 369 339 394 41129% 6% 7% 3% 15% -3% -3% -8% 16% 4%
District 5 n/a 19 16 41 38 42 53 53 5333% -17% 159% -6% 9% 28% 0% 0%
District 6 13 2 13 9 20 16 23 38 2218% -49% 645% -27% 113% -17% 42% 65% -42%
District 7 556 566 566 617 664 620 648 648 6690% 1% 0% 9% 8% -7% 5% 0% 3%
District 8 97 90 99 168 106 121 97 98 130-24% -3% 10% 71% -37% 14% -20% 1% 33%
District 10 n/a 19 27 20 51 51 46 40 5239% -27% 159% 1% -9% -14% 31%
District 11 69 125 172 289 273 269 326 334 2925% 22% 38% 69% -6% -1% 21% 3% -13%
District 12 133 204 295 269 254 233 212 190 254-4% 15% 45% -9% -6% -8% -9% -10% 34%
1,191 1,449 1,608 1,898 1,905 1,832 1,867 1,916 2,028
2% 7% 11% 18% 0% -4% 2% 3% 6%
Totals100%
14%
6%
3%
Annual % Change
Annual % Change
Annual % Change
Annual % Change
No statew
ide report developed
Annual % Change
Annual % Change
Annual % Change
Annual % Change
Annual % Change
Annual % Change
13%
3%
7%
20%
1%
33%
2-4

Exhibit 2-3: Urban Area Freeway Total Directional Miles by District 1995-2005
1995 1996 1997 1998 1999 2000 2001 2002 2003 2004 2005Percent of Statewide
2005District 3 319 319 319 319 319 317 317 320 325 325 325
0% 0% 0% 0% 0% -1% 0% 1% 2% 0% 0%
District 4 1,064 1,064 1,064 1,075 1,075 1,074 1,074 1,074 1,104 1,104 1,1046% 0% 0% 1% 0% 0% 0% 0% 3% 0% 0%
District 5 226 226 226 226 226 226 226 226 229 229 22922% 0% 0% 0% 0% 0% 0% 0% 1% 0% 0%
District 6 239 239 239 241 255 260 268 268 269 269 26915% 0% 0% 1% 6% 2% 3% 0% 0% 0% 0%
District 7 1,059 1,059 1,059 1,061 1,061 1,065 1,065 1,075 1,085 1,085 1,0850% 0% 0% 0% 0% 0% 0% 1% 1% 0% 0%
District 8 523 526 526 542 542 542 555 572 572 572 5728% 0% 0% 3% 0% 0% 2% 3% 0% 0% 0%
District 10 170 170 178 178 178 178 182 182 185 185 185-37% 0% 5% 0% 0% 0% 2% 0% 2% 0% 0%
District 11 449 453 453 458 458 464 464 464 478 478 478-5% 1% 0% 1% 0% 1% 0% 0% 3% 0% 0%
District 12 291 315 340 357 376 376 376 376 386 386 3865% 8% 8% 5% 5% 0% 0% 0% 3% 0% 0%
4,340 4,370 4,403 4,457 4,489 4,503 4,527 4,557 4,634 4,634 4,634
2% 1% 1% 1% 1% 0% 1% 1% 2% 0% 0%Annual % Change100%
4%
Annual % Change
Annual % Change
Annual % Change
8%
10%
Annual % Change
Totals
Annual % Change
Annual % Change
Annual % Change
Annual % Change
Annual % Change
7%
24%
6%
12%
23%
5%
2-5

Exhibit 2-4: Congested Directional Miles to Total Directional Miles by District 1995-2005
1995 1996 1997 1998 1999 2000 2001 2002 2003 2004 2005
District 3 17% 19% 31% 26% 30% 38% 35% 38% 37% 44%
District 4 25% 27% 30% 31% 36% 35% 34% 31% 36% 37%
District 5 n/a 8% 7% 18% 17% 18% 23% 23% 23%
District 6 5% 1% 5% 4% 7% 6% 9% 14% 8%
District 7 53% 53% 53% 58% 62% 58% 60% 60% 62%
District 8 19% 17% 18% 31% 19% 21% 17% 17% 23%
District 10 n/a 11% 15% 11% 28% 28% 25% 22% 28%
District 11 15% 27% 38% 62% 59% 58% 68% 70% 61%
District 12 46% 57% 79% 71% 68% 62% 55% 49% 66%
27% 33% 36% 42% 42% 40% 40% 41% 44%
No statew
ide report developed
Totals
2-6

Exhibit 2-5: Daily Vehicle-Hours of Delay Trends by District 1987-2005
0
25,000
50,000
75,000
100,000
125,000
150,000
175,000
200,000
1987
1988
1989
1990
1991
1992
1993
1994
1995
1996*
1997*
1998
1999
2000
2001
2002
2003
2004
2005
Year
Daily D
elay (Veh-H
rs)
0
25,000
50,000
75,000
100,000
125,000
150,000
175,000
200,000
Daily D
elay (Veh-H
rs)
District 3 - MarysvilleDistrict 4 - OaklandDistrict 5 - San Luis ObispoDistrict 6 - FresnoDistrict 7 - Los AngelesDistrict 8 - San BernardinoDistrict 10 - StocktonDistrict 11 - San DiegoDistrict 12 - Irvine
D-10
D-7
D-12
D-11
D-8
D-3
D-5
D-6
D-4
* No statewide HICOMP reporting was done in 1996 and 1997. Districts 3 and 4 produced district reports in 1996.
2-7

Exhibit 2-6: Congested Directional Mile Trends by District 1987-2005
0
100
200
300
400
500
600
700
800
900
1,000
1987
1988
1989
1990
1991
1992
1993
1994
1995
1996*
1997*
1998
1999
2000
2001
2002
2003
2004
2005
Year
Congested D
irectional Miles
0
100
200
300
400
500
600
700
800
900
1,000
Congested D
irectional Miles
District 3 - MarysvilleDistrict 4 - OaklandDistrict 5 - San Luis ObispoDistrict 6 - FresnoDistrict 7 - Los AngelesDistrict 8 - San BernardinoDistrict 10 - StocktonDistrict 11 - San DiegoDistrict 12 - Irvine D-7
D-12
D-11
D-8D-3
D-5D-10D-6
D-4
* No statewide HICOMP reporting was done in 1996 and 1997. Districts 3 and 4 produced district reports in 1996.
2-8

Exhibit 2-7: Statewide Vehicle-Hours of Delay and Congested Directional Miles 1987-2005
1987
1988
1989
1990
1991
1992
1993
1994
1995
1996*
1997*
1998
1999
2000
2001
2002
2003
2004
2005
Year
0
500
1,000
1,500
2,000
2,500
3,000
3,500
4,000
4,500
5,000
5,500
6,000
Congested Directional Miles
Total Directional Urban Freeway Miles
Urban Freew
ay and Congested D
irectional Miles
0
50
100
150
200
250
300
350
400
450
500
550
600
Daily Vehicle-Hours of Delay
Urban Freew
ays Daily D
elay(1,000 V
ehicle-Hours)
* No statewide HICOMP reporting was done in 1996 and 1997.
2-9

Exhibit 2-8: Daily Delay and Congested Directional Miles County Rankings 2004 vs. 2005
2005 2004 2005 2004 2005 2004RankA RankB District County DVHD F DVHD G CDM I CDM J1 1 7 Los Angeles 164,891 170,965 655.5 639.5
2 2 12 Orange 97,581 96,522 254.1 190.33 3 11 San Diego 62,796 65,768 291.9 333.94 4 4 Alameda 52,300 50,540 120.5 124.05 6 8 Riverside 25,327 20,807 75.3 66.46 5 4 Santa Clara 23,900 22,910 91.4 90.07 7 4 Contra Costa 21,600 18,520 71.6 75.08 8 3 Sacramento 19,721 15,500 129.4 103.79 9 4 San Francisco 10,700 8,860 24.7 21.0
10 12 8 San Bernardino 9,958 6,673 54.4 31.511 11 4 Marin 9,800 7,410 21.4 20.012 10 4 San Mateo 7,600 7,800 45.2 32.013 13 4 Sonoma 7,100 5,320 26.5 21.014 15 10 San Joaquin 4,863 3,383 44.4 31.715 14 5 Santa Cruz 4,030 4,030 17.9 17.916 16 4 Solano 2,700 2,830 9.7 11.017 17 5 Santa Barbara 2,110 2,110 25.1 25.118 18 3 Placer 1,896 1,772 9.0 10.019 22 6 Fresno 296 292 22.0 37.920 23 5 Monterey 280 280 5.3 5.321 19 7 Ventura 250 473 13.5 8.522 24 3 Yolo 190 134 3.8 2.123 21 10 Stanislaus 147 302 7.7 8.324 25 5 San Luis Obispo 33 33 4.9 4.925 20 3 El Dorado 23 306 2.3 5.026 26 6 Kern 0 0 0.0 0.0
530,091 513,539 2,028 1,916
* - County numbers may not add to total due to rounding.
Daily Vehicle-Hours of Delay
Congested Directional Miles
Totals*
Rank Caltrans District County
2-10

Exhibit 2-9: 2005 Excess Fuel Consumption, Travel Cost, and Emissions Due to Congestion
District
Indicator
43,661 271,400 12,907 591 330,283 70,569 10,019 125,591 195,162 1,060,182
1.00 1.10 1.00 1.10 1.10 1.10 1.10 1.00 1.10
43,661 298,540 12,907 650 363,311 77,625 11,021 125,591 214,678 1,147,985
75,053 466,537 22,187 1,016 567,756 121,307 17,223 215,891 335,483 1,822,453
$736,759 $4,920,660 $217,795 $10,717 $5,988,243 $1,279,455 $181,657 $2,119,304 $3,538,411 $18,993,001
22 136 6 0.3 165 35 5 63 98 530
(2) Fuel Efficient Traffic Signal Management Evaluation (Institute of Transportation Studies): 1,000 vehicle-hours of delay results in 1,719 gallons of wasted fuel and 1/2 ton of emissions.
(3) Total user cost includes cost of travel time and cost of excess fuel. The average cost of travel time per person-hour of delay in 2005 is estimated to be $12.56. This figure is based on the average auto and truck costs of travel from the California Lifecycle Benefit/Cost Analysis Model weighted by VMT by vehicle type. The cost of fuel is estimated at $2.51 per gallon, the average monthly price (weighted by monthly "vehicle miles traveled" estimates from Caltrans) for regular unleaded gasoline as reported by the California State Automobile Association (CSAA) monthly gas survey for the year 2005.
Total Emissions per Day (Tons) (2)
(1) Average Vehicle Occupancy (AVO) estimates are used to calculate the daily person-hours of delay (Total Daily Delay x AVO). The person-hours of daily delay estimates are then used to calculate the total user cost per day. AVOs used in the HICOMP are the "home-to-work" trip estimates from the 2000-2001 California Statewide Household Travel Survey. Caltrans, June 2002. This is the most recent data available. The next such report will be produced in the year 2010.
12 Total
Total Daily Delay (Vehicle-Hours)
7 8 10
Excess Fuel Consumed per Day (Gallons) (2)
Total User Cost per Day (Dollars) (3)
113 4 5 6
Average Vehicle Occupancy (1)
Estimated Daily Person-Hours of Delay (1)
2-11

Exhibit 2-10: California State Highway Vehicle Miles Traveled (VMT) 1987-2005
2-12
50
60
70
80
90
100
110
120
130
140
150
160
170
180
190
200
1987
1988
1989
1990
1991
1992
1993
1994
1995
1996
1997
1998
1999
2000
2001
2002
2003
2004
2005
Year
Annual V
ehicle Miles T
raveled Statewide (B
illions)

3. District and County Level Findings and Analysis This chapter presents the 2005 findings by district. The results are presented in three formats:
1) A district summary table presenting total district-wide delay and county sub-totals, 2) a chart showing the district trends over time for delay and congested miles, and 3) two maps showing the location and duration of freeway segments where congestion was measured. The first map shows congested locations for the morning peak commute period and the second map shows the results for the evening peak commute period.
3.1 District 3: Sacramento Area
Exhibit 3-1 summarizes weekday recurrent congestion in District 3 during 2005 compared to 2004. Exhibit 3-2 presents trends in DVHD and CDM for the district. Exhibits 3-3 and 3-4 are maps showing the location and duration of morning and evening peak period congestion.
Both the 2004 and 2005 data used in this data compilation are based on the fall floating vehicle data collection efforts. Prior to 1998, delay estimates were based on both spring and fall floating vehicle data.
In 2005, the total DVHD was 21,830, compared to 17,712 reported for 2004 (a 23 percent increase). The CDM were nearly 145 miles in 2005, (a 20 percent increase) over the 121 miles reported in 2004.
3-1

Exhibit 3-1: District 3 Highway Congestion Summary
District 3 2004 2005Percent Change
2004-2005
Percent of Statewide
2005Daily Vehicle-Hours of Delay 17,712 21,830 23% 4%
El Dorado 306 23 -93%Placer 1,772 1,896 7%
Sacramento 15,500 19,721 27%Yolo 134 190 42%
Congested Directional Miles 120.8 144.5 20% 7%El Dorado 5.0 2.3 -54%
Placer 10.0 9.0 -10%Sacramento 103.7 129.4 25%
Yolo 2.1 3.8 81%
Total Urban Area Freeway Directional Miles 325.4 325.4 Congested Miles/ Total Urban Freeway Miles 37% 44%
3-2

Exhibit 3-2: District 3 Congestion Trends 1987-2005
1987
1988
1989
1990
1991
1992
1993
1994
1995
1996
1997*
1998
1999
2000
2001
2002
2003
2004
2005
Year
0
50
100
150
200
250
300
350
400
450
500
Congested Directional Miles
Urban Freeway Directional Miles
Urban Freew
ay and Congested D
irectional Miles
0
2,500
5,000
7,500
10,000
12,500
15,000
17,500
20,000
22,500
25,000
Daily Vehicle-Hours of Delay
Urban Freew
ays Daily D
elay(V
ehicle-Hours)
* No HICOMP reporting performed.
3-3

s.
Note: This map is representative of congestion on the indicated freeway segments during peak rush hours on incident-free weekday Weekends, holidays and days in which traffic is influenced by accidents, special events and lane closures are not reflected on this map. Congestion delay is defined as the difference in travel time between 35 mph and the lower congested speed.
EXHIBIT 3-3 DISTRICT 3
SACRAMENTO AREA 2005 MORNING CONGESTION MAP
3-4

s.
Note: This map is representative of congestion on the indicated freeway segments during peak rush hours on incident-free weekday Weekends, holidays and days in which traffic is influenced by accidents, special events and lane closures are not reflected on this map. Congestion delay is defined as the difference in travel time between 35 mph and the lower congested speed.
EXHIBIT 3-4 DISTRICT 3
SACRAMENTO AREA 2005 EVENING CONGESTION MAP
3-5

3.2 District 4: San Francisco Bay Area
Exhibit 3-5 summarizes weekday recurrent congestion in District 4 during 2005 compared to 2004. Exhibit 3-6 presents trends in DVHD and CDM for the district. Exhibits 3-7 and 3-8 are maps showing the location and duration of morning and evening peak period congestion.
District 4 collects data in both the spring and fall seasons for the statewide HICOMP. District 4's most congested locations were collected using GPS-equipped floating vehicles during the spring and fall season of 2005 by consultants hired by the Department’s regional partner, the Metropolitan Transportation Commission (MTC). The MTC’s consultant, with the Department’s guidance and review, develops delay estimates.
In 2005, the total DVHD was 135,700 compared to 124,190 reported for 2004 (a nine percent increase). The CDM were 411 miles in 2005, (four percent increase) from 2004.
3-6

Exhibit 3-5: District 4 Highway Congestion Summary
District 4 2004 2005 Percent Change2004-2005
Percent of Statewide
2005Daily Vehicle-Hours of Delay 124,190 135,700 9% 26%
Alameda 50,540 52,300 3%Contra Costa 18,520 21,600 17%
Marin 7,410 9,800 32%Napa 0 0 n/a
San Francisco 8,860 10,700 21%San Mateo 7,800 7,600 -3%
Santa Clara 22,910 23,900 4%Solano 2,830 2,700 -5%
Sonoma 5,320 7,100 33%
Congested Directional Miles 394.0 411.1 4% 20%Alameda 124.0 120.5 -3%
Contra Costa 75.0 71.6 -5%Marin 20.0 21.4 7%Napa 0.0 0.0 n/a
San Francisco 21.0 24.7 17%San Mateo 32.0 45.2 41%
Santa Clara 90.0 91.4 2%Solano 11.0 9.7 -12%
Sonoma 21.0 26.5 26%
Total Urban Area Freeway Directional Miles 1,104.3 1,104.3 Congested Miles/Total Urban Freeway Miles 36% 37%Note: County numbers may not sum to district totals due to rounding.
3-7

Exhibit 3-6: District 4 Congestion Trends 1987-2005
1987
1988
1989
1990
1991
1992
1993
1994
1995
1996
1997*
1998
1999
2000
2001
2002
2003
2004
2005
Year
0
250
500
750
1,000
1,250
1,500
1,750
2,000
Congested Directional Miles
Urban Freeway Directional Miles
Urban Freew
ay and Congested D
irectional Miles
0
25,000
50,000
75,000
100,000
125,000
150,000
175,000
200,000
Daily Vehicle-Hours of Delay
Urban Freew
ays Daily D
elay(V
ehicle-Hours)
* No HICOMP reporting performed.
3-8

s.
Note: This map is representative of congestion on theindicated freeway segments during peak rush hours on incident-free weekday Weekends, holidays and days in which traffic is influenced by accidents, special events and lane closures are not reflected on this map. Congestion delay is defined as the difference in travel time between 35 mph and the lower congested speed.
EXHIBIT 3-7 DISTRICT 4
SAN FRANCISCO BAY AREA 2005 MORNING CONGESTION MAP
3-9

s.
Note: This map is representative of congestion on the indicated freeway segments during peak rush hours on incident-free weekday Weekends, holidays and days in which traffic is influenced by accidents, special events and lane closures are not reflected on this map. Congestion delay is defined as the difference in travel time between 35 mph and the lower congested speed.
EXHIBIT 3-8 DISTRICT 4
SAN FRANCISCO BAY AREA 2005 EVENING CONGESTION MAP
3-10

3.3 District 5: Central Coast Area
Exhibit 3-9 summarizes weekday recurrent congestion in District 5 during 2005 compared to 2004. Exhibit 3-10 presents trends in DVHD and CDM for the district. Exhibits 3-11 and 3-12 are maps showing the location and duration of morning and evening peak period congestion.
In 2005, the total DVHD was assumed to be 6,453 hours, the same as in 2004 since no new data collection was performed. The CDM was assumed to be 53 miles in 2005, the same as in 2004.
3-11
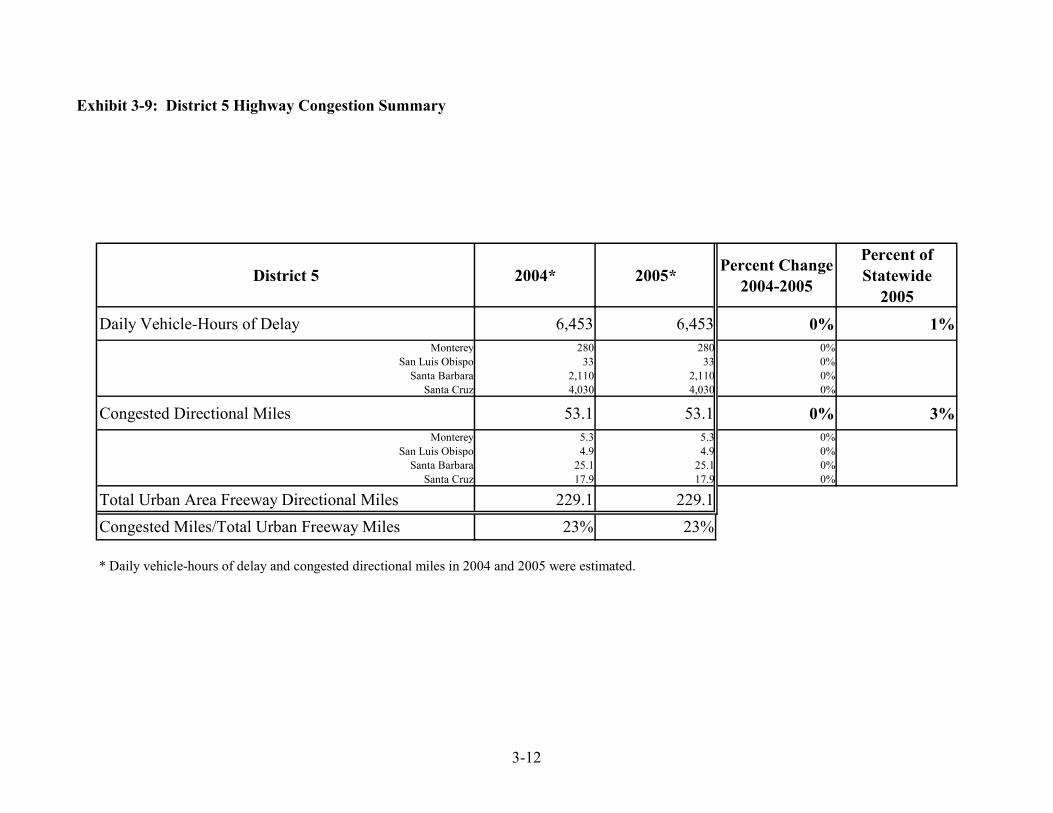
Exhibit 3-9: District 5 Highway Congestion Summary
District 5 2004* 2005* Percent Change2004-2005
Percent of Statewide
2005Daily Vehicle-Hours of Delay 6,453 6,453 0% 1%
Monterey 280 280 0%San Luis Obispo 33 33 0%
Santa Barbara 2,110 2,110 0%Santa Cruz 4,030 4,030 0%
Congested Directional Miles 53.1 53.1 0% 3%Monterey 5.3 5.3 0%
San Luis Obispo 4.9 4.9 0%Santa Barbara 25.1 25.1 0%
Santa Cruz 17.9 17.9 0%
Total Urban Area Freeway Directional Miles 229.1 229.1 Congested Miles/Total Urban Freeway Miles 23% 23%
* Daily vehicle-hours of delay and congested directional miles in 2004 and 2005 were estimated.
3-12

Exhibit 3-10: District 5 Congestion Trends 1989-2005
1987
1988
1989
1990
1991
1992
1993
1994
1995
1996*
1997*
1998
1999
2000
2001
2002
2003
2004
2005
Year
0
25
50
75
100
125
150
175
200
225
250
275
300
325
350
375
400
Congested Directional Miles
***
Urban Freeway Directional Miles
Urban Freew
ay and Congested D
irectional Miles
0
500
1,000
1,500
2,000
2,500
3,000
3,500
4,000
4,500
5,000
5,500
6,000
6,500
7,000
7,500
8,000
Daily Vehicle-Hours of Delay
Urban Freew
ays Daily D
elay(V
ehicle-Hours)
* No HICOMP reporting performed.
3-13

s.
Note: This map is representative of congestion on the indicated freeway segments during peak rush hours on incident-free weekday Weekends, holidays and days in which traffic is influenced by accidents, special events and lane closures are not reflected on this map. Congestion delay is defined as the difference in travel time between 35 mph and the lower congested speed.
EXHIBIT 3-11 DISTRICT 5
CENTRAL COAST AREA 2005 MORNING CONGESTION MAP
3-14

s.
Note: This map is representative of congestion on the indicated freeway segments during peak rush hours on incident-free weekday Weekends, holidays and days in which traffic is influenced by accidents, special events and lane closures are not reflected on this map. Congestion delay is defined as the difference in travel time between 35 mph and the lower congested speed.
EXHIBIT 3-12 DISTRICT 5
CENTRAL COAST AREA 2005 EVENING CONGESTION MAP
3-15

3.4 District 6: Fresno Area
Exhibit 3-13 summarizes weekday recurrent congestion in District 6 during 2005 compared to 2004. Exhibit 3-14 presents trends in DVHD and CDM for the district. Exhibits 3-15 and 3-16 are maps showing the location and duration of morning and evening peak period congestion.
The 2004 and 2005 District 6 results in this data compilation are based on floating vehicle data collected in the fall season of each year.
In 2005, the total DVHD was 296 compared to the 292 hours reported for 2004. The CDM was almost 22 miles in 2005, a 16-mile decrease from the 38 miles reported in 2004. District 6’s DVHD and CDM numbers were relatively small. Therefore, any small change for 2005 may translate to large changes.
3-16

Exhibit 3-13: District 6 Highway Congestion Summary
District 6 2004 2005 Percent Change2004-2005
Percent of Statewide
2005Daily Vehicle-Hours of Delay 292 296 1% 0%
Fresno 292 296 1%Kern - - n/a
Congested Directional Miles 37.9 22.0 -42% 1%Fresno 37.9 22.0 -42%
Kern - - n/a
Total Urban Area Freeway Directional Miles 269.1 269.1 Congested Miles/Total Urban Freeway Miles 14% 8%
3-17

Exhibit 3-14: District 6 Congestion Trends 1990-2005
1987
1988
1989
1990
1991
1992
1993
1994
1995
1996*
1997*
1998
1999
2000
2001
2002
2003
2004
2005
Year
0
25
50
75
100
125
150
175
200
225
250
275
300
Congested Directional Miles
* * *
Urban Freeway Directional Miles
Urban Freew
ay and Congested D
irectional Miles
0
50
100
150
200
250
300
350
400
450
500
550
600
Daily Vehicle-Hours of Delay
Urban Freew
ays Daily D
elay(V
ehicle-Hours)
* No HICOMP reporting performed.
3-18

s.
Note: This map is representative of congestion on the indicated freeway segments during peak rush hours on incident-free weekday Weekends, holidays and days in which traffic is influenced by accidents, special events and lane closures are not reflected on this map. Congestion delay is defined as the difference in travel time between 35 mph and the lower congested speed.
EXHIBIT 3-15 DISTRICT 6
FRESNO AREA 2005 MORNING CONGESTION MAP
3-19

s.
Note: This map is representative of congestion on the indicated freeway segments during peak rush hours on incident-free weekday Weekends, holidays and days in which traffic is influenced by accidents, special events and lane closures are not reflected on this map. Congestion delay is defined as the difference in travel time between 35 mph and the lower congested speed.
EXHIBIT 3-16 DISTRICT 6
FRESNO AREA 2005 EVENING CONGESTION MAP
3-20
3.5 District 7: Los Angeles-Ventura Area
Exhibit 3-17 summarizes weekday recurrent congestion in District 7 during 2005 compared to 2004. Exhibit 3-18 presents trends in DVHD and CDM for the district. Exhibits 3-19 and 3-20 are maps showing the location and duration of morning and evening peak period congestion.
Both the 2004 and 2005 data used in this data compilation are based on data retrieved from automatic detectors. Floating car data from the fall season of 2003 was also used to fill in gaps where no automatic detection is available. Those areas have not been monitored since that time, so the congestion levels are assumed to be roughly equivalent from year to year. Prior to 1998, delay estimates were based on both spring and fall automatic detection data.
In 2005, the total DVHD was 165,141 compared to 171,438 hours reported for 2004 (a four percent decrease). The CDM increased from 648 miles in 2004 to 669 miles in 2005 (an increase of three percent).
3-21

Exhibit 3-17: District 7 Highway Congestion Summary
District 7 2004 2005 Percent Change2004-2005
Percent of Statewide
2005Daily Vehicle-Hours of Delay 171,438 165,141 -4% 31%
Los Angeles 170,965 164,891 -4%Ventura 473 250 -47%
Congested Directional Miles 648.0 669.0 3% 34%Los Angeles 639.5 655.5 3%
Ventura 8.5 13.5 59%
Total Urban Area Freeway Directional Miles 1,084.8 1,084.8 Congested Miles/Total Urban Freeway Miles 60% 62%
3-22

Exhibit 3-18: District 7 Congestion Trends 1987-2005
1987
1988
1989
1990
1991
1992
1993
1994
1995
1996*
1997*
1998
1999
2000
2001
2002
2003
2004
2005
Year
0
250
500
750
1,000
1,250
1,500
1,750
2,000
Congested Directional Miles
Urban Freeway Directional Miles
Urban Freew
ay and Congested D
irectional Miles
0
25,000
50,000
75,000
100,000
125,000
150,000
175,000
200,000
Daily Vehicle-Hours of Delay
Urban Freew
ays Daily D
elay(V
ehicle-Hours)
* No HICOMP reporting performed.
3-23

3-24
Exhibit 3-19 DISTRICT 7
LOS ANGELES-VENTURA AREA 2004 MORNING CONGESTION
MAP
Note: This map is representative of congestion on the indicated freeway segments during peak rush hours on incident-free weekdays. Weekends, holidays and days in which traffic is influenced by accidents, special events and lane closures are not reflected on this map. Congestion delay is defined as the difference in travel time between 35 mph and the lower congested speed.

3-25
Exhibit 3-20 DISTRICT 7
LOS ANGELES-VENTURA AREA 2004 EVENING CONGESTION
MAP
Note: This map is representative of congestion on the indicated freeway segments during peak rush hours on incident-free weekdays. Weekends, holidays and days in which traffic is influenced by accidents, special events and lane closures are not reflected on this map. Congestion delay is defined as the difference in travel time between 35 mph and the lower congested speed.

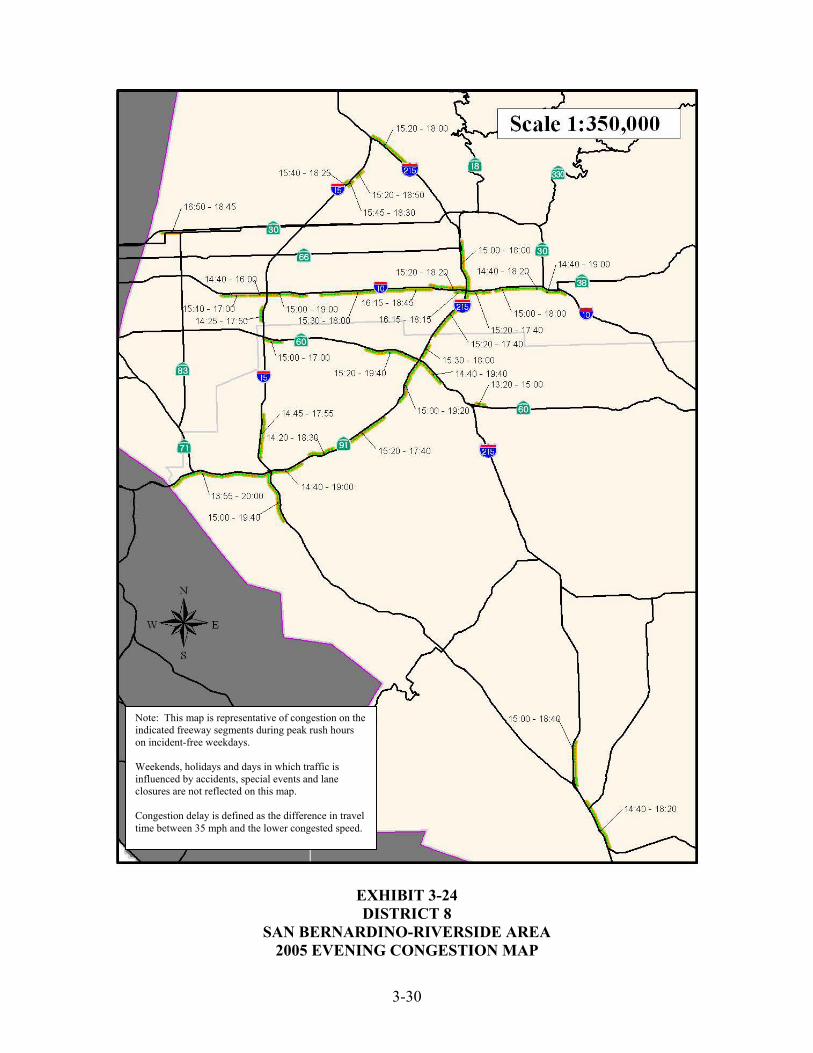
3.6 District 8: San Bernardino-Riverside Area
Exhibit 3-21 summarizes weekday recurrent congestion in District 8 during 2005 compared to 2004. Exhibit 3-22 presents trends in DVHD and CDM for the district. Exhibits 3-23 and 3-24 are maps showing the locations and durations of morning and evening peak period congestion.
The 2005 data results reported in this data compilation are based in large part on spring and fall 2005 data collected by floating vehicles. In 2004, the floating vehicle data was not collected on some segments. Consequently, the results in 2004 were mostly estimated. However, based on the 2005 results, prior year data that had been estimated were adjusted as needed.
Prior to 1998, delay estimates were based on both spring and fall floating vehicle data. Beginning in 2001, District 8 began to use fall automatic detection data to estimate delay for some route segments. Other segments continued to be monitored using floating vehicles.
In 2005, the total DVHD was 35,284 hours compared to an adjusted 27,480 hours reported for 2004 (an increase of 28 percent). The CDM increased to nearly 130 miles in 2005 compared to an adjusted 98 miles in 2004 (an increase of 33 percent). The 2004 data was adjusted because it was incomplete and some data was estimated. When comparing the more complete data from 2005 with the data from 2003 and the estimated data from 2004, it was apparent that some adjustment was appropriate.
3-26

Exhibit 3-21: District 8 Highway Congestion Summary
District 8 2004* 2005 Percent Change2004-2005
Percent of Statewide
2005Daily Vehicle-Hours of Delay 27,480 35,284 28% 7%
Riverside 20,807 25,327 22%San Bernardino 6,673 9,958 49%
Congested Directional Miles 97.8 129.8 33% 6%Riverside 66.4 75.3 13%
San Bernardino 31.5 54.4 73%
Total Urban Area Freeway Directional Miles 571.6 571.6 Congested Miles/Total Urban Freeway Miles 17% 23%
* Daily vehicle-hours of delay in 2003 and 2004 were estimated for some segments. In 2005, these estimates were revised for segments where 2005 data collection was performed. Congested directional miles assumed to not have changed between 2003 and 2004 for those segments where no data collection was performed.
3-27

Exhibit 3-22: District 8 Congestion Trends 1987-2005
1987
1988
1989
1990
1991
1992
1993
1994
1995
1996*
1997*
1998
1999
2000
2001
2002
2003
2004
2005
Year
0
50
100
150
200
250
300
350
400
450
500
550
600
Congested Directional Miles
Urban Freeway Directional Miles
Urban Freew
ay and Congested D
irectional Miles
0
5,000
10,000
15,000
20,000
25,000
30,000
35,000
40,000
45,000
50,000
55,000
60,000
Daily Vehicle-Hours of Delay
Urban Freew
ays Daily D
elay(V
ehicle-Hours)
* No HICOMP reporting performed.
3-28

s.
Note: This map is representative of congestion on the indicated freeway segments during peak rush hours on incident-free weekday Weekends, holidays and days in which traffic is influenced by accidents, special events and lane closures are not reflected on this map. Congestion delay is defined as the difference in travel time between 35 mph and the lower congested speed.
EXHIBIT 3-23 DISTRICT 8
SAN BERNARDINO-RIVERSIDE AREA 2005 MORNING CONGESTION MAP
3-29
s.
Note: This map is representative of congestion on the indicated freeway segments during peak rush hours on incident-free weekday Weekends, holidays and days in which traffic is influenced by accidents, special events and lane closures are not reflected on this map. Congestion delay is defined as the difference in travel time between 35 mph and the lower congested speed.
EXHIBIT 3-24 DISTRICT 8
SAN BERNARDINO-RIVERSIDE AREA 2005 EVENING CONGESTION MAP
3-30

3.7 District 10: Stockton Area
Exhibit 3-25 summarizes weekday recurrent congestion in District 10 during 2005 compared to 2004. Exhibit 3-26 presents trends in DVHD and CDM for the district. Exhibits 3-27 and 3-28 are maps showing the location and duration of MORNING and EVENING peak period congestion.
Both the 2004 and 2005 data used in this data compilation are based on fall floating vehicle data collection efforts. District 10 has been monitoring traffic congestion for the HICOMP data compilation since 1998, when recurrent congestion grew to a level to warrant monitoring.
In 2005, the total DVHD was 5,010 compared to 3,685 hours reported for 2004 (a 36 percent increase). The CDM were more than 52 miles in 2005, up 12 miles from 2004 (a 31 percent increase).
3-31

Exhibit 3-25: District 10 Highway Congestion Summary
District 10 2004 2005 Percent Change2004-2005
Percent of Statewide
2005Daily Vehicle-Hours of Delay 3,685 5,010 36% 1%
San Joaquin 3,383 4,863 44%Stanislaus 302 147 -51%
Congested Directional Miles 39.9 52.2 31% 3%San Joaquin 31.7 44.4 40%
Stanislaus 8.3 7.7 -7%
Total Urban Area Freeway Directional Miles 185.4 185.4 Congested Miles/Total Urban Freeway Miles 22% 28%
3-32

Exhibit 3-26: District 10 Congestion Trends 1998-2005
1987
1988
1989
1990
1991
1992
1993
1994
1995
1996*
1997*
1998
1999
2000
2001
2002
2003
2004
2005
Year
0
50
100
150
200
250
300
350
400
450
500
550
Congested Directional Miles
Urban Freeway Directional Miles
Urban area freeway designation adjusted based on 1990 U.S. Census Caltrans district
boundary adjustment
* * * * * * * * *
Urban Freew
ay and Congested D
irectional Miles
0
500
1,000
1,500
2,000
2,500
3,000
3,500
4,000
4,500
5,000
5,500
Daily Vehicle-Hours of Delay
Urban Freew
ays Daily D
elay(V
ehicle-Hours)
* No HICOMP reporting performed.
3-33

s.
Note: This map is representative of congestion on the indicated freeway segments during peak rush hours on incident-free weekday Weekends, holidays and days in which traffic is influenced by accidents, special events and lane closures are not reflected on this map. Congestion delay is defined as the difference in travel time between 35 mph and the lower congested speed.
EXHIBIT 3-27 DISTRICT 10
STOCKTON AREA 2005 MORNING CONGESTION MAP
3-34

s.
Note: This map is representative of congestion on the indicated freeway segments during peak rush hours on incident-free weekday Weekends, holidays and days in which traffic is influenced by accidents, special events and lane closures are not reflected on this map. Congestion delay is defined as the difference in travel time between 35 mph and the lower congested speed.
EXHIBIT 3-28 DISTRICT 10
STOCKTON AREA 2005 EVENING CONGESTION MAP
3-35

3.8 District 11: San Diego Area
Exhibit 3-29 summarizes weekday recurrent congestion in District 11 during 2005 compared to 2004. Exhibit 3-30 presents trends in DVHD and CDM for the district. Exhibits 3-31 and 3-32 are maps showing the location and duration of morning and evening peak period congestion.
Both the 2004 and 2005 data used in this data compilation are based on fall floating vehicle and automatic detection data collection efforts. Prior to 1998, delay estimates were based on both spring and fall floating vehicle data. Since 1998, District 11 has been using automatic detection data from the fall to estimate delay for many route segments. The floating vehicle was used to monitor the remaining segments.
In 2005, the total DVHD was 62,796 compared to 65,768 hours reported for 2004 (a decrease of five percent). The CDM was 292 miles in 2005 from the 334 miles in 2004 (a 13 percent decrease).
3-36

Exhibit 3-29: District 11 Highway Congestion Summary
District 11 2004 2005 Percent Change2004-2005
Percent of Statewide
2005Daily Vehicle-Hours of Delay 65,768 62,796 -5% 12%
San Diego 65,768 62,796 -5%
Congested Directional Miles 333.9 291.9 -13% 15%San Diego 333.9 291.9 -13%
Total Urban Area Freeway Directional Miles 478.4 478.4 Congested Miles/Total Urban Freeway Miles 70% 61%
3-37
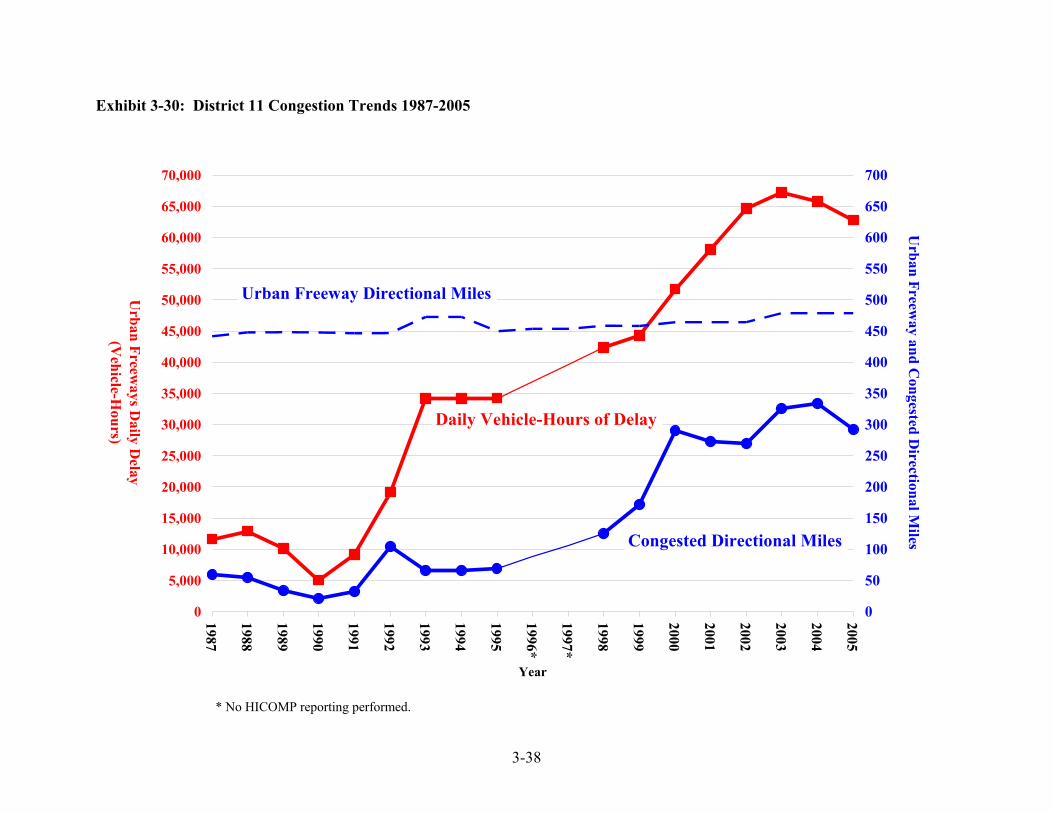
Exhibit 3-30: District 11 Congestion Trends 1987-2005
1987
1988
1989
1990
1991
1992
1993
1994
1995
1996*
1997*
1998
1999
2000
2001
2002
2003
2004
2005
Year
0
50
100
150
200
250
300
350
400
450
500
550
600
650
700
Congested Directional Miles
Urban Freeway Directional Miles
Urban Freew
ay and Congested D
irectional Miles
0
5,000
10,000
15,000
20,000
25,000
30,000
35,000
40,000
45,000
50,000
55,000
60,000
65,000
70,000
Daily Vehicle-Hours of Delay
Urban Freew
ays Daily D
elay(V
ehicle-Hours)
* No HICOMP reporting performed.
3-38

Note: This map is representative of congestion on the indicated freeway segments during peak rush hours on incident-free weekdays. Weekends, holidays and days in which traffic is influenced by accidents, special events and lane closures are not reflected on this map. Congestion delay is defined as the difference in travel time between 35 mph and the lower congested speed.
EXHIBIT 3-31 DISTRICT 11
SAN DIEGO AREA 2005 MORNING CONGESTION MAP
3-39

s.
Note: This map is representative of congestion on the indicated freeway segments during peak rush hours on incident-free weekday Weekends, holidays and days in which traffic is influenced by accidents, special events and lane closures are not reflected on this map. Congestion delay is defined as the difference in travel time between 35 mph and the lower congested speed.
EXHIBIT 3-32 DISTRICT 11
SAN DIEGO AREA 2005 EVENING CONGESTION MAP
3-40

3.9 District 12: Orange County
Exhibit 3-33 summarizes weekday recurrent congestion in District 12 during 2005 compared to 2004. Exhibit 3-34 presents trends in DVHD and CDM for the district. Exhibits 3-35 and 3-36 are maps showing the location and duration of morning and evening peak period congestion.
The 2004 data was derived from automatic detection data, which differs from the floating car data collection used in the past. Floating car data collected in 2005, generally yielding high DVHD results, was used to adjust the 2004 numbers.
In 2005, the total DVHD was 97,581 compared to 96,522 hours for 2004 (a one percent increase). The CDM in 2005 was 254 compared to the 190 miles reported in 2004 (a 34 percent increase).
3-41

Exhibit 3-33: District 12 Highway Congestion Summary
District 12 2004* 2005 Percent Change2004-2005
Percent of Statewide
2005Daily Vehicle-Hours of Delay 96,522 97,581 1% 19%
Orange 96,522 97,581 1%
Congested Directional Miles 190.3 254.1 34% 13%Orange 190.3 254.1 34%
Total Urban Area Freeway Directional Miles 385.5 385.5 Congested Miles/Total Urban Freeway Miles 49% 66%
* The district incorporated a methodological change in 2004, which contributed to the increase in overall delay reported.
3-42

Exhibit 3-34: District 12 Congestion Trends 1987-2005
1987
1988
1989
1990
1991
1992
1993
1994
1995
1996*
1997*
1998
1999
2000
2001
2002
2003
2004
2005
Year
0
100
200
300
400
500
600
700
800
900
1,000
1,100
1,200
Congested Directional Miles
Urban Freeway Directional Miles
Urban Freew
ay and Congested D
irectional Miles
0
10,000
20,000
30,000
40,000
50,000
60,000
70,000
80,000
90,000
100,000
110,000
120,000
Daily Vehicle-Hours of Delay
Urban Freew
ays Daily D
elay(V
ehicle-Hours)
* No HICOMP reporting performed.
3-43

s.
Note: This map is representative of congestion on the indicated freeway segments during peak rush hours on incident-free weekday Weekends, holidays and days in which traffic is influenced by accidents, special events and lane closures are not reflected on this map. Congestion delay is defined as the difference in travel time between 35 mph and the lower congested speed.
EXHIBIT 3-35 DISTRICT 12
ORANGE COUNTY 2005 MORNING CONGESTION MAP
3-44

s.
Note: This map is representative of congestion on the indicated freeway segments during peak rush hours on incident-free weekday Weekends, holidays and days in which traffic is influenced by accidents, special events and lane closures are not reflected on this map. Congestion delay is defined as the difference in travel time between 35 mph and the lower congested speed.
EXHIBIT 3-36 DISTRICT 12
ORANGE COUNTY 2005 EVENING CONGESTION MAP
3-45

Appendix A: Department District and County Map
2
8
6 9
3
5
1
4
7
10
1112
SBD
INY
RIV
KER
SIS
LA
SD
FRE
TUL
IMP
LASTRI
SB
SHA
MOD
SLO
MEN
HUM
TEH
MON
MNO
PLU
ED
SJ TUO
MAD
VEN
MER
BUT
KIN
PLA
STA
SON
SBT
LAK
DN
MPASCL
GLE SIE
COL
CAL
YOL
CC
SACSOL
ALP
ORA
YUB
SM
MRNSF
NAP
N
EW
S
CaltransDistrict Numberin BLUE
0 100 200 Miles
A-1

Appendix B: Department Contacts
District Contact Person Public Number Email Address
03 Matt Taghipour (916) 859-7950 [email protected]
04 Ron Kyutoku (510) 286-4640 [email protected]
05 Roger D. Barnes (805) 594-6190 [email protected]
06 Albert Lee (559) 488-4111 [email protected]
07 Kirk Patel (213) 897-1825 [email protected]
08 Mohammed Bendelhoum (909) 383-6452 [email protected]
10 Arlene Cordero (209) 948-3894 [email protected]
11 Lawrence Emerson (858) 467-3073 [email protected]
12 Farid Nowshiravan (949) 756-7639 [email protected]
HQ Rex Cluff (916) 651-9059 [email protected]
B-1

Appendix C: Glossary of Terms Automatic Detection – The most common type of automatic detection uses inductive loops (commonly referred to as “loop detectors”). New technologies are also being employed such as radar, infrared sensors, and vehicle transponder tags, such as those used for toll roads or bridges. Daily Vehicle Hours of Delay (DVHD) – is the result of calculating V × D × T. Where, V = Volume in vehicles per hour = Number of lanes × Vehicles per hour per lane (VPHPL), D = Duration of congestion in hours and T = Travel time (in hours) to cover a given distance under congested conditions minus the travel time at 35 mph. Directional Mile – A one-mile length of freeway has two directional miles, regardless of number of lanes. Duration – The length of time the freeway directional segment remains congested expressed in hours. Congested Directional Miles (CDM) – See Extent. Extent – The length of freeway segment, by direction, experiencing speeds below 35 mph for 15 minutes or more. Extent is expressed in terms of congested directional miles (CDM). Floating Vehicle – Consists of either a fixed transmission sensor mounted in the engine compartment of a vehicle or GPS device. The transmission sensor, or tachometer, counts the number of wheel rotations in one second and sends that data to a laptop computer. Software on the computer then translates this data into meaningful time, distance, and travel speed information. A GPS system uses satellite technology to identify the location of the vehicle over time. Computer software identifies the freeway, direction of travel, and average speed of the vehicle. High Occupancy Vehicle Lanes (HOV) – Lanes on freeways restricted to vehicles carrying more than one person or to public transportation vehicles. Minimum vehicle occupancies can be either two or three people depending on the highway segment. HOV lanes are designed to encourage ridesharing. Magnitude – The difference in time between the time it takes to travel a segment at the recorded congested speed and the travel time at 35 mph. DVHD is the term used to express the magnitude of the delay. Metered Connector – Ramp meter on a freeway-to-freeway connector. Non-Recurrent Congestion – Caused by events that occur irregularly such as accidents, sporting events, and maintenance or construction.
C-1

Ramp Metering – Signalized devices installed on freeway on-ramps to regulate traffic entering the freeway system. Recurrent Congestion – A condition lasting for 15 minutes or longer where travel demand exceeds freeway capacity, as evident by vehicular speeds of 35 mph or less occurring during peak commute periods on a typical, incident-free weekday. Surveillance Stations – All detector locations including ramp-metering stations are termed surveillance stations.
C-2

Arnold Schwarzenegger Governor Dale E. Bonner Secretary, Business, Transportation and Housing Agency Will Kempton Director, California Department of Transportation Robert Copp Division Chief, Traffic Operations For more information or additional copies of this data compilation please contact Rex Cluff at (916) 651-9059 or by email: [email protected]
Related Documents


