State and Territory Greenhouse Gas Inventories 2015 Australia’s National Greenhouse Accounts May 2017

Welcome message from author
This document is posted to help you gain knowledge. Please leave a comment to let me know what you think about it! Share it to your friends and learn new things together.
Transcript
State and Territory Greenhouse G
as Inventories 2015 Australia’s N
ational Greenhouse A
ccounts
State and Territory Greenhouse Gas Inventories 2015Australia’s National Greenhouse Accounts
May 2017
© Commonwealth of Australia, 2017
State and Territory Greenhouse Gas Inventories 2015 is licensed by the Commonwealth of Australia for use under a Creative Commons By Attribution 3.0 Australia licence with the exception of the Coat of Arms of the Commonwealth of Australia, the logo of the agency responsible for publishing the report, content supplied by third parties, and any images depicting people. For licence conditions see: http://creativecommons.org/licenses/by/3.0/au/
This report should be attributed as ‘State and Territory Greenhouse Gas Inventories 2015, Commonwealth of Australia 2017’.
The Commonwealth of Australia has made all reasonable efforts to identify content supplied by third parties using the following format ‘© Copyright, [name of third party] ’.
Disclaimer The views and opinions expressed in this publication are those of the authors and do not necessarily reflect those of the Australian Government or the Minister for the Environment and Energy.
Contents
State and Territory Greenhouse Gas Emissions – an overview 2
State and Territory Greenhouse Gas Inventories 4
NEW SOUTH WALES 4
VICTORIA 5
QUEENSLAND 6
WESTERN AUSTRALIA 7
SOUTH AUSTRALIA 8
TASMANIA 9
AUSTRALIAN CAPITAL TERRITORY 10
NORTHERN TERRITORY 11
Appendix 1 – Notes 12
Appendix 2 – Sectoral Greenhouse Gas Emissions 17
Appendix 3 – State and Territory Emissions Trends 21
Related Publications and Resources 69
2 / AUSTRALIAN NATIONAL GREENHOUSE ACCOUNTS State and Territory Greenhouse Gas Inventories, 2015
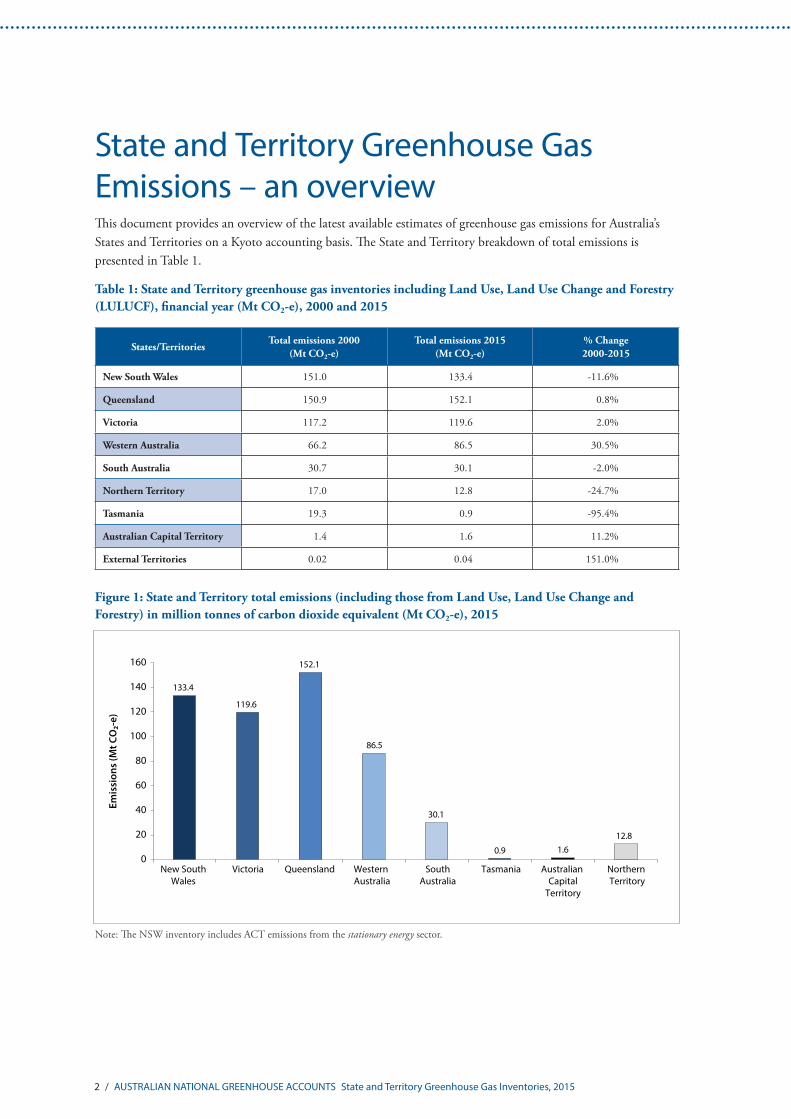
State and Territory Greenhouse Gas Emissions – an overviewThis document provides an overview of the latest available estimates of greenhouse gas emissions for Australia’s States and Territories on a Kyoto accounting basis. The State and Territory breakdown of total emissions is presented in Table 1.
Table 1: State and Territory greenhouse gas inventories including Land Use, Land Use Change and Forestry (LULUCF), financial year (Mt CO2-e), 2000 and 2015
States/TerritoriesTotal emissions 2000
(Mt CO2-e)Total emissions 2015
(Mt CO2-e)% Change 2000-2015
New South Wales 151.0 133.4 -11.6%
Queensland 150.9 152.1 0.8%
Victoria 117.2 119.6 2.0%
Western Australia 66.2 86.5 30.5%
South Australia 30.7 30.1 -2.0%
Northern Territory 17.0 12.8 -24.7%
Tasmania 19.3 0.9 -95.4%
Australian Capital Territory 1.4 1.6 11.2%
External Territories 0.02 0.04 151.0%
Figure 1: State and Territory total emissions (including those from Land Use, Land Use Change and Forestry) in million tonnes of carbon dioxide equivalent (Mt CO2-e), 2015
Note: The NSW inventory includes ACT emissions from the stationary energy sector.
133.4
119.6
152.1
86.5
30.1
0.9 1.612.8
0
20
40
60
80
100
120
140
160
New SouthWales
Victoria Queensland Western Australia
SouthAustralia
Tasmania Australian Capital
Territory
Northern Territory
AUSTRALIAN NATIONAL GREENHOUSE ACCOUNTS State and Territory Greenhouse Gas Inventories, 2015 / 3
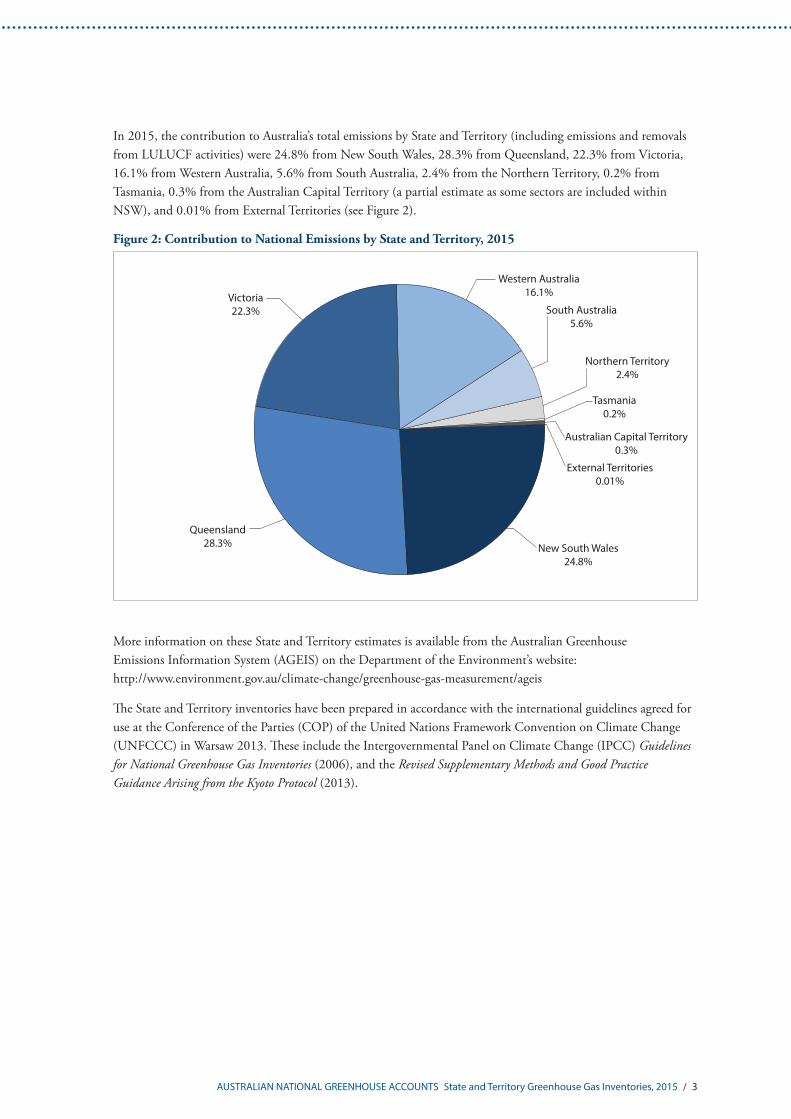
In 2015, the contribution to Australia’s total emissions by State and Territory (including emissions and removals from LULUCF activities) were 24.8% from New South Wales, 28.3% from Queensland, 22.3% from Victoria, 16.1% from Western Australia, 5.6% from South Australia, 2.4% from the Northern Territory, 0.2% from Tasmania, 0.3% from the Australian Capital Territory (a partial estimate as some sectors are included within NSW), and 0.01% from External Territories (see Figure 2).
Figure 2: Contribution to National Emissions by State and Territory, 2015
More information on these State and Territory estimates is available from the Australian Greenhouse Emissions Information System (AGEIS) on the Department of the Environment’s website: http://www.environment.gov.au/climate-change/greenhouse-gas-measurement/ageis
The State and Territory inventories have been prepared in accordance with the international guidelines agreed for use at the Conference of the Parties (COP) of the United Nations Framework Convention on Climate Change (UNFCCC) in Warsaw 2013. These include the Intergovernmental Panel on Climate Change (IPCC) Guidelines for National Greenhouse Gas Inventories (2006), and the Revised Supplementary Methods and Good Practice Guidance Arising from the Kyoto Protocol (2013).
Western Australia16.1%
South Australia5.6%
Northern Territory2.4%
Tasmania0.2%
Australian Capital Territory0.3%
External Territories0.01%
New South Wales24.8%
Queensland28.3%
Victoria22.3%
4 / AUSTRALIAN NATIONAL GREENHOUSE ACCOUNTS State and Territory Greenhouse Gas Inventories, 2015
State and Territory Greenhouse Gas InventoriesThe following sections provide summary information on the greenhouse gas emissions, including emissions and removals from Land Use, Land Use Change and Forestry (LULUCF) activities, for each State and Territory. Other background information including a detailed time series of emissions estimates is provided in the appendices.
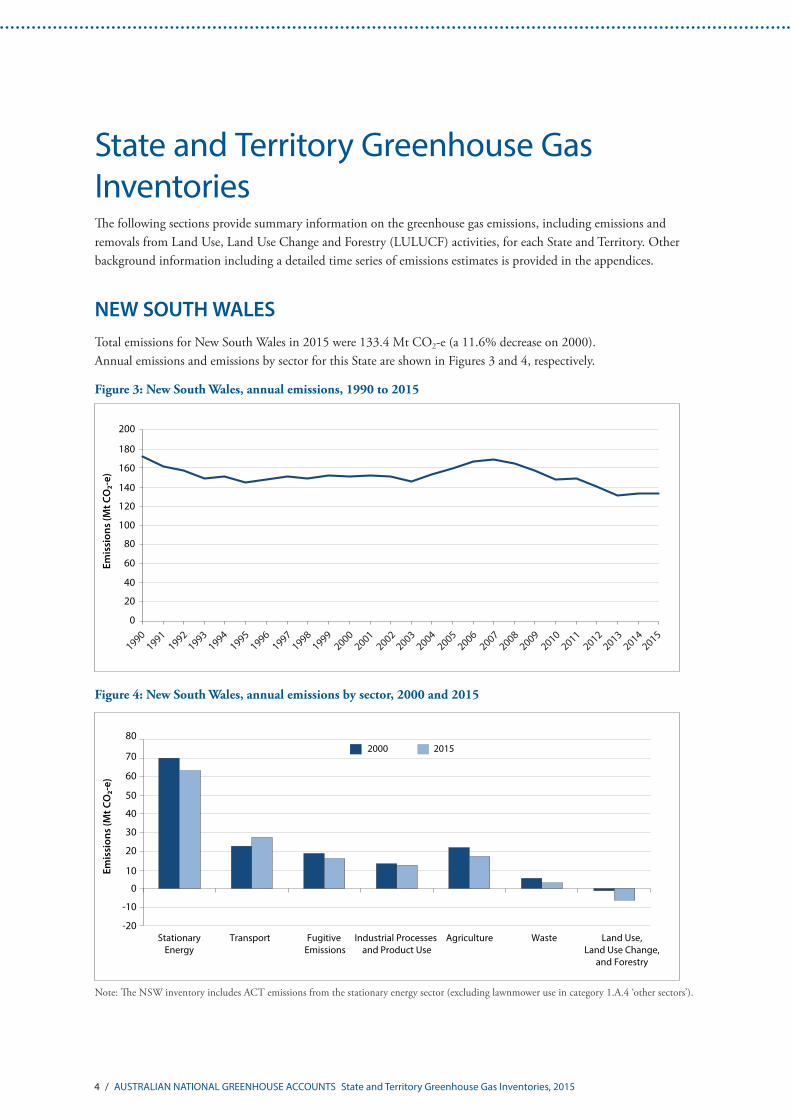
NEW SOUTH WALESTotal emissions for New South Wales in 2015 were 133.4 Mt CO2-e (a 11.6% decrease on 2000). Annual emissions and emissions by sector for this State are shown in Figures 3 and 4, respectively.
Figure 3: New South Wales, annual emissions, 1990 to 2015
Figure 4: New South Wales, annual emissions by sector, 2000 and 2015
0
20
40
60
80
100
120
140
160
180
200
19901991
19921993
19941995
19961997
19981999
20002001
20022003
20042005
20062007
20082009
20102011
20122013
20142015
0
10
20
30
40
50
60
70
80
StationaryEnergy
Transport Fugitive Emissions
Industrial Processes and Product Use
Agriculture Waste Land Use,Land Use Change,
and Forestry
-10
-20
2000 2015
Note: The NSW inventory includes ACT emissions from the stationary energy sector (excluding lawnmower use in category 1.A.4 ‘other sectors’).
AUSTRALIAN NATIONAL GREENHOUSE ACCOUNTS State and Territory Greenhouse Gas Inventories, 2015 / 5
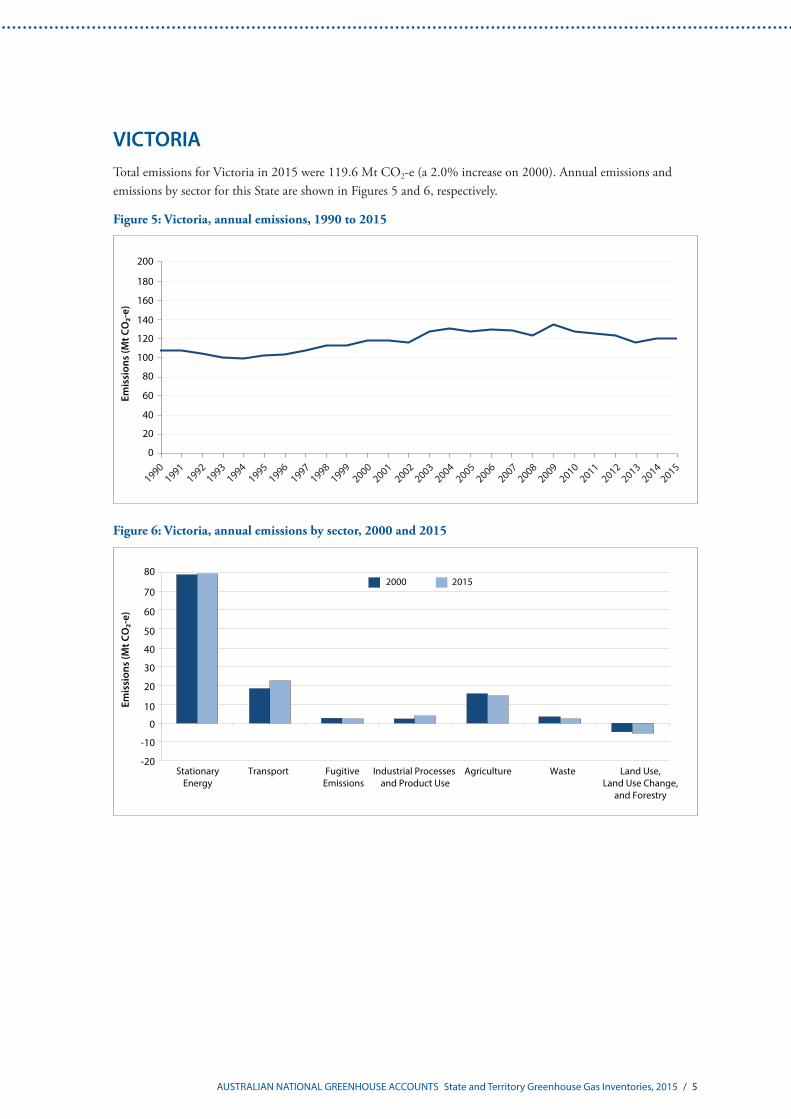
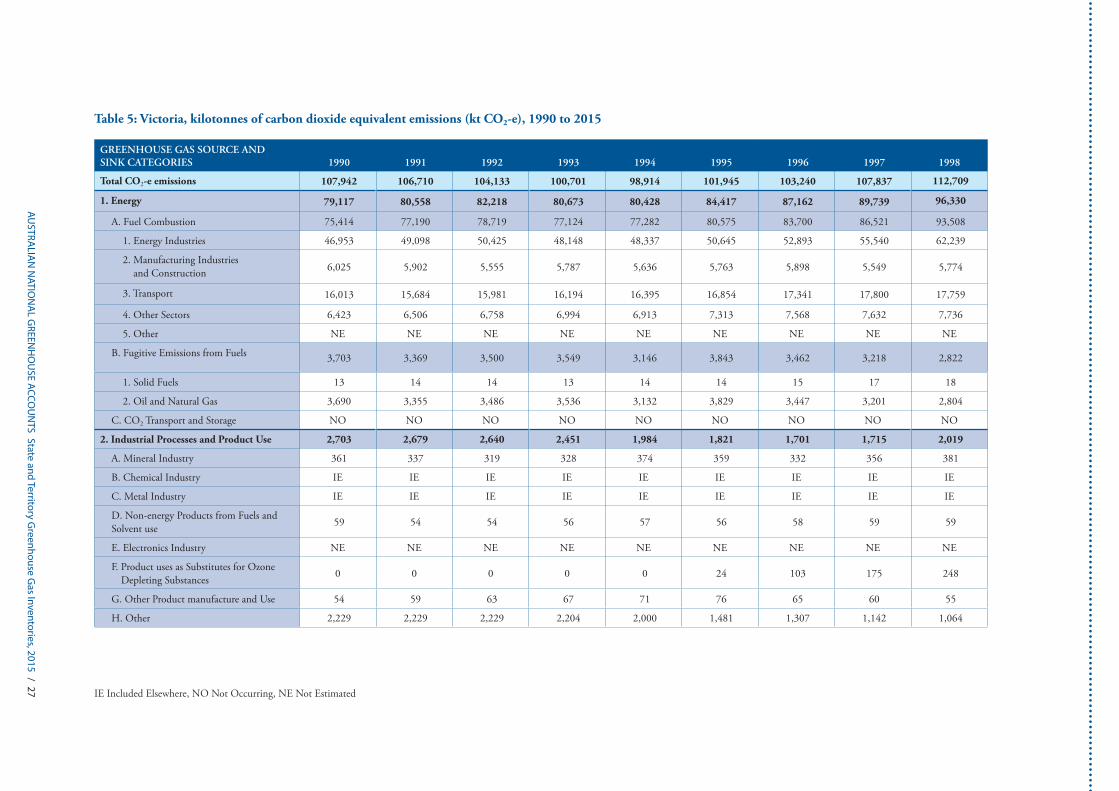
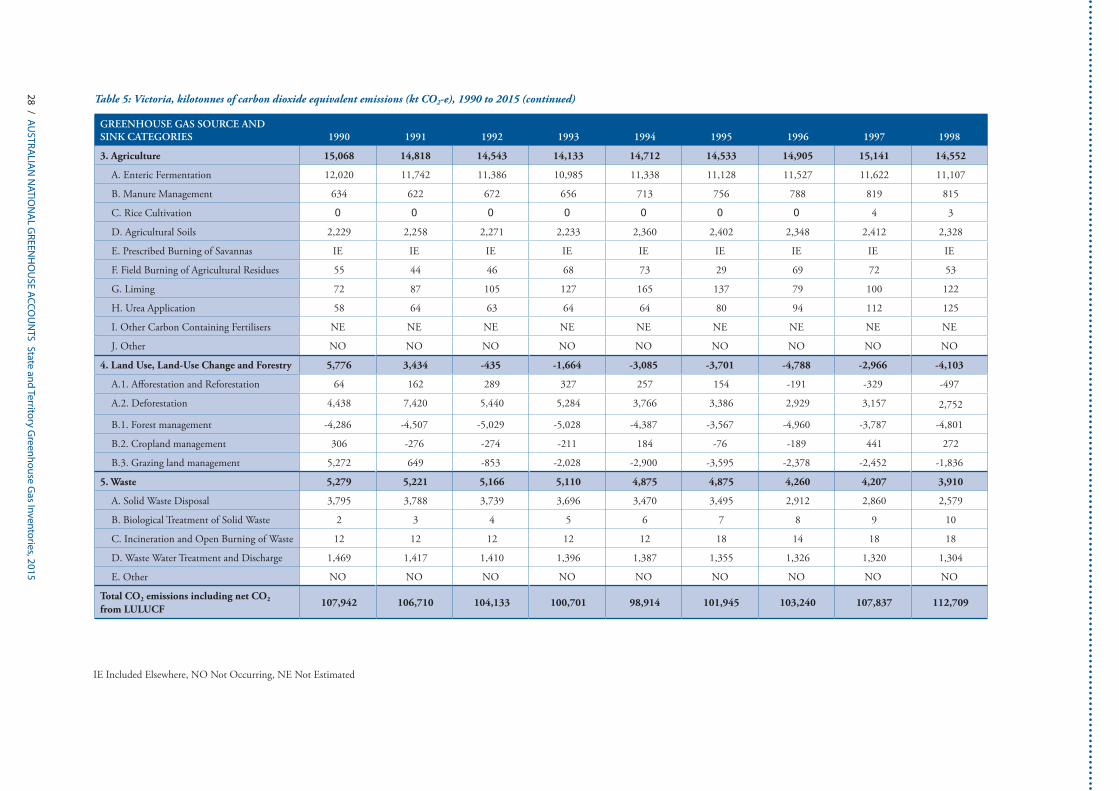
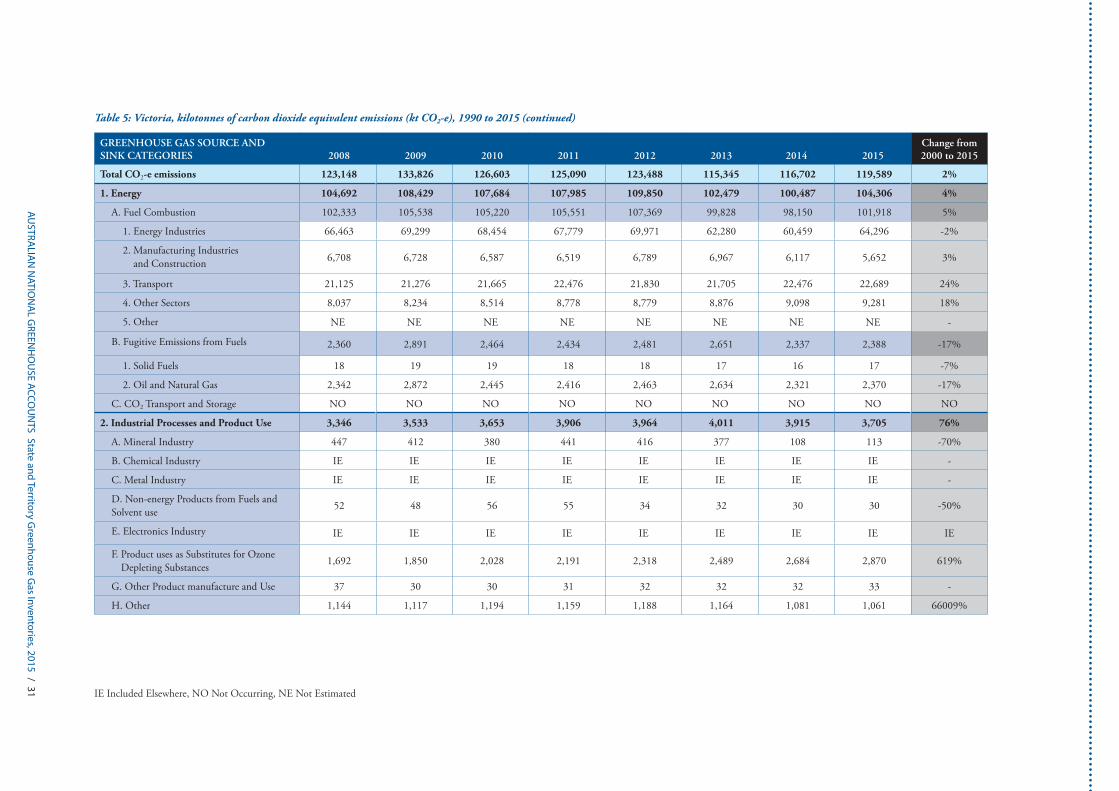
VICTORIATotal emissions for Victoria in 2015 were 119.6 Mt CO2-e (a 2.0% increase on 2000). Annual emissions and emissions by sector for this State are shown in Figures 5 and 6, respectively.
Figure 5: Victoria, annual emissions, 1990 to 2015
Figure 6: Victoria, annual emissions by sector, 2000 and 2015
0
20
40
60
80
100
120
140
160
180
200
19901991
19921993
19941995
19961997
19981999
20002001
20022003
20042005
20062007
20082009
20102011
20122013
20142015
0
10
20
30
40
50
60
70
80
StationaryEnergy
Transport Fugitive Emissions
Industrial Processes and Product Use
Agriculture Waste Land Use,Land Use Change,
and Forestry
-10
-20
2000 2015
6 / AUSTRALIAN NATIONAL GREENHOUSE ACCOUNTS State and Territory Greenhouse Gas Inventories, 2015
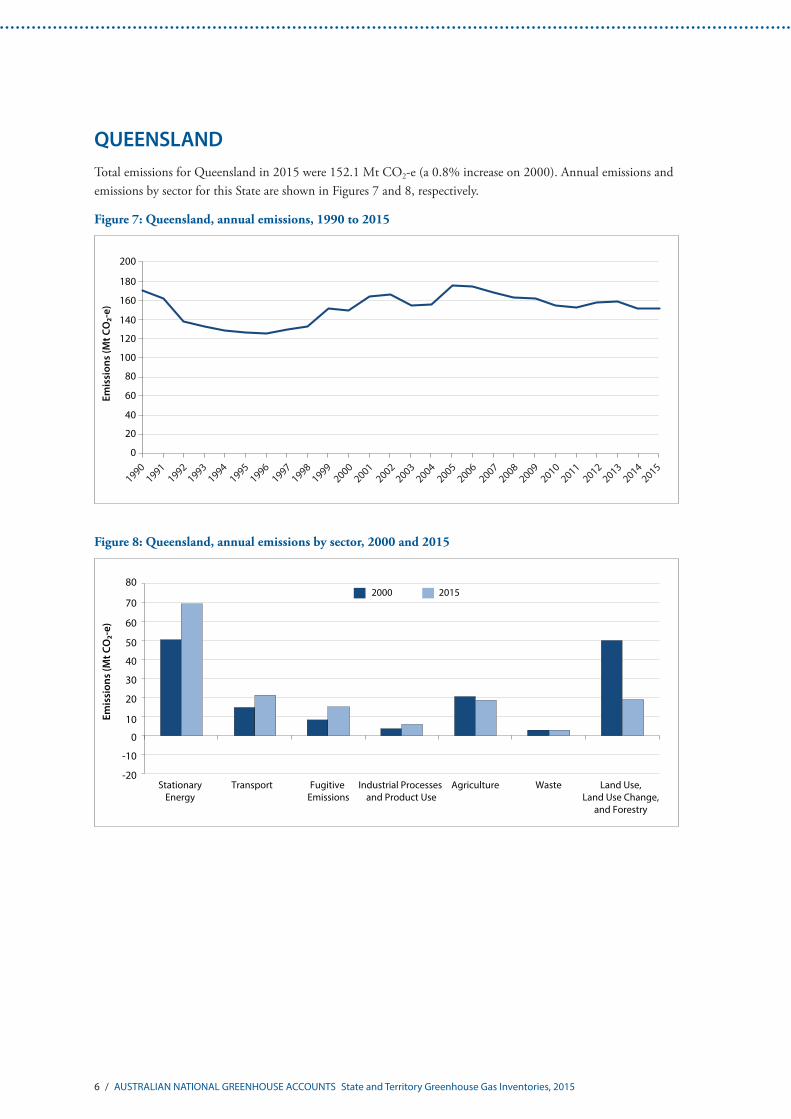
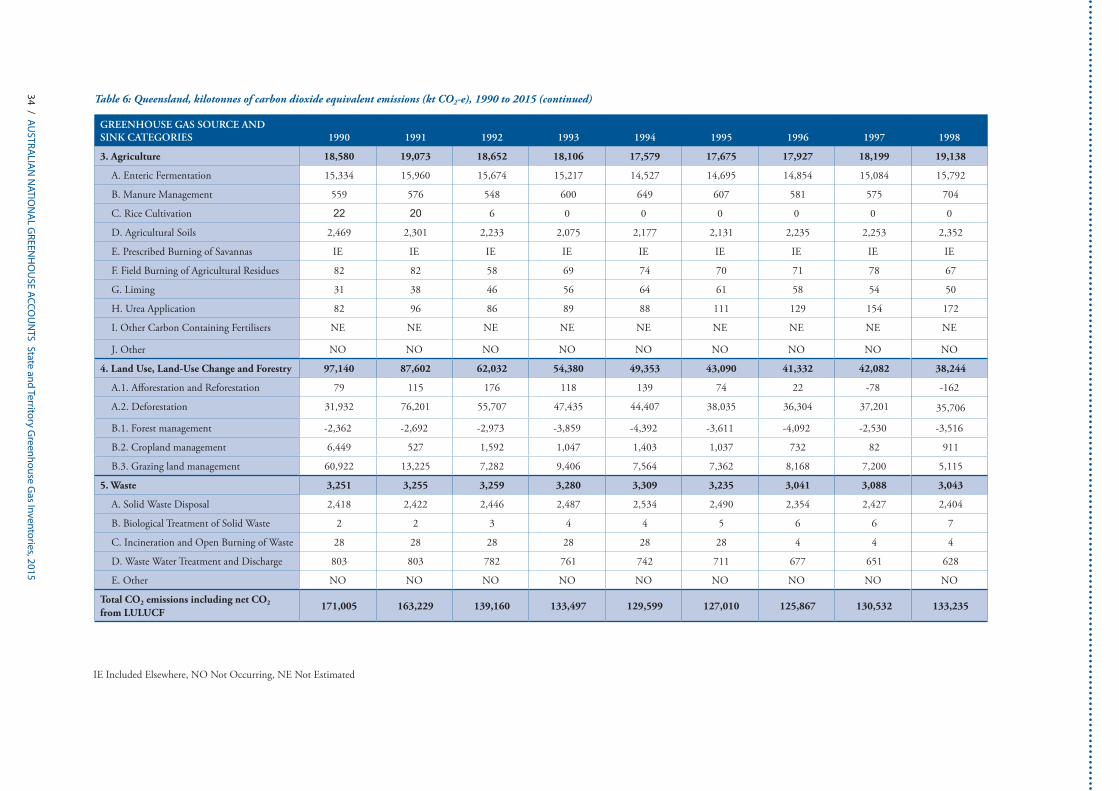
QUEENSLANDTotal emissions for Queensland in 2015 were 152.1 Mt CO2-e (a 0.8% increase on 2000). Annual emissions and emissions by sector for this State are shown in Figures 7 and 8, respectively.
Figure 7: Queensland, annual emissions, 1990 to 2015
Figure 8: Queensland, annual emissions by sector, 2000 and 2015
0
20
40
60
80
100
120
140
160
180
200
19901991
19921993
19941995
19961997
19981999
20002001
20022003
20042005
20062007
20082009
20102011
20122013
20142015
0
10
20
30
40
50
60
70
80
StationaryEnergy
Transport Fugitive Emissions
Industrial Processes and Product Use
Agriculture Waste Land Use,Land Use Change,
and Forestry
-10
-20
2000 2015
AUSTRALIAN NATIONAL GREENHOUSE ACCOUNTS State and Territory Greenhouse Gas Inventories, 2015 / 7
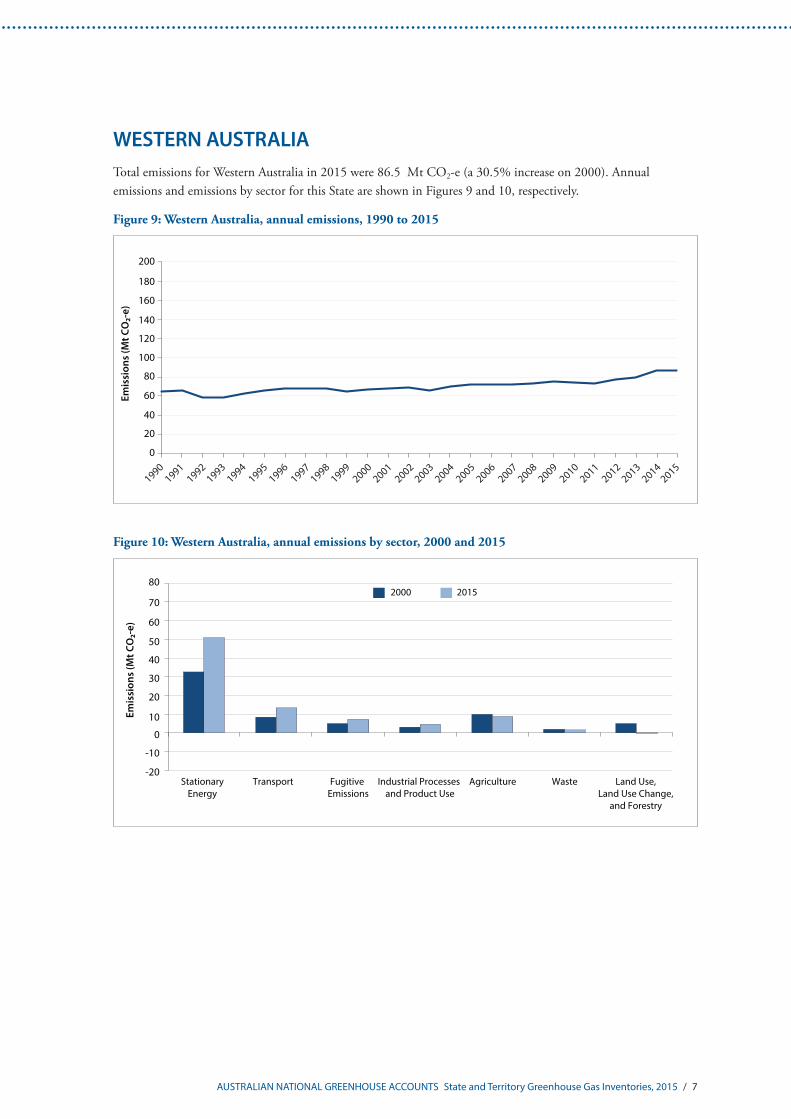
WESTERN AUSTRALIA Total emissions for Western Australia in 2015 were 86.5 Mt CO2-e (a 30.5% increase on 2000). Annual emissions and emissions by sector for this State are shown in Figures 9 and 10, respectively.
Figure 9: Western Australia, annual emissions, 1990 to 2015
Figure 10: Western Australia, annual emissions by sector, 2000 and 2015
0
20
40
60
80
100
120
140
160
180
200
19901991
19921993
19941995
19961997
19981999
20002001
20022003
20042005
20062007
20082009
20102011
20122013
20142015
0
10
20
30
40
50
60
70
80
StationaryEnergy
Transport Fugitive Emissions
Industrial Processes and Product Use
Agriculture Waste Land Use,Land Use Change,
and Forestry
-10
-20
2000 2015
8 / AUSTRALIAN NATIONAL GREENHOUSE ACCOUNTS State and Territory Greenhouse Gas Inventories, 2015
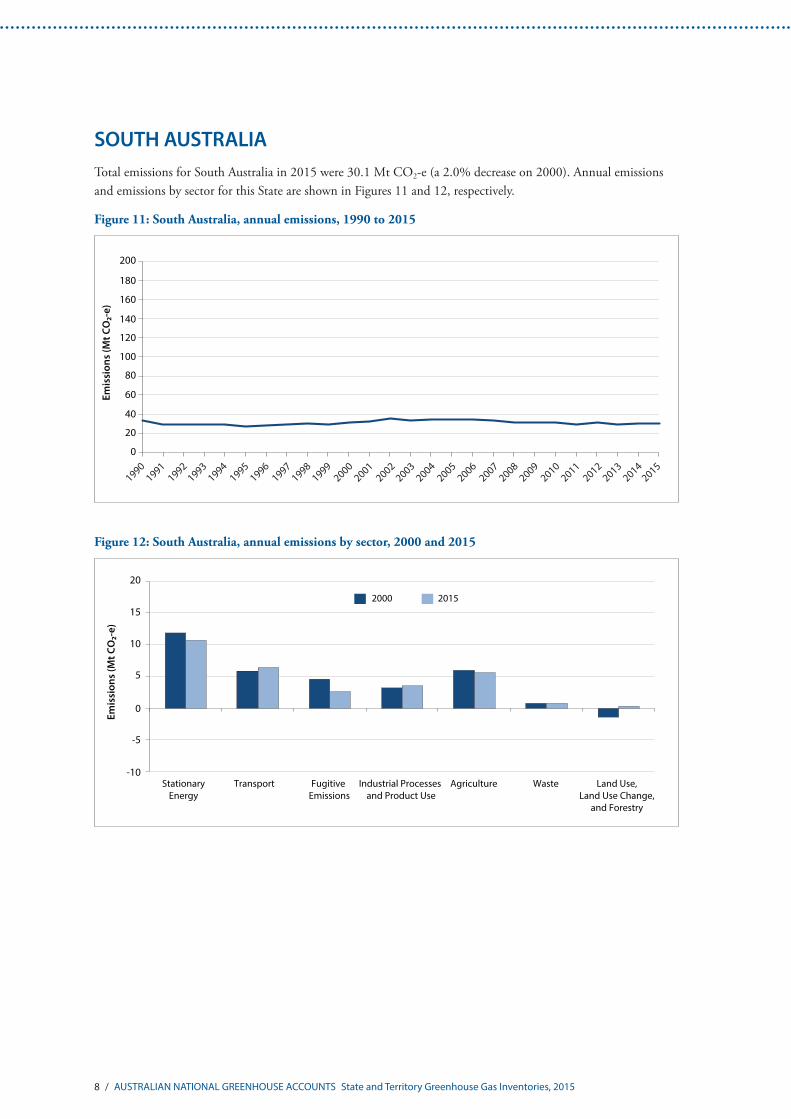
SOUTH AUSTRALIATotal emissions for South Australia in 2015 were 30.1 Mt CO2-e (a 2.0% decrease on 2000). Annual emissions and emissions by sector for this State are shown in Figures 11 and 12, respectively.
Figure 11: South Australia, annual emissions, 1990 to 2015
Figure 12: South Australia, annual emissions by sector, 2000 and 2015
0
20
40
60
80
100
120
140
160
180
200
19901991
19921993
19941995
19961997
19981999
20002001
20022003
20042005
20062007
20082009
20102011
20122013
20142015
-5
0
5
10
15
20
StationaryEnergy
Transport Fugitive Emissions
Industrial Processes and Product Use
Agriculture Waste Land Use,Land Use Change,
and Forestry
-10
2000 2015
AUSTRALIAN NATIONAL GREENHOUSE ACCOUNTS State and Territory Greenhouse Gas Inventories, 2015 / 9
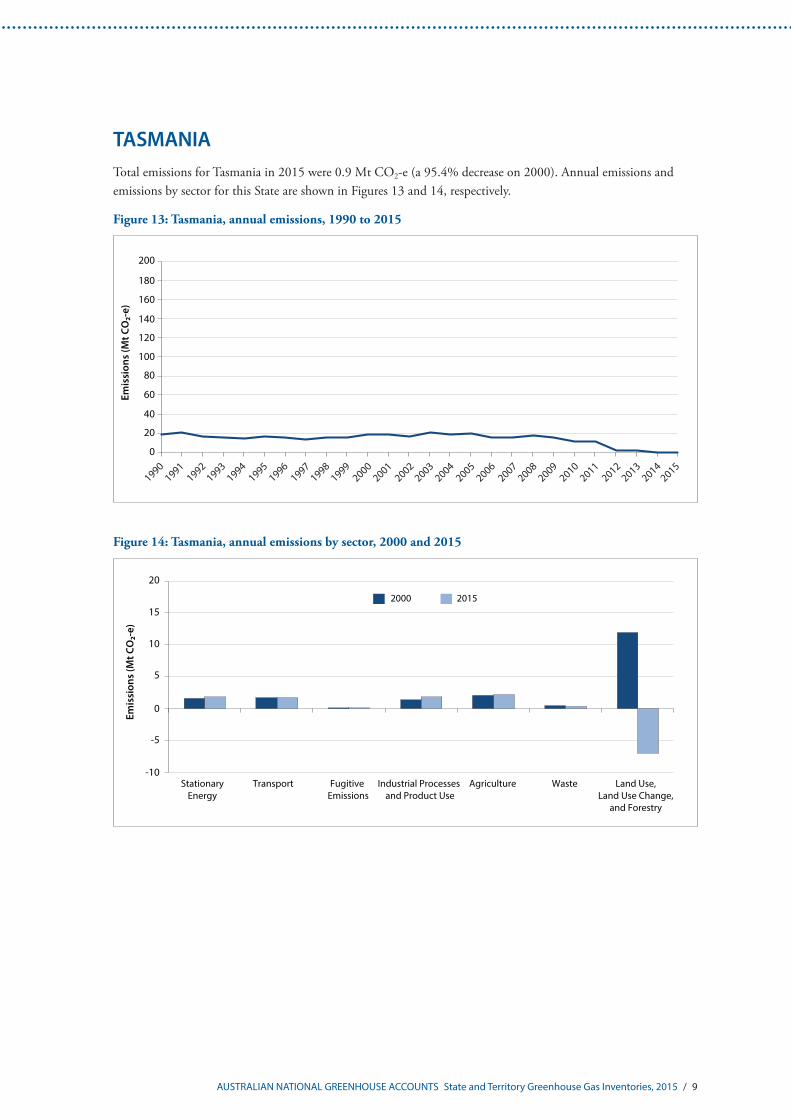
TASMANIATotal emissions for Tasmania in 2015 were 0.9 Mt CO2-e (a 95.4% decrease on 2000). Annual emissions and emissions by sector for this State are shown in Figures 13 and 14, respectively.
Figure 13: Tasmania, annual emissions, 1990 to 2015
Figure 14: Tasmania, annual emissions by sector, 2000 and 2015
0
20
40
60
80
100
120
140
160
180
200
19901991
19921993
19941995
19961997
19981999
20002001
20022003
20042005
20062007
20082009
20102011
20122013
20142015
-5
0
5
10
15
20
StationaryEnergy
Transport Fugitive Emissions
Industrial Processes and Product Use
Agriculture Waste Land Use,Land Use Change,
and Forestry
-10
2000 2015
10 / AUSTRALIAN NATIONAL GREENHOUSE ACCOUNTS State and Territory Greenhouse Gas Inventories, 2015
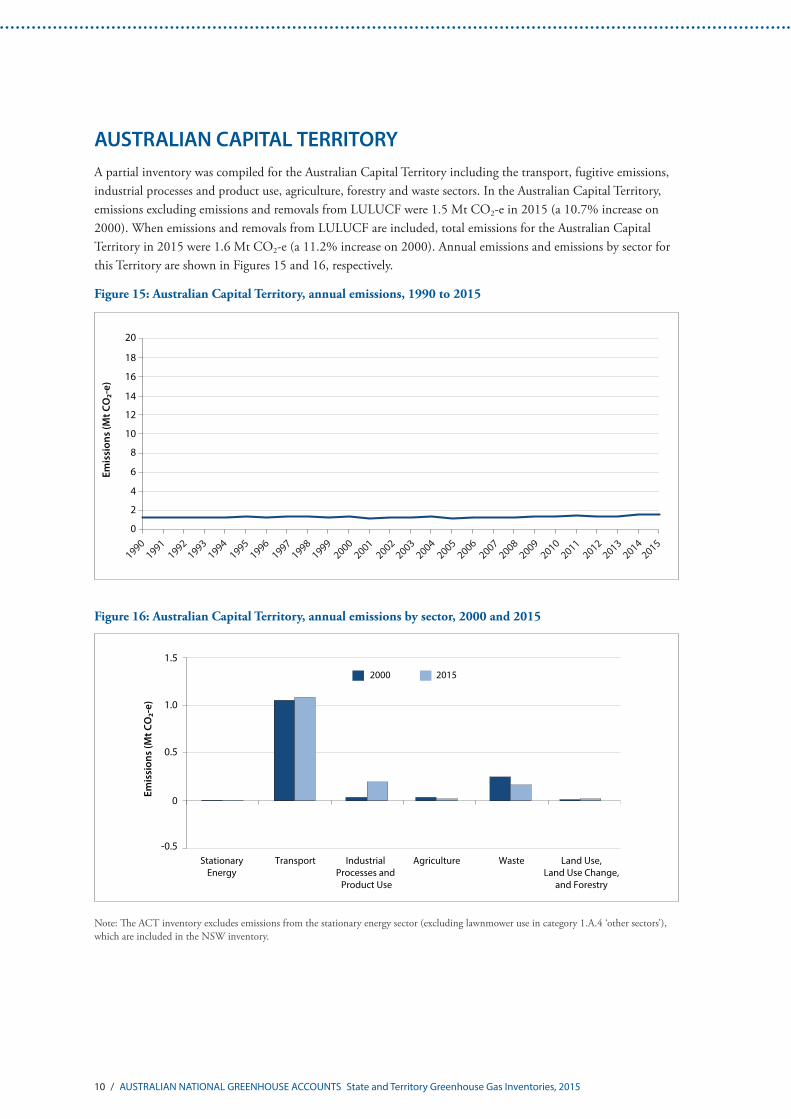
AUSTRALIAN CAPITAL TERRITORYA partial inventory was compiled for the Australian Capital Territory including the transport, fugitive emissions, industrial processes and product use, agriculture, forestry and waste sectors. In the Australian Capital Territory, emissions excluding emissions and removals from LULUCF were 1.5 Mt CO2-e in 2015 (a 10.7% increase on 2000). When emissions and removals from LULUCF are included, total emissions for the Australian Capital Territory in 2015 were 1.6 Mt CO2-e (a 11.2% increase on 2000). Annual emissions and emissions by sector for this Territory are shown in Figures 15 and 16, respectively.
Figure 15: Australian Capital Territory, annual emissions, 1990 to 2015
Figure 16: Australian Capital Territory, annual emissions by sector, 2000 and 2015
Note: The ACT inventory excludes emissions from the stationary energy sector (excluding lawnmower use in category 1.A.4 ‘other sectors’), which are included in the NSW inventory.
0
2
4
6
8
10
12
14
16
18
20
19901991
19921993
19941995
19961997
19981999
20002001
20022003
20042005
20062007
20082009
20102011
20122013
20142015
-0.5
0
0.5
1.0
1.5
StationaryEnergy
Transport Industrial Processes and
Product Use
Agriculture Waste Land Use,Land Use Change,
and Forestry
2000 2015
AUSTRALIAN NATIONAL GREENHOUSE ACCOUNTS State and Territory Greenhouse Gas Inventories, 2015 / 11
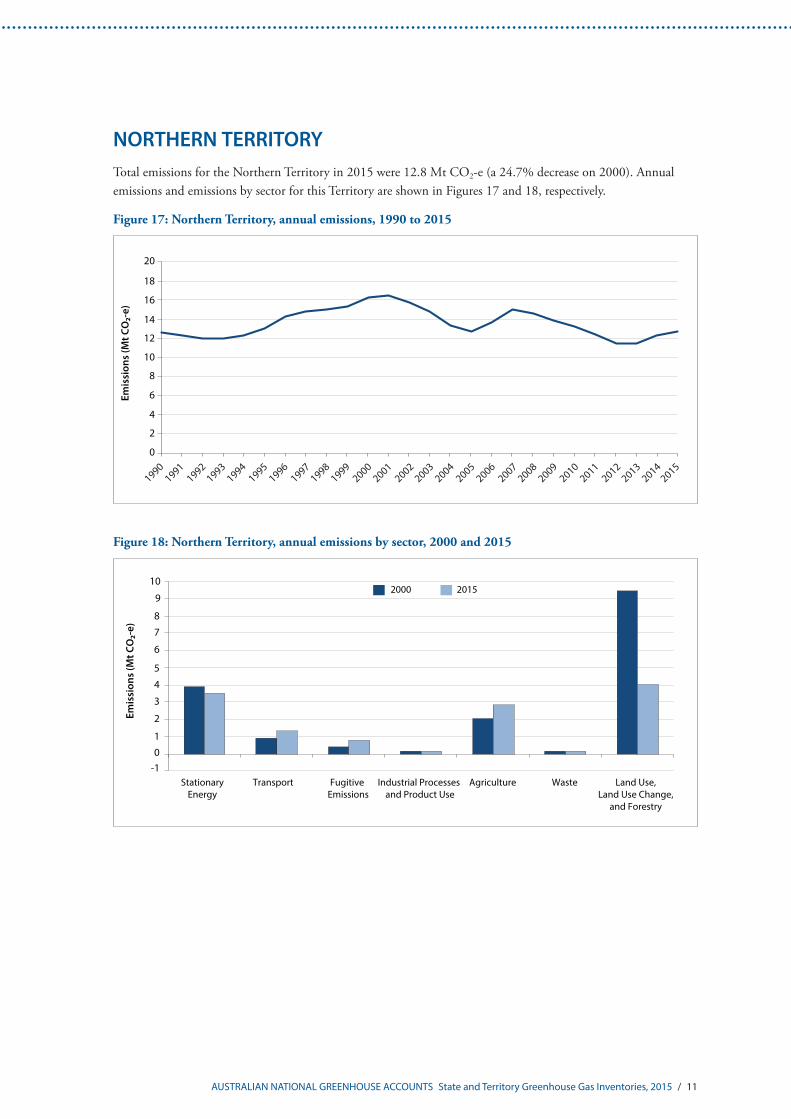
NORTHERN TERRITORYTotal emissions for the Northern Territory in 2015 were 12.8 Mt CO2-e (a 24.7% decrease on 2000). Annual emissions and emissions by sector for this Territory are shown in Figures 17 and 18, respectively.
Figure 17: Northern Territory, annual emissions, 1990 to 2015
Figure 18: Northern Territory, annual emissions by sector, 2000 and 2015
0
2
4
6
8
10
12
14
16
18
20
19901991
19921993
19941995
19961997
19981999
20002001
20022003
20042005
20062007
20082009
20102011
20122013
20142015
-101
2
3
StationaryEnergy
Transport Fugitive Emissions
Industrial Processes and Product Use
Agriculture Waste Land Use,Land Use Change,
and Forestry
2000 2015
4
5
6
7
8
9
10
12 / AUSTRALIAN NATIONAL GREENHOUSE ACCOUNTS State and Territory Greenhouse Gas Inventories, 2015
Appendix 1 – Notes
Australian National Greenhouse Accounts
Australia’s National Greenhouse Accounts 2015 are comprised of the:
• Quarterly Update of Australia’s National Greenhouse Gas Inventory – December Quarter 2015;
• State and Territory Greenhouse Gas Inventories 2015;
• National Inventory by Economic Sector 2015; and
• National Inventory Report 2015 prepared under the reporting provisions applicable to the United Nations Framework Convention on Climate Change (UNFCCC) and the Kyoto Protocol (KP).
These publications are available online: http://www.environment.gov.au/climate-change/greenhouse-gas-measurement/tracking-emissions
The emission estimates for these inventories are prepared in accordance with international guidelines and are subject to annual review by international experts. The methodologies for the estimation of emissions are documented in Australia’s National Inventory Report.
Kyoto Accounting
‘Kyoto accounting’ is relevant to Australia’s target under the second commitment period (CP2) of the Kyoto Protocol (KP), which is yet to enter into force. This report covers 2015, the third year of CP2.
Under the Kyoto Protocol, the national inventory must report net emissions from the energy, industrial processes and product use, agriculture, and waste sectors. The inventory must also include the mandatory Land Use, Land Use Change and Forestry (LULUCF) activities of afforestation/reforestation, deforestation, and forest management. In addition to these, the voluntary LULUCF activities of cropland management and grazing land management have also been included in Australia’s national inventory for CP2.
The energy sector is made up of many different sources, including:
Stationary energy is mainly greenhouse gas emissions from the production of electricity and other direct combustion of fossil fuels in industries such as manufacturing and construction.
Transport comprises greenhouse gas emissions from air, road, rail and shipping transportation.
Fugitive emissions comprises the greenhouse gas emissions from the extraction and distribution of coal, oil and natural gas.
The Industrial processes and product use sector comprises the direct greenhouse gas emissions from the chemical and or physical transformation of materials and the consumption of synthetic greenhouse gases.
The Agriculture sector comprises the emissions of methane and nitrous oxide only (that is, non-carbon dioxide gases) from livestock, crops, and agricultural and forest soils. From the 2017 submission, which covers emissions estimates to 2015, emissions from agricultural burning including the prescribed burning of savannas have been reallocated to grazing land management (a sub-sector of LULUCF).
The Waste sector comprises the greenhouse gas emissions from the disposal of solid waste to land, the treatment of domestic and industrial wastewater, the incineration of municipal and clinical waste and the biological treatment of solid waste.
AUSTRALIAN NATIONAL GREENHOUSE ACCOUNTS State and Territory Greenhouse Gas Inventories, 2015 / 13
The LULUCF sector is made up of several sources, including:
Deforestation comprises emissions and removals from the direct human-induced conversion of forest to alternative land uses since 1 January 1990.
Afforestation/reforestation comprises emissions and removals (that is sinks) from forests established since 1990 on land that was clear of forest on 31 December 1989. Forests may be established by planting events for commercial timber or for other reasons, known as ‘environmental plantings’, or by regeneration from natural seed sources on lands regulated for the protection of forests.
Forest management comprises emissions and removals from those forests managed under a system of practices designed to support commercial timber production such as harvest or silvicultural practices or practices designed to implement specific sink enhancement activities. This includes multiple-use public forests; plantations established prior to 1990; and privately managed forest land where defined harvest, silvicultural and sink enhancement activities have been observed to occur.
Cropland management comprises emissions and removals from land that is used for continuous cropping, lands managed as crop-pasture rotations and forest land converted to cropland prior to 1990. Perennial crops including orchards and vineyards are included under cropland management.
Grazing land management comprises emissions and removals from lands including grasslands, forests in northern Australia monitored for ‘savanna burning’ and forests established by regeneration from natural seed sources on lands not regulated for the protection of forests (and which are not classified as afforestation/reforestation).
Revegetation includes the establishment of vegetation that covers a minimum area of 0.05 hectares and does not meet the definitions of afforestation/reforestation. The activity is restricted to settlements and wetlands.
The 1990 estimate presented here for LULUCF, is the ‘base year’ estimate used for the initial estimate of Australia’s CP2 assigned amount or carbon budget.
Australian Greenhouse Emissions Information System
The Australian Greenhouse Emissions Information System (AGEIS) provides on-line public access to emission estimates, background supporting data and time-series analyses that support the National Greenhouse Accounts. The dynamic interface allows users to select emissions data of interest and download the results in a format which allows for further analysis of the data on their own desktop. The AGEIS can be accessed online: http://www.environment.gov.au/climate-change/greenhouse-gas-measurement/ageis
International Guidelines
The State and Territory Greenhouse Gas Inventories 2015 has been prepared in accordance with the international guidelines agreed for use at the Conference of the Parties (COP) of the United Nations Framework Convention on Climate Change (UNFCCC) in Warsaw 2013. These include the Intergovernmental Panel on Climate Change (IPCC) Guidelines for National Greenhouse Gas Inventories (2006), and the Revised Supplementary Methods and Good Practice Guidance Arising from the Kyoto Protocol (2013).
14 / AUSTRALIAN NATIONAL GREENHOUSE ACCOUNTS State and Territory Greenhouse Gas Inventories, 2015
Greenhouse Gases
Consistent with the requirements of the Kyoto Protocol, this report covers sources of greenhouse gas emissions and removals by sinks resulting from human (anthropogenic) activities for the major greenhouse gases – carbon dioxide (CO2), methane (CH4), nitrous oxide (N2O), perfluorocarbons (PFCs), hydrofluorocarbons (HFCs) and sulphur hexafluoride (SF6). In accordance with IPCC guidelines, Australia’s emissions of the greenhouse gas nitrogen trifluoride (NF3) are considered negligible and are not estimated.
GWPs have been used for each of the major greenhouse gases to convert them to carbon dioxide equivalents (CO2-e). As greenhouse gases vary in their radiative activity and in their atmospheric residence time, converting emissions into CO2-e allows the integrated effect of emissions of the various gases to be compared. The GWPs used in this Report were the 100-year GWPs contained in the 2007 IPCC Fourth Assessment Report (IPCC 2007), by international agreement.
External Territories
The geographical coverage of the State and Territories Greenhouse Gas Inventories also includes emissions from Norfolk Island, Christmas Island, Cocos (Keeling) Islands, and Heard and McDonald Islands. Australia’s Antarctic Program operations in the Antarctic are also covered. The following external territories are covered but are included in the respective state statistical territories by the Australian Bureau of Statistics: Coral Sea Islands (Queensland), and Ashmore and Cartier Islands (Northern Territory).
Uncertainty Analysis
Uncertainty is inherent within any kind of estimation. Uncertainty assessments at a sectoral level are reported in the National Inventory Report. Overall, at the national inventory level including LULUCF, the uncertainty of the emissions estimates level has been assessed at 3.9%. While no quantitative estimates have been produced, the Department assesses that the uncertainties for emission estimates for these inventories, particularly the smaller States and Territories, will be somewhat higher than for the national inventory.
Ongoing Improvements of estimates
Due to refinements to the emissions estimation methodologies, which have been applied to all years for which emissions have been estimated, the estimates presented in this document supersede all previously published estimates for the State and Territories Greenhouse Gas Inventories.
Method improvements that have resulted in recalculations to the national inventory, and as a result each state and territory inventory.
Australian National Audit Office (ANAO) Performance Audit: 2016-17
The ANAO is an independent office established under the Auditor-General Act 1997. Its purpose is to drive accountability and transparency in the Australian Government sector through quality evidence based audit services and independent reporting to Parliament, the Executive and the public, with the result of improving public sector performance.
The ANAO conducts performance audits of government agencies operating under the Standard on Assurance Engagements ASAE 3500 Performance Engagements issued by the Australian Auditing and Assurance Standards Board (AUASB). ANAO reports are tabled in the Australian Parliament and subject to review by the Joint Committee of Public Accounts and Audit (JCPAA).
AUSTRALIAN NATIONAL GREENHOUSE ACCOUNTS State and Territory Greenhouse Gas Inventories, 2015 / 15
The ANAO undertook a performance audit of the national inventory over nine months (August 2016 to April 2017). Its objective was to assess the effectiveness of arrangements for the preparation and reporting of Australia’s greenhouse gas emissions estimates in the National Inventory Report 2014 (revised) for the year 2014.
The Department postponed finalisation of this Report in order to take into account findings from the ANAO performance audit fieldwork. Publication of the ANAO report is forthcoming.
Land sector
The estimation of net emissions from Forest land converted to grasslands and Land converted to forest reflect new, advanced methods for forest and harvest detection, the estimation of mature forest biomass and the calibration of the Full Carbon Accounting Model (FullCAM) model for improved forest carbon dynamics using the latest available data and science from the Commonwealth Scientific and Industrial Research Organisation (CSIRO).
The net result is a significant advance in the level of confidence in the estimates presented.
Changes in the estimates of the area of clearing in this submission relate almost entirely to a process of reclassification of estimates from the area of sparse woody vegetation loss previously reported under Grasslands remaining grasslands to the area of forest re-clearing for pasture maintenance now reported under Forest converted to grassland. It does not reflect an omission from previous inventories.
The implications of this change for net emissions are minor since the areas of vegetation growth have also been re-classified from sparse woody to forest regrowth generating increased estimates of sequestration and which, over the long run, tend to cancel out any emission effects.
Oil and gas fugitives sector
New methods have also been introduced for the estimation of fugitive methane and carbon dioxide emissions from the gas supply chain reflecting empirical studies of Australian gas fields conducted by the CSIRO and international developments. The changes have caused reductions in estimates of emissions from fracking in coal seam gas fields and increases in emissions from other parts of the supply chain including from produced water at coal seam gas wellheads, gathering and boosting stations, gas processing plants, storage sites and from Liquid Natural Gas terminals.
AUSTRA
LIAN
NATIO
NA
L GREEN
HO
USE ACCO
UN
TS State and Territory Greenhouse G
as Inventories, 2015 / 17
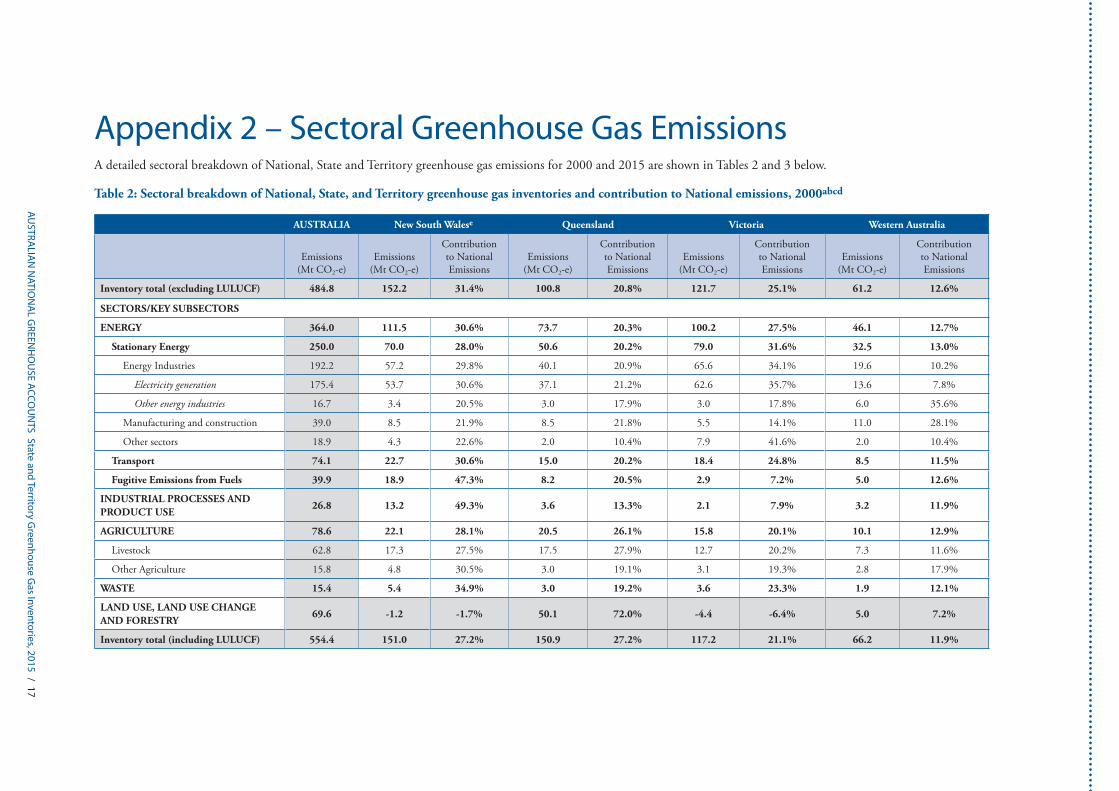
Appendix 2 – Sectoral Greenhouse Gas EmissionsA detailed sectoral breakdown of National, State and Territory greenhouse gas emissions for 2000 and 2015 are shown in Tables 2 and 3 below.
Table 2: Sectoral breakdown of National, State, and Territory greenhouse gas inventories and contribution to National emissions, 2000abcd
AUSTRALIA New South Walese Queensland Victoria Western Australia
Emissions (Mt CO2-e)
Emissions (Mt CO2-e)
Contribution to National Emissions
Emissions (Mt CO2-e)
Contribution to National Emissions
Emissions (Mt CO2-e)
Contribution to National Emissions
Emissions (Mt CO2-e)
Contribution to National Emissions
Inventory total (excluding LULUCF) 484.8 152.2 31.4% 100.8 20.8% 121.7 25.1% 61.2 12.6%
SECTORS/KEY SUBSECTORS
ENERGY 364.0 111.5 30.6% 73.7 20.3% 100.2 27.5% 46.1 12.7%
Stationary Energy 250.0 70.0 28.0% 50.6 20.2% 79.0 31.6% 32.5 13.0%
Energy Industries 192.2 57.2 29.8% 40.1 20.9% 65.6 34.1% 19.6 10.2%
Electricity generation 175.4 53.7 30.6% 37.1 21.2% 62.6 35.7% 13.6 7.8%
Other energy industries 16.7 3.4 20.5% 3.0 17.9% 3.0 17.8% 6.0 35.6%
Manufacturing and construction 39.0 8.5 21.9% 8.5 21.8% 5.5 14.1% 11.0 28.1%
Other sectors 18.9 4.3 22.6% 2.0 10.4% 7.9 41.6% 2.0 10.4%
Transport 74.1 22.7 30.6% 15.0 20.2% 18.4 24.8% 8.5 11.5%
Fugitive Emissions from Fuels 39.9 18.9 47.3% 8.2 20.5% 2.9 7.2% 5.0 12.6%
INDUSTRIAL PROCESSES AND PRODUCT USE
26.8 13.2 49.3% 3.6 13.3% 2.1 7.9% 3.2 11.9%
AGRICULTURE 78.6 22.1 28.1% 20.5 26.1% 15.8 20.1% 10.1 12.9%
Livestock 62.8 17.3 27.5% 17.5 27.9% 12.7 20.2% 7.3 11.6%
Other Agriculture 15.8 4.8 30.5% 3.0 19.1% 3.1 19.3% 2.8 17.9%
WASTE 15.4 5.4 34.9% 3.0 19.2% 3.6 23.3% 1.9 12.1%
LAND USE, LAND USE CHANGE AND FORESTRY
69.6 -1.2 -1.7% 50.1 72.0% -4.4 -6.4% 5.0 7.2%
Inventory total (including LULUCF) 554.4 151.0 27.2% 150.9 27.2% 117.2 21.1% 66.2 11.9%
18 / AUSTRA
LIAN
NATIO
NA
L GREEN
HO
USE ACCO
UN
TS State and Territory Greenhouse G
as Inventories, 2015
AUSTRALIA South Australia Northern Territory Tasmania Australian Capital Territorye
(partial inventory)
Emissions (Mt CO2-e)
Emissions (Mt CO2-e)
Contribution to National Emissions
Emissions (Mt CO2-e)
Contribution to National Emissions
Emissions (Mt CO2-e)
Contribution to National Emissions
Emissions (Mt CO2-e)
Contribution to National Emissions
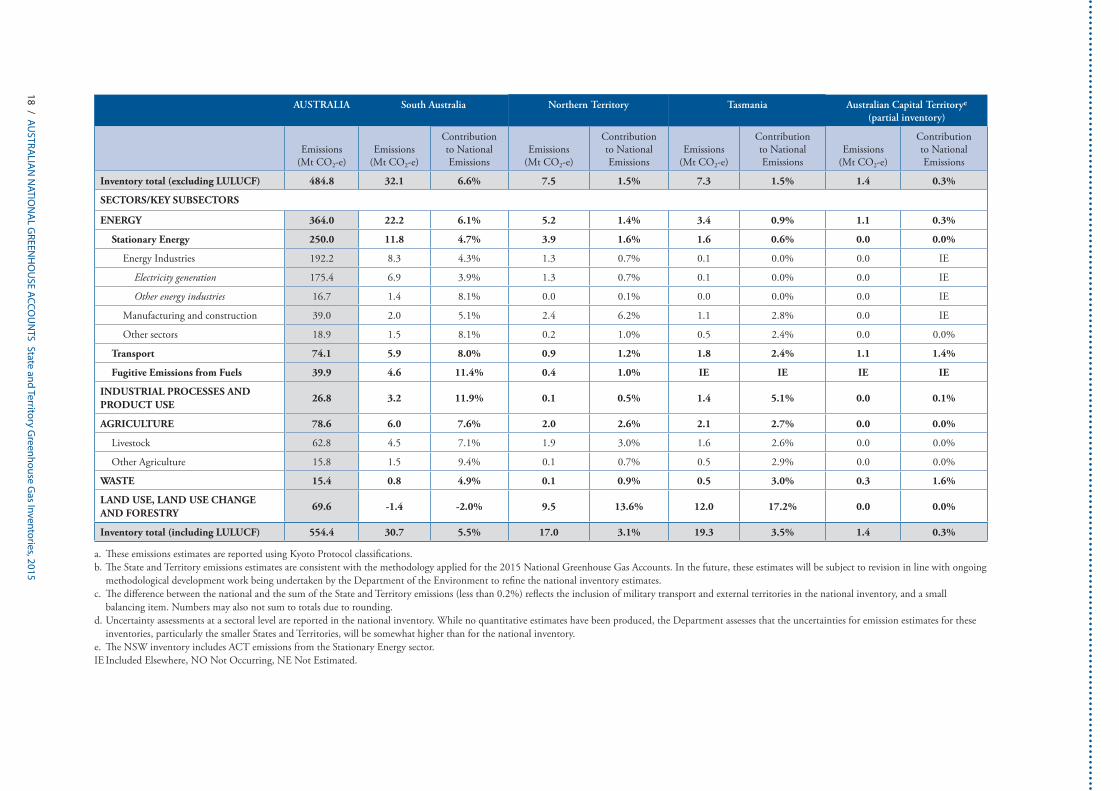
Inventory total (excluding LULUCF) 484.8 32.1 6.6% 7.5 1.5% 7.3 1.5% 1.4 0.3%
SECTORS/KEY SUBSECTORS
ENERGY 364.0 22.2 6.1% 5.2 1.4% 3.4 0.9% 1.1 0.3%
Stationary Energy 250.0 11.8 4.7% 3.9 1.6% 1.6 0.6% 0.0 0.0%
Energy Industries 192.2 8.3 4.3% 1.3 0.7% 0.1 0.0% 0.0 IE
Electricity generation 175.4 6.9 3.9% 1.3 0.7% 0.1 0.0% 0.0 IE
Other energy industries 16.7 1.4 8.1% 0.0 0.1% 0.0 0.0% 0.0 IE
Manufacturing and construction 39.0 2.0 5.1% 2.4 6.2% 1.1 2.8% 0.0 IE
Other sectors 18.9 1.5 8.1% 0.2 1.0% 0.5 2.4% 0.0 0.0%
Transport 74.1 5.9 8.0% 0.9 1.2% 1.8 2.4% 1.1 1.4%
Fugitive Emissions from Fuels 39.9 4.6 11.4% 0.4 1.0% IE IE IE IE
INDUSTRIAL PROCESSES AND PRODUCT USE
26.8 3.2 11.9% 0.1 0.5% 1.4 5.1% 0.0 0.1%
AGRICULTURE 78.6 6.0 7.6% 2.0 2.6% 2.1 2.7% 0.0 0.0%
Livestock 62.8 4.5 7.1% 1.9 3.0% 1.6 2.6% 0.0 0.0%
Other Agriculture 15.8 1.5 9.4% 0.1 0.7% 0.5 2.9% 0.0 0.0%
WASTE 15.4 0.8 4.9% 0.1 0.9% 0.5 3.0% 0.3 1.6%
LAND USE, LAND USE CHANGE AND FORESTRY
69.6 -1.4 -2.0% 9.5 13.6% 12.0 17.2% 0.0 0.0%
Inventory total (including LULUCF) 554.4 30.7 5.5% 17.0 3.1% 19.3 3.5% 1.4 0.3%
a. These emissions estimates are reported using Kyoto Protocol classifications.b. The State and Territory emissions estimates are consistent with the methodology applied for the 2015 National Greenhouse Gas Accounts. In the future, these estimates will be subject to revision in line with ongoing
methodological development work being undertaken by the Department of the Environment to refine the national inventory estimates. c. The difference between the national and the sum of the State and Territory emissions (less than 0.2%) reflects the inclusion of military transport and external territories in the national inventory, and a small
balancing item. Numbers may also not sum to totals due to rounding.d. Uncertainty assessments at a sectoral level are reported in the national inventory. While no quantitative estimates have been produced, the Department assesses that the uncertainties for emission estimates for these
inventories, particularly the smaller States and Territories, will be somewhat higher than for the national inventory. e. The NSW inventory includes ACT emissions from the Stationary Energy sector.IE Included Elsewhere, NO Not Occurring, NE Not Estimated.
AUSTRA
LIAN
NATIO
NA
L GREEN
HO
USE ACCO
UN
TS State and Territory Greenhouse G
as Inventories, 2015 / 19
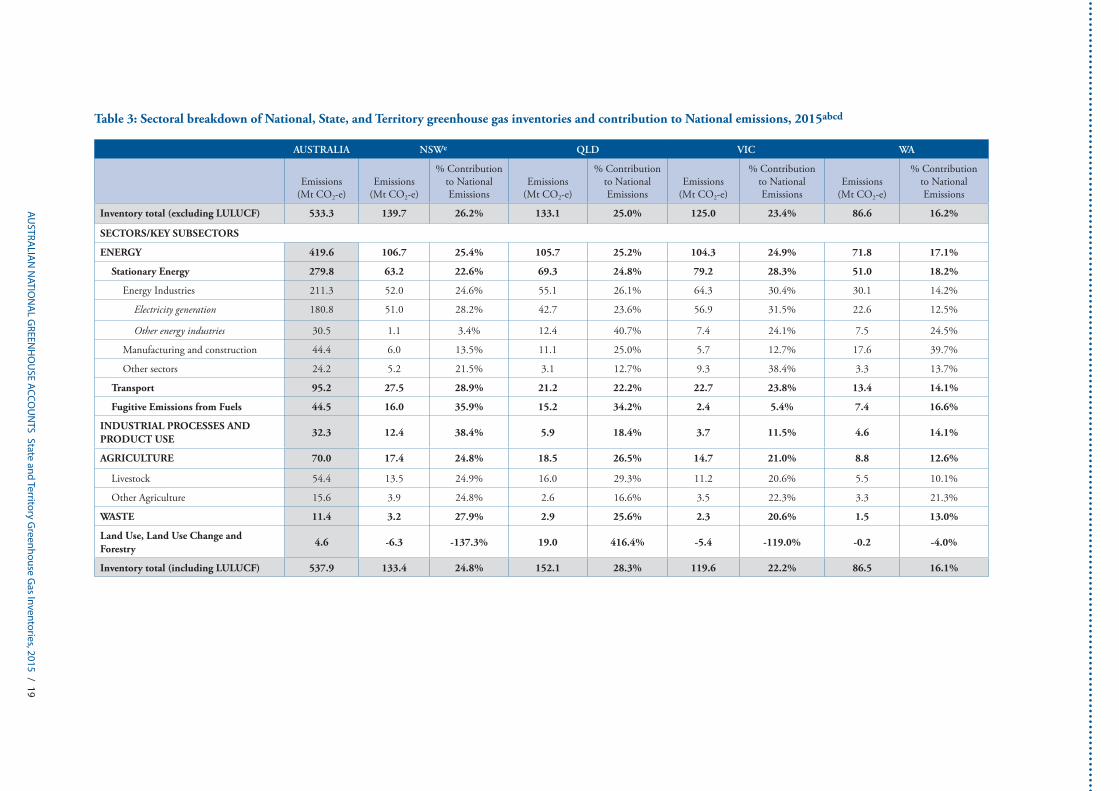
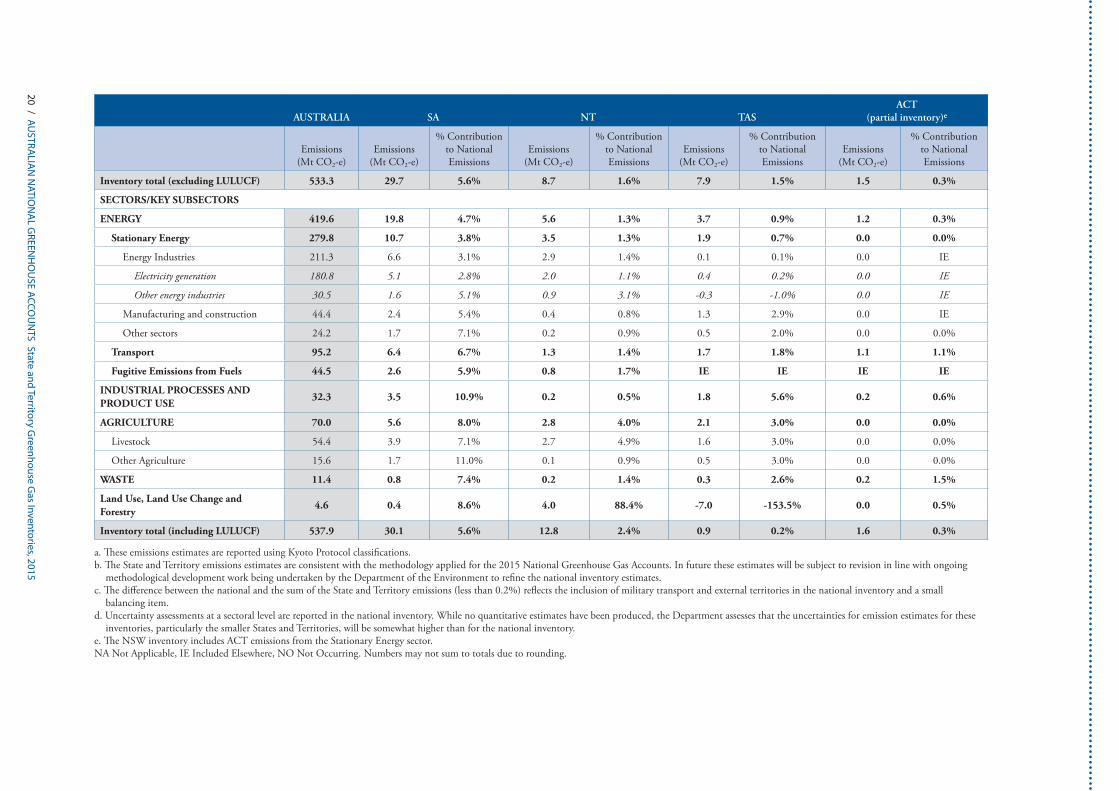
Table 3: Sectoral breakdown of National, State, and Territory greenhouse gas inventories and contribution to National emissions, 2015abcd
AUSTRALIA NSWe QLD VIC WA
Emissions (Mt CO2-e)
Emissions (Mt CO2-e)
% Contribution to National Emissions
Emissions (Mt CO2-e)
% Contribution to National Emissions
Emissions (Mt CO2-e)
% Contribution to National Emissions
Emissions (Mt CO2-e)
% Contribution to National Emissions
Inventory total (excluding LULUCF) 533.3 139.7 26.2% 133.1 25.0% 125.0 23.4% 86.6 16.2%
SECTORS/KEY SUBSECTORS
ENERGY 419.6 106.7 25.4% 105.7 25.2% 104.3 24.9% 71.8 17.1%
Stationary Energy 279.8 63.2 22.6% 69.3 24.8% 79.2 28.3% 51.0 18.2%
Energy Industries 211.3 52.0 24.6% 55.1 26.1% 64.3 30.4% 30.1 14.2%
Electricity generation 180.8 51.0 28.2% 42.7 23.6% 56.9 31.5% 22.6 12.5%
Other energy industries 30.5 1.1 3.4% 12.4 40.7% 7.4 24.1% 7.5 24.5%
Manufacturing and construction 44.4 6.0 13.5% 11.1 25.0% 5.7 12.7% 17.6 39.7%
Other sectors 24.2 5.2 21.5% 3.1 12.7% 9.3 38.4% 3.3 13.7%
Transport 95.2 27.5 28.9% 21.2 22.2% 22.7 23.8% 13.4 14.1%
Fugitive Emissions from Fuels 44.5 16.0 35.9% 15.2 34.2% 2.4 5.4% 7.4 16.6%
INDUSTRIAL PROCESSES AND PRODUCT USE
32.3 12.4 38.4% 5.9 18.4% 3.7 11.5% 4.6 14.1%
AGRICULTURE 70.0 17.4 24.8% 18.5 26.5% 14.7 21.0% 8.8 12.6%
Livestock 54.4 13.5 24.9% 16.0 29.3% 11.2 20.6% 5.5 10.1%
Other Agriculture 15.6 3.9 24.8% 2.6 16.6% 3.5 22.3% 3.3 21.3%
WASTE 11.4 3.2 27.9% 2.9 25.6% 2.3 20.6% 1.5 13.0%
Land Use, Land Use Change and Forestry
4.6 -6.3 -137.3% 19.0 416.4% -5.4 -119.0% -0.2 -4.0%
Inventory total (including LULUCF) 537.9 133.4 24.8% 152.1 28.3% 119.6 22.2% 86.5 16.1%
20 / AUSTRA
LIAN
NATIO
NA
L GREEN
HO
USE ACCO
UN
TS State and Territory Greenhouse G
as Inventories, 2015
AUSTRALIA SA NT TASACT
(partial inventory)e
Emissions (Mt CO2-e)
Emissions (Mt CO2-e)
% Contribution to National Emissions
Emissions (Mt CO2-e)
% Contribution to National Emissions
Emissions (Mt CO2-e)
% Contribution to National Emissions
Emissions (Mt CO2-e)
% Contribution to National Emissions
Inventory total (excluding LULUCF) 533.3 29.7 5.6% 8.7 1.6% 7.9 1.5% 1.5 0.3%
SECTORS/KEY SUBSECTORS
ENERGY 419.6 19.8 4.7% 5.6 1.3% 3.7 0.9% 1.2 0.3%
Stationary Energy 279.8 10.7 3.8% 3.5 1.3% 1.9 0.7% 0.0 0.0%
Energy Industries 211.3 6.6 3.1% 2.9 1.4% 0.1 0.1% 0.0 IE
Electricity generation 180.8 5.1 2.8% 2.0 1.1% 0.4 0.2% 0.0 IE
Other energy industries 30.5 1.6 5.1% 0.9 3.1% -0.3 -1.0% 0.0 IE
Manufacturing and construction 44.4 2.4 5.4% 0.4 0.8% 1.3 2.9% 0.0 IE
Other sectors 24.2 1.7 7.1% 0.2 0.9% 0.5 2.0% 0.0 0.0%
Transport 95.2 6.4 6.7% 1.3 1.4% 1.7 1.8% 1.1 1.1%
Fugitive Emissions from Fuels 44.5 2.6 5.9% 0.8 1.7% IE IE IE IE
INDUSTRIAL PROCESSES AND PRODUCT USE
32.3 3.5 10.9% 0.2 0.5% 1.8 5.6% 0.2 0.6%
AGRICULTURE 70.0 5.6 8.0% 2.8 4.0% 2.1 3.0% 0.0 0.0%
Livestock 54.4 3.9 7.1% 2.7 4.9% 1.6 3.0% 0.0 0.0%
Other Agriculture 15.6 1.7 11.0% 0.1 0.9% 0.5 3.0% 0.0 0.0%
WASTE 11.4 0.8 7.4% 0.2 1.4% 0.3 2.6% 0.2 1.5%
Land Use, Land Use Change and Forestry
4.6 0.4 8.6% 4.0 88.4% -7.0 -153.5% 0.0 0.5%
Inventory total (including LULUCF) 537.9 30.1 5.6% 12.8 2.4% 0.9 0.2% 1.6 0.3%
a. These emissions estimates are reported using Kyoto Protocol classifications.b. The State and Territory emissions estimates are consistent with the methodology applied for the 2015 National Greenhouse Gas Accounts. In future these estimates will be subject to revision in line with ongoing
methodological development work being undertaken by the Department of the Environment to refine the national inventory estimates. c. The difference between the national and the sum of the State and Territory emissions (less than 0.2%) reflects the inclusion of military transport and external territories in the national inventory and a small
balancing item. d. Uncertainty assessments at a sectoral level are reported in the national inventory. While no quantitative estimates have been produced, the Department assesses that the uncertainties for emission estimates for these
inventories, particularly the smaller States and Territories, will be somewhat higher than for the national inventory. e. The NSW inventory includes ACT emissions from the Stationary Energy sector. NA Not Applicable, IE Included Elsewhere, NO Not Occurring. Numbers may not sum to totals due to rounding.
AUSTRA
LIAN
NATIO
NA
L GREEN
HO
USE ACCO
UN
TS State and Territory Greenhouse G
as Inventories, 2015 / 21
IE Included Elsewhere, NO Not Occurring, NE Not Estimated.
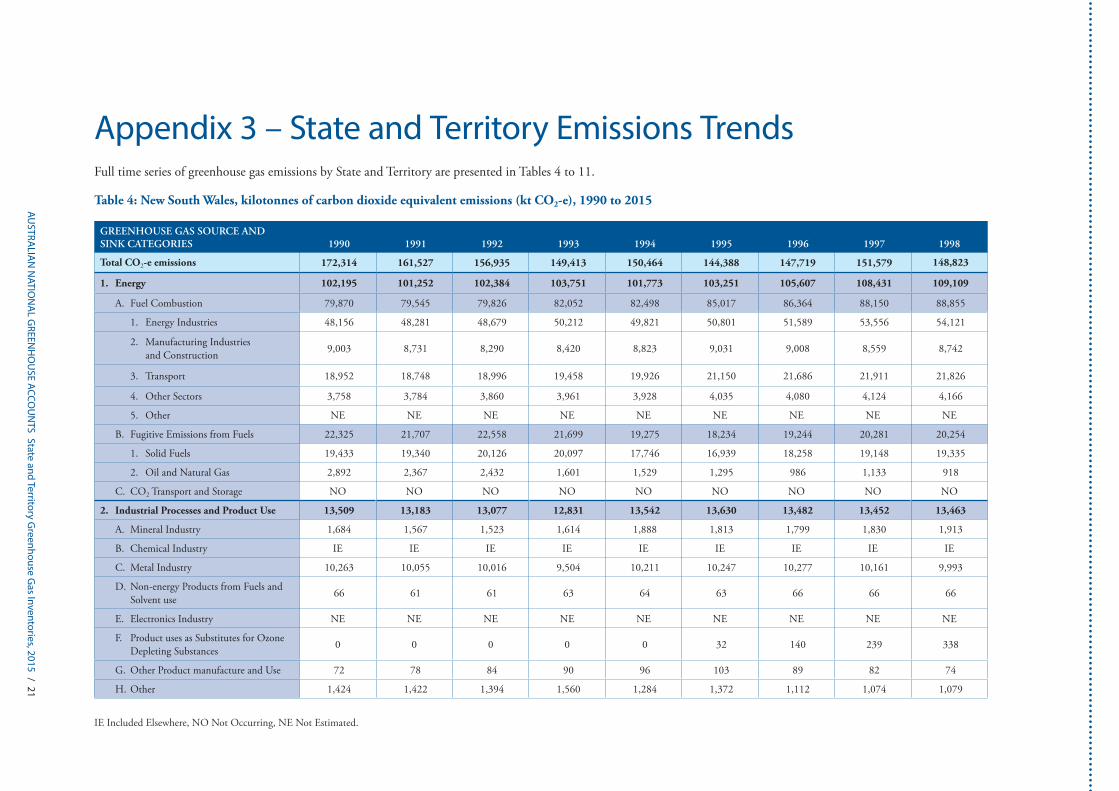
Appendix 3 – State and Territory Emissions TrendsFull time series of greenhouse gas emissions by State and Territory are presented in Tables 4 to 11.
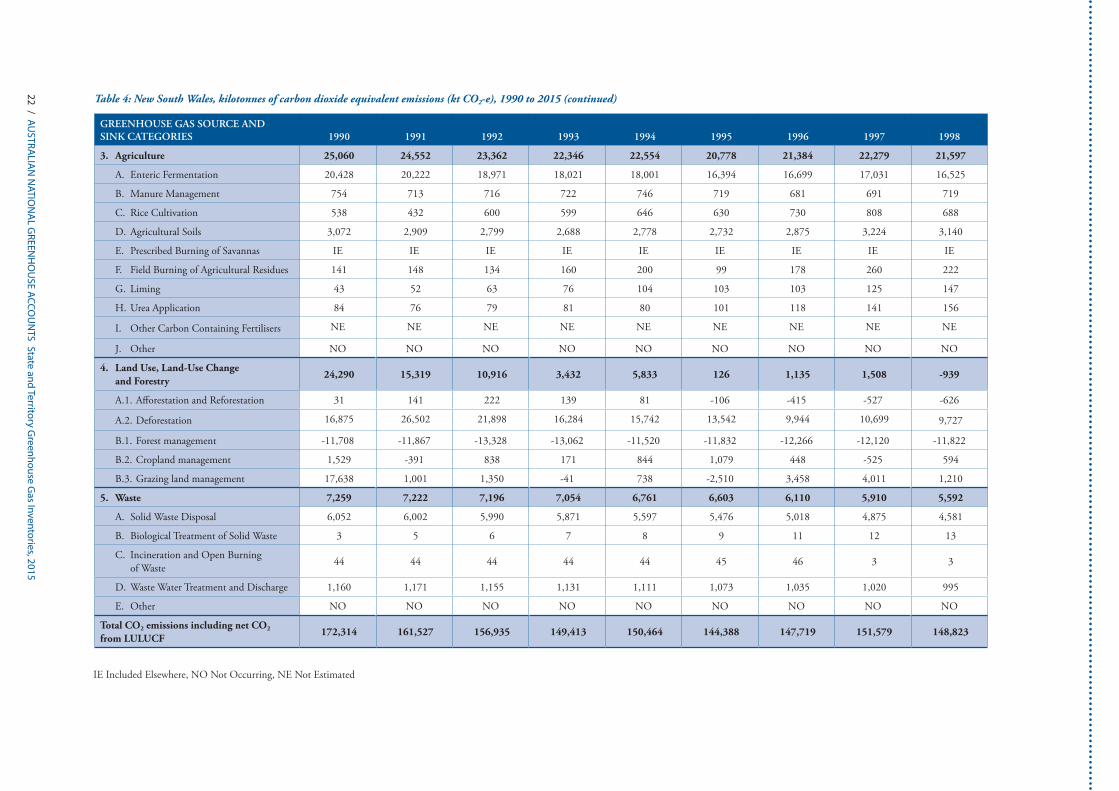
Table 4: New South Wales, kilotonnes of carbon dioxide equivalent emissions (kt CO2-e), 1990 to 2015
GREENHOUSE GAS SOURCE AND SINK CATEGORIES 1990 1991 1992 1993 1994 1995 1996 1997 1998
Total CO2-e emissions 172,314 161,527 156,935 149,413 150,464 144,388 147,719 151,579 148,823
1. Energy 102,195 101,252 102,384 103,751 101,773 103,251 105,607 108,431 109,109
A. Fuel Combustion 79,870 79,545 79,826 82,052 82,498 85,017 86,364 88,150 88,855
1. Energy Industries 48,156 48,281 48,679 50,212 49,821 50,801 51,589 53,556 54,121
2. Manufacturing Industries and Construction 9,003 8,731 8,290 8,420 8,823 9,031 9,008 8,559 8,742
3. Transport 18,952 18,748 18,996 19,458 19,926 21,150 21,686 21,911 21,826
4. Other Sectors 3,758 3,784 3,860 3,961 3,928 4,035 4,080 4,124 4,166
5. Other NE NE NE NE NE NE NE NE NE
B. Fugitive Emissions from Fuels 22,325 21,707 22,558 21,699 19,275 18,234 19,244 20,281 20,254
1. Solid Fuels 19,433 19,340 20,126 20,097 17,746 16,939 18,258 19,148 19,335
2. Oil and Natural Gas 2,892 2,367 2,432 1,601 1,529 1,295 986 1,133 918
C. CO2 Transport and Storage NO NO NO NO NO NO NO NO NO
2. Industrial Processes and Product Use 13,509 13,183 13,077 12,831 13,542 13,630 13,482 13,452 13,463
A. Mineral Industry 1,684 1,567 1,523 1,614 1,888 1,813 1,799 1,830 1,913
B. Chemical Industry IE IE IE IE IE IE IE IE IE
C. Metal Industry 10,263 10,055 10,016 9,504 10,211 10,247 10,277 10,161 9,993
D. Non-energy Products from Fuels and Solvent use 66 61 61 63 64 63 66 66 66
E. Electronics Industry NE NE NE NE NE NE NE NE NE
F. Product uses as Substitutes for Ozone Depleting Substances 0 0 0 0 0 32 140 239 338
G. Other Product manufacture and Use 72 78 84 90 96 103 89 82 74
H. Other 1,424 1,422 1,394 1,560 1,284 1,372 1,112 1,074 1,079
22 / AUSTRA
LIAN
NATIO
NA
L GREEN
HO
USE ACCO
UN
TS State and Territory Greenhouse G
as Inventories, 2015
IE Included Elsewhere, NO Not Occurring, NE Not Estimated
GREENHOUSE GAS SOURCE AND SINK CATEGORIES 1990 1991 1992 1993 1994 1995 1996 1997 1998
3. Agriculture 25,060 24,552 23,362 22,346 22,554 20,778 21,384 22,279 21,597
A. Enteric Fermentation 20,428 20,222 18,971 18,021 18,001 16,394 16,699 17,031 16,525
B. Manure Management 754 713 716 722 746 719 681 691 719
C. Rice Cultivation 538 432 600 599 646 630 730 808 688
D. Agricultural Soils 3,072 2,909 2,799 2,688 2,778 2,732 2,875 3,224 3,140
E. Prescribed Burning of Savannas IE IE IE IE IE IE IE IE IE
F. Field Burning of Agricultural Residues 141 148 134 160 200 99 178 260 222
G. Liming 43 52 63 76 104 103 103 125 147
H. Urea Application 84 76 79 81 80 101 118 141 156
I. Other Carbon Containing Fertilisers NE NE NE NE NE NE NE NE NE
J. Other NO NO NO NO NO NO NO NO NO
4. Land Use, Land-Use Change and Forestry
24,290 15,319 10,916 3,432 5,833 126 1,135 1,508 -939
A.1. Afforestation and Reforestation 31 141 222 139 81 -106 -415 -527 -626
A.2. Deforestation 16,875 26,502 21,898 16,284 15,742 13,542 9,944 10,699 9,727
B.1. Forest management -11,708 -11,867 -13,328 -13,062 -11,520 -11,832 -12,266 -12,120 -11,822
B.2. Cropland management 1,529 -391 838 171 844 1,079 448 -525 594
B.3. Grazing land management 17,638 1,001 1,350 -41 738 -2,510 3,458 4,011 1,210
5. Waste 7,259 7,222 7,196 7,054 6,761 6,603 6,110 5,910 5,592
A. Solid Waste Disposal 6,052 6,002 5,990 5,871 5,597 5,476 5,018 4,875 4,581
B. Biological Treatment of Solid Waste 3 5 6 7 8 9 11 12 13
C. Incineration and Open Burning of Waste 44 44 44 44 44 45 46 3 3
D. Waste Water Treatment and Discharge 1,160 1,171 1,155 1,131 1,111 1,073 1,035 1,020 995
E. Other NO NO NO NO NO NO NO NO NO
Total CO2 emissions including net CO2 from LULUCF
172,314 161,527 156,935 149,413 150,464 144,388 147,719 151,579 148,823
Table 4: New South Wales, kilotonnes of carbon dioxide equivalent emissions (kt CO2-e), 1990 to 2015 (continued)

AUSTRA
LIAN
NATIO
NA
L GREEN
HO
USE ACCO
UN
TS State and Territory Greenhouse G
as Inventories, 2015 / 23 IE Included Elsewhere, NO Not Occurring, NE Not Estimated
GREENHOUSE GAS SOURCE AND SINK CATEGORIES 1999 2000 2001 2002 2003 2004 2005 2006 2007
Total CO2-e emissions 152,033 150,990 151,840 151,548 146,091 152,894 159,528 166,876 168,456
1. Energy 109,521 111,498 114,568 114,392 114,311 116,741 117,634 120,212 124,446
A. Fuel Combustion 91,193 92,626 95,984 96,576 97,454 99,403 99,772 101,168 103,908
1. Energy Industries 56,185 57,171 60,068 60,348 60,581 61,938 62,034 63,688 66,420
2. Manufacturing Industries and Construction 8,605 8,531 8,752 8,877 8,875 8,835 8,798 8,441 8,151
3. Transport 22,223 22,666 22,675 22,851 23,315 23,972 24,314 24,327 24,670
4. Other Sectors 4,180 4,258 4,489 4,500 4,683 4,659 4,626 4,711 4,666
5. Other NE NE NE NE NE NE NE NE NE
B. Fugitive Emissions from Fuels 18,327 18,872 18,584 17,816 16,858 17,338 17,862 19,045 20,538
1. Solid Fuels 17,601 17,962 17,692 16,946 15,994 16,466 17,099 18,239 19,773
2. Oil and Natural Gas 727 909 893 870 863 872 762 805 766
C. CO2 Transport and Storage NO NO NO NO NO NO NO NO NO
2. Industrial Processes and Product Use 13,991 13,201 12,023 12,080 13,079 14,098 14,559 14,676 15,287
A. Mineral Industry 1,879 1,801 1,717 1,752 1,806 1,775 1,782 1,874 1,975
B. Chemical Industry IE IE IE IE IE IE IE IE IE
C. Metal Industry 10,404 9,577 8,248 7,999 8,674 9,420 9,426 9,344 9,722
D. Non-energy Products from Fuels and Solvent use 64 67 69 71 73 67 65 62 59
E. Electronics Industry NE NE NE NE NE NE NE NE NE
F. Product uses as Substitutes for Ozone Depleting Substances 465 546 781 990 1,206 1,432 1,672 1,815 2,020
G. Other Product manufacture and Use 65 64 67 68 70 70 61 57 53
H. Other 1,113 1,146 1,141 1,200 1,251 1,335 1,553 1,524 1,459
Table 4: New South Wales, kilotonnes of carbon dioxide equivalent emissions (kt CO2-e), 1990 to 2015 (continued)

24 / AUSTRA
LIAN
NATIO
NA
L GREEN
HO
USE ACCO
UN
TS State and Territory Greenhouse G
as Inventories, 2015
IE Included Elsewhere, NO Not Occurring, NE Not Estimated
GREENHOUSE GAS SOURCE AND SINK CATEGORIES 1999 2000 2001 2002 2003 2004 2005 2006 2007
3. Agriculture 21,720 22,104 22,411 21,438 19,063 19,682 19,520 19,832 17,769
A. Enteric Fermentation 16,456 16,599 16,478 15,902 14,738 15,058 14,778 14,869 13,855
B. Manure Management 695 690 776 790 756 679 871 777 837
C. Rice Cultivation 735 643 898 718 187 316 220 510 82
D. Agricultural Soils 3,247 3,535 3,567 3,299 2,870 3,026 3,068 3,108 2,629
E. Prescribed Burning of Savannas IE IE IE IE IE IE IE IE IE
F. Field Burning of Agricultural Residues 252 243 257 241 89 193 158 211 65
G. Liming 169 191 213 267 251 236 221 205 190
H. Urea Application 167 203 223 221 172 174 203 153 111
I. Other Carbon Containing Fertilisers NE NE NE NE NE NE NE NE NE
J. Other NO NO NO NO NO NO NO NO NO
4. Land Use, Land-Use Change and Forestry 1,261 -1,202 -2,549 -1,805 -5,386 -2,500 2,913 7,333 6,124
A.1. Afforestation and Reforestation -960 -1,213 -1,211 -1,161 -1,284 -1,411 -1,259 -757 -921
A.2. Deforestation 10,605 11,325 10,601 10,847 8,299 8,963 13,193 13,438 13,431
B.1. Forest management -12,239 -10,747 -9,937 -8,369 -9,275 -9,309 -9,239 -7,845 -7,855
B.2. Cropland management 359 289 -810 -514 4 439 -275 -686 -942
B.3. Grazing land management 3,518 -835 -1,171 -2,589 -3,123 -1,175 501 3,196 2,419
5. Waste 5,541 5,389 5,387 5,443 5,023 4,872 4,902 4,822 4,831
A. Solid Waste Disposal 4,538 4,395 4,344 4,413 4,026 3,864 3,888 3,782 3,775
B. Biological Treatment of Solid Waste 14 16 17 18 19 20 21 23 24
C. Incineration and Open Burning of Waste 3 3 3 3 3 3 3 3 3
D. Waste Water Treatment and Discharge 985 975 1,023 1,009 975 984 989 1,013 1,028
E. Other NO NO NO NO NO NO NO NO NO
Total CO2 emissions including net CO2 from LULUCF
152,033 150,990 151,840 151,548 146,091 152,894 159,528 166,876 168,456
Table 4: New South Wales, kilotonnes of carbon dioxide equivalent emissions (kt CO2-e), 1990 to 2015 (continued)

AUSTRA
LIAN
NATIO
NA
L GREEN
HO
USE ACCO
UN
TS State and Territory Greenhouse G
as Inventories, 2015 / 25 IE Included Elsewhere, NO Not Occurring, NE Not Estimated
GREENHOUSE GAS SOURCE AND SINK CATEGORIES 2008 2009 2010 2011 2012 2013 2014 2015
Change from 2000 to 2015
Total CO2-e emissions 164,357 156,819 148,570 149,161 141,119 133,012 133,403 -12%
1. Energy 125,405 123,742 119,550 117,511 115,659 111,148 108,317 106,680 -4%
A. Fuel Combustion 106,081 104,552 102,654 99,917 99,147 96,023 93,572 90,697 -2%
1. Energy Industries 67,789 66,485 63,840 60,349 60,032 57,432 55,624 52,043 -9%
2. Manufacturing Industries and Construction 8,479 7,902 7,927 7,779 7,741 7,117 6,575 5,974 -30%
3. Transport 25,162 25,534 26,223 26,944 26,453 26,430 26,379 27,475 21%
4. Other Sectors 4,651 4,630 4,664 4,846 4,922 5,043 4,994 5,205 22%
5. Other NE NE NE NE NE NE NE NE -
B. Fugitive Emissions from Fuels 19,324 19,190 16,896 17,593 16,512 15,125 14,745 15,983 -15%
1. Solid Fuels 18,567 18,281 16,001 16,672 15,612 14,381 13,988 15,102 -16%
2. Oil and Natural Gas 757 909 895 921 900 744 757 881 -3%
C. CO2 Transport and Storage NO NO NO NO NO NO NO NO -
2. Industrial Processes and Product Use 15,307 12,862 14,786 15,655 12,677 11,721 11,463 12,429 -6%
A. Mineral Industry 1,891 1,635 1,623 1,770 1,415 1,375 1,377 1,283 -29%
B. Chemical Industry
C. Metal Industry 9,526 7,428 9,199 9,713 7,335 5,963 5,561 6,089 -36%
D. Non-energy Products from Fuels and Solvent use 62 75 80 70 44 43 43 43 -36%
E. Electronics Industry NE NE NE NE NE NE NE NE -
F. Product uses as Substitutes for Ozone Depleting Substances 2,246 2,455 2,645 2,855 3,007 3,214 3,454 3,678 573%
G. Other Product manufacture and Use 50 39 39 40 41 41 42 42 -34%
H. Other 1,532 1,230 1,200 1,207 836 1,085 987 1,294 13%
Table 4: New South Wales, kilotonnes of carbon dioxide equivalent emissions (kt CO2-e), 1990 to 2015 (continued)

26 / AUSTRA
LIAN
NATIO
NA
L GREEN
HO
USE ACCO
UN
TS State and Territory Greenhouse G
as Inventories, 2015
IE Included Elsewhere, NO Not Occurring, NE Not Estimated
GREENHOUSE GAS SOURCE AND SINK CATEGORIES 2008 2009 2010 2011 2012 2013 2014 2015
Change from 2000 to 2015
3. Agriculture 16,751 16,812 16,400 17,818 18,563 18,505 17,480 17,398 -21%
A. Enteric Fermentation 13,249 13,122 12,520 12,959 13,570 13,495 12,941 12,867 -22%
B. Manure Management 800 711 690 654 678 664 628 670 -3%
C. Rice Cultivation 11 40 92 408 505 554 385 323 -50%
D. Agricultural Soils 2,323 2,514 2,605 3,189 3,214 3,178 2,948 2,911 -18%
E. Prescribed Burning of Savannas IE IE IE IE IE IE IE IE IE
F. Field Burning of Agricultural Residues 72 124 97 199 187 196 154 156 -36%
G. Liming 175 195 217 184 152 120 129 176 -8%
H. Urea Application 122 106 178 225 258 299 295 295 46%
I. Other Carbon Containing Fertilisers NE NE NE NE NE NE NE NE -
J. Other NO NO NO NO NO NO NO NO -
4. Land Use, Land-Use Change and Forestry 1,791 -1,434 -6,971 -6,379 -9,826 -14,193 -8,240 -6,272 422%
A.1. Afforestation and Reforestation -1,250 -1,159 -1,625 -2,209 -1,919 -1,848 -1,965 -1,917 58%
A.2. Deforestation 9,651 8,466 7,632 8,357 9,028 9,183 8,440 6,845 -40%
B.1. Forest management -8,694 -8,858 -10,600 -11,806 -11,398 -12,393 -12,258 -10,516 -2%
B.2. Cropland management -130 -647 -1,074 -317 -387 -313 -64 -255 -188%
B.3. Grazing land management 2,218 790 -1,277 -380 -5,118 -8,781 -2,343 -379 -55%
5. Waste 5,102 4,837 4,806 4,557 4,046 3,808 3,991 3,168 -41%
A. Solid Waste Disposal 4,016 3,738 3,696 3,361 3,043 2,875 2,874 2,056 -53%
B. Biological Treatment of Solid Waste 26 27 30 35 36 36 37 37 137%
C. Incineration and Open Burning of Waste 3 4 4 4 4 4 4 4 18%
D. Waste Water Treatment and Discharge 1,057 1,069 1,075 1,157 963 893 1,077 1,071 10%
E. Other NO NO NO NO NO NO NO NO -
Total CO2 emissions including net CO2 from LULUCF
164,357 156,819 148,570 149,161 141,119 130,989 133,012 133,403 -12%
Table 4: New South Wales, kilotonnes of carbon dioxide equivalent emissions (kt CO2-e), 1990 to 2015 (continued)
AUSTRA
LIAN
NATIO
NA
L GREEN
HO
USE ACCO
UN
TS State and Territory Greenhouse G
as Inventories, 2015 / 27 IE Included Elsewhere, NO Not Occurring, NE Not Estimated
Table 5: Victoria, kilotonnes of carbon dioxide equivalent emissions (kt CO2-e), 1990 to 2015
GREENHOUSE GAS SOURCE AND SINK CATEGORIES 1990 1991 1992 1993 1994 1995 1996 1997 1998
Total CO2-e emissions 107,942 106,710 104,133 100,701 98,914 101,945 103,240 107,837 112,709
1. Energy 79,117 80,558 82,218 80,673 80,428 84,417 87,162 89,739 96,330
A. Fuel Combustion 75,414 77,190 78,719 77,124 77,282 80,575 83,700 86,521 93,508
1. Energy Industries 46,953 49,098 50,425 48,148 48,337 50,645 52,893 55,540 62,239
2. Manufacturing Industries and Construction 6,025 5,902 5,555 5,787 5,636 5,763 5,898 5,549 5,774
3. Transport 16,013 15,684 15,981 16,194 16,395 16,854 17,341 17,800 17,759
4. Other Sectors 6,423 6,506 6,758 6,994 6,913 7,313 7,568 7,632 7,736
5. Other NE NE NE NE NE NE NE NE NE
B. Fugitive Emissions from Fuels 3,703 3,369 3,500 3,549 3,146 3,843 3,462 3,218 2,822
1. Solid Fuels 13 14 14 13 14 14 15 17 18
2. Oil and Natural Gas 3,690 3,355 3,486 3,536 3,132 3,829 3,447 3,201 2,804
C. CO2 Transport and Storage NO NO NO NO NO NO NO NO NO
2. Industrial Processes and Product Use 2,703 2,679 2,640 2,451 1,984 1,821 1,701 1,715 2,019
A. Mineral Industry 361 337 319 328 374 359 332 356 381
B. Chemical Industry IE IE IE IE IE IE IE IE IE
C. Metal Industry IE IE IE IE IE IE IE IE IE
D. Non-energy Products from Fuels and Solvent use 59 54 54 56 57 56 58 59 59
E. Electronics Industry NE NE NE NE NE NE NE NE NE
F. Product uses as Substitutes for Ozone Depleting Substances 0 0 0 0 0 24 103 175 248
G. Other Product manufacture and Use 54 59 63 67 71 76 65 60 55
H. Other 2,229 2,229 2,229 2,204 2,000 1,481 1,307 1,142 1,064
28 / AUSTRA
LIAN
NATIO
NA
L GREEN
HO
USE ACCO
UN
TS State and Territory Greenhouse G
as Inventories, 2015
IE Included Elsewhere, NO Not Occurring, NE Not Estimated
GREENHOUSE GAS SOURCE AND SINK CATEGORIES 1990 1991 1992 1993 1994 1995 1996 1997 1998
3. Agriculture 15,068 14,818 14,543 14,133 14,712 14,533 14,905 15,141 14,552
A. Enteric Fermentation 12,020 11,742 11,386 10,985 11,338 11,128 11,527 11,622 11,107
B. Manure Management 634 622 672 656 713 756 788 819 815
C. Rice Cultivation 0 0 0 0 0 0 0 4 3
D. Agricultural Soils 2,229 2,258 2,271 2,233 2,360 2,402 2,348 2,412 2,328
E. Prescribed Burning of Savannas IE IE IE IE IE IE IE IE IE
F. Field Burning of Agricultural Residues 55 44 46 68 73 29 69 72 53
G. Liming 72 87 105 127 165 137 79 100 122
H. Urea Application 58 64 63 64 64 80 94 112 125
I. Other Carbon Containing Fertilisers NE NE NE NE NE NE NE NE NE
J. Other NO NO NO NO NO NO NO NO NO
4. Land Use, Land-Use Change and Forestry 5,776 3,434 -435 -1,664 -3,085 -3,701 -4,788 -2,966 -4,103
A.1. Afforestation and Reforestation 64 162 289 327 257 154 -191 -329 -497
A.2. Deforestation 4,438 7,420 5,440 5,284 3,766 3,386 2,929 3,157 2,752
B.1. Forest management -4,286 -4,507 -5,029 -5,028 -4,387 -3,567 -4,960 -3,787 -4,801
B.2. Cropland management 306 -276 -274 -211 184 -76 -189 441 272
B.3. Grazing land management 5,272 649 -853 -2,028 -2,900 -3,595 -2,378 -2,452 -1,836
5. Waste 5,279 5,221 5,166 5,110 4,875 4,875 4,260 4,207 3,910
A. Solid Waste Disposal 3,795 3,788 3,739 3,696 3,470 3,495 2,912 2,860 2,579
B. Biological Treatment of Solid Waste 2 3 4 5 6 7 8 9 10
C. Incineration and Open Burning of Waste 12 12 12 12 12 18 14 18 18
D. Waste Water Treatment and Discharge 1,469 1,417 1,410 1,396 1,387 1,355 1,326 1,320 1,304
E. Other NO NO NO NO NO NO NO NO NO
Total CO2 emissions including net CO2 from LULUCF
107,942 106,710 104,133 100,701 98,914 101,945 103,240 107,837 112,709
Table 5: Victoria, kilotonnes of carbon dioxide equivalent emissions (kt CO2-e), 1990 to 2015 (continued)

AUSTRA
LIAN
NATIO
NA
L GREEN
HO
USE ACCO
UN
TS State and Territory Greenhouse G
as Inventories, 2015 / 29 IE Included Elsewhere, NO Not Occurring, NE Not Estimated
GREENHOUSE GAS SOURCE AND SINK CATEGORIES 1999 2000 2001 2002 2003 2004 2005 2006 2007
Total CO2-e emissions 112,724 117,232 117,993 115,272 126,965 130,673 126,439 129,618 128,184
1. Energy 98,201 100,189 99,825 98,021 100,805 105,517 104,483 104,417 103,288
A. Fuel Combustion 95,775 97,322 97,065 95,582 98,688 103,110 102,124 102,227 101,047
1. Energy Industries 64,665 65,622 65,239 63,503 64,630 68,470 66,774 67,201 66,035
2. Manufacturing Industries and Construction 5,437 5,487 5,494 5,251 6,727 6,695 7,068 6,807 6,477
3. Transport 18,013 18,361 18,310 18,767 19,239 19,945 20,168 20,171 20,629
4. Other Sectors 7,660 7,851 8,023 8,061 8,091 8,000 8,114 8,048 7,906
5. Other NE NE NE NE NE NE NE NE NE
B. Fugitive Emissions from Fuels 2,426 2,867 2,760 2,440 2,117 2,407 2,358 2,190 2,241
1. Solid Fuels 18 18 18 18 18 18 18 19 18
2. Oil and Natural Gas 2,407 2,848 2,742 2,421 2,098 2,389 2,340 2,171 2,223
C. CO2 Transport and Storage NO NO NO NO NO NO NO NO NO
2. Industrial Processes and Product Use 1,992 2,109 2,462 2,634 2,822 2,989 3,183 3,009 3,216
A. Mineral Industry 382 382 385 387 395 393 403 419 460
B. Chemical Industry IE IE IE IE IE IE IE IE IE
C. Metal Industry IE IE IE IE IE IE IE IE IE
D. Non-energy Products from Fuels and Solvent use 57 60 62 63 65 61 56 54 50
E. Electronics Industry NE NE NE NE NE NE NE IE IE
F. Product uses as Substitutes for Ozone Depleting Substances 340 399 571 724 884 1,055 1,237 1,348 1,522
G. Other Product manufacture and Use 48 47 49 50 51 51 45 43 40
H. Other 1,277 1,164 1,222 1,397 1,411 1,427 1,428 1,442 1,146
Table 5: Victoria, kilotonnes of carbon dioxide equivalent emissions (kt CO2-e), 1990 to 2015 (continued)

30 / AUSTRA
LIAN
NATIO
NA
L GREEN
HO
USE ACCO
UN
TS State and Territory Greenhouse G
as Inventories, 2015
IE Included Elsewhere, NO Not Occurring, NE Not Estimated
GREENHOUSE GAS SOURCE AND SINK CATEGORIES 1999 2000 2001 2002 2003 2004 2005 2006 2007
3. Agriculture 14,780 15,773 16,103 16,199 15,506 15,493 16,334 15,431 14,757
A. Enteric Fermentation 11,208 11,769 11,888 11,867 11,468 11,250 11,861 11,028 10,592
B. Manure Management 859 949 987 1,065 977 967 1,222 1,201 1,060
C. Rice Cultivation 3 0 9 8 4 3 3 5 1
D. Agricultural Soils 2,377 2,654 2,768 2,796 2,646 2,770 2,792 2,716 2,621
E. Prescribed Burning of Savannas IE IE IE IE IE IE IE IE IE
F. Field Burning of Agricultural Residues 56 75 89 83 28 96 49 72 20
G. Liming 143 165 186 221 235 250 264 279 293
H. Urea Application 133 162 177 161 147 157 141 129 170
I. Other Carbon Containing Fertilisers NE NE NE NE NE NE NE NE NE
J. Other NO NO NO NO NO NO NO NO NO
4. Land Use, Land-Use Change and Forestry -6,264 -4,435 -4,064 -5,481 3,941 2,826 -1,402 2,941 3,196
A.1. Afforestation and Reforestation -802 -992 -1,047 -1,241 -1,461 -2,093 -2,905 -3,070 -4,077
A.2. Deforestation 1,788 1,735 2,791 3,263 7,052 8,127 5,104 7,929 6,849
B.1. Forest management -5,360 -2,829 -2,091 -4,996 770 -1,836 -2,194 -749 1,765
B.2. Cropland management -62 257 -149 172 99 556 120 -164 -355
B.3. Grazing land management -1,837 -2,614 -3,577 -2,688 -2,529 -1,937 -1,539 -1,018 -997
5. Waste 4,016 3,596 3,667 3,898 3,891 3,848 3,842 3,820 3,728
A. Solid Waste Disposal 2,690 2,655 2,686 2,929 2,962 2,908 2,895 2,861 2,755
B. Biological Treatment of Solid Waste 11 11 12 13 14 15 16 17 18
C. Incineration and Open Burning of Waste 18 17 17 17 17 17 17 17 17
D. Waste Water Treatment and Discharge 1,297 912 952 939 898 908 914 925 938
E. Other NO NO NO NO NO NO NO NO NO
Total CO2 emissions including net CO2 from LULUCF
112,724 117,232 117,993 115,272 126,965 130,673 126,439 129,618 128,184
Table 5: Victoria, kilotonnes of carbon dioxide equivalent emissions (kt CO2-e), 1990 to 2015 (continued)
AUSTRA
LIAN
NATIO
NA
L GREEN
HO
USE ACCO
UN
TS State and Territory Greenhouse G
as Inventories, 2015 / 31 IE Included Elsewhere, NO Not Occurring, NE Not Estimated
GREENHOUSE GAS SOURCE AND SINK CATEGORIES 2008 2009 2010 2011 2012 2013 2014 2015
Change from 2000 to 2015
Total CO2-e emissions 123,148 133,826 126,603 125,090 123,488 115,345 116,702 119,589 2%
1. Energy 104,692 108,429 107,684 107,985 109,850 102,479 100,487 104,306 4%
A. Fuel Combustion 102,333 105,538 105,220 105,551 107,369 99,828 98,150 101,918 5%
1. Energy Industries 66,463 69,299 68,454 67,779 69,971 62,280 60,459 64,296 -2%
2. Manufacturing Industries and Construction 6,708 6,728 6,587 6,519 6,789 6,967 6,117 5,652 3%
3. Transport 21,125 21,276 21,665 22,476 21,830 21,705 22,476 22,689 24%
4. Other Sectors 8,037 8,234 8,514 8,778 8,779 8,876 9,098 9,281 18%
5. Other NE NE NE NE NE NE NE NE -
B. Fugitive Emissions from Fuels 2,360 2,891 2,464 2,434 2,481 2,651 2,337 2,388 -17%
1. Solid Fuels 18 19 19 18 18 17 16 17 -7%
2. Oil and Natural Gas 2,342 2,872 2,445 2,416 2,463 2,634 2,321 2,370 -17%
C. CO2 Transport and Storage NO NO NO NO NO NO NO NO NO
2. Industrial Processes and Product Use 3,346 3,533 3,653 3,906 3,964 4,011 3,915 3,705 76%
A. Mineral Industry 447 412 380 441 416 377 108 113 -70%
B. Chemical Industry IE IE IE IE IE IE IE IE -
C. Metal Industry IE IE IE IE IE IE IE IE -
D. Non-energy Products from Fuels and Solvent use 52 48 56 55 34 32 30 30 -50%
E. Electronics Industry IE IE IE IE IE IE IE IE IE
F. Product uses as Substitutes for Ozone Depleting Substances 1,692 1,850 2,028 2,191 2,318 2,489 2,684 2,870 619%
G. Other Product manufacture and Use 37 30 30 31 32 32 32 33 -
H. Other 1,144 1,117 1,194 1,159 1,188 1,164 1,081 1,061 66009%
Table 5: Victoria, kilotonnes of carbon dioxide equivalent emissions (kt CO2-e), 1990 to 2015 (continued)

32 / AUSTRA
LIAN
NATIO
NA
L GREEN
HO
USE ACCO
UN
TS State and Territory Greenhouse G
as Inventories, 2015
IE Included Elsewhere, NO Not Occurring, NE Not Estimated
GREENHOUSE GAS SOURCE AND SINK CATEGORIES 2008 2009 2010 2011 2012 2013 2014 2015
Change from 2000 to 2015
3. Agriculture 13,871 13,622 13,538 14,218 14,961 14,734 14,927 14,671 -7%
A. Enteric Fermentation 10,006 9,693 9,300 9,726 10,445 10,213 10,181 10,032 -15%
B. Manure Management 955 979 1,076 1,071 1,158 1,112 1,139 1,167 23%
C. Rice Cultivation 0 0 0 1 4 2 3 1 0%
D. Agricultural Soils 2,416 2,442 2,552 2,806 2,839 2,901 3,004 2,845 7%
E. Prescribed Burning of Savannas IE IE IE IE IE IE IE IE -
F. Field Burning of Agricultural Residues 51 44 53 69 68 66 63 47 -37%
G. Liming 308 332 355 282 208 134 175 219 33%
H. Urea Application 135 133 203 263 239 305 360 360 123%
I. Other Carbon Containing Fertilisers NE NE NE NE NE NE NE NE -
J. Other NO NO NO NO NO NO NO NO -
4. Land Use, Land-Use Change and Forestry -2,438 4,571 -1,946 -4,232 -7,967 -7,796 -4,651 -5,437 23%
A.1. Afforestation and Reforestation -5,398 -5,522 -6,321 -7,416 -6,602 -5,886 -4,604 -3,474 250%
A.2. Deforestation 4,633 5,972 7,039 3,862 2,680 2,080 2,458 1,930 11%
B.1. Forest management -601 5,296 -1,435 -1,039 -1,862 -2,061 -1,769 -2,470 -13%
B.2. Cropland management -291 -214 -637 -828 -821 -537 -860 -683 -366%
B.3. Grazing land management -796 -972 -603 1,182 -1,349 -1,373 141 -725 -72%
5. Waste 3,678 3,672 3,674 3,212 2,679 1,917 2,025 2,344 -35%
A. Solid Waste Disposal 2,687 2,679 2,679 2,365 2,075 1,262 1,361 1,662 -37%
B. Biological Treatment of Solid Waste 20 21 23 27 27 28 28 29 153%
C. Incineration and Open Burning of Waste 17 17 17 17 17 17 17 17 0%
D. Waste Water Treatment and Discharge 954 955 954 803 559 610 618 635 -30%
E. Other NO NO NO NO NO NO NO NO -
Total CO2 emissions including net CO2 from LULUCF
123,148 133,826 126,603 125,090 123,488 115,345 116,702 119,589 2%
Table 5: Victoria, kilotonnes of carbon dioxide equivalent emissions (kt CO2-e), 1990 to 2015 (continued)

AUSTRA
LIAN
NATIO
NA
L GREEN
HO
USE ACCO
UN
TS State and Territory Greenhouse G
as Inventories, 2015 / 33 IE Included Elsewhere, NO Not Occurring, NE Not Estimated
Table 6: Queensland, kilotonnes of carbon dioxide equivalent emissions (kt CO2-e), 1990 to 2015
GREENHOUSE GAS SOURCE AND SINK CATEGORIES 1990 1991 1992 1993 1994 1995 1996 1997 1998
Total CO2-e emissions 171,005 163,229 139,160 133,497 129,599 127,010 125,867 130,532 133,235
1. Energy 48,540 49,832 51,695 54,162 56,006 59,832 60,458 64,004 69,252
A. Fuel Combustion 45,390 46,292 47,914 50,269 51,627 54,608 55,970 57,876 62,339
1. Energy Industries 25,085 25,828 27,062 28,811 29,515 31,445 32,467 33,701 38,079
2. Manufacturing Industries and Construction 7,427 7,370 7,472 7,558 7,818 7,959 7,860 8,136 8,017
3. Transport 11,187 11,402 11,677 12,172 12,561 13,450 13,877 14,217 14,395
4. Other Sectors 1,691 1,692 1,702 1,729 1,733 1,753 1,766 1,822 1,847
5. Other NE NE NE NE NE NE NE NE NE
B. Fugitive Emissions from Fuels 3,150 3,540 3,781 3,893 4,380 5,224 4,488 6,129 6,913
1. Solid Fuels 2,727 3,116 3,342 3,426 3,851 4,654 3,895 5,506 6,315
2. Oil and Natural Gas 423 424 439 467 528 570 593 623 598
C. CO2 Transport and Storage NO NO NO NO NO NO NO NO NO
2. Industrial Processes and Product Use 3,495 3,468 3,522 3,569 3,352 3,178 3,108 3,159 3,559
A. Mineral Industry IE IE IE IE IE IE IE IE IE
B. Chemical Industry IE IE IE IE IE IE IE IE IE
C. Metal Industry IE IE IE IE IE IE IE IE IE
D. Non-energy Products from Fuels and Solvent use 75 70 69 71 73 72 75 75 75
E. Electronics Industry NE NE NE NE NE NE NE NE NE
F. Product uses as Substitutes for Ozone Depleting Substances 0 0 0 0 0 17 75 129 183
G. Other Product manufacture and Use 36 39 42 46 50 54 47 44 40
H. Other 3,384 3,359 3,411 3,452 3,228 3,035 2,911 2,910 3,260
34 / AUSTRA
LIAN
NATIO
NA
L GREEN
HO
USE ACCO
UN
TS State and Territory Greenhouse G
as Inventories, 2015
IE Included Elsewhere, NO Not Occurring, NE Not Estimated
GREENHOUSE GAS SOURCE AND SINK CATEGORIES 1990 1991 1992 1993 1994 1995 1996 1997 1998
3. Agriculture 18,580 19,073 18,652 18,106 17,579 17,675 17,927 18,199 19,138
A. Enteric Fermentation 15,334 15,960 15,674 15,217 14,527 14,695 14,854 15,084 15,792
B. Manure Management 559 576 548 600 649 607 581 575 704
C. Rice Cultivation 22 20 6 0 0 0 0 0 0
D. Agricultural Soils 2,469 2,301 2,233 2,075 2,177 2,131 2,235 2,253 2,352
E. Prescribed Burning of Savannas IE IE IE IE IE IE IE IE IE
F. Field Burning of Agricultural Residues 82 82 58 69 74 70 71 78 67
G. Liming 31 38 46 56 64 61 58 54 50
H. Urea Application 82 96 86 89 88 111 129 154 172
I. Other Carbon Containing Fertilisers NE NE NE NE NE NE NE NE NE
J. Other NO NO NO NO NO NO NO NO NO
4. Land Use, Land-Use Change and Forestry 97,140 87,602 62,032 54,380 49,353 43,090 41,332 42,082 38,244
A.1. Afforestation and Reforestation 79 115 176 118 139 74 22 -78 -162
A.2. Deforestation 31,932 76,201 55,707 47,435 44,407 38,035 36,304 37,201 35,706
B.1. Forest management -2,362 -2,692 -2,973 -3,859 -4,392 -3,611 -4,092 -2,530 -3,516
B.2. Cropland management 6,449 527 1,592 1,047 1,403 1,037 732 82 911
B.3. Grazing land management 60,922 13,225 7,282 9,406 7,564 7,362 8,168 7,200 5,115
5. Waste 3,251 3,255 3,259 3,280 3,309 3,235 3,041 3,088 3,043
A. Solid Waste Disposal 2,418 2,422 2,446 2,487 2,534 2,490 2,354 2,427 2,404
B. Biological Treatment of Solid Waste 2 2 3 4 4 5 6 6 7
C. Incineration and Open Burning of Waste 28 28 28 28 28 28 4 4 4
D. Waste Water Treatment and Discharge 803 803 782 761 742 711 677 651 628
E. Other NO NO NO NO NO NO NO NO NO
Total CO2 emissions including net CO2 from LULUCF
171,005 163,229 139,160 133,497 129,599 127,010 125,867 130,532 133,235
Table 6: Queensland, kilotonnes of carbon dioxide equivalent emissions (kt CO2-e), 1990 to 2015 (continued)
AUSTRA
LIAN
NATIO
NA
L GREEN
HO
USE ACCO
UN
TS State and Territory Greenhouse G
as Inventories, 2015 / 35 IE Included Elsewhere, NO Not Occurring, NE Not Estimated
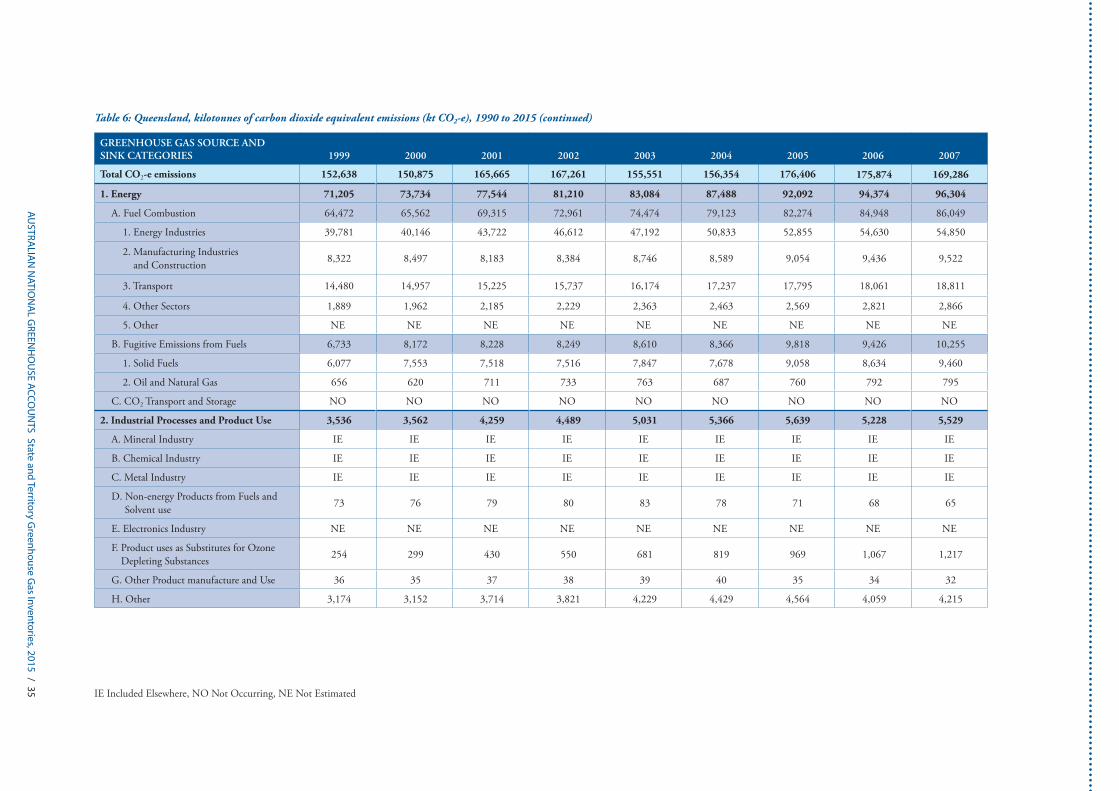
GREENHOUSE GAS SOURCE AND SINK CATEGORIES 1999 2000 2001 2002 2003 2004 2005 2006 2007
Total CO2-e emissions 152,638 150,875 165,665 167,261 155,551 156,354 176,406 175,874 169,286
1. Energy 71,205 73,734 77,544 81,210 83,084 87,488 92,092 94,374 96,304
A. Fuel Combustion 64,472 65,562 69,315 72,961 74,474 79,123 82,274 84,948 86,049
1. Energy Industries 39,781 40,146 43,722 46,612 47,192 50,833 52,855 54,630 54,850
2. Manufacturing Industries and Construction 8,322 8,497 8,183 8,384 8,746 8,589 9,054 9,436 9,522
3. Transport 14,480 14,957 15,225 15,737 16,174 17,237 17,795 18,061 18,811
4. Other Sectors 1,889 1,962 2,185 2,229 2,363 2,463 2,569 2,821 2,866
5. Other NE NE NE NE NE NE NE NE NE
B. Fugitive Emissions from Fuels 6,733 8,172 8,228 8,249 8,610 8,366 9,818 9,426 10,255
1. Solid Fuels 6,077 7,553 7,518 7,516 7,847 7,678 9,058 8,634 9,460
2. Oil and Natural Gas 656 620 711 733 763 687 760 792 795
C. CO2 Transport and Storage NO NO NO NO NO NO NO NO NO
2. Industrial Processes and Product Use 3,536 3,562 4,259 4,489 5,031 5,366 5,639 5,228 5,529
A. Mineral Industry IE IE IE IE IE IE IE IE IE
B. Chemical Industry IE IE IE IE IE IE IE IE IE
C. Metal Industry IE IE IE IE IE IE IE IE IE
D. Non-energy Products from Fuels and Solvent use 73 76 79 80 83 78 71 68 65
E. Electronics Industry NE NE NE NE NE NE NE NE NE
F. Product uses as Substitutes for Ozone Depleting Substances 254 299 430 550 681 819 969 1,067 1,217
G. Other Product manufacture and Use 36 35 37 38 39 40 35 34 32
H. Other 3,174 3,152 3,714 3,821 4,229 4,429 4,564 4,059 4,215
Table 6: Queensland, kilotonnes of carbon dioxide equivalent emissions (kt CO2-e), 1990 to 2015 (continued)

36 / AUSTRA
LIAN
NATIO
NA
L GREEN
HO
USE ACCO
UN
TS State and Territory Greenhouse G
as Inventories, 2015
IE Included Elsewhere, NO Not Occurring, NE Not Estimated
GREENHOUSE GAS SOURCE AND SINK CATEGORIES 1999 2000 2001 2002 2003 2004 2005 2006 2007
3. Agriculture 18,977 20,515 19,483 19,668 18,078 19,333 19,497 19,116 19,070
A. Enteric Fermentation 15,564 16,774 15,890 15,888 14,663 15,688 15,861 15,488 15,634
B. Manure Management 708 731 809 866 868 923 986 1,024 1,013
C. Rice Cultivation 0 0 0 0 0 0 0 0 0
D. Agricultural Soils 2,413 2,685 2,459 2,633 2,235 2,398 2,357 2,318 2,158
E. Prescribed Burning of Savannas IE IE IE IE IE IE IE IE IE
F. Field Burning of Agricultural Residues 63 60 42 47 46 50 41 38 50
G. Liming 46 42 39 53 53 53 53 53 53
H. Urea Application 183 222 244 182 213 221 199 194 163
I. Other Carbon Containing Fertilisers NE NE NE NE NE NE NE NE NE
J. Other NO NO NO NO NO NO NO NO NO
4. Land Use, Land-Use Change and Forestry 55,927 50,099 61,351 58,993 46,690 41,556 56,678 54,718 45,652
A.1. Afforestation and Reforestation -271 -372 -363 -360 -416 -383 -438 -440 -462
A.2. Deforestation 50,007 47,662 55,214 55,733 42,284 38,457 52,177 50,679 43,279
B.1. Forest management -3,687 -2,732 -3,235 -2,094 -2,983 -2,123 159 -1,814 -2,488
B.2. Cropland management 782 -73 549 -2,030 -689 -743 -2,297 -1,619 -1,371
B.3. Grazing land management 8,925 5,448 9,038 7,621 8,390 6,285 6,937 7,725 6,473
5. Waste 2,993 2,965 3,027 2,901 2,667 2,610 2,500 2,438 2,731
A. Solid Waste Disposal 2,367 2,337 2,360 2,244 2,032 1,962 1,846 1,776 2,054
B. Biological Treatment of Solid Waste 8 9 9 10 11 12 13 14 15
C. Incineration and Open Burning of Waste 4 4 5 5 5 5 5 5 5
D. Waste Water Treatment and Discharge 614 615 654 642 620 631 636 643 657
E. Other NO NO NO NO NO NO NO NO NO
Total CO2 emissions including net CO2 from LULUCF
152,638 150,875 165,665 167,261 155,551 156,354 176,406 175,874 169,286
Table 6: Queensland, kilotonnes of carbon dioxide equivalent emissions (kt CO2-e), 1990 to 2015 (continued)
AUSTRA
LIAN
NATIO
NA
L GREEN
HO
USE ACCO
UN
TS State and Territory Greenhouse G
as Inventories, 2015 / 37 IE Included Elsewhere, NO Not Occurring, NE Not Estimated
GREENHOUSE GAS SOURCE AND SINK CATEGORIES
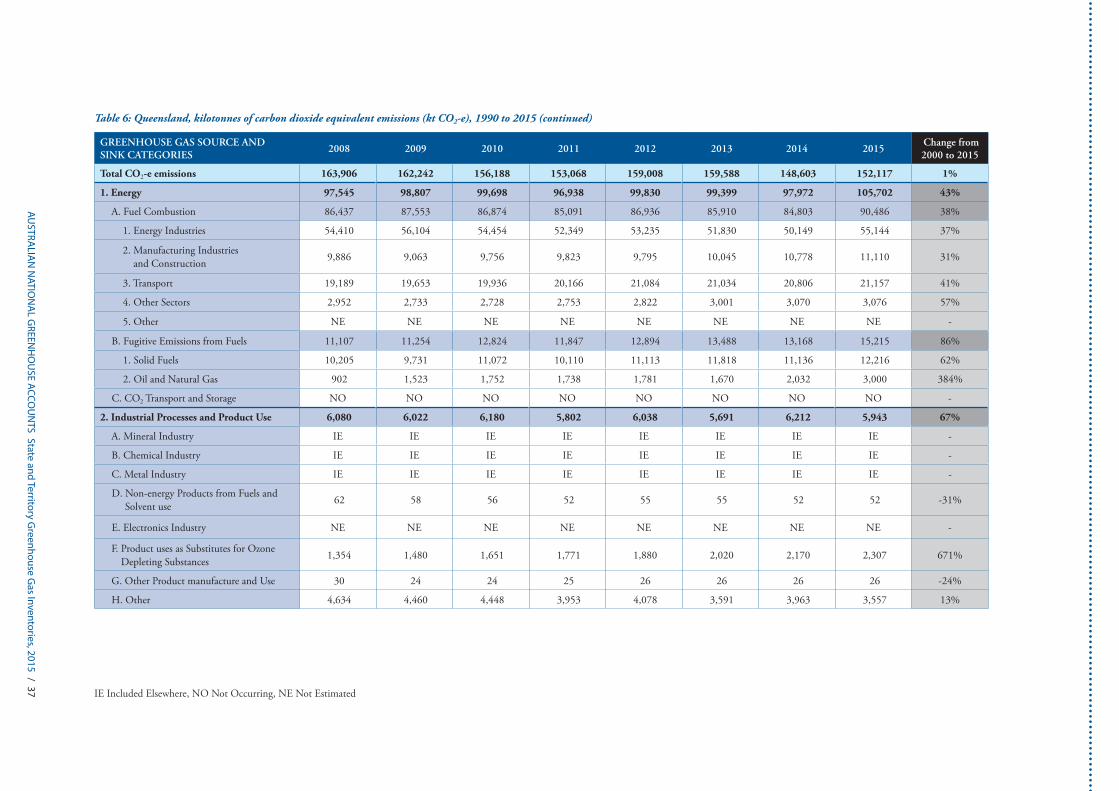
2008 2009 2010 2011 2012 2013 2014 2015 Change from 2000 to 2015
Total CO2-e emissions 163,906 162,242 156,188 153,068 159,008 159,588 148,603 152,117 1%
1. Energy 97,545 98,807 99,698 96,938 99,830 99,399 97,972 105,702 43%
A. Fuel Combustion 86,437 87,553 86,874 85,091 86,936 85,910 84,803 90,486 38%
1. Energy Industries 54,410 56,104 54,454 52,349 53,235 51,830 50,149 55,144 37%
2. Manufacturing Industries and Construction 9,886 9,063 9,756 9,823 9,795 10,045 10,778 11,110 31%
3. Transport 19,189 19,653 19,936 20,166 21,084 21,034 20,806 21,157 41%
4. Other Sectors 2,952 2,733 2,728 2,753 2,822 3,001 3,070 3,076 57%
5. Other NE NE NE NE NE NE NE NE -
B. Fugitive Emissions from Fuels 11,107 11,254 12,824 11,847 12,894 13,488 13,168 15,215 86%
1. Solid Fuels 10,205 9,731 11,072 10,110 11,113 11,818 11,136 12,216 62%
2. Oil and Natural Gas 902 1,523 1,752 1,738 1,781 1,670 2,032 3,000 384%
C. CO2 Transport and Storage NO NO NO NO NO NO NO NO -
2. Industrial Processes and Product Use 6,080 6,022 6,180 5,802 6,038 5,691 6,212 5,943 67%
A. Mineral Industry IE IE IE IE IE IE IE IE -
B. Chemical Industry IE IE IE IE IE IE IE IE -
C. Metal Industry IE IE IE IE IE IE IE IE -
D. Non-energy Products from Fuels and Solvent use 62 58 56 52 55 55 52 52 -31%
E. Electronics Industry NE NE NE NE NE NE NE NE -
F. Product uses as Substitutes for Ozone Depleting Substances 1,354 1,480 1,651 1,771 1,880 2,020 2,170 2,307 671%
G. Other Product manufacture and Use 30 24 24 25 26 26 26 26 -24%
H. Other 4,634 4,460 4,448 3,953 4,078 3,591 3,963 3,557 13%
Table 6: Queensland, kilotonnes of carbon dioxide equivalent emissions (kt CO2-e), 1990 to 2015 (continued)
38 / AUSTRA
LIAN
NATIO
NA
L GREEN
HO
USE ACCO
UN
TS State and Territory Greenhouse G
as Inventories, 2015
IE Included Elsewhere, NO Not Occurring, NE Not Estimated
GREENHOUSE GAS SOURCE AND SINK CATEGORIES
2008 2009 2010 2011 2012 2013 2014 2015 Change from 2000 to 2015
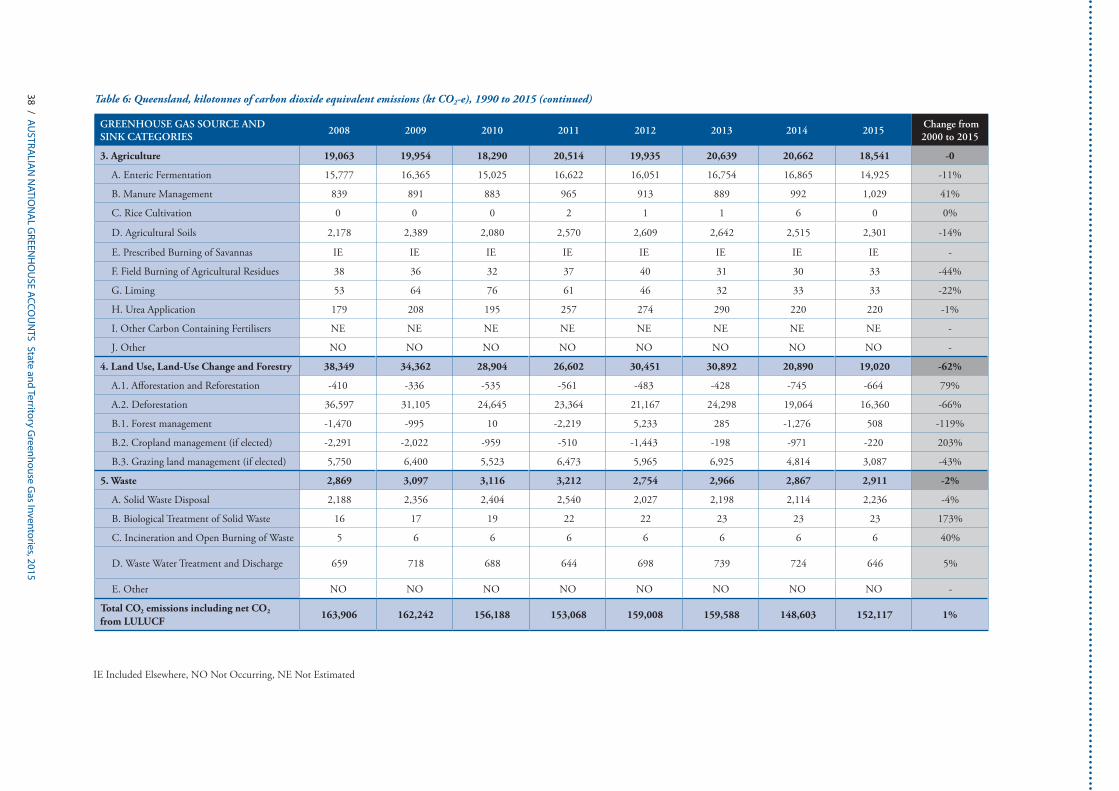
3. Agriculture 19,063 19,954 18,290 20,514 19,935 20,639 20,662 18,541 -0
A. Enteric Fermentation 15,777 16,365 15,025 16,622 16,051 16,754 16,865 14,925 -11%
B. Manure Management 839 891 883 965 913 889 992 1,029 41%
C. Rice Cultivation 0 0 0 2 1 1 6 0 0%
D. Agricultural Soils 2,178 2,389 2,080 2,570 2,609 2,642 2,515 2,301 -14%
E. Prescribed Burning of Savannas IE IE IE IE IE IE IE IE -
F. Field Burning of Agricultural Residues 38 36 32 37 40 31 30 33 -44%
G. Liming 53 64 76 61 46 32 33 33 -22%
H. Urea Application 179 208 195 257 274 290 220 220 -1%
I. Other Carbon Containing Fertilisers NE NE NE NE NE NE NE NE -
J. Other NO NO NO NO NO NO NO NO -
4. Land Use, Land-Use Change and Forestry 38,349 34,362 28,904 26,602 30,451 30,892 20,890 19,020 -62%
A.1. Afforestation and Reforestation -410 -336 -535 -561 -483 -428 -745 -664 79%
A.2. Deforestation 36,597 31,105 24,645 23,364 21,167 24,298 19,064 16,360 -66%
B.1. Forest management -1,470 -995 10 -2,219 5,233 285 -1,276 508 -119%
B.2. Cropland management (if elected) -2,291 -2,022 -959 -510 -1,443 -198 -971 -220 203%
B.3. Grazing land management (if elected) 5,750 6,400 5,523 6,473 5,965 6,925 4,814 3,087 -43%
5. Waste 2,869 3,097 3,116 3,212 2,754 2,966 2,867 2,911 -2%
A. Solid Waste Disposal 2,188 2,356 2,404 2,540 2,027 2,198 2,114 2,236 -4%
B. Biological Treatment of Solid Waste 16 17 19 22 22 23 23 23 173%
C. Incineration and Open Burning of Waste 5 6 6 6 6 6 6 6 40%
D. Waste Water Treatment and Discharge 659 718 688 644 698 739 724 646 5%
E. Other NO NO NO NO NO NO NO NO -
Total CO2 emissions including net CO2 from LULUCF
163,906 162,242 156,188 153,068 159,008 159,588 148,603 152,117 1%
Table 6: Queensland, kilotonnes of carbon dioxide equivalent emissions (kt CO2-e), 1990 to 2015 (continued)

AUSTRA
LIAN
NATIO
NA
L GREEN
HO
USE ACCO
UN
TS State and Territory Greenhouse G
as Inventories, 2015 / 39 IE Included Elsewhere, NO Not Occurring, NE Not Estimated
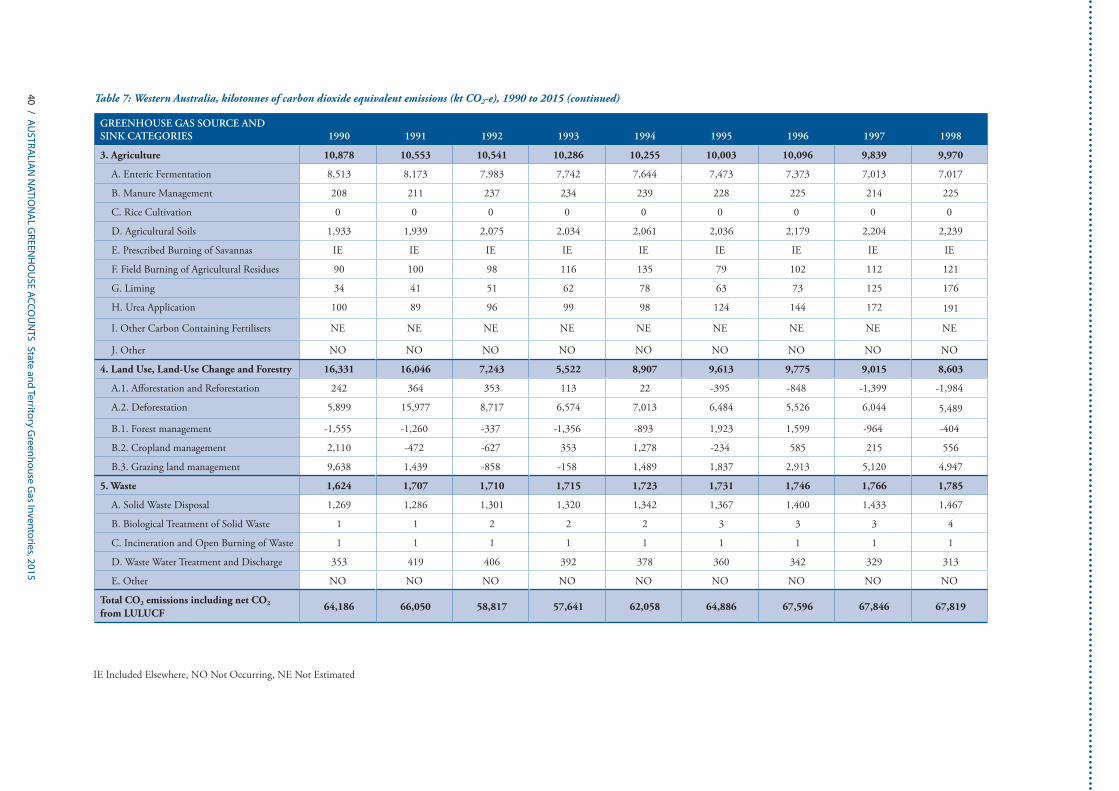
Table 7: Western Australia, kilotonnes of carbon dioxide equivalent emissions (kt CO2-e), 1990 to 2015
GREENHOUSE GAS SOURCE AND SINK CATEGORIES 1990 1991 1992 1993 1994 1995 1996 1997 1998
Total CO2-e emissions 64,186 66,050 58,817 57,641 62,058 64,886 67,596 67,846 67,819
1. Energy 33,464 36,066 37,451 38,041 39,109 41,463 43,712 44,849 44,780
A. Fuel Combustion 30,175 31,649 32,389 33,502 34,688 36,517 38,150 39,021 39,681
1. Energy Industries 13,361 14,486 14,827 15,531 16,085 16,975 18,214 18,428 19,089
2. Manufacturing Industries and Construction 8,400 8,805 9,047 9,250 9,556 9,933 10,002 10,473 10,392
3. Transport 6,689 6,598 6,700 6,864 7,190 7,702 8,010 8,183 8,254
4. Other Sectors 1,726 1,760 1,814 1,856 1,856 1,907 1,924 1,938 1,946
5. Other NE NE NE NE NE NE NE NE NE
B. Fugitive Emissions from Fuels 3,288 4,417 5,062 4,539 4,421 4,946 5,562 5,829 5,099
1. Solid Fuels IE IE IE IE IE IE IE IE IE
2. Oil and Natural Gas IE IE IE IE IE IE IE IE IE
C. CO2 Transport and Storage NO NO NO NO NO NO NO NO NO
2. Industrial Processes and Product Use 1,890 1,678 1,871 2,076 2,063 2,075 2,267 2,378 2,681
A. Mineral Industry 775 765 762 789 887 865 909 958 1,074
B. Chemical Industry 958 757 952 1,127 1,013 1,036 1,156 1,190 1,351
C. Metal Industry IE IE IE IE IE IE IE IE IE
D. Non-energy Products from Fuels and Solvent use 47 43 43 45 46 45 47 47 47
E. Electronics Industry NE NE NE NE NE NE NE NE NE
F. Product uses as Substitutes for Ozone Depleting Substances 0 0 0 0 0 9 40 68 97
G. Other Product manufacture and Use 20 22 23 25 27 29 25 23 21
H. Other 107 109 111 113 114 117 113 111 109
40 / AUSTRA
LIAN
NATIO
NA
L GREEN
HO
USE ACCO
UN
TS State and Territory Greenhouse G
as Inventories, 2015
IE Included Elsewhere, NO Not Occurring, NE Not Estimated
GREENHOUSE GAS SOURCE AND SINK CATEGORIES 1990 1991 1992 1993 1994 1995 1996 1997 1998
3. Agriculture 10,878 10,553 10,541 10,286 10,255 10,003 10,096 9,839 9,970
A. Enteric Fermentation 8,513 8,173 7,983 7,742 7,644 7,473 7,373 7,013 7,017
B. Manure Management 208 211 237 234 239 228 225 214 225
C. Rice Cultivation 0 0 0 0 0 0 0 0 0
D. Agricultural Soils 1,933 1,939 2,075 2,034 2,061 2,036 2,179 2,204 2,239
E. Prescribed Burning of Savannas IE IE IE IE IE IE IE IE IE
F. Field Burning of Agricultural Residues 90 100 98 116 135 79 102 112 121
G. Liming 34 41 51 62 78 63 73 125 176
H. Urea Application 100 89 96 99 98 124 144 172 191
I. Other Carbon Containing Fertilisers NE NE NE NE NE NE NE NE NE
J. Other NO NO NO NO NO NO NO NO NO
4. Land Use, Land-Use Change and Forestry 16,331 16,046 7,243 5,522 8,907 9,613 9,775 9,015 8,603
A.1. Afforestation and Reforestation 242 364 353 113 22 -395 -848 -1,399 -1,984
A.2. Deforestation 5,899 15,977 8,717 6,574 7,013 6,484 5,526 6,044 5,489
B.1. Forest management -1,555 -1,260 -337 -1,356 -893 1,923 1,599 -964 -404
B.2. Cropland management 2,110 -472 -627 353 1,278 -234 585 215 556
B.3. Grazing land management 9,638 1,439 -858 -158 1,489 1,837 2,913 5,120 4,947
5. Waste 1,624 1,707 1,710 1,715 1,723 1,731 1,746 1,766 1,785
A. Solid Waste Disposal 1,269 1,286 1,301 1,320 1,342 1,367 1,400 1,433 1,467
B. Biological Treatment of Solid Waste 1 1 2 2 2 3 3 3 4
C. Incineration and Open Burning of Waste 1 1 1 1 1 1 1 1 1
D. Waste Water Treatment and Discharge 353 419 406 392 378 360 342 329 313
E. Other NO NO NO NO NO NO NO NO NO
Total CO2 emissions including net CO2 from LULUCF
64,186 66,050 58,817 57,641 62,058 64,886 67,596 67,846 67,819
Table 7: Western Australia, kilotonnes of carbon dioxide equivalent emissions (kt CO2-e), 1990 to 2015 (continued)
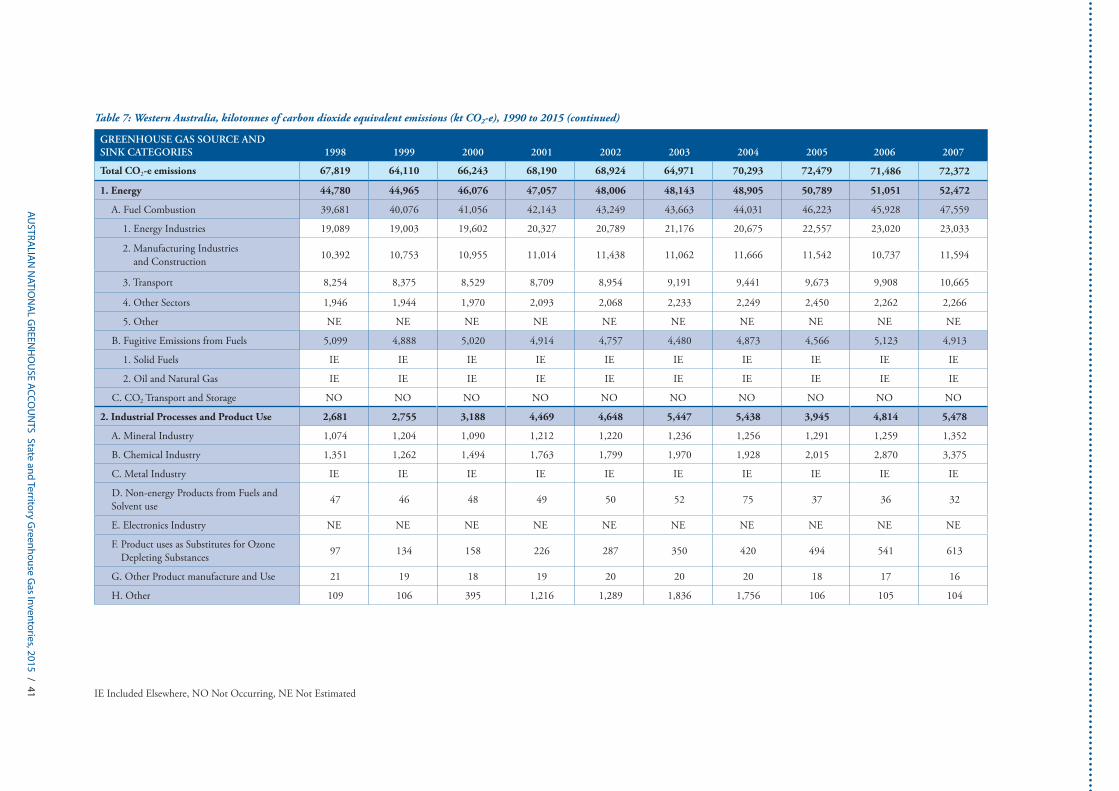
AUSTRA
LIAN
NATIO
NA
L GREEN
HO
USE ACCO
UN
TS State and Territory Greenhouse G
as Inventories, 2015 / 41 IE Included Elsewhere, NO Not Occurring, NE Not Estimated
GREENHOUSE GAS SOURCE AND SINK CATEGORIES 1998 1999 2000 2001 2002 2003 2004 2005 2006 2007
Total CO2-e emissions 67,819 64,110 66,243 68,190 68,924 64,971 70,293 72,479 71,486 72,372
1. Energy 44,780 44,965 46,076 47,057 48,006 48,143 48,905 50,789 51,051 52,472
A. Fuel Combustion 39,681 40,076 41,056 42,143 43,249 43,663 44,031 46,223 45,928 47,559
1. Energy Industries 19,089 19,003 19,602 20,327 20,789 21,176 20,675 22,557 23,020 23,033
2. Manufacturing Industries and Construction 10,392 10,753 10,955 11,014 11,438 11,062 11,666 11,542 10,737 11,594
3. Transport 8,254 8,375 8,529 8,709 8,954 9,191 9,441 9,673 9,908 10,665
4. Other Sectors 1,946 1,944 1,970 2,093 2,068 2,233 2,249 2,450 2,262 2,266
5. Other NE NE NE NE NE NE NE NE NE NE
B. Fugitive Emissions from Fuels 5,099 4,888 5,020 4,914 4,757 4,480 4,873 4,566 5,123 4,913
1. Solid Fuels IE IE IE IE IE IE IE IE IE IE
2. Oil and Natural Gas IE IE IE IE IE IE IE IE IE IE
C. CO2 Transport and Storage NO NO NO NO NO NO NO NO NO NO
2. Industrial Processes and Product Use 2,681 2,755 3,188 4,469 4,648 5,447 5,438 3,945 4,814 5,478
A. Mineral Industry 1,074 1,204 1,090 1,212 1,220 1,236 1,256 1,291 1,259 1,352
B. Chemical Industry 1,351 1,262 1,494 1,763 1,799 1,970 1,928 2,015 2,870 3,375
C. Metal Industry IE IE IE IE IE IE IE IE IE IE
D. Non-energy Products from Fuels and Solvent use 47 46 48 49 50 52 75 37 36 32
E. Electronics Industry NE NE NE NE NE NE NE NE NE NE
F. Product uses as Substitutes for Ozone Depleting Substances 97 134 158 226 287 350 420 494 541 613
G. Other Product manufacture and Use 21 19 18 19 20 20 20 18 17 16
H. Other 109 106 395 1,216 1,289 1,836 1,756 106 105 104
Table 7: Western Australia, kilotonnes of carbon dioxide equivalent emissions (kt CO2-e), 1990 to 2015 (continued)

42 / AUSTRA
LIAN
NATIO
NA
L GREEN
HO
USE ACCO
UN
TS State and Territory Greenhouse G
as Inventories, 2015
IE Included Elsewhere, NO Not Occurring, NE Not Estimated
GREENHOUSE GAS SOURCE AND SINK CATEGORIES 1998 1999 2000 2001 2002 2003 2004 2005 2006 2007
3. Agriculture 9,970 9,999 10,110 9,228 9,441 9,262 10,318 10,470 9,821 9,487
A. Enteric Fermentation 7,017 6,778 7,073 6,544 6,462 6,451 6,832 6,938 6,682 6,457
B. Manure Management 225 211 203 213 253 231 218 243 249 275
C. Rice Cultivation 0 0 0 0 0 0 0 0 0 0
D. Agricultural Soils 2,239 2,417 2,271 1,938 2,079 1,945 2,483 2,579 2,238 2,108
E. Prescribed Burning of Savannas IE IE IE IE IE IE IE IE IE IE
F. Field Burning of Agricultural Residues 121 127 83 54 72 42 100 49 53 32
G. Liming 176 262 231 207 346 380 415 418 420 422
H. Urea Application 191 204 248 272 229 213 269 243 179 192
I. Other Carbon Containing Fertilisers NE NE NE NE NE NE NE NE NE NE
J. Other NO NO NO NO NO NO NO NO NO NO
4. Land Use, Land-Use Change and Forestry 8,603 4,568 5,009 5,526 5,061 720 4,322 5,863 4,435 3,440
A.1. Afforestation and Reforestation -1,984 -2,897 -3,919 -4,862 -5,318 -6,473 -7,200 -7,682 -9,054 -8,299
A.2. Deforestation 5,489 4,438 4,457 4,431 4,788 5,558 6,257 6,740 6,481 7,350
B.1. Forest management -404 185 -727 1,989 1,217 -243 1,860 2,195 1,461 -261
B.2. Cropland management 556 142 659 405 113 -1,028 -217 -796 -1,194 -520
B.3. Grazing land management 4,947 2,700 4,540 3,565 4,265 2,909 3,622 5,408 6,742 5,169
5. Waste 1,785 1,822 1,862 1,910 1,768 1,399 1,310 1,412 1,365 1,495
A. Solid Waste Disposal 1,467 1,506 1,547 1,581 1,467 1,120 1,027 1,125 1,072 1,195
B. Biological Treatment of Solid Waste 4 4 5 5 5 6 6 6 7 7
C. Incineration and Open Burning of Waste 1 1 1 1 1 1 1 1 1 1
D. Waste Water Treatment and Discharge 313 311 309 323 294 272 276 279 285 291
E. Other NO NO NO NO NO NO NO NO NO NO
Total CO2 emissions including net CO2 from LULUCF
67,819 64,110 66,243 68,190 68,924 64,971 70,293 72,479 71,486 72,372
Table 7: Western Australia, kilotonnes of carbon dioxide equivalent emissions (kt CO2-e), 1990 to 2015 (continued)

AUSTRA
LIAN
NATIO
NA
L GREEN
HO
USE ACCO
UN
TS State and Territory Greenhouse G
as Inventories, 2015 / 43 IE Included Elsewhere, NO Not Occurring, NE Not Estimated
GREENHOUSE GAS SOURCE AND SINK CATEGORIES 2008 2009 2010 2011 2012 2013 2014 2015
Change from 2000 to 2015
Total CO2-e emissions 72,901 75,487 73,818 72,756 76,415 78,510 83,812 86,450 31%
1. Energy 53,573 58,247 57,266 60,207 63,417 68,459 69,441 71,766 56%
A. Fuel Combustion 48,509 52,604 50,653 53,585 56,674 61,029 62,479 64,375 57%
1. Energy Industries 22,979 26,480 25,709 27,761 27,267 28,462 28,539 30,091 54%
2. Manufacturing Industries and Construction 12,242 13,088 11,676 12,232 14,215 16,957 17,950 17,598 61%
3. Transport 10,951 10,502 10,638 10,885 12,318 12,688 13,104 13,382 57%
4. Other Sectors 2,337 2,534 2,630 2,706 2,873 2,922 2,886 3,304 68%
5. Other NE NE NE NE NE NE NE NE -
B. Fugitive Emissions from Fuels 5,065 5,644 6,613 6,623 6,743 7,430 6,961 7,390 47%
1. Solid Fuels IE IE IE IE IE IE IE IE -
2. Oil and Natural Gas IE IE IE IE IE IE IE IE -
C. CO2 Transport and Storage NO NO NO NO NO NO NO NO -
2. Industrial Processes and Product Use 4,951 4,987 5,709 5,452 5,686 5,407 5,373 4,557 43%
A. Mineral Industry 1,341 1,331 1,323 1,210 1,383 1,390 1,275 1,100 1%
B. Chemical Industry 2,789 2,775 3,336 3,159 3,069 2,721 2,665 2,007 34%
C. Metal Industry IE IE IE IE IE IE IE IE IE
D. Non-energy Products from Fuels and Solvent use 33 32 33 33 36 36 37 37 -23%
E. Electronics Industry NE NE NE NE NE NE NE NE -
F. Product uses as Substitutes for Ozone Depleting Substances 682 745 839 931 1,002 1,093 1,176 1,250 693%
G. Other Product manufacture and Use 15 12 12 13 14 14 14 14 -22%
H. Other 103 100 109 114 122 102 165 107 -73%
Table 7: Western Australia, kilotonnes of carbon dioxide equivalent emissions (kt CO2-e), 1990 to 2015 (continued)
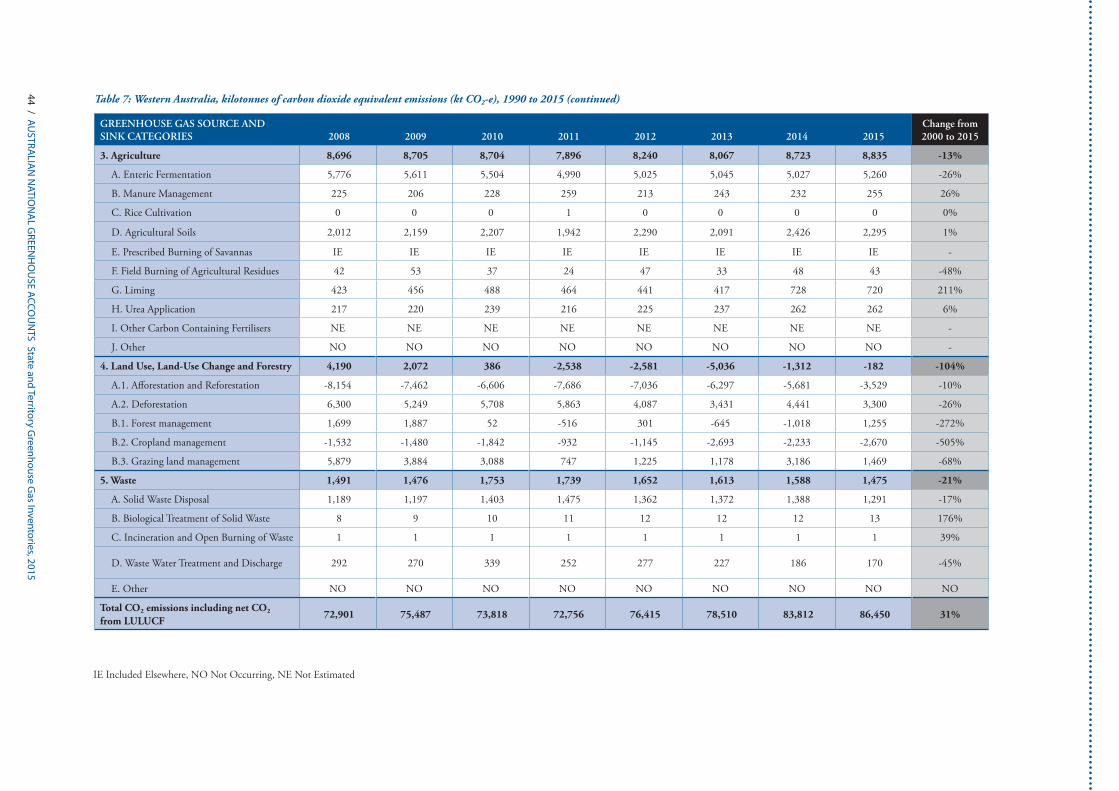
44 / AUSTRA
LIAN
NATIO
NA
L GREEN
HO
USE ACCO
UN
TS State and Territory Greenhouse G
as Inventories, 2015
IE Included Elsewhere, NO Not Occurring, NE Not Estimated
GREENHOUSE GAS SOURCE AND SINK CATEGORIES 2008 2009 2010 2011 2012 2013 2014 2015
Change from 2000 to 2015
3. Agriculture 8,696 8,705 8,704 7,896 8,240 8,067 8,723 8,835 -13%
A. Enteric Fermentation 5,776 5,611 5,504 4,990 5,025 5,045 5,027 5,260 -26%
B. Manure Management 225 206 228 259 213 243 232 255 26%
C. Rice Cultivation 0 0 0 1 0 0 0 0 0%
D. Agricultural Soils 2,012 2,159 2,207 1,942 2,290 2,091 2,426 2,295 1%
E. Prescribed Burning of Savannas IE IE IE IE IE IE IE IE -
F. Field Burning of Agricultural Residues 42 53 37 24 47 33 48 43 -48%
G. Liming 423 456 488 464 441 417 728 720 211%
H. Urea Application 217 220 239 216 225 237 262 262 6%
I. Other Carbon Containing Fertilisers NE NE NE NE NE NE NE NE -
J. Other NO NO NO NO NO NO NO NO -
4. Land Use, Land-Use Change and Forestry 4,190 2,072 386 -2,538 -2,581 -5,036 -1,312 -182 -104%
A.1. Afforestation and Reforestation -8,154 -7,462 -6,606 -7,686 -7,036 -6,297 -5,681 -3,529 -10%
A.2. Deforestation 6,300 5,249 5,708 5,863 4,087 3,431 4,441 3,300 -26%
B.1. Forest management 1,699 1,887 52 -516 301 -645 -1,018 1,255 -272%
B.2. Cropland management -1,532 -1,480 -1,842 -932 -1,145 -2,693 -2,233 -2,670 -505%
B.3. Grazing land management 5,879 3,884 3,088 747 1,225 1,178 3,186 1,469 -68%
5. Waste 1,491 1,476 1,753 1,739 1,652 1,613 1,588 1,475 -21%
A. Solid Waste Disposal 1,189 1,197 1,403 1,475 1,362 1,372 1,388 1,291 -17%
B. Biological Treatment of Solid Waste 8 9 10 11 12 12 12 13 176%
C. Incineration and Open Burning of Waste 1 1 1 1 1 1 1 1 39%
D. Waste Water Treatment and Discharge 292 270 339 252 277 227 186 170 -45%
E. Other NO NO NO NO NO NO NO NO NO
Total CO2 emissions including net CO2 from LULUCF
72,901 75,487 73,818 72,756 76,415 78,510 83,812 86,450 31%
Table 7: Western Australia, kilotonnes of carbon dioxide equivalent emissions (kt CO2-e), 1990 to 2015 (continued)
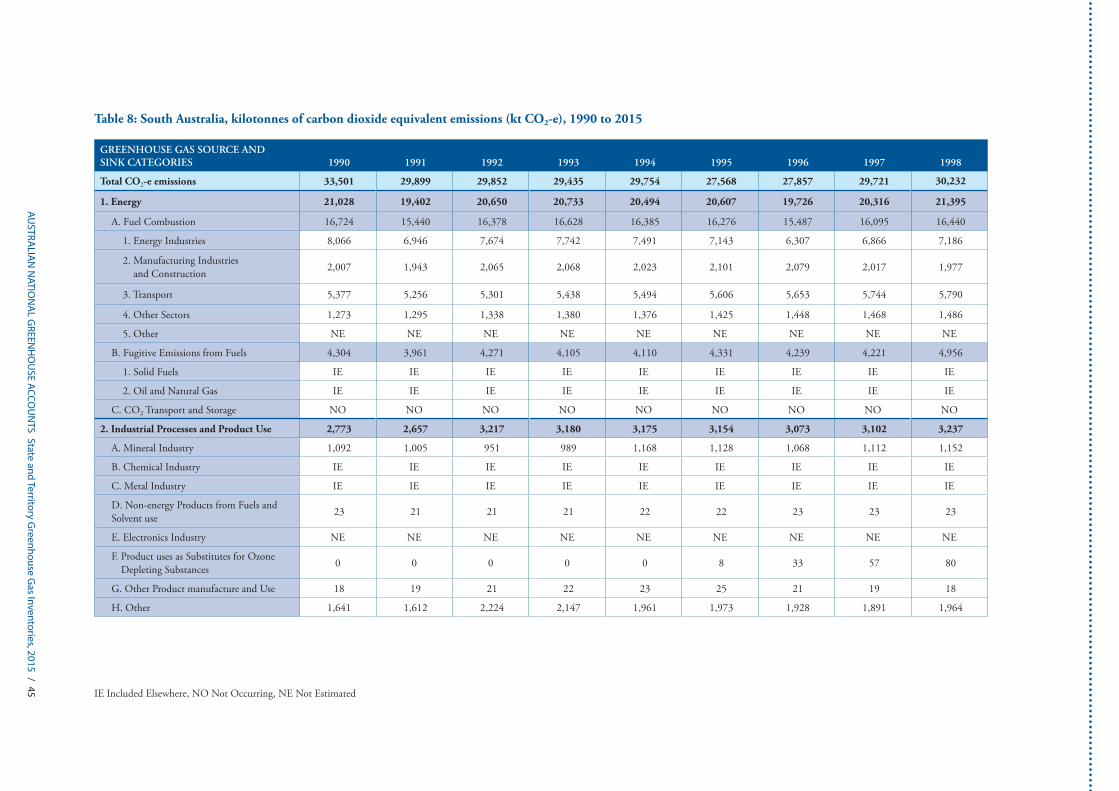
AUSTRA
LIAN
NATIO
NA
L GREEN
HO
USE ACCO
UN
TS State and Territory Greenhouse G
as Inventories, 2015 / 45 IE Included Elsewhere, NO Not Occurring, NE Not Estimated
Table 8: South Australia, kilotonnes of carbon dioxide equivalent emissions (kt CO2-e), 1990 to 2015
GREENHOUSE GAS SOURCE AND SINK CATEGORIES 1990 1991 1992 1993 1994 1995 1996 1997 1998
Total CO2-e emissions 33,501 29,899 29,852 29,435 29,754 27,568 27,857 29,721 30,232
1. Energy 21,028 19,402 20,650 20,733 20,494 20,607 19,726 20,316 21,395
A. Fuel Combustion 16,724 15,440 16,378 16,628 16,385 16,276 15,487 16,095 16,440
1. Energy Industries 8,066 6,946 7,674 7,742 7,491 7,143 6,307 6,866 7,186
2. Manufacturing Industries and Construction 2,007 1,943 2,065 2,068 2,023 2,101 2,079 2,017 1,977
3. Transport 5,377 5,256 5,301 5,438 5,494 5,606 5,653 5,744 5,790
4. Other Sectors 1,273 1,295 1,338 1,380 1,376 1,425 1,448 1,468 1,486
5. Other NE NE NE NE NE NE NE NE NE
B. Fugitive Emissions from Fuels 4,304 3,961 4,271 4,105 4,110 4,331 4,239 4,221 4,956
1. Solid Fuels IE IE IE IE IE IE IE IE IE
2. Oil and Natural Gas IE IE IE IE IE IE IE IE IE
C. CO2 Transport and Storage NO NO NO NO NO NO NO NO NO
2. Industrial Processes and Product Use 2,773 2,657 3,217 3,180 3,175 3,154 3,073 3,102 3,237
A. Mineral Industry 1,092 1,005 951 989 1,168 1,128 1,068 1,112 1,152
B. Chemical Industry IE IE IE IE IE IE IE IE IE
C. Metal Industry IE IE IE IE IE IE IE IE IE
D. Non-energy Products from Fuels and Solvent use 23 21 21 21 22 22 23 23 23
E. Electronics Industry NE NE NE NE NE NE NE NE NE
F. Product uses as Substitutes for Ozone Depleting Substances 0 0 0 0 0 8 33 57 80
G. Other Product manufacture and Use 18 19 21 22 23 25 21 19 18
H. Other 1,641 1,612 2,224 2,147 1,961 1,973 1,928 1,891 1,964

46 / AUSTRA
LIAN
NATIO
NA
L GREEN
HO
USE ACCO
UN
TS State and Territory Greenhouse G
as Inventories, 2015
IE Included Elsewhere, NO Not Occurring, NE Not Estimated
GREENHOUSE GAS SOURCE AND SINK CATEGORIES 1990 1991 1992 1993 1994 1995 1996 1997 1998
3. Agriculture 6,484 6,330 6,221 6,221 6,042 5,813 5,846 5,770 5,938
A. Enteric Fermentation 4,773 4,596 4,459 4,490 4,294 4,073 4,109 3,974 4,033
B. Manure Management 284 264 275 284 287 268 262 265 298
C. Rice Cultivation NO NO NO NO NO NO NO NO NO
D. Agricultural Soils 1,316 1,361 1,366 1,314 1,320 1,359 1,341 1,377 1,439
E. Prescribed Burning of Savannas IE IE IE IE IE IE IE IE IE
F. Field Burning of Agricultural Residues 63 51 59 63 63 37 64 66 66
G. Liming 17 20 24 30 39 26 13 19 25
H. Urea Application 31 39 39 40 40 50 58 70 77
I. Other Carbon Containing Fertilisers NE NE NE NE NE NE NE NE NE
J. Other NO NO NO NO NO NO NO NO NO
4. Land Use, Land-Use Change and Forestry 1,859 153 -1,428 -1,913 -990 -3,233 -1,743 -373 -1,104
A.1. Afforestation and Reforestation 27 81 123 153 176 155 68 -15 -113
A.2. Deforestation 1,251 2,363 1,554 1,593 1,029 961 767 878 712
B.1. Forest management -2,572 -2,880 -1,941 -2,668 -1,546 -2,403 -1,390 -795 -588
B.2. Cropland management 681 -243 -707 59 409 -388 -137 386 -133
B.3. Grazing land management 2,512 867 -432 -1,030 -1,044 -1,545 -1,045 -822 -984
5. Waste 1,357 1,357 1,193 1,214 1,034 1,227 954 905 766
A. Solid Waste Disposal 1,028 1,030 876 911 743 954 701 666 541
B. Biological Treatment of Solid Waste 1 1 1 2 2 2 3 3 3
C. Incineration and Open Burning of Waste 2 2 2 2 2 2 2 2 2
D. Waste Water Treatment and Discharge 326 325 314 300 288 269 249 234 221
E. Other NO NO NO NO NO NO NO NO NO
Total CO2 emissions including net CO2 from LULUCF
33,501 29,899 29,852 29,435 29,754 27,568 27,857 29,721 30,232
Table 8: South Australia, kilotonnes of carbon dioxide equivalent emissions (kt CO2-e), 1990 to 2015 (continued)

AUSTRA
LIAN
NATIO
NA
L GREEN
HO
USE ACCO
UN
TS State and Territory Greenhouse G
as Inventories, 2015 / 47 IE Included Elsewhere, NO Not Occurring, NE Not Estimated
GREENHOUSE GAS SOURCE AND SINK CATEGORIES 1999 2000 2001 2002 2003 2004 2005 2006 2007
Total CO2-e emissions 29,290 30,739 32,317 35,652 33,607 34,451 34,762 34,550 32,954
1. Energy 21,858 22,236 22,492 22,857 23,519 23,431 23,795 23,293 24,290
A. Fuel Combustion 17,511 17,684 17,980 18,380 19,257 19,665 20,133 19,813 20,757
1. Energy Industries 8,167 8,277 8,749 8,996 10,090 9,985 10,140 9,723 10,722
2. Manufacturing Industries and Construction 1,972 1,975 1,968 2,051 1,615 2,073 2,330 2,347 2,203
3. Transport 5,863 5,902 5,687 5,721 5,854 5,991 5,956 5,996 6,099
4. Other Sectors 1,509 1,529 1,576 1,612 1,698 1,616 1,707 1,746 1,733
5. Other NE NE NE NE NE NE NE NE NE
B. Fugitive Emissions from Fuels 4,347 4,552 4,512 4,477 4,261 3,766 3,662 3,481 3,534
1. Solid Fuels IE IE IE IE IE IE IE IE IE
2. Oil and Natural Gas IE IE IE IE IE IE IE IE IE
C. CO2 Transport and Storage NO NO NO NO NO NO NO NO NO
2. Industrial Processes and Product Use 3,170 3,175 3,140 3,158 3,184 3,187 2,999 3,023 3,236
A. Mineral Industry 1,132 1,120 1,063 1,067 1,081 1,072 1,099 1,158 1,281
B. Chemical Industry IE IE IE IE IE IE IE IE IE
C. Metal Industry IE IE IE IE IE IE IE IE IE
D. Non-energy Products from Fuels and Solvent use 22 23 24 24 25 45 16 16 15
E. Electronics Industry NE NE NE NE NE NE NE NE NE
F. Product uses as Substitutes for Ozone Depleting Substances 109 127 180 227 276 327 380 413 464
G. Other Product manufacture and Use 15 15 15 16 16 16 14 13 12
H. Other 1,892 1,890 1,858 1,823 1,787 1,727 1,490 1,424 1,463
Table 8: South Australia, kilotonnes of carbon dioxide equivalent emissions (kt CO2-e), 1990 to 2015 (continued)
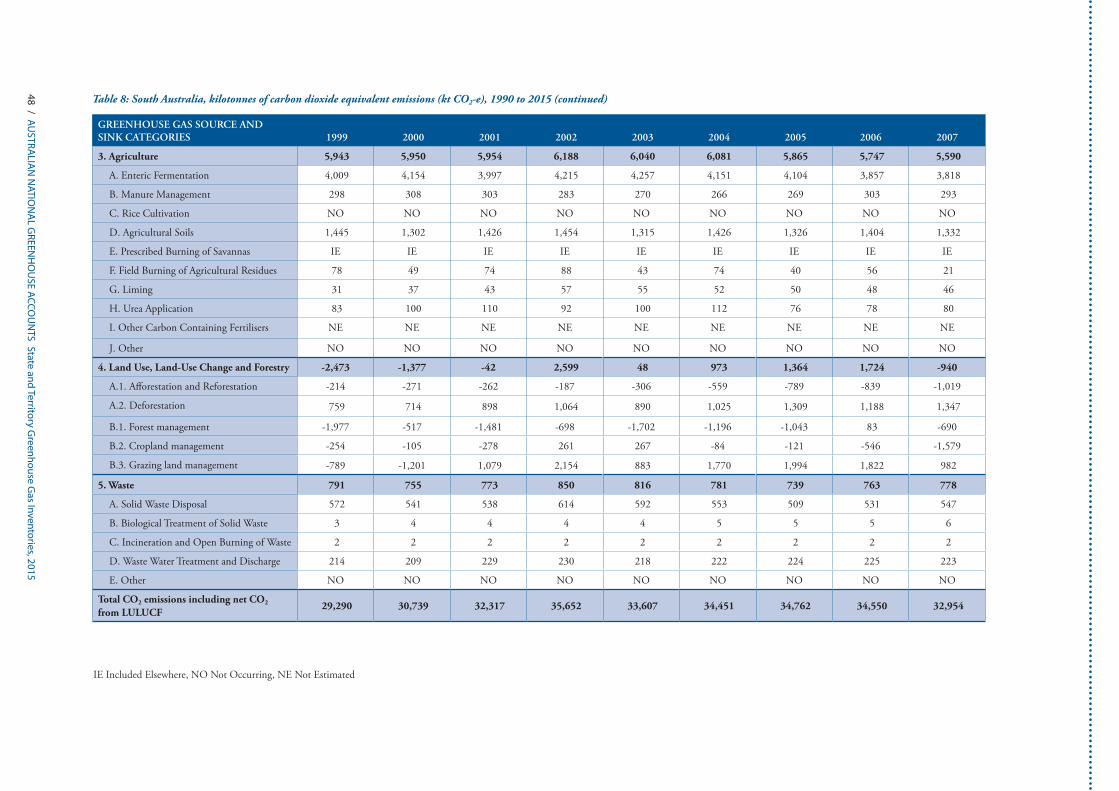
48 / AUSTRA
LIAN
NATIO
NA
L GREEN
HO
USE ACCO
UN
TS State and Territory Greenhouse G
as Inventories, 2015
IE Included Elsewhere, NO Not Occurring, NE Not Estimated
GREENHOUSE GAS SOURCE AND SINK CATEGORIES 1999 2000 2001 2002 2003 2004 2005 2006 2007
3. Agriculture 5,943 5,950 5,954 6,188 6,040 6,081 5,865 5,747 5,590
A. Enteric Fermentation 4,009 4,154 3,997 4,215 4,257 4,151 4,104 3,857 3,818
B. Manure Management 298 308 303 283 270 266 269 303 293
C. Rice Cultivation NO NO NO NO NO NO NO NO NO
D. Agricultural Soils 1,445 1,302 1,426 1,454 1,315 1,426 1,326 1,404 1,332
E. Prescribed Burning of Savannas IE IE IE IE IE IE IE IE IE
F. Field Burning of Agricultural Residues 78 49 74 88 43 74 40 56 21
G. Liming 31 37 43 57 55 52 50 48 46
H. Urea Application 83 100 110 92 100 112 76 78 80
I. Other Carbon Containing Fertilisers NE NE NE NE NE NE NE NE NE
J. Other NO NO NO NO NO NO NO NO NO
4. Land Use, Land-Use Change and Forestry -2,473 -1,377 -42 2,599 48 973 1,364 1,724 -940
A.1. Afforestation and Reforestation -214 -271 -262 -187 -306 -559 -789 -839 -1,019
A.2. Deforestation 759 714 898 1,064 890 1,025 1,309 1,188 1,347
B.1. Forest management -1,977 -517 -1,481 -698 -1,702 -1,196 -1,043 83 -690
B.2. Cropland management -254 -105 -278 261 267 -84 -121 -546 -1,579
B.3. Grazing land management -789 -1,201 1,079 2,154 883 1,770 1,994 1,822 982
5. Waste 791 755 773 850 816 781 739 763 778
A. Solid Waste Disposal 572 541 538 614 592 553 509 531 547
B. Biological Treatment of Solid Waste 3 4 4 4 4 5 5 5 6
C. Incineration and Open Burning of Waste 2 2 2 2 2 2 2 2 2
D. Waste Water Treatment and Discharge 214 209 229 230 218 222 224 225 223
E. Other NO NO NO NO NO NO NO NO NO
Total CO2 emissions including net CO2 from LULUCF
29,290 30,739 32,317 35,652 33,607 34,451 34,762 34,550 32,954
Table 8: South Australia, kilotonnes of carbon dioxide equivalent emissions (kt CO2-e), 1990 to 2015 (continued)

AUSTRA
LIAN
NATIO
NA
L GREEN
HO
USE ACCO
UN
TS State and Territory Greenhouse G
as Inventories, 2015 / 49 IE Included Elsewhere, NO Not Occurring, NE Not Estimated
GREENHOUSE GAS SOURCE AND SINK CATEGORIES 2008 2009 2010 2011 2012 2013 2014 2015
Change from 2000 to 2015
Total CO2-e emissions 32,162 31,804 31,562 29,921 30,931 28,633 29,882 30,136 -2%
1. Energy 24,779 23,474 23,436 21,982 21,208 20,178 19,891 19,768 -11%
A. Fuel Combustion 21,256 21,111 20,758 19,517 18,597 17,714 17,175 17,135 -3%
1. Energy Industries 10,734 10,335 10,019 8,994 7,840 7,159 6,440 6,629 -20%
2. Manufacturing Industries and Construction 2,393 2,704 2,662 2,504 2,920 2,654 2,697 2,382 21%
3. Transport 6,342 6,398 6,458 6,530 6,295 6,320 6,355 6,413 9%
4. Other Sectors 1,786 1,673 1,619 1,489 1,543 1,581 1,682 1,711 12%
5. Other NE NE NE NE NE NE NE NE -
B. Fugitive Emissions from Fuels 3,523 2,363 2,678 2,465 2,611 2,464 2,716 2,633 -42%
1. Solid Fuels IE IE IE IE IE IE IE IE -
2. Oil and Natural Gas IE IE IE IE IE IE IE IE -
C. CO2 Transport and Storage NO NO NO NO NO NO NO NO -
2. Industrial Processes and Product Use 3,158 3,175 3,284 3,279 3,655 3,669 3,416 3,535 11%
A. Mineral Industry 1,177 1,087 1,063 1,056 1,146 1,072 997 1,019 -9%
B. Chemical Industry IE IE IE IE IE IE IE IE -
C. Metal Industry IE IE IE IE IE IE IE IE -
D. Non-energy Products from Fuels and Solvent use 18 18 16 15 15 15 15 15 -35%
E. Electronics Industry NE NE NE NE NE NE NE NE -
F. Product uses as Substitutes for Ozone Depleting Substances 516 564 601 649 682 725 775 820 544%
G. Other Product manufacture and Use 11 9 9 9 9 9 9 9
H. Other 1,436 1,497 1,594 1,550 1,802 1,848 1,620 1,672 -12%
Table 8: South Australia, kilotonnes of carbon dioxide equivalent emissions (kt CO2-e), 1990 to 2015 (continued)
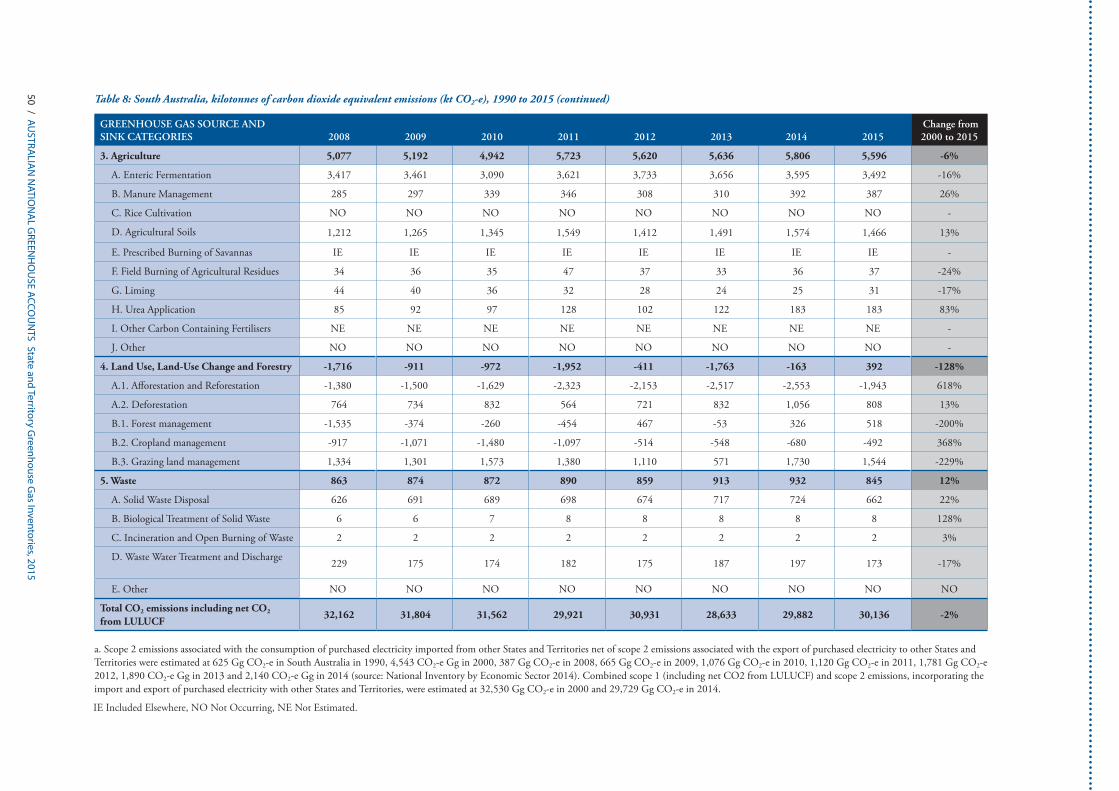
50 / AUSTRA
LIAN
NATIO
NA
L GREEN
HO
USE ACCO
UN
TS State and Territory Greenhouse G
as Inventories, 2015
IE Included Elsewhere, NO Not Occurring, NE Not Estimated.
GREENHOUSE GAS SOURCE AND SINK CATEGORIES 2008 2009 2010 2011 2012 2013 2014 2015
Change from 2000 to 2015
3. Agriculture 5,077 5,192 4,942 5,723 5,620 5,636 5,806 5,596 -6%
A. Enteric Fermentation 3,417 3,461 3,090 3,621 3,733 3,656 3,595 3,492 -16%
B. Manure Management 285 297 339 346 308 310 392 387 26%
C. Rice Cultivation NO NO NO NO NO NO NO NO -
D. Agricultural Soils 1,212 1,265 1,345 1,549 1,412 1,491 1,574 1,466 13%
E. Prescribed Burning of Savannas IE IE IE IE IE IE IE IE -
F. Field Burning of Agricultural Residues 34 36 35 47 37 33 36 37 -24%
G. Liming 44 40 36 32 28 24 25 31 -17%
H. Urea Application 85 92 97 128 102 122 183 183 83%
I. Other Carbon Containing Fertilisers NE NE NE NE NE NE NE NE -
J. Other NO NO NO NO NO NO NO NO -
4. Land Use, Land-Use Change and Forestry -1,716 -911 -972 -1,952 -411 -1,763 -163 392 -128%
A.1. Afforestation and Reforestation -1,380 -1,500 -1,629 -2,323 -2,153 -2,517 -2,553 -1,943 618%
A.2. Deforestation 764 734 832 564 721 832 1,056 808 13%
B.1. Forest management -1,535 -374 -260 -454 467 -53 326 518 -200%
B.2. Cropland management -917 -1,071 -1,480 -1,097 -514 -548 -680 -492 368%
B.3. Grazing land management 1,334 1,301 1,573 1,380 1,110 571 1,730 1,544 -229%
5. Waste 863 874 872 890 859 913 932 845 12%
A. Solid Waste Disposal 626 691 689 698 674 717 724 662 22%
B. Biological Treatment of Solid Waste 6 6 7 8 8 8 8 8 128%
C. Incineration and Open Burning of Waste 2 2 2 2 2 2 2 2 3%
D. Waste Water Treatment and Discharge 229 175 174 182 175 187 197 173 -17%
E. Other NO NO NO NO NO NO NO NO NO
Total CO2 emissions including net CO2 from LULUCF
32,162 31,804 31,562 29,921 30,931 28,633 29,882 30,136 -2%
a. Scope 2 emissions associated with the consumption of purchased electricity imported from other States and Territories net of scope 2 emissions associated with the export of purchased electricity to other States and Territories were estimated at 625 Gg CO2-e in South Australia in 1990, 4,543 CO2-e Gg in 2000, 387 Gg CO2-e in 2008, 665 Gg CO2-e in 2009, 1,076 Gg CO2-e in 2010, 1,120 Gg CO2-e in 2011, 1,781 Gg CO2-e 2012, 1,890 CO2-e Gg in 2013 and 2,140 CO2-e Gg in 2014 (source: National Inventory by Economic Sector 2014). Combined scope 1 (including net CO2 from LULUCF) and scope 2 emissions, incorporating the import and export of purchased electricity with other States and Territories, were estimated at 32,530 Gg CO2-e in 2000 and 29,729 Gg CO2-e in 2014.
Table 8: South Australia, kilotonnes of carbon dioxide equivalent emissions (kt CO2-e), 1990 to 2015 (continued)
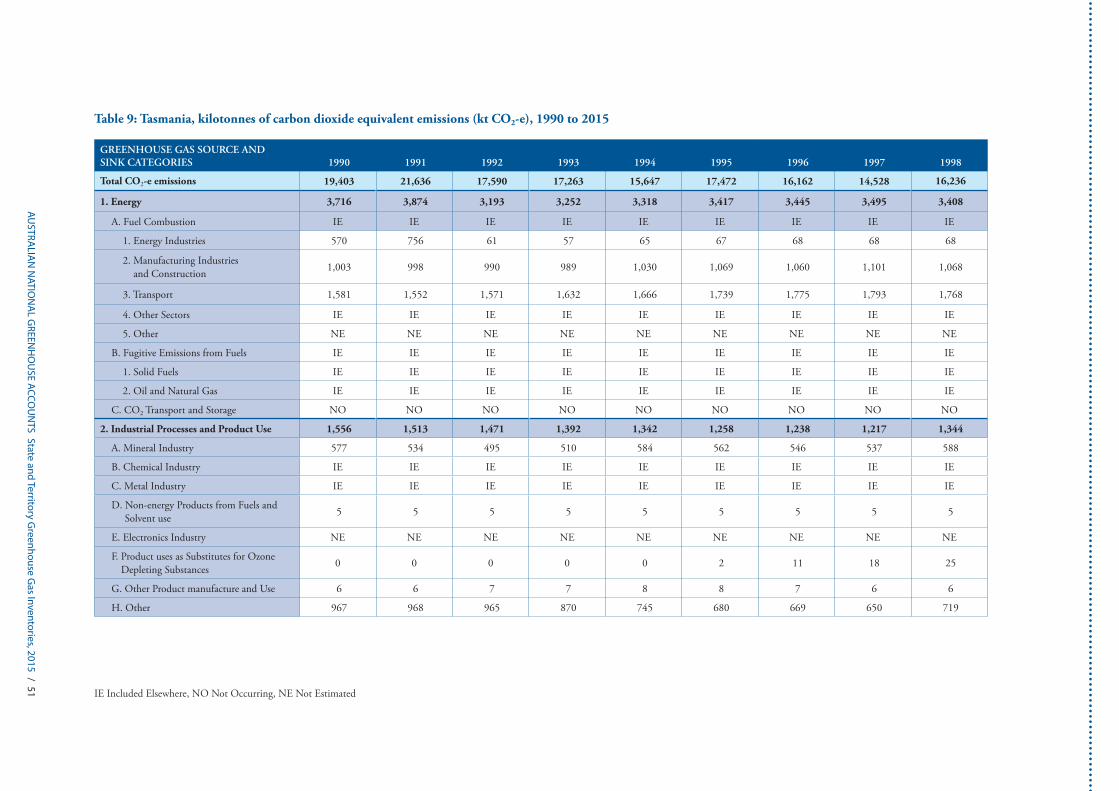
AUSTRA
LIAN
NATIO
NA
L GREEN
HO
USE ACCO
UN
TS State and Territory Greenhouse G
as Inventories, 2015 / 51 IE Included Elsewhere, NO Not Occurring, NE Not Estimated
Table 9: Tasmania, kilotonnes of carbon dioxide equivalent emissions (kt CO2-e), 1990 to 2015
GREENHOUSE GAS SOURCE AND SINK CATEGORIES 1990 1991 1992 1993 1994 1995 1996 1997 1998
Total CO2-e emissions 19,403 21,636 17,590 17,263 15,647 17,472 16,162 14,528 16,236
1. Energy 3,716 3,874 3,193 3,252 3,318 3,417 3,445 3,495 3,408
A. Fuel Combustion IE IE IE IE IE IE IE IE IE
1. Energy Industries 570 756 61 57 65 67 68 68 68
2. Manufacturing Industries and Construction 1,003 998 990 989 1,030 1,069 1,060 1,101 1,068
3. Transport 1,581 1,552 1,571 1,632 1,666 1,739 1,775 1,793 1,768
4. Other Sectors IE IE IE IE IE IE IE IE IE
5. Other NE NE NE NE NE NE NE NE NE
B. Fugitive Emissions from Fuels IE IE IE IE IE IE IE IE IE
1. Solid Fuels IE IE IE IE IE IE IE IE IE
2. Oil and Natural Gas IE IE IE IE IE IE IE IE IE
C. CO2 Transport and Storage NO NO NO NO NO NO NO NO NO
2. Industrial Processes and Product Use 1,556 1,513 1,471 1,392 1,342 1,258 1,238 1,217 1,344
A. Mineral Industry 577 534 495 510 584 562 546 537 588
B. Chemical Industry IE IE IE IE IE IE IE IE IE
C. Metal Industry IE IE IE IE IE IE IE IE IE
D. Non-energy Products from Fuels and Solvent use 5 5 5 5 5 5 5 5 5
E. Electronics Industry NE NE NE NE NE NE NE NE NE
F. Product uses as Substitutes for Ozone Depleting Substances 0 0 0 0 0 2 11 18 25
G. Other Product manufacture and Use 6 6 7 7 8 8 7 6 6
H. Other 967 968 965 870 745 680 669 650 719

52 / AUSTRA
LIAN
NATIO
NA
L GREEN
HO
USE ACCO
UN
TS State and Territory Greenhouse G
as Inventories, 2015
IE Included Elsewhere, NO Not Occurring, NE Not Estimated
GREENHOUSE GAS SOURCE AND SINK CATEGORIES 1990 1991 1992 1993 1994 1995 1996 1997 1998
3. Agriculture 2,315 2,248 2,196 2,194 2,242 2,173 2,274 2,303 2,296
A. Enteric Fermentation 1,880 1,818 1,756 1,746 1,776 1,711 1,773 1,801 1,785
B. Manure Management 47 45 50 51 53 51 49 49 50
C. Rice Cultivation NO NO NO NO NO NO NO NO NO
D. Agricultural Soils 360 351 352 353 363 348 376 370 373
E. Prescribed Burning of Savannas IE IE IE IE IE IE IE IE IE
F. Field Burning of Agricultural Residues 0 0 0 0 0 0 0 0 0
G. Liming 19 22 27 33 38 49 60 63 66
H. Urea Application 10 11 11 11 11 14 16 19 21
I. Other Carbon Containing Fertilisers NE NE NE NE NE NE NE NE NE
J. Other NO NO NO NO NO NO NO NO NO
4. Land Use, Land-Use Change and Forestry 11,350 13,536 10,267 9,964 8,282 10,162 8,744 7,056 8,731
A.1. Afforestation and Reforestation 211 330 501 454 290 154 45 -132 -233
A.2. Deforestation 2,188 8,431 5,905 4,696 3,053 3,092 2,882 2,825 2,788
B.1. Forest management 6,068 4,374 3,485 4,428 4,634 6,665 5,468 4,163 5,978
B.2. Cropland management 77 14 24 17 24 26 23 24 28
B.3. Grazing land management 2,806 387 349 367 279 222 323 173 168
5. Waste 466 464 463 462 464 462 461 459 457
A. Solid Waste Disposal 313 313 314 316 320 324 328 330 332
B. Biological Treatment of Solid Waste 0 0 0 1 1 1 1 1 1
C. Incineration and Open Burning of Waste NO NO NO NO NO NO NO NO NO
D. Waste Water Treatment and Discharge 153 151 149 146 143 138 133 128 125
E. Other NO NO NO NO NO NO NO NO NO
Total CO2 emissions including net CO2 from LULUCF
19,403 21,636 17,590 17,263 15,647 17,472 16,162 14,528 16,236
Table 9: Tasmania, kilotonnes of carbon dioxide equivalent emissions (kt CO2-e), 1990 to 2015 (continued)

AUSTRA
LIAN
NATIO
NA
L GREEN
HO
USE ACCO
UN
TS State and Territory Greenhouse G
as Inventories, 2015 / 53 IE Included Elsewhere, NO Not Occurring, NE Not Estimated
GREENHOUSE GAS SOURCE AND SINK CATEGORIES 1999 2000 2001 2002 2003 2004 2005 2006 2007
Total CO2-e emissions 16,079 19,307 18,873 17,514 21,735 20,224 20,778 16,355 16,797
1. Energy 3,467 3,397 3,414 3,495 3,477 3,736 3,925 4,064 4,083
A. Fuel Combustion IE IE IE IE IE IE IE IE IE
1. Energy Industries 70 65 112 171 200 337 503 508 525
2. Manufacturing Industries and Construction 1,097 1,076 1,024 1,076 874 921 1,003 1,038 1,059
3. Transport 1,757 1,771 1,756 1,765 1,822 1,925 1,966 1,983 2,023
4. Other Sectors IE IE IE IE IE IE IE IE IE
5. Other NE NE NE NE NE NE NE NE NE
B. Fugitive Emissions from Fuels IE IE IE IE IE IE IE IE IE
1. Solid Fuels IE IE IE IE IE IE IE IE IE
2. Oil and Natural Gas IE IE IE IE IE IE IE IE IE
C. CO2 Transport and Storage NO NO NO NO NO NO NO NO NO
2. Industrial Processes and Product Use 1,323 1,360 1,425 1,441 1,475 1,488 1,530 1,475 1,441
A. Mineral Industry 598 611 603 597 616 610 625 661 611
B. Chemical Industry IE IE IE IE IE IE IE IE IE
C. Metal Industry IE IE IE IE IE IE IE IE IE
D. Non-energy Products from Fuels and Solvent use 5 6 6 6 6 5 5 4 4
E. Electronics Industry NE NE NE NE NE NE NE NE NE
F. Product uses as Substitutes for Ozone Depleting Substances 34 40 56 71 86 102 120 130 145
G. Other Product manufacture and Use 5 5 5 5 5 5 4 4 4
H. Other 681 699 755 763 763 765 776 676 677
Table 9: Tasmania, kilotonnes of carbon dioxide equivalent emissions (kt CO2-e), 1990 to 2015 (continued)
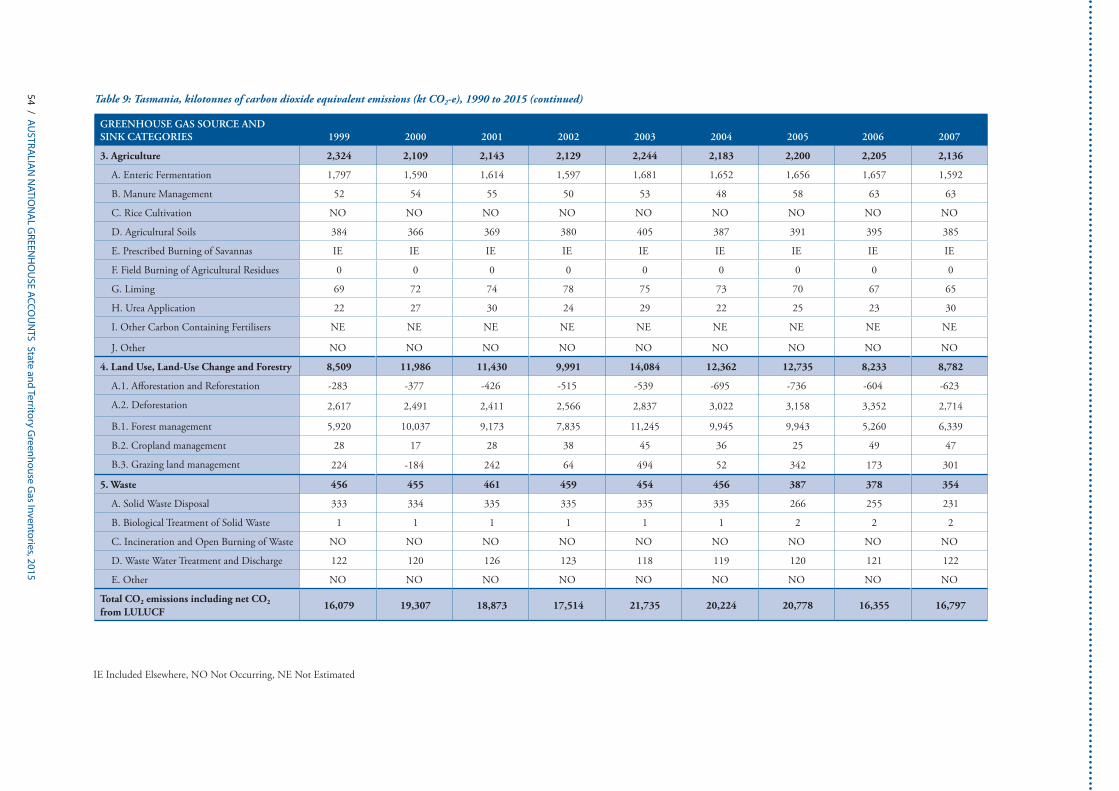
54 / AUSTRA
LIAN
NATIO
NA
L GREEN
HO
USE ACCO
UN
TS State and Territory Greenhouse G
as Inventories, 2015
IE Included Elsewhere, NO Not Occurring, NE Not Estimated
GREENHOUSE GAS SOURCE AND SINK CATEGORIES 1999 2000 2001 2002 2003 2004 2005 2006 2007
3. Agriculture 2,324 2,109 2,143 2,129 2,244 2,183 2,200 2,205 2,136
A. Enteric Fermentation 1,797 1,590 1,614 1,597 1,681 1,652 1,656 1,657 1,592
B. Manure Management 52 54 55 50 53 48 58 63 63
C. Rice Cultivation NO NO NO NO NO NO NO NO NO
D. Agricultural Soils 384 366 369 380 405 387 391 395 385
E. Prescribed Burning of Savannas IE IE IE IE IE IE IE IE IE
F. Field Burning of Agricultural Residues 0 0 0 0 0 0 0 0 0
G. Liming 69 72 74 78 75 73 70 67 65
H. Urea Application 22 27 30 24 29 22 25 23 30
I. Other Carbon Containing Fertilisers NE NE NE NE NE NE NE NE NE
J. Other NO NO NO NO NO NO NO NO NO
4. Land Use, Land-Use Change and Forestry 8,509 11,986 11,430 9,991 14,084 12,362 12,735 8,233 8,782
A.1. Afforestation and Reforestation -283 -377 -426 -515 -539 -695 -736 -604 -623
A.2. Deforestation 2,617 2,491 2,411 2,566 2,837 3,022 3,158 3,352 2,714
B.1. Forest management 5,920 10,037 9,173 7,835 11,245 9,945 9,943 5,260 6,339
B.2. Cropland management 28 17 28 38 45 36 25 49 47
B.3. Grazing land management 224 -184 242 64 494 52 342 173 301
5. Waste 456 455 461 459 454 456 387 378 354
A. Solid Waste Disposal 333 334 335 335 335 335 266 255 231
B. Biological Treatment of Solid Waste 1 1 1 1 1 1 2 2 2
C. Incineration and Open Burning of Waste NO NO NO NO NO NO NO NO NO
D. Waste Water Treatment and Discharge 122 120 126 123 118 119 120 121 122
E. Other NO NO NO NO NO NO NO NO NO
Total CO2 emissions including net CO2 from LULUCF
16,079 19,307 18,873 17,514 21,735 20,224 20,778 16,355 16,797
Table 9: Tasmania, kilotonnes of carbon dioxide equivalent emissions (kt CO2-e), 1990 to 2015 (continued)

AUSTRA
LIAN
NATIO
NA
L GREEN
HO
USE ACCO
UN
TS State and Territory Greenhouse G
as Inventories, 2015 / 55 IE Included Elsewhere, NO Not Occurring, NE Not Estimated
GREENHOUSE GAS SOURCE AND SINK CATEGORIES 2008 2009 2010 2011 2012 2013 2014 2015
Change from 2000 to 2015
Total CO2-e emissions 18,354 16,226 11,971 11,920 3,517 2,146 2,100 890 -95%
1. Energy 4,528 4,240 4,287 4,392 4,046 4,235 3,900 3,690 9%
A. Fuel Combustion IE IE IE IE IE IE IE IE -
1. Energy Industries 670 391 515 651 673 732 422 107 65%
2. Manufacturing Industries and Construction 1,128 1,266 1,172 1,071 1,053 1,226 1,233 1,290 20%
3. Transport 2,088 2,011 2,030 2,076 1,765 1,752 1,717 1,713 -3%
4. Other Sectors IE IE IE IE IE IE IE IE -
5. Other NE NE NE NE NE NE NE NE -
B. Fugitive Emissions from Fuels IE IE IE IE IE IE IE IE -
1. Solid Fuels IE IE IE IE IE IE IE IE -
2. Oil and Natural Gas IE IE IE IE IE IE IE IE -
C. CO2 Transport and Storage NO NO NO NO NO NO NO NO -
2. Industrial Processes and Product Use 1,481 1,471 1,480 1,542 1,484 1,634 1,682 1,800 32%
A. Mineral Industry 648 653 649 632 685 637 651 711 16%
B. Chemical Industry IE IE IE IE IE IE IE IE -
C. Metal Industry IE IE IE IE IE IE IE IE -
D. Non-energy Products from Fuels and Solvent use 3 4 3 3 2 2 2 2 -59%
E. Electronics Industry NE NE NE NE NE NE NE NE -
F. Product uses as Substitutes for Ozone Depleting Substances 161 176 186 202 211 223 237 249 524%
G. Other Product manufacture and Use 4 3 3 3 3 3 3 3 -39%
H. Other 665 636 640 702 583 770 789 835 19%
Table 9: Tasmania, kilotonnes of carbon dioxide equivalent emissions (kt CO2-e), 1990 to 2015 (continued)
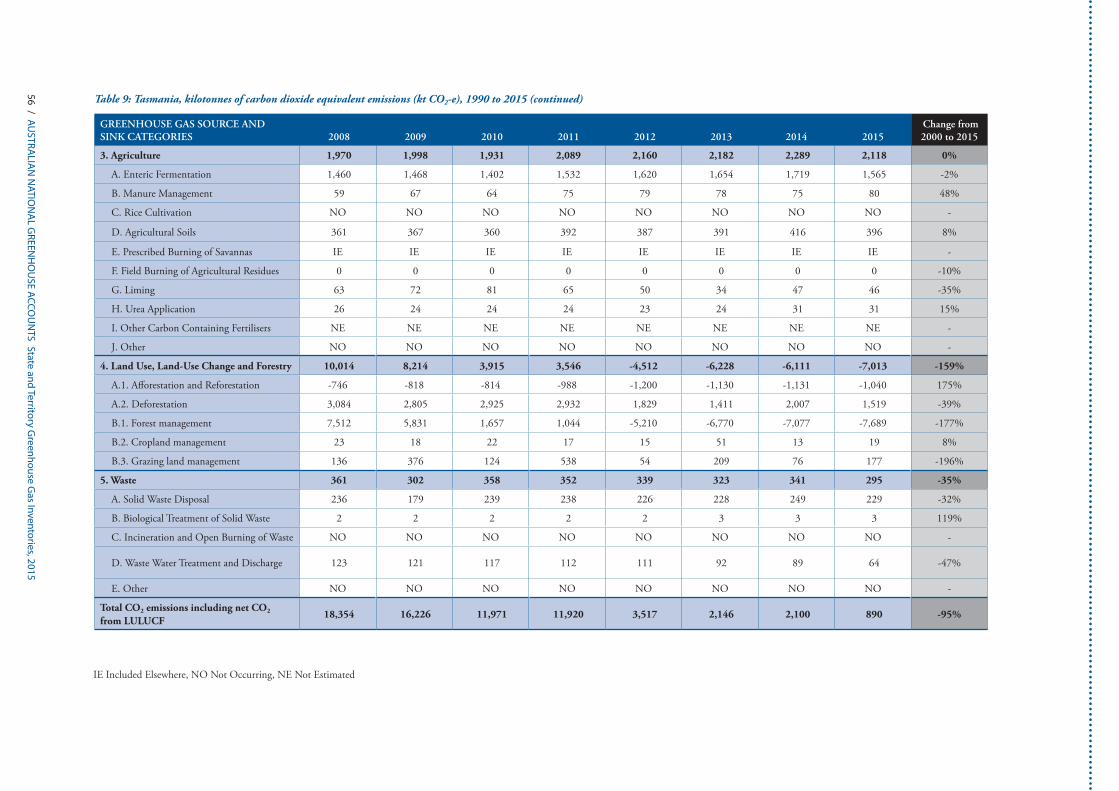
56 / AUSTRA
LIAN
NATIO
NA
L GREEN
HO
USE ACCO
UN
TS State and Territory Greenhouse G
as Inventories, 2015
IE Included Elsewhere, NO Not Occurring, NE Not Estimated
GREENHOUSE GAS SOURCE AND SINK CATEGORIES 2008 2009 2010 2011 2012 2013 2014 2015
Change from 2000 to 2015
3. Agriculture 1,970 1,998 1,931 2,089 2,160 2,182 2,289 2,118 0%
A. Enteric Fermentation 1,460 1,468 1,402 1,532 1,620 1,654 1,719 1,565 -2%
B. Manure Management 59 67 64 75 79 78 75 80 48%
C. Rice Cultivation NO NO NO NO NO NO NO NO -
D. Agricultural Soils 361 367 360 392 387 391 416 396 8%
E. Prescribed Burning of Savannas IE IE IE IE IE IE IE IE -
F. Field Burning of Agricultural Residues 0 0 0 0 0 0 0 0 -10%
G. Liming 63 72 81 65 50 34 47 46 -35%
H. Urea Application 26 24 24 24 23 24 31 31 15%
I. Other Carbon Containing Fertilisers NE NE NE NE NE NE NE NE -
J. Other NO NO NO NO NO NO NO NO -
4. Land Use, Land-Use Change and Forestry 10,014 8,214 3,915 3,546 -4,512 -6,228 -6,111 -7,013 -159%
A.1. Afforestation and Reforestation -746 -818 -814 -988 -1,200 -1,130 -1,131 -1,040 175%
A.2. Deforestation 3,084 2,805 2,925 2,932 1,829 1,411 2,007 1,519 -39%
B.1. Forest management 7,512 5,831 1,657 1,044 -5,210 -6,770 -7,077 -7,689 -177%
B.2. Cropland management 23 18 22 17 15 51 13 19 8%
B.3. Grazing land management 136 376 124 538 54 209 76 177 -196%
5. Waste 361 302 358 352 339 323 341 295 -35%
A. Solid Waste Disposal 236 179 239 238 226 228 249 229 -32%
B. Biological Treatment of Solid Waste 2 2 2 2 2 3 3 3 119%
C. Incineration and Open Burning of Waste NO NO NO NO NO NO NO NO -
D. Waste Water Treatment and Discharge 123 121 117 112 111 92 89 64 -47%
E. Other NO NO NO NO NO NO NO NO -
Total CO2 emissions including net CO2 from LULUCF
18,354 16,226 11,971 11,920 3,517 2,146 2,100 890 -95%
Table 9: Tasmania, kilotonnes of carbon dioxide equivalent emissions (kt CO2-e), 1990 to 2015 (continued)
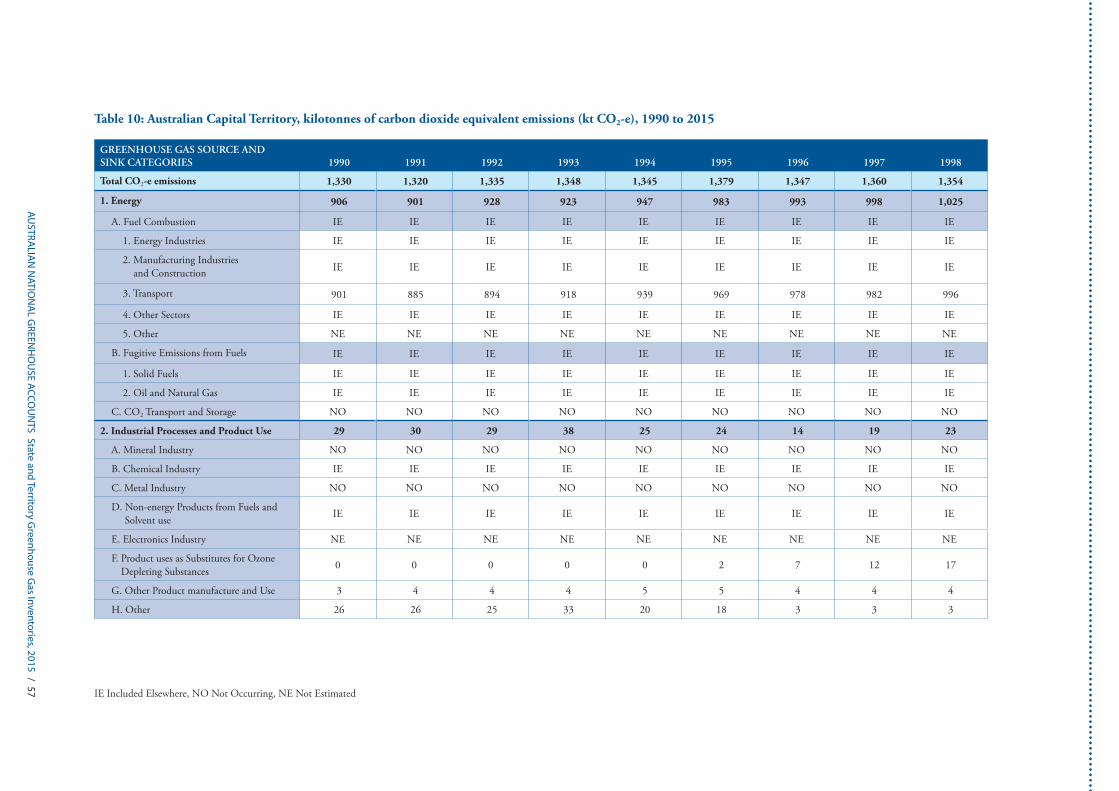
AUSTRA
LIAN
NATIO
NA
L GREEN
HO
USE ACCO
UN
TS State and Territory Greenhouse G
as Inventories, 2015 / 57 IE Included Elsewhere, NO Not Occurring, NE Not Estimated
Table 10: Australian Capital Territory, kilotonnes of carbon dioxide equivalent emissions (kt CO2-e), 1990 to 2015
GREENHOUSE GAS SOURCE AND SINK CATEGORIES 1990 1991 1992 1993 1994 1995 1996 1997 1998
Total CO2-e emissions 1,330 1,320 1,335 1,348 1,345 1,379 1,347 1,360 1,354
1. Energy 906 901 928 923 947 983 993 998 1,025
A. Fuel Combustion IE IE IE IE IE IE IE IE IE
1. Energy Industries IE IE IE IE IE IE IE IE IE
2. Manufacturing Industries and Construction IE IE IE IE IE IE IE IE IE
3. Transport 901 885 894 918 939 969 978 982 996
4. Other Sectors IE IE IE IE IE IE IE IE IE
5. Other NE NE NE NE NE NE NE NE NE
B. Fugitive Emissions from Fuels IE IE IE IE IE IE IE IE IE
1. Solid Fuels IE IE IE IE IE IE IE IE IE
2. Oil and Natural Gas IE IE IE IE IE IE IE IE IE
C. CO2 Transport and Storage NO NO NO NO NO NO NO NO NO
2. Industrial Processes and Product Use 29 30 29 38 25 24 14 19 23
A. Mineral Industry NO NO NO NO NO NO NO NO NO
B. Chemical Industry IE IE IE IE IE IE IE IE IE
C. Metal Industry NO NO NO NO NO NO NO NO NO
D. Non-energy Products from Fuels and Solvent use IE IE IE IE IE IE IE IE IE
E. Electronics Industry NE NE NE NE NE NE NE NE NE
F. Product uses as Substitutes for Ozone Depleting Substances 0 0 0 0 0 2 7 12 17
G. Other Product manufacture and Use 3 4 4 4 5 5 4 4 4
H. Other 26 26 25 33 20 18 3 3 3

58 / AUSTRA
LIAN
NATIO
NA
L GREEN
HO
USE ACCO
UN
TS State and Territory Greenhouse G
as Inventories, 2015
IE Included Elsewhere, NO Not Occurring, NE Not Estimated
GREENHOUSE GAS SOURCE AND SINK CATEGORIES 1990 1991 1992 1993 1994 1995 1996 1997 1998
3. Agriculture 49 46 44 44 43 38 39 40 34
A. Enteric Fermentation 42 40 38 38 37 32 33 34 29
B. Manure Management 1 1 1 1 1 1 1 1 0
C. Rice Cultivation 0 0 0 0 0 0 0 0 0
D. Agricultural Soils 6 6 6 6 5 5 5 5 5
E. Prescribed Burning of Savannas IE IE IE IE IE IE IE IE IE
F. Field Burning of Agricultural Residues 0 0 0 0 0 0 0 0
G. Liming 0 0 0 0 0 0 0 0 0
H. Urea Application NO NO NO NO NO NO NO NO NO
I. Other Carbon Containing Fertilisers NE NE NE NE NE NE NE NE NE
J. Other NO NO NO NO NO NO NO NO NO
4. Land Use, Land-Use Change and Forestry 52 40 23 23 14 8 8 16 9
A.1. Afforestation and Reforestation 0 1 3 4 2 1 -4 -6 -7
A.2. Deforestation 55 53 35 34 29 28 23 31 29
B.1. Forest management -3 -4 -5 -6 -7 -7 -6 -7 -8
B.2. Cropland management -0 0 -0 -0 -0 -0 -0 0 -0
B.3. Grazing land management 3 -5 -5 -5 -6 -9 0 2 -2
5. Waste 293 302 311 320 317 325 294 286 263
A. Solid Waste Disposal IE IE IE IE IE IE IE IE IE
B. Biological Treatment of Solid Waste IE IE IE IE IE IE IE IE IE
C. Incineration and Open Burning of Waste IE IE IE IE IE IE IE IE IE
D. Waste Water Treatment and Discharge IE IE IE IE IE IE IE IE IE
E. Other IE IE IE IE IE IE IE IE IE
Total CO2 emissions including net CO2 from LULUCF 1,330 1,320 1,335 1,348 1,345 1,379 1,347 1,360 1,354
Table 10: Australian Capital Territory, kilotonnes of carbon dioxide equivalent emissions (kt CO2-e), 1990 to 2015 (continued)

AUSTRA
LIAN
NATIO
NA
L GREEN
HO
USE ACCO
UN
TS State and Territory Greenhouse G
as Inventories, 2015 / 59 IE Included Elsewhere, NO Not Occurring, NE Not Estimated
GREENHOUSE GAS SOURCE AND SINK CATEGORIES 1999 2000 2001 2002 2003 2004 2005 2006 2007
Total CO2-e emissions 1,285 1,414 1,245 1,298 1,335 1,421 1,254 1,321 1,330
1. Energy 940 1,077 913 955 930 1,032 898 951 988
A. Fuel Combustion IE IE IE IE IE IE IE IE IE
1. Energy Industries IE IE IE IE IE IE IE IE IE
2. Manufacturing Industries and Construction IE IE IE IE IE IE IE IE IE
3. Transport 917 1,054 891 934 907 1,013 880 932 971
4. Other Sectors IE IE IE IE IE IE IE IE IE
5. Other NE NE NE NE NE NE NE NE NE
B. Fugitive Emissions from Fuels IE IE IE IE IE IE IE IE IE
1. Solid Fuels IE IE IE IE IE IE IE IE IE
2. Oil and Natural Gas IE IE IE IE IE IE IE IE IE
C. CO2 Transport and Storage NO NO NO NO NO NO NO NO NO
2. Industrial Processes and Product Use 29 33 45 55 67 77 87 94 106
A. Mineral Industry NO NO NO NO NO NO NO NO NO
B. Chemical Industry IE IE IE IE IE IE IE IE IE
C. Metal Industry NO NO NO NO NO NO NO NO NO
D. Non-energy Products from Fuels and Solvent use IE IE IE IE IE IE IE IE IE
E. Electronics Industry NE NE NE NE NE NE NE NE NE
F. Product uses as Substitutes for Ozone Depleting Substances 23 27 38 48 58 69 80 87 99
G. Other Product manufacture and Use 3 3 3 3 3 3 3 3 3
H. Other 3 4 4 4 5 5 4 4 4
Table 10: Australian Capital Territory, kilotonnes of carbon dioxide equivalent emissions (kt CO2-e), 1990 to 2015 (continued)

60 / AUSTRA
LIAN
NATIO
NA
L GREEN
HO
USE ACCO
UN
TS State and Territory Greenhouse G
as Inventories, 2015
IE Included Elsewhere, NO Not Occurring, NE Not Estimated
GREENHOUSE GAS SOURCE AND SINK CATEGORIES 1999 2000 2001 2002 2003 2004 2005 2006 2007
3. Agriculture 34 35 44 38 37 35 36 34 31
A. Enteric Fermentation 29 30 37 32 31 29 30 29 26
B. Manure Management 0 0 0 1 1 1 1 1 1
C. Rice Cultivation IE IE IE IE IE IE IE IE IE
D. Agricultural Soils 5 5 6 5 5 5 5 5 4
E. Prescribed Burning of Savannas IE IE IE IE IE IE IE IE IE
F. Field Burning of Agricultural Residues 0 0 0 0 0 0 0 0 0
G. Liming 0 0 0 0 0 0 0 0 0
H. Urea Application NO NO NO NO NO NO NO NO NO
I. Other Carbon Containing Fertilisers NE NE NE NE NE NE NE NE NE
J. Other NO NO NO NO NO NO NO NO NO
4. Land Use, Land-Use Change and Forestry 19 15 -7 -6 78 81 41 52 21
A.1. Afforestation and Reforestation -13 -16 -17 -16 -18 -17 -18 -13 -14
A.2. Deforestation 42 54 25 27 88 110 67 69 39
B.1. Forest management -7 -9 -9 -9 13 -10 -9 -9 -9
B.2. Cropland management -0 -0 0 0 -0 -0 -0 -0 -0
B.3. Grazing land management 2 -9 -2 -4 -3 0 4 8 9
5. Waste 262 253 251 256 224 196 193 189 184
A. Solid Waste Disposal IE IE IE IE IE IE IE IE IE
B. Biological Treatment of Solid Waste IE IE IE IE IE IE IE IE IE
C. Incineration and Open Burning of Waste IE IE IE IE IE IE IE IE IE
D. Waste Water Treatment and Discharge IE IE IE IE IE IE IE IE IE
E. Other IE IE IE IE IE IE IE IE IE
Total CO2 emissions including net CO2 from LULUCF
1,285 1,414 1,245 1,298 1,335 1,421 1,254 1,321 1,330
Table 10: Australian Capital Territory, kilotonnes of carbon dioxide equivalent emissions (kt CO2-e), 1990 to 2015 (continued)

AUSTRA
LIAN
NATIO
NA
L GREEN
HO
USE ACCO
UN
TS State and Territory Greenhouse G
as Inventories, 2015 / 61 IE Included Elsewhere, NO Not Occurring, NE Not Estimated
GREENHOUSE GAS SOURCE AND SINK CATEGORIES 2008 2009 2010 2011 2012 2013 2014 2015
Change from 2000 to 2015
Total CO2-e emissions 1,347 1,363 1,436 1,495 1,469 1,438 1,489 1,573 11%
1. Energy 1,034 1,010 1,052 1,095 1,107 1,086 1,096 1,166 8%
A. Fuel Combustion IE IE IE IE IE IE IE IE -
1. Energy Industries IE IE IE IE IE IE IE IE -
2. Manufacturing Industries and Construction IE IE IE IE IE IE IE IE -
3. Transport 1,014 971 1,006 1,046 1,057 1,042 1,019 1,082 3%
4. Other Sectors IE IE IE IE IE IE IE IE -
5. Other NE NE NE NE NE NE NE NE
B. Fugitive Emissions from Fuels IE IE IE IE IE IE IE IE -
1. Solid Fuels IE IE IE IE IE IE IE IE -
2. Oil and Natural Gas IE IE IE IE IE IE IE IE -
C. CO2 Transport and Storage NO NO NO NO NO NO NO NO -
2. Industrial Processes and Product Use 118 128 138 153 162 173 185 197 490%
A. Mineral Industry NO NO NO NO NO NO NO NO -
B. Chemical Industry IE IE IE IE IE IE IE IE -
C. Metal Industry NO NO NO NO NO NO NO NO -
D. Non-energy Products from Fuels and Solvent use IE IE IE IE IE IE IE IE -
E. Electronics Industry NE NE NE NE NE NE NE NE -
F. Product uses as Substitutes for Ozone Depleting Substances 110 121 131 146 154 165 177 189 611%
G. Other Product manufacture and Use 2 2 2 2 2 2 2 2
H. Other 5 5 5 5 6 6 6 6 57%
Table 10: Australian Capital Territory, kilotonnes of carbon dioxide equivalent emissions (kt CO2-e), 1990 to 2015 (continued)

62 / AUSTRA
LIAN
NATIO
NA
L GREEN
HO
USE ACCO
UN
TS State and Territory Greenhouse G
as Inventories, 2015
IE Included Elsewhere, NO Not Occurring, NE Not Estimated
GREENHOUSE GAS SOURCE AND SINK CATEGORIES 2008 2009 2010 2011 2012 2013 2014 2015
Change from 2000 to 2015
3. Agriculture 25 25 20 25 24 24 18 20 -44%
A. Enteric Fermentation 20 22 18 22 22 22 16 18 -41%
B. Manure Management 1 0 0 0 0 0 0 0 -96%
C. Rice Cultivation IE IE IE IE IE IE IE IE -
D. Agricultural Soils 4 3 2 3 3 3 2 2 -51%
E. Prescribed Burning of Savannas IE IE IE IE IE IE IE IE -
F. Field Burning of Agricultural Residues 0 0 0 0 0 0 0 0 -100%
G. Liming 0 0 0 0 0 0 0 0 -100%
H. Urea Application NO NO NO NO NO NO NO NO -
I. Other Carbon Containing Fertilisers NE NE NE NE NE NE NE NE -
J. Other NO NO NO NO NO NO NO NO -
4. Land Use, Land-Use Change and Forestry -9 -0 22 25 11 -12 11 24 57%
A.1. Afforestation and Reforestation -16 -11 -6 -3 -3 -9 -8 -6 -61%
A.2. Deforestation 12 12 35 31 25 19 28 26 -51%
B.1. Forest management -9 -7 -8 -8 -7 -7 -8 2 -122%
B.2. Cropland management -0 -0 -0 0 0 0 -0 0 -109%
B.3. Grazing land management 6 8 3 6 -4 -13 1 5 -152%
5. Waste 178 201 203 196 164 167 179 167 -34%
A. Solid Waste Disposal IE IE IE IE IE IE IE IE -
B. Biological Treatment of Solid Waste IE IE IE IE IE IE IE IE -
C. Incineration and Open Burning of Waste IE IE IE IE IE IE IE IE -
D. Waste Water Treatment and Discharge IE IE IE IE IE IE IE IE -
E. Other IE IE IE IE IE IE IE IE -
Total CO2 emissions including net CO2 from LULUCF
1,347 1,363 1,436 1,495 1,469 1,438 1,489 1,573 11%
Table 10: Australian Capital Territory, kilotonnes of carbon dioxide equivalent emissions (kt CO2-e), 1990 to 2015 (continued)
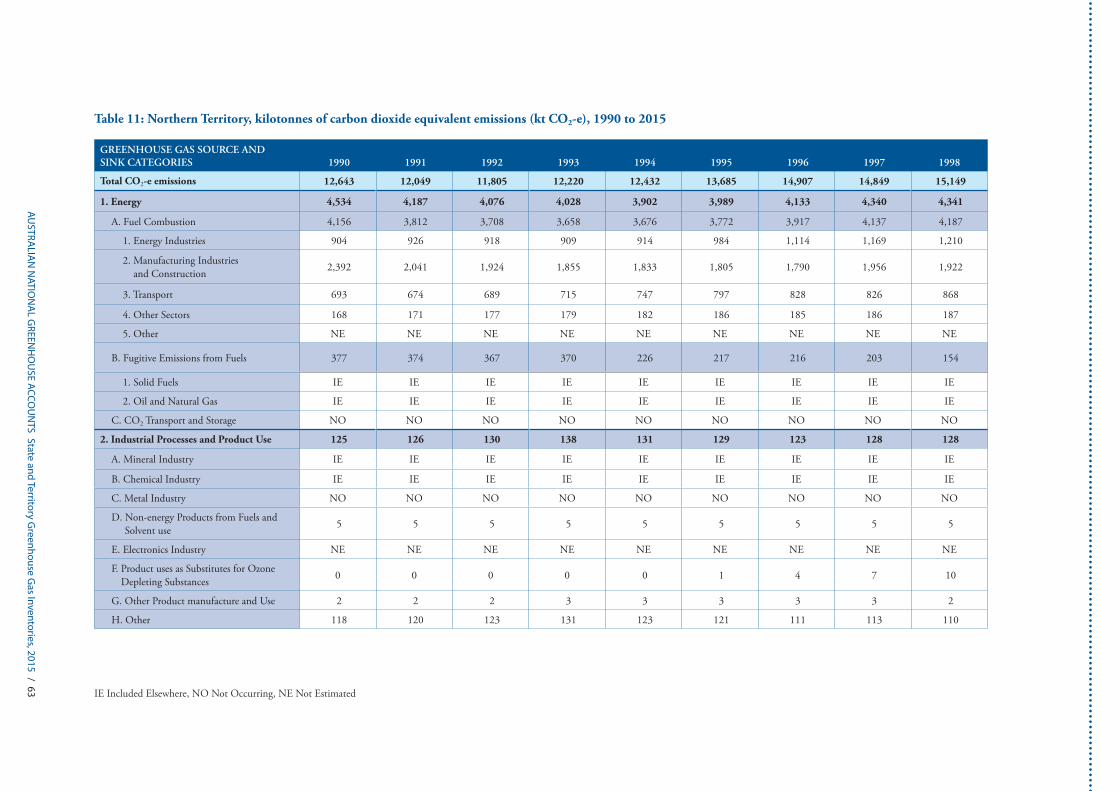
AUSTRA
LIAN
NATIO
NA
L GREEN
HO
USE ACCO
UN
TS State and Territory Greenhouse G
as Inventories, 2015 / 63 IE Included Elsewhere, NO Not Occurring, NE Not Estimated
Table 11: Northern Territory, kilotonnes of carbon dioxide equivalent emissions (kt CO2-e), 1990 to 2015
GREENHOUSE GAS SOURCE AND SINK CATEGORIES 1990 1991 1992 1993 1994 1995 1996 1997 1998
Total CO2-e emissions 12,643 12,049 11,805 12,220 12,432 13,685 14,907 14,849 15,149
1. Energy 4,534 4,187 4,076 4,028 3,902 3,989 4,133 4,340 4,341
A. Fuel Combustion 4,156 3,812 3,708 3,658 3,676 3,772 3,917 4,137 4,187
1. Energy Industries 904 926 918 909 914 984 1,114 1,169 1,210
2. Manufacturing Industries and Construction 2,392 2,041 1,924 1,855 1,833 1,805 1,790 1,956 1,922
3. Transport 693 674 689 715 747 797 828 826 868
4. Other Sectors 168 171 177 179 182 186 185 186 187
5. Other NE NE NE NE NE NE NE NE NE
B. Fugitive Emissions from Fuels 377 374 367 370 226 217 216 203 154
1. Solid Fuels IE IE IE IE IE IE IE IE IE
2. Oil and Natural Gas IE IE IE IE IE IE IE IE IE
C. CO2 Transport and Storage NO NO NO NO NO NO NO NO NO
2. Industrial Processes and Product Use 125 126 130 138 131 129 123 128 128
A. Mineral Industry IE IE IE IE IE IE IE IE IE
B. Chemical Industry IE IE IE IE IE IE IE IE IE
C. Metal Industry NO NO NO NO NO NO NO NO NO
D. Non-energy Products from Fuels and Solvent use 5 5 5 5 5 5 5 5 5
E. Electronics Industry NE NE NE NE NE NE NE NE NE
F. Product uses as Substitutes for Ozone Depleting Substances 0 0 0 0 0 1 4 7 10
G. Other Product manufacture and Use 2 2 2 3 3 3 3 3 2
H. Other 118 120 123 131 123 121 111 113 110

64 / AUSTRA
LIAN
NATIO
NA
L GREEN
HO
USE ACCO
UN
TS State and Territory Greenhouse G
as Inventories, 2015
IE Included Elsewhere, NO Not Occurring, NE Not Estimated
GREENHOUSE GAS SOURCE AND SINK CATEGORIES 1990 1991 1992 1993 1994 1995 1996 1997 1998
3. Agriculture 1,744 1,790 1,775 1,759 1,863 1,843 1,938 1,977 2,024
A. Enteric Fermentation 1,635 1,674 1,666 1,651 1,751 1,727 1,822 1,861 1,907
B. Manure Management 4 4 4 4 4 4 4 4 4
C. Rice Cultivation 1 1 1 0 1 0 1 1 0
D. Agricultural Soils 104 111 105 103 108 111 110 111 113
E. Prescribed Burning of Savannas IE IE IE IE IE IE IE IE IE
F. Field Burning of Agricultural Residues 0 0 0 0 0 0 0 0 0
G. Liming 0 0 0 0 0 0 0 0 0
H. Urea Application 0 0 0 0 0 0 0 0 0
I. Other Carbon Containing Fertilisers NE NE NE NE NE NE NE NE NE
J. Other NO NO NO NO NO NO NO NO NO
4. Land Use, Land-Use Change and Forestry 6,113 5,817 5,693 6,161 6,401 7,589 8,577 8,267 8,519
A.1. Afforestation and Reforestation 9 -23 -45 -37 -77 -101 20 69 46
A.2. Deforestation 398 419 615 480 319 287 356 468 384
B.1. Forest management 0 0 2 3 -0 0 0 15 4
B.2. Cropland management 20 20 19 20 20 18 14 22 20
B.3. Grazing land management 5,563 5,279 4,991 5,595 6,045 7,312 8,128 7,656 8,033
5. Waste 127 129 131 133 134 135 136 137 137
A. Solid Waste Disposal IE IE IE IE IE IE IE IE IE
B. Biological Treatment of Solid Waste IE IE IE IE IE IE IE IE IE
C. Incineration and Open Burning of Waste IE IE IE IE IE IE IE IE IE
D. Waste Water Treatment and Discharge IE IE IE IE IE IE IE IE IE
E. Other IE IE IE IE IE IE IE IE IE
Total CO2 emissions including net CO2 from LULUCF
12,643 12,049 11,805 12,220 12,432 13,685 14,907 14,849 15,149
Table 11: Northern Territory, kilotonnes of carbon dioxide equivalent emissions (kt CO2-e), 1990 to 2015 (continued)
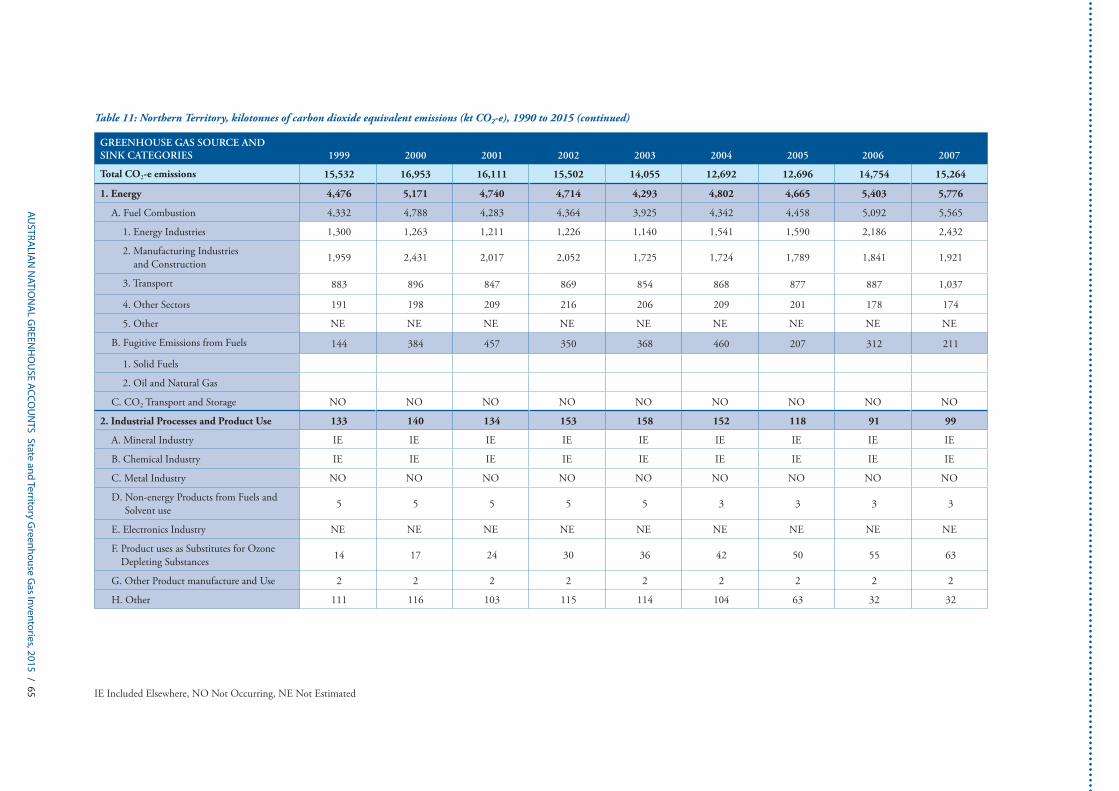
AUSTRA
LIAN
NATIO
NA
L GREEN
HO
USE ACCO
UN
TS State and Territory Greenhouse G
as Inventories, 2015 / 65 IE Included Elsewhere, NO Not Occurring, NE Not Estimated
GREENHOUSE GAS SOURCE AND SINK CATEGORIES 1999 2000 2001 2002 2003 2004 2005 2006 2007
Total CO2-e emissions 15,532 16,953 16,111 15,502 14,055 12,692 12,696 14,754 15,264
1. Energy 4,476 5,171 4,740 4,714 4,293 4,802 4,665 5,403 5,776
A. Fuel Combustion 4,332 4,788 4,283 4,364 3,925 4,342 4,458 5,092 5,565
1. Energy Industries 1,300 1,263 1,211 1,226 1,140 1,541 1,590 2,186 2,432
2. Manufacturing Industries and Construction 1,959 2,431 2,017 2,052 1,725 1,724 1,789 1,841 1,921
3. Transport 883 896 847 869 854 868 877 887 1,037
4. Other Sectors 191 198 209 216 206 209 201 178 174
5. Other NE NE NE NE NE NE NE NE NE
B. Fugitive Emissions from Fuels 144 384 457 350 368 460 207 312 211
1. Solid Fuels
2. Oil and Natural Gas
C. CO2 Transport and Storage NO NO NO NO NO NO NO NO NO
2. Industrial Processes and Product Use 133 140 134 153 158 152 118 91 99
A. Mineral Industry IE IE IE IE IE IE IE IE IE
B. Chemical Industry IE IE IE IE IE IE IE IE IE
C. Metal Industry NO NO NO NO NO NO NO NO NO
D. Non-energy Products from Fuels and Solvent use 5 5 5 5 5 3 3 3 3
E. Electronics Industry NE NE NE NE NE NE NE NE NE
F. Product uses as Substitutes for Ozone Depleting Substances 14 17 24 30 36 42 50 55 63
G. Other Product manufacture and Use 2 2 2 2 2 2 2 2 2
H. Other 111 116 103 115 114 104 63 32 32
Table 11: Northern Territory, kilotonnes of carbon dioxide equivalent emissions (kt CO2-e), 1990 to 2015 (continued)

66 / AUSTRA
LIAN
NATIO
NA
L GREEN
HO
USE ACCO
UN
TS State and Territory Greenhouse G
as Inventories, 2015
IE Included Elsewhere, NO Not Occurring, NE Not Estimated
GREENHOUSE GAS SOURCE AND SINK CATEGORIES 1999 2000 2001 2002 2003 2004 2005 2006 2007
3. Agriculture 2,025 2,029 2,213 2,316 2,192 2,262 2,265 2,299 2,432
A. Enteric Fermentation 1,903 1,907 2,074 2,178 2,064 2,128 2,133 2,158 2,294
B. Manure Management 4 4 4 5 4 4 4 4 2
C. Rice Cultivation 0 0 0 0 0 0 0 0 0
D. Agricultural Soils 117 117 133 132 123 129 127 136 135
E. Prescribed Burning of Savannas IE IE IE IE IE IE IE IE IE
F. Field Burning of Agricultural Residues 0 0 0 0 0 0 0 0 0
G. Liming 0 0 0 0 0 0 0 0 0
H. Urea Application 0 1 1 1 0 1 0 0 0
I. Other Carbon Containing Fertilisers NE NE NE NE NE NE NE NE NE
J. Other NO NO NO NO NO NO NO NO NO
4. Land Use, Land-Use Change and Forestry 8,759 9,471 8,877 8,169 7,256 5,322 5,534 6,866 6,854
A.1. Afforestation and Reforestation 62 30 8 12 -8 32 78 133 69
A.2. Deforestation 265 317 317 335 332 336 392 456 469
B.1. Forest management 17 9 8 3 -2 1 -2 -1 -2
B.2. Cropland management 18 19 333 141 112 -68 21 -62 84
B.3. Grazing land management 8,370 9,072 8,187 7,678 6,823 5,016 5,039 6,342 6,239
5. Waste 139 142 147 151 155 154 114 95 102
A. Solid Waste Disposal IE IE IE IE IE IE IE IE IE
B. Biological Treatment of Solid Waste IE IE IE IE IE IE IE IE IE
C. Incineration and Open Burning of Waste IE IE IE IE IE IE IE IE IE
D. Waste Water Treatment and Discharge IE IE IE IE IE IE IE IE IE
E. Other IE IE IE IE IE IE IE IE IE
Total CO2 emissions including net CO2 from LULUCF
15,532 16,953 16,111 15,502 14,055 12,692 12,696 14,754 15,264
Table 11: Northern Territory, kilotonnes of carbon dioxide equivalent emissions (kt CO2-e), 1990 to 2015 (continued)
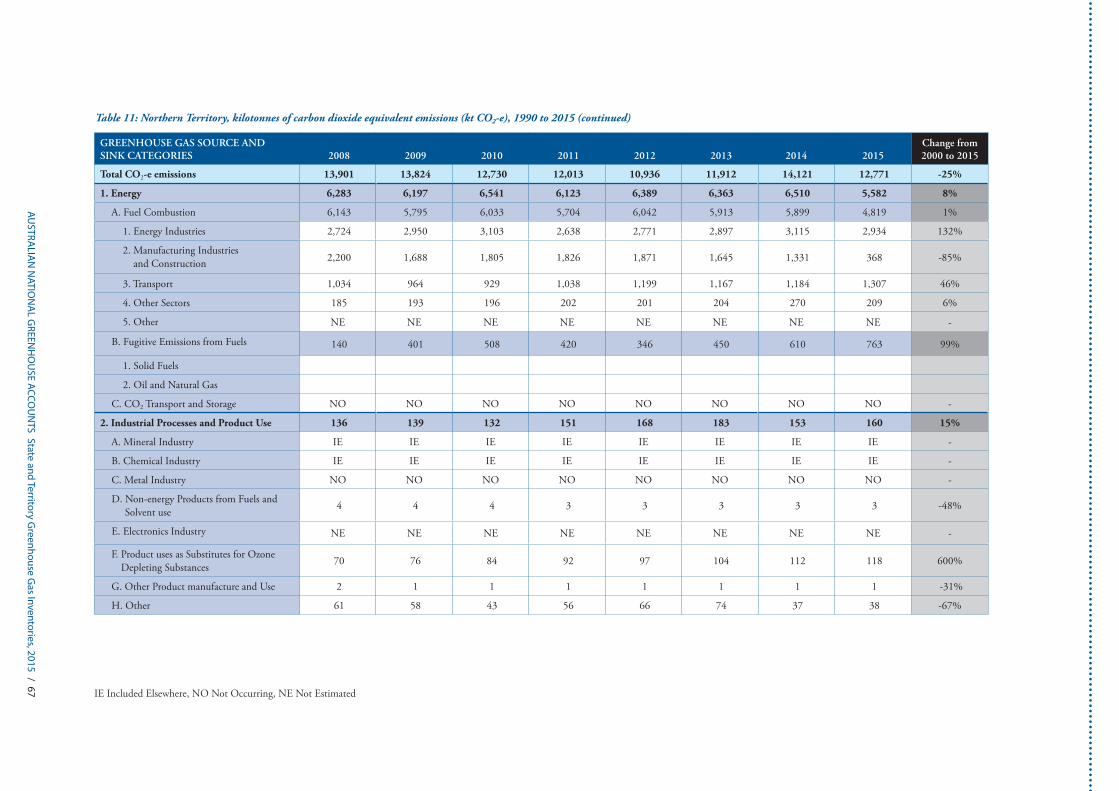
AUSTRA
LIAN
NATIO
NA
L GREEN
HO
USE ACCO
UN
TS State and Territory Greenhouse G
as Inventories, 2015 / 67 IE Included Elsewhere, NO Not Occurring, NE Not Estimated
GREENHOUSE GAS SOURCE AND SINK CATEGORIES 2008 2009 2010 2011 2012 2013 2014 2015
Change from 2000 to 2015
Total CO2-e emissions 13,901 13,824 12,730 12,013 10,936 11,912 14,121 12,771 -25%
1. Energy 6,283 6,197 6,541 6,123 6,389 6,363 6,510 5,582 8%
A. Fuel Combustion 6,143 5,795 6,033 5,704 6,042 5,913 5,899 4,819 1%
1. Energy Industries 2,724 2,950 3,103 2,638 2,771 2,897 3,115 2,934 132%
2. Manufacturing Industries and Construction 2,200 1,688 1,805 1,826 1,871 1,645 1,331 368 -85%
3. Transport 1,034 964 929 1,038 1,199 1,167 1,184 1,307 46%
4. Other Sectors 185 193 196 202 201 204 270 209 6%
5. Other NE NE NE NE NE NE NE NE -
B. Fugitive Emissions from Fuels 140 401 508 420 346 450 610 763 99%
1. Solid Fuels
2. Oil and Natural Gas
C. CO2 Transport and Storage NO NO NO NO NO NO NO NO -
2. Industrial Processes and Product Use 136 139 132 151 168 183 153 160 15%
A. Mineral Industry IE IE IE IE IE IE IE IE -
B. Chemical Industry IE IE IE IE IE IE IE IE -
C. Metal Industry NO NO NO NO NO NO NO NO -
D. Non-energy Products from Fuels and Solvent use 4 4 4 3 3 3 3 3 -48%
E. Electronics Industry NE NE NE NE NE NE NE NE -
F. Product uses as Substitutes for Ozone Depleting Substances 70 76 84 92 97 104 112 118 600%
G. Other Product manufacture and Use 2 1 1 1 1 1 1 1 -31%
H. Other 61 58 43 56 66 74 37 38 -67%
Table 11: Northern Territory, kilotonnes of carbon dioxide equivalent emissions (kt CO2-e), 1990 to 2015 (continued)
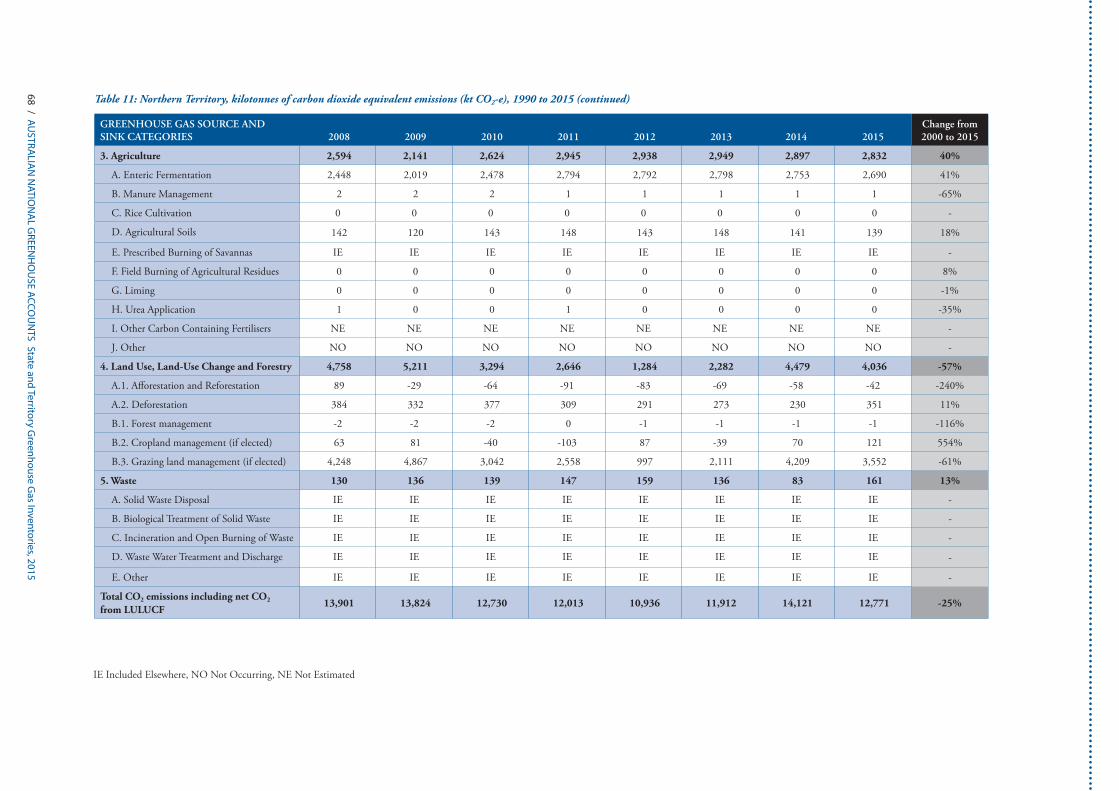
68 / AUSTRA
LIAN
NATIO
NA
L GREEN
HO
USE ACCO
UN
TS State and Territory Greenhouse G
as Inventories, 2015
IE Included Elsewhere, NO Not Occurring, NE Not Estimated
GREENHOUSE GAS SOURCE AND SINK CATEGORIES 2008 2009 2010 2011 2012 2013 2014 2015
Change from 2000 to 2015
3. Agriculture 2,594 2,141 2,624 2,945 2,938 2,949 2,897 2,832 40%
A. Enteric Fermentation 2,448 2,019 2,478 2,794 2,792 2,798 2,753 2,690 41%
B. Manure Management 2 2 2 1 1 1 1 1 -65%
C. Rice Cultivation 0 0 0 0 0 0 0 0 -
D. Agricultural Soils 142 120 143 148 143 148 141 139 18%
E. Prescribed Burning of Savannas IE IE IE IE IE IE IE IE -
F. Field Burning of Agricultural Residues 0 0 0 0 0 0 0 0 8%
G. Liming 0 0 0 0 0 0 0 0 -1%
H. Urea Application 1 0 0 1 0 0 0 0 -35%
I. Other Carbon Containing Fertilisers NE NE NE NE NE NE NE NE -
J. Other NO NO NO NO NO NO NO NO -
4. Land Use, Land-Use Change and Forestry 4,758 5,211 3,294 2,646 1,284 2,282 4,479 4,036 -57%
A.1. Afforestation and Reforestation 89 -29 -64 -91 -83 -69 -58 -42 -240%
A.2. Deforestation 384 332 377 309 291 273 230 351 11%
B.1. Forest management -2 -2 -2 0 -1 -1 -1 -1 -116%
B.2. Cropland management (if elected) 63 81 -40 -103 87 -39 70 121 554%
B.3. Grazing land management (if elected) 4,248 4,867 3,042 2,558 997 2,111 4,209 3,552 -61%
5. Waste 130 136 139 147 159 136 83 161 13%
A. Solid Waste Disposal IE IE IE IE IE IE IE IE -
B. Biological Treatment of Solid Waste IE IE IE IE IE IE IE IE -
C. Incineration and Open Burning of Waste IE IE IE IE IE IE IE IE -
D. Waste Water Treatment and Discharge IE IE IE IE IE IE IE IE -
E. Other IE IE IE IE IE IE IE IE -
Total CO2 emissions including net CO2 from LULUCF
13,901 13,824 12,730 12,013 10,936 11,912 14,121 12,771 -25%
Table 11: Northern Territory, kilotonnes of carbon dioxide equivalent emissions (kt CO2-e), 1990 to 2015 (continued)
AUSTRALIAN NATIONAL GREENHOUSE ACCOUNTS State and Territory Greenhouse Gas Inventories, 2015 / 69
Related Publications and ResourcesAustralia’s National Greenhouse AccountsThe following Department of the Environment and Energy publications are all available on the departmental website.
National Inventory Report 2015
The three volumes comprising Australia’s National Inventory Report 2015 were submitted under the United Nations Framework Convention on Climate Change (UNFCCC) and the Kyoto Protocol in May 2017. These reports contains national greenhouse gas emission estimates for the period 1990-2015 compiled under the rules for reporting applicable to the UNFCCC.
Volume 1: Includes Australia’s data for energy (stationary energy, transport and fugitive emissions), industrial processes and agriculture.
Volume 2: Australia’s data for the Land Use, Land Use Change and Forestry (LULUCF) and waste sectors, recalculations and improvements.
Volume 3: Australia’s data for Kyoto Protocol LULUCF, Kyoto Protocol accounting requirements, annexes, glossary and references. http://www.environment.gov.au/climate-change/greenhouse-gas-measurement/progress-inventory
National Inventory by Economic Sector 2015
This document provides an overview of the latest available estimates of annual greenhouse gas emissions, disaggregated by Australia-New Zealand Standard Industrial Classifications (ANZSIC).
Quarterly Update of Australia’s National Greenhouse Gas Inventory: December 2016
This report provides estimates of Australia’s national inventory up to the December quarter of 2016.
70 / AUSTRALIAN NATIONAL GREENHOUSE ACCOUNTS State and Territory Greenhouse Gas Inventories, 2015
Emissions Projections: Australia’s emissions projections 2016
The report provides detail on emissions trends, including sector specific analysis of factors driving emissions. It also includes sensitivity analyses taking into consideration different assumptions of technology change and energy exports in the future: http://www.environment.gov.au/climate-change/publications/emissions-projections-2016
Australian Greenhouse Emissions Information System (AGEIS)
The AGEIS centralises the Department’s emissions estimation, emissions data management and reporting systems. AGEIS is being used to compile national and State and Territory inventories. The interactive web interface provides enhanced accessibility and transparency to Australia’s greenhouse emissions data. http://www.environment.gov.au/climate-change/greenhouse-gas-measurement/ageis
Full Carbon Accounting Model
The Full Carbon Accounting Model (FullCAM) is the calculation engine which supports the estimation of carbon stock change on forest and agricultural systems. FullCAM can be downloaded from the Department’s webpage: http://www.environment.gov.au/climate-change/greenhouse-gas-measurement/land-sector.
Australia’s Second Biennial Report
Australia’s second Biennial Report is a comprehensive summary of Australia’s progress towards meeting its commitments under the United National Framework Convention on Climate Change (UNFCCC). Countries such as Australia are required to submit these reports to the UNFCCC every two years. http://www.environment.gov.au/climate-change/publications/australias-second-biennial-report
What the rest of the world is doing
Other developed countries are also required to produce annual greenhouse gas inventories. More information regarding the reporting requirements and various international reports (including reports by Australia) are located online: http://unfccc.int/national_reports/items/1408.php
environment.gov.au
CC
144.
0516
Related Documents