he Starbucks Coffee Network ere. The abstract is typically a short summary of e Distribution f the Preethi Kasireddy Billy Jung Esmeralda Ayala Ari Eryorulmaz

Welcome message from author
This document is posted to help you gain knowledge. Please leave a comment to let me know what you think about it! Share it to your friends and learn new things together.
Transcript
Preethi Kasireddy[Type the abstract of the document here. The abstract is typically a short summary of thecontents of the document.]
Starbucks Coffee Distribution
Network
[ C o m p a n y A d d r e s s ]
here. The abstract is typically a short summary of the
Starbucks Coffee Distributionhere. The abstract is typically a short summary of the
Preethi Kasireddy
Billy Jung
Esmeralda Ayala
Ari Eryorulmaz
gbottlik
Pencil
gbottlik
Pencil
gbottlik
Pencil
gbottlik
Pencil
gbottlik
Pencil
gbottlik
Pencil
1
Table of Contents
Abstract…………………………………………………………………………………………....2
Background and Problem Definition……………………………………………………...2
Current Situation………………………………………………………………………………..2-5
Demand………………………………………………………………………………....2-3
Supply Side Concerns…………………………………………………………………..3-4
Prices……………………………………………………………………………………4-5
Distribution Network………………………………………………………………………...…5-7
Phase 1: From Suppliers to Distribution Centers…………………………………….....5-6
Phase 2: From Distribution Centers to Regional Retailers……………………………...6-7
Recommendations…………………………………………………………………………………7
Starbucks’ Use of 3PL…………………………………………………………………………….8
References……………………………………………………………………………………..9-11
Appendix A………………………………………………………………………………………12
Appendix B………………………………………………………………………………………13
Appendix C………………………………………………………………………………………14
Appendix D………………………………………………………………………………………15
Appendix E………………………………………………………………………………………16
Appendix F………………………………………………………………………………………17
Appendix G………………………………………………………………………………………18
Appendix H………………………………………………………………………………………19
Appendix I……………………………………………………………………………………….20
Appendix J……………………………………………………………………………………….21
Appendix K………………………………………………………………………………………22
Appendix L………………………………………………………………………………………23
Appendix M……………………………………………………………………………………...24
Appendix N………………………………………………………………………………………25
2
Abstract
Background and Problem Definition
Starbucks, founded in 1971, is the world’s #1 specialty coffee retailer with more than
18,850 coffee shops in 40 countries. It operates approximately 8,800 of its shops, while licenses
and franchises operate the remaining stores. The company also owns Seattle’s Best Coffee and
Torrefazione Italia coffee brands. Starbucks offers a variety of food items, as well as roasted
beans, coffee accessories, and teas and also markets its coffee through grocery stores and
branded food and beverage products.
Due to the immense global network that Starbucks has built over the past 40 years, this
report will focus strictly on the coffee bean supply chain network for Starbucks U.S. In particular,
the report will analyze international coffee bean suppliers, Starbucks’ US distribution network,
shipping and transportation costs, and regional distribution network. Because of the tight supply
and growing demand, evident from strong revenue growth, of coffee beans, all of the demand is
not being met. Thus, the goal of this project is to find an alternative method for 100% of the
demand to be distributed and supplied.
The Current Situation
Demand
Starbucks coffee, which maintains 4.5% of the US market share for coffee, is expected to
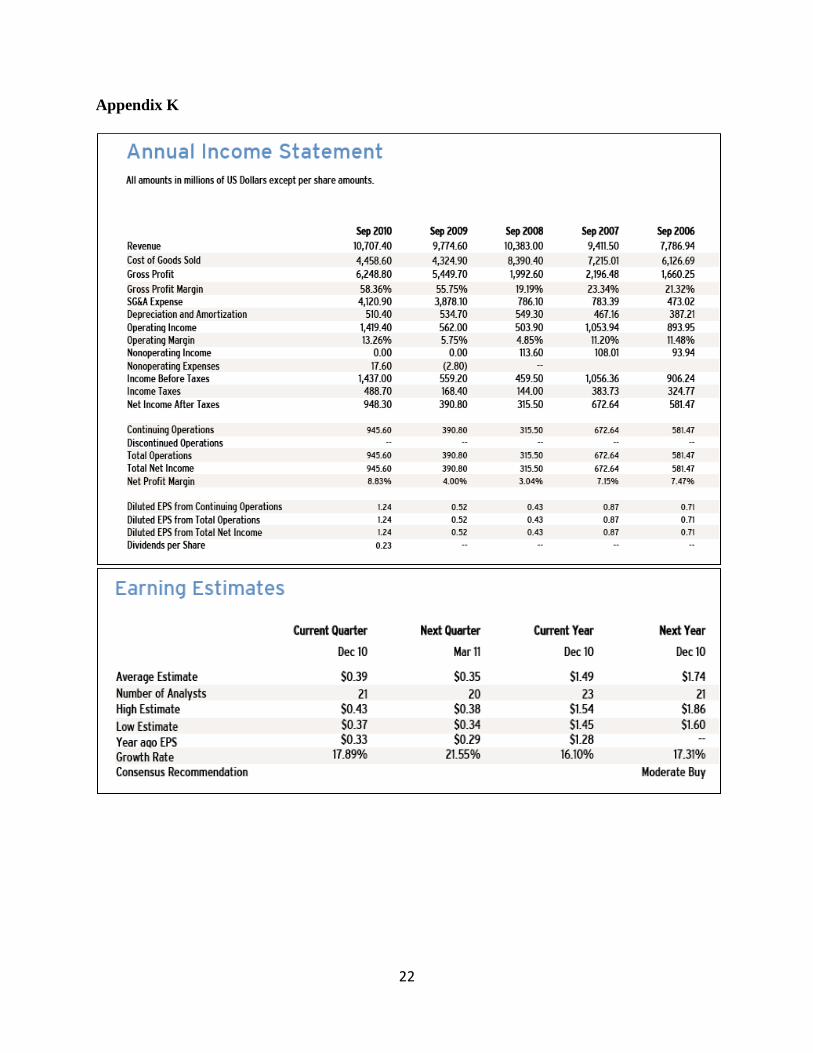
see an increase in per capital coffee consumption. For the fiscal year ending September 2010,
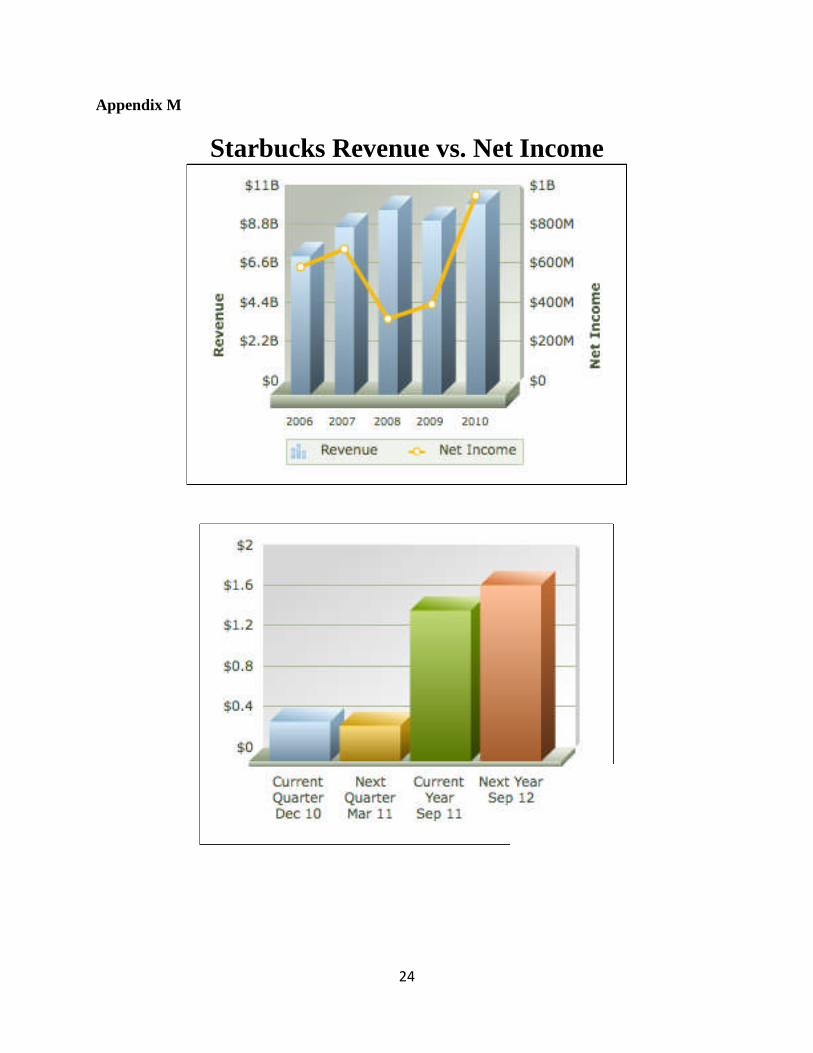
Starbucks reported $10.71B Sales, with a 1-Year Sales Growth of 9.54% and a 13.26% operating
margin growth. They reported $946.60M in net income, which a 1-Year Net Income growth of
141.97%. For fiscal first quarter of 2011, EPS of $0.45 were reported and increased profits of 44%
from year-ago period. This growth was driven by in-store sales growth of 8% in the U.S. The
3
strength of Starbucks growth in comparison to the industry median growth of -0.35% for revenue
and 10.04% growth in net income is a strong indicator of high demand for Starbucks from 2011-
2016.
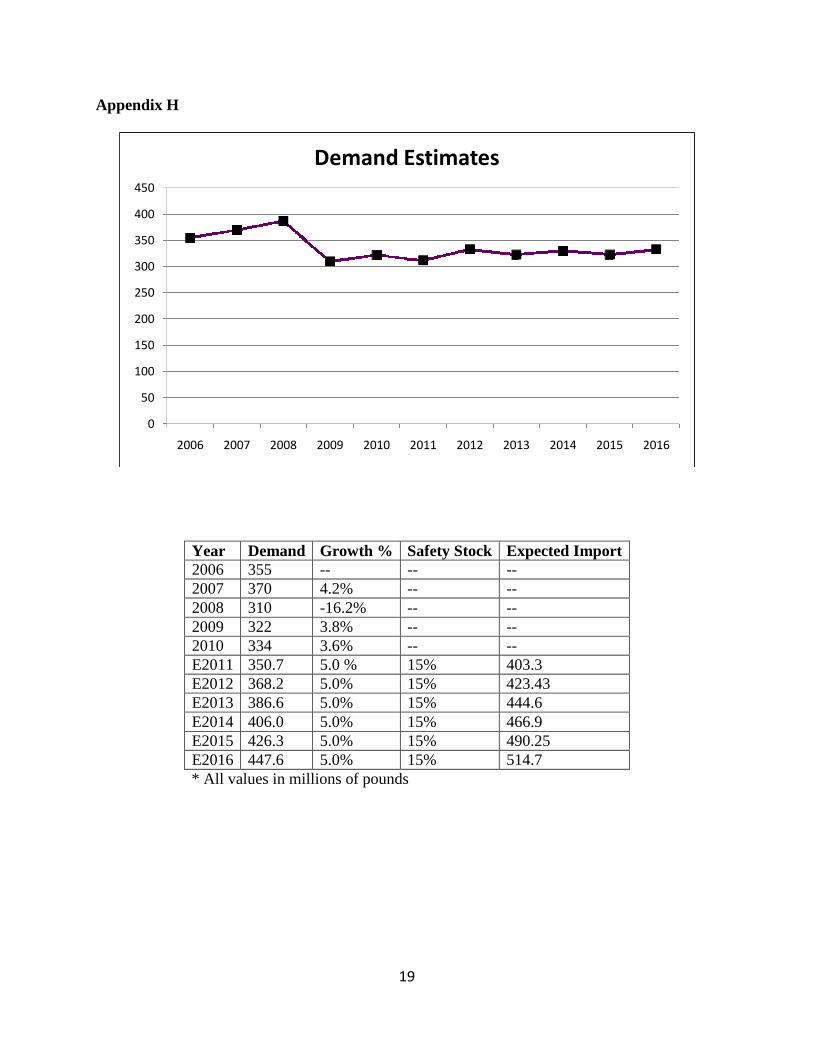
Demand numbers were calculated based on 2009 imports. Risks that Starbucks faces
include late delivery from supplier, slow replenishment lead time, damaged/unusable beans,
random demand, unexpected increase in demand, and inaccurate demand forecasts. Therefore, to
mitigate the risk of stock outs, a safety stock of 15% was applied. Coffee beans don’t spoil or
expire and so additional costs due to safety stock only come from storage costs (see Demand
Analysis Tables in Appendix H).
Despite higher commodity coffee costs Starbucks is expected to face in 2011 and 2012,
the high prices are expected to reach normal levels starting 2013. Therefore, it follows the
Starbucks will plan to meet 100% of the demand projected from 2011-2016.
Supply Side Concerns
Starbucks uses C.A.F.E Practices to ensure sustainable supply of high quality coffee
beans. C.A.F.E Practices are a set of guidelines set to ensure high quality coffee beans, promote
equitable relationships with farmers, workers, and communities, and protect the environment. All
suppliers for Starbucks coffee beans must meet the minimum prerequisites of high quality
Arabica coffee bean, economic transparency, performance, supply network of farms, and coffee
growing and processing practices. Suppliers were chosen meticulously to smooth the forecasted
supply fluctuations and long supply response times.
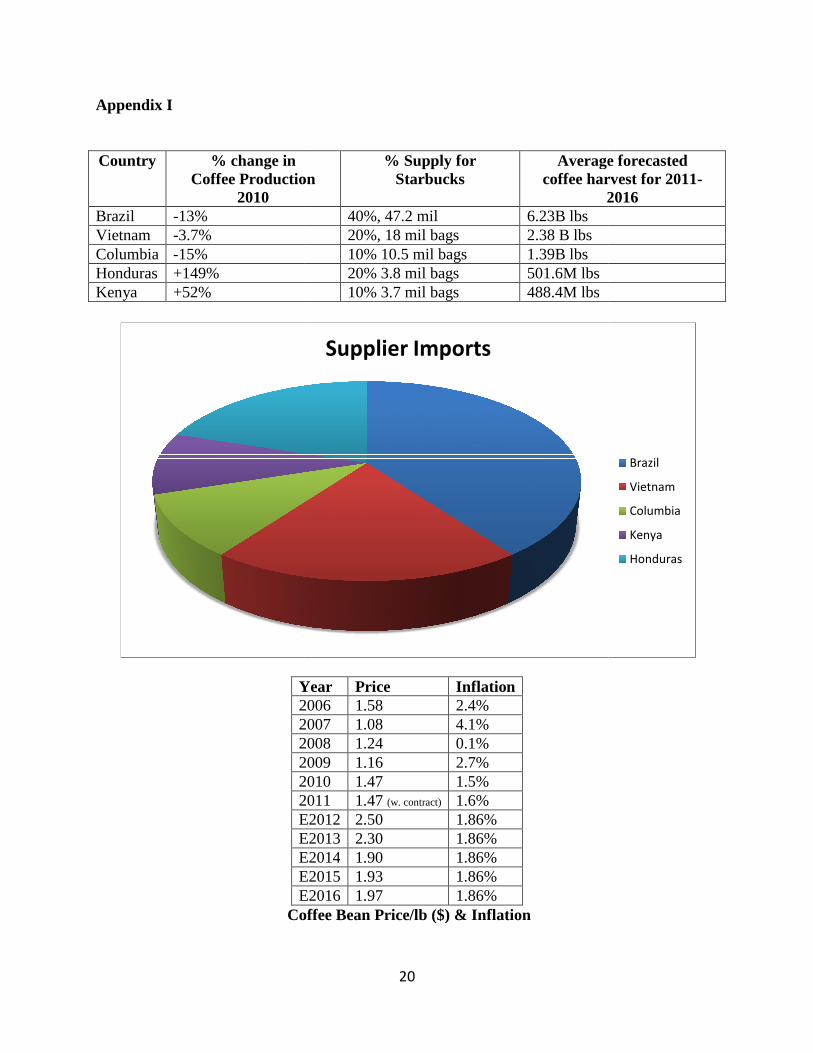
Brazil, Vietnam, and Columbia make up the majority of the global supply for Arabica
coffee beans for Starbucks, with market shares of 38%, 14.5%, 12.3%, and respectively.
gbottlik
Pencil
4
Brazil, the largest supplier for 2010, is expected to have a decrease in harvest of 25% percent
from 2010, while Brazil’s domestic consumption is expected to increase 5%, Mexico showed a
decrease in exports of 17% in 2010. Columbia also poses a small risk due a major outbreak of
fungus that affected supply in 2010, as well as Costa Rico due to adverse weather. Contingent
upon these risks and the 2010 export growth/decline percentage, below is the proposed
breakdown of import suppliers for 2011-2016. We recommended a decrease in Brazil imports to
40% of supply, rather than 60%. We also recommended an increase in supply from Honduras
and Kenya due to strong coffee harvests in 2010 (see Appendix I).
Prices
Coffee bean prices in 2011 are on average 90% higher than 2010 due to the La Nina
weather patterns plaguing Central America and South America, significant coffee plant damage
in Columbia due to fungus on coffee crops, bad weather in Vietnam, and concentrated supply.
Another contributing factor to the 2010 severe rice in coffee prices is the declining of the U.S
dollar. This decline results in higher coffee commodity prices for Starbucks. In addition, low
interest rates maintained by the Federal Reserve, due to the financial crisis of 2008 and 2009, has
led to investors to increase investment in commodities, including coffee, which is another driver
for higher coffee prices for Starbucks.
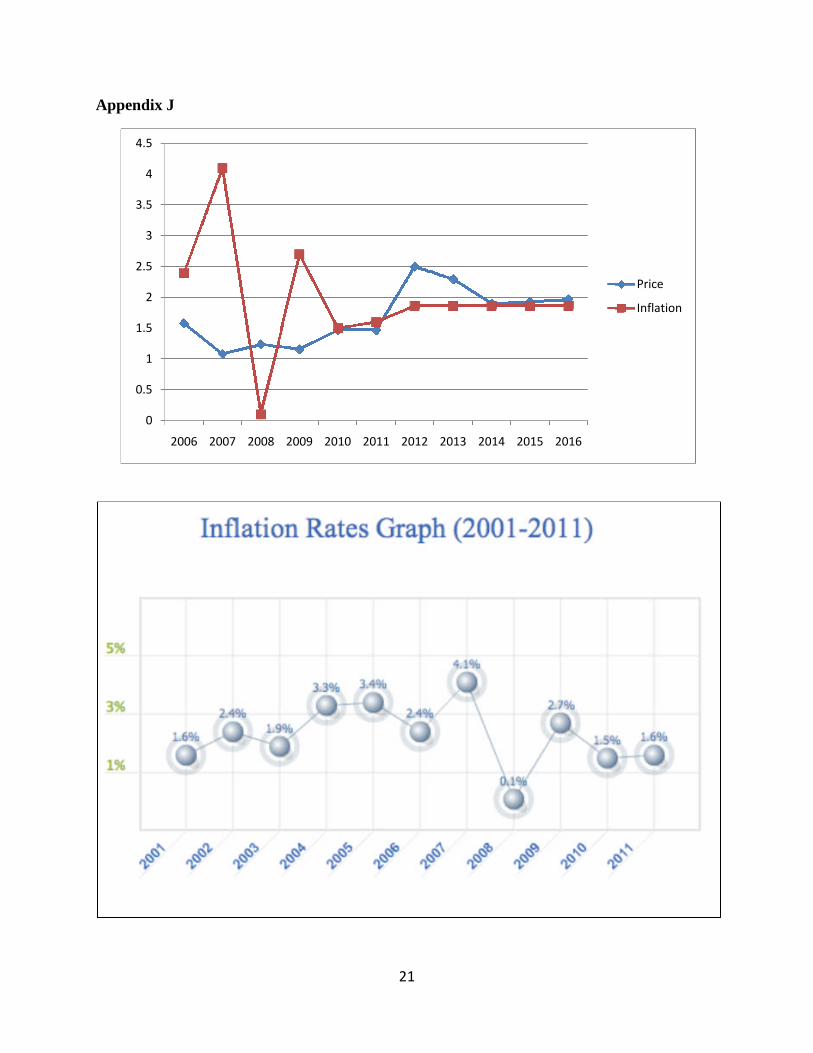
The price per pound in January, February, and March 2011 were $2.35, $2.47, and $3.56,
respectively. Derived from Treasury inflation protected securities and survey-based estimates,
the Federal Reserve Bank of Cleveland reports that its latest estimate of 10-year expected
inflation is 1.82 percent. Expected prices for 2011-2016 were calculated based on inflation rates,
an existing contract Starbucks has with its suppliers for 2011, the assumption based on research
gbottlik
Pencil
gbottlik
Pencil
5
that prices will begin to decrease in 2012-2013 due to improving crops, and the assumption that
prices will remain steady from 2014-2016 (see Appendices I - J for price chart and graphs).
Distribution Network
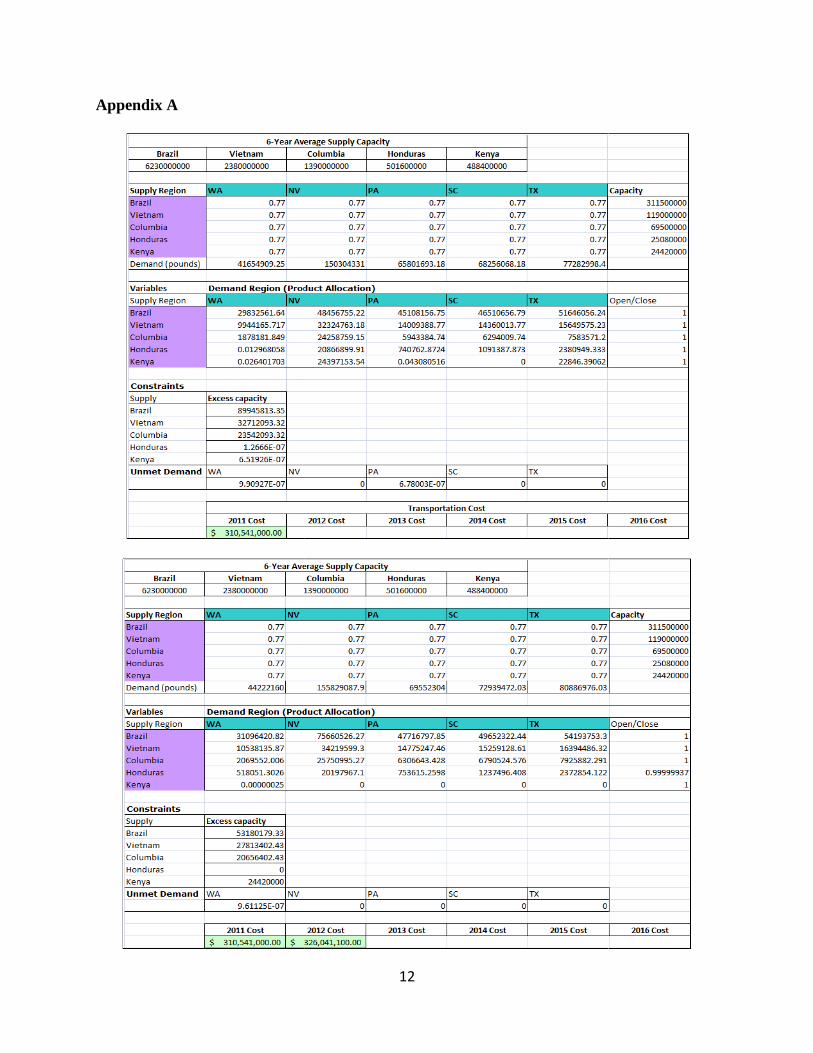
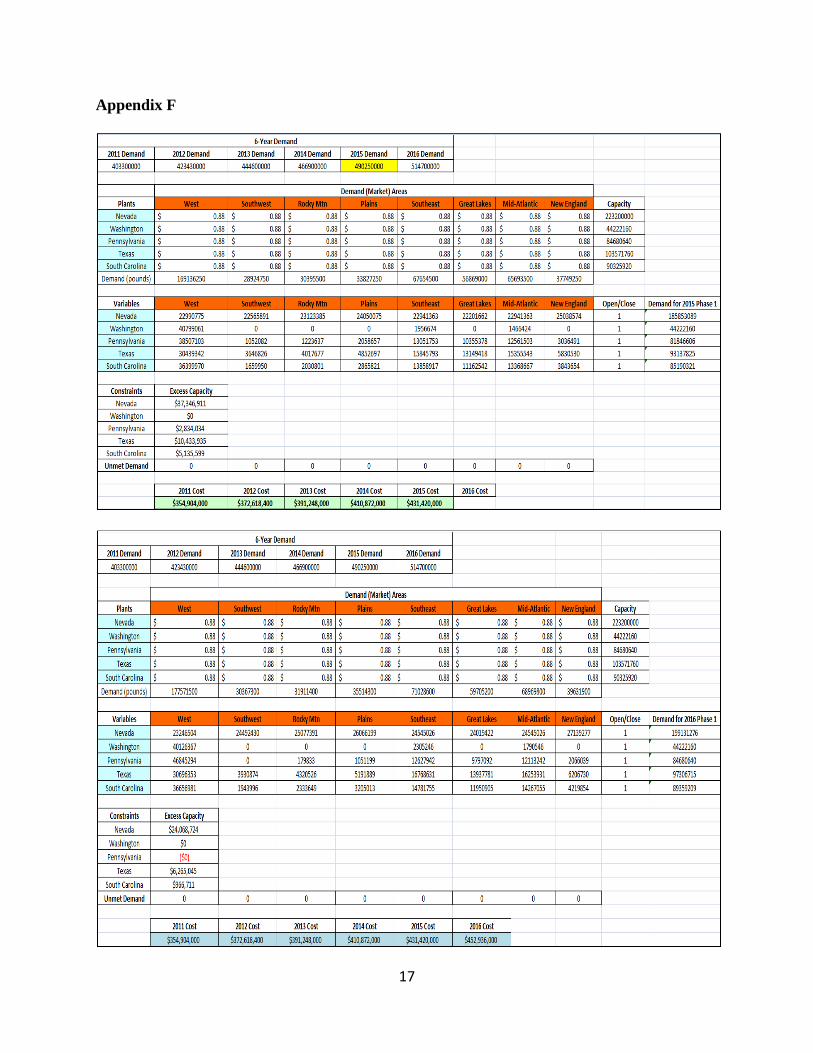
The team’s alternative is to use the Facility Location model to see whether every supplier and
every distribution center is necessary to meet 100% of demand for the years 2011 to 2016. If so,
then each supplier will supply the appropriate number of pounds to each distribution center to
minimize costs (Phase 2); and each distribution center will supply the appropriate number of
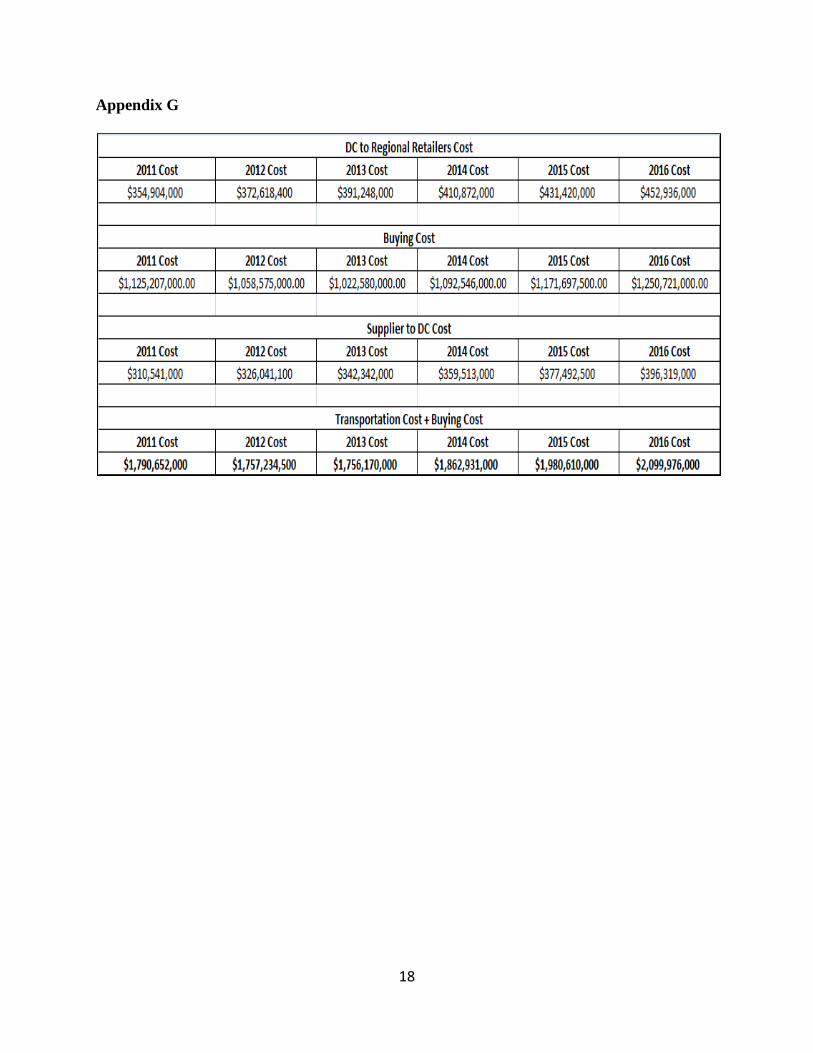
pounds to each regional retailer to minimize costs (Phase 2). After finding the minimum costs for
each year for both phases, the total annual costs per year will consist of annual Phase 1 and
Phase 2 costs plus the buying cost of the coffee beans from the suppliers.
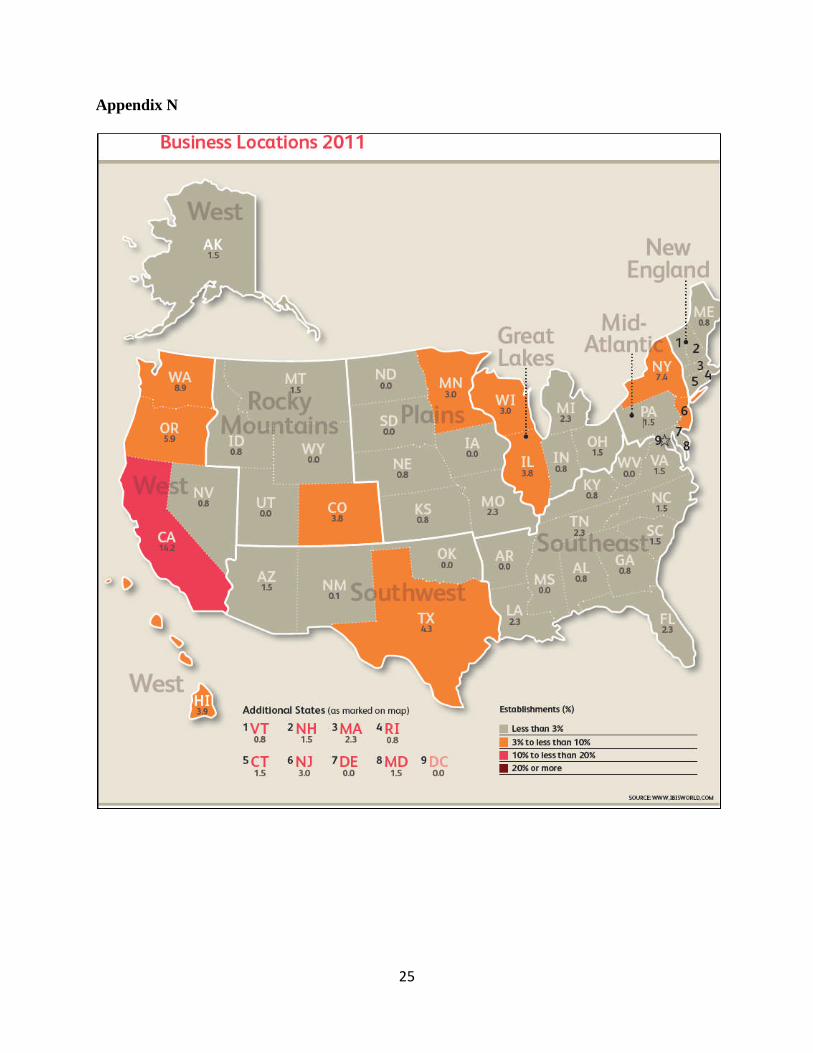
Phase 1: From Suppliers to Distribution Centers
For Phase 1 of the distribution network, we needed to find the appropriate allocation and
costs to supply US distribution centers from outside countries. Four of the distributions centers in
the US, which include Washington, Nevada, Pennsylvania, and South Carolina, are current
Starbucks distribution center locations. When analyzing the IBIS US map (Appendix N) that
highlights heavy areas of coffee demand, we observed that a reasonable amount comes from
Texas. Assuming that distribution of coffee demand in the US as shown in figure only relates to
Starbucks coffee, we found the absence of a distribution center in the south alarming and hence
decided to add a distribution center in Texas to the existing Starbucks distribution network.
Once the distribution locations were determined, supply, demand, and shipping costs needed to
be found.
We were not able to find specific exporting costs for each country so we assumed that
Cameroons exporting coffee price of $1.70 per Kg ($0.77 per pound) was a good estimate for our
6
shipping rate. We assumed the available supply from each country was about 5% of their overall
harvest considering that Starbucks is one out of their many customers. To calculate demand for
each distribution center, we first needed to solve the Phase 2 network. Once we saw the
distribution center to regional retailer allocation to meet each regional retailers demand, we
added up the amount each state had distributed to each region, and that become our distribution
center demand for the Phase 1 network. To then find the appropriate allocation and total cost we
used solver. The average costs to distribute from the suppliers to the distribution centers for the
next six years will be $352,041,433.00
The following are assumptions we made to calculate the minimum shipping costs from supplier
to distribution centers:
Shipping cost is $0.77 per pound
Supply capacity from each country is 5% of overall country’s coffee harvest
Demand of each distribution center comes from the demand being supplied to regional
retailers (Phase 2)
The total costs to distribute from the suppliers to the distribution centers for six years can
be seen in the table below.
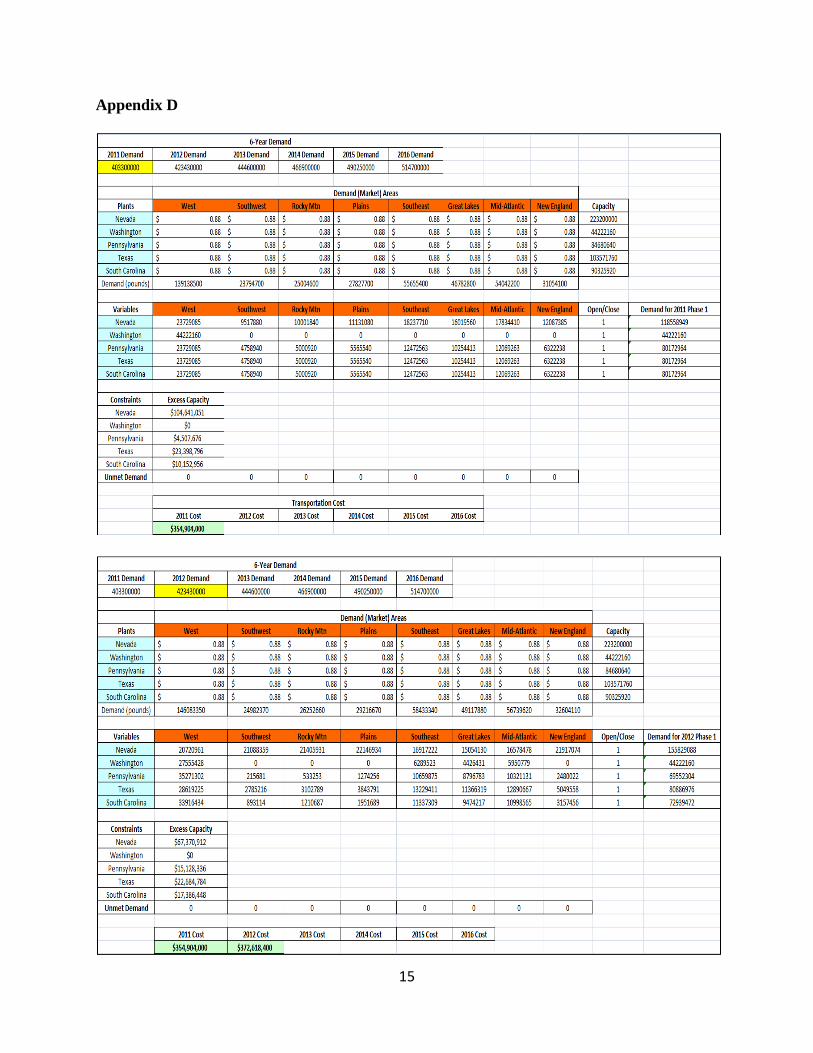
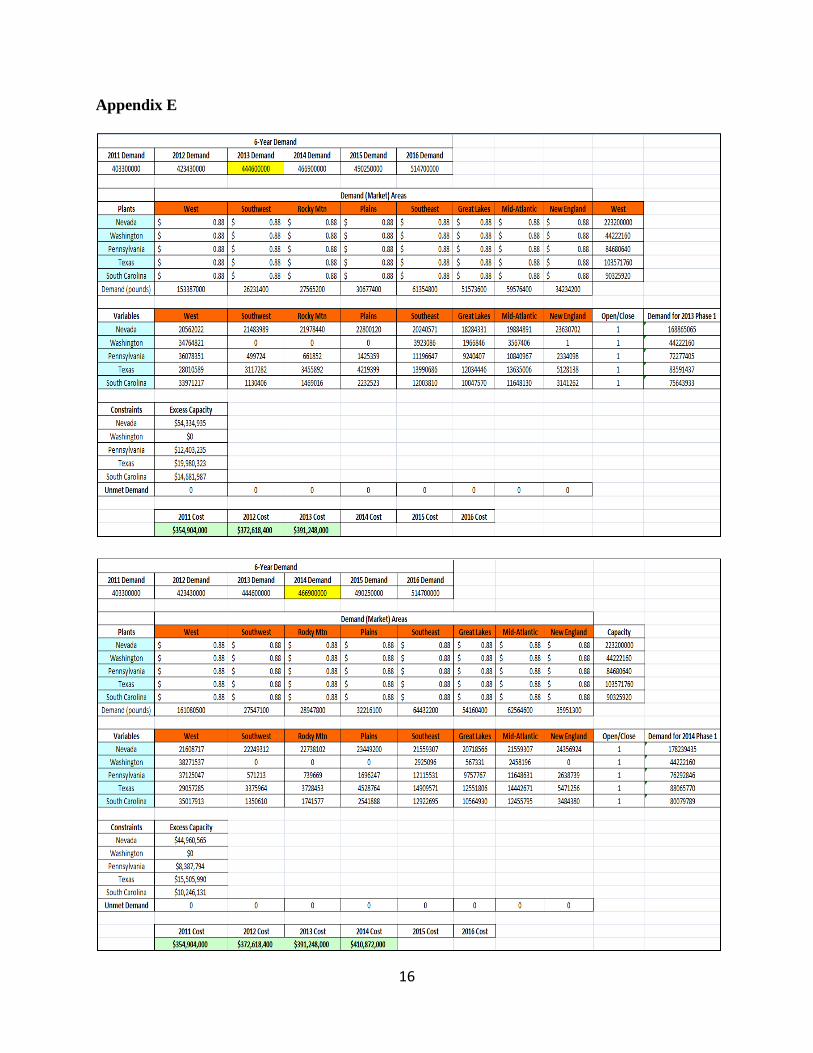
Phase 2: From Distribution Centers to Regional Retailers
In this phase, the same solving method in Phase 1 was used. The goal was to find the total
minimum transportation cost per year from 2011 to 2016. Based on IBIS (Appendix N), the
demand for Starbucks coffee was spread throughout the United States by eight regions. Each
region has state demand percentages, so the state percentages were added up to calculate the
regional demand percentages. Figure 1 in Appendix A illustrates the various regions and their
respective demand percentages. For each year from 2011 to 2016, the regional percentages were
7
multiplied by the 2011 total demand to calculate the regional demands. The distribution center
capacities were calculated by researching plant square footage for each location on Century 21’s
website. The team assumed that only 50% of the square footage of the buildings would be used
for storage. The square footage was then multiplied by an assumed 30 feet building height to
calculate the volume of the distribution centers. Assuming the dimensions of a 1-pound
Starbucks coffee bag (0.25’ x 0.25’ x 1.00’), the total distribution center volume was divided by
the volume of the 1-pound bag.
The following assumptions were made to calculate the total minimum transportation cost per
year:
Although the annual demand would change, the regional demand % would stay the same
for each year
Shipping by trucks ($0.88) costs a little more than shipping by sea ($0.77)
The shipping cost of $0.88 per pound would remain the same for each year
Square footage of plant
Volume of plant
Percentage of plant that would be used for coffee bean storage (50%)
Recommendations
The team’s recommendations to Starbucks would be to keep open all suppliers to meet
distribution center demands and to keep open all distribution centers to meet regional retailer
demands. Starbucks should allocate the appropriate number of pounds from suppliers to
distribution centers, as shown in Appendices A – C, and it should allocate the appropriate
number of pounds from distribution centers to regional retailers, as shown in Appendices D – F.
8
Starbucks’ Use of 3PL
Starbucks has used Kraft to distribute its coffee in supermarkets and grocery stores for
twelve years. Acosta Inc, the distributor for Starbucks VIA instant coffee has plans to take over
Kraft, which will save money for Starbucks. According to a research study, Acosta will help
Starbucks to develop sales and product display strategies starting March 1, 2011.
This business plan actually came with the release of Starbucks VIA. Starbucks sold its
VIA Product for the first time directly to retailers, bypassing third-party distributors. The team
believes that leaving Kraft out of the game will generate a huge surplus of income for Starbucks.
Another option is switching to another distributor instead of using Kraft Foods. Folgers
Coffee, owned by Proctor & Gamble, has merged with JM Smucker in the last quarter of 2008.
This was a 3.3 billion dollar deal that benefited Folgers to use the current distribution network
that JM Smucker already has.
On March 10, 2011, Starbucks signed a new agreement with Green Mountain Coffee
Roasters, which own and distribute the K-Cup Keurig Coffee Brewing system. Green Mountain
Coffee Roasters owns the biggest distribution network for the single-cup brew system in the
North American market. Shares of Green Mountain went up 32%, and Starbucks shares went up
7.7% because of this beneficial agreement. While Kraft Foods had only 7.2% of the market share
with its single serving products, Green Market dominates the market with more than 65% market
share. Thus, the team recommends that Starbucks should further pursue this partnership with
Green Mountain to expand into the single cup coffee market.
9
Works Cited
"Analysis of Starbucks - a Knol by Admin." Knol - a Unit of Knowledge: Share What You Know,
Publish Your Expertise. Web. 11 Mar. 2011. <http://knol.google.com/k/admin/analysis-
of-starbucks>.
Andrejczak, Matt. "Starbucks Taps Acosta for New Grocery Push - MarketWatch."
MarketWatch - Stock Market Quotes, Business News, Financial News. Web. 11 Mar.
2011. <http://www.marketwatch.com/story/starbucks-taps-acosta-for-new-grocery-push-
2010-12-01-1421100>.
Baertlein, Lisa. "Starbucks Sees Higher 2011 Coffee Costs - TODAY News -
TODAYshow.com." TODAY.com: Matt Lauer, Meredith Vieira, Ann Curry, Al Roker,
Natalie Morales - TODAY Show Video, News, Recipes, Health, Pets. Web. 11 Mar. 2011.
<http://today.msnbc.msn.com/id/39315921/ns/business-stocksandeconomy/>.
Barnes, Jack. "Five Ways to Profit as Coffee Prices Soar - Seeking Alpha." Stock Market News
& Financial Analysis - Seeking Alpha. Web. 11 Mar. 2011.
<http://seekingalpha.com/article/226228-five-ways-to-profit-as-coffee-prices-soar>.
"Brazil’s Coffee Production Forecast 2011 - Coffee Prices Today Stock Market Today - Penny
Stock - Gold Prices - Car Insurance." Stock Market Today - Penny Stock - Gold Prices -
Car Insurance. Web. 11 Mar. 2011. <http://indonsia-stock-exchange.blogspot.com/>
"Cleveland Fed Estimates of Inflation Expectations :: Federal Reserve Bank of Cleveland."
Welcome to the Cleveland Fed! :: Federal Reserve Bank of Cleveland. Web. 11 Mar.
2011. <http://www.clevelandfed.org/research/data/inflation_expectations/index.cfm>.
"Coffee Prices 2011." Espresso Coffee Guide — Everything You Need to Know about Espresso
and Coffee. William Blair & Company Equity Research Report - L.L.C. Web. 11 Mar.
10
2011. <http://www.espressocoffeeguide.com/2011/01/coffee-prices-2011/>.
"Coffee: Supply Shortfalls Should Continue to Favor Put Sellers in 2011 - Seeking Alpha." Stock
Market News & Financial Analysis - Seeking Alpha. Web. 11 Mar. 2011.
<http://seekingalpha.com/article/240874-coffee-supply-shortfalls-should-continue-to-
favor-put-sellers-in-2011>.
"Company Information from Hoover's." Hoovers | Business Solutions from Hoovers. Hoover's.
Web. 11 Mar. 2011. <http://www.hoovers.com/business-information>.
Kansas, Dave. "JDSU, Starbucks, Green Mountain Coffee Buck Sharp Downward Trend –
MarketBeat - WSJ." WSJ Blogs - WSJ. Web. 11 Mar. 2011.
<http://blogs.wsj.com/marketbeat/2011/03/10/jdsu-starbucks-green-mountain-coffee-
buck-sharp-downward-trend/?mod=google_news_blog>.
"Kraft Deal Costs Starbucks Potential Grocery Sales - Bloomberg." Bloomberg - Business &
Financial News, Breaking News Headlines. Web. 11 Mar. 2011.
<http://www.bloomberg.com/news/2011-01-04/starbucks-deal-with-kraft-cost-it-
potential-grocery-store-sales.html>.
LeTrent, Sarah. "Starbucks Plans to Stir up Coffee Market - CNN." Featured Articles from CNN.
26 May 2010. Web. 11 Mar. 2011. <http://articles.cnn.com/2010-05-
26/living/starbucks.coffee.battle>.
Lunkong, Pius. "Cameroon Robusta Coffee Export Price Rises 3% in Week to Dec. 6 -
Bloomberg." Bloomberg - Business & Financial News, Breaking News Headlines. 7 Dec.
2010. Web. 11 Mar. 2011. <http://www.bloomberg.com/news/2010-12-07/cameroon-
robusta-coffee-export-price-rises-3-in-week-to-dec-6.html>.
"News :: 2011-2012 Coffee Crop May Shrink." Market Leader. Web. 11 Mar. 2011.
11
<http://www.profi-forex.us/news/entry4000000902.html>.
Real Estate Listings - Real Estate Agents | CENTURY 21. Web. 11 Mar. 2011.
<http://www.century21.com/>.
"STARBUCKS CORPORATION BUILDING A SUSTAINABLE SUPPLY CHAIN." Google
Docs. GLOBAL SUPPLY CHAIN MANAGEMENT FORUM, May 2007. Web. 11 Mar.
2011.<http://docs.google.com/viewer?a=v&q=cache:5XFm3tNGQpwJ:www.gsb.stanfor
d.edu/scforum/login/abstracts/documents/GS54.pdf starbucks coffee bean supply chain>.
"Starbucks Opens Third U.S. Roasting Plant in Nevada. (Trade News). | North America United
States from AllBusiness.com." Small Business Advice and Resources from
AllBusiness.com. Tea & Coffee Trade Journal, 20 May 2003. Web. 11 Mar. 2011.
<http://www.allbusiness.com/manufacturing/food-manufacturing-food-coffee-
tea/548196-1.html>.
"USA QuickFacts from the US Census Bureau." State and County QuickFacts. Web. 11 Mar.
2011. <http://quickfacts.census.gov/qfd/states/00000.html>.
Appendix A
12
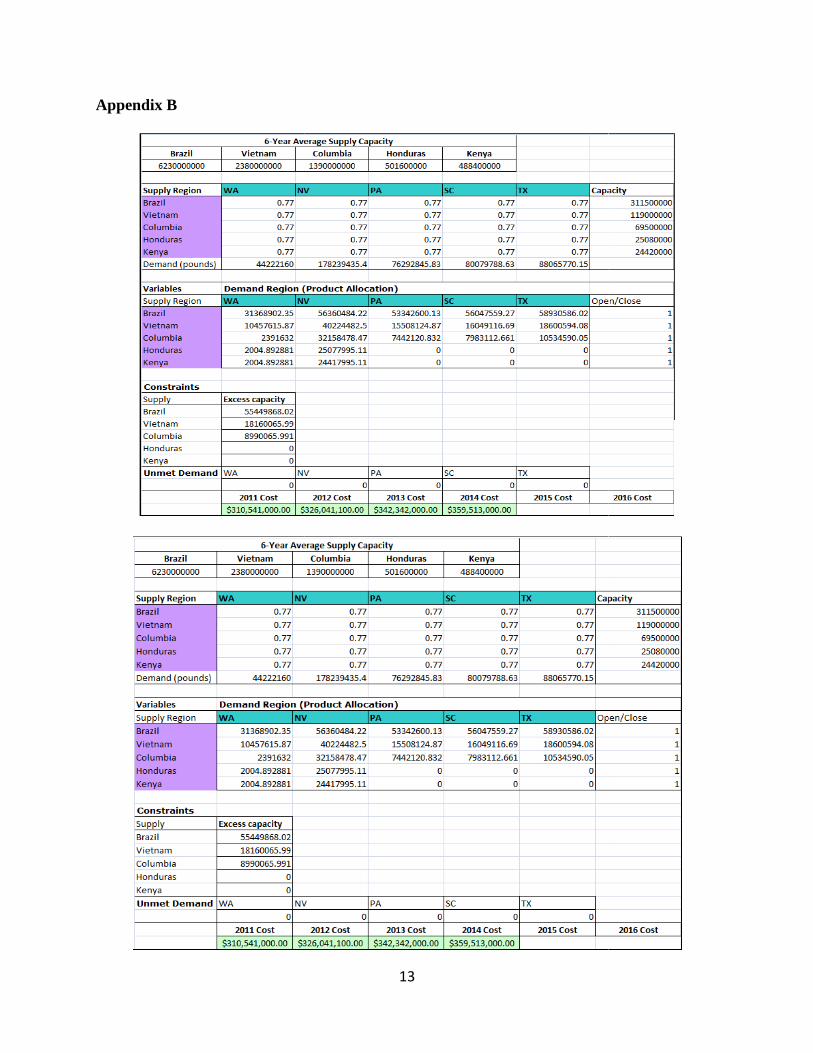
Appendix B
13
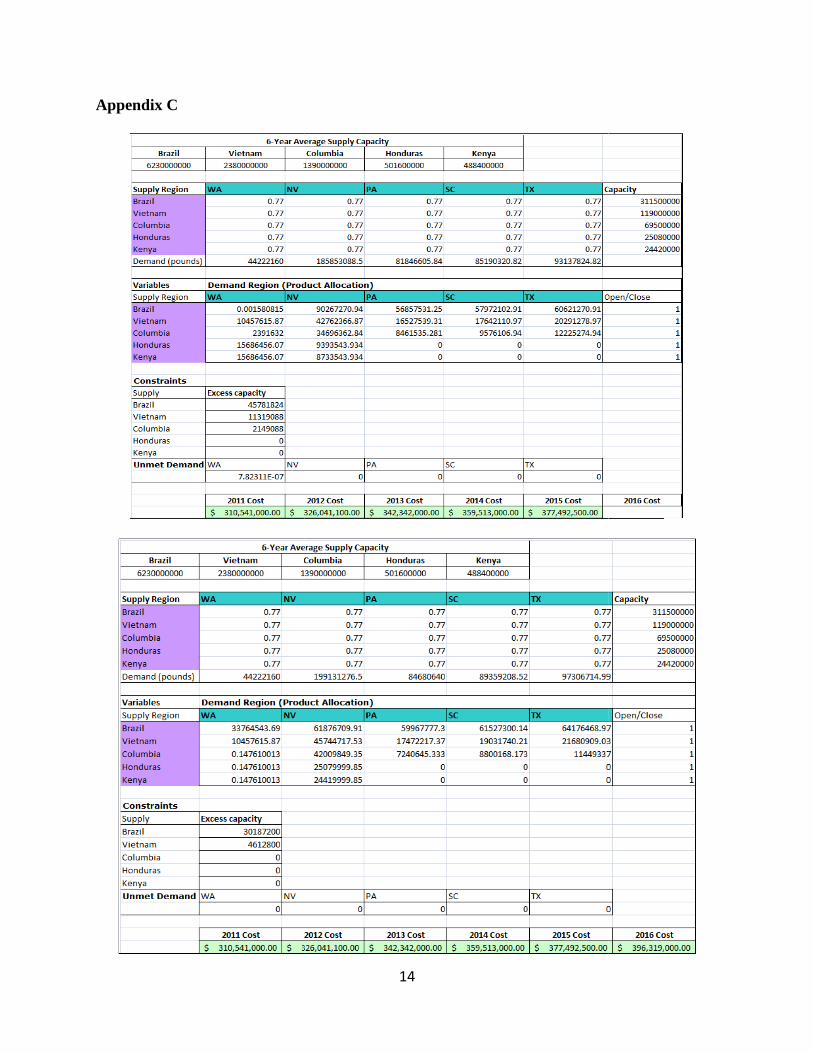
Appendix C
14
15
Appendix D
16
Appendix E
17
Appendix F
18
Appendix G
19
Appendix H
Year Demand Growth % Safety Stock Expected Import2006 355 -- -- --2007 370 4.2% -- --2008 310 -16.2% -- --2009 322 3.8% -- --2010 334 3.6% -- --E2011 350.7 5.0 % 15% 403.3E2012 368.2 5.0% 15% 423.43E2013 386.6 5.0% 15% 444.6E2014 406.0 5.0% 15% 466.9E2015 426.3 5.0% 15% 490.25E2016 447.6 5.0% 15% 514.7* All values in millions of pounds
0
50
100
150
200
250
300
350
400
450
2006 2007 2008 2009 2010 2011 2012 2013 2014 2015 2016
Demand Estimates
Appendix I
Country % change inCoffee Production
2010Brazil -13%Vietnam -3.7%Columbia -15%Honduras +149%Kenya +52%
Year200620072008200920102011E2012E2013E2014E2015E2016
Coffee Bean Price/lb ($) & Inflation
20
Coffee Production% Supply for
StarbucksAverage forecasted
coffee harvest for 20112016
40%, 47.2 mil 6.23B lbs20%, 18 mil bags 2.38 B lbs10% 10.5 mil bags 1.39B lbs20% 3.8 mil bags 501.6M lbs10% 3.7 mil bags 488.4M lbs
Year Price Inflation2006 1.58 2.4%2007 1.08 4.1%2008 1.24 0.1%2009 1.16 2.7%2010 1.47 1.5%2011 1.47 (w. contract) 1.6%E2012 2.50 1.86%E2013 2.30 1.86%E2014 1.90 1.86%E2015 1.93 1.86%E2016 1.97 1.86%
Coffee Bean Price/lb ($) & Inflation
Supplier Imports
Average forecastedcoffee harvest for 2011-
2016
Brazil
Vietnam
Columbia
Kenya
Honduras
21
Appendix J
0
0.5
1
1.5
2
2.5
3
3.5
4
4.5
2006 2007 2008 2009 2010 2011 2012 2013 2014 2015 2016
Price
Inflation
22
Appendix K
23
Appendix L
24
Appendix M
Starbucks Revenue vs. Net Income
25
Appendix N
Related Documents