Designation: E 45 – 05 e1 Standard Test Methods for Determining the Inclusion Content of Steel 1 This standard is issued under the fixed designation E 45; the number immediately following the designation indicates the year of original adoption or, in the case of revision, the year of last revision. A number in parentheses indicates the year of last reapproval. A superscript epsilon (e) indicates an editorial change since the last revision or reapproval. This standard has been approved for use by agencies of the Department of Defense. e 1 NOTE—Table 1 was editorially corrected in February 2007. 1. Scope 1.1 These test methods cover a number of recognized procedures for determining the nonmetallic inclusion content of wrought steel. Macroscopic methods include macroetch, fracture, step-down, and magnetic particle tests. Microscopic methods include five generally accepted systems of examina- tion. In these microscopic methods, inclusions are assigned to a category based on similarities in morphology, and not necessarily on their chemical identity. Metallographic tech- niques that allow simple differentiation between morphologi- cally similar inclusions are briefly discussed. While the meth- ods are primarily intended for rating inclusions, constituents such as carbides, nitrides, carbonitrides, borides, and interme- tallic phases may be rated using some of the microscopic methods. In some cases, alloys other than steels may be rated using one or more of these methods; the methods will be described in terms of their use on steels. 1.2 This practice covers procedures to perform JK-type inclusion ratings using automatic image analysis in accordance with microscopic methods A and D. 1.3 Depending on the type of steel and the properties required, either a macroscopic or a microscopic method for determining the inclusion content, or combinations of the two methods, may be found most satisfactory. 1.4 These test methods deal only with recommended test methods and nothing in them should be construed as defining or establishing limits of acceptability for any grade of steel. 1.5 The values stated in SI units are to be regarded as the standard. Values in parentheses are conversions and are ap- proximate. 1.6 This standard does not purport to address all of the safety concerns, if any, associated with its use. It is the responsibility of the user of this standard to establish appro- priate safety and health practices and determine the applica- bility of regulatory limitations prior to use. 2. Referenced Documents 2.1 ASTM Standards: 2 D 96 Test Method for Water and Sediment in Crude Oil by Centrifuge Method (Field Procedure) E3 Guide for Preparation of Metallographic Specimens E7 Terminology Relating to Metallography E 381 Method of Macroetch Testing Steel Bars, Billets, Blooms, and Forgings E 709 Guide for Magnetic Particle Examination E 768 Practice for Preparing and Evaluating Specimens for Automatic Inclusion Assessment of Steel E 1245 Practice for Determining Inclusion or Second-Phase Constituent Content of Metals by Automatic Image Analy- sis E 1444 Practice for Magnetic Particle Examination E 1951 Guide for Calibrating Reticles and Light Micro- scope Magnifications 2.2 SAE Standards: 3 J422, Recommended Practice for Determination of Inclu- sions in Steel 2.3 Aerospace Material Specifications: 3 AMS 2300, Premium Aircraft-Quality Steel Cleanliness: Magnetic Particle Inspection Procedure AMS 2301, Aircraft Quality Steel Cleanliness: Magnetic Particle Inspection Procedure AMS 2303, Aircraft Quality Steel Cleanliness: Martensitic Corrosion-Resistant Steels Magnetic Particle Inspection Procedure AMS 2304, Special Aircraft-Quality Steel Cleanliness: Magnetic Particle Inspection Procedure 2.4 ISO Standards: 4 ISO 3763, Wrought Steels—Macroscopic Methods for As- sessing the Content of Nonmetallic Inclusions 1 These test methods are under the jurisdiction of ASTM Committee E04 on Metallography and is the direct responsibility of Subcommittee E04.09 on Inclu- sions. Current edition approved Nov. 1, 2005. Published December 2005. Originally approved in 1942. Last previous edition approved in 2002 as E 45 – 97 (2002). 2 For referenced ASTM standards, visit the ASTM website, www.astm.org, or contact ASTM Customer Service at [email protected]. For Annual Book of ASTM Standards volume information, refer to the standard’s Document Summary page on the ASTM website. 3 Available from Society of Automotive Engineers (SAE), 400 Commonwealth Dr., Warrendale, PA 15096-0001. 4 Available from American National Standards Institute (ANSI), 25 W. 43rd St., 4th Floor, New York, NY 10036. Copyright © ASTM International, 100 Barr Harbor Drive, PO Box C700, West Conshohocken, PA 19428-2959, United States. Copyright ASTM International Provided by IHS under license with ASTM No reproduction or networking permitted without license from IHS --`,,```,,,,````-`-`,,`,,`,`,,`---

Welcome message from author
This document is posted to help you gain knowledge. Please leave a comment to let me know what you think about it! Share it to your friends and learn new things together.
Transcript
Designation: E 45 – 05e1
Standard Test Methods forDetermining the Inclusion Content of Steel1
This standard is issued under the fixed designation E 45; the number immediately following the designation indicates the year of originaladoption or, in the case of revision, the year of last revision. A number in parentheses indicates the year of last reapproval. A superscriptepsilon (e) indicates an editorial change since the last revision or reapproval.
This standard has been approved for use by agencies of the Department of Defense.
e1 NOTE—Table 1 was editorially corrected in February 2007.
1. Scope
1.1 These test methods cover a number of recognizedprocedures for determining the nonmetallic inclusion contentof wrought steel. Macroscopic methods include macroetch,fracture, step-down, and magnetic particle tests. Microscopicmethods include five generally accepted systems of examina-tion. In these microscopic methods, inclusions are assigned toa category based on similarities in morphology, and notnecessarily on their chemical identity. Metallographic tech-niques that allow simple differentiation between morphologi-cally similar inclusions are briefly discussed. While the meth-ods are primarily intended for rating inclusions, constituentssuch as carbides, nitrides, carbonitrides, borides, and interme-tallic phases may be rated using some of the microscopicmethods. In some cases, alloys other than steels may be ratedusing one or more of these methods; the methods will bedescribed in terms of their use on steels.
1.2 This practice covers procedures to perform JK-typeinclusion ratings using automatic image analysis in accordancewith microscopic methods A and D.
1.3 Depending on the type of steel and the propertiesrequired, either a macroscopic or a microscopic method fordetermining the inclusion content, or combinations of the twomethods, may be found most satisfactory.
1.4 These test methods deal only with recommended testmethods and nothing in them should be construed as definingor establishing limits of acceptability for any grade of steel.
1.5 The values stated in SI units are to be regarded as thestandard. Values in parentheses are conversions and are ap-proximate.
1.6 This standard does not purport to address all of thesafety concerns, if any, associated with its use. It is theresponsibility of the user of this standard to establish appro-priate safety and health practices and determine the applica-bility of regulatory limitations prior to use.
2. Referenced Documents
2.1 ASTM Standards: 2
D 96 Test Method for Water and Sediment in Crude Oil byCentrifuge Method (Field Procedure)
E 3 Guide for Preparation of Metallographic SpecimensE 7 Terminology Relating to MetallographyE 381 Method of Macroetch Testing Steel Bars, Billets,
Blooms, and ForgingsE 709 Guide for Magnetic Particle ExaminationE 768 Practice for Preparing and Evaluating Specimens for
Automatic Inclusion Assessment of SteelE 1245 Practice for Determining Inclusion or Second-Phase
Constituent Content of Metals by Automatic Image Analy-sis
E 1444 Practice for Magnetic Particle ExaminationE 1951 Guide for Calibrating Reticles and Light Micro-
scope Magnifications2.2 SAE Standards:3
J422, Recommended Practice for Determination of Inclu-sions in Steel
2.3 Aerospace Material Specifications:3
AMS 2300, Premium Aircraft-Quality Steel Cleanliness:Magnetic Particle Inspection Procedure
AMS 2301, Aircraft Quality Steel Cleanliness: MagneticParticle Inspection Procedure
AMS 2303, Aircraft Quality Steel Cleanliness: MartensiticCorrosion-Resistant Steels Magnetic Particle InspectionProcedure
AMS 2304, Special Aircraft-Quality Steel Cleanliness:Magnetic Particle Inspection Procedure
2.4 ISO Standards:4
ISO 3763, Wrought Steels—Macroscopic Methods for As-sessing the Content of Nonmetallic Inclusions
1 These test methods are under the jurisdiction of ASTM Committee E04 onMetallography and is the direct responsibility of Subcommittee E04.09 on Inclu-sions.
Current edition approved Nov. 1, 2005. Published December 2005. Originallyapproved in 1942. Last previous edition approved in 2002 as E 45 – 97 (2002).
2 For referenced ASTM standards, visit the ASTM website, www.astm.org, orcontact ASTM Customer Service at [email protected]. For Annual Book of ASTMStandards volume information, refer to the standard’s Document Summary page onthe ASTM website.
3 Available from Society of Automotive Engineers (SAE), 400 CommonwealthDr., Warrendale, PA 15096-0001.
4 Available from American National Standards Institute (ANSI), 25 W. 43rd St.,4th Floor, New York, NY 10036.
1
Copyright © ASTM International, 100 Barr Harbor Drive, PO Box C700, West Conshohocken, PA 19428-2959, United States.
Copyright ASTM International Provided by IHS under license with ASTM
Not for ResaleNo reproduction or networking permitted without license from IHS
--`,,```,,,,````-`-`,,`,,`,`,,`---

ISO 4967, Steel—Determination of Content of NonmetallicInclusions—Micrographic Methods Using Standard Dia-grams
2.5 ASTM Adjuncts:Inclusions in Steel Plates I-r and II5
Four Photomicrographs of Low Carbon Steel6
3. Terminology
3.1 Definitions:3.1.1 For definitions of terms used in this practice, see
Terminology E 7.3.1.2 Terminology E 7 includes the term inclusion count;
since some methods of these test methods involve lengthmeasurements or conversions to numerical representations oflengths or counts, or both, the term inclusion rating ispreferred.
3.2 Definitions of Terms Specific to This Standard:3.2.1 aspect ratio—the length-to-width ratio of a micro-
structural feature.3.2.2 discontinuous stringer—three or more Type B or C
inclusions aligned in a plane parallel to the hot working axisand offset by no more than 15 µm, with a separation of less than40 µm (0.0016 in.) between any two nearest neighbor inclu-sions.
3.2.3 inclusion types—for definitions of sulfide-, alumina-,and silicate-type inclusions, see Terminology E 7. Globularoxide, in some methods refers to isolated, relatively nonde-formed inclusions with an aspect ratio not in excess of 2:1. Inother methods, oxides are divided into deformable and nonde-formable types.
3.2.4 JK inclusion rating—a method of measuring nonme-tallic inclusions based on the Swedish Jernkontoret procedures;Methods A and D of these test methods are the principal JKrating methods, and Method E also uses the JK rating charts.
3.2.5 stringer—an individual inclusion that is highly elon-gated in the deformation direction or three or more Type B orC inclusions aligned in a plane parallel to the hot working axisand offset by no more than 15 µm, with a separation of less than40 µm (0.0016 in.) between any two nearest neighbor inclu-sions.
3.2.6 threshold setting—isolation of a range of gray levelvalues exhibited by one constituent in the microscope field.
3.2.7 worst-field rating—a rating in which the specimen israted for each type of inclusion by assigning the value for thehighest severity rating observed of that inclusion type any-where on the specimen surface.
4. Significance and Use
4.1 These test methods cover four macroscopic and fivemicroscopic test methods (manual and image analysis) fordescribing the inclusion content of steel and procedures forexpressing test results.
4.2 Inclusions are characterized by size, shape, concentra-tion, and distribution rather than chemical composition. Al-though compositions are not identified, Microscopic methods
place inclusions into one of several composition-related cat-egories (sulfides, oxides, and silicates—the last as a type ofoxide). Paragraph 12.2.1 describes a metallographic techniqueto facilitate inclusion discrimination. Only those inclusionspresent at the test surface can be detected.
4.3 The macroscopic test methods evaluate larger surfaceareas than microscopic test methods and because examinationis visual or at low magnifications, these methods are best suitedfor detecting larger inclusions. Macroscopic methods are notsuitable for detecting inclusions smaller than about 0.40 mm(1⁄64 in.) in length and the methods do not discriminateinclusions by type.
4.4 The microscopic test methods are employed to charac-terize inclusions that form as a result of deoxidation or due tolimited solubility in solid steel (indigenous inclusions). Theseinclusions are characterized by morphological type, that is, bysize, shape, concentration, and distribution, but not specificallyby composition. The microscopic methods are not intended forassessing the content of exogenous inclusions (those fromentrapped slag or refractories).
4.5 Because the inclusion population within a given lot ofsteel varies with position, the lot must be statistically sampledin order to assess its inclusion content. The degree of samplingmust be adequate for the lot size and its specific characteristics.Materials with very low inclusion contents may be moreaccurately rated by automatic image analysis, which permitsmore precise microscopic ratings.
4.6 Results of macroscopic and microscopic test methodsmay be used to qualify material for shipment, but these testmethods do not provide guidelines for acceptance or rejectionpurposes. Qualification criteria for assessing the data devel-oped by these methods can be found in ASTM productstandards or may be described by purchaser-producer agree-ments. By agreements between producer and purchaser, thispractice may be modified to count only certain inclusion typesand thicknesses, or only those inclusions above a certainseverity level, or both. Also, by agreement, qualitative prac-tices may be used where only the highest severity ratings foreach inclusion type and thickness are defined or the number offields containing these highest severity ratings are tabulated.
4.7 These test methods are intended for use on wroughtmetallic structures. While a minimum level of deformation isnot specified, the test methods are not suitable for use on caststructures or on lightly worked structures.
4.8 Guidelines are provided to rate inclusions in steelstreated with rare earth additions or calcium-bearing com-pounds. When such steels are evaluated, the test report shoulddescribe the nature of the inclusions rated according to eachinclusion category (A, B, C, D).
4.9 In addition to the Practice E 45 JK ratings, basic (suchas used in Practice E 1245) stereological measurements (forexample, the volume fraction of sulfides and oxides, thenumber of sulfides or oxides per square millimeter, the spacingbetween inclusions, and so forth) may be separately deter-mined and added to the test report, if desired for additionalinformation. This practice, however, does not address themeasurement of such parameters.
5 Available from ASTM Headquarters. Order ADJE004502.6 Available from ASTM Headquarters. Order ADJE004501.
E 45 – 05e1
2Copyright ASTM International Provided by IHS under license with ASTM
Not for ResaleNo reproduction or networking permitted without license from IHS
--`,,```,,,,````-`-`,,`,,`,`,,`---
MACROSCOPIC METHODS
5. Macroscopical Test Methods Overview
5.1 Summary:5.1.1 Macro-etch Test—The macro-etch test is used to
indicate inclusion content and distribution, usually in the crosssection or transverse to the direction of rolling or forging. Insome instances, longitudinal sections are also examined. Testsare prepared by cutting and machining a section through thedesired area and etching with a suitable reagent. A solution ofone part hydrochloric acid and one part water at a temperatureof 71 to 82°C (160 to 180°F) is widely used. As the name ofthis test implies, the etched surface is examined visually or atlow magnification for inclusions. Details of this test areincluded in Method E 381. The nature of questionable indica-tions should be verified by microscopic examination or othermeans of inspection.
5.1.1.1 Sulfides are revealed as pits when the standardetchant described in 5.1.1 is used.
5.1.1.2 Only large oxides are revealed by this test method.5.1.2 Fracture Test—The fracture test is used to determine
the presence and location of inclusions as shown on thefracture of hardened slices approximately 9 to 13 mm (3⁄8 to 1⁄2in.) thick. This test is used mostly for steels where it is possibleto obtain a hardness of approximately 60 HRC and a fracturegrain size of 7 or finer. Test specimens should not haveexcessive external indentations or notches that guide thefracture. It is desirable that fracture be in the longitudinaldirection approximately across the center of the slice. Thefractured surfaces are examined visually and at magnificationsup to approximately ten diameters, and the length and distri-bution of inclusions is noted. Heat tinting, or blueing, willincrease visibility of oxide stringers. ISO 3763 provides a chartmethod for fracture surface inclusion ratings. In some in-stances, indications as small as 0.40 mm (1⁄64 in.) in length arerecorded.
5.1.3 Step-Down Method—The step-down test method isused to determine the presence of inclusions on machinedsurfaces of rolled or forged steel. The test sample is machinedto specified diameters below the surface and surveyed forinclusions under good illumination with the unaided eye orwith low magnification. In some instances, test samples aremachined to smaller diameters for further examination after theoriginal diameters are inspected. This test is essentially used todetermine the presence of inclusions 3 mm (1⁄8 in.) in lengthand longer.
5.1.4 Magnetic Particle Method—The magnetic particlemethod is a variation of the step-down method for ferromag-netic materials in which the test sample is machined, magne-tized, and magnetic powder is applied. Discontinuities as smallas 0.40 mm (1⁄64 in.) in length create magnetic leakage fieldsthat attract the magnetic powder, thereby outlining the inclu-sion. See Practice E 1444 and Guide E 709 on magneticparticle examinations for more details of the procedure. Referto Aerospace Materials Specifications AMS 2300, AMS 2301,AMS 2303, and AMS 2304.
5.2 Advantages:5.2.1 These test methods facilitate the examination of speci-
mens with large surface areas. The larger inclusions in steel,
which are the main concern in most cases, are not uniformlydistributed and the spaces between them are relatively large, sothat the chances of revealing them are better when largerspecimens are examined.
5.2.2 Specimens for macroscopic examination may bequickly prepared by machining and grinding. A highly polishedsurface is not necessary. The macroscopic methods are suffi-ciently sensitive to reveal the larger inclusions.
5.3 Disadvantages:5.3.1 These test methods do not distinguish among the
different inclusion shapes.5.3.2 They are not suitable for the detection of small
globular inclusions or of chains of very fine elongated inclu-sions.
5.3.3 The magnetic particle method can lead to incorrectinterpretation of microstructural features such as streaks ofretained austenite, microsegregation, or carbides in certainalloys; this is particularly likely if high magnetization currentsare employed.
MICROSCOPIC METHODS
6. Microscopic Test Methods Overview
6.1 Microscopic methods are used to characterize the size,distribution, number, and type of inclusions on a polishedspecimen surface. This may be done by examining the speci-men with a light microscope and reporting the types ofinclusions encountered, accompanied by a few representativephotomicrographs. This method, however, does not lend itselfto a uniform reporting style. Therefore, standard referencecharts depicting a series of typical inclusion configurations(size, type, and number) were created for direct comparisonwith the microscopic field of view. A method using imageanalysis to make these comparisons has also been developed.
6.2 Various reference charts of this nature have been de-vised such as the JK chart7 and the SAE chart found in SAERecommended Practice J422 of the SAE Handbook. Themicroscopic methods in Test Methods E 45 use refined com-parison charts based on these charts. Method A (Worst Fields),Method D (Low Inclusion Content) and Method E (SAMRating) use charts based on the JK chart while Method C(Oxides and Silicates) uses the SAE chart. ISO Standard 4967also uses the JK chart.
6.3 No chart can represent all of the various types and formsof inclusions. The use of any chart is thus limited to determin-ing the content of the most common types of inclusions, and itmust be kept in mind that such a determination is not acomplete metallographic study of inclusions.
6.4 An alternate to comparison (chart) methods such asMethods A, C and D8 may be found in Method B. Method B(Length) is used to determine inclusion content based onlength. Only inclusions 0.127 mm (0.005 in.) or longer arerecorded regardless of their type. From this method one may
7 The JK chart derives its name from its sponsors Jernkontoret, the SwedishIronmasters Association.
8 Note that while these methods are called comparison chart methods, theprocedure used may also consist of length measurements or counts of inclusions, orboth.
E 45 – 05e1
3Copyright ASTM International Provided by IHS under license with ASTM
Not for ResaleNo reproduction or networking permitted without license from IHS
--`,,```,,,,````-`-`,,`,,`,`,,`---
obtain data such as length of the longest inclusion and averageinclusion length. In addition, photomicrographs may also betaken to characterize the background inclusions that were notlong enough to measure.
6.5 The advantages of the microscopic methods are:6.5.1 Inclusions can be characterized as to their size, type,
and number.6.5.2 Extremely small inclusions can be revealed.6.6 A disadvantage of the microscopic methods is that
individual rating fields are very small (0.50 mm2). This limitsthe practical size of the specimen, as it would simply take aprohibitive number of fields to characterize a large specimen.The result obtained by a microscopic characterization of theinclusions in a large section is governed by chance if localvariations in the inclusion distribution are substantial. The enduse of the product determines the importance of the micro-scopic results. Experience in interpreting these results isnecessary in order not to exaggerate the importance of smallinclusions in some applications.
6.7 In determining the inclusion content, it is important torealize that, whatever method is used, the result actuallyapplies only to the areas of the specimens that were examined.For practical reasons, such specimens are relatively smallcompared with the total amount of steel represented by them.For the inclusion determination to have any value, adequatesampling is just as necessary as a proper method of testing.
6.8 Steel often differs in inclusion content not only fromheat to heat, but also from ingot to ingot in the same heat andeven in different portions of the same ingot. It is essential thatthe unit lot of steel, the inclusion content of which is to bedetermined, shall not be larger than one heat. Sufficientsamples should be selected to represent the lot adequately. Theexact sampling procedure should be incorporated in the indi-vidual product requirements or specifications. For semifinishedproducts, the specimens should be selected after the materialhas been sufficiently cropped and suitable discards made. If thelocations of the different ingots and portions of ingots in theheat cannot be identified in the lot being tested, randomsampling should involve a greater number of test specimens foran equivalent weight of steel. A value for the inclusion contentof an isolated piece of steel, even if accurately determined,should not be expected to represent the inclusion content of thewhole heat.
6.9 The size and shape of the wrought steel product testedhas a marked influence on the size and shape of the inclusions.During reduction from the cast shape by rolling or forging, theinclusions are elongated and broken up according to the degreeof reduction of the steel cross section. In reporting results ofinclusion determinations, therefore, the size, shape, andmethod of manufacture of the steel from which the specimenswere cut must be stated. In comparing the inclusion content ofdifferent steels, they must all be rolled or forged as nearly aspossible to the same size and shape, and from cast sections ofabout the same size. Specimens cut lengthwise or parallel tothe direction of rolling or forging shall be used.
6.10 It may be convenient, in order to obtain more readilycomparable results, to forge coupons from larger billets. Theseforged sections may then be sampled in the same way as rolled
sections. Exercise care, however, to crop specimens of suffi-cient length from the billets for forging; otherwise, there isdanger of the shear-dragged ends being incorporated in thespecimens. Such distorted material will give a false result inthe inclusion determination. To avoid this, it is helpful to sawthe ends of the billet length for forging and to take thespecimen from the middle of the forged length.
6.11 Several of the methods described in these test methodsrequire that a specific area of the prepared surface of thespecimen is surveyed, and all the significant inclusions ob-served be recorded and expressed in the results. The reportedresult for each specimen examined is, therefore, a moreaccurate representation of the inclusion content than a photo-micrograph or diagram. A disadvantage of the Worst Fieldapproach is that no such distribution of inclusion ratings isobtained.
6.12 To make comparisons possible between different heatsand different parts of heats, the results shall be expressed insuch a manner that an average for the inclusion content of thedifferent specimens in the heat can be obtained. When thelengths of the inclusions are measured, the simplest number isthat for the aggregate length of all the inclusions per areaexamined; however, it may be desirable not merely to add thelengths but also to weight the inclusions according to theirindividual lengths. The length of the largest inclusion foundand the total number of inclusions may also be expressed.
7. Sampling
7.1 To obtain a reasonable estimate of inclusion variationswithin a lot, at least six locations, chosen to be as representa-tive of the lot as possible, should be examined. In this context,a lot shall be defined as a unit of material processed at one timeand subjected to similar processing variables. In no case shouldmore than one heat be in the same lot. For example if a lotconsists of one heat, sampling locations might be in the productobtained from the top and bottom of the first, middle, and lastusable ingots in the pouring sequence. For strand cast orbottom pour processing, a similar sampling plan per heatshould be invoked.
7.2 For cases in which a definite location within a heat,ingot, or other unit lot is unknown, statistical random samplingwith a greater number of specimens should be employed.
7.3 Ratings obtained will vary with the amount of reductionof the product. For materials acceptance or for comparisonamong heats, care must be taken to sample at the correct stageof processing.
8. Test Specimen Geometry
8.1 The minimum polished surface area of a specimen forthe microscopic determination of inclusion content is 160mm2 (0.25 in.2). It is recommended that a significantly largearea should be obtained so that the measurements may be madewithin the defined area away from the edges of the sample. Thepolished surface must be parallel to the longitudinal axis of theproduct. In addition, for flat-rolled products, the section shallalso be perpendicular to the rolling plane; for rounds andtubular shapes, the section shall be in the radial direction. In allcases, the polished surface shall be parallel to the hot-working
E 45 – 05e1
4Copyright ASTM International Provided by IHS under license with ASTM
Not for ResaleNo reproduction or networking permitted without license from IHS
--`,,```,,,,````-`-`,,`,,`,`,,`---

axis. Studies have demonstrated that inclusion length measure-ments are significantly affected if the plane of polish is angledmore than 6° from the longitudinal hot-working direction.9
8.1.1 Sections less than 0.71 mm in thickness shall not beanalyzed using Test Methods E 45.
8.2 Thick Section (Product Section Size Greater than 9.5mm (0.375 in.) Thick, Such as Forgings, Billet, Bar, Slab,Plate, and Pipe):
8.2.1 For wide products, the one-quarter point along theproduct width is commonly used to provide representativematerial.
8.2.2 For round sections, the manner of cutting a specimenfrom a 38 mm (1.5-in.) diameter section is shown in Fig. 3. Adisk at least 12 mm (0.474 in.) thick is cut from the product.The quarter-section indicated in Fig. 3 is cut from the disk andthe shaded area is polished. Thus the specimen extends at least12 mm along the length of the product from the outside to thecenter.
8.2.3 For large sections, each specimen shall be taken fromthe mid-radius location, as shown by the shaded area in Fig. 4.The specimen face to be polished extends at least 12 mmparallel to the longitudinal axis of the billet and at least 19 mm(0.75 in.) in the longitudinal radial plane, with the polishedface midway between the center and the outside of the billet.Such midway sampling is used to decrease the number of
specimens polished and examined. Other areas, such as thecenter and the surface, may be examined as well, provided thesampling procedure used is stated in the results. A billet or barabout 50 to 100 mm (2 to 4 in.) round or square is the preferredsize from which specimens should be taken; however, larger orsmaller sizes may be used, provided the product sizes arereported with the results.
8.3 Thin Sections (Product Section Sizes 9.5 mm (0.375 in.)Thick or Less; Strip, Sheet, Rod, Wire, and Tubing)—Full crosssection longitudinal specimens shall be cut in accordance withthe following plan:
8.3.1 For 0.95 to 9.5-mm (0.0375 to 0.375 in.) cross sectionthicknesses inclusively, a sufficient number of pieces from thesame sampling point are mounted to provide approximately160 mm2 (0.25 in.2) of polished specimen surface. (Example:For a sheet 1.27 mm (0.050 in.) thick, select seven or eightlongitudinal pieces uniformly across the sheet width to provideone specimen).
8.3.2 For cross section thicknesses less than 0.95 mm, tenlongitudinal pieces from each sampling location shall bemounted to provide a suitable specimen surface for polishing.
9 Allmand, T. R., and Coleman, D. S., “The Effect of Sectioning Errors onMicroscopic Determinations of Non-Metallic Inclusions in Steels,” Metals andMaterials, Vol 7, 1973, pp. 280–283.
NOTE 1—This method is also applicable to round sections.NOTE 2—a denotes surface removal.
FIG. 1 Quarter Section Specimen from Square Section forMagnetic Particle Test, Machine Only
NOTE 1—Method also applicable to square sections.NOTE 2—a denotes distance equal to surface removal.
FIG. 2 Quarter Section Specimen from Round Section forMagnetic Particle Test, Forging and Machining
NOTE 1—Inch-pound equivalents: 12 mm = 0.47 in.; 19 mm = 0.75 in.FIG. 3 Specimen from 11⁄2-in. (38.1 mm) Round Section for
Microscopic Test
FIG. 4 Specimen from Large Bar or Billet for Microscopic Test
E 45 – 05e1
5Copyright ASTM International Provided by IHS under license with ASTM
Not for ResaleNo reproduction or networking permitted without license from IHS
--`,,```,,,,````-`-`,,`,,`,`,,`---

(Dependent on material thickness and piece length, the pol-ished specimen area may be less than 160 mm2. Because ofpractical difficulties in mounting a group of more than tenpieces, the reduced specimen area will be considered suffi-cient.) Note that when using the comparison procedures ofMethods A, C, D and E, the thickness of the test specimencross section should not be less than the defined minimumdimension of a single field of view. Therefore, the minimumthickness required is 0.71 mm for Methods A, D, and E, and0.79 mm for Method C. Thinner sections should be rated byother means.
9. Preparation of Specimens
9.1 Methods of specimen preparation must be such that apolished, microscopically flat section is achieved in order thatthe sizes and shapes of inclusions are accurately shown. Toobtain satisfactory and consistent inclusion ratings, the speci-men must have a polished surface free of artifacts such aspitting, foreign material (for example, polishing media), andscratches. When polishing the specimen it is very importantthat the inclusions not be pitted, dragged, or obscured. Speci-mens must be examined in the as-polished condition, free fromthe effects of any prior etching (if used).
9.2 Metallographic specimen preparation must be carefullycontrolled to produce acceptable quality surfaces for bothmanual and image analysis. Guidelines and recommendationsare given in Practice E 3, Test Methods E 45, and PracticeE 768.
9.3 Inclusion retention is generally easier to accomplish inhardened steel specimens than in the annealed condition. Ifinclusion retention is inadequate in annealed specimens, theyshould be subjected to a standard heat treatment cycle using arelatively low tempering temperature. After heat treatment, thespecimen must be descaled and the longitudinal plane must bereground below any decarburization. This recommendationonly applies to heat-treatable steel grades.
9.4 Mounting of specimens is not required if unmountedspecimens can be properly polished.
10. Calibration and Standardization
10.1 Recommended calibration guidelines can be found inGuide E 1951.
10.2 For image analysis, a stage micrometer and a ruler,both calibrated against devices traceable to a recognizednational standards laboratory, such as the National Institute forStandards and Technology (NIST), are used to determine themagnification of the system and calibrate the system inaccordance with the manufacturer’s recommended procedure.For example, the ruler is superimposed over the magnifiedimage of the stage micrometer on the monitor. The apparent(magnified) distance between two known points on the stagemicrometer is measured with the ruler. The magnified distanceis divided by the true distance to determine the screenmagnification. The pixel dimensions can be determined fromthe number of pixels for a known horizontal or verticaldimension on the monitor. Divide the known length of a scaleor mask by the number of pixels representing that length on themonitor to determine the pixel size for each possible screenmagnification. Not all systems use square pixels. Determine the
pixel dimensions in both horizontal and vertical orientations.Check the instruction manual to determine how corrections aremade for those systems that do not use square pixels.
10.2.1 Follow the manufacturer’s recommendations in ad-justing the microscope light source and setting the correct levelof illumination for the television video camera. For systemswith 256 gray levels, the illumination is generally adjusteduntil the as-polished matrix surface is at level 254 and black isat zero.
10.2.2 For modern image analyzers with 256 gray levels,with the illumination set as described in 10.2.1, it is usuallypossible to determine the reflectance histogram of individualinclusions as an aid in establishing proper threshold settings todiscriminate between oxides and sulfides. Oxides are darkerand usually exhibit gray levels below about 130 on the grayscale while the lighter sulfides generally exhibit values be-tween about 130 and 195. These numbers are not absolute andwill vary somewhat for different steels and different imageanalyzers. After setting the threshold limits to discriminateoxides and sulfides, use the flicker method of switchingback-and-forth between the live inclusion image and thedetected (discriminated) image, over a number of test fields, toensure that the settings are correct, that is, detection of sulfidesor oxides by type and size is correct.
11. Classification of Inclusions and Calculation ofSeverities
11.1 In these microscopic methods, inclusions are classifiedinto four categories (called Type) based on their morphologyand two subcategories based on their width or diameter.Categories A-Sulfide Type, B-Alumina Type, C-Silicate Typeand D-Globular Oxide Type define their shape while categoriesHeavy and Thin describe their thickness. Although the catego-ries contain chemical names that imply knowledge of theirchemical content, the ratings are based strictly on morphology.The chemical names associated with the various Types werederived from historical data collected on inclusions found inthese shapes or morphologies. The four categories, or Types,are partitioned into Severity Levels based on the number orlength of the particles present in a 0.50 mm2 field of view.These Severity Levels and inclusion Types are depicted inPlate I-r and their numerical equivalents are found in Tables 1and 2.
11.1.1 Type A and C inclusions are very similar in size andshape. Therefore, discrimination between these Types is aidedby metallographic techniques. Type A-Sulfide are light graywhile Type C-Silicate are black when viewed under brightfieldillumination. Discrimination between these types may also beaided by viewing the questionable inclusions under darkfield orcross-polarized illumination where properly polished sulfideinclusions are dark and silicate inclusions appear luminescent.
11.2 The B-type stringers consist of a number (at least three)of round or angular oxide particles with aspect ratios less than2 that are aligned nearly parallel to the deformation axis.Particles within 615 µm of the centerline of a B-type stringerare considered to be part of that stringer. The Type C-Silicatestringers consist of one or more highly elongated oxides withsmooth surfaces aligned parallel to the deformation axis.Aspect ratios are generally high, $ 2. The maximum permitted
E 45 – 05e1
6Copyright ASTM International Provided by IHS under license with ASTM
Not for ResaleNo reproduction or networking permitted without license from IHS
--`,,```,,,,````-`-`,,`,,`,`,,`---

separation between particles in a stringer is 40 µm. Any oxidesthat have aspect ratios < 2, and are not part of a B- or C-typestringer, are rated as D-types. No other shape restriction isapplicable.
11.3 After the inclusions are categorized by Type, they mustbe categorized by thickness or diameter. Inclusion width
parameters for classification into the Thin or Heavy categoryare listed in Table 2. An inclusion whose width varies fromThin to Heavy along its length shall be placed in the categorythat best represents its whole. That is to say, if more of itslength falls into the Heavy range, classify it as Heavy. See 11.8for instructions on reporting inclusions that exceed the limits ofTable 1 or Table 2.
11.4 Inclusions thinner than the 2 µm minimum listed inTable 2 are not rated. That is, their lengths or numbers are notincluded in the determination of Severity.
11.5 After classification by type and thickness, the severitylevels are determined for the inclusions within 0.50 mm2 testareas based upon the total Type A sulfide lengths per field, thetotal Type B or C stringer lengths per field, and the number ofisolated D-type inclusions per field. These values can bereported according to the length or number in each 0.50-mm2
field or as the length per unit area or number per unit area(mm2), but the measurements must be made on contiguous0.50 mm2 test areas. Severities are calculated based on thelimits given in Table 1. Note that these values are the minimumlength or number for each class. In general, severity values(calculated as described below) are rounded downward to thenearest whole or half unit. For steels with particularly lowinclusion contents, severity values may be rounded down to thenearest quarter or tenth value, per agreement between producerand purchaser. However, because of the way D inclusioncounts are defined (for 1 inclusion, the severity is 0.5 and for0 inclusions, the severity is 0), there can be no subdivisionsbetween 0 and 0.5 severities.
11.6 Calculation of the severity number for Type A, B, andC inclusions is based on a log-log plot of the data in Table 1 onMinimum Values for Inclusion Rating Numbers (Methods Aand D). Such plots10 reveal a linear relationship between theseverity numbers and the minimum total sulfide length (TypeA) and the minimum total stringer length (Types B & C) per0.50-mm2 field for each severity level as shown in Figs. 10-12.A least-square fit to the data in Table 1 has been used toproduce the relationships in Table 6, which can be used tocalculate the severity of Type A, B, and C inclusions, eitherthin or thick. The antilog is determined and rounded downwardto the nearest half-severity value.
11.7 Calculation of the severity numbers for D-type oxidesis done in the same manner as for Types A, B, and C inclusionsexcept that the criterion is the number of oxides rather thantheir length. Fig. 13 shows a log-log plot of the data in Table1.
11.8 The fields shown in Plate I-r represent the total lengthsof the A inclusions, the total stringer lengths of B and Cinclusions, the number of D inclusions, and their respectivelimiting widths or diameters. If any inclusions are present thatare longer than the fields shown in Plate I-r, their lengths shallbe recorded separately. If their widths or diameters are greaterthan the limiting values shown in Plate I-r and Table 2, theyshall be recorded separately. Note that an oversize A, B, or C
10 Vander Voort, G. F., and Golden, J. F., “Automating the JK InclusionAnalysis,” Microstructural Science, Vol 10, Elsevier Science Publishing Co., Inc.,NY, 1982, pp. 277–290.
TABLE 1 Minimum Values for Severity Level Numbers(Methods A, D, and E)A,B
(mm (in.) at 1003, or count)
Severity A B C DC
0.5 3.7(0.15) 1.7(0.07) 1.8(0.07) 11.0 12.7(0.50) 7.7(0.30) 7.6(0.30) 41.5 26.1(1.03) 18.4(0.72) 17.6(0.69) 92.0 43.6(1.72) 34.3(1.35) 32.0(1.26) 162.5 64.9(2.56) 55.5(2.19) 51.0(2.01) 253.0 89.8(3.54) 82.2(3.24) 74.6(2.94) 363.5 118.1(4.65) 114.7(4.52) 102.9(4.05) 494.0 149.8(5.90) 153.0(6.02) 135.9(5.35) 644.5 189.8(7.47) 197.3(7.77) 173.7(6.84) 815.0 223.0(8.78) 247.6(9.75) 216.3(8.52) 100
(µm (in.) at 13, or count)
Severity A B C DC
0.5 37.0(.002) 17.2(.0007) 17.8(.0007) 11.0 127.0(.005) 76.8(.003) 75.6(.003) 41.5 261.0(.010) 184.2(.007) 176.0(.007) 92.0 436.1(.017) 342.7(.014) 320.5(.013) 162.5 649.0(.026) 554.7(.022) 510.3(.020) 253.0 898.0(.035) 822.2(.032) 746.1(.029) 363.5 1181.0(.047) 1147.0(.045) 1029.0(.041) 494.0 1498.0(.059) 1530.0(.060) 1359.0(.054) 644.5 1898.0(.075) 1973.0(.078) 1737.0(.068) 815.0 2230.0(.088) 2476.0(.098) 2163.0(.085) 100
(mm/mm2(in./in.2), or count/mm2)
Severity A B C DC
0.5 0.074(1.88) 0.034(.864) 0.036(.914) 21.0 0.254(6.45) 0.154(3.91) 0.152(3.86) 81.5 0.522(3.64) 0.368(9.35) 0.352(8.94) 182.0 0.872(22.15) 0.686(17.32) 0.640(16.26) 322.5 1.298(32.97) 1.110(28.19) 1.020(25.91) 503.0 1.796(45.59) 1.644(41.76) 1.492(37.90) 723.5 2.362(59.99) 2.294(58.27) 2.058(52.27) 984.0 2.996(76.10) 3.060(77.72)† 2.718(69.04) 1284.5 3.796(96.42) 3.946(100.2) 3.474(88.24) 1625.0 4.460(113.3) 4.952(125.8) 4.326(109.9) 200
A Note that length values in this table have been changed to be compatible withautomated rating methods. The significant length changes occurred at minimumrating levels of 1⁄2 where manual methods are least accurate. Inclusion counts forType D inclusions have also been revised. In this case, the changes are greatestfor high counts, which are above the levels of material acceptance standards.
B VanderVoort, G. F., and Wilson, R. K., “Nonmetallic Inclusions and ASTMCommittee E04,” Standardization News, Vol 19, May 1991, pp 28–37.
C Maximum aspect ratio for Type D inclusions is < 2.††Editorial corrections made February 2007.
TABLE 2 Inclusion Width and Diameter Parameters(Methods A and D)A
InclusionType
Thin Series Heavy Series
Width, min,µm
Width, max,µm
Width, min,µm
Width, max,µm
A 2 (.00008) 4 (.00016) >4 (.00016) 12 (.0005)B 2 (.00008) 9 (.00035) >9 (.00035) 15 (.0006)C 2 (.00008) 5 (.0002) >5 (.0002) 12 (.0005)D 2 (.00008) 8 (.0003) >8 (.0003) 13 (.0005)
A Any inclusion with maximum dimensions greater than the maximum for theHeavy Series must be reported as oversized accompanied with its actualdimensions.
E 45 – 05e1
7Copyright ASTM International Provided by IHS under license with ASTM
Not for ResaleNo reproduction or networking permitted without license from IHS
--`,,```,,,,````-`-`,,`,,`,`,,`---

inclusion or inclusion stringer still contributes to the determi-nation of a field’s Severity Level Number. Therefore, if an A,B, or C inclusion is oversized either in length or thickness thatportion that is within the field boundaries shall be included inthe appropriate Thin or Heavy severity level measurement.Likewise, if an oversize D inclusion is encountered in a field,it is also included in the count that determines the D heavyrating. For reference, illustrations of large, globular oxides
appear at the bottom of Plate I-r. A Type D globular oxide maynot exceed an aspect ratio of 2:1.
11.9 Oxides located at the tips of Type A-Sulfide inclusionsare rated at Type D- Globular Oxides unless they are closeenough together to meet the requirements of a TypeB-Alumina.
11.10 The indigenous inclusions in steels deoxidized withrare earth elements or calcium-containing materials are also
NOTE 1—The square mask will yield a field area of 0.50 mm2 on the specimen surface. A graphic representation of the maximum thickness of the Thinand Heavy series of Types A, B, C, and D is on the left. Several oversized Type D are depicted on the right for convenience.
FIG. 5 Suggested Reticle or Overlay Grid For Methods A, D, and E
NOTE 1—Systematically scan the entire masked area. Methods A, B, C, and E permit adjustment of the field locations in order to maximize a severitylevel number or facilitate a measurement. For Method D, the fields must remain contiguous and only features within the field are compared to Plate I-r.
NOTE 2—Method D will require a larger (10 3 17 mm) test area to facilitate placement of enough contiguous, 0.71 mm square fields to total 160 mm2
of polished surface area.FIG. 6 Typical Scan Pattern for Microscopic Methods
E 45 – 05e1
8Copyright ASTM International Provided by IHS under license with ASTM
Not for ResaleNo reproduction or networking permitted without license from IHS
--`,,```,,,,````-`-`,,`,,`,`,,`---
classified by morphology and thickness with the added require-ment that compositional information be given in the report. Forexample, rare earth or calcium-modified sulfides with an aspectratio $ 2 are rated as A-types by their total length per fieldaccording to the limits of Table 1 and the width limits of Table2. However, for aspect ratios < 2 and if they are not part of astringer, they are rated as D-types by their number per fieldaccording to the number limits of Table 1 and the width limitsof Table 2. In both cases, a general description of theircomposition must be provided to avoid confusion. Becausethey are sulfides with a D-type morphology, they may bereferred to as DS.
11.11 Complex inclusions, such as oxysulfides or duplexinclusions, are also rated according to their morphology:whether they are stringered or elongated (for aspect ratios $ 2)or isolated (not part of a stringer and aspect ratio < 2); and thenby thickness. Isolated, globular particles are rated as D-typesby their average thickness. Complex Ds may be predominantly(>50 % by area) sulfides or oxides and should be identified assuch. For example, if the oxide area is greater in a globularoxysulfide, it could be called a DOS type. Stringered complexparticles are rated by the aspect ratio of the individual particles;if < 2, they are B-types, if $ 2 they are A- or C-types (separateby gray level). For those complex inclusions with aspect ratios$ 2, they are classified as A-types if more than 50 % of thearea is sulfide and C-types if more than 50 % of the area isoxide. Report the composition, in general terms, to avoidconfusion, and state the nature of the inclusions, for example,“globular calcium aluminates encapsulated with a thin film ofcalcium-manganese sulfide,” or “irregular aluminates partiallyor fully embedded in manganese sulfide stringers.”
11.12 If producer-purchaser agreements limit the analysis toonly certain inclusion types, thickness categories, or severitylimits, the scheme in Section 11 can be modified to analyze,measure, and store only the data of interest. It may also containprocedures to perform basic (see Practice E 1245) stereologicalmeasurements to supplement the JK analyses. Such measure-ments are not covered by this practice.
12. Method A (Worst Fields)11
12.1 Manual Introduction—This test method requires asurvey of a 160 mm2 (0.25 in.2) polished surface area of thespecimen at 1003. The field size shall equal an area equivalentto 0.50 mm2 (0.000779 in.2) on the specimen surface as definedby a square with 0.71 mm (0.02791 in.) long sides (see Fig. 5).Each 0.50 mm2 field is compared to the square fields depictedin Plate I-r in a search for the worst field, that is, the highestseverity rating, of each inclusion Type A, B, C, and D for boththe Thin and Heavy series. The severity level of these worstfields shall be reported for every specimen examined.
12.2 Manual Procedure:12.2.1 Either of two techniques may be employed to
achieve a 0.50 mm2 field of view. One method is to project the1003 microscope image onto a viewing screen that has asquare mask with 71.0 mm (2.79 in.) sides drawn on it. Anotheroption is to use a reticle made for the microscope, which willsuperimpose the required square mask directly onto the field ofview (see Fig. 5).
12.2.2 To begin, outline the required test area on thespecimen surface using either an indelible marker or a carbide-tipped scribe. Place the specimen on the microscope stage andstart the examination with a field in one of the corners of themarked test area. Compare this field to the images on Plate I-r.Classify the inclusion content of the field based on the ruleslisted in Section 11 concerning Type, and thickness of inclu-sions present. Record the severity level in whole numbers from0 to 3.0 for each inclusion type (A, B, C, and D) that mostresembles the field under observation. (See Table 1 if requiredto report severity levels > 3.0). Do this for both the Thin andHeavy series. It is important to note here that if a field ofinclusions falls between two severity levels, its value isrounded down to the lower severity level. For example, whenusing Plate I-r, a field that contains fewer inclusions, or lessinclusion length than Severity Level Number 1, is counted as a0.
12.2.3 Move the microscope stage to reveal an adjacent fieldand repeat the comparison procedure. Continue this processuntil the required polished surface area of the specimen hasbeen scanned. A typical scan configuration is shown in Fig. 6.This method requires adjustment of the microscope stage tomaximize an inclusion severity level. That is, the field of viewis adjusted using the microscope stage controls, such thatinclusions are moved inside the square mask in order to locatethe worst field. In practice, the rater is actually scanning thespecimen and stopping only when a potential worst field ofeach type and thickness is in view.
12.3 Manual Expression of Results:12.3.1 The averages of the worst fields for each inclusion
type in all the specimens of the lot shall be calculated inaccordance with the Severity Level Numbers given at the sidesof Plate I-r or Table 1. An example showing the averagesobtained for six specimens examined is given in Table 4.
12.3.2 Oversize inclusions with widths or diameters greaterthan the limiting values shown on Plate I-r (and Table 2) shallbe recorded separately.
11 This method is similar to the Jernkontoret Method, Uppsala, Sweden (1936).
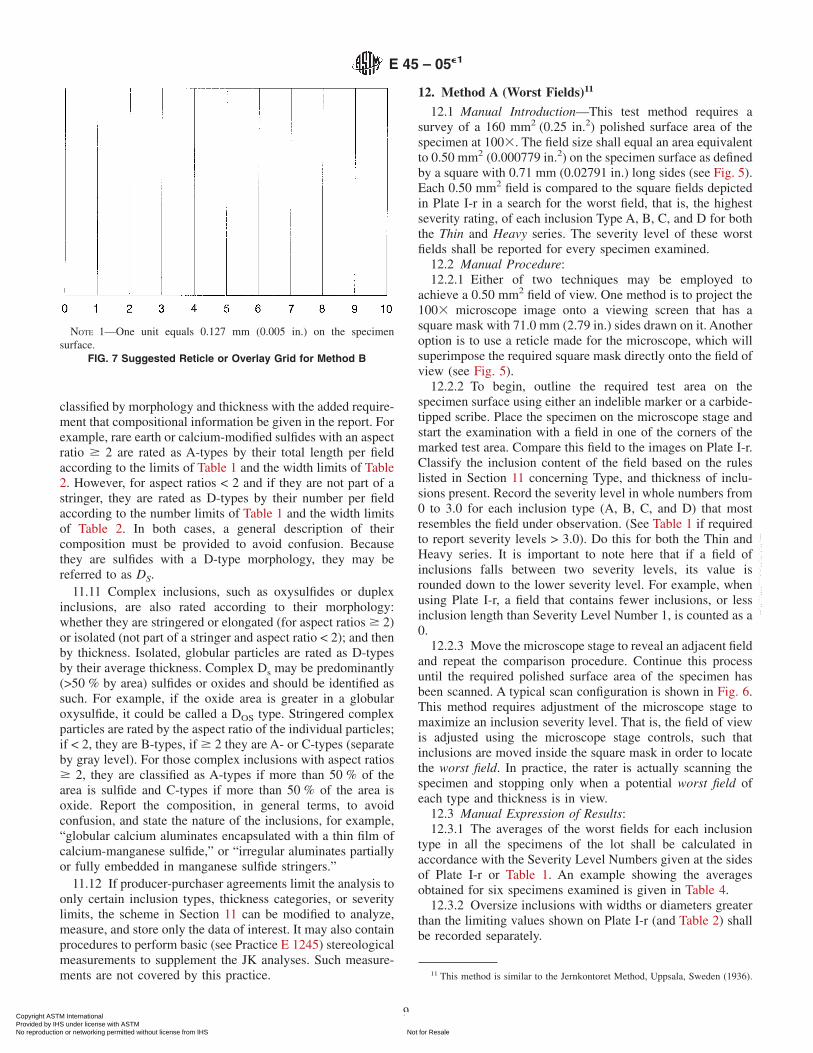
NOTE 1—One unit equals 0.127 mm (0.005 in.) on the specimensurface.
FIG. 7 Suggested Reticle or Overlay Grid for Method B
E 45 – 05e1
9Copyright ASTM International Provided by IHS under license with ASTM
Not for ResaleNo reproduction or networking permitted without license from IHS
--`,,```,,,,````-`-`,,`,,`,`,,`---
12.3.3 If desired, the predominant chemical type of inclu-sions may be determined and recorded as sulfide, silicate, oroxide. If the charts are used to rate carbides or nitrides,chemical composition information may also be determined andreported.
12.4 Image Analysis Introduction—The inclusions on thesurface of a properly prepared as-polished metallographicspecimen are viewed with a high-quality, metallurgical micro-scope. The bright-field image is picked up by a suitabletelevision camera and transferred to the image analyzer screen.Image analysis software is then used to evaluate the inclusioncontent of the material based on microscopic Methods A and D.
12.5 Image Analysis Procedure:12.5.1 Place the specimen on the microscope stage so that
the specimen surface is perpendicular to the optical axis. Withan inverted-type microscope, simply place the specimen face-
down on the stage plate and hold in place with the stageclamps. With an upright-type microscope, place the sample ona slide and level the surface using clay or plasticene and ahand-leveling press. Certain upright microscopes can beequipped with an autoleveling stage for mounted specimens. Ifthe sample must be leveled using clay, the tissue paper placedbetween the specimen surface and the leveling press ram mayadhere to the surface and present artifacts for measurement. In
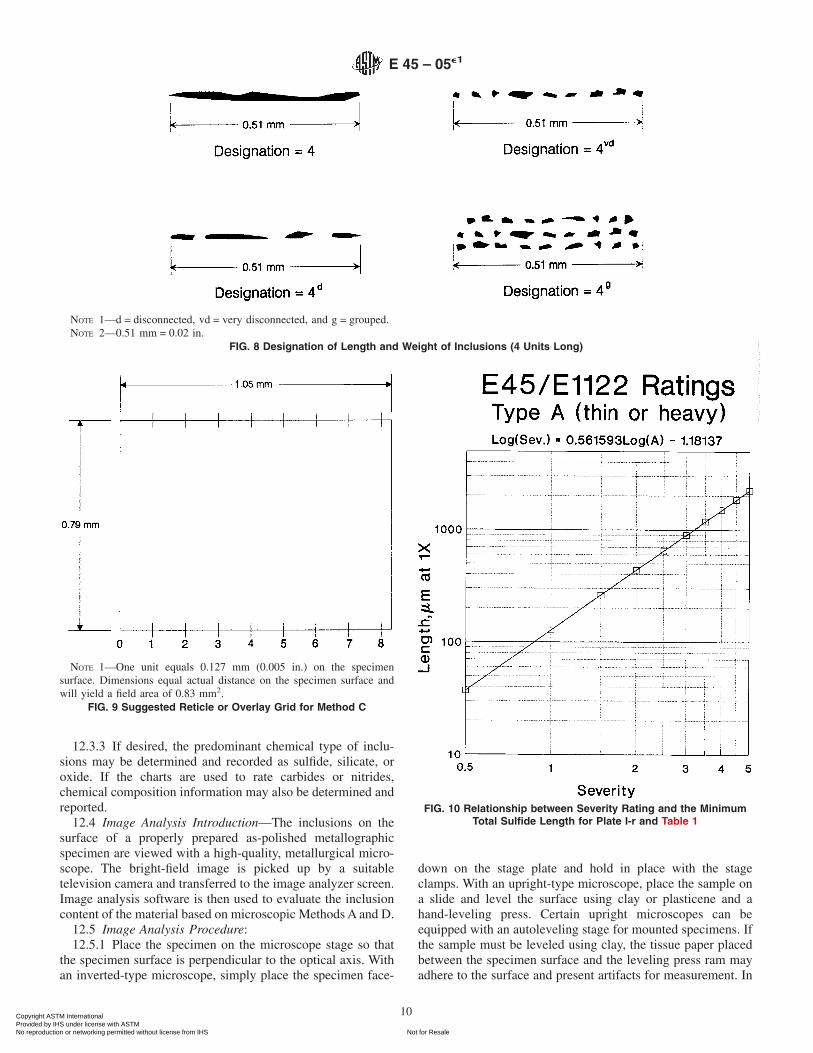
NOTE 1—d = disconnected, vd = very disconnected, and g = grouped.NOTE 2—0.51 mm = 0.02 in.
FIG. 8 Designation of Length and Weight of Inclusions (4 Units Long)
NOTE 1—One unit equals 0.127 mm (0.005 in.) on the specimensurface. Dimensions equal actual distance on the specimen surface andwill yield a field area of 0.83 mm2.
FIG. 9 Suggested Reticle or Overlay Grid for Method C
FIG. 10 Relationship between Severity Rating and the MinimumTotal Sulfide Length for Plate I-r and Table 1
E 45 – 05e1
10Copyright ASTM International Provided by IHS under license with ASTM
Not for ResaleNo reproduction or networking permitted without license from IHS
--`,,```,,,,````-`-`,,`,,`,`,,`---
some cases, adherent tissue can be blown off the specimensurface. An alternative procedure to avoid this problem is toplace an aluminum or stainless steel ring form, which has beenflattened slightly in a vise to an oval shape, between the sampleand the ram. If the specimen was mounted, the ring form willrest only on the surface of the mounting material. If thespecimen is unmounted but with a surface area substantiallygreater than the 160-mm2 area required for the measurement,the ring form can rest on the outer edges of the specimen forflattening and thus avoid contact with the measurement area.Align the specimen on the stage so that the inclusions arealigned parallel to the x-direction of the stage movement, thatis, horizontal on the monitor screen. Alternatively, if program-ming is facilitated, align the inclusions parallel to they-direction of the stage movement, that is, the longitudinaldirection is vertical on the monitor screen.
12.5.2 Check the microscope light source for correct align-ment and adjust the illumination to the level required by thetelevision video camera.
12.5.3 The inclusions can be examined and discriminatedby type using magnifications other than 1003 and field areasother than 0.50 mm2 as long as the severity measurements arebased upon the required 0.50-mm2 field area, if the image
analyzer is capable of such a procedure.12 If the system cannotwork in this manner, that is, if the inclusions in each field mustbe discriminated by type, measured, and a severity levelassigned on a field-by-field basis, then the magnification mustbe chosen so that the field area is as close to 0.50 mm2 as
12 Forget, C., “Improved Method for E1122 Image Analysis NonmetallicInclusion Ratings,” MiCon 90: Advances in Video Technology for MicrostructuralControl, ASTM STP 1094, American Society for Testing and Materials, Philadelphia,1991, pp. 135–150.
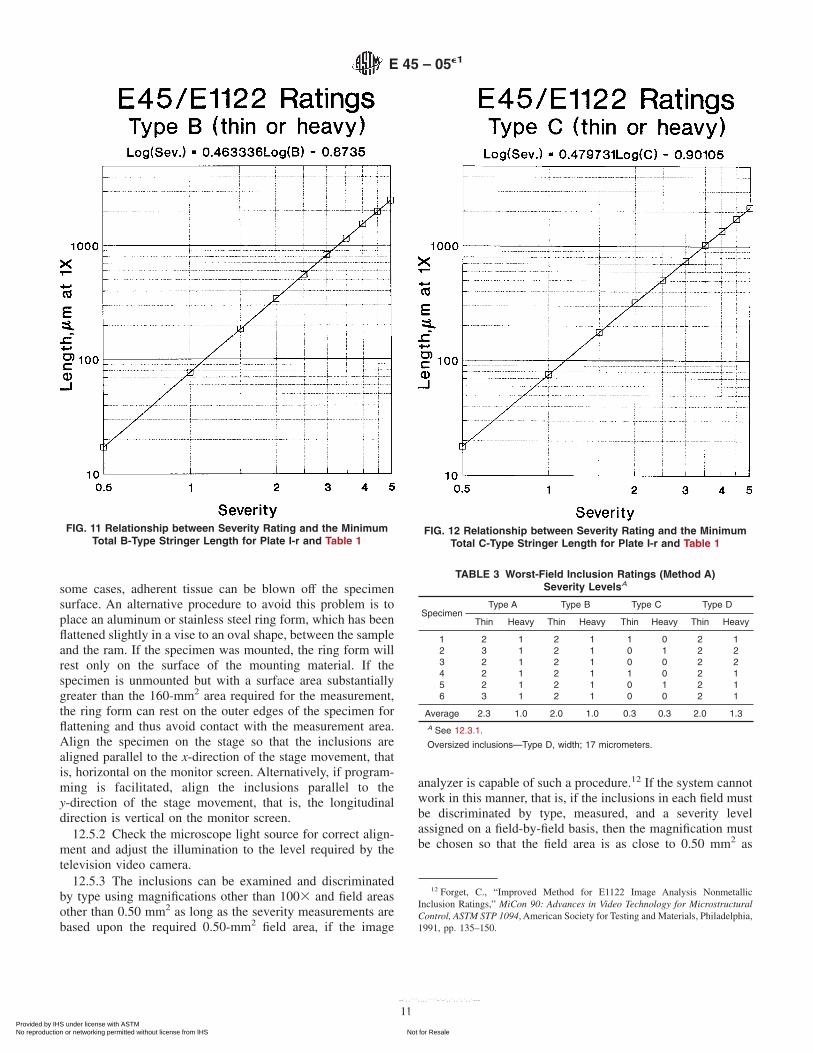
FIG. 11 Relationship between Severity Rating and the MinimumTotal B-Type Stringer Length for Plate I-r and Table 1
FIG. 12 Relationship between Severity Rating and the MinimumTotal C-Type Stringer Length for Plate I-r and Table 1
TABLE 3 Worst-Field Inclusion Ratings (Method A)Severity LevelsA
SpecimenType A Type B Type C Type D
Thin Heavy Thin Heavy Thin Heavy Thin Heavy
1 2 1 2 1 1 0 2 12 3 1 2 1 0 1 2 23 2 1 2 1 0 0 2 24 2 1 2 1 1 0 2 15 2 1 2 1 0 1 2 16 3 1 2 1 0 0 2 1
Average 2.3 1.0 2.0 1.0 0.3 0.3 2.0 1.3A See 12.3.1.
Oversized inclusions—Type D, width; 17 micrometers.
E 45 – 05e1
11Copyright ASTM International Provided by IHS under license with ASTM
Not for ResaleNo reproduction or networking permitted without license from IHS
--`,,```,,,,````-`-`,,`,,`,`,,`---
possible. A deviation of less than 60.05 mm2 from the required0.50-mm2 area will not significantly impair measurement
results. The magnification chosen should produce a maximumcalibration factor of 1.3 microns at 1003.
12.5.4 Select the gray-level threshold settings to permitindependent detection of sulfides and oxides (see 10.2.2).
12.5.5 When detecting sulfides, a false image (called thehalo effect) may be detected around the periphery of oxides inthe same field. This problem can be corrected by the use of anauto-delineation feature or by application of appropriate algo-rithms to the binary image. Choice of the most satisfactoryapproach depends upon the image analysis system used.
12.5.6 Set the stage controls to move the specimen in asquare or rectangular pattern with contiguous field alignmentso that a minimum of 160 mm2 is examined and evaluated.Other measurement areas may be used based on producer-purchaser agreements.
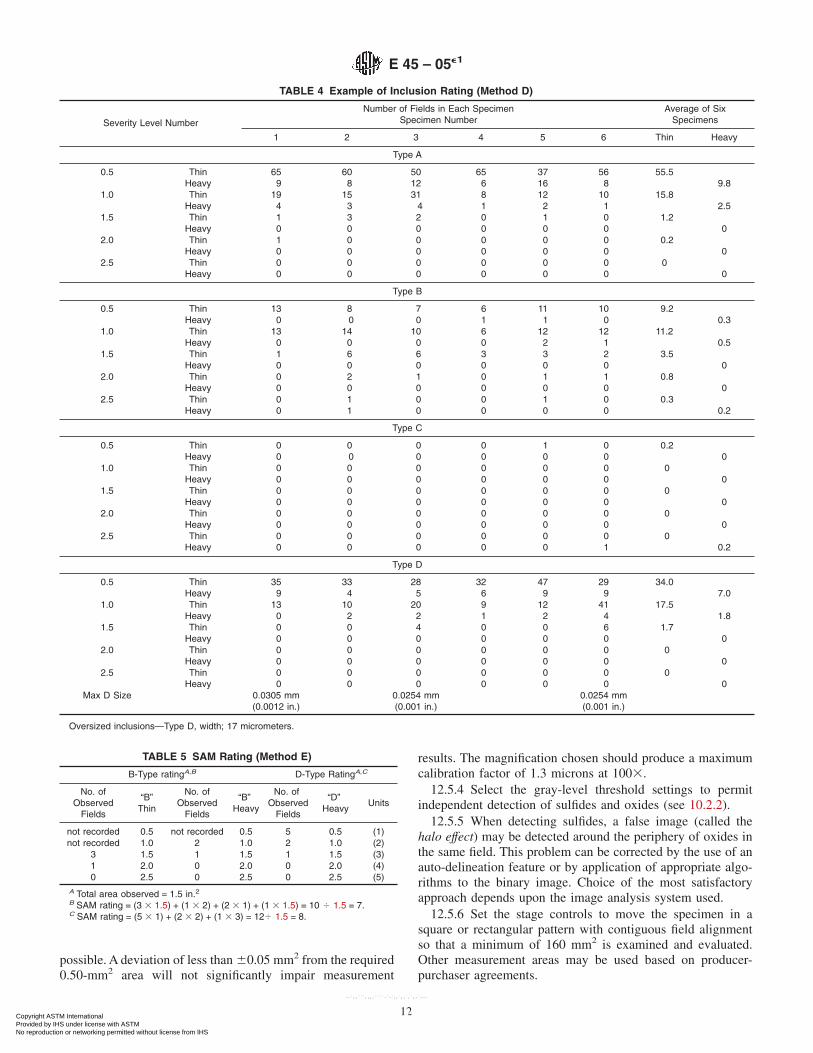
TABLE 4 Example of Inclusion Rating (Method D)
Severity Level Number
Number of Fields in Each SpecimenSpecimen Number
Average of SixSpecimens
1 2 3 4 5 6 Thin Heavy
Type A
0.5 ThinHeavy
659
608
5012
656
3716
568
55.59.8
1.0 ThinHeavy
194
153
314
81
122
101
15.82.5
1.5 ThinHeavy
10
30
20
00
10
00
1.20
2.0 ThinHeavy
10
00
00
00
00
00
0.20
2.5 ThinHeavy
00
00
00
00
00
00
00
Type B
0.5 ThinHeavy
130
80
70
61
111
100
9.20.3
1.0 ThinHeavy
130
140
100
60
122
121
11.20.5
1.5 ThinHeavy
10
60
60
30
30
20
3.50
2.0 ThinHeavy
00
20
10
00
10
10
0.80
2.5 ThinHeavy
00
11
00
00
10
00
0.30.2
Type C
0.5 ThinHeavy
00
00
00
00
10
00
0.20
1.0 ThinHeavy
00
00
00
00
00
00
00
1.5 ThinHeavy
00
00
00
00
00
00
00
2.0 ThinHeavy
00
00
00
00
00
00
00
2.5 ThinHeavy
00
00
00
00
00
01
00.2
Type D
0.5 ThinHeavy
359
334
285
326
479
299
34.07.0
1.0 ThinHeavy
130
102
202
91
122
414
17.51.8
1.5 ThinHeavy
00
00
40
00
00
60
1.70
2.0 ThinHeavy
00
00
00
00
00
00
00
2.5 ThinHeavy
00
00
00
00
00
00
00
Max D Size 0.0305 mm(0.0012 in.)
0.0254 mm(0.001 in.)
0.0254 mm(0.001 in.)
Oversized inclusions—Type D, width; 17 micrometers.
TABLE 5 SAM Rating (Method E)
B-Type ratingA,B D-Type RatingA,C
No. ofObserved
Fields
“B”Thin
No. ofObserved
Fields
“B”Heavy
No. ofObserved
Fields
“D”Heavy
Units
not recorded 0.5 not recorded 0.5 5 0.5 (1)not recorded 1.0 2 1.0 2 1.0 (2)
3 1.5 1 1.5 1 1.5 (3)1 2.0 0 2.0 0 2.0 (4)0 2.5 0 2.5 0 2.5 (5)
A Total area observed = 1.5 in.2B SAM rating = (3 3 1.5) + (1 3 2) + (2 3 1) + (1 3 1.5) = 10 4 1.5 = 7.C SAM rating = (5 3 1) + (2 3 2) + (1 3 3) = 124 1.5 = 8.
E 45 – 05e1
12Copyright ASTM International Provided by IHS under license with ASTM
Not for ResaleNo reproduction or networking permitted without license from IHS
--`,,```,,,,````-`-`,,`,,`,`,,`---

12.5.7 Use a previously written computer program to sepa-rate the inclusion images by type and thickness, then calculateseverities by length or number based on the rules listed inSection 12. The program should also store results, control stagemovements (if an automated stage is used), and generate thetest report.
12.5.8 If the width of an A inclusion, or a B or C stringer,varies and becomes less than 2 µm over part of its length,detect as much of it as possible and calculate the severity basedon the detected length. For specimens from wrought productswith high degrees of reduction, where the majority of theinclusions are < 2 µm thick, based on producer-purchaseragreement, the minimum thickness of the thin series can be setat a lower value, such as 0.5 µm, or the lower limit can bedropped. Detection of these thinner inclusions will require useof a higher magnification with a resultant field size less than0.50 mm2; hence, field data must be combined, as described in12.5.3, to obtain valid ratings.
12.5.9 An array is established in the computer memory totabulate the number of fields that were rated according to theThin and Heavy limits of the four inclusion types for elevenpossible severities from 0 to 5 in half-level increments. Aftereach field is rated and the severities are computed, theappropriate array locations are incremented to store the results.
12.5.10 The use of randomly selected, contiguously alignedfields may not produce true worst field (Method A) ratings.Valid worst field ratings require advanced image analysistechnology, for example, use of a 0.50-mm2 mask that can bemoved anywhere within the 160-mm2 test area using analgorithm that controls the mask movement by maximizing theseverity values.
12.5.11 For quantitative inclusion descriptions, blank fields(that is, those that contain no visible inclusions of a particulartype and width) may be differentiated from non-ratable fields(that is, fields with inclusions # 2 µm in width, or withinclusion lengths or stringer lengths below the minimum limitfor 0.5 severity).
12.5.12 The program should incorporate procedures to dealwith fields that contain artifacts, either from polishing orcleaning, or from dust settling on the specimen, and so forth.The alignment of Type A, B, and C inclusions in wroughtspecimens generally will not deviate by more than 620° fromthe longitudinal direction. Depending on the system and thenature of the artifact, it may be possible to develop analgorithm that will recognize such artifacts and remove themfrom the binary image. By restricting the orientation ofdetected features within this limit, certain artifacts (for ex-ample, deep scratches not removed during polishing) can berecognized and deleted from the binary image, if their orien-tation is greater than this limit. If this cannot be done, the fieldshould be rejectable, that is, no test results from the field should
TABLE 6 Regression Equations for Severity Rating Calculations(Based on the Four Alternate Ways of Expressing A, B, or C
Lengths or Two Ways to Express D Counts in Table 2)
1. Length in in. at 1003 or count per field
A Log(Sev.) = [0.560522Log(A)] + 0.168870B Log(Sev.) = [0.462631Log(B)] + 0.241092C Log(Sev.) = [0.480736Log(C)] + 0.252106D Log(Sev.) = [0.5Log(D)] - 0.30102
2. Length in mm at 1003 or count per field
A Log(Sev.) = [0.561739Log(A)] − 0.62003B Log(Sev.) = [0.463336Log(B)] − 0.41017C Log(Sev.) = [0.479731Log(C)] − 0.42132D Log(Sev.) = [0.5Log(D)] − 0.30102
3. Length in µm at 13 or count per field
A Log(Sev.) = [0.561739Log(A)] − 1.18177B Log(Sev.) = [0.463336Log(B)] − 0.8735C Log(Sev.) = [0.479731Log(C)] − 0.90105D Log(Sev.) = [0.5Log(D)] − 0.30102
4. Length per unit area (mm/mm2) or count per unit area (no./mm2)
A Log(Sev.) = [0.561739Log(A)] − 0.33434B Log(Sev.) = [0.463336Log(B)] − 0.377021C Log(Sev.) = [0.479731Log(C)] − 0.393723D Log(Sev.) = [0.5Log(D)] − 0.45154
NOTE 1—Choose the equations to calculate the inclusion severity (boththin and heavy series) based on the nature of the measurement used; allapproaches give the same severity values.
NOTE 2—Round off the severity number downward to the nearesthalf-severity level (or, if desired, to the nearest one-quarter or one-tenthvalue). For D-type inclusions, because we have only whole integer counts,and 0.5 is the severity for one inclusion in a field (a field has an area of0.5 mm2), there cannot be a D severity of 0.25 or any one-tenth valuebelow 0.5, except for 0 if there are no ratable Ds present.
NOTE 3—To determine the severity value using the above equations,take the Log (base 10) of the measured value, multiply by the indicatedvalue, subtract or add the indicated value, then take the antilog and rounddownward as described above.
FIG. 13 Relationship between Severity Rating and the MinimumNumber of Globular D-Type Inclusions for Plate I-r and Table 1
E 45 – 05e1
13Copyright ASTM International Provided by IHS under license with ASTM
Not for ResaleNo reproduction or networking permitted without license from IHS
--`,,```,,,,````-`-`,,`,,`,`,,`---
be stored. In such a case, another field should be analyzed toreplace the rejected field, if this is possible. If a rejected fieldcannot be replaced in the same run, it may be possible toevaluate and rate the additional fields required in a subsequentrun (do not rate fields already rated). Good preparationpractices will minimize the need to reject fields with artifacts.In no case should the test results for a measurement area lessthan 160 mm2 be mathematically extrapolated or converted(for example, because of rejected fields) in an effort to producedata for a 160-mm2 area.
12.6 Image Anlysis Expression of Results:12.6.1 The number of fields of each inclusion type (A, B, C,
and D) and thickness (thin and thick) are reported for eachseverity from 0 to 5 in whole or half-severity level increments.For steels with very low inclusion contents, severities may becomputed to one-quarter or one-tenth severity level incre-ments. Note that for D-type inclusions, because one inclusionper field is a severity of 0.5, by definition, there can be noD-severity levels between 0 and 0.5.
12.6.2 If desired, based on producer-purchaser agreements,modifications of the reported data may be made, for example,reports for only certain inclusion types, thicknesses, or severityvalues. Other modifications may include only worst-fieldseverity ratings or the number of fields at the worst-fieldseverity ratings.
12.6.3 If desired by producer-purchaser agreement, an indexmay be calculated to describe the inclusion content.
12.6.4 To produce average results for more than one speci-men per lot, the average number of fields for each severityrating, inclusion type, and thickness may be calculated (seeTable 4).
12.6.5 Data for inclusions or stringers that are oversized ineither length or width, or both, should be reported separately.Report the inclusion type, measured width, and length (forTypes A, B, and C).
12.6.6 Fields with zero severity levels may be furtherclassified, if desired, as either blank (no inclusions of aparticular type and width category are present) or non-ratable(inclusions are present but their length is below the 0.5 severitylimit or their width is < 2 µm), or their diameter is < 3 µm.
12.6.7 Information pertaining to the composition of theinclusions (Types A to D) may be provided if desired. For rareearth- or calcium-treated steels, or other steels with nontradi-tional deoxidation approaches, the chemical composition of theinclusions, in general terms, must be reported with each rating.Microanalytical techniques may be required to obtain suchinformation if the operator is not able to identify the inclusionsby light optical examination.
12.6.8 Supplementary stereological data determined duringanalysis may be included in the test report as desired. Stan-dardization of such test data is not governed by this practice(see Practice E 1245).
13. Method B (Length)
13.1 Introduction—This test method requires a survey of a160 mm2 polished surface area of the specimen at 1003. Anyinclusion whose length is 0.127 mm or longer is to bemeasured and individually tallied.
13.2 Procedure:
13.2.1 This method utilizes a pattern of parallel lines whosespacing is such that the distance between lines is equivalent to0.127 mm (0.005 in.) on the specimen surface when viewed at1003. This distance shall be referred to as one unit. Thepattern may be drawn on (or taped to) a viewing screen, inwhich case the physical distance between lines would be 12.7mm (0.5 in.) since the specimen is magnified 100 times. Analternate technique would be to have a reticle made that willsuperimpose the required pattern directly onto the image asseen through the eyepieces of the microscope. Fig. 7 shows arecommended measurement grid for use with Method B. Notethat the parallel lines are contained in a mask to aid in theindexing of fields.
13.2.2 To begin, outline the required test area on thespecimen surface using either an indelible marker or a carbide-tipped scribe. Place the specimen on the microscope and startthe examination with a field in one of the corners of the markedtest area. Measure and record all inclusions in this field that areone unit long or longer. Inclusions separated by a distancegreater than one unit shall be classified as two inclusions andnot be considered as one stringer. The length of an inclusionshall be rounded down to the next whole unit and only wholeunits will be recorded. For example, if an inclusion measures21⁄2 units, it shall be recorded as a “2.” If an inclusion liespartially outside of the field, that is, part of its length lies inwhat will become Field Number 2, move the field slightly inorder that its entire length may be measured.
13.2.3 Move the microscope stage to view an adjacent field.Repeat the measurement procedure. Take care that any inclu-sion measured in the previous field is not remeasured. Continuethis process until the required polished surface area of thespecimen has been scanned. A typical scan configuration isshown in Fig. 6.
13.3 Expression of Results:13.3.1 The determination for each specimen shall be di-
vided into two parts, as follows:13.3.1.1 The length of the longest inclusion shall be re-
corded first. It shall be supplemented to describe the inclusionwidth by a superscript T for thin or H for heavy. A thininclusion is defined as being 10 µm (0.0004 in.) or less in widthover more than 50 % of its entire length. Likewise, a heavyinclusion must have a thickness of 30 µm (0.012 in.) or moreover the majority of its length. Inclusions greater than 10 µmbut less than 30 µm wide shall not be represented by a T or Hsuperscript. Supercripts d (disconnected), vd (very discon-nected), and g (grouped) may also be used to describe thedegree of connectivity or clustering as illustrated in Fig. 8.
13.3.1.2 The average length of all inclusions one unit andlonger in length, but excluding the longest inclusion, shall bereported as a single number, followed by a superscript denotingthe number of inclusions averaged.
13.3.2 When required, a series of comparison photomicro-graphs at 1003, which illustrates all other nonmetallic par-ticles present, may be used to characterize the backgroundappearance of the specimen. If used, these shall be labeled A,B, ... etc., in order of increasing inclusion population. The
E 45 – 05e1
14Copyright ASTM International Provided by IHS under license with ASTM
Not for ResaleNo reproduction or networking permitted without license from IHS
--`,,```,,,,````-`-`,,`,,`,`,,`---
specific photomicrographs used shall be mutually agreed uponbetween the interested parties.13
13.3.3 The following is an expression of results for a singlespecimen by this method: 6d-23-A. This indicates that thelongest inclusion observed was six units long, that three otherinclusions were observed whose average length was two units,and that the background inclusions were similar in appearanceto the A figure from a background photomicrographic series.
13.3.4 The results for all specimens from a lot shall betabulated. If required, the predominant type of inclusions(sulfides, silicates, or oxides) shall be recorded.
14. Method C (Oxides and Silicates)14
14.1 Introduction—This method requires a survey of a 160mm2 polished surface area of the specimen at 1003. Each fieldon the specimen shall be examined for the presence ofnon-deformable alumina oxide and deformable silicate string-ers and rated by comparison to Plate II. The longest stringer ofeach inclusion type (“O” for alumina oxides and “S” forsilicates) shall be reported, per the designations of Plate II, forevery specimen examined. Note that sulfides are not rated bythis method.
14.2 Procedure:14.2.1 This method utilizes a rectangular mask that will
present a field area of 0.83 mm2 (0.001289 in.2) on thespecimen surface. The rectangular mask shall have sides equalto 0.79 3 1.05 mm (0.03125 3 0.04125 in.) on the specimensurface (see Fig. 9).
14.2.2 Either of two techniques may be used to mask off afield of the required size. One method is to project the 1003
image from the microscope to a viewing screen equipped witha rectangular mask having sides 79.0 3 105.0 mm. Anotheroption is to have a reticle made for the microscope, which willsuperimpose the required rectangular mask directly onto thefield of view.
14.2.3 To begin, outline the required test area on thespecimen surface using either an indelible marker or a carbide-tipped scribe. Place the specimen on the microscope and startthe examination with a field in one of the corners of the markedtest area. The longer side of the rectangular mask shall beparallel to the rolling direction. Compare this field with theimages on Plate II and record the number of the frame thatmost resembles the oxide or silicate stringers, or both, present.It is important to note that if an inclusion’s size falls betweentwo of the numbered frames on Plate II, it shall be roundeddown to the lower whole number. Also, stringered inclusionsshall be classified as two distinct inclusions when they areseparated by at least 40 µm (0.0016 in.) on the specimensurface or offset by more than 15 µm.
14.2.4 Move the microscope stage to reveal an adjacent fieldand repeat the comparison procedure with Plate II. Continuethis process until the required polished surface area of thespecimen has been scanned. A typical scan configuration is
shown in Fig. 6. It is permissible, and will be necessary attimes, to adjust the microscope stage such that the entirestringer may be viewed within the mask. The rater’s objectiveis to find the longest oxide and silicate stringers in thespecimen. Therefore, in practice, the rater is actually scanningthe specimen and stopping only when a potential longeststringer is in view.
14.3 Expression of Results:14.3.1 The maximum length of each type of inclusion,
usually a series of individual particles in a stringer, is generallyused to evaluate a specimen. The silicate photomicrographs areused for deformable-oxide inclusions, and the oxide photomi-crographs for all non-deformable oxide, or hard-type, inclu-sions. For example, a specimen may be classified 0-5 (oxide)and S-4 (silicate) to indicate that the longest non-deformableoxide inclusion seen was comparable to Oxide Photomicro-graph 5, and the longest deformable-oxide inclusion seen wascomparable to Silicate Photomicrograph 4.
14.3.2 Modifications, such as suffix numerals, may be usedto indicate the number of long inclusions noted or the exactlength of a particular inclusion when it is over the maximumlength indicated by the photomicrographs.
15. Method D (Low Inclusion Content)
15.1 Manual Introduction—This test method is intended forapplication to steel with low inclusion contents, as the severitylevels shall be reported in 1⁄2 increments. It requires a survey ofa 160 mm2 polished surface area of the specimen at 1003.Every square 0.50 mm2 (0.000779 in.2) field on the polishedsurface is examined for inclusion Types A, B, C, and D andcompared with the square fields depicted on Plate I-r. Theresult of this every field comparison is recorded and tallied.
15.2 Manual Procedure:15.2.1 A field shall be defined as a square with 0.71 mm
(0.02791 in.) long sides. See Fig. 5. This will result in a fieldarea of 0.50 mm2 on the specimen. Either of two techniquesmay be employed to achieve the square field. One method is toproject the 1003 microscope image onto a viewing screen thathas a square mask (with 71.0 mm sides) drawn on it. Anotheroption is to have a reticle made for the microscope, which willsuperimpose the required square mask directly onto the field ofview (see Fig. 5).
15.2.2 To begin, outline the required test area on thespecimen surface using either an indelible marker or a carbide-tipped scribe. Place the specimen on the microscope and startthe examination with a field in one of the corners of thespecimen. Compare this field with the images on Plate I-r.Classify the inclusion content of the field based on the ruleslisted in Section 12 concerning Type, and thickness of inclu-sions present. Record the Severity Level Number for eachinclusion type (A, B, C, and D) that most resembles the fieldunder observation. Do this for both the Thin and Heavy series.It is important to note that if a field of inclusions falls betweentwo severity levels it is rounded down to the nearest severitylevel. Therefore, a field that contains fewer inclusions, or lessinclusion length, than severity level 1⁄2 is recorded as a 0.
15.2.3 Move the microscope stage to reveal an adjacent fieldand repeat the comparison procedure with Plate I-r. The fields
13 A series of four photomicrographs of low carbon steel, previously printed aspart of Practice E 45, may be obtained from ASTM Headquarters. OrderADJE004501.
14 This method is similar to SAE Recommended Practice J422.
E 45 – 05e1
15Copyright ASTM International Provided by IHS under license with ASTM
Not for ResaleNo reproduction or networking permitted without license from IHS
--`,,```,,,,````-`-`,,`,,`,`,,`---

shall be contiguous and only inclusions or portions of inclu-sions that fall within the square mask shall be considered. It isnot acceptable practice to move an inclusion into the squarefield simply to prevent its intersection with the sides of themask. Continue this process until the required polished surfacearea of the specimen has been rated. A typical scan configura-tion is shown in Fig. 6.
15.2.4 In contrast with Method A, this is an every fieldrating method. The arbitrary field boundaries created bystepwise movement through the sample should not be alteredor adjusted. Record the severity level shown on the side ofPlate I-r selected for each inclusion type (A, B, C, or D) thatappears most like the field under observation for both the thinand heavy series. Report each field containing inclusionsequivalent to or greater than the 0.5 severity level. See Table 1for values of Severity Level Numbers > 3.0.
15.3 Manual Expression of Results:15.3.1 The number of fields of each inclusion type (A, B, C,
and D of Plate I-r) found for both the thin and heavy seriesshall be recorded for each specimen in terms of the SeverityLevel Numbers 0.5 to 3.0.
15.3.2 If any field or inclusion is found that exceeds thelimits of severity level 3.0 (displayed on Plate I-r and listed inTable 1), it shall be recorded separately. Likewise oversizeinclusions with widths or diameters greater than the limitingvalues shown on Plate I-r (and Table 2) shall be recordedseparately.
15.3.3 To average the results of more than one specimen,the average of the number of fields found for each inclusionrating number and type in the various specimens examinedwithin a lot may be calculated as illustrated in Table 4.
15.3.4 If desired, the predominant chemical type of inclu-sions may be determined (using, for example, energy disper-sive x-ray spectroscopy on a scanning electron microscope).
15.4 Image Analysis Introduction—The inclusions on thesurface of a properly prepared as-polished metallographicspecimen are viewed with a high-quality, metallurgical micro-scope. The bright-field image is picked up by a suitabletelevision camera and transferred to the image analyzer screen.Image analysis software is then used to evaluate the inclusioncontent of the material.
15.5 Image Analysis Procedure:15.5.1 Place the specimen on the microscope stage so that
the specimen surface is perpendicular to the optical axis. Withan inverted-type microscope, simply place the specimen face-down on the stage plate and hold in place with the stageclamps. With an upright-type microscope, place the sample ona slide and level the surface using clay or plasticene and ahand-leveling press. Certain upright microscopes can beequipped with an autoleveling stage for mounted specimens. Ifthe sample must be leveled using clay, the tissue paper placedbetween the specimen surface and the leveling press ram mayadhere to the surface and present artifacts for measurement. Insome cases, adherent tissue can be blown off the specimensurface. An alternative procedure to avoid this problem is toplace an aluminum or stainless steel ring form, which has beenflattened slightly in a vise to an oval shape, between the sampleand the ram. If the specimen was mounted, the ring form will
rest only on the surface of the mounting material. If thespecimen is unmounted but with a surface area substantiallygreater than the 160-mm2 area required for the measurement,the ring form can rest on the outer edges of the specimen forflattening and thus avoid contact with the measurement area.Align the specimen on the stage so that the inclusions arealigned parallel to the x-direction of the stage movement, thatis, horizontal on the monitor screen. Alternatively, if program-ming is facilitated, align the inclusions parallel to they-direction of the stage movement, that is, the longitudinaldirection is vertical on the monitor screen.
15.5.2 Check the microscope light source for correct align-ment and adjust the illumination to the level required by thetelevision video camera.
15.5.3 The inclusions can be examined and discriminatedby type using magnifications other than 1003 and field areasother than 0.50 mm2 as long as the severity measurements arebased upon the required 0.50-mm2 field area, if the imageanalyzer is capable of such a procedure.15 If the system cannotwork in this manner, that is, if the inclusions in each field mustbe discriminated by type, measured, and a severity levelassigned on a field-by-field basis, then the magnification mustbe chosen so that the field area is as close to 0.50 mm2 aspossible. A deviation of less than 60.05 mm2 from the required0.50-mm2 area will not significantly impair measurementresults. The magnification chosen should produce a maximumcalibration factor of 1.3 microns at 1003.
15.5.4 Select the gray-level threshold settings to permitindependent detection of sulfides and oxides (see 10.2.2).
15.5.5 When detecting sulfides, a false image (called thehalo effect) may be detected around the periphery of oxides inthe same field. This problem can be corrected by the use of anauto-delineation feature or by application of appropriate algo-rithms to the binary image. Choice of the most satisfactoryapproach depends upon the image analysis system used.
15.5.6 Set the stage controls to move the specimen in asquare or rectangular pattern with contiguous field alignmentso that a minimum area of 160 mm2 is examined and evaluated.Other measurement areas may be used based on producer-purchaser agreements.
15.5.7 Use a previously written computer program to sepa-rate the inclusion images by type and thickness, then calculateseverities based on length or number based on the rules listedin Section 12. The program should also store results, controlstage movements (if an automated stage is used), and generatethe test report.
15.5.8 If the width of an A inclusion, or a B or C stringer,varies and becomes less than 2 µm over part of its length,detect as much of it as possible and calculate the severity basedon the detected length. For specimens from wrought productswith high degrees of reduction, where the majority of theinclusions are < 2 µm thick, based on producer-purchaseragreement, the minimum thickness of the thin series can be set
15 Forget, C., “Improved Method for E1122 Image Analysis NonmetallicInclusion Ratings,” MiCon 90: Advances in Video Technology for MicrostructuralControl, ASTM STP 1094, American Society for Testing and Materials, Philadelphia,1991, pp. 135–150.
E 45 – 05e1
16Copyright ASTM International Provided by IHS under license with ASTM
Not for ResaleNo reproduction or networking permitted without license from IHS
--`,,```,,,,````-`-`,,`,,`,`,,`---
at a lower value, such as 0.5 µm, or the lower limit can bedropped. Detection of these thinner inclusions will require useof a higher magnification with a resultant field size less than0.50 mm2; hence, field data must be combined, as described in15.5.3, to obtain valid ratings.
15.5.9 An array is established in the computer memory totabulate the number of fields that were rated according to theThin and Heavy limits of the four inclusion types for elevenpossible severities from 0 to 5 in half-level increments. Aftereach field is rated and the severities are computed, theappropriate array locations are incremented to store the results.
15.5.10 The use of randomly selected, contiguously alignedfields may not produce true worst field (Method A) ratings.Valid worst field ratings require advanced image analysistechnology, for example, use of a 0.50-mm2 mask that can bemoved anywhere within the 160-mm2 test area using analgorithm that controls the mask movement by maximizing theseverity values.
15.5.11 For quantitative inclusion descriptions, blank fields(that is, those that contain no visible inclusions of a particulartype and width) may be differentiated from non-ratable fields(that is, fields with inclusions # 2 µm in width, or withinclusion lengths or stringer lengths below the minimum limitfor 0.5 severity).
15.5.12 The program should incorporate procedures to dealwith fields that contain artifacts, either from polishing orcleaning, or from dust settling on the specimen, and so forth.The alignment of Type A, B, and C inclusions in wroughtspecimens generally will not deviate by more than 620° fromthe longitudinal direction. Depending on the system and thenature of the artifact, it may be possible to develop analgorithm that will recognize such artifacts and remove themfrom the binary image. By restricting the orientation ofdetected features within this limit, certain artifacts (for ex-ample, deep scratches not removed during polishing) can berecognized and deleted from the binary image, if their orien-tation is greater than this limit. If this cannot be done, the fieldshould be rejectable, that is, no test results from the field shouldbe stored. In such a case, another field should be analyzed toreplace the rejected field, if this is possible. If a rejected fieldcannot be replaced in the same run, it may be possible toevaluate and rate the additional fields required in a subsequentrun (do not rate fields already rated). Good preparationpractices will minimize the need to reject fields with artifacts.In no case should the test results for a measurement area lessthan 160 mm2 be mathematically extrapolated or converted(for example, because of rejected fields) in an effort to producedata for a 160-mm2 area.
15.6 Image Anlysis Expression of Results:15.6.1 The number of fields of each inclusion type (A, B, C,
and D) and thickness (thin and thick) are reported for eachseverity from 0 to 5 in whole or half-severity level increments.For steels with very low inclusion contents, severities may becomputed to one-quarter or one-tenth severity level incre-ments. Note that for D-type inclusions, because one inclusionper field is a severity of 0.5, by definition, there can be noD-severity levels between 0 and 0.5.
15.6.2 If desired, based on producer-purchaser agreements,modifications of the reported data may be made, for example,reports for only certain inclusion types, thicknesses, or severityvalues. Other modifications may include only worst-fieldseverity ratings or the number of fields at the worst-fieldseverity ratings.
15.6.3 If desired by producer-purchaser agreement, an indexmay be calculated to describe the inclusion content.
15.6.4 To produce average results for more than one speci-men per lot, the average number of fields for each severityrating, inclusion type, and thickness may be calculated (seeTable 4).
15.6.5 Data for inclusions or stringers that are oversized ineither length or width, or both, should be reported separately.Report the inclusion type, measured width, and length (forTypes A, B, and C).
15.6.6 Fields with zero severity levels may be furtherclassified, if desired, as either blank (no inclusions of aparticular type and width category are present) or non-ratable(inclusions are present but their length is below the 0.5 severitylimit or their width is < 2 µm), or their diameter is < 3 µm.
15.6.7 7 Information pertaining to the composition of theinclusions (Types A to D) may be provided if desired. For rareearth- or calcium-treated steels, or other steels with nontradi-tional deoxidation approaches, the chemical composition of theinclusions, in general terms, must be reported with each rating.Microanalytical techniques may be required to obtain suchinformation if the operator is not able to identify the inclusionsby light optical examination.
15.6.8 Supplementary stereological data determined duringanalysis may be included in the test report as desired. Stan-dardization of such test data is not governed by this practice(see Practice E 1245).
16. Method E (SAM Rating)
16.1 Introduction—This test method is used to rate theinclusion content of steels in a manner that reflects the severityand frequency of occurrence of the larger B- and D-Typeinclusions. It will result in a survey of a 160 mm2 polishedsurface of the specimen at 1003.
16.2 Procedure:16.2.1 A field shall be defined as a square with 0.71 mm
(0.02791 in.) long sides. See Fig. 5. This will result in a fieldarea of 0.50 mm2 on the specimen. Either of two techniquesmay be employed to achieve the square field. One method is toproject the 1003 microscope image onto a viewing screen thathas a square mask (with 71.0 mm sides) drawn on it. Anotheroption is to have a reticle made for the microscope, which willsuperimpose the required square mask directly onto the field ofview.
16.2.2 To begin, outline the required test area on thespecimen surface using either an indelible marker or a carbide-tipped scribe. Place the specimen on the microscope and startthe examination with a field in one of the corners of the markedtest area. Compare this field with the images on Plate I-r. Rateonly the B and D type inclusions using the following criteria.
16.2.3 A rating of B-type inclusions is obtained by compar-ing each field of the specimen with the fields in Plate I-r (Table1 may also be used). Record all B-Thin fields observed at
E 45 – 05e1
17Copyright ASTM International Provided by IHS under license with ASTM
Not for ResaleNo reproduction or networking permitted without license from IHS
--`,,```,,,,````-`-`,,`,,`,`,,`---
severity levels of 1.5 or higher and all B-Heavy fields observedat each severity level of 1.0 or higher. See Table 2 for widthand diameter parameters. Classify a field with size of inclu-sions intermediate between configurations in Plate I-r or Table1 as the lower inclusion rating. An inclusion whose widthvaries from Thin to Heavy along its length shall be placed inthe category that best represents its whole.
16.2.4 Classify broken B-types as two distinct inclusionswhen they are separated by at least 40 µm (0.0016 in.) or offsetby more than 15 µm on the specimen surface. If two or moreB-types appear in one microscope field, their summed lengthdetermines the inclusion rating number.
16.2.5 When an A-type sulfide has formed a complexinclusion with either a B- or D-type oxide, the inclusion shallbe rated as a B- or D-type provided its oxide volume is thepredominant (>50 % by area) chemical type.
16.2.6 A rating of D-type inclusions is obtained by record-ing all D-Heavy fields with a rating of 0.5 or higher. See Table2 for width and diameter parameters. Fields of 0.5 severity arecounted as one unit; fields of 1.0 severity as two units; fields of1.5 severity as three units; and so on. The minimum inclusionnumbers for D-type are printed on Plate I-r and listed in Table1.
16.2.7 Move the microscope stage to reveal an adjacent fieldand repeat the comparison procedure with Plate I-r. Thismethod requires adjustment of the microscope stage in order tomaximize the inclusion Severity Level Number. That is, thefield of view is adjusted using the microscope stage controlssuch that inclusions are moved inside the square mask in orderto determine the maximum severity of rateable B- andD-Types. Continue this process, being careful not to rate anyinclusion more than once, until the required polished surfacearea of the specimen has been rated. A typical scan configura-tion is shown in Fig. 6.
16.2.8 If any inclusions are present that are longer than thefields shown in Plate I-r, their lengths shall be recordedseparately. If their widths or diameters are greater than thelimiting values shown in Plate I-r and Table 2, they shall berecorded separately. Note that an oversize B or D inclusion stillcontributes to the determination of a field’s Severity LevelNumber. Therefore, if a B inclusion is oversized either inlength or thickness, that portion that is within the fieldboundaries shall be included in the appropriate Thin or Heavyseverity level measurement. Likewise, if an oversize D inclu-sion is encountered in a field, it also is included in the countthat determines the D heavy rating.
16.3 Expression of Results:16.3.1 Results are expressed in terms of two rating numbers
reflecting B-type and D-heavy type inclusion contents.16.3.2 The number of B-type fields recorded at each sever-
ity level times the severity level is summed (see Table 5) andnormalized by dividing by the total rated area, in square inches,of all samples. The nearest whole number is recorded as therating.
16.3.3 The number of D units is summed (see Table 5) andnormalized by dividing by the total rated area, in square inches,of all samples. The nearest whole number is recorded as therating.
16.3.4 All oversized B- and D-Type inclusions are reportedalong with their actual lengths or widths, or both.
17. Test Report
17.1 Pertinent information regarding the origin and identityof the test specimen should be reported along with the datarequirements covered in the “Expression of Results” section ofeach test method.
17.2 Report, also, the following information:17.2.1 Date of test,17.2.2 Rater’s name,17.2.3 Plant location,17.2.4 Heat number; and17.2.5 Specimen identification code and any other unique
data (such as a lot number) that can provide traceability withinthe seller’s organization.
18. Precision and Bias
18.1 Studies of JK ratings made by different laboratorieshave shown that there is an inherent problem in inclusionidentification, chiefly in discrimination between Type A (sul-fides) and C (silicate) deformable oxide inclusions. Hence, theaccuracy of JK ratings can be severely influenced by suchproblems. The accuracy of Method A, C, and D ratings isinfluenced by total inclusion contents. As the inclusion contentincreases, the accuracy of such ratings decreases.
18.2 For steels that are rated to 0.5 Severity Level Numberson Plate I-r, worst field ratings are generally accurate within61 severity number and may be within 60.5 severity at lowinclusion content. In general, the accuracies of rating of TypeB and D inclusions are better than for Type A and C inclusions.Also, the accuracy of the thin series is generally better than forthe Heavy series, regardless of the inclusion type.
18.3 For steels that must be rated to whole Severity LevelNumbers using Plate I-r, the accuracies are generally poorer,approaching 62 at the highest severity levels. The same trendsapply here regarding A and C versus B and D Types and Thinversus Heavy. Greater inaccuracies will occur if inclusions aremisidentified. The accuracy of inclusion field counts usingMethod D is not as good as for the worst field ratings. A good,accurate Method D rating requires considerable effort.
18.4 The accuracy of Method C ratings is significantlyinfluenced by misidentification of S Type (deformable oxide)inclusions. When such problems are not encountered, steelswith low inclusion contents will agree within 61 unit, whilesteels with high inclusion contents will agree within 62 unitsof severity. Method C, Plate II, is only used to rate oxides,never sulfides.
18.5 The precision of ratings made by the use of Plate I-rgenerally agrees with the chart severity increments used butmay in certain cases be slightly higher. For very low inclusioncontent steels, automatic image analysis methods (as coveredby Practices E 1122 and E 1245) are preferable where ratingsbelow the minimum rating (1⁄2) are possible. Note that micro-scopic Methods A and D stipulate minimum sizes for ratableinclusions; thus a field or a specimen may contain inclusionsthat are identifiable but not ratable because they are below theminimum size for a non-zero rating.
E 45 – 05e1
18Copyright ASTM International Provided by IHS under license with ASTM
Not for ResaleNo reproduction or networking permitted without license from IHS
--`,,```,,,,````-`-`,,`,,`,`,,`---
18.6 For the image analysis procedures, when the samespecimen is reanalyzed immediately, starting over at the samelocation and re-measuring the same fields, reproducibility isextremely good. Worst-field ratings are usually identical, butmay occasionally show a variation of one-half severity limit forone of the eight possible ratings (A to D, thin and thick). Thenumber of fields at each severity level for each inclusion typeand thickness generally varies by less than 5 %.
18.6.1 If a rated specimen is re-polished and rated again ona parallel plane by the same laboratory, the results will bereasonably reproducible. Worst-field ratings will usually varyby no more than one-half severity level for several of theinclusion types and thickness categories but larger variationsare occasionally encountered due to the inherent variability ofthe inclusion content.
18.6.2 Interlaboratory test variability has not been evaluatedbut may be expected to be greater. This variability will be at aminimum if each laboratory controls specimen preparationaccording to the guidelines in Practice E 768.
18.6.3 Use of a manually operated stage, rather than anautomated stage, may introduce bias into the field selection.
19. Keywords
19.1 alumina; automatic image analysis; complex inclu-sions; fracture test; globular inclusions; inclusions; inclusionrating; inclusion stringers; JK inclusion rating; light micros-copy; macroetch test; magnetic-particle method; oxide; SAMrating; silicate; steel; step-down method; stringer; sulfide
ASTM International takes no position respecting the validity of any patent rights asserted in connection with any item mentionedin this standard. Users of this standard are expressly advised that determination of the validity of any such patent rights, and the riskof infringement of such rights, are entirely their own responsibility.
This standard is subject to revision at any time by the responsible technical committee and must be reviewed every five years andif not revised, either reapproved or withdrawn. Your comments are invited either for revision of this standard or for additional standardsand should be addressed to ASTM International Headquarters. Your comments will receive careful consideration at a meeting of theresponsible technical committee, which you may attend. If you feel that your comments have not received a fair hearing you shouldmake your views known to the ASTM Committee on Standards, at the address shown below.
This standard is copyrighted by ASTM International, 100 Barr Harbor Drive, PO Box C700, West Conshohocken, PA 19428-2959,United States. Individual reprints (single or multiple copies) of this standard may be obtained by contacting ASTM at the aboveaddress or at 610-832-9585 (phone), 610-832-9555 (fax), or [email protected] (e-mail); or through the ASTM website(www.astm.org).
E 45 – 05e1
19Copyright ASTM International Provided by IHS under license with ASTM
Not for ResaleNo reproduction or networking permitted without license from IHS
--`,,```,,,,````-`-`,,`,,`,`,,`---
Related Documents