Standard Costs and the Balanced Scorecard Chapter 10

Standard Costs and the Balanced Scorecard Chapter 10.
Dec 19, 2015
Welcome message from author
This document is posted to help you gain knowledge. Please leave a comment to let me know what you think about it! Share it to your friends and learn new things together.
Transcript

Standard Costs and the Balanced
Scorecard
Chapter 10

© The McGraw-Hill Companies, Inc., 2003McGraw-Hill/Irwin
Standard Costs
Standard Costs are
Predetermined.
Used for planning labor, materialand overhead requirements.
Benchmarks formeasuring performance.
Used to simplify theaccounting system.
© The McGraw-Hill Companies, Inc., 2003McGraw-Hill/Irwin
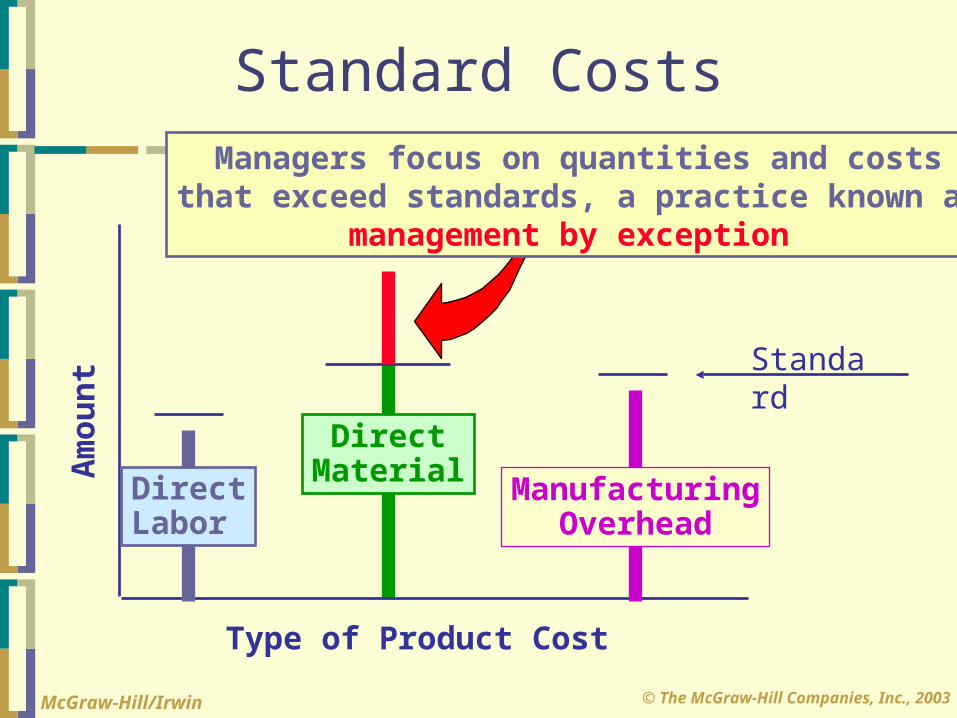
Standard Costs
DirectMaterial
Managers focus on quantities and coststhat exceed standards, a practice known as
management by exception.
Type of Product Cost
Am
ou
nt
DirectLabor
ManufacturingOverhead
Standard

© The McGraw-Hill Companies, Inc., 2003McGraw-Hill/Irwin
Accountants, engineers, personnel administrators, and production managers combine efforts to set standards
based on experience and expectations.
Setting Standard Costs

© The McGraw-Hill Companies, Inc., 2003McGraw-Hill/Irwin
Setting Standard Costs
Should we usepractical standardsor ideal standards?
Engineer ManagerialAccountant

© The McGraw-Hill Companies, Inc., 2003McGraw-Hill/Irwin
Setting Standard CostsPractical standards should be set at levels that are currently attainable with reasonable and
efficient effort.
Productionmanager
© The McGraw-Hill Companies, Inc., 2003McGraw-Hill/Irwin
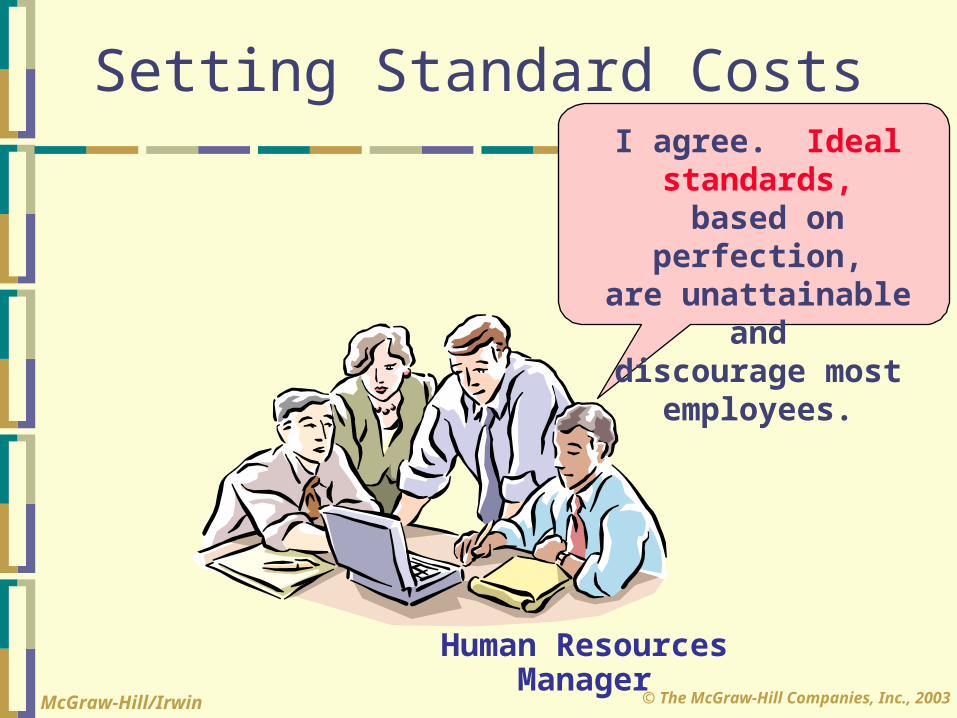
Setting Standard CostsI agree. Ideal standards,
based on perfection,are unattainable and
discourage mostemployees.
Human ResourcesManager
© The McGraw-Hill Companies, Inc., 2003McGraw-Hill/Irwin
Note
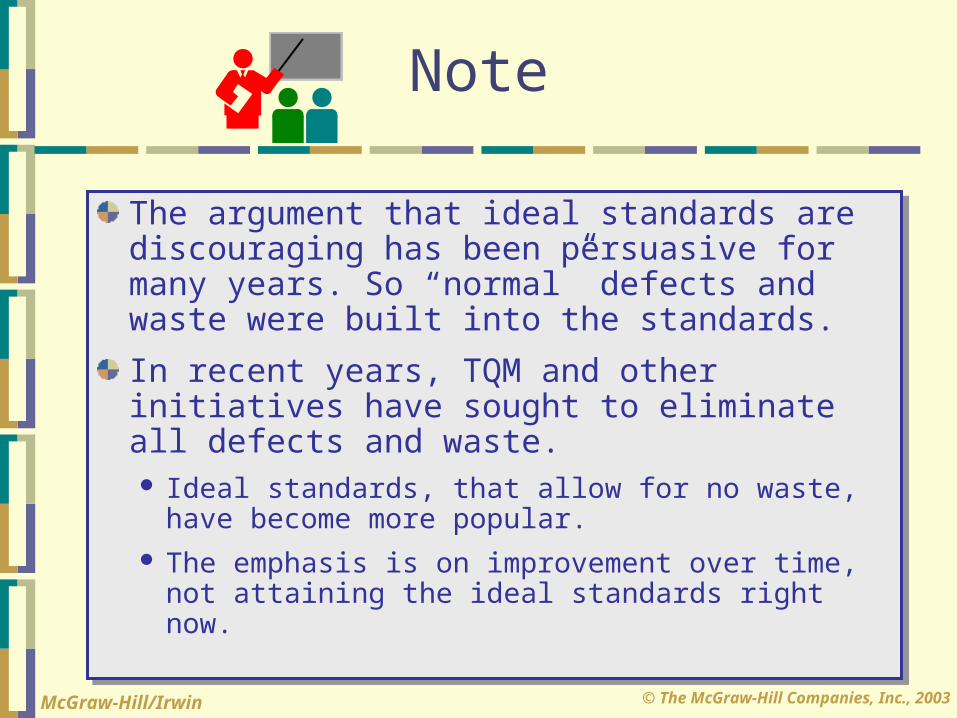
The argument that ideal standards are discouraging has been persuasive for many years. So “normal” defects and waste were built into the standards.
In recent years, TQM and other initiatives have sought to eliminate all defects and waste. Ideal standards, that allow for no waste, have
become more popular. The emphasis is on improvement over time, not
attaining the ideal standards right now.

© The McGraw-Hill Companies, Inc., 2003McGraw-Hill/Irwin
Setting Direct Material Standards
PriceStandards
Final, deliveredcost of materials,net of discounts.
QuantityStandards
Use product design specifications.

© The McGraw-Hill Companies, Inc., 2003McGraw-Hill/Irwin
Setting Direct Labor Standards
RateStandards
Use wage surveys and
labor contracts.
TimeStandards
Use time and motion studies for
each labor operation.

© The McGraw-Hill Companies, Inc., 2003McGraw-Hill/Irwin
Setting Variable Overhead Standards
RateStandards
The rate is the variable portion of the
predetermined overhead rate.
ActivityStandards
The activity is the base used to calculate
the predetermined overhead.

© The McGraw-Hill Companies, Inc., 2003McGraw-Hill/Irwin
Standard Cost Card – Variable Production Cost
A standard cost card for one unit of product might look like this:
A A x BStandard Standard StandardQuantity Price Cost
Inputs or Hours or Rate per Unit
Direct materials 3.0 lbs. 4.00$ per lb. 12.00$ Direct labor 2.5 hours 14.00 per hour 35.00 Variable mfg. overhead 2.5 hours 3.00 per hour 7.50 Total standard unit cost 54.50$
B

© The McGraw-Hill Companies, Inc., 2003McGraw-Hill/Irwin
Are standards the same as budgets?
A budget is set for total costs.
Standards vs. Budgets
A standard is a per unit cost.
Standards are often used when
preparing budgets.

© The McGraw-Hill Companies, Inc., 2003McGraw-Hill/Irwin
Standard Cost VariancesC
ost
Standard
This variance is unfavorablebecause the actual cost
exceeds the standard cost.
A standard cost variance is the amount by whichan actual cost differs from the standard cost.

© The McGraw-Hill Companies, Inc., 2003McGraw-Hill/Irwin
Standard Cost Variances
I see that thereis an unfavorable
variance.
But why arevariances
important to me?
First, they point to causes ofproblems and directions
for improvement.
Second, they trigger investigations in departments
having responsibility for incurring the costs.
© The McGraw-Hill Companies, Inc., 2003McGraw-Hill/Irwin
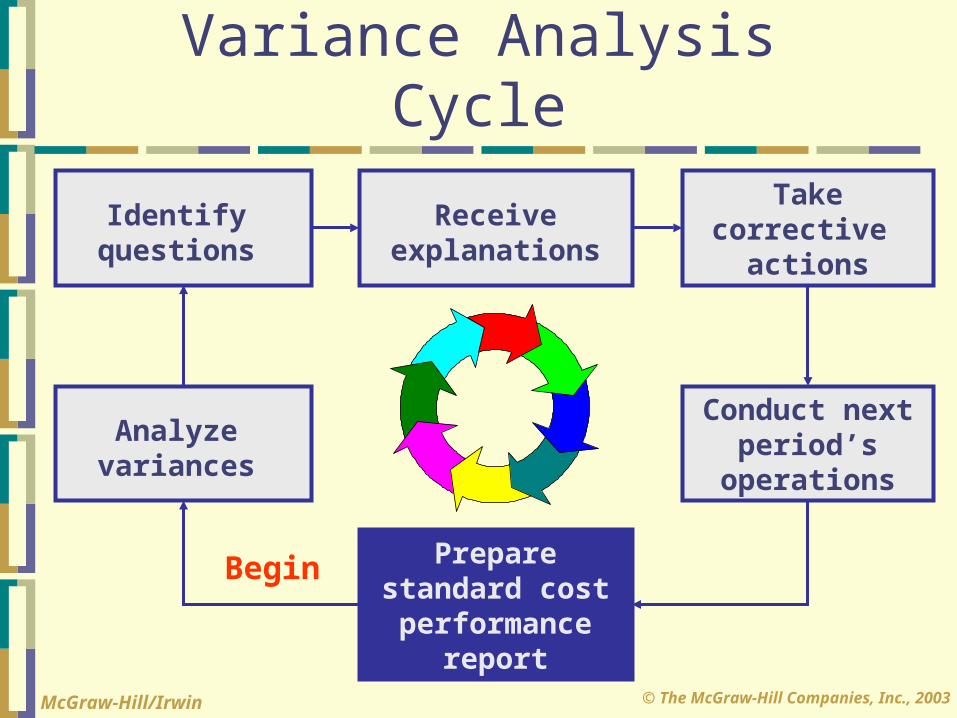
Variance Analysis Cycle
Prepare standard cost performance
report
Analyze variances
Begin
Identifyquestions
Receive explanations
Takecorrective
actions
Conduct next period’s
operations

© The McGraw-Hill Companies, Inc., 2003McGraw-Hill/Irwin
Standard Cost Variances
Standard Cost Variances
Price Variance
The difference betweenthe actual price and the
standard price
Quantity Variance
The difference betweenthe actual quantity andthe standard quantity

© The McGraw-Hill Companies, Inc., 2003McGraw-Hill/Irwin
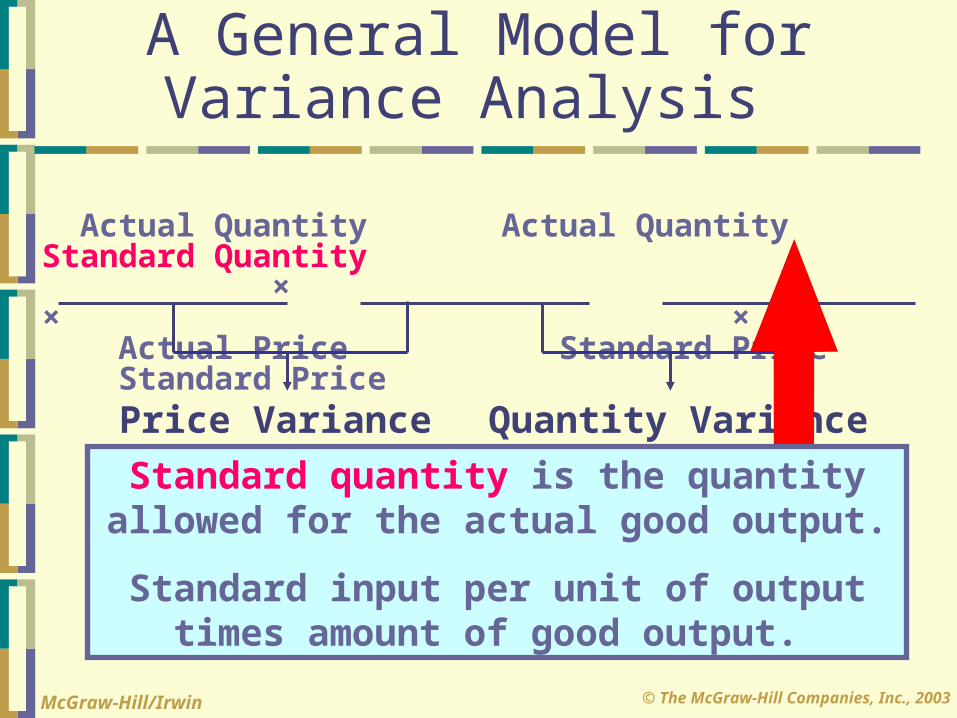
A General Model for Variance Analysis
Actual Quantity Actual Quantity Standard Quantity × × × Actual Price Standard Price Standard Price
Price Variance Quantity Variance
Standard price is the amount that should have been paid for the resources acquired.
© The McGraw-Hill Companies, Inc., 2003McGraw-Hill/Irwin
Price Variance Quantity Variance
Actual Quantity Actual Quantity Standard Quantity × × × Actual Price Standard Price Standard Price
A General Model for Variance Analysis
Standard quantity is the quantity allowed for the actual good output.
Standard input per unit of outputtimes amount of good output.

© The McGraw-Hill Companies, Inc., 2003McGraw-Hill/Irwin
A General Model for Variance Analysis
AQ(AP - SP) SP(AQ - SQ)
AQ = Actual Quantity SP = Standard Price AP = Actual Price SQ = Standard Quantity
Price Variance Quantity Variance
Actual Quantity Actual Quantity Standard Quantity × × × Actual Price Standard Price Standard Price

© The McGraw-Hill Companies, Inc., 2003McGraw-Hill/Irwin
Standard Costs
Let’s use the general model to calculate standard cost
variances for direct material.

© The McGraw-Hill Companies, Inc., 2003McGraw-Hill/Irwin
Glacier Peak Outfitters has the following direct material standard for the fiberfill in its
mountain parka.
0.1 kg. of fiberfill per parka at $5.00 per kg.
Last month 210 kgs of fiberfill were purchased and used to make 2,000 parkas.
The material cost a total of $1,029.
Material VariancesExample
© The McGraw-Hill Companies, Inc., 2003McGraw-Hill/Irwin
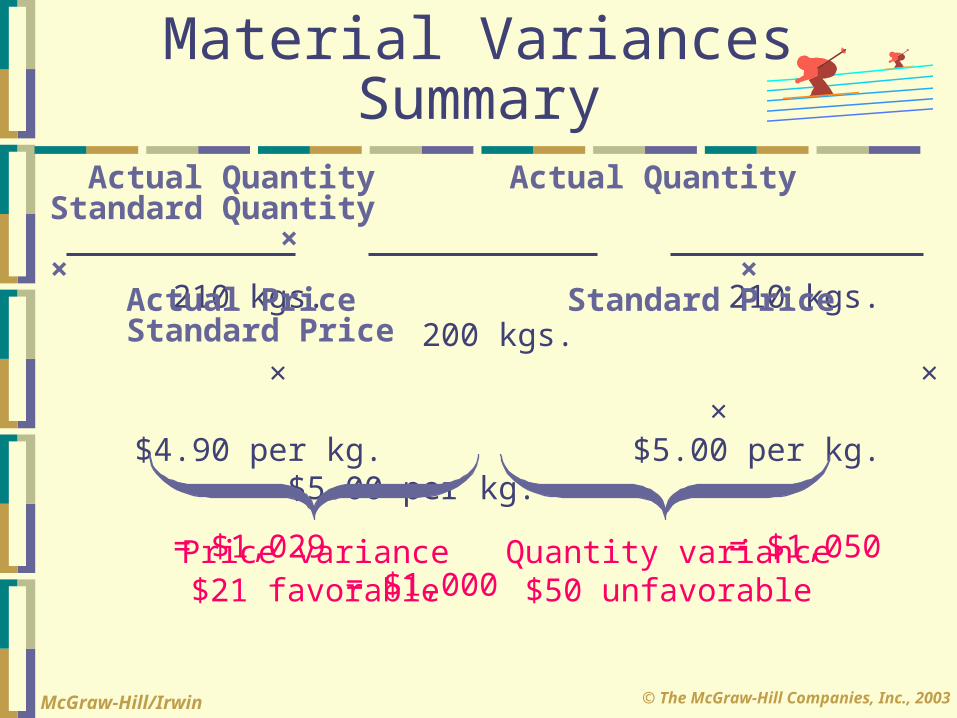
210 kgs. 210 kgs. 200 kgs. × × × $4.90 per kg. $5.00 per kg. $5.00 per kg.
= $1,029 = $1,050 = $1,000
Price variance$21 favorable
Quantity variance$50 unfavorable
Actual Quantity Actual Quantity Standard Quantity × × × Actual Price Standard Price Standard Price
Material VariancesSummary

© The McGraw-Hill Companies, Inc., 2003McGraw-Hill/Irwin
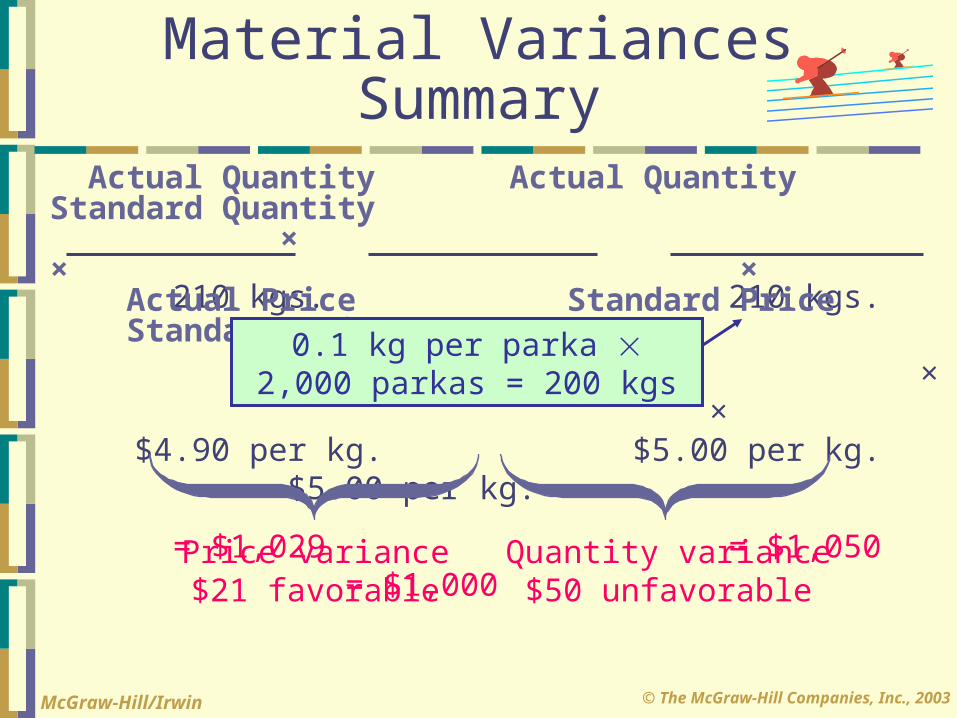
210 kgs. 210 kgs. 200 kgs. × × × $4.90 per kg. $5.00 per kg. $5.00 per kg.
= $1,029 = $1,050 = $1,000
Price variance$21 favorable
Quantity variance$50 unfavorable
Actual Quantity Actual Quantity Standard Quantity × × × Actual Price Standard Price Standard Price
$1,029 210 kgs = $4.90 per
kg
Material VariancesSummary
© The McGraw-Hill Companies, Inc., 2003McGraw-Hill/Irwin
210 kgs. 210 kgs. 200 kgs. × × × $4.90 per kg. $5.00 per kg. $5.00 per kg.
= $1,029 = $1,050 = $1,000
Price variance$21 favorable
Quantity variance$50 unfavorable
Actual Quantity Actual Quantity Standard Quantity × × × Actual Price Standard Price Standard Price
0.1 kg per parka 2,000 parkas = 200 kgs
Material VariancesSummary
© The McGraw-Hill Companies, Inc., 2003McGraw-Hill/Irwin
Note: Using the formulas
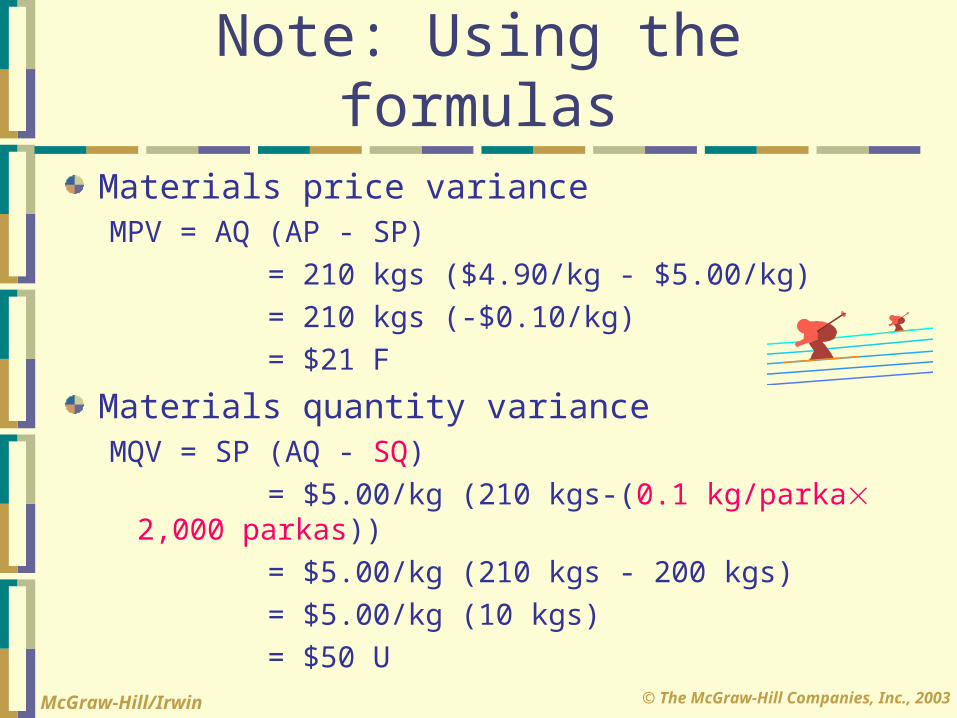
Materials price varianceMPV = AQ (AP - SP)
= 210 kgs ($4.90/kg - $5.00/kg)
= 210 kgs (-$0.10/kg)
= $21 F
Materials quantity varianceMQV = SP (AQ - SQ)
= $5.00/kg (210 kgs-(0.1 kg/parka 2,000 parkas))
= $5.00/kg (210 kgs - 200 kgs)
= $5.00/kg (10 kgs)
= $50 U

© The McGraw-Hill Companies, Inc., 2003McGraw-Hill/Irwin
Quick Check
Suppose only 190 kgs of fiberfill were used to make 2,000 parkas. What is the materials quantity variance? Remember that the standards call for 0.1 kg of fiberfill per parka at a cost of $5 per kg of fiberfill.
a. $50 F
b. $50 U
c. $100 F
d. $100 U
Suppose only 190 kgs of fiberfill were used to make 2,000 parkas. What is the materials quantity variance? Remember that the standards call for 0.1 kg of fiberfill per parka at a cost of $5 per kg of fiberfill.
a. $50 F
b. $50 U
c. $100 F
d. $100 U

© The McGraw-Hill Companies, Inc., 2003McGraw-Hill/Irwin
Suppose only 190 kgs of fiberfill were used to make 2,000 parkas. What is the materials quantity variance? Remember that the standards call for 0.1 kg of fiberfill per parka at a cost of $5 per kg of fiberfill.
a. $50 F
b. $50 U
c. $100 F
d. $100 U
Suppose only 190 kgs of fiberfill were used to make 2,000 parkas. What is the materials quantity variance? Remember that the standards call for 0.1 kg of fiberfill per parka at a cost of $5 per kg of fiberfill.
a. $50 F
b. $50 U
c. $100 F
d. $100 U
Quick Check
MQV = SP (AQ - SQ) = $5.00/kg (190 kgs-(0.1 kg/parka 2,000 parkas)) = $5.00/kg (190 kgs - 200 kgs) = $5.00/kg (-10 kgs) = $50 F

© The McGraw-Hill Companies, Inc., 2003McGraw-Hill/Irwin
If the material quantity standard specifies exactly how much material should be in the final product without any wastage, is a favorable (F) materials quantity variance a good thing?
a. Yes
b. No
If the material quantity standard specifies exactly how much material should be in the final product without any wastage, is a favorable (F) materials quantity variance a good thing?
a. Yes
b. No
Quick Check

© The McGraw-Hill Companies, Inc., 2003McGraw-Hill/Irwin
Quick Check
If the material quantity standard specifies exactly how much material should be in the final product without any wastage, is a favorable (F) materials quantity variance a good thing?
a. Yes
b. No
If the material quantity standard specifies exactly how much material should be in the final product without any wastage, is a favorable (F) materials quantity variance a good thing?
a. Yes
b. No
© The McGraw-Hill Companies, Inc., 2003McGraw-Hill/Irwin
Standard Costs
Let’s use the general model to calculate all standard cost
variances, starting withdirect material.
© The McGraw-Hill Companies, Inc., 2003McGraw-Hill/Irwin
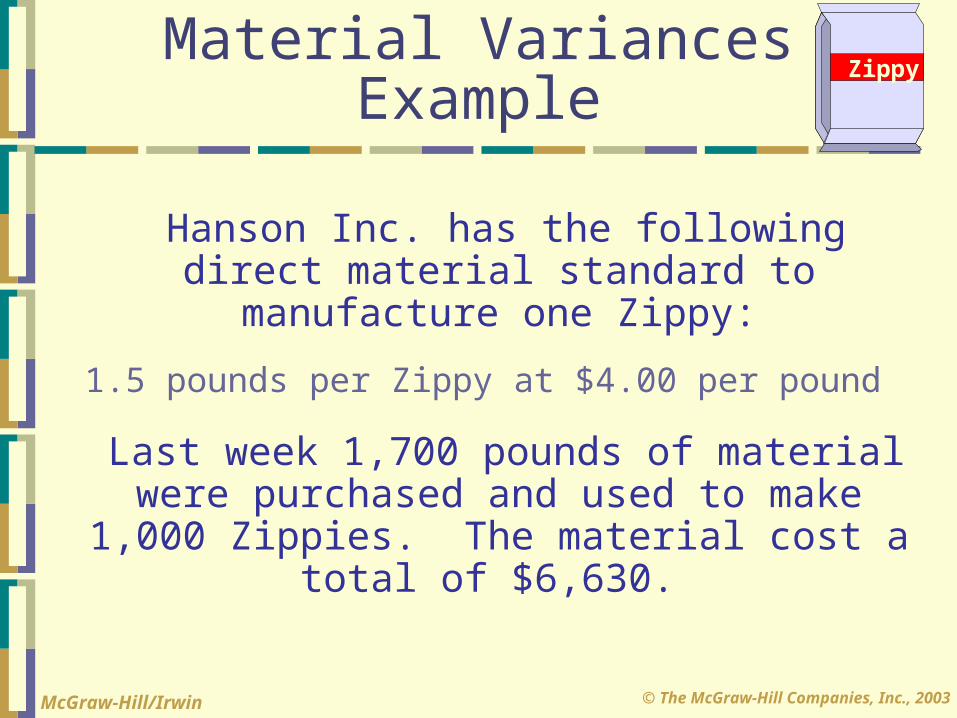
Hanson Inc. has the following direct material standard to manufacture one Zippy:
1.5 pounds per Zippy at $4.00 per pound
Last week 1,700 pounds of material were purchased and used to make 1,000 Zippies.
The material cost a total of $6,630.
Material VariancesExample
Zippy

© The McGraw-Hill Companies, Inc., 2003McGraw-Hill/Irwin
What is the actual price per poundpaid for the material?
a. $4.00 per pound.
b. $4.10 per pound.
c. $3.90 per pound.
d. $6.63 per pound.
What is the actual price per poundpaid for the material?
a. $4.00 per pound.
b. $4.10 per pound.
c. $3.90 per pound.
d. $6.63 per pound.
Quick Check Zippy

© The McGraw-Hill Companies, Inc., 2003McGraw-Hill/Irwin
What is the actual price per poundpaid for the material?
a. $4.00 per pound.
b. $4.10 per pound.
c. $3.90 per pound.
d. $6.63 per pound.
What is the actual price per poundpaid for the material?
a. $4.00 per pound.
b. $4.10 per pound.
c. $3.90 per pound.
d. $6.63 per pound.
AP = $6,630 ÷ 1,700 lbs.AP = $3.90 per lb.
Quick Check Zippy

© The McGraw-Hill Companies, Inc., 2003McGraw-Hill/Irwin
Hanson’s material price variance (MPV)for the week was:
a. $170 unfavorable.
b. $170 favorable.
c. $800 unfavorable.
d. $800 favorable.
Hanson’s material price variance (MPV)for the week was:
a. $170 unfavorable.
b. $170 favorable.
c. $800 unfavorable.
d. $800 favorable.
Quick Check Zippy

© The McGraw-Hill Companies, Inc., 2003McGraw-Hill/Irwin
Hanson’s material price variance (MPV)for the week was:
a. $170 unfavorable.
b. $170 favorable.
c. $800 unfavorable.
d. $800 favorable.
Hanson’s material price variance (MPV)for the week was:
a. $170 unfavorable.
b. $170 favorable.
c. $800 unfavorable.
d. $800 favorable. MPV = AQ(AP - SP) MPV = 1,700 lbs. × ($3.90 - 4.00) MPV = $170 Favorable
Quick Check Zippy

© The McGraw-Hill Companies, Inc., 2003McGraw-Hill/Irwin
The standard quantity of material thatshould have been used to produce1,000 Zippies is:
a. 1,700 pounds.
b. 1,500 pounds.
c. 2,550 pounds.
d. 2,000 pounds.
The standard quantity of material thatshould have been used to produce1,000 Zippies is:
a. 1,700 pounds.
b. 1,500 pounds.
c. 2,550 pounds.
d. 2,000 pounds.
Quick Check Zippy

© The McGraw-Hill Companies, Inc., 2003McGraw-Hill/Irwin
The standard quantity of material thatshould have been used to produce1,000 Zippies is:
a. 1,700 pounds.
b. 1,500 pounds.
c. 2,550 pounds.
d. 2,000 pounds.
The standard quantity of material thatshould have been used to produce1,000 Zippies is:
a. 1,700 pounds.
b. 1,500 pounds.
c. 2,550 pounds.
d. 2,000 pounds. SQ = 1,000 units × 1.5 lbs per unit SQ = 1,500 lbs
Quick Check Zippy

© The McGraw-Hill Companies, Inc., 2003McGraw-Hill/Irwin
Quick Check
Hanson’s material quantity variance (MQV)for the week was:
a. $170 unfavorable.
b. $170 favorable.
c. $800 unfavorable.
d. $800 favorable.
Hanson’s material quantity variance (MQV)for the week was:
a. $170 unfavorable.
b. $170 favorable.
c. $800 unfavorable.
d. $800 favorable.
Zippy

© The McGraw-Hill Companies, Inc., 2003McGraw-Hill/Irwin
1,700 lbs. 1,700 lbs. 1,500 lbs. × × × $3.90 per lb. $4.00 per lb. $4.00 per lb.
= $6,630 = $ 6,800 = $6,000
Price variance$170 favorable
Quantity variance$800 unfavorable
Actual Quantity Actual Quantity Standard Quantity × × × Actual Price Standard Price Standard Price
Material VariancesSummary
Zippy

© The McGraw-Hill Companies, Inc., 2003McGraw-Hill/Irwin
Material Variances
Hanson purchased and used 1,700 pounds.
How are the variances computed if the amount purchased differs from
the amount used?
The price variance is computed on the entire
quantity purchased.
The quantity variance is computed only on
the quantity used.

© The McGraw-Hill Companies, Inc., 2003McGraw-Hill/Irwin
Hanson Inc. has the following material standard to manufacture one Zippy:
1.5 pounds per Zippy at $4.00 per pound
Last week 2,800 pounds of material were purchased at a total cost of $10,920, and 1,700 pounds were used to make 1,000
Zippies.
Material VariancesContinued
Zippy

© The McGraw-Hill Companies, Inc., 2003McGraw-Hill/Irwin
Actual Quantity Actual Quantity Purchased Purchased × × Actual Price Standard Price 2,800 lbs. 2,800 lbs. × × $3.90 per lb. $4.00 per lb.
= $10,920 = $11,200
Price variance$280 favorable
Price variance increases because quantity
purchased increases.
ZippyMaterial Variances
Continued

© The McGraw-Hill Companies, Inc., 2003McGraw-Hill/Irwin
Actual Quantity Used Standard Quantity × × Standard Price Standard Price 1,700 lbs. 1,500 lbs. × × $4.00 per lb. $4.00 per lb.
= $6,800 = $6,000
Quantity variance$800 unfavorable
Quantity variance is unchanged because actual and standard
quantities are unchanged.
Material VariancesContinued
Zippy

© The McGraw-Hill Companies, Inc., 2003McGraw-Hill/Irwin
Isolation of Material Variances
I need the price variancesooner so that I can better
identify purchasing problems.
You accountants just don’tunderstand the problems thatpurchasing managers have.
I’ll start computingthe price variancewhen material is
purchased rather thanwhen it’s used.

© The McGraw-Hill Companies, Inc., 2003McGraw-Hill/Irwin
Responsibility for Material Variances
I am not responsible for this unfavorable material
quantity variance.
You purchased cheapmaterial, so my peoplehad to use more of it.
You used too much material because of poorly trained
workers and poorly maintained equipment.
Also, your poor scheduling sometimes requires me to
rush order material at a higher price, causing
unfavorable price variances.

© The McGraw-Hill Companies, Inc., 2003McGraw-Hill/Irwin
Standard Costs
Now let’s calculate standard cost variances for direct labor.

© The McGraw-Hill Companies, Inc., 2003McGraw-Hill/Irwin
Note
Materials variances: Material price variance
MPV = AQ (AP - SP) Material quantity variance
MQV = SP (AQ - SQ)
Labor variances: Labor rate variance
LRV = AH (AR - SR) Labor efficiency variance
LEV = SR (AH - SH)
Actual hours
Actual rate
Standard rate
Standard hours allowed for the actual good output
© The McGraw-Hill Companies, Inc., 2003McGraw-Hill/Irwin
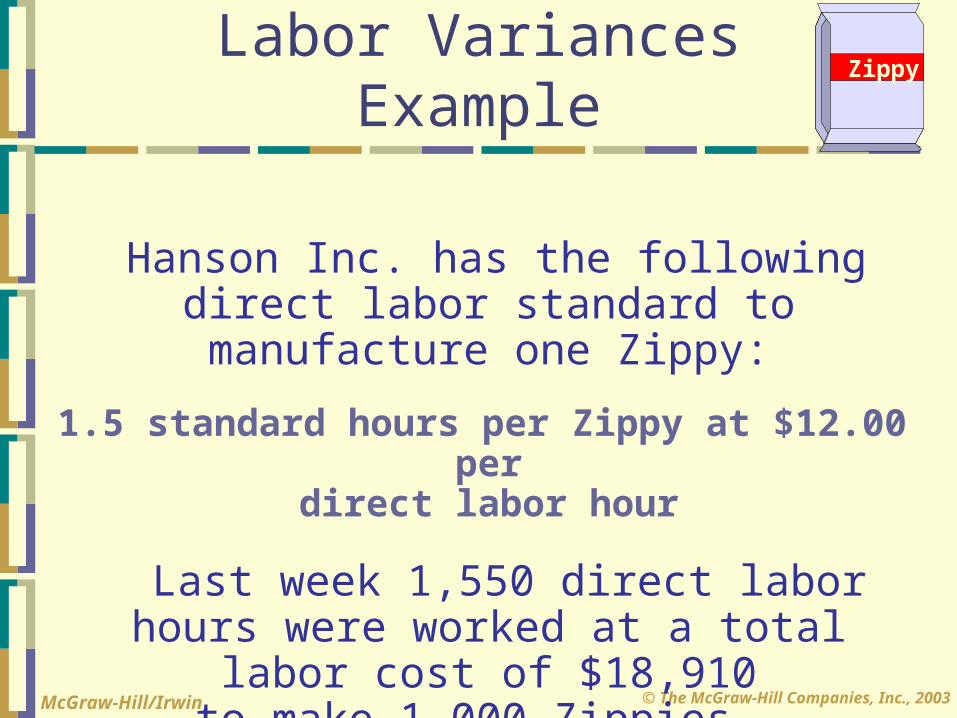
Hanson Inc. has the following direct labor standard to manufacture one Zippy:
1.5 standard hours per Zippy at $12.00 perdirect labor hour
Last week 1,550 direct labor hours were worked at a total labor cost of $18,910
to make 1,000 Zippies.
Labor Variances Example Zippy
© The McGraw-Hill Companies, Inc., 2003McGraw-Hill/Irwin
What was Hanson’s actual rate (AR)for labor for the week?
a. $12.20 per hour.
b. $12.00 per hour.
c. $11.80 per hour.
d. $11.60 per hour.
What was Hanson’s actual rate (AR)for labor for the week?
a. $12.20 per hour.
b. $12.00 per hour.
c. $11.80 per hour.
d. $11.60 per hour.
Quick Check Zippy

© The McGraw-Hill Companies, Inc., 2003McGraw-Hill/Irwin
What was Hanson’s actual rate (AR)for labor for the week?
a. $12.20 per hour.
b. $12.00 per hour.
c. $11.80 per hour.
d. $11.60 per hour.
What was Hanson’s actual rate (AR)for labor for the week?
a. $12.20 per hour.
b. $12.00 per hour.
c. $11.80 per hour.
d. $11.60 per hour.
Quick Check
AR = $18,910 ÷ 1,550 hours AR = $12.20 per hour
Zippy

© The McGraw-Hill Companies, Inc., 2003McGraw-Hill/Irwin
Hanson’s labor rate variance (LRV) for the week was:
a. $310 unfavorable.
b. $310 favorable.
c. $300 unfavorable.
d. $300 favorable.
Hanson’s labor rate variance (LRV) for the week was:
a. $310 unfavorable.
b. $310 favorable.
c. $300 unfavorable.
d. $300 favorable.
Quick Check Zippy

© The McGraw-Hill Companies, Inc., 2003McGraw-Hill/Irwin
Hanson’s labor rate variance (LRV) for the week was:
a. $310 unfavorable.
b. $310 favorable.
c. $300 unfavorable.
d. $300 favorable.
Hanson’s labor rate variance (LRV) for the week was:
a. $310 unfavorable.
b. $310 favorable.
c. $300 unfavorable.
d. $300 favorable.
Quick Check
LRV = AH(AR - SR) LRV = 1,550 hrs($12.20 - $12.00) LRV = $310 unfavorable
Zippy

© The McGraw-Hill Companies, Inc., 2003McGraw-Hill/Irwin
The standard hours (SH) of labor thatshould have been worked to produce1,000 Zippies is:
a. 1,550 hours.
b. 1,500 hours.
c. 1,700 hours.
d. 1,800 hours.
The standard hours (SH) of labor thatshould have been worked to produce1,000 Zippies is:
a. 1,550 hours.
b. 1,500 hours.
c. 1,700 hours.
d. 1,800 hours.
Quick Check Zippy

© The McGraw-Hill Companies, Inc., 2003McGraw-Hill/Irwin
The standard hours (SH) of labor thatshould have been worked to produce1,000 Zippies is:
a. 1,550 hours.
b. 1,500 hours.
c. 1,700 hours.
d. 1,800 hours.
The standard hours (SH) of labor thatshould have been worked to produce1,000 Zippies is:
a. 1,550 hours.
b. 1,500 hours.
c. 1,700 hours.
d. 1,800 hours.
Quick Check
SH = 1,000 units × 1.5 hours per unit SH = 1,500 hours
Zippy

© The McGraw-Hill Companies, Inc., 2003McGraw-Hill/Irwin
Hanson’s labor efficiency variance (LEV)for the week was:
a. $590 unfavorable.
b. $590 favorable.
c. $600 unfavorable.
d. $600 favorable.
Hanson’s labor efficiency variance (LEV)for the week was:
a. $590 unfavorable.
b. $590 favorable.
c. $600 unfavorable.
d. $600 favorable.
Quick Check Zippy

© The McGraw-Hill Companies, Inc., 2003McGraw-Hill/Irwin
Hanson’s labor efficiency variance (LEV)for the week was:
a. $590 unfavorable.
b. $590 favorable.
c. $600 unfavorable.
d. $600 favorable.
Hanson’s labor efficiency variance (LEV)for the week was:
a. $590 unfavorable.
b. $590 favorable.
c. $600 unfavorable.
d. $600 favorable.
Quick Check
LEV = SR(AH - SH) LEV = $12.00(1,550 hrs - 1,500 hrs) LEV = $600 unfavorable
Zippy

© The McGraw-Hill Companies, Inc., 2003McGraw-Hill/Irwin
Actual Hours Actual Hours Standard Hours × × × Actual Rate Standard Rate Standard Rate
Labor VariancesSummary
Rate variance$310 unfavorable
Efficiency variance$600 unfavorable
1,550 hours 1,550 hours 1,500 hours × × × $12.20 per hour $12.00 per hour $12.00 per hour
= $18,910 = $18,600 = $18,000
Zippy
© The McGraw-Hill Companies, Inc., 2003McGraw-Hill/Irwin
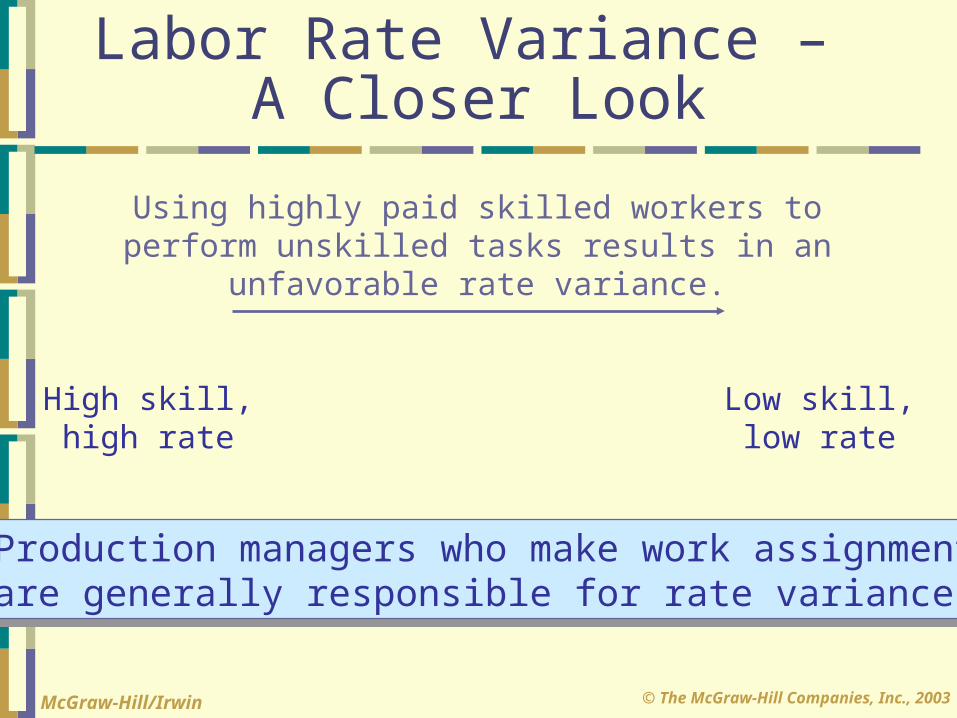
Labor Rate Variance – A Closer Look
Production managers who make work assignmentsare generally responsible for rate variances.
Production managers who make work assignmentsare generally responsible for rate variances.
High skill,high rate
Low skill,low rate
Using highly paid skilled workers toperform unskilled tasks results in an
unfavorable rate variance.

© The McGraw-Hill Companies, Inc., 2003McGraw-Hill/Irwin
Labor Efficiency Variance –A Closer Look
UnfavorableEfficiencyVariance
Poorsupervisionof workers
Poorlymaintainedequipment
Poorlytrainedworkers
Poorquality
materials
Insufficientdemand

© The McGraw-Hill Companies, Inc., 2003McGraw-Hill/Irwin
Responsibility forLabor Variances
I am not responsible for the unfavorable labor
efficiency variance!
You purchased cheapmaterial, so it took more
time to process it.
You used too much time because of poorly
trained workers and poor supervision.
© The McGraw-Hill Companies, Inc., 2003McGraw-Hill/Irwin
Responsibility forLabor Variances
Maybe I can attribute the laborand material variances to personnel
for hiring the wrong peopleand training them poorly.

© The McGraw-Hill Companies, Inc., 2003McGraw-Hill/Irwin
Standard Costs
Now let’s calculate standard cost
variances for the last of the variable production costs –
variable manufacturing
overhead.

© The McGraw-Hill Companies, Inc., 2003McGraw-Hill/Irwin
Note
Labor variances: Labor rate variance
LRV = AH (AR - SR) Labor efficiency variance
LEV = SR (AH - SH)
Variable overhead variances: Variable overhead spending variance
VOSV = AH (AR - SR) Variable overhead efficiency variance
VOEV = SR (AH Quick Check
Actual hours of the allocation base
Actual variable overhead rate
Standard variable overhead rate
Standard hours allowed for the actual good output
© The McGraw-Hill Companies, Inc., 2003McGraw-Hill/Irwin
Hanson’s spending variance (VOSV) for variable manufacturing overhead forthe week was:
a. $465 unfavorable.
b. $400 favorable.
c. $335 unfavorable.
d. $300 favorable.
Hanson’s spending variance (VOSV) for variable manufacturing overhead forthe week was:
a. $465 unfavorable.
b. $400 favorable.
c. $335 unfavorable.
d. $300 favorable.
Quick Check Zippy

© The McGraw-Hill Companies, Inc., 2003McGraw-Hill/Irwin
Hanson’s spending variance (VOSV) for variable manufacturing overhead forthe week was:
a. $465 unfavorable.
b. $400 favorable.
c. $335 unfavorable.
d. $300 favorable.
Hanson’s spending variance (VOSV) for variable manufacturing overhead forthe week was:
a. $465 unfavorable.
b. $400 favorable.
c. $335 unfavorable.
d. $300 favorable.
Quick Check
SV = AH(AR - SR) SV = 1,550 hrs($3.30 - $3.00) SV = $465 unfavorable
Zippy

© The McGraw-Hill Companies, Inc., 2003McGraw-Hill/Irwin
Hanson’s efficiency variance (VOEV) for variable manufacturing overhead for the week was:
a. $435 unfavorable.
b. $435 favorable.
c. $150 unfavorable.
d. $150 favorable.
Hanson’s efficiency variance (VOEV) for variable manufacturing overhead for the week was:
a. $435 unfavorable.
b. $435 favorable.
c. $150 unfavorable.
d. $150 favorable.
Quick Check Zippy

© The McGraw-Hill Companies, Inc., 2003McGraw-Hill/Irwin
Hanson’s efficiency variance (VOEV) for variable manufacturing overhead for the week was:
a. $435 unfavorable.
b. $435 favorable.
c. $150 unfavorable.
d. $150 favorable.
Hanson’s efficiency variance (VOEV) for variable manufacturing overhead for the week was:
a. $435 unfavorable.
b. $435 favorable.
c. $150 unfavorable.
d. $150 favorable.
Quick Check
EV = SR(AH - SH) EV = $3.00(1,550 hrs - 1,500 hrs) EV = $150 unfavorable
1,000 units × 1.5 hrs per unit
Zippy

© The McGraw-Hill Companies, Inc., 2003McGraw-Hill/Irwin
Spending variance$465 unfavorable
Efficiency variance$150 unfavorable
1,550 hours 1,550 hours 1,500 hours × × × $3.30 per hour $3.00 per hour $3.00 per hour
= $5,115 = $4,650 = $4,500
Actual Hours Actual Hours Standard Hours × × × Actual Rate Standard Rate Standard Rate
Variable ManufacturingOverhead Variances
Zippy

© The McGraw-Hill Companies, Inc., 2003McGraw-Hill/Irwin
Variable Manufacturing Overhead Variances – A Closer Look
If variable overhead is applied on the basisof direct labor hours, the labor efficiency
and variable overhead efficiency varianceswill move in tandem.
If variable overhead is applied on the basisof direct labor hours, the labor efficiency
and variable overhead efficiency varianceswill move in tandem.
© The McGraw-Hill Companies, Inc., 2003McGraw-Hill/Irwin
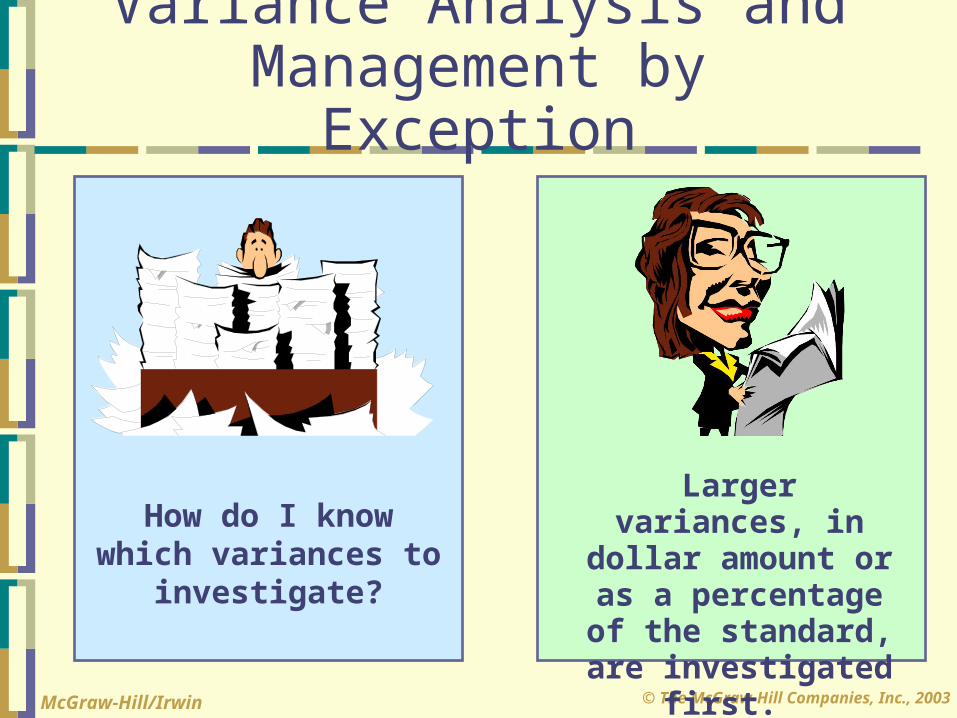
Variance Analysis and Management by Exception
How do I know which variances to investigate?
Larger variances, in dollar amount or as a percentage of the
standard, are investigated first.

© The McGraw-Hill Companies, Inc., 2003McGraw-Hill/Irwin
Advantages of Standard Costs
Management byexception
Improved cost control and performance
evaluation
Better Informationfor planning anddecision making
Possible reductionsin production costs
Advantages
© The McGraw-Hill Companies, Inc., 2003McGraw-Hill/Irwin
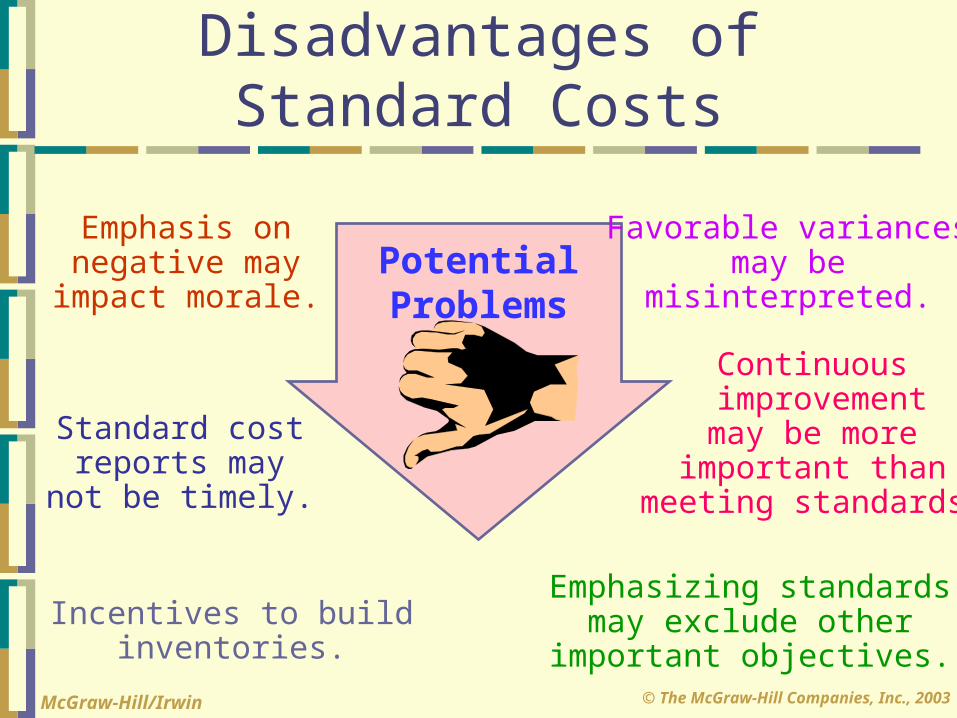
PotentialProblems
Emphasis onnegative may
impact morale.
Emphasizing standardsmay exclude other
important objectives.
Favorable variancesmay be
misinterpreted.
Continuous improvementmay be moreimportant than
meeting standards.
Standard costreports may
not be timely.
Incentives to buildinventories.
Disadvantages ofStandard Costs

© The McGraw-Hill Companies, Inc., 2003McGraw-Hill/Irwin
The Balanced Scorecard
Management translates its strategy into performance measures that employees
understand and accept.
Management translates its strategy into performance measures that employees
understand and accept.
Performancemeasures
Customers
Learningand growth
Internalbusiness
processes
Financial
© The McGraw-Hill Companies, Inc., 2003McGraw-Hill/Irwin
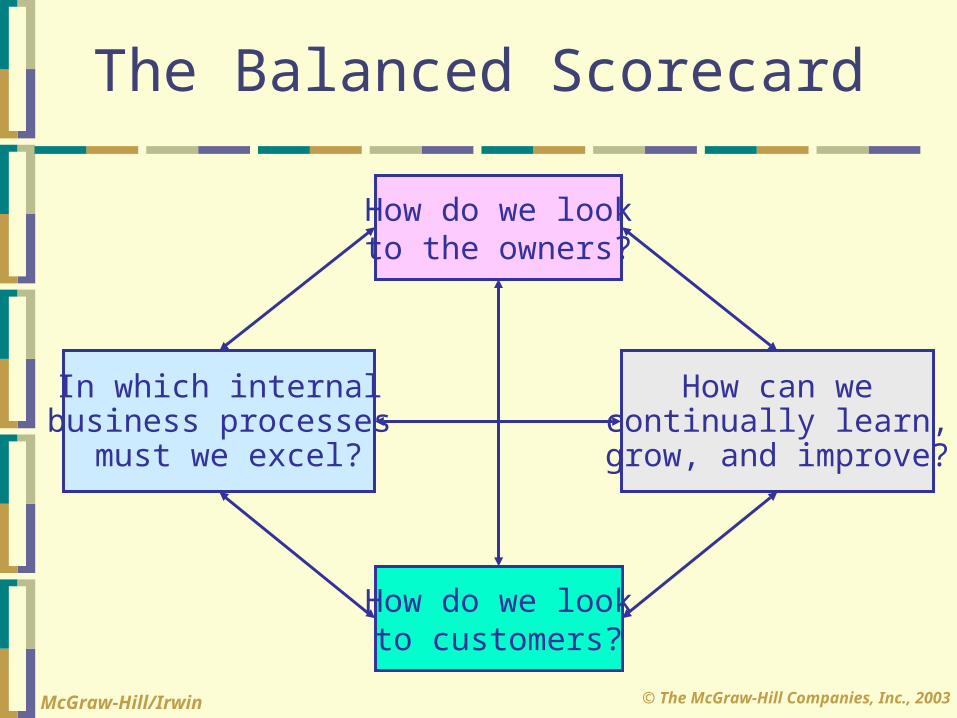
The Balanced Scorecard
How do we lookto the owners?
How can wecontinually learn,
grow, and improve?
In which internalbusiness processes
must we excel?
How do we lookto customers?

© The McGraw-Hill Companies, Inc., 2003McGraw-Hill/Irwin
The Balanced Scorecard
Learning improvesbusiness processes.
Improved businessprocesses improve
customer satisfaction.
Improving customersatisfaction improves
financial results.

© The McGraw-Hill Companies, Inc., 2003McGraw-Hill/Irwin
Benefits of Balance Scorecard
If implemented well:Forces management to articulate a coherent
strategy.Strategy is communicated throughout
organization.Performance measures are more likely to be
consistent with strategy and actionable.Portfolio of measures reduces gaming
problems.Feedback loop makes strategy dynamic.
If implemented well:Forces management to articulate a coherent
strategy.Strategy is communicated throughout
organization.Performance measures are more likely to be
consistent with strategy and actionable.Portfolio of measures reduces gaming
problems.Feedback loop makes strategy dynamic.

© The McGraw-Hill Companies, Inc., 2003McGraw-Hill/Irwin
Some Possible Problems
Cultural/behavioralProgram fatigue.
Culture shock/resistance.
Every existing performance measurehas a champion.
Gaming still possible.
Cultural/behavioralProgram fatigue.
Culture shock/resistance.
Every existing performance measurehas a champion.
Gaming still possible.

© The McGraw-Hill Companies, Inc., 2003McGraw-Hill/Irwin
Process time is the only value-added time.
Delivery Performance Measures
Wait TimeProcess Time + Inspection Time
+ Move Time + Queue Time
Delivery Cycle Time
Order Received
ProductionStarted
Goods Shipped
Throughput Time

© The McGraw-Hill Companies, Inc., 2003McGraw-Hill/Irwin
Delivery Performance Measures
ManufacturingCycle
Efficiency
Value-added time
Manufacturing cycle time=
Wait TimeProcess Time + Inspection Time
+ Move Time + Queue Time
Delivery Cycle Time
Order Received
ProductionStarted
Goods Shipped
Throughput Time

© The McGraw-Hill Companies, Inc., 2003McGraw-Hill/Irwin
Quick Check
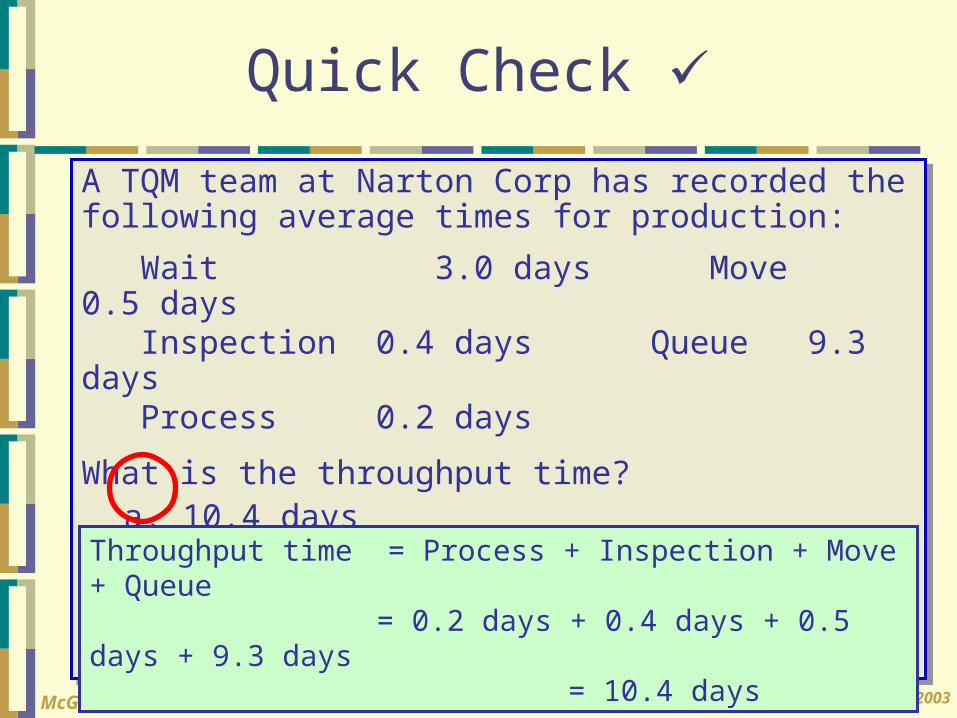
A TQM team at Narton Corp has recorded the following average times for production:
Wait 3.0 days Move 0.5 days Inspection 0.4 days Queue 9.3 days Process 0.2 days
What is the throughput time? a. 10.4 daysb. 0.2 daysc. 4.1 daysd. 13.4 days
A TQM team at Narton Corp has recorded the following average times for production:
Wait 3.0 days Move 0.5 days Inspection 0.4 days Queue 9.3 days Process 0.2 days
What is the throughput time? a. 10.4 daysb. 0.2 daysc. 4.1 daysd. 13.4 days
© The McGraw-Hill Companies, Inc., 2003McGraw-Hill/Irwin
A TQM team at Narton Corp has recorded the following average times for production:
Wait 3.0 days Move 0.5 days Inspection 0.4 days Queue 9.3 days Process 0.2 days
What is the throughput time? a. 10.4 daysb. 0.2 daysc. 4.1 daysd. 13.4 days
A TQM team at Narton Corp has recorded the following average times for production:
Wait 3.0 days Move 0.5 days Inspection 0.4 days Queue 9.3 days Process 0.2 days
What is the throughput time? a. 10.4 daysb. 0.2 daysc. 4.1 daysd. 13.4 days
Quick Check
Throughput time = Process + Inspection + Move + Queue = 0.2 days + 0.4 days + 0.5 days + 9.3 days = 10.4 days
© The McGraw-Hill Companies, Inc., 2003McGraw-Hill/Irwin
Quick Check
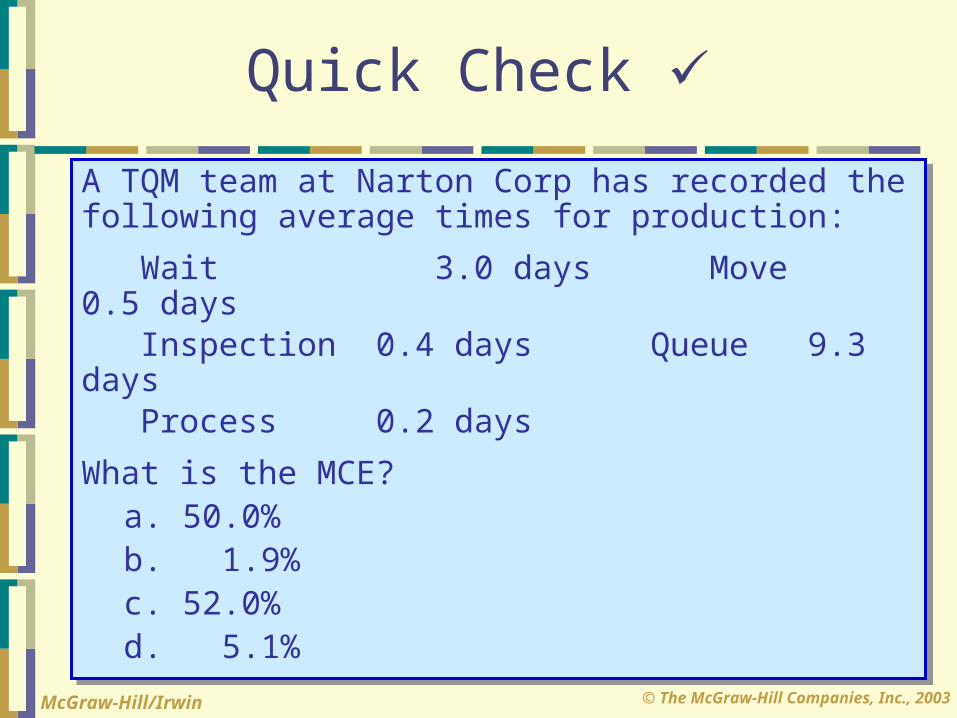
A TQM team at Narton Corp has recorded the following average times for production:
Wait 3.0 days Move 0.5 days Inspection 0.4 days Queue 9.3 days Process 0.2 days
What is the MCE? a. 50.0%b. 1.9%c. 52.0%d. 5.1%
A TQM team at Narton Corp has recorded the following average times for production:
Wait 3.0 days Move 0.5 days Inspection 0.4 days Queue 9.3 days Process 0.2 days
What is the MCE? a. 50.0%b. 1.9%c. 52.0%d. 5.1%

© The McGraw-Hill Companies, Inc., 2003McGraw-Hill/Irwin
A TQM team at Narton Corp has recorded the following average times for production:
Wait 3.0 days Move 0.5 days Inspection 0.4 days Queue 9.3 days Process 0.2 days
What is the MCE? a. 50.0%b. 1.9%c. 52.0%d. 5.1%
A TQM team at Narton Corp has recorded the following average times for production:
Wait 3.0 days Move 0.5 days Inspection 0.4 days Queue 9.3 days Process 0.2 days
What is the MCE? a. 50.0%b. 1.9%c. 52.0%d. 5.1%
Quick Check
MCE = Value-added time ÷ Throughput time
= Process time ÷ Throughput time
= 0.2 days ÷ 10.4 days = 1.9%

© The McGraw-Hill Companies, Inc., 2003McGraw-Hill/Irwin
Quick Check
A TQM team at Narton Corp has recorded the following average times for production:
Wait 3.0 days Move 0.5 days Inspection 0.4 days Queue 9.3 days Process 0.2 days
What is the delivery cycle time? a. 0.5 daysb. 0.7 daysc. 13.4 daysd. 10.4 days
A TQM team at Narton Corp has recorded the following average times for production:
Wait 3.0 days Move 0.5 days Inspection 0.4 days Queue 9.3 days Process 0.2 days
What is the delivery cycle time? a. 0.5 daysb. 0.7 daysc. 13.4 daysd. 10.4 days

© The McGraw-Hill Companies, Inc., 2003McGraw-Hill/Irwin
A TQM team at Narton Corp has recorded the following average times for production:
Wait 3.0 days Move 0.5 days Inspection 0.4 days Queue 9.3 days Process 0.2 days
What is the delivery cycle time? a. 0.5 daysb. 0.7 daysc. 13.4 daysd. 10.4 days
A TQM team at Narton Corp has recorded the following average times for production:
Wait 3.0 days Move 0.5 days Inspection 0.4 days Queue 9.3 days Process 0.2 days
What is the delivery cycle time? a. 0.5 daysb. 0.7 daysc. 13.4 daysd. 10.4 days
Quick Check Delivery cycle time = Wait time + Throughput time = 3.0 days + 10.4 days = 13.4 days

© The McGraw-Hill Companies, Inc., 2003McGraw-Hill/Irwin
End of Chapter 10
Related Documents