Stage Gate Results & Input on CE Strategy Kenya Augustine Cheruiyot & team

Welcome message from author
This document is posted to help you gain knowledge. Please leave a comment to let me know what you think about it! Share it to your friends and learn new things together.
Transcript
Stage Gate Results & Input
on CE Strategy
Kenya
Augustine Cheruiyot & team
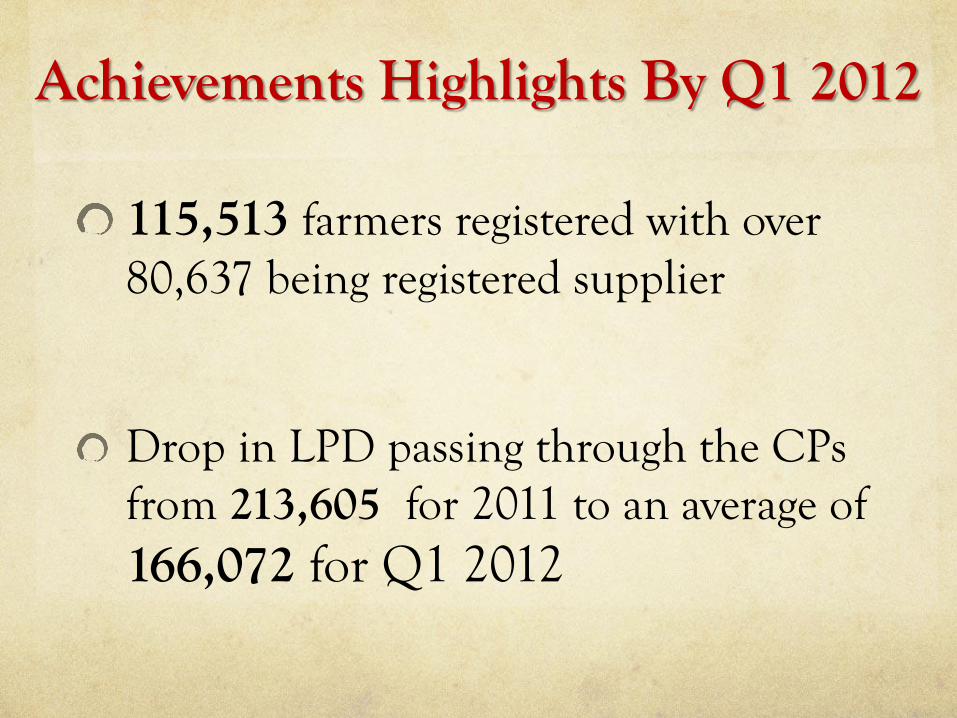
Achievements Highlights By Q1 2012
115,513 farmers registered with over 80,637 being registered supplier
Drop in LPD passing through the CPs from 213,605 for 2011 to an average of 166,072 for Q1 2012
Stage gate Results
Production Stage gating
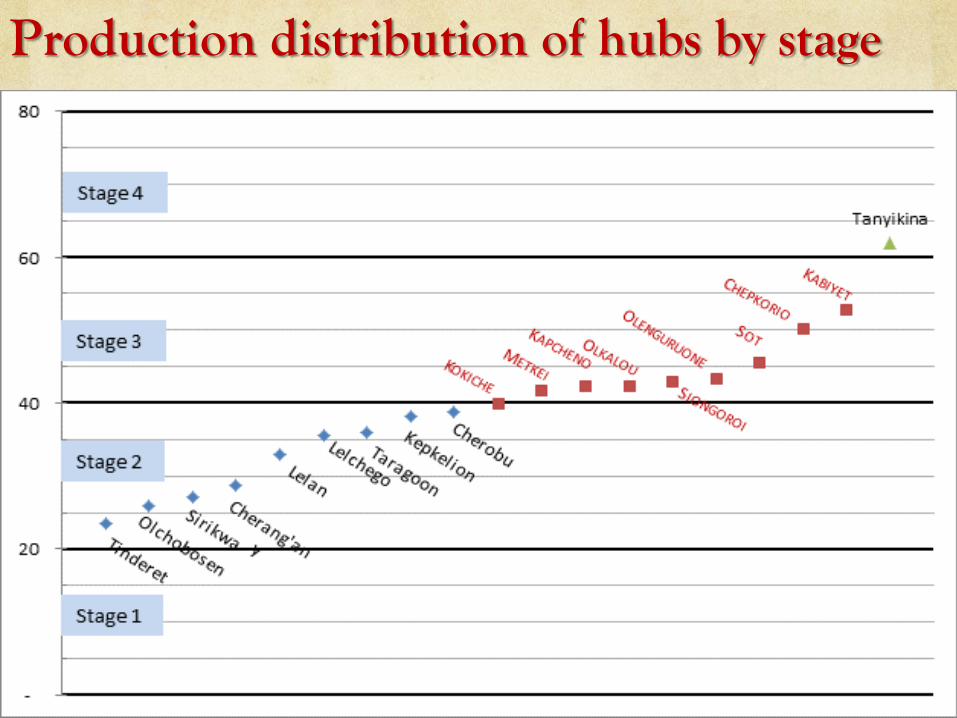
Production distribution of hubs by stage
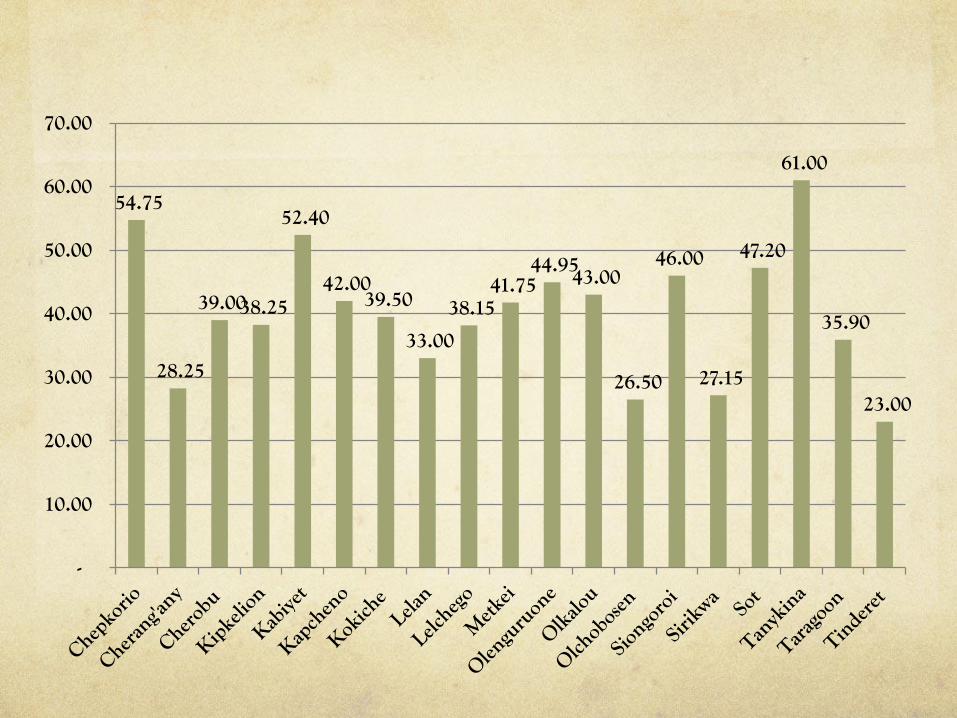
54.75
28.25
39.00 38.25
52.40
42.00 39.50
33.00
38.15 41.75
44.95 43.00
26.50
46.00
27.15
47.20
61.00
35.90
23.00
-
10.00
20.00
30.00
40.00
50.00
60.00
70.00
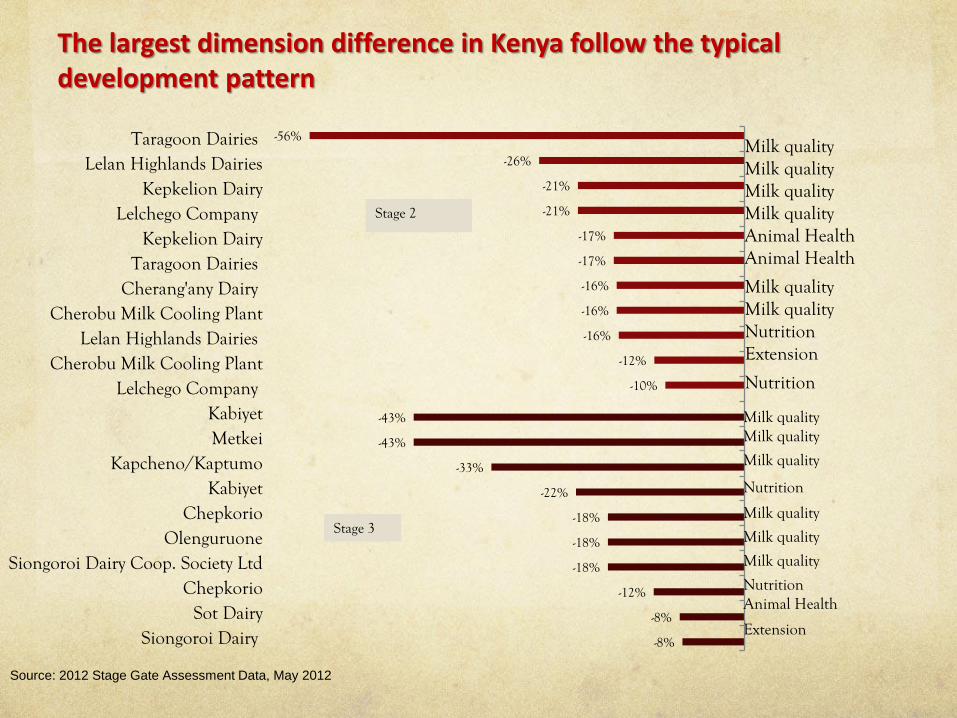
The largest dimension difference in Kenya follow the typical development pattern
Source: 2012 Stage Gate Assessment Data, May 2012
-56%
-26%
-21%
-21%
-17%
-17%
-16%
-16%
-16%
-12%
-10%
-43%
-43%
-33%
-22%
-18%
-18%
-18%
-12%
-8%
-8%
Taragoon DairiesLelan Highlands Dairies
Kepkelion DairyLelchego Company
Kepkelion DairyTaragoon Dairies
Cherang'any DairyCherobu Milk Cooling Plant
Lelan Highlands DairiesCherobu Milk Cooling Plant
Lelchego CompanyKabiyetMetkei
Kapcheno/KaptumoKabiyet
ChepkorioOlenguruone
Siongoroi Dairy Coop. Society LtdChepkorio
Sot DairySiongoroi Dairy
Stage 2
Milk quality Milk quality Milk quality Milk quality Animal Health Animal Health
Milk quality Milk quality Nutrition Extension
Nutrition
Milk quality Milk quality
Milk quality
Nutrition
Milk quality
Milk quality
Milk quality
Nutrition Animal Health
Extension
Stage 3

Business Stage Gating
Stage 2
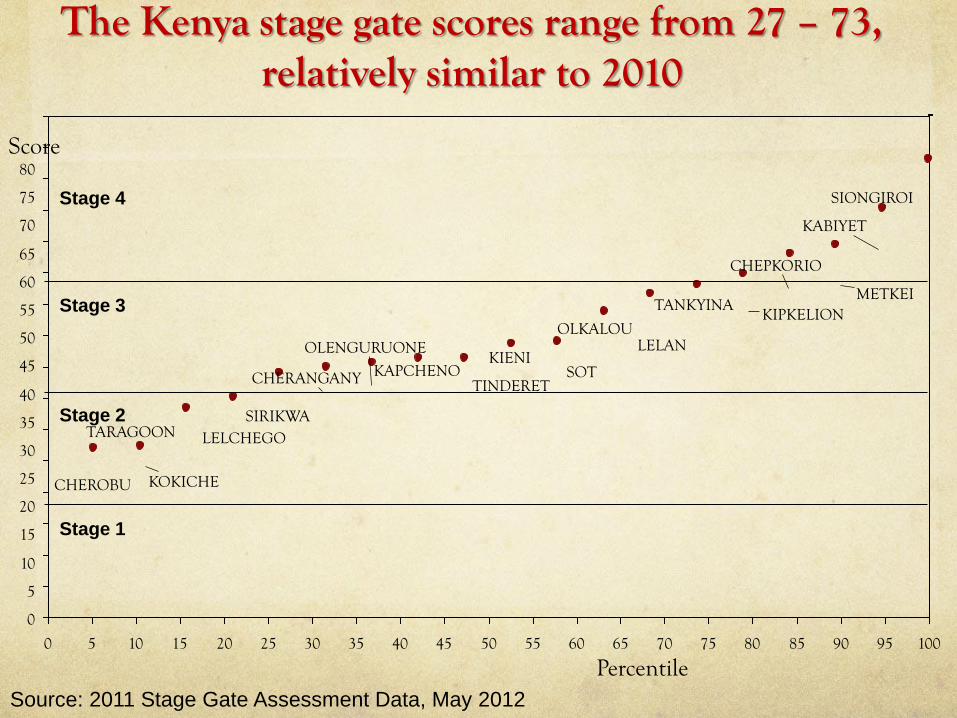
The Kenya stage gate scores range from 27 – 73, relatively similar to 2010
40
35
30
25
20
15
10
5
0
Percentile
100 95
Score
90 85 80
KOKICHE CHEROBU
50 45 40 35 30 25 20 15 10 5 0
SIONGIROI
KABIYET
METKEI
CHEPKORIO
KIPKELION TANKYINA
LELAN OLKALOU
SOT KIENI
TINDERET KAPCHENO
OLENGURUONE
CHERANGANY
SIRIKWA LELCHEGO TARAGOON
75 70 65 60 55
55
60
65
70
75
50
45
80
Stage 4
Stage 3
Stage 1
Source: 2011 Stage Gate Assessment Data, May 2012
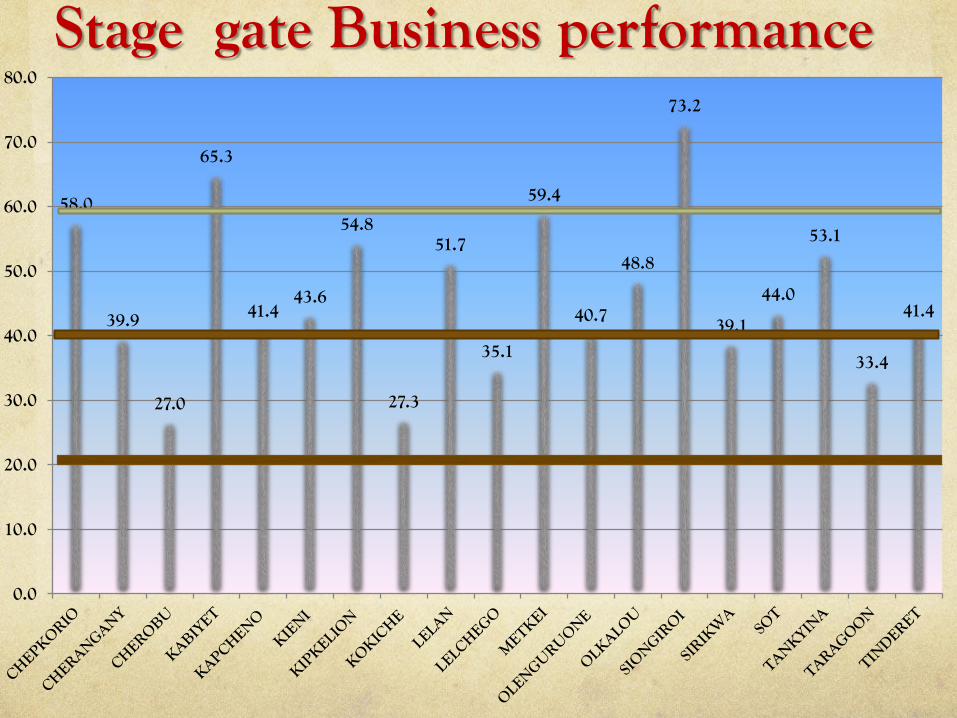
Stage gate Business performance
58.0
39.9
27.0
65.3
41.4 43.6
54.8
27.3
51.7
35.1
59.4
40.7
48.8
73.2
39.1
44.0
53.1
33.4
41.4
0.0
10.0
20.0
30.0
40.0
50.0
60.0
70.0
80.0
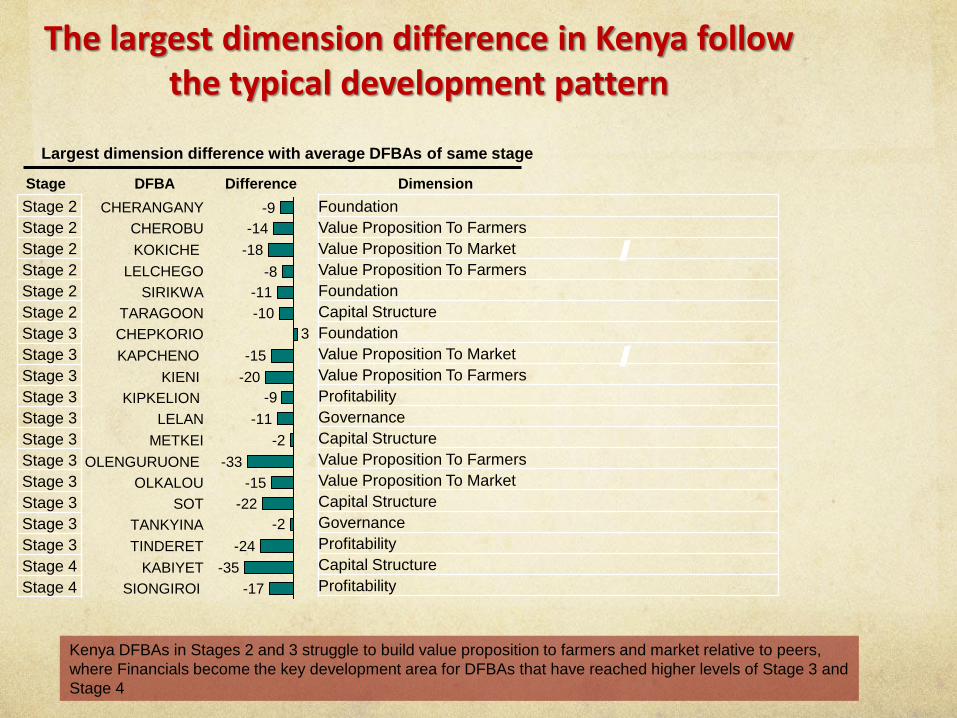
Kenya DFBAs in Stages 2 and 3 struggle to build value proposition to farmers and market relative to peers,
where Financials become the key development area for DFBAs that have reached higher levels of Stage 3 and
Stage 4
The largest dimension difference in Kenya follow the typical development pattern
-2
-2
-9
3
-8
-9
SIONGIROI -17
KABIYET -35
TINDERET -24
TANKYINA
SOT -22
OLKALOU -15
OLENGURUONE -33
METKEI
LELAN -11
KIPKELION
KIENI -20
KAPCHENO -15
CHEPKORIO
TARAGOON -10
SIRIKWA -11
LELCHEGO
KOKICHE -18
CHEROBU -14
CHERANGANY
Largest dimension difference with average DFBAs of same stage
Dimension Difference Stage
Stage 2
Stage 2
Stage 2
Stage 2
Stage 2
Stage 2
Stage 3
Stage 3
Stage 3
Stage 3
Stage 3
Stage 3
Stage 3
Stage 3
Stage 3
Stage 3
Stage 3
Stage 4
Stage 4
Foundation
Value Proposition To Farmers
Value Proposition To Market
Value Proposition To Farmers
Foundation
Capital Structure
Foundation
Value Proposition To Market
Value Proposition To Farmers
Profitability
Governance
Capital Structure
Value Proposition To Farmers
Value Proposition To Market
Capital Structure
Governance
Profitability
Capital Structure
Profitability
DFBA
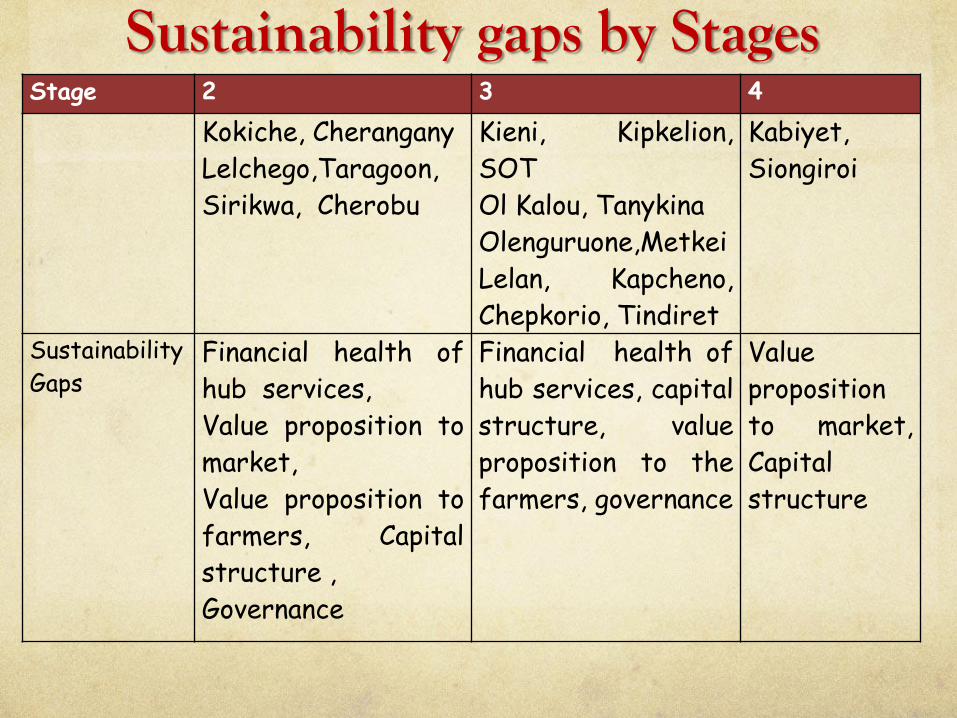
Sustainability gaps by Stages Stage 2 3 4
Kokiche, Cherangany
Lelchego,Taragoon,
Sirikwa, Cherobu
Kieni, Kipkelion,
SOT
Ol Kalou, Tanykina
Olenguruone,Metkei
Lelan, Kapcheno,
Chepkorio, Tindiret
Kabiyet,
Siongiroi
Sustainability
Gaps Financial health of
hub services,
Value proposition to
market,
Value proposition to
farmers, Capital
structure ,
Governance
Financial health of
hub services, capital
structure, value
proposition to the
farmers, governance
Value
proposition
to market,
Capital
structure
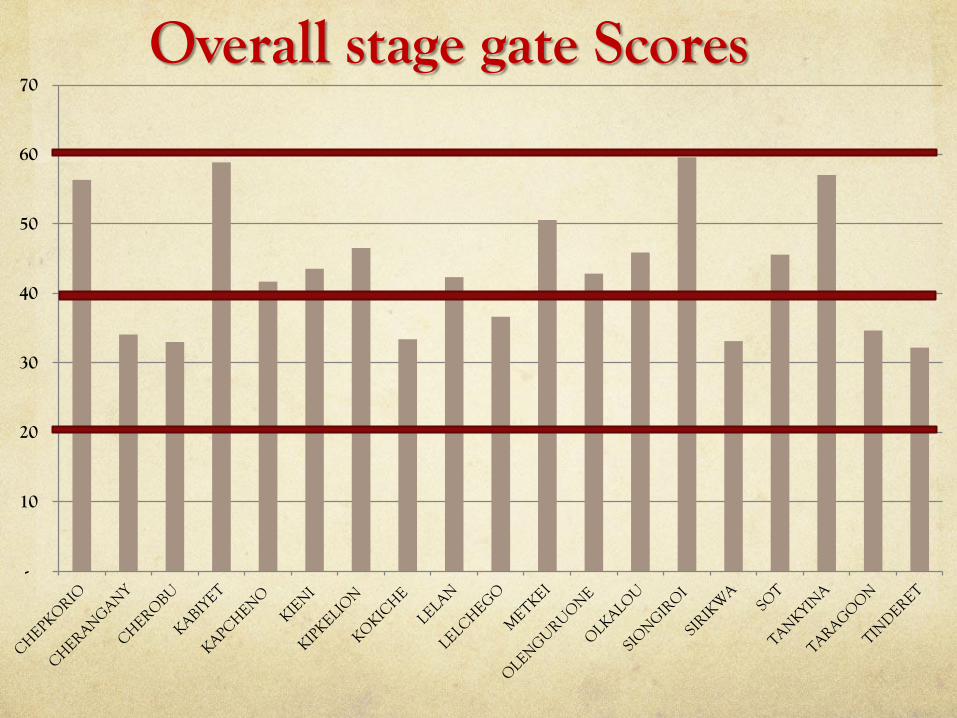
Overall stage gate Scores
-
10
20
30
40
50
60
70
Overall
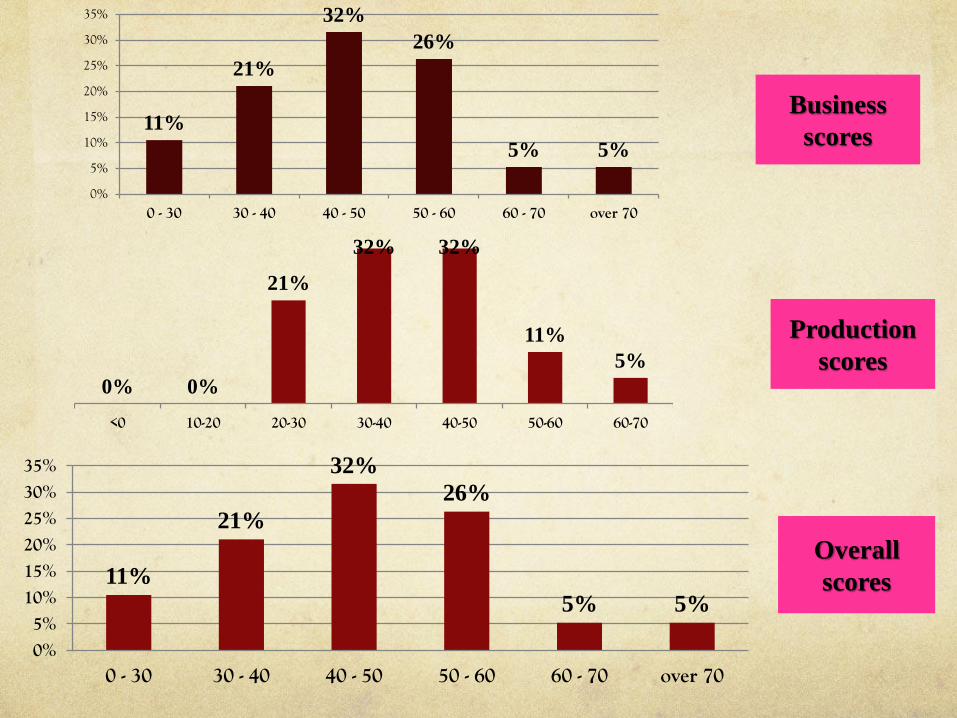
scores 11%
21%
32%
26%
5% 5%
0%5%
10%15%20%25%30%35%
0 - 30 30 - 40 40 - 50 50 - 60 60 - 70 over 70
0% 0%
21%
32% 32%
11%
5%
<0 10-20 20-30 30-40 40-50 50-60 60-70
Production
scores
11%
21%
32%
26%
5% 5%
0%
5%
10%
15%
20%
25%
30%
35%
0 - 30 30 - 40 40 - 50 50 - 60 60 - 70 over 70
Business
scores
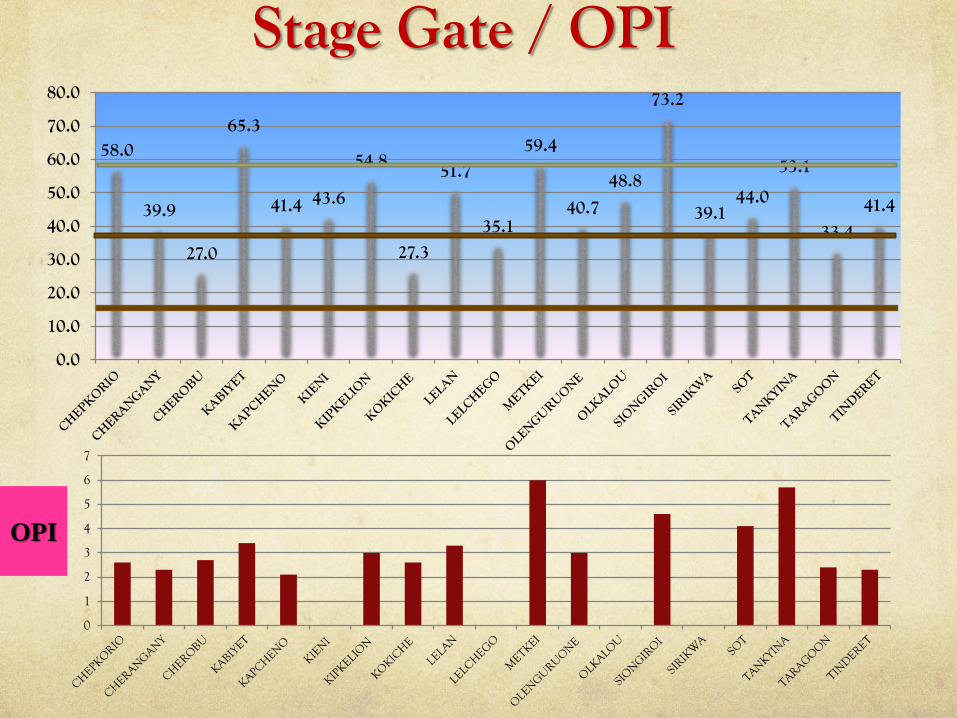
Stage Gate / OPI
58.0
39.9
27.0
65.3
41.4 43.6
54.8
27.3
51.7
35.1
59.4
40.7
48.8
73.2
39.1 44.0
53.1
33.4
41.4
0.0
10.0
20.0
30.0
40.0
50.0
60.0
70.0
80.0
0
1
2
3
4
5
6
7
OPI
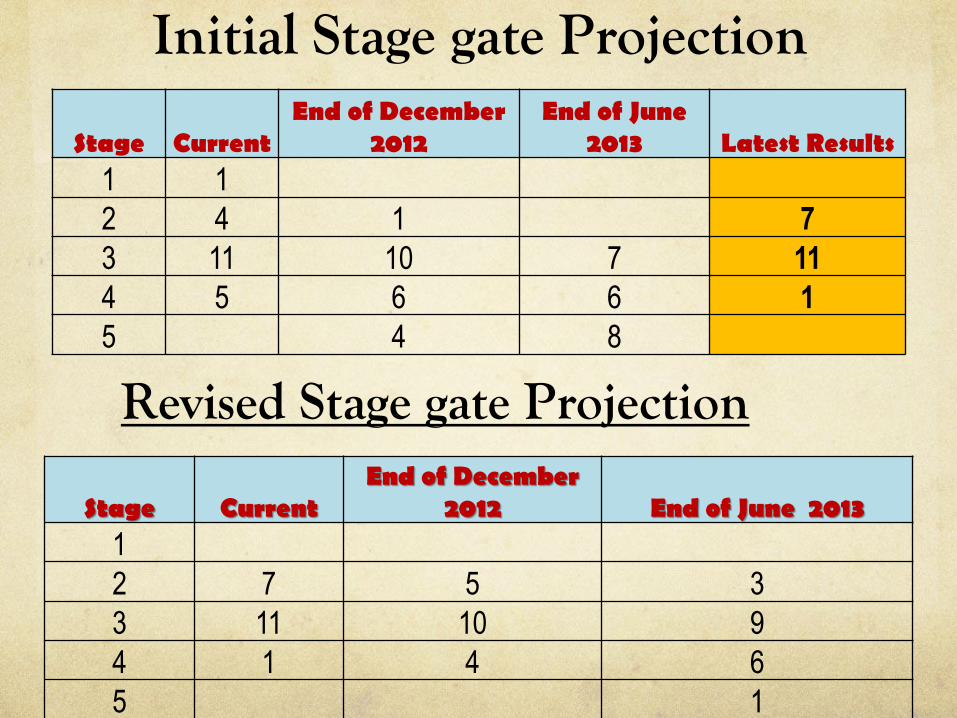
Initial Stage gate Projection
Stage Current End of December
2012 End of June 2013 1
2 7 5 3
3 11 10 9
4 1 4 6
5 1
Stage Current End of December
2012 End of June
2013 Latest Results 1 1
2 4 1 7
3 11 10 7 11
4 5 6 6 1
5 4 8
Revised Stage gate Projection
Inputs process on CE Strategy
Sharing of the results with respective DFBAs
Reviewing the AOPs for respective sites
Key objectives & activities remain as they are
Objective 1: Transition DFBA – Chilling Plants to efficient and
competitive dairy hubs
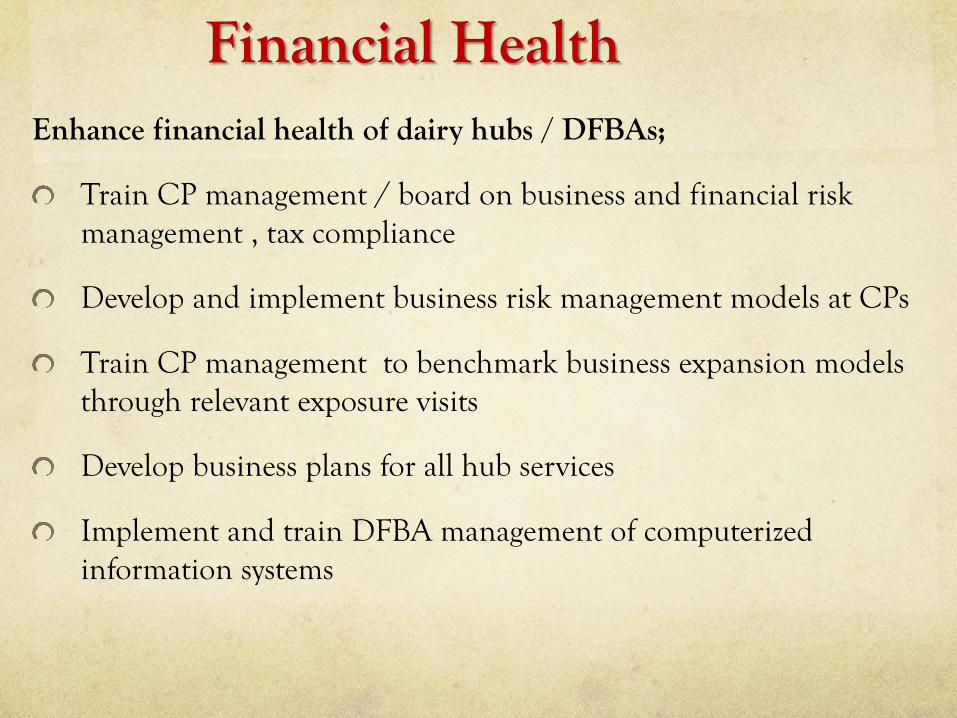
Financial Health Enhance financial health of dairy hubs / DFBAs;
Train CP management / board on business and financial risk management , tax compliance
Develop and implement business risk management models at CPs
Train CP management to benchmark business expansion models through relevant exposure visits
Develop business plans for all hub services
Implement and train DFBA management of computerized information systems
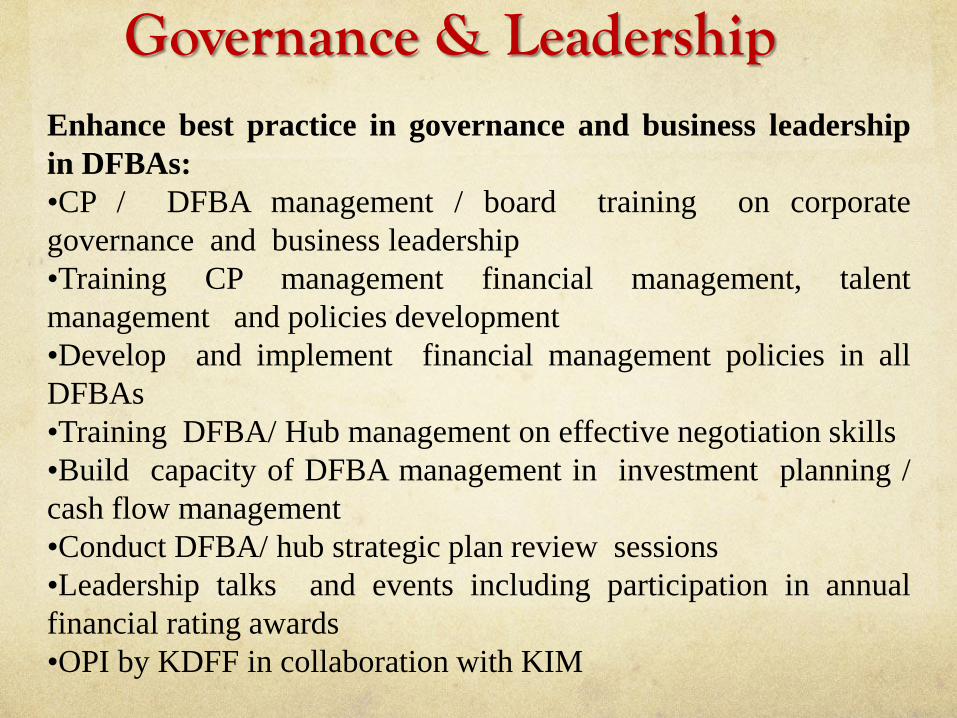
Governance & Leadership Enhance best practice in governance and business leadership
in DFBAs:
•CP / DFBA management / board training on corporate
governance and business leadership
•Training CP management financial management, talent
management and policies development
•Develop and implement financial management policies in all
DFBAs
•Training DFBA/ Hub management on effective negotiation skills
•Build capacity of DFBA management in investment planning /
cash flow management
•Conduct DFBA/ hub strategic plan review sessions
•Leadership talks and events including participation in annual
financial rating awards
•OPI by KDFF in collaboration with KIM
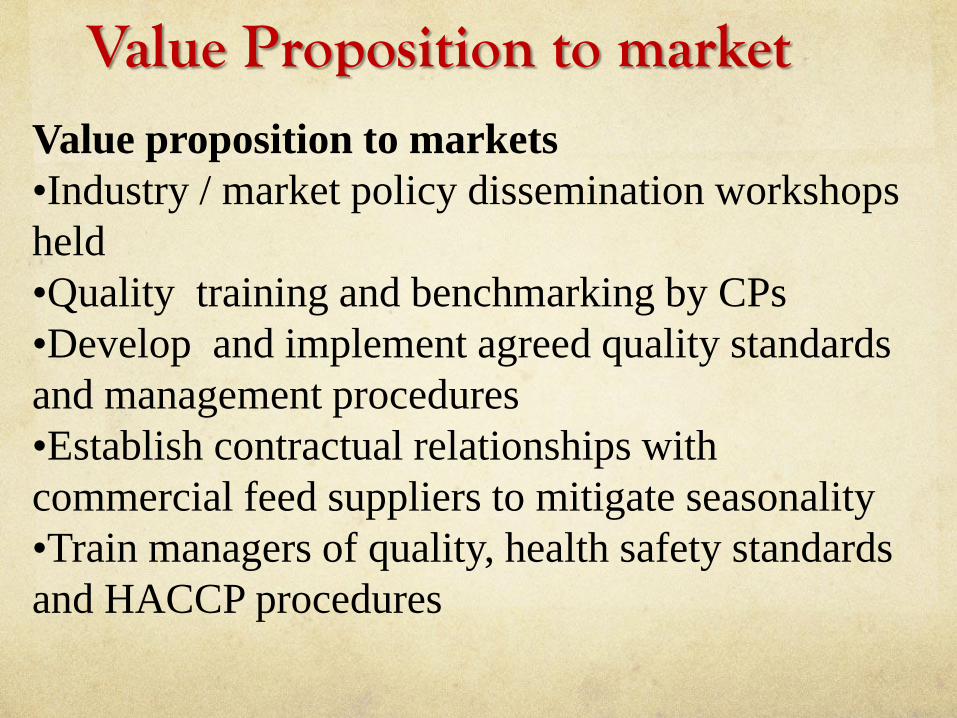
Value Proposition to market
Value proposition to markets
•Industry / market policy dissemination workshops
held
•Quality training and benchmarking by CPs
•Develop and implement agreed quality standards
and management procedures
•Establish contractual relationships with
commercial feed suppliers to mitigate seasonality
•Train managers of quality, health safety standards
and HACCP procedures
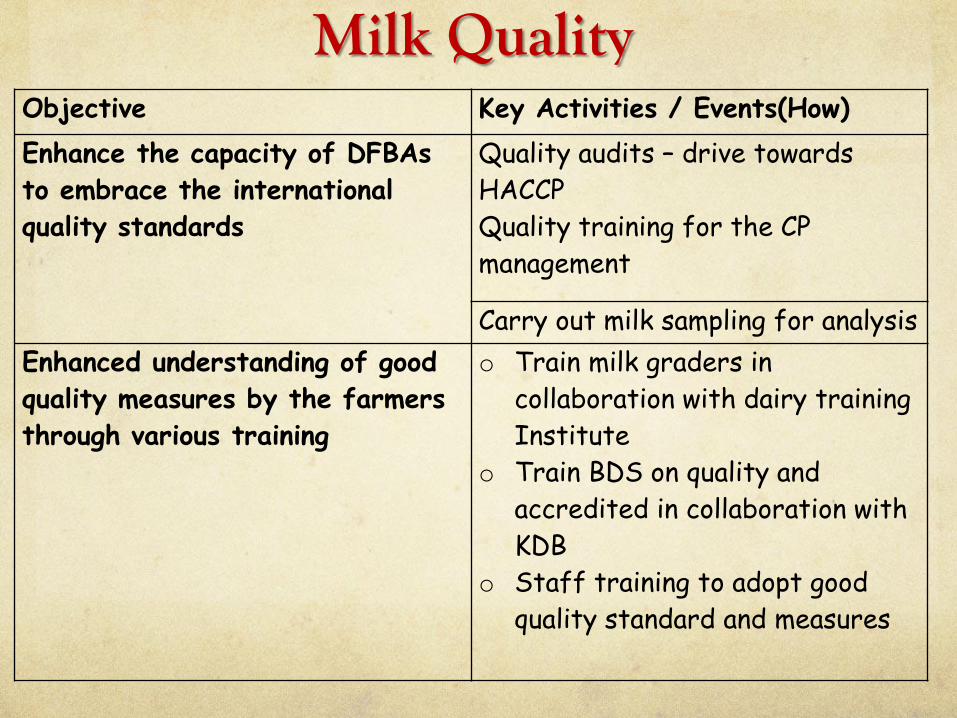
Milk Quality Objective Key Activities / Events(How)
Enhance the capacity of DFBAs
to embrace the international
quality standards
Quality audits – drive towards
HACCP
Quality training for the CP
management
Carry out milk sampling for analysis
Enhanced understanding of good
quality measures by the farmers
through various training
o Train milk graders in
collaboration with dairy training
Institute
o Train BDS on quality and
accredited in collaboration with
KDB
o Staff training to adopt good
quality standard and measures

Objective 2: Strengthen the Capacity of DFBAs to provide sustainable
extension services to farmers:
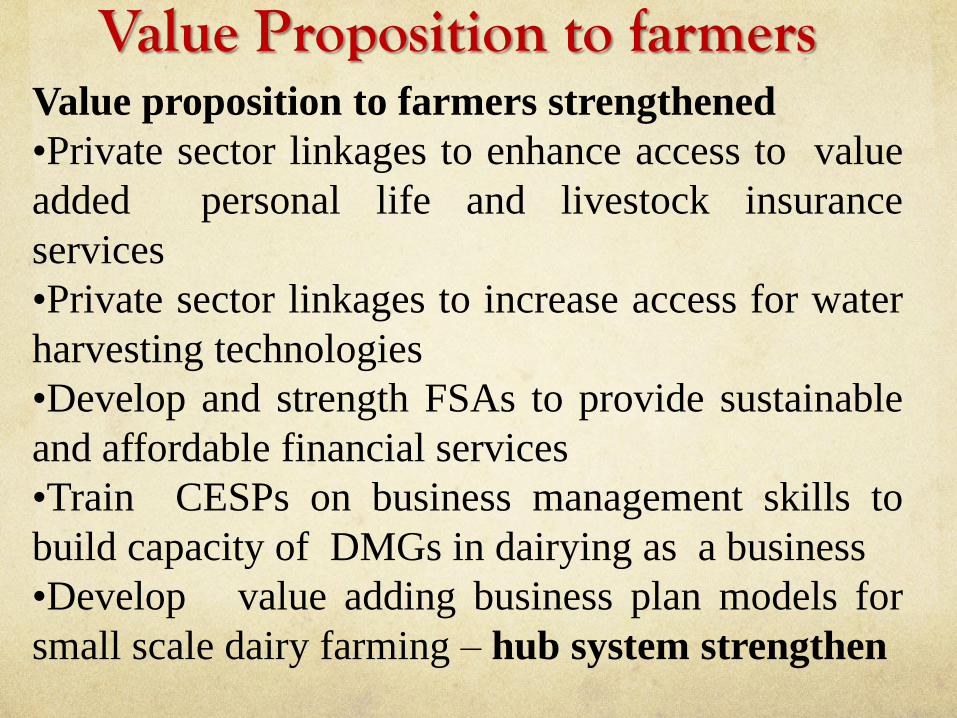
Value Proposition to farmers Value proposition to farmers strengthened
•Private sector linkages to enhance access to value
added personal life and livestock insurance
services
•Private sector linkages to increase access for water
harvesting technologies
•Develop and strength FSAs to provide sustainable
and affordable financial services
•Train CESPs on business management skills to
build capacity of DMGs in dairying as a business
•Develop value adding business plan models for
small scale dairy farming – hub system strengthen
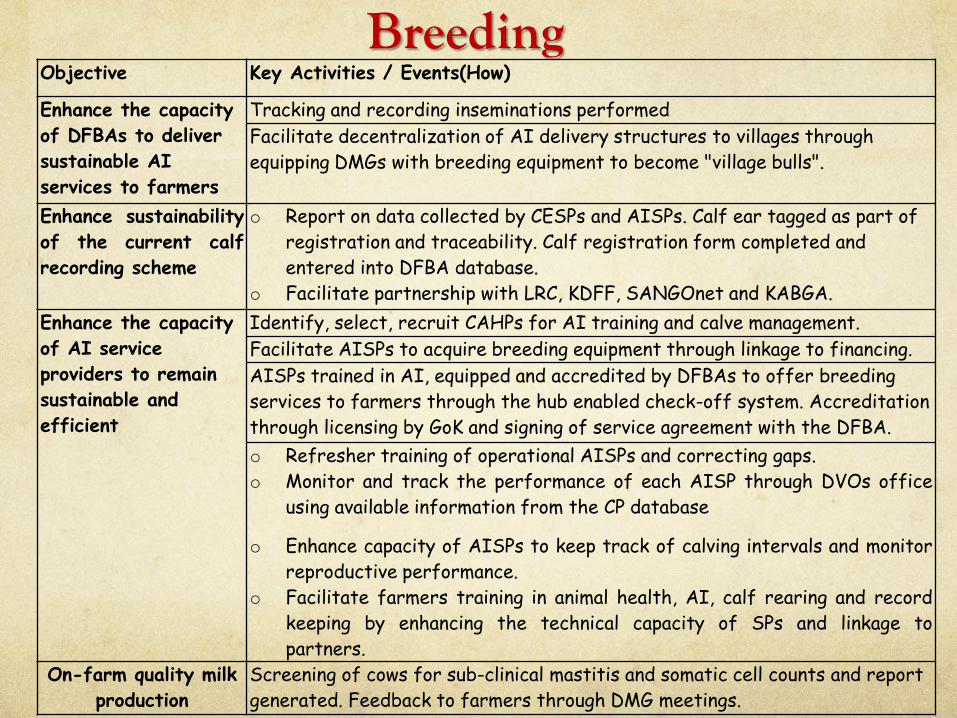
Breeding Objective Key Activities / Events(How)
Enhance the capacity
of DFBAs to deliver
sustainable AI
services to farmers
Tracking and recording inseminations performed
Facilitate decentralization of AI delivery structures to villages through
equipping DMGs with breeding equipment to become "village bulls".
Enhance sustainability
of the current calf
recording scheme
o Report on data collected by CESPs and AISPs. Calf ear tagged as part of
registration and traceability. Calf registration form completed and
entered into DFBA database.
o Facilitate partnership with LRC, KDFF, SANGOnet and KABGA.
Enhance the capacity
of AI service
providers to remain
sustainable and
efficient
Identify, select, recruit CAHPs for AI training and calve management.
Facilitate AISPs to acquire breeding equipment through linkage to financing.
AISPs trained in AI, equipped and accredited by DFBAs to offer breeding
services to farmers through the hub enabled check-off system. Accreditation
through licensing by GoK and signing of service agreement with the DFBA.
o Refresher training of operational AISPs and correcting gaps.
o Monitor and track the performance of each AISP through DVOs office
using available information from the CP database
o Enhance capacity of AISPs to keep track of calving intervals and monitor
reproductive performance.
o Facilitate farmers training in animal health, AI, calf rearing and record
keeping by enhancing the technical capacity of SPs and linkage to
partners.
On-farm quality milk
production
Screening of cows for sub-clinical mastitis and somatic cell counts and report
generated. Feedback to farmers through DMG meetings.
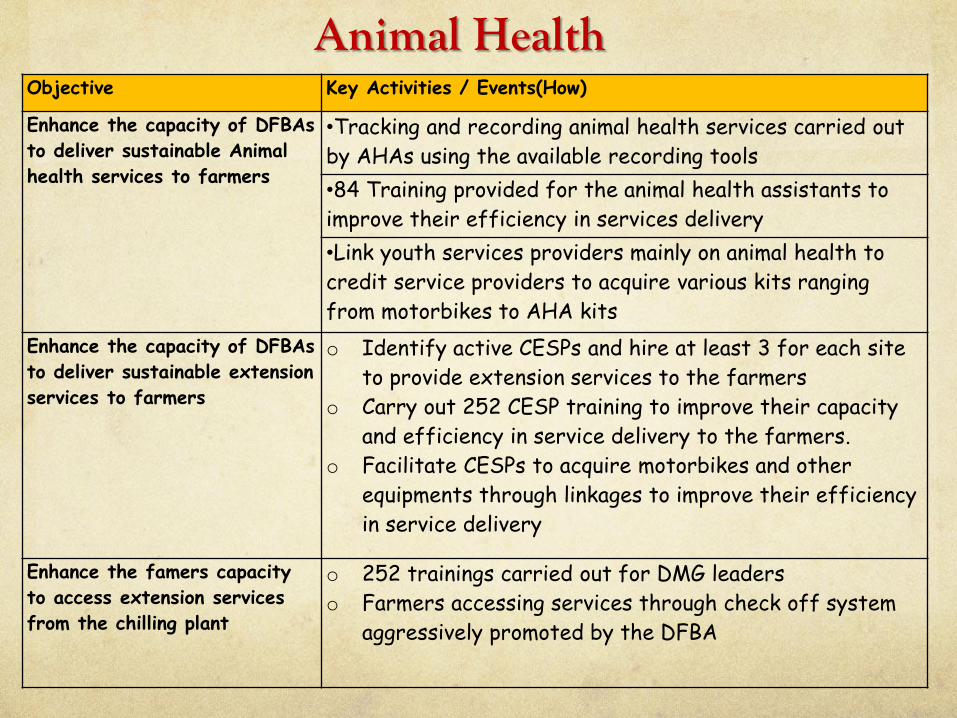
Animal Health Objective Key Activities / Events(How)
Enhance the capacity of DFBAs
to deliver sustainable Animal
health services to farmers
•Tracking and recording animal health services carried out
by AHAs using the available recording tools
•84 Training provided for the animal health assistants to
improve their efficiency in services delivery
•Link youth services providers mainly on animal health to
credit service providers to acquire various kits ranging
from motorbikes to AHA kits
Enhance the capacity of DFBAs
to deliver sustainable extension
services to farmers
o Identify active CESPs and hire at least 3 for each site
to provide extension services to the farmers
o Carry out 252 CESP training to improve their capacity
and efficiency in service delivery to the farmers.
o Facilitate CESPs to acquire motorbikes and other
equipments through linkages to improve their efficiency
in service delivery
Enhance the famers capacity
to access extension services
from the chilling plant
o 252 trainings carried out for DMG leaders
o Farmers accessing services through check off system
aggressively promoted by the DFBA
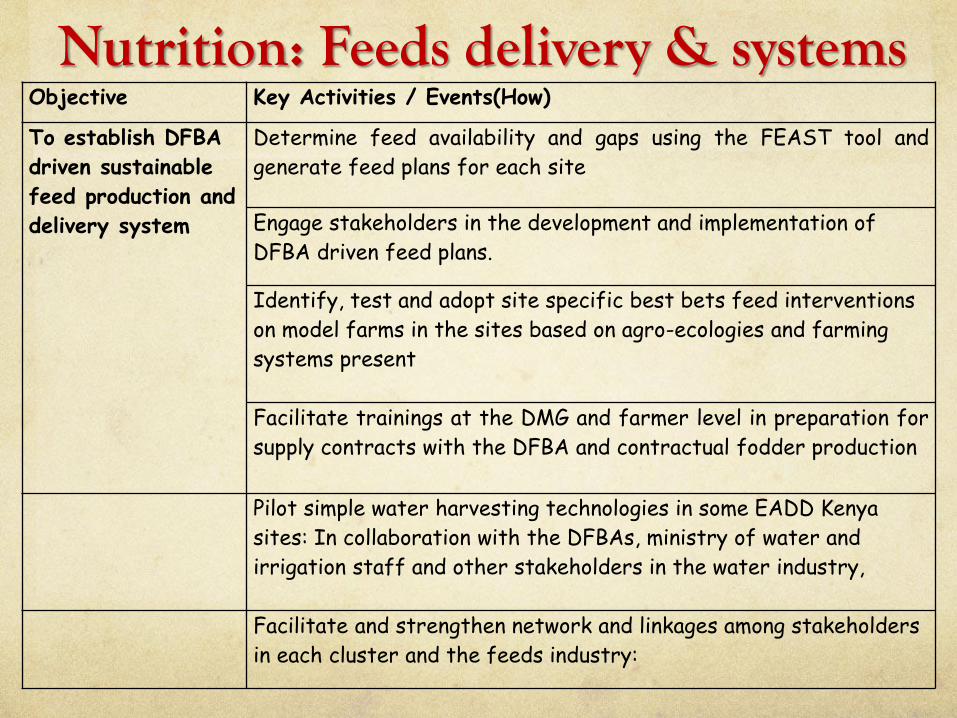
Nutrition: Feeds delivery & systems Objective Key Activities / Events(How)
To establish DFBA
driven sustainable
feed production and
delivery system
Determine feed availability and gaps using the FEAST tool and
generate feed plans for each site
Engage stakeholders in the development and implementation of
DFBA driven feed plans.
Identify, test and adopt site specific best bets feed interventions
on model farms in the sites based on agro-ecologies and farming
systems present
Facilitate trainings at the DMG and farmer level in preparation for
supply contracts with the DFBA and contractual fodder production
Pilot simple water harvesting technologies in some EADD Kenya
sites: In collaboration with the DFBAs, ministry of water and
irrigation staff and other stakeholders in the water industry,
Facilitate and strengthen network and linkages among stakeholders
in each cluster and the feeds industry:
Thank You!
Related Documents