A Project Report On Stability Study of Important Metal Organic Frameworks (MOFs) and a Review on their Gas Adsorption Properties Submitted by Vinay Kumar Agarwal (Roll No: 108CH008) In partial fulfillment of the requirements for the degree in Bachelor of Technology in Chemical Engineering Under the guidance of Dr. Pradip Chowdhury Department of Chemical Engineering National Institute of Technology Rourkela May, 2012

Welcome message from author
This document is posted to help you gain knowledge. Please leave a comment to let me know what you think about it! Share it to your friends and learn new things together.
Transcript
A
Project Report
On
Stability Study of Important Metal Organic Frameworks
(MOFs) and a Review on their Gas Adsorption Properties
Submitted by
Vinay Kumar Agarwal
(Roll No: 108CH008)
In partial fulfillment of the requirements for the degree in
Bachelor of Technology in Chemical Engineering
Under the guidance of
Dr. Pradip Chowdhury
Department of Chemical Engineering
National Institute of Technology Rourkela
May, 2012
II
CERTIFICATE
This is certified that the work contained in the thesis entitled “Stability Study of Important
Metal Organic Frameworks (MOFs) and a Review on their Gas Adsorption Properties,”
submitted by Vinay Kumar Agarwal (108CH008), has been carried out under my supervision
and this work has not been submitted elsewhere for a degree.
____________________
Date:
Place: (Thesis Supervisor)
Dr. Pradip Chowdhury
Assistant Professor, Department of
Chemical Engineering
NIT Rourkela
III
Acknowledgements
First and the foremost, I would like to offer my sincere gratitude to my thesis supervisor, Dr.
Pradip Chowdhury for his immense interest and enthusiasm on the project. His technical
prowess and vast knowledge on diverse fields left quite an impression on me. He was always
accessible and worked for hours with me. Although the journey was beset with complexities but
I always found his helping hand. He has been a constant source of inspiration for me.
I am also thankful to all faculties and support staff of Department of Chemical
Engineering, National Institute of Technology Rourkela, for their constant help and extending
the departmental facilities for carrying out my project work.
I would like to extend my sincere thanks to my friends and colleagues. Last but not the least, I
wish to profoundly acknowledge my parents for their constant support.
________________________
(Vinay Kumar Agarwal)
108CH008
IV
ABSTRACT
Metal Organic Frameworks (or, MOFs) have shown tremendous potential in adsorptive
separation applications and gas storage owing to some of their extraordinary features in terms of
specific surface area, pore volume, low to moderate heat of adsorption and fairly uniform pore
size distribution. But, the success or failure of any adsorbent material largely depends on their
stability in varying experimental conditions. In this work, we have highlighted the synthesis of 3
most versatile MOFs reported till date viz. Cu-BTC (or, HKUST-1), Cr-BDC (or, MIL-101) and
Zn-BDC (or, MOF-5). Each of these MOFs after their successful synthesis and characterization
were exposed to a regulated environmental condition to study the effect of moisture sensitivity.
Such a study is particularly important since any real time experiment with MOF is bound to
come to terms with varying degree of moisture or water vapor, especially when exposed for
longer duration. After detailed experimentation we concluded that a controlled exposure to
ambient conditions didn’t have a severe effect on MOF’s thermal stability. Cr-BDC was found to
be taking up more moisture during the course of time as compared to Cu-BTC and Zn-BDC. The
degree of crystallinity appeared to be reduced over the time interval and surface morphology too
gets affected.
Moreover, we have carried out a comprehensive review of 3 very important industrially and
environmentally important gases viz. H2, CO and CO2 on these three MOF matrices. The reason
behind choosing theses gases stems out from the fact that H2 is projected as a future fuel which
may very well replace the conventional fossil fuels, both CO2 and CO are the most important
green house gases and their emission needs to be effectively arrested, mixture of these gases are
emitted from various sources e.g. steam reforming of naphtha, partial oxidation of hydrocarbons,
metallurgical plants etc. Apart from these facts, physical properties of each of them are quite
different. H2 is a non-polar gas whereas CO has a permanent dipole moment and CO2 has a
quadrupole moment. Studying the effects of these physical properties could be interesting from a
fundamental point of view to understand the adsorption phenomenon. The retrieved experimental
data from literature was model fit using standard isotherm models viz. Langmuir, Freundlich,
Freundlich-Langmuir, Dual Site Langmuir (DSL) and Virial models. Additionally, a comparative
V
study between simulation data (available in literature) and experimental data (at same conditions)
was carried out for a proper validation. CO was selected on the basis of its polarity and CH4 was
chosen since it is non-polar. The adsorbent for the study was Cu-BTC.
Our findings are summarized as:
(I) All the isotherm models are not equally efficient in predicting the adsorption behavior in low
and high pressure regime. Freundlich-Langmuir model is seen to be the best in explaining the
adsorption behavior irrespective of the type of probe or adsorbent surface.
(II) The experimental H2 adsorption data as reported by various researchers varied considerably
from lab to lab and H2 adsorption on none of the adsorbents studied in this work satisfies the
Department of Energy (DoE) target of 6.5 wt%.
(III) Cr-BDC (or, MIL-101) showed the highest affinity for CO2. This uptake of CO2 is the
highest reported till date.
(IV) Although experimental data on CO adsorption on any MOF material is scarce, but still
within our review, we have found Cr-BDC to have the highest loading of CO. The higher loading
can be attributed to very high surface area (ca. 3000 m2 g
-1) for Cr-BDC amongst the studied
MOFs.
(V) The comparison of simulation with experimental data of CO and CH4 on Cu-BTC has shown
that for polar molecule e.g. CO, simulation data under predicts the experimental data whereas in
the higher loading region simulation data over predicts. This is less marked for non-polar gas like
CH4. It is worth mentioning that even though there are variations in simulation result predictions
with experimental data but still Grand Canonical Monte Carlo (GCMC) simulation is a strong
method in predicting experimental excess adsorption data particularly when total pore volume
information and single crystal XRD data is available.
VI
CONTENTS
PAGE NO.
Abstract IV
List of Tables IX
List of Figures XI
List of Symbols XIV
CHAPTER 1: Introduction 1
1.1 Prelude 1
1.2 Types of adsorption 2
1.2.1 Physical Adsorption or Physisorption 2
1.2.2Chemical Adsorption or Chemisorption 2
1.3 Novel Adsorbents 2
1.4Background of present research work 4
1.4.1 Selection of MOF 4
1.4.2 Selection of Gases 5
1.5 Research Objectives 5
CHAPTER 2: Literature Review 7
2.1 Metal Organic Frameworks (MOFs) 7
2.1.1 Brief Review 7
2.1.2 MOF Architecture 8
2.1.3 Salient Features of MOFs 10
2.1.4 Important MOFs 10
VII
2.2 The Adsorptive Gases or Probe Molecules 12
CHAPTER 3: Theory on Adsorption Isotherms and Measurements 17
3.1 Adsorption Isotherms 17
3.1.1 Types of Isotherms 18
3.2 Isotherm Models 20
3.2.1 Freundlich Adsorption Isotherm 20
3.2.2 Langmuir Adsorption Isotherm 21
3.2.3 Freundlich-Langmuir Adsorption Isotherm 22
3.2.4 Dual Site Langmuir Isotherm 22
3.2.5 Virial Isotherm 23
3.2.6 Virial-Langmuir Isotherm 24
3.3 Measurement of Adsorption Isotherm 25
3.3.1 Pure Gas Adsorption Measurements Using 25
Gravimetry
CHAPTER 4: Experimental Works and Data Retrieval 27
4.1 Synthesis of Cu-BTC 27
4.2 Synthesis of Cr-BDC 27
4.3 Synthesis of Zn-BDC 28
4.4 Characterization 28
4.5 Stability Analysis 28
4.6 Data Retrieval 29
CHAPTER 5: Results and Discussion 30
5.1 Comparison of Pure Gas Adsorption 30
5.2 Comparison of Experimental data with Simulation data 42
5.3 Stability Study of Synthesized MOFs 47

VIII
CHAPTER 6: Conclusion and Future Works 53
References 55
Appendix 62
IX
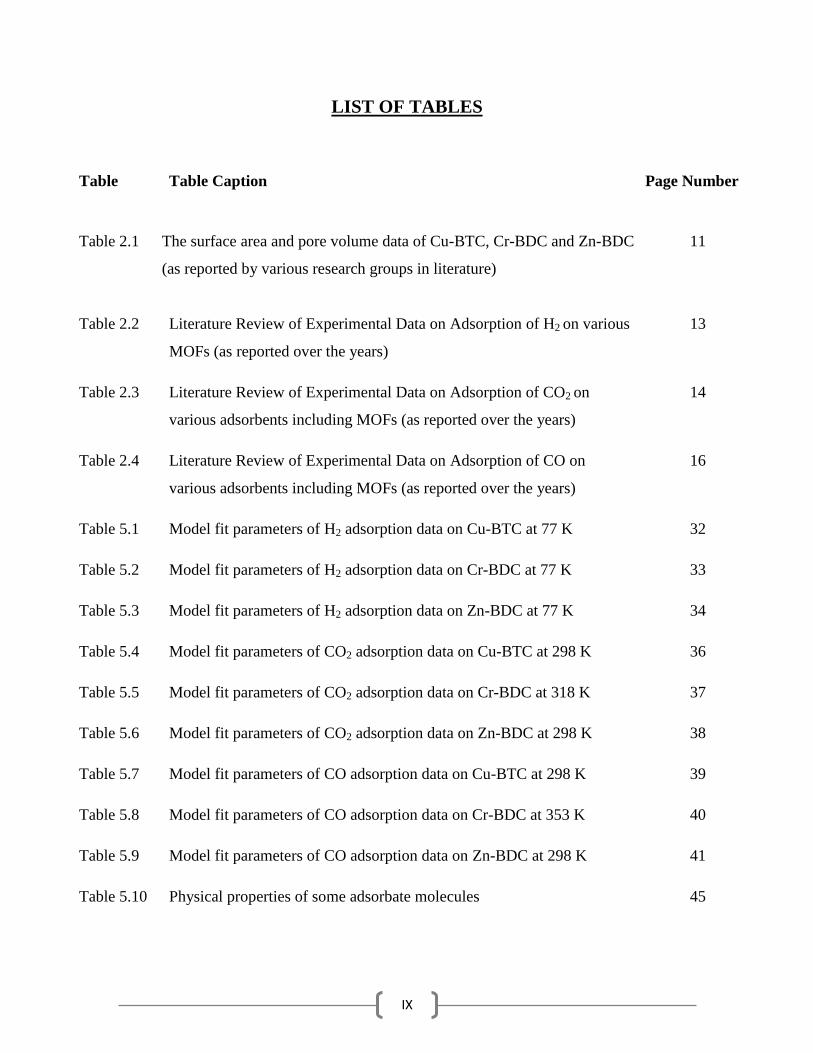
LIST OF TABLES
Table Table Caption Page Number
Table 2.1 The surface area and pore volume data of Cu-BTC, Cr-BDC and Zn-BDC
(as reported by various research groups in literature)
11
Table 2.2 Literature Review of Experimental Data on Adsorption of H2 on various
MOFs (as reported over the years)
13
Table 2.3 Literature Review of Experimental Data on Adsorption of CO2 on
various adsorbents including MOFs (as reported over the years)
14
Table 2.4 Literature Review of Experimental Data on Adsorption of CO on
various adsorbents including MOFs (as reported over the years)
16
Table 5.1 Model fit parameters of H2 adsorption data on Cu-BTC at 77 K 32
Table 5.2 Model fit parameters of H2 adsorption data on Cr-BDC at 77 K 33
Table 5.3 Model fit parameters of H2 adsorption data on Zn-BDC at 77 K 34
Table 5.4 Model fit parameters of CO2 adsorption data on Cu-BTC at 298 K 36
Table 5.5 Model fit parameters of CO2 adsorption data on Cr-BDC at 318 K 37
Table 5.6 Model fit parameters of CO2 adsorption data on Zn-BDC at 298 K 38
Table 5.7 Model fit parameters of CO adsorption data on Cu-BTC at 298 K 39
Table 5.8 Model fit parameters of CO adsorption data on Cr-BDC at 353 K 40
Table 5.9 Model fit parameters of CO adsorption data on Zn-BDC at 298 K 41
Table 5.10 Physical properties of some adsorbate molecules 45
X
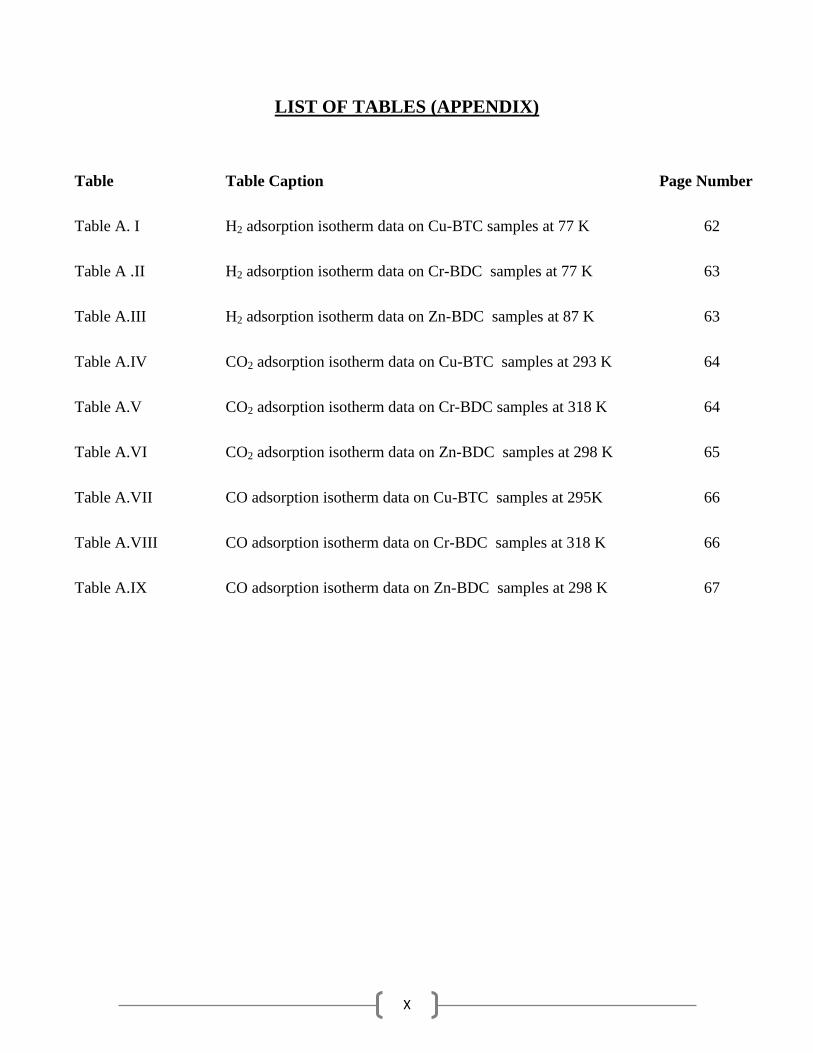
LIST OF TABLES (APPENDIX)
Table Table Caption Page Number
Table A. I H2 adsorption isotherm data on Cu-BTC samples at 77 K 62
Table A .II H2 adsorption isotherm data on Cr-BDC samples at 77 K 63
Table A.III H2 adsorption isotherm data on Zn-BDC samples at 87 K 63
Table A.IV CO2 adsorption isotherm data on Cu-BTC samples at 293 K 64
Table A.V CO2 adsorption isotherm data on Cr-BDC samples at 318 K 64
Table A.VI CO2 adsorption isotherm data on Zn-BDC samples at 298 K 65
Table A.VII CO adsorption isotherm data on Cu-BTC samples at 295K 66
Table A.VIII CO adsorption isotherm data on Cr-BDC samples at 318 K 66
Table A.IX CO adsorption isotherm data on Zn-BDC samples at 298 K
67
XI
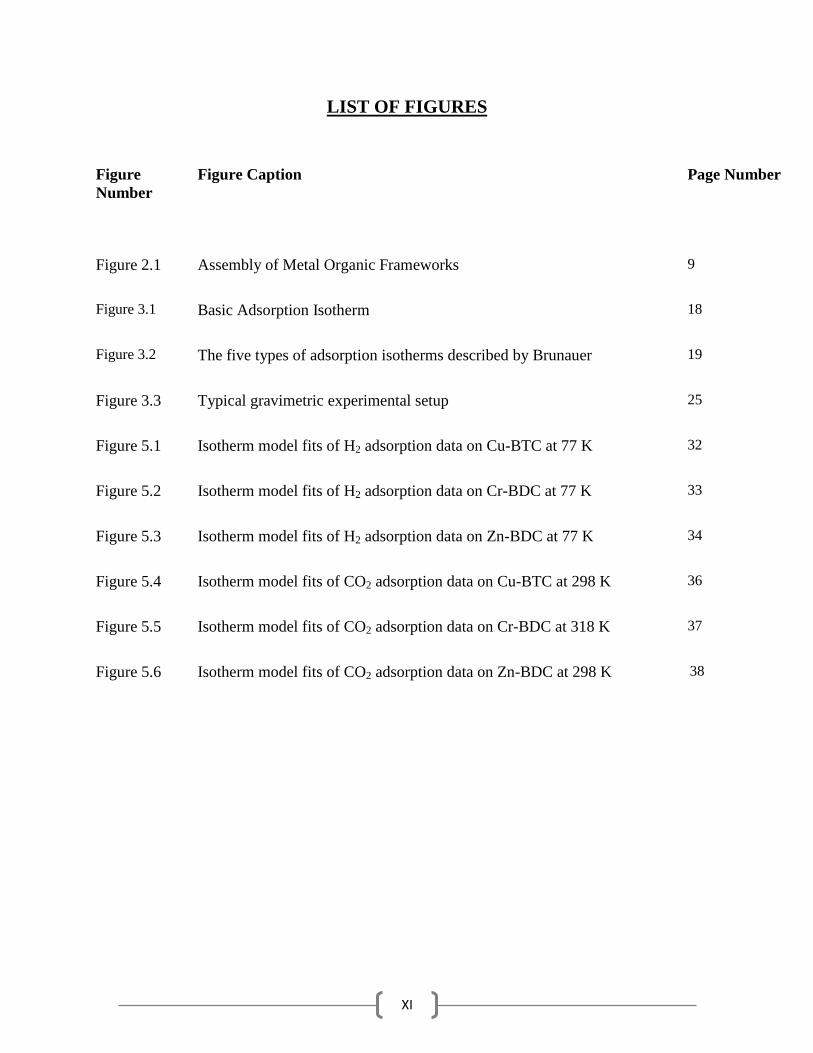
LIST OF FIGURES
Figure
Number
Figure Caption Page Number
Figure 2.1 Assembly of Metal Organic Frameworks 9
Figure 3.1 Basic Adsorption Isotherm 18
Figure 3.2 The five types of adsorption isotherms described by Brunauer 19
Figure 3.3 Typical gravimetric experimental setup 25
Figure 5.1 Isotherm model fits of H2 adsorption data on Cu-BTC at 77 K 32
Figure 5.2 Isotherm model fits of H2 adsorption data on Cr-BDC at 77 K 33
Figure 5.3 Isotherm model fits of H2 adsorption data on Zn-BDC at 77 K 34
Figure 5.4 Isotherm model fits of CO2 adsorption data on Cu-BTC at 298 K 36
Figure 5.5 Isotherm model fits of CO2 adsorption data on Cr-BDC at 318 K 37
Figure 5.6 Isotherm model fits of CO2 adsorption data on Zn-BDC at 298 K 38
XII
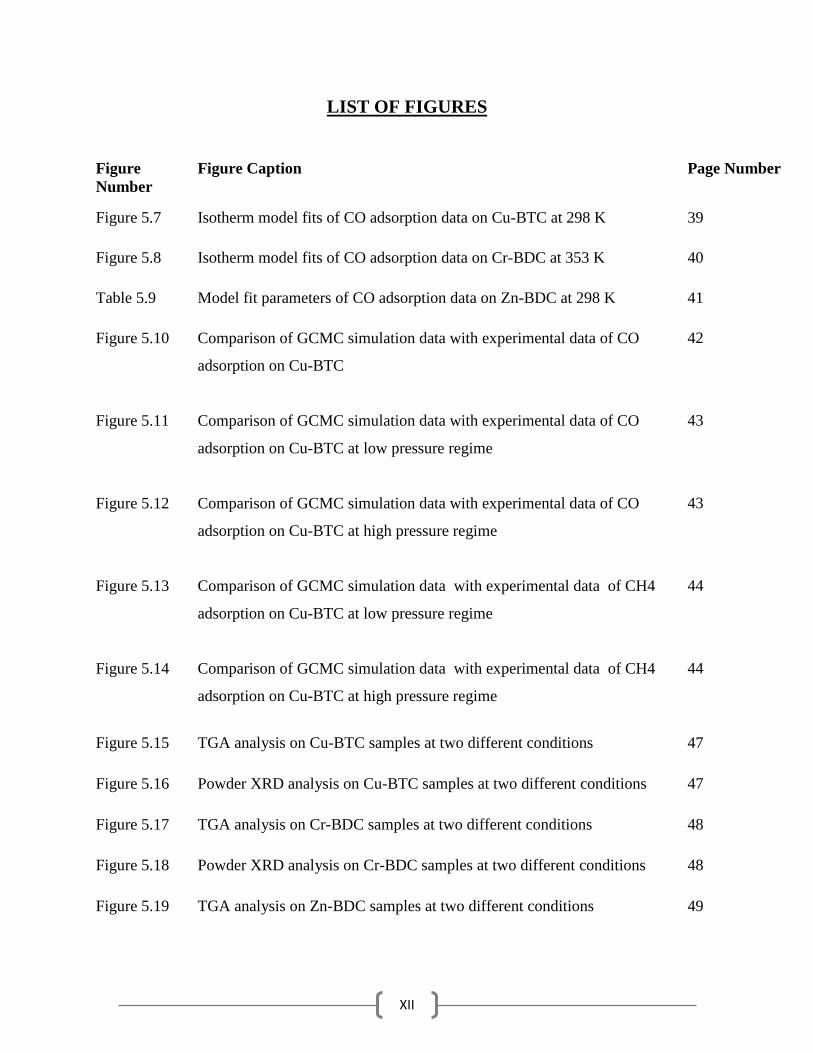
LIST OF FIGURES
Figure
Number
Figure Caption Page Number
Figure 5.7 Isotherm model fits of CO adsorption data on Cu-BTC at 298 K 39
Figure 5.8 Isotherm model fits of CO adsorption data on Cr-BDC at 353 K 40
Table 5.9 Model fit parameters of CO adsorption data on Zn-BDC at 298 K 41
Figure 5.10 Comparison of GCMC simulation data with experimental data of CO
adsorption on Cu-BTC
42
Figure 5.11 Comparison of GCMC simulation data with experimental data of CO
adsorption on Cu-BTC at low pressure regime
43
Figure 5.12 Comparison of GCMC simulation data with experimental data of CO
adsorption on Cu-BTC at high pressure regime
43
Figure 5.13 Comparison of GCMC simulation data with experimental data of CH4
adsorption on Cu-BTC at low pressure regime
44
Figure 5.14 Comparison of GCMC simulation data with experimental data of CH4
adsorption on Cu-BTC at high pressure regime
44
Figure 5.15 TGA analysis on Cu-BTC samples at two different conditions 47
Figure 5.16 Powder XRD analysis on Cu-BTC samples at two different conditions 47
Figure 5.17 TGA analysis on Cr-BDC samples at two different conditions 48
Figure 5.18 Powder XRD analysis on Cr-BDC samples at two different conditions 48
Figure 5.19 TGA analysis on Zn-BDC samples at two different conditions 49

XIII
Figure 5.20 Powder XRD analysis of Zn-BDC samples at two different conditions 49
Figure 5.21 SEM images of Cu-BTC Samples 51
Figure 5.22 SEM images of Cr-BDC Samples 52
Figure 5.23 SEM images of Zn-BDC Samples 52
XIV
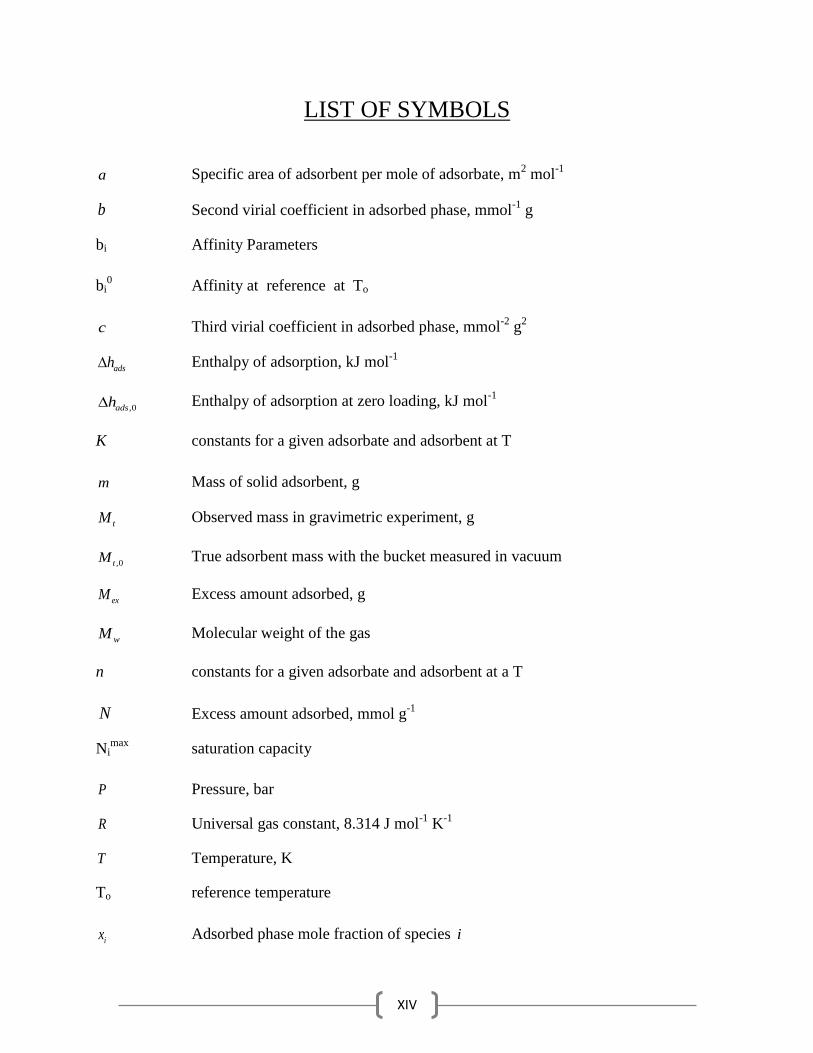
LIST OF SYMBOLS
a Specific area of adsorbent per mole of adsorbate, m2 mol
-1
b Second virial coefficient in adsorbed phase, mmol-1
g
bi Affinity Parameters
bi0 Affinity at reference at To
c Third virial coefficient in adsorbed phase, mmol-2
g2
adsh Enthalpy of adsorption, kJ mol-1
,0adsh Enthalpy of adsorption at zero loading, kJ mol-1
K constants for a given adsorbate and adsorbent at T
m Mass of solid adsorbent, g
tM Observed mass in gravimetric experiment, g
,0tM True adsorbent mass with the bucket measured in vacuum
exM Excess amount adsorbed, g
wM Molecular weight of the gas
n constants for a given adsorbate and adsorbent at a T
N Excess amount adsorbed, mmol g-1
Nimax
saturation capacity
P Pressure, bar
R Universal gas constant, 8.314 J mol-1
K-1
T Temperature, K
To reference temperature
ix Adsorbed phase mole fraction of species i

XV
bucketV Bucket volume, cm3
buoyancyV Buoyancy volume, cm3
Z Compressibility factor for the adsorbed phase
GREEK LETTERS
Fractional coverage of the surface
α Langmuir constant
ρgas
Density of gas
Henry constant, mmol g-1
bar-1
1
CHAPTER 1
INTRODUCTION
This chapter highlights the basics on adsorption science and technology. It focuses on novel
materials called metal organic frameworks (or, MOFs). The background of the present thesis
work is aptly explained. The objectives are also properly highlighted.
1.1 Prelude
Separation can be defined as a process that transforms a mixture of substance into two or more
product that differs from each other in composition. The process is difficult to achieve because it
is opposite of mixing, a process favored by the second law of thermodynamics. Separation steps
accounts for the major production cost in chemical and petrochemical industry.
The surface of solid represents a discontinuity of its structure. The forces acting at the surface is
unsaturated. Hence, when the solid is exposed to a gas, the gas molecule will form bonds with it
and become attached. This phenomenon is termed as Adsorption. Adsorption is the adhesion of
molecules of gas, liquid or dissolved solids to a surface. It differs from absorption in which a
fluid permeates through or is dissolved by a liquid or a solid. Adsorption occurs because the
atoms or ions at the surface of a solid are extremely reactive. Unlike their counterparts in the
interior of the substance, they have unfulfilled valence requirements. The unused bonding
capability of the surface atoms or ions may be used to bond molecules from the gas or solution
phase to the surface of the solid. This process creates a film of the adsorbate (the molecules or
atoms being accumulated) on the surface of the adsorbent. It differs from absorption, in which a
fluid permeates or is dissolved by a liquid or solid. Forces of attraction exist between adsorbate
and adsorbent and due to these forces of attraction, heat energy is released. So adsorption is an
exothermic process [1].
2
1.2 Types of adsorption
Forces of attraction exist between adsorbate and adsorbent. These forces of attraction can be due
to Vander Waal forces of attraction which are weak forces or due to chemical bond which are
strong forces of attraction. On the basis of type of forces of attraction existing between adsorbate
and adsorbent, adsorption can be classified into two types: Physical Adsorption or Chemical
Adsorption [2].
1.2.1 Physical Adsorption or Physisorption
When the force of attraction existing between adsorbate and adsorbent are weak Vander Waal
forces of attraction, the process is called physical adsorption or Physisorption. Physical
Adsorption takes place with formation of multilayer of adsorbate on adsorbent. It has low
enthalpy of adsorption i.e. ΔH ads=20~40 kJ mol-1
.
1.2.2 Chemical Adsorption or Chemisorption
When the force of attraction existing between adsorbate and adsorbent are chemical forces of
attraction or chemical bond, the process is called chemical adsorption or chemisorption.
Chemisorption takes place with formation of unilayer of adsorbate on adsorbent. It has high
enthalpy of adsorption i.e. ΔH ads= 200~400 kJ mol-1
.
1.3 Novel Adsorbents
New materials usher new technologies. Synthesizing novel materials is always reflected as a
corner stone in technological developments. Until recently, zeolites and activated carbons are
thought to be the indispensable in adsorption based unit operations. But as the need grows for
more efficient, economical and highly specific functions, conventional adsorbents were found ill
equipped to handle such problems. Although, improved synthesis and different post-treatment
procedures of zeolites and activated carbon resulted into some of their derivatives but the need of
the hour was to design and synthesize materials that could be more effective.
3
In the quest for designing novel adsorbents, attention has been paid to develop hybrid structures
involving both inorganic and organic components by employing novel synthetic routes. The
general concept was to take advantage of both the metal coordination and functionalities of the
organic components. The concept of reticular synthesis which can be described as the process of
assembling judiciously designed rigid molecular building blocks into predetermined ordered
structures or networks, held together by strong bonding is found to be the key to the true design
of novel solid-state materials. Researchers have envisioned that to fully realize the benefits of
designing crystalline solid state frameworks the structural integrity and rigidity of the molecular
building blocks must remain unaltered throughout the construction process: key feature of
reticular synthesis [3]. The said mechanism plays a pivotal role in producing robust porous
materials by connecting rigid rod-like organic moieties with inflexible inorganic clusters acting
as joints. The length and functionalities of the organic units determine the size and chemical
environment of the resulting void spaces. Accordingly, the concept of „tailor-made‟ materials
finally realized. Appropriate selection of starting materials can give rise to myriad of different
structures. Within a short period of time a large variety of extended structures have been
successfully prepared and the collection of compounds has been given various names e.g. „co-
ordination polymers‟, „hybrid organic-inorganic materials‟, „organic zeolite analogues‟ or „metal
organic frameworks‟. Although each terminology signifies certain aspects of the materials it
encompasses but for a solid to be truly called a „Metal Organic Framework‟ or MOF, it must
possess robustness implying strong bonding, assembling units are available for modification by
organic synthesis and geometrically a well-defined structure [4].
4
1.4 Background of present research work
Some conventional well-known adsorbents include: silica gel, activated alumina, activated
carbon, carbon molecular sieves and zeolites. Each of these adsorbents has certain specific
features that have been exploited over the years in various industrially challenging
applications ranging from adsorptive gas separation/purification, ion-exchange and catalysis.
In this present context, the term „Novel‟ signifies a new class of hybrid adsorbents popularly
known as „metal organic frameworks‟ or MOFs and „covalent organic frameworks‟ or COFs.
Metal organic frameworks are relatively new class of crystalline porous material consists of
metal cluster connected by organic ligands. They are crystalline compound consisting of metal
ions/cluster coordinated to often rigid organic molecules to form one, two, three dimensional
structures that can be porous. The pore size and surface properties of these materials can be
tuned to a great extent with relative ease by choosing appropriate metal centers and organic
ligands. This structural flexibility generated interest in these materials for the application ranging
from gas storage and separation, catalysis and so forth. The main advantages of MOFs are: Good
crystallinity akin to zeolites, high porosity and structural and functional diversity.
The experimental data of gas adsorption on MOFs vary from lab to lab. Especially with H2, the
excess amount adsorbed reported by various research groups on similar surfaces varied
considerably both at cryogenic conditions as well as at room temperature. Similar observations
are also made for CO and CO2. Additionally, it is worth mentioning that each of these gases is
quite different from one another on fundamental aspects. H2 is a non-polar gas whereas CO2
possess high quadrupole moment and CO has a permanent dipole. Owing to their differences in
electrical properties, interactions of these gases with various adsorbent surfaces would be highly
interesting and attempts have been made by various research groups.
1.4.1 Selection of MOF
A careful review of the literature reveals more than 2,000 different MOF structures being
synthesized and characterized. Although the number speaks volumes about their variation in
structural configuration but not all are stable. Thermal and chemical stability, along with high
surface area is what researchers look for in a good adsorbent to be effective at the industrial
level. Cu-BTC (or HKUST-1), Cr-BDC (or MIL-101) and Zn-BDC (or, MOF-5) frameworks
5
possess all the desirable qualities that set them apart from others. Not only they have very high
specific surface areas but also show better stability. Some of their characteristic features include:
High specific surface area (~1000 to 5000 m2/g), large pore volume (~0.7-2.5 cc/g)
and light weight or low packing density
Low to moderate heat of adsorption (15-20 kJ/mol)
Good thermal and chemical stability
1.4.2 Selection of Gases
A brief illustration on each of them is highlighted below:
[A] Hydrogen: At present, carbon based fossil fuels provide ~ 80% of the world‟s energy
demands and they are the main source of the increasing level of CO2 in the atmosphere,
responsible for serious climate change. H2 being the clean and green fuel is gaining rapid
popularity as an alternate source of energy. The development of a safe and efficient hydrogen
storage system is urgently needed for the realization of hydrogen as a future fuel.
[B] Carbon dioxide and Carbon monoxide: Apart from being harmful greenhouse gases, the
mixtures of CO/CO2 are found in a variety of industrial off gases e.g. coming out of metallurgical
plants, in synthesis gas (from steam reforming), partial oxidation of many hydrocarbons and
coal. The capture and removal of these gases is important to meet environmental regulations and
adsorption can be a viable option.
1.5 Research Objectives
The main objectives of our research can be classified in the following categories:
[A] As top-down approach it is of paramount importance to have a knowledge about the details
of material synthesis and post-synthesis treatments for synthesizing a more stable and immune
MOF structure. In this work, we aimed at synthesizing 3 most versatile MOF structures viz. Cu-
BTC, Cr-BDC and Zn-BDC. Each of them would be exposed to a controlled ambient conditions
(with fairly constant relative humidity) to examine their immunity and thermal stability. Such a
study is particularly important since any real time experiment with MOF is bound to come to
6
terms with varying degree of moisture or water vapor, especially when exposed for longer
duration and hence the affect requires to be verified.
[B] A comprehensive literature review is done to make a database on adsorption of H2, CO and
CO2 on various adsorbents with special emphasis on MOFs. Consistency is maintained in
selecting the scale and units used for an ease in comparison. Judicious interpolation and
extrapolation is done wherever required for finding accurate experimental data. Such a study is
very useful and handy in getting ready-made updated information on progress made in the
experimental front with these probe molecules.
[C] The experimental data extracted from various literatures (using “windig” software) will be
tried to fit with standard isotherm models e.g. Langmuir, Freundlich, Freundlich-Langmuir,
Dual Site Langmuir (DSL) and Virial models.
[D] Being geometrically symmetrical and regular, plenty of research has been initiated on the
simulation of adsorption of various probes on many MOF surfaces. Grand Canonical Monte
Carlo simulation popularly known as GCMC is one such technique. Although, GCMC
simulations are known for their fair prediction and accuracy but still it requires to be validated by
comparing with authentic experimental data. In our present work, we aimed at comparing the
experimental data with simulation results under similar conditions for a better understanding and
validation.
7
CHAPTER 2
LITERATURE REVIEW
In this chapter a brief review on metal organic frameworks (MOFs) is given. A general overview
on adsorption of H2, CO and CO2 on various conventional and novel adsorbent materials is also
represented in tabular form. The intention is to highlight the frequency of work in this field and
gradual improvement in experimental data on adsorption of these gases on MOFs and other
conventionally known adsorbents viz. zeolites, activated carbon etc.
2.1 Metal Organic Frameworks (MOFs)
2.1.1 Brief Review
“Metal Organic Frameworks” or MOFs represent a class of novel materials that has caught the
attention of researchers owing to their great diversity in structures resulting from co-ordination
between inorganic metal atoms/ions and organic ligands as linkers. Proper selection of metal
atoms/ions and organic linkers leads to innumerable possibilities in the co-ordination geometry
with wide variation in structural architecture. A few very attractive motifs include honeycomb,
brickwall, bilayer, ladder, herringbone, diamondoid, rectangular grid, and octahedral geometries.
Metal Organic Frameworks (MOFs) which forms as a result of combination of an inorganic
metal atom/ion as a node with an organic ligand as a linker can be classified to be a relatively
new group of materials. Ever since initial reports on its synthesis, there has been a spurt in
research activities owing to some of their characteristic features. The most important features
include: extremely high specific surface area (ca. 800-5000 m2 g
-1) and large pore volume (ca.
0.8-2.5 cc g-1
), uniform pore size distribution and tunable or tailor-made pores.
8
2.1.2 MOF Architecture
The key to successfully designing metal organic frameworks lies in the use of linkers meant to
achieve desired network topologies by connecting transition-metal centers or polynuclear
clusters serving as nodes of the network. Myriad of different possibilities are there depending on
our choice of metal atoms/ions and organic linkers. Flexibility or the rigidity of the frameworks
is greatly affected by the choice of organic linker in the structure. To illustrate the complete
behavior let us consider the following example [3]
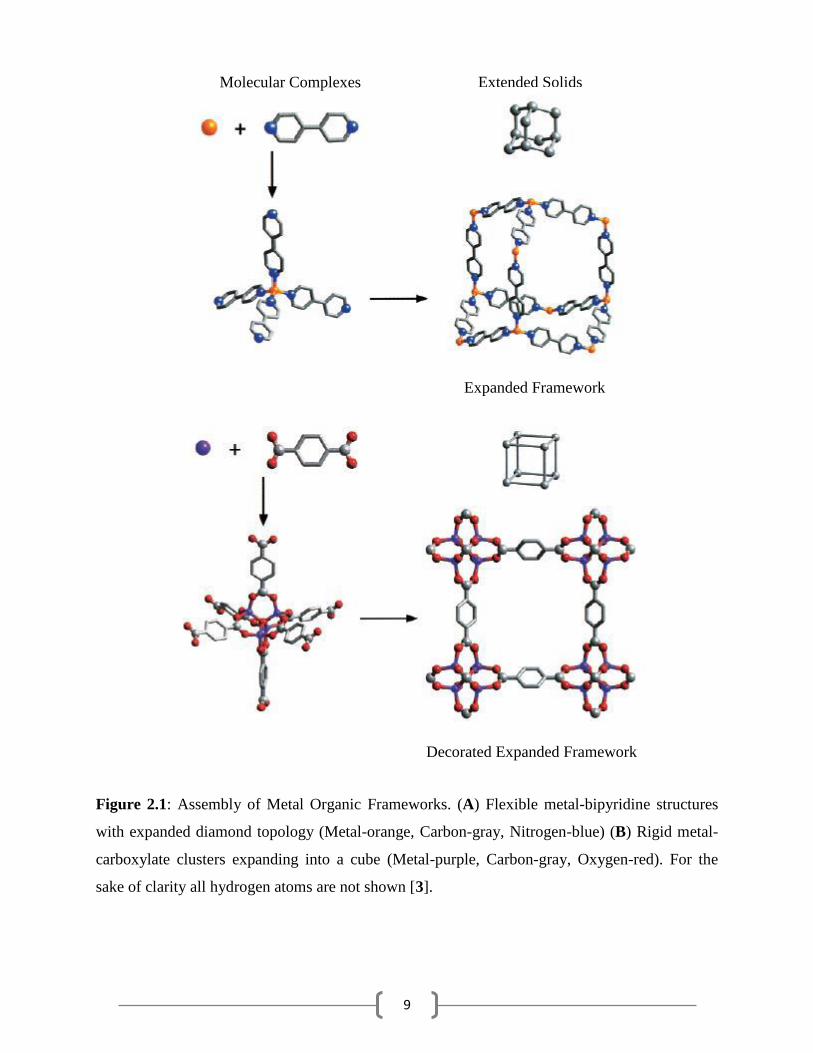
In Figure 2.1 (A), we have the assembly of a tetrahedrally coordinated metal center and a linear
organic linker like 4, 4´-bipyridine. It results in a structure with an expanded diamond topology.
Each bond of the diamond network is replaced by a sequence of bonds that expands the networks
and yields void space proportional to the length of the linker. In Figure 2.1 (B) the organic linker
is 1, 4-benzene dicarboxylate. It allows for the formation of an aggregate of metal ions into M-O-
C clusters that generally referred as secondary building units (SBUs) which finally extends into a
cube.
9
Figure 2.1: Assembly of Metal Organic Frameworks. (A) Flexible metal-bipyridine structures
with expanded diamond topology (Metal-orange, Carbon-gray, Nitrogen-blue) (B) Rigid metal-
carboxylate clusters expanding into a cube (Metal-purple, Carbon-gray, Oxygen-red). For the
sake of clarity all hydrogen atoms are not shown [3].
Extended Solids Molecular Complexes
Expanded Framework
Decorated Expanded Framework
10
2.1.3 Salient Features of MOFs
Some of the characteristic features of MOFs include:
(a) High surface area (ca. 800-5000 m2 g
-1) and pore volume (ca. 0.5-2.5 ml g
-1)
(b) Highly crystalline and can be synthesized in pure form with less crystal imperfections
(c) Uniform pore size distribution akin to zeolites and hence good molecular sieving properties
(d) Low to moderate heat of adsorption and hence can act as a good gas storage medium
(e) Low bulk packing density i.e. lighter in weight
Although MOFs have shown some remarkable features but still there are certain unresolved
issues which hindered its application at the industrial level. Most importantly, the thermal and
chemical stability of MOFs is a bottleneck which requires to be overcome. Out of an excess of
2000 MOF matrix synthesized and analyzed, very few could withstand a temperature in excess
of 300oC. The frameworks collapse and showed low robustness at moderate to high
temperatures. Moreover, frameworks also showed less immunity under aqueous and various
organic mediums. Qualitatively as well as quantitatively speaking, same MOF synthesized at
same conditions (keeping constant stoichiometry) following same recipes at times tend to yield
products with varying percentage purities. Since, percentage yields and product purities of
different batches vary; care must be taken during synthesis and post-synthesis treatments. It is
also observed that MOFs undergoing adsorption mechanism in pressure swing adsorption (PSA)
column undergo physical deformation after a few cycles or swings. The effect of high pressure is
also a cause of concern before they can be approved to be industrially more viable.
2.1.4 Important MOFs
A careful review of literature shows that out of an excess of more than 2000 variants of MOFs
reported till date: the Zn, Cu and Cr based MOFs have found a niche in the scientific
community. The most widely studied MOF series since its inception can be grouped as follows:
(I) The Isoreticular Metal Organic Frameworks or IRMOF series (MOF-5 being also
known as IRMOF-1).
11
(II) Cu-BTC or HKUST-1
(III) MatérialInstitut Lavoisier or MIL series
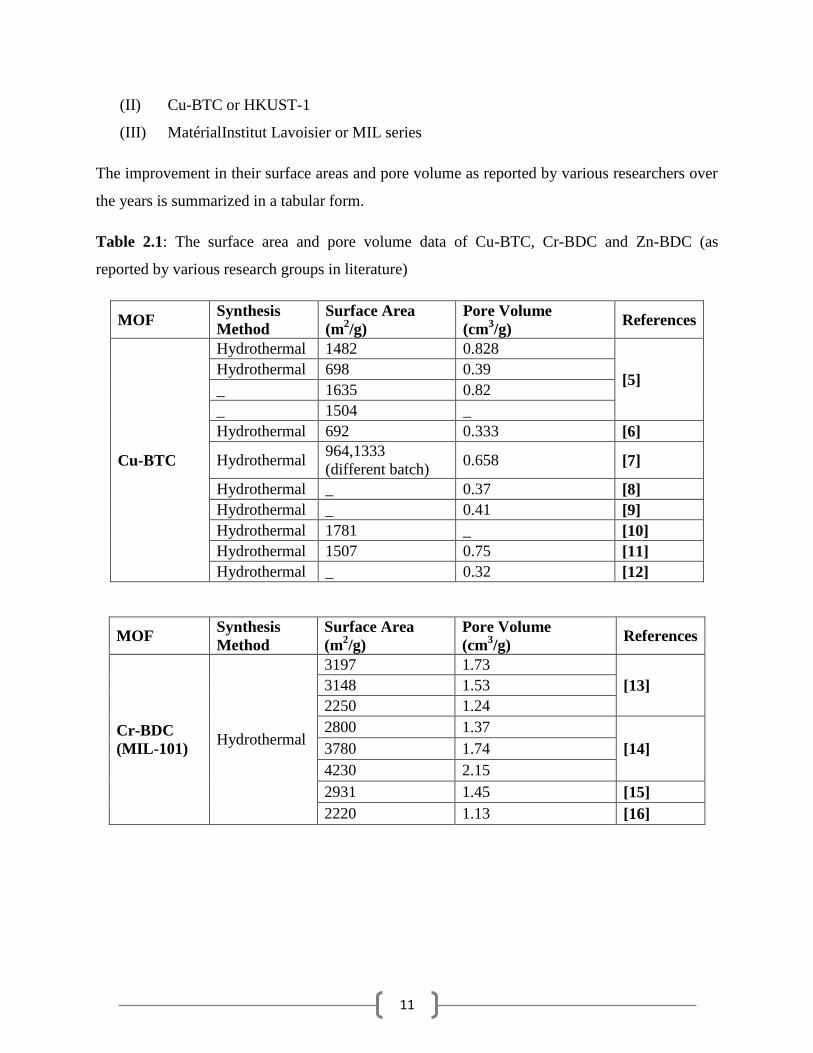
The improvement in their surface areas and pore volume as reported by various researchers over
the years is summarized in a tabular form.
Table 2.1: The surface area and pore volume data of Cu-BTC, Cr-BDC and Zn-BDC (as
reported by various research groups in literature)
MOF Synthesis
Method
Surface Area
(m2/g)
Pore Volume
(cm3/g)
References
Cu-BTC
Hydrothermal 1482 0.828
[5] Hydrothermal 698 0.39
_ 1635 0.82
_ 1504 _
Hydrothermal 692 0.333 [6]
Hydrothermal 964,1333
(different batch) 0.658 [7]
Hydrothermal _ 0.37 [8]
Hydrothermal _ 0.41 [9]
Hydrothermal 1781 _ [10]
Hydrothermal 1507 0.75 [11]
Hydrothermal _ 0.32 [12]
MOF Synthesis
Method
Surface Area
(m2/g)
Pore Volume
(cm3/g)
References
Cr-BDC
(MIL-101) Hydrothermal
3197 1.73
[13] 3148 1.53
2250 1.24
2800 1.37
[14] 3780 1.74
4230 2.15
2931 1.45 [15]
2220 1.13 [16]
12
MOF Synthesis
Method
BET
(m2/g)
Pore Volume
(cm3/g)
References
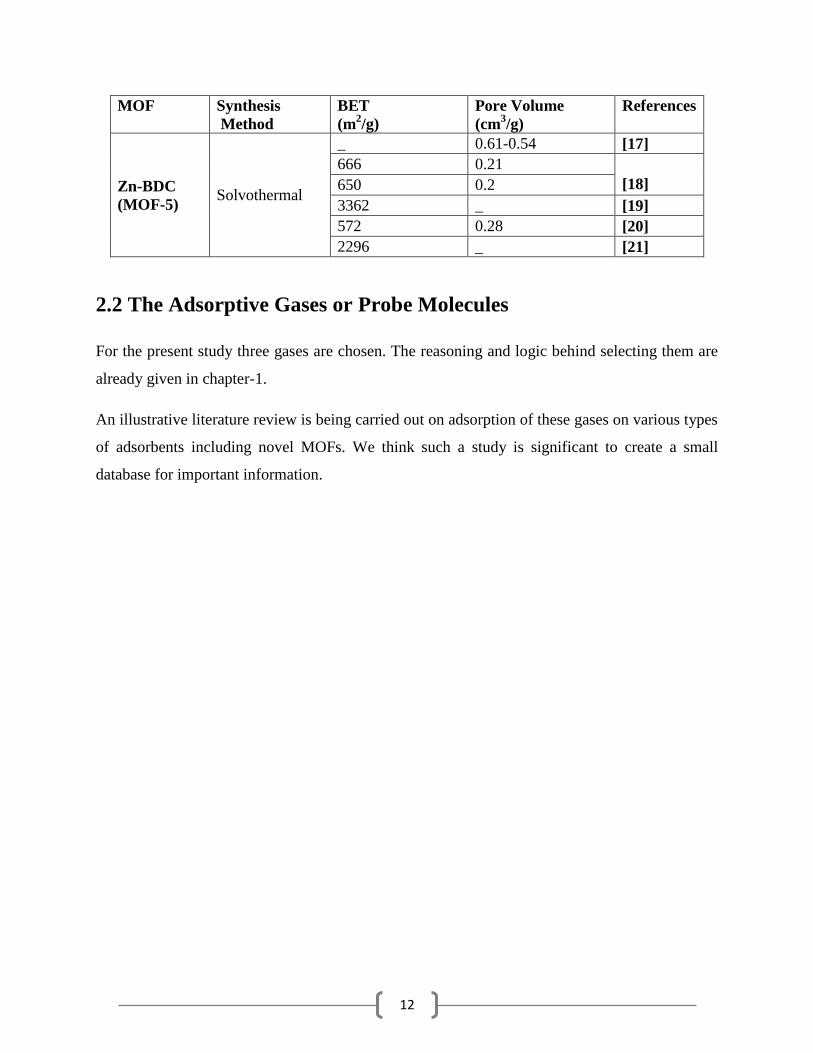
Zn-BDC
(MOF-5) Solvothermal
_ 0.61-0.54 [17]
666 0.21
[18] 650 0.2
3362 _ [19]
572 0.28 [20]
2296 _ [21]
2.2 The Adsorptive Gases or Probe Molecules
For the present study three gases are chosen. The reasoning and logic behind selecting them are
already given in chapter-1.
An illustrative literature review is being carried out on adsorption of these gases on various types
of adsorbents including novel MOFs. We think such a study is significant to create a small
database for important information.
13
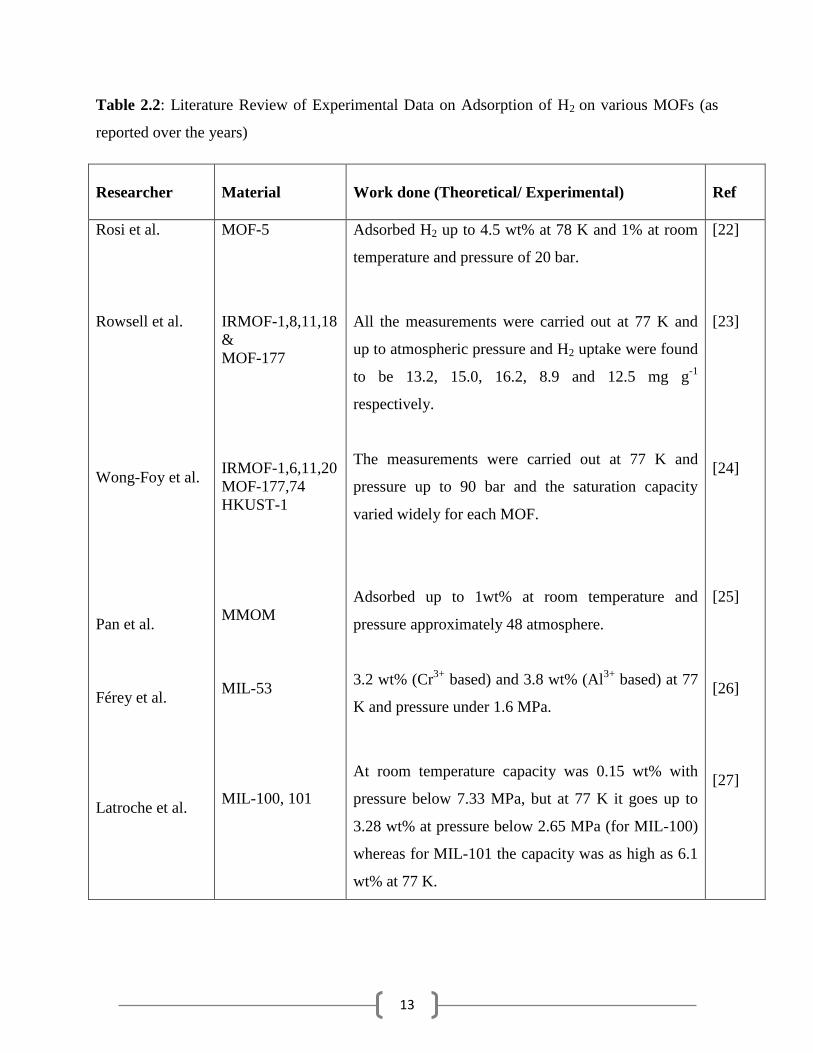
Table 2.2: Literature Review of Experimental Data on Adsorption of H2 on various MOFs (as
reported over the years)
Researcher
Material Work done (Theoretical/ Experimental) Ref
Rosi et al.
Rowsell et al.
Wong-Foy et al.
Pan et al.
Férey et al.
Latroche et al.
MOF-5
IRMOF-1,8,11,18
&
MOF-177
IRMOF-1,6,11,20
MOF-177,74
HKUST-1
MMOM
MIL-53
MIL-100, 101
Adsorbed H2 up to 4.5 wt% at 78 K and 1% at room
temperature and pressure of 20 bar.
All the measurements were carried out at 77 K and
up to atmospheric pressure and H2 uptake were found
to be 13.2, 15.0, 16.2, 8.9 and 12.5 mg g-1
respectively.
The measurements were carried out at 77 K and
pressure up to 90 bar and the saturation capacity
varied widely for each MOF.
Adsorbed up to 1wt% at room temperature and
pressure approximately 48 atmosphere.
3.2 wt% (Cr3+
based) and 3.8 wt% (Al3+
based) at 77
K and pressure under 1.6 MPa.
At room temperature capacity was 0.15 wt% with
pressure below 7.33 MPa, but at 77 K it goes up to
3.28 wt% at pressure below 2.65 MPa (for MIL-100)
whereas for MIL-101 the capacity was as high as 6.1
wt% at 77 K.
[22]
[23]
[24]
[25]
[26]
[27]
14
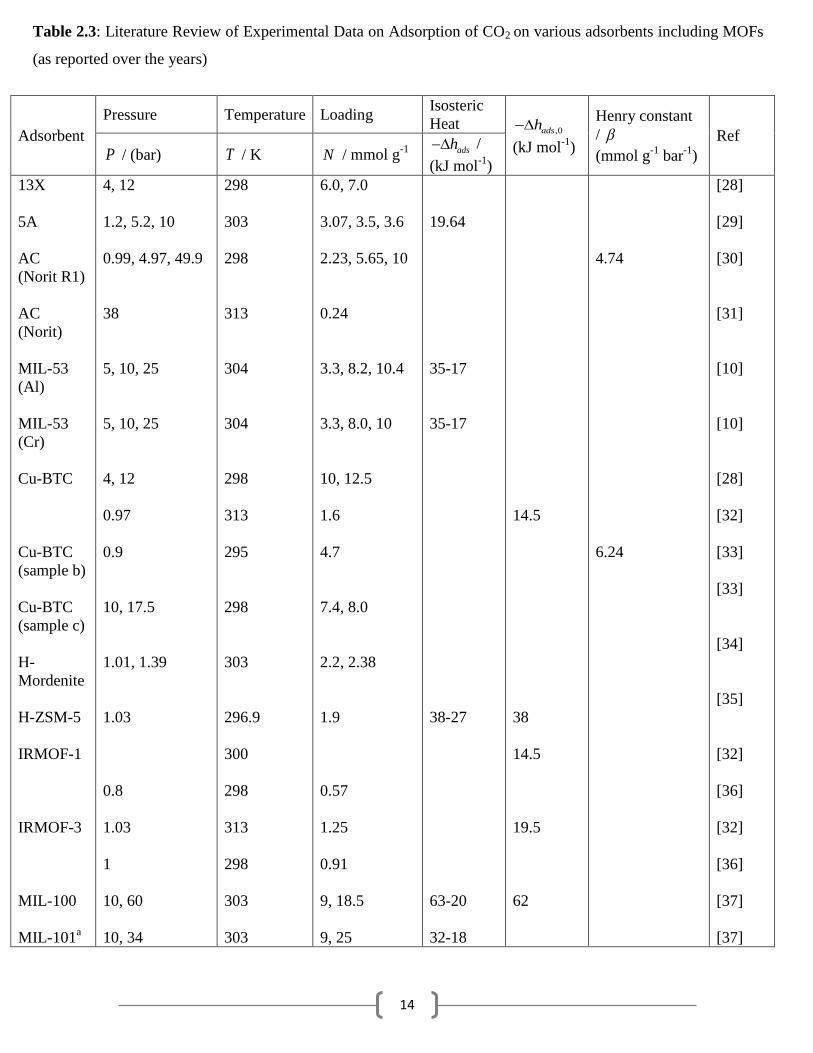
Adsorbent
Pressure Temperature Loading Isosteric
Heat ,0adsh
(kJ mol-1
)
Henry constant
/
(mmol g-1
bar-1
)
Ref
P / (bar) T / K N / mmol g-1
adsh /
(kJ mol-1
)
13X
5A
AC
(Norit R1)
AC
(Norit)
MIL-53
(Al)
MIL-53
(Cr)
Cu-BTC
Cu-BTC
(sample b)
Cu-BTC
(sample c)
H-
Mordenite
H-ZSM-5
IRMOF-1
IRMOF-3
MIL-100
MIL-101a
4, 12
1.2, 5.2, 10
0.99, 4.97, 49.9
38
5, 10, 25
5, 10, 25
4, 12
0.97
0.9
10, 17.5
1.01, 1.39
1.03
0.8
1.03
1
10, 60
10, 34
298
303
298
313
304
304
298
313
295
298
303
296.9
300
298
313
298
303
303
6.0, 7.0
3.07, 3.5, 3.6
2.23, 5.65, 10
0.24
3.3, 8.2, 10.4
3.3, 8.0, 10
10, 12.5
1.6
4.7
7.4, 8.0
2.2, 2.38
1.9
0.57
1.25
0.91
9, 18.5
9, 25
19.64
35-17
35-17
38-27
63-20
32-18
14.5
38
14.5
19.5
62
4.74
6.24
[28]
[29]
[30]
[31]
[10]
[10]
[28]
[32]
[33]
[33]
[34]
[35]
[32]
[36]
[32]
[36]
[37]
[37]
Table 2.3: Literature Review of Experimental Data on Adsorption of CO2 on various adsorbents including MOFs
(as reported over the years)
15
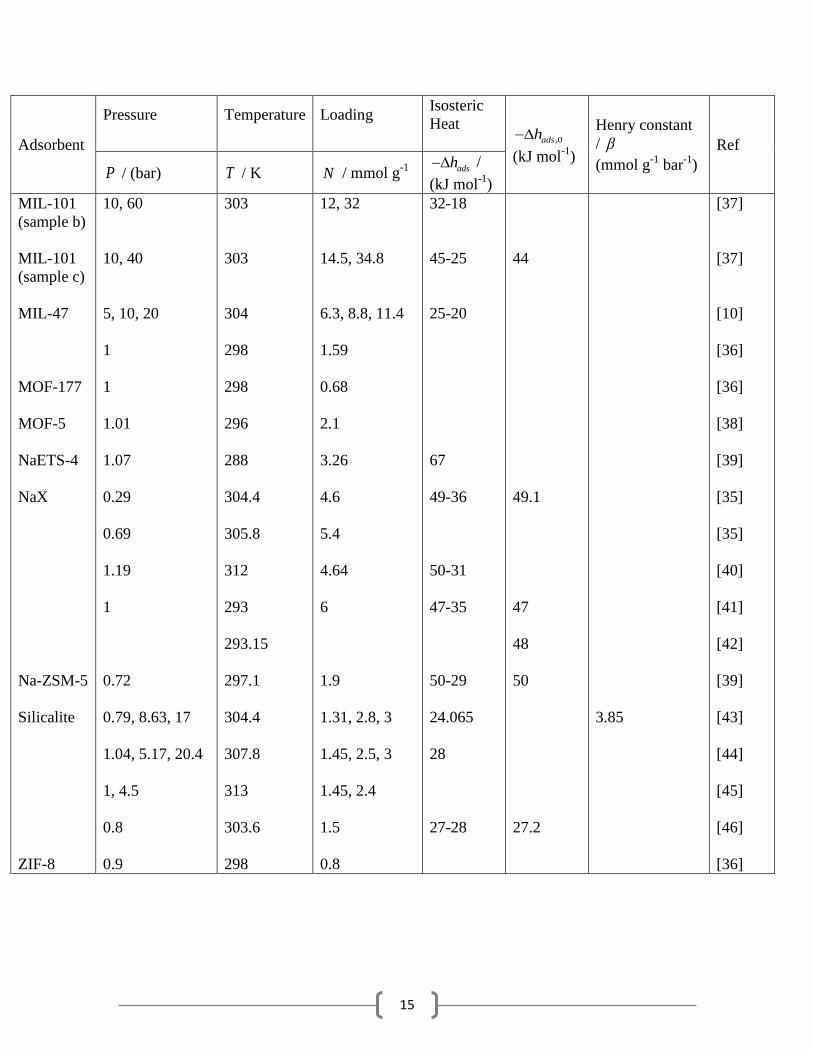
Adsorbent
Pressure
Temperature
Loading
Isosteric
Heat
,0adsh
(kJ mol-1
)
Henry constant
/
(mmol g-1
bar-1
)
Ref
P / (bar) T / K N / mmol g-1
adsh /
(kJ mol-1
)
MIL-101
(sample b)
MIL-101
(sample c)
MIL-47
MOF-177
MOF-5
NaETS-4
NaX
Na-ZSM-5
Silicalite
ZIF-8
10, 60
10, 40
5, 10, 20
1
1
1.01
1.07
0.29
0.69
1.19
1
0.72
0.79, 8.63, 17
1.04, 5.17, 20.4
1, 4.5
0.8
0.9
303
303
304
298
298
296
288
304.4
305.8
312
293
293.15
297.1
304.4
307.8
313
303.6
298
12, 32
14.5, 34.8
6.3, 8.8, 11.4
1.59
0.68
2.1
3.26
4.6
5.4
4.64
6
1.9
1.31, 2.8, 3
1.45, 2.5, 3
1.45, 2.4
1.5
0.8
32-18
45-25
25-20
67
49-36
50-31
47-35
50-29
24.065
28
27-28
44
49.1
47
48
50
27.2
3.85
[37]
[37]
[10]
[36]
[36]
[38]
[39]
[35]
[35]
[40]
[41]
[42]
[39]
[43]
[44]
[45]
[46]
[36]
16
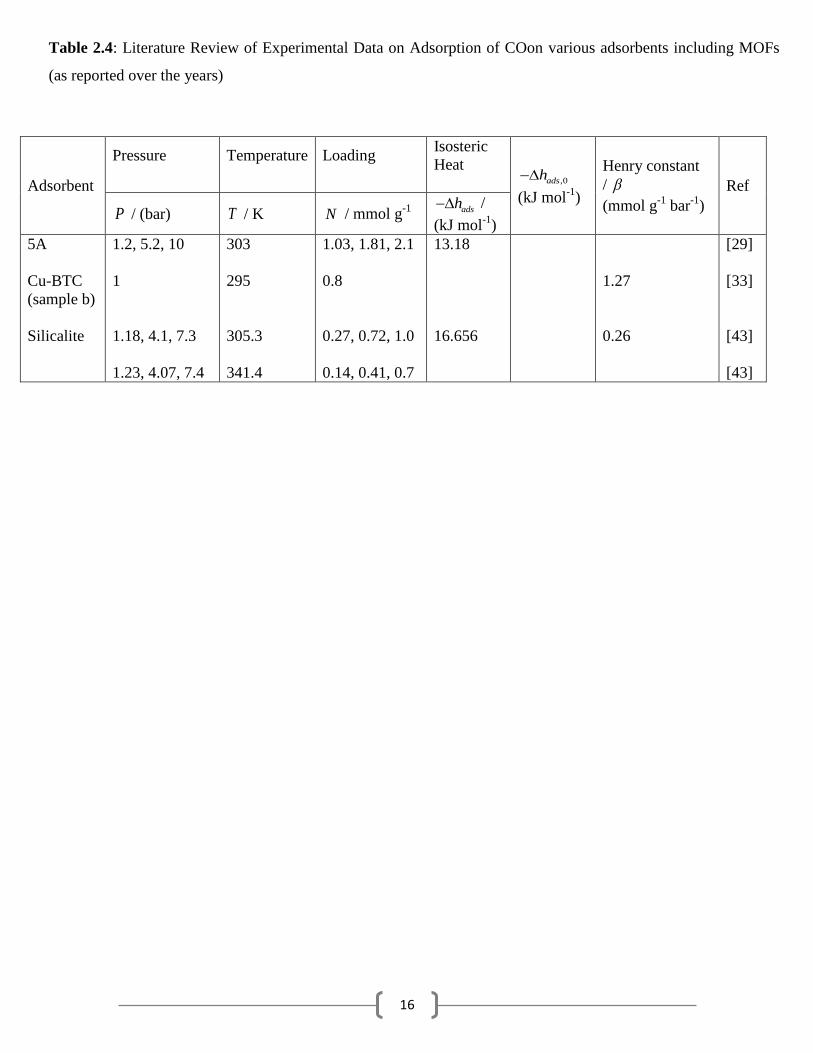
Adsorbent
Pressure
Temperature
Loading
Isosteric
Heat
,0adsh
(kJ mol-1
)
Henry constant
/
(mmol g-1
bar-1
)
Ref
P / (bar) T / K N / mmol g-1
adsh /
(kJ mol-1
)
5A
Cu-BTC
(sample b)
Silicalite
1.2, 5.2, 10
1
1.18, 4.1, 7.3
1.23, 4.07, 7.4
303
295
305.3
341.4
1.03, 1.81, 2.1
0.8
0.27, 0.72, 1.0
0.14, 0.41, 0.7
13.18
16.656
1.27
0.26
[29]
[33]
[43]
[43]
Table 2.4: Literature Review of Experimental Data on Adsorption of COon various adsorbents including MOFs
(as reported over the years)
17
CHAPTER 3
THEORY ON ADSORPTION ISOTHERMS AND
MEASUREMENTS
This chapter summarizes on various types of adsorption isotherms based on IUPAC
nomenclature. Isotherm models are also discussed in detail. Details on adsorption measurement
techniques are also discussed.
3.1 Adsorption Isotherms
Adsorption of a pure component of gas on a solid at equilibrium can be represented by the
following function:
( , )N f P T (3.1)
N is the amount adsorbed in cc STP per gm, P is the pressure and T is temperature.
At constant temperature, the amount of gas adsorbed onto a solid surface is only a function of P
and is known as adsorption isotherm [1]. During the process of adsorption, adsorbate molecules
get attached to the adsorbent surface physically due to van der Waal‟s forces of attraction.
According to Le-Chatelier principle, the direction of equilibrium would shift in that direction
where the stress can be relieved. In case of application of excess of pressure to the equilibrium
system, the equilibrium will shift in the direction where the number of molecules decreases.
Since number of molecules decreases in forward direction, with the increases in pressure,
forward direction of equilibrium will be favored.

18
Figure 3.1: Basic Adsorption Isotherm
From the graph, we can predict that after saturation pressure Ps, adsorption does not occur
anymore. This can be explained by the fact that there are limited numbers of vacancies on the
surface of the adsorbent. At high pressure a stage is reached when all the sites are occupied and
further increase in pressure does not cause any difference in adsorption process. At high
pressure, Adsorption is independent of pressure.
3.1.1 Types of Isotherms
The great majority of isotherms observed to-date can be classified into five types as shown in
figure given in next page.
19
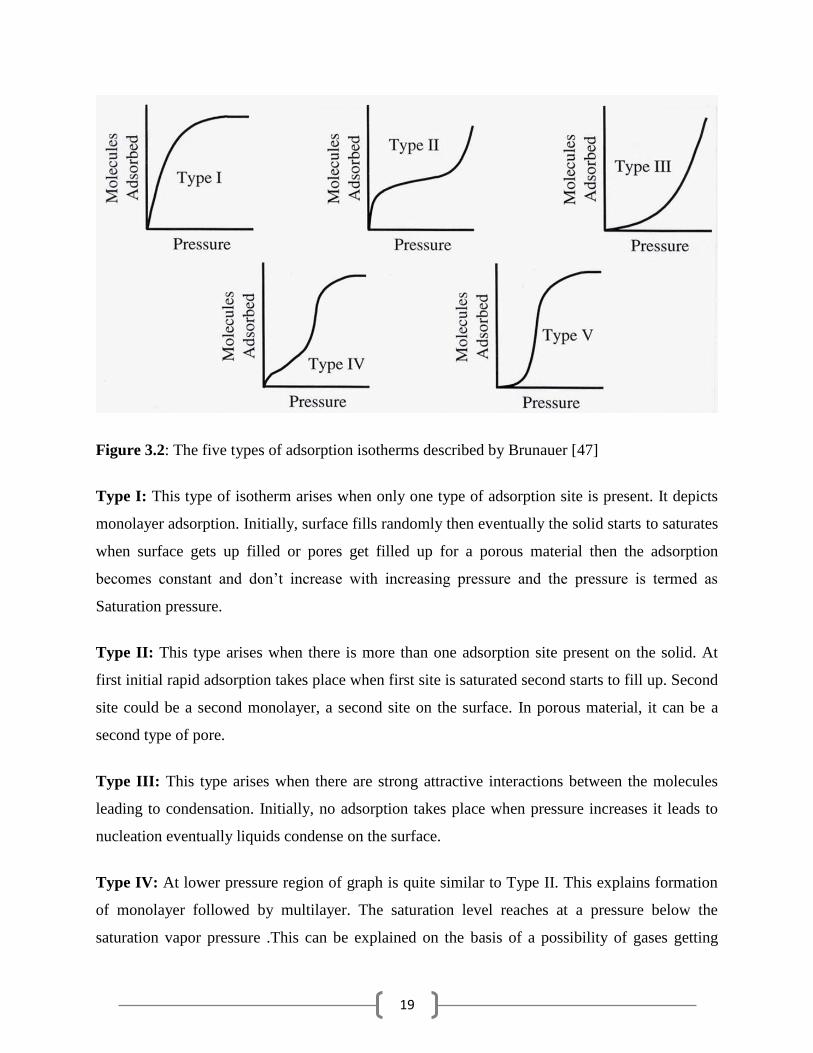
Figure 3.2: The five types of adsorption isotherms described by Brunauer [47]
Type I: This type of isotherm arises when only one type of adsorption site is present. It depicts
monolayer adsorption. Initially, surface fills randomly then eventually the solid starts to saturates
when surface gets up filled or pores get filled up for a porous material then the adsorption
becomes constant and don‟t increase with increasing pressure and the pressure is termed as
Saturation pressure.
Type II: This type arises when there is more than one adsorption site present on the solid. At
first initial rapid adsorption takes place when first site is saturated second starts to fill up. Second
site could be a second monolayer, a second site on the surface. In porous material, it can be a
second type of pore.
Type III: This type arises when there are strong attractive interactions between the molecules
leading to condensation. Initially, no adsorption takes place when pressure increases it leads to
nucleation eventually liquids condense on the surface.
Type IV: At lower pressure region of graph is quite similar to Type II. This explains formation
of monolayer followed by multilayer. The saturation level reaches at a pressure below the
saturation vapor pressure .This can be explained on the basis of a possibility of gases getting
20
condensed in the tiny capillary pores of adsorbent at pressure below the saturation pressure of the
gas.
Type V: It is a another case for attractive interaction initially no adsorption takes place later
nucleation starts which leads to formation of liquid drops and coverage saturates when no more
space is left to hold adsorbate.
Type I and II are the most frequently encountered in separation process. Many theories and
models have been developed to interpret these types of isotherms.
3.2 Isotherm Models
Important isotherm models are discussed in this section.
3.2.1 Freundlich Adsorption Isotherm [1]
In 1909, Freundlich gave an empirical expression representing the isothermal variation of
adsorption of a quantity of gas adsorbed by unit mass of solid adsorbent with pressure. This
equation is known as Freundlich adsorption isotherm or Freundlich adsorption equation. The
Freundlich adsorption isotherm is mathematically expressed as:
1
nx
KPm (3.2)
It is also written as
1log( ) log ( ) log
xk P
m n (3.3)
Or
1
nx
Kcm (3.4)
21
3.2.2 Langmuir Adsorption Isotherm [48]
When Freundlich isotherm failed at higher temperature Irving Langmuir in 1916 derived a
simple adsorption isotherm, on theoretical considerations based on kinetic theory of gases. This
is named as Langmuir adsorption isotherm. The Langmuir equation relates the coverage or
adsorption of molecules on a solid surface to gas pressure or concentration of a medium above
the solid surface at a fixed temperature.
The equation is stated as:
1
P
P
(3.5)
Where, is the fractional coverage of the surface, P is the gas pressure or concentration, is a
constant. The constant is the Langmuir adsorption constantand increases with an increase in
the binding energy of adsorption and with a decrease in temperature.
The following assumptions are used by Langmuir while deriving the equation:
Adsorption occurs on a fixed number of sites.
Each site can only take one adsorbate molecule
All sites are energetically equivalent
Interaction between adsorbed molecules are neglected as they are assumed to be
small compared to sorbate/sorbent interactions
Dynamic equilibrium exists between adsorbed gaseous molecules and the free
gaseous molecules.
22
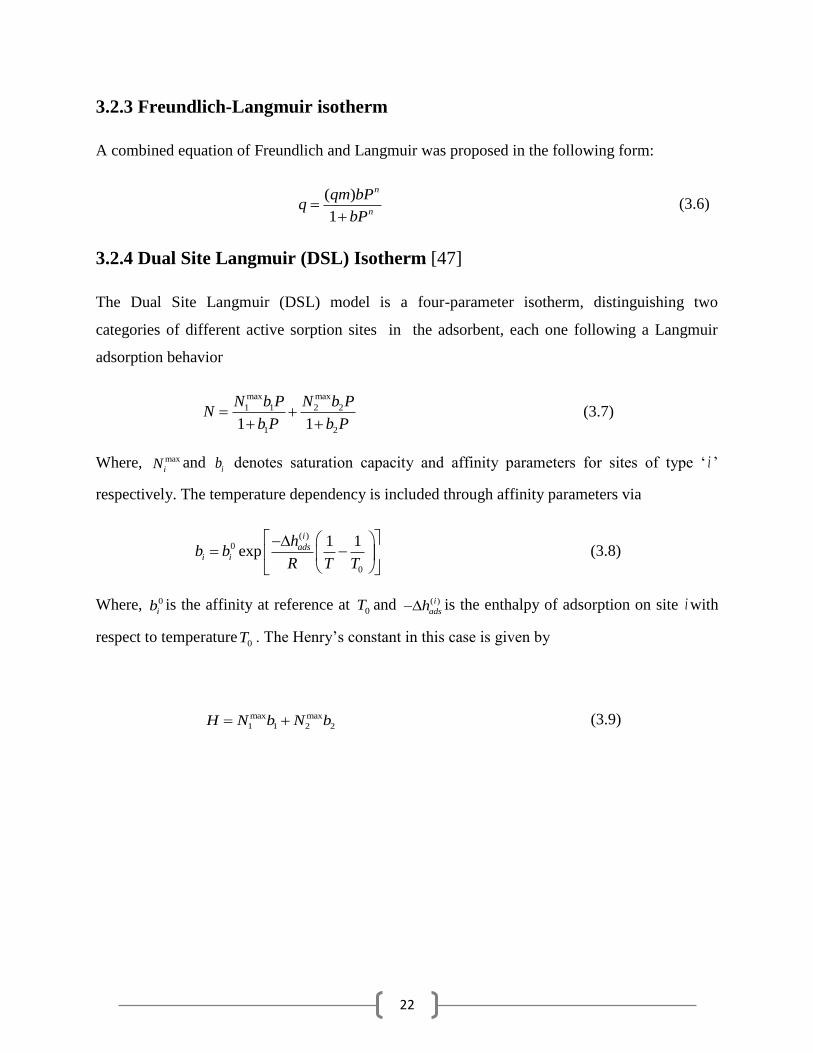
3.2.3 Freundlich-Langmuir isotherm
A combined equation of Freundlich and Langmuir was proposed in the following form:
( )
1
n
n
qm bPq
bP
(3.6)
3.2.4 Dual Site Langmuir (DSL) Isotherm [47]
The Dual Site Langmuir (DSL) model is a four-parameter isotherm, distinguishing two
categories of different active sorption sites in the adsorbent, each one following a Langmuir
adsorption behavior
max max
1 1 2 2
1 21 1
N b P N b PN
b P b P
(3.7)
Where, max
iN and ib denotes saturation capacity and affinity parameters for sites of type „ i ‟
respectively. The temperature dependency is included through affinity parameters via
( )0
0
1 1exp
i
adsi i
hb b
R T T
(3.8)
Where, 0
ib is the affinity at reference at 0T and ( )i
adsh is the enthalpy of adsorption on site i with
respect to temperature0T . The Henry‟s constant in this case is given by
max max
1 1 2 2H N b N b (3.9)
23
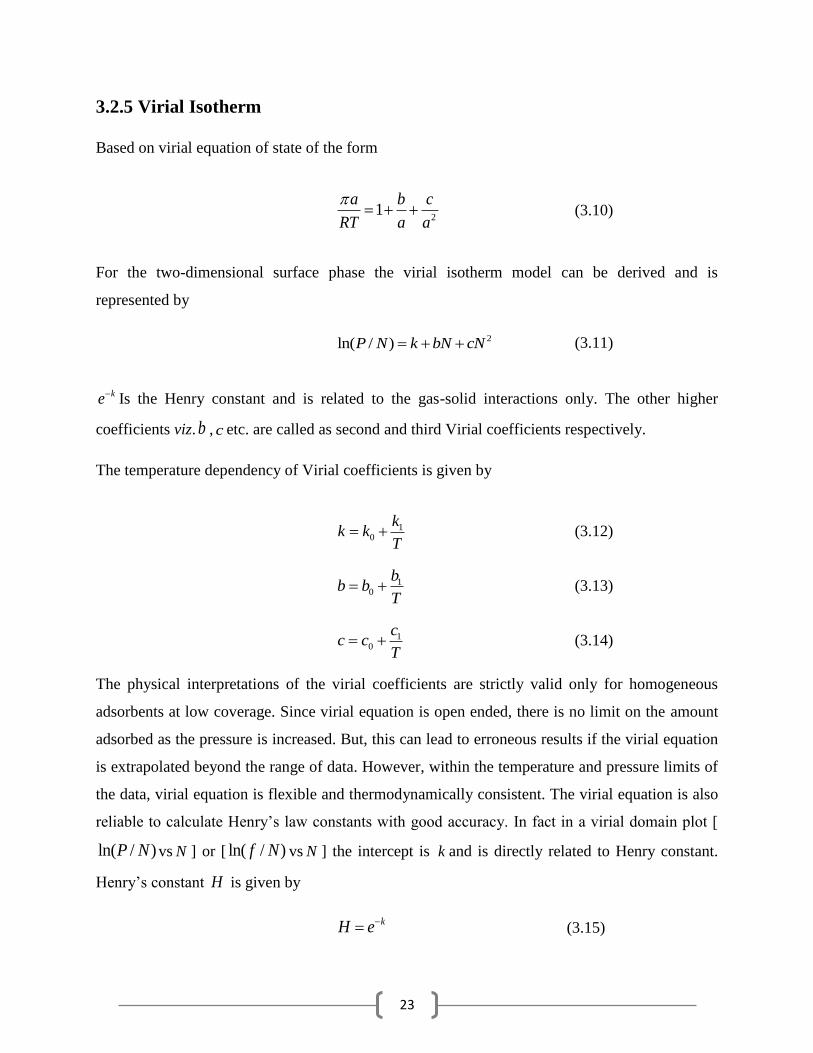
3.2.5 Virial Isotherm
Based on virial equation of state of the form
21
a b c
RT a a
(3.10)
For the two-dimensional surface phase the virial isotherm model can be derived and is
represented by
2ln( / )P N k bN cN (3.11)
keIs the Henry constant and is related to the gas-solid interactions only. The other higher
coefficients viz. b , c etc. are called as second and third Virial coefficients respectively.
The temperature dependency of Virial coefficients is given by
10
kk k
T (3.12)
10
bb b
T (3.13)
10
cc c
T (3.14)
The physical interpretations of the virial coefficients are strictly valid only for homogeneous
adsorbents at low coverage. Since virial equation is open ended, there is no limit on the amount
adsorbed as the pressure is increased. But, this can lead to erroneous results if the virial equation
is extrapolated beyond the range of data. However, within the temperature and pressure limits of
the data, virial equation is flexible and thermodynamically consistent. The virial equation is also
reliable to calculate Henry‟s law constants with good accuracy. In fact in a virial domain plot [
ln( / )P N vs N ] or [ ln( / )f N vs N ] the intercept is k and is directly related to Henry constant.
Henry‟s constant H is given by
kH e (3.15)
24
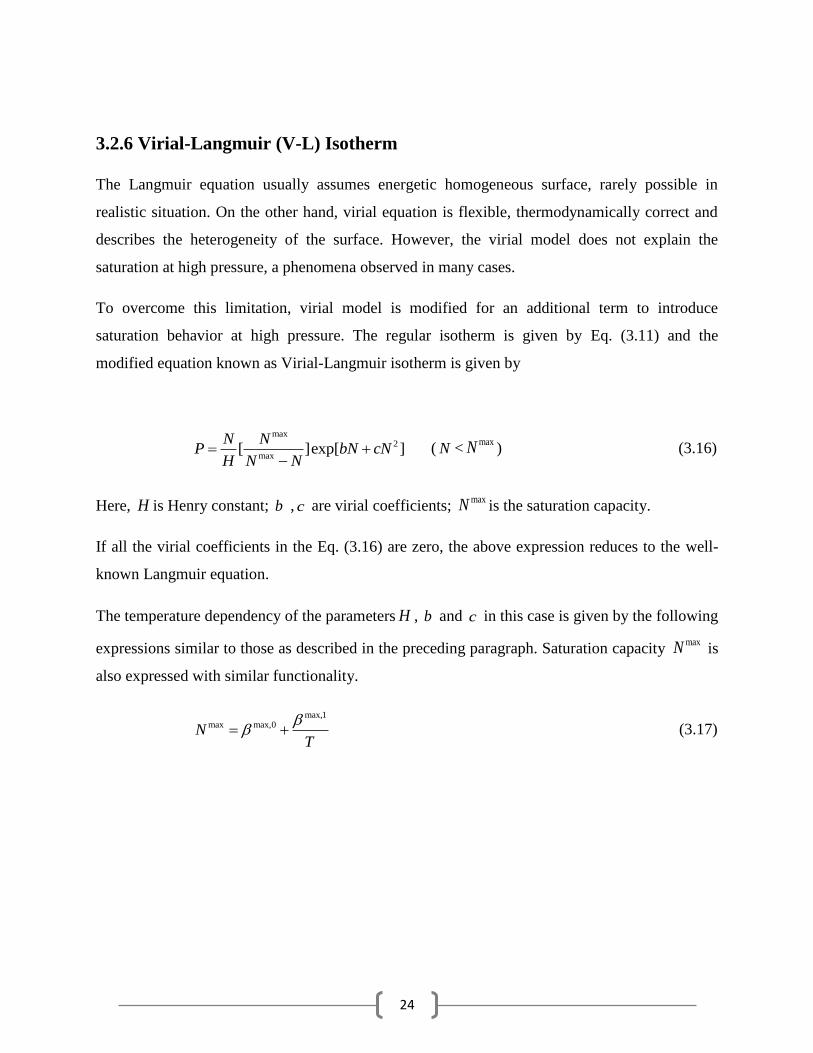
3.2.6 Virial-Langmuir (V-L) Isotherm
The Langmuir equation usually assumes energetic homogeneous surface, rarely possible in
realistic situation. On the other hand, virial equation is flexible, thermodynamically correct and
describes the heterogeneity of the surface. However, the virial model does not explain the
saturation at high pressure, a phenomena observed in many cases.
To overcome this limitation, virial model is modified for an additional term to introduce
saturation behavior at high pressure. The regular isotherm is given by Eq. (3.11) and the
modified equation known as Virial-Langmuir isotherm is given by
max
2
max[ ]exp[ ]
N NP bN cN
H N N
( N <
maxN ) (3.16)
Here, H is Henry constant; b , c are virial coefficients; maxN is the saturation capacity.
If all the virial coefficients in the Eq. (3.16) are zero, the above expression reduces to the well-
known Langmuir equation.
The temperature dependency of the parameters H , b and c in this case is given by the following
expressions similar to those as described in the preceding paragraph. Saturation capacity maxN is
also expressed with similar functionality.
max,1max max,0N
T
(3.17)

25
3.3 Measurement of Adsorption Isotherms
3.3.1 Pure Gas Adsorption Measurements Using Gravimetry
Various methods are available to measure pure gas adsorption isotherm. The important methods
include gravimetry, volumetry and gas chromatography. Gravimetry is a fast and direct
measurement technique and is gaining wide spread popularity amongst experimentalists. A
typical gravimetric experimental setup is shown in Figure 3.3.
Figure 3.3: Typical gravimetric experimental setup
The adsorbent is loaded in a bucket which is on the other hand suspended from a micro balance.
The sample is completely activated by keeping the pressure chamber at a high activation
temperature, under vacuum. Sometimes a flow of an inert gas is utilized to facilitate flushing of
desorbed components, if the system design allows for such an operation. After activation the
pressure chamber is completely vacuumed, isolated and is cooled down to experimental
temperature. The true adsorbent mass with the weight of the bucket,,0tM is measured in vacuum.
The solid is then exposed to the gas of interest at some pressure P . At equilibrium, the observed
mass tM is related to the Gibbs‟ excess amount adsorbed,
exM by the relation,
26
,0ex
gas
t t buoyancyM M M V (3.18)
The last term on RHS accounts for the buoyancy correction on the sample and bucket. The
density of the gas is usually obtained from an EoS. Some recently developed commercial
balances allow simultaneous gas density measurements [49].
The buoyancy volume buoyancy
V is typically measured through Eq. (3.18) for measurements
conducted using helium, with the assumption that 0exM (i.e. helium does not adsorb under
experimental conditions). Once calculated from the helium experiments, buoyancy
V is then used to
calculate the Gibbs‟ excess amount adsorbed for all other adsorbing gases via Eq. (3.18). The
buoyancy volume buoyancy
V is the sum of the impenetrable solid volume ( .sV m )of an adsorbent of
mass m andthe difference between the volumes of the balance assembly (buckets, hang downs
etc.) between the sample and reference sides. Thus measurement of buoyancy volume fixes the
Gibbs‟ dividing surface.
This method is the simplest in adsorption equilibrium measurements. The operator has control
over the final pressure in the system. It is possible to obtain the true mass of the solid after
complete desorption in vacuum. Only small amount of solid sample (often less than 1 gm) is
needed. By itself this method can be used only for pure component measurements.
27
CHAPTER 4
EXPERIMENTAL WORKS AND DATA RETRIEVAL
This chapter illustrates MOF synthesis methods, specifically Cu-BTC, Cr-BDC and Zn-BDC. An
improvised method studying the stability of the adsorbent samples at controlled ambient
conditions is also elaborated. Finally, data retrieval methods are also discussed.
4.1 Synthesis of Cu-BTC
Cu-BTC or HKUST-1 was first reported by Chui et al. [50]. This method reported by Liu et al.
and is a modification of previous works by Roswell and Yaghi [51]. 1, 3, 5-benzenetricarboxylic
acid (1.0 g) was dissolved in 30 ml of a 1:1 mixture of ethanol/N, N-dimethylformamide (DMF).
In another flask, Copper (II) Nitrate trihydrate (2.077 g) was dissolved in 15 ml water. The two
solutions were then mixed and stirred for 10 min. They were then transferred into Teflon-lined
stainless steel autoclave and heated at 373 K for 10 hours. The reaction vessel was cooled to
room temperature normally. The resulting blue crystals were isolated by filtration and extracted
with methanol overnight using a Soxhlet extractor to remove solvated DMF. The product was
then dried at room temperature.
4.2 Synthesis of Cr-BDC
Cr-BDC or MIL-101 was synthesized hydrothermally following the published work of Ferey et
al. [52]. The reaction was carried out in a Teflon lined stainless steel autoclave where a
stoichiometric mixture of Cr(NO3)3.9H2O, de-ionized water, 1,4-benzene dicarboxylic acid and
HF was placed for 8 hrs at 493 K. Post-synthesis treatments of MIL-101 sample was crucial
since significant amount of needle shaped colorless crystals of terephthalic acid (H2BDC) formed
as a by-product.
28
4.3 Synthesis of Zn-BDC
Zn-BDC on the other hand was synthesized following the original procedure described by
Henrik Fanø Clausen et al. [53] followed by the modified route of Jinping Li et al. [54]. Zn
(NO3)2.6H2O (6 g), and H2BDC (1.7 g) were dissolved in DMF (20 ml). The solution was then
transferred into Teflon- lined autoclave, which was heated at 373 K for 24 h. The reaction
products were cooled to room temperature, and the solid obtained were collected by
centrifugation, washed with DMF, and dried at room temperature.
4.4 Characterization
Characterization was performed using SEM, Powder XRD, TGA and BET surface area analysis.
The membrane morphologies were observed via scanning electron microscopy (SEM, JEOL
JSM-6480 LV) equipped with an energy dispersive X-ray spectrometer (EDX). Prior to imaging,
each sample was platinum coated in a specialized device to increase the conductivity for a better
imaging. The synthesized samples were subjected to X-ray diffraction by a diffractometer (XRD,
Philips Analytical, PW-3040) equipped with the graphite monochromatizedCuKα radiation
(λ=1.5406Å) in 2θ angles ranging from 5o to 75
o with a step size of 2 degree and scanning rate 1
minute. BET surface area analysis was performed by BET surface area analyzer (Autosorb-1,
Quantachrome). The relative pressure in BET surface area calculation was between 0.05-0.35.
Finally, thermal analyses of samples were carried out in detail in a TGA apparatus, SHIMADZU
(DTG 60 H). 60 µl alumina crucibles were used during TGA analysis.
4.5 Stability Analysis
Each of the batches of synthesized MOF samples was protected in a standard plastic vial of 25
ml volume. Each of the vials was filled up to a certain pre-determined level to set aside some
empty space above the adsorbent surface. Small perforations were made in the top corners of the
vial and it was kept in a controlled environment of 85~90% relative humidity for 12 weeks.
Samples were re-analyzed to check for its stability subsequently.
29
4.6 Data Retrieval
All experimental data for our present study were retrieved from literature. „Windig‟ software was
used extensively for this purpose. Judicious interpolation and extrapolation was done wherever
required. Model fitting was carried out using „MATLAB‟ (version: 7.3.0.267). Various isotherm
models were tried and tested on the experimental data to get the best fit. Model fit parameters
were evaluated from model equations and the physical significance of each of the parameters
was tried to be explained to understand the adsorption mechanism.
30
CHAPTER 5
RESULTS AND DISCUSSION
This chapter summarizes all the results. All experimental data for H2, CO and CO2 obtained from
literature is fit with standard isotherm models and compared. Interesting observations are made
and explained in detail. The effects of atmospheric condition onto synthesized MOF morphology
are also explained. Comparison of experimental data with simulation data at same condition is
also made and elaborated.
5.1 Comparison of Pure Gas Adsorption Isotherms of H2, CO and
CO2
The pure component excess adsorption data retrieved from literature are either gravimetrically or
volumetrically measured by various researchers across the globe. A complete summary table of
our review is already shown in tables 2.2, 2.3 and 2.4 respectively. We are convinced that such a
study is not only important for making a database for comparison but also give an important
picture on chronological developments over the years.
Now, if we shift our attention on H2, being projected as one of the most important future fuel, we
come across many interesting observations. H2 being a non-polar gas with very small kinetic
diameter, it is always challenging to store H2 in adsorbed mode. Conventional methods of storing
H2 in cryogenic state or compressed state proved too costly and inefficient exercise. The
Department of Energy (USA) target for storing H2 in adsorbed medium by 2010 was 6.5 wt%.
Now if we focus our attention to table 2.2 we can readily see that researchers are falling way
below the set target. The importance of MOFs can be gauged from the fact that they possess
huge specific surface area, unparalleled by any known adsorbents till date and hence MOFs are
projected as “would be” material for storing significant amount of H2 at moderate pressure with
faster kinetics. But an experienced eye can readily see the expected results and the results we
have across different laboratories. The data reported in table 2.2 are mostly measured at
cryogenic conditions i.e. at 77 K and moderate to high pressures. Interestingly, data reported on
same MOF by two different groups vary quite significantly. The lack of consistency on measured
31
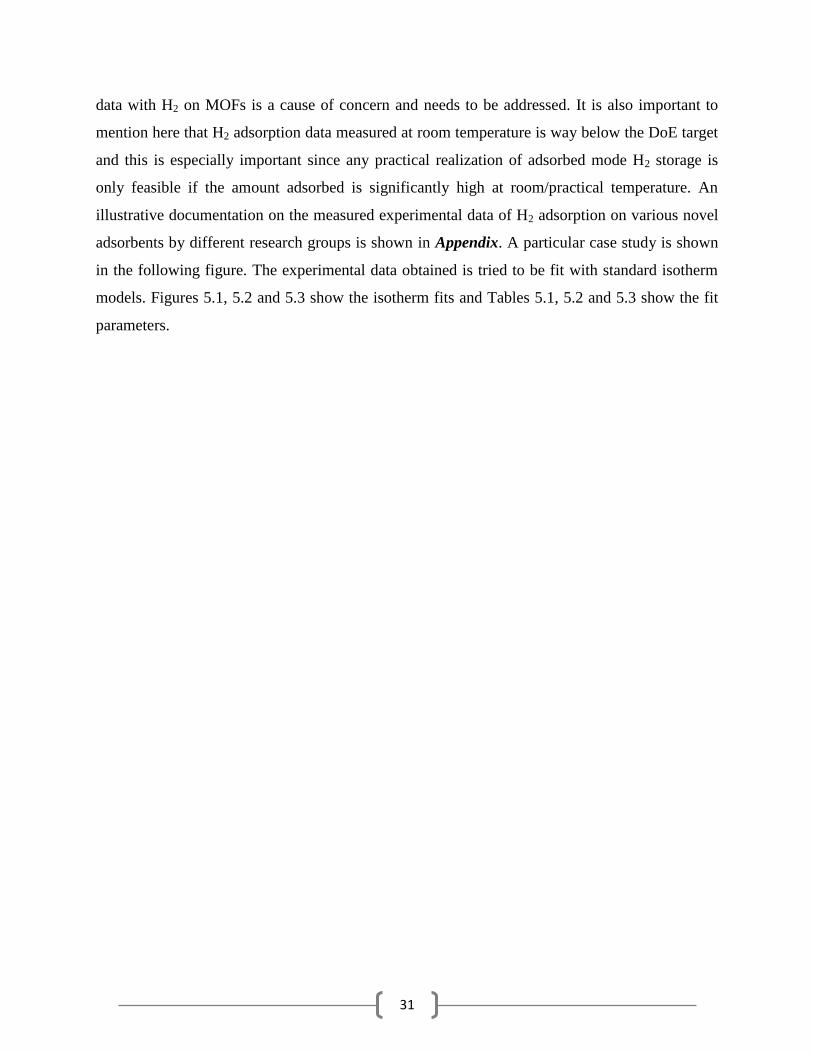
data with H2 on MOFs is a cause of concern and needs to be addressed. It is also important to
mention here that H2 adsorption data measured at room temperature is way below the DoE target
and this is especially important since any practical realization of adsorbed mode H2 storage is
only feasible if the amount adsorbed is significantly high at room/practical temperature. An
illustrative documentation on the measured experimental data of H2 adsorption on various novel
adsorbents by different research groups is shown in Appendix. A particular case study is shown
in the following figure. The experimental data obtained is tried to be fit with standard isotherm
models. Figures 5.1, 5.2 and 5.3 show the isotherm fits and Tables 5.1, 5.2 and 5.3 show the fit
parameters.
32
(A) (B)
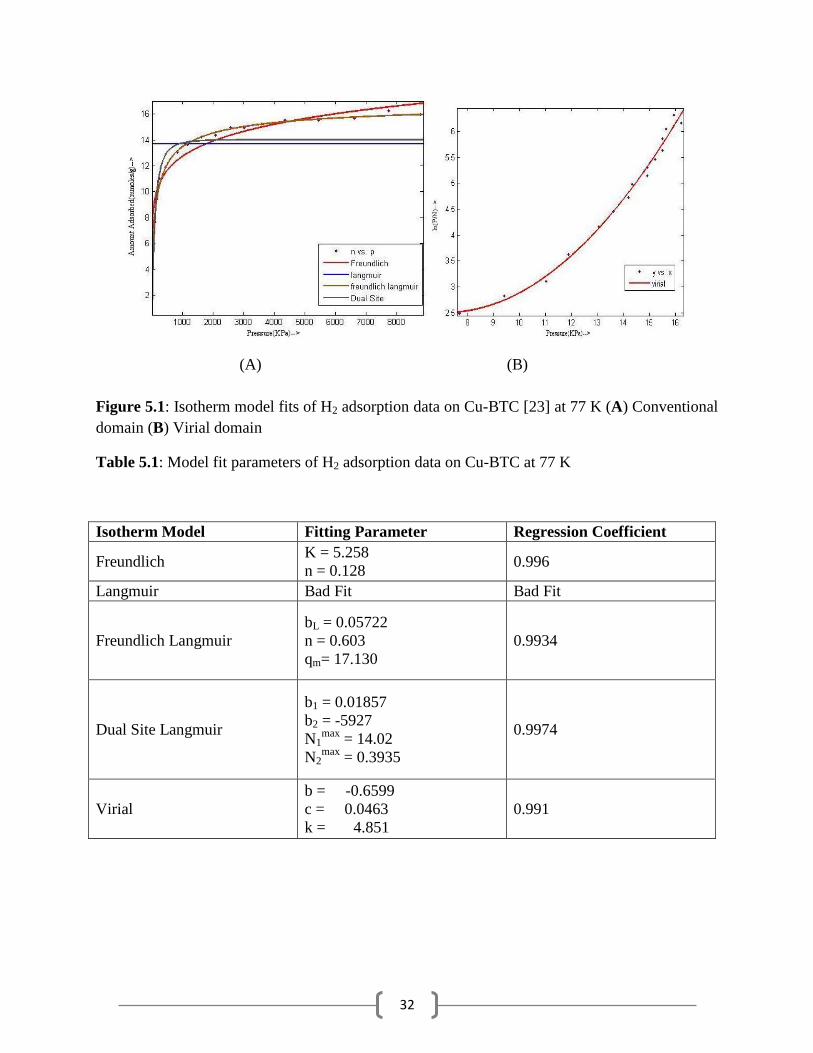
Figure 5.1: Isotherm model fits of H2 adsorption data on Cu-BTC [23] at 77 K (A) Conventional
domain (B) Virial domain
Table 5.1: Model fit parameters of H2 adsorption data on Cu-BTC at 77 K
Isotherm Model Fitting Parameter Regression Coefficient
Freundlich K = 5.258
n = 0.128 0.996
Langmuir Bad Fit Bad Fit
Freundlich Langmuir
bL = 0.05722
n = 0.603
qm= 17.130
0.9934
Dual Site Langmuir
b1 = 0.01857
b2 = -5927
N1max
= 14.02
N2max
= 0.3935
0.9974
Virial
b = -0.6599
c = 0.0463
k = 4.851
0.991
33
(A) (B)
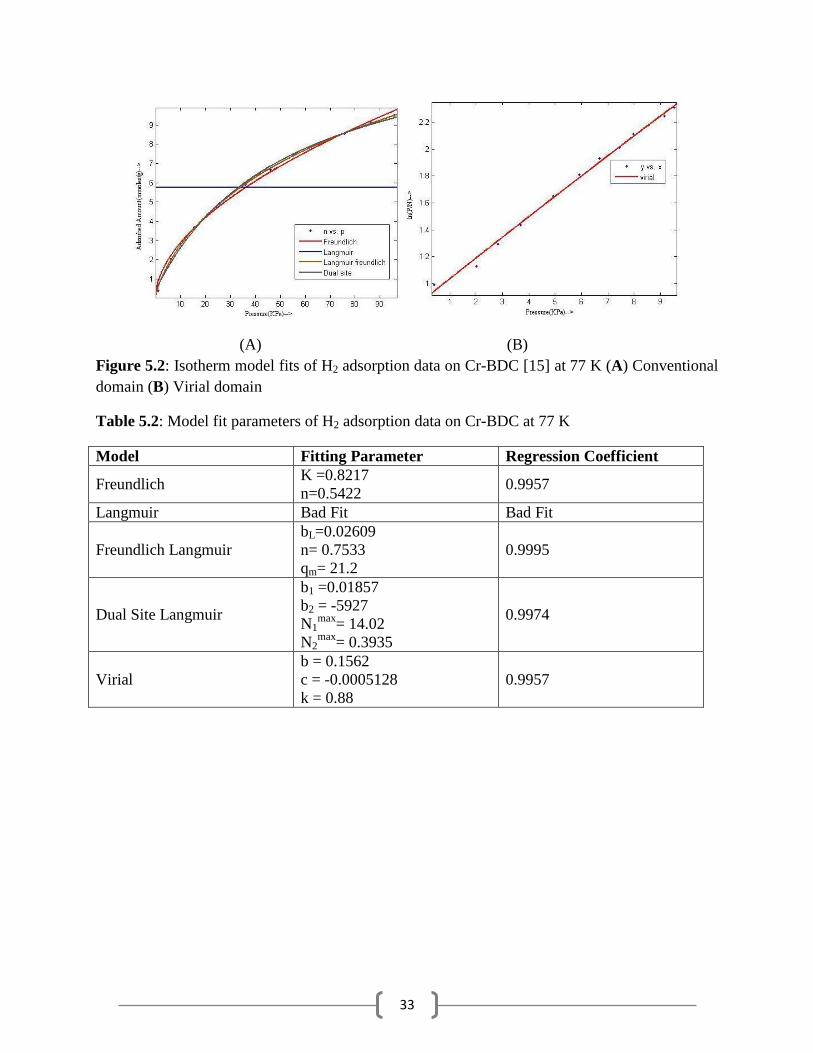
Figure 5.2: Isotherm model fits of H2 adsorption data on Cr-BDC [15] at 77 K (A) Conventional
domain (B) Virial domain
Table 5.2: Model fit parameters of H2 adsorption data on Cr-BDC at 77 K
Model Fitting Parameter Regression Coefficient
Freundlich K =0.8217
n=0.5422 0.9957
Langmuir Bad Fit Bad Fit
Freundlich Langmuir
bL=0.02609
n= 0.7533
qm= 21.2
0.9995
Dual Site Langmuir
b1 =0.01857
b2 = -5927
N1max
= 14.02
N2max
= 0.3935
0.9974
Virial
b = 0.1562
c = -0.0005128
k = 0.88
0.9957
34
(A) (B)
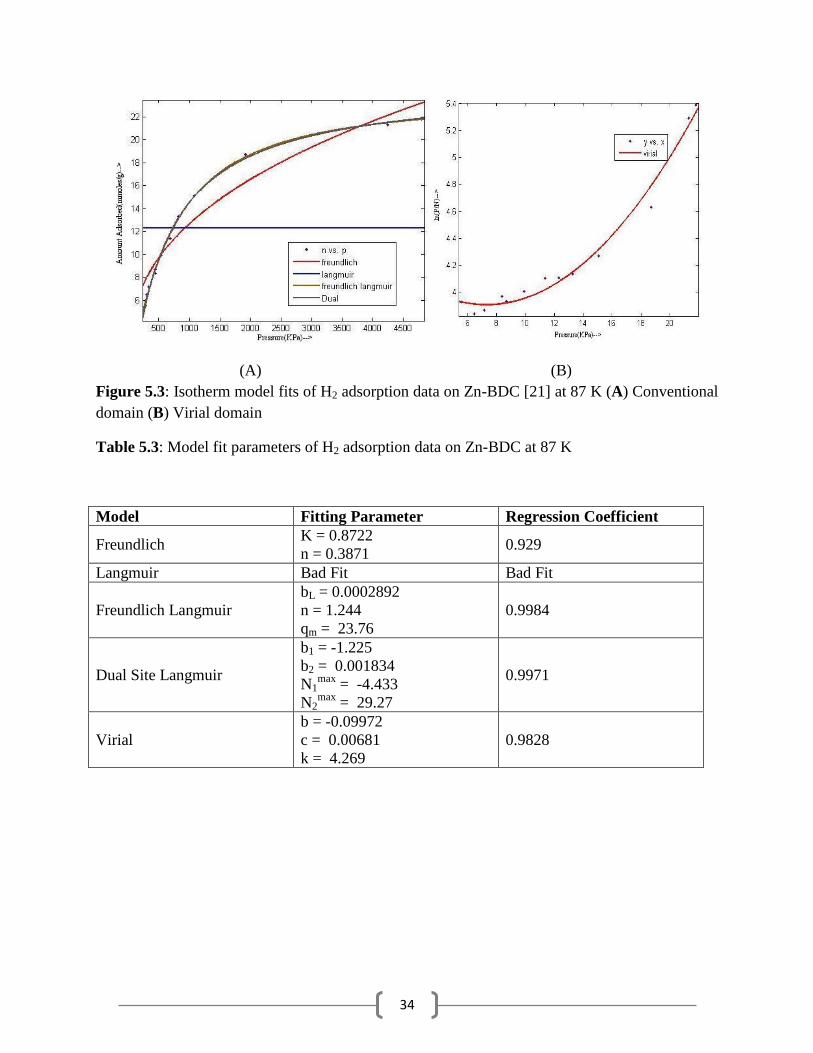
Figure 5.3: Isotherm model fits of H2 adsorption data on Zn-BDC [21] at 87 K (A) Conventional
domain (B) Virial domain
Table 5.3: Model fit parameters of H2 adsorption data on Zn-BDC at 87 K
Model Fitting Parameter Regression Coefficient
Freundlich K = 0.8722
n = 0.3871 0.929
Langmuir Bad Fit Bad Fit
Freundlich Langmuir
bL = 0.0002892
n = 1.244
qm = 23.76
0.9984
Dual Site Langmuir
b1 = -1.225
b2 = 0.001834
N1max
= -4.433
N2max
= 29.27
0.9971
Virial
b = -0.09972
c = 0.00681
k = 4.269
0.9828
35
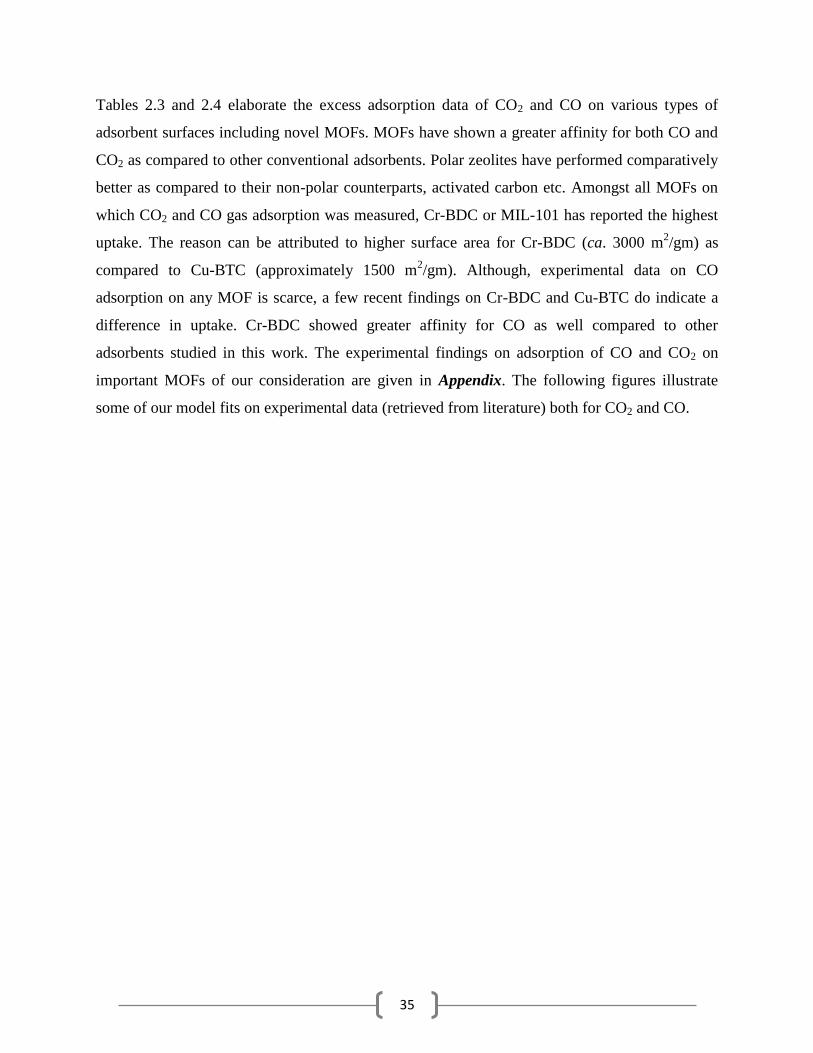
Tables 2.3 and 2.4 elaborate the excess adsorption data of CO2 and CO on various types of
adsorbent surfaces including novel MOFs. MOFs have shown a greater affinity for both CO and
CO2 as compared to other conventional adsorbents. Polar zeolites have performed comparatively
better as compared to their non-polar counterparts, activated carbon etc. Amongst all MOFs on
which CO2 and CO gas adsorption was measured, Cr-BDC or MIL-101 has reported the highest
uptake. The reason can be attributed to higher surface area for Cr-BDC (ca. 3000 m2/gm) as
compared to Cu-BTC (approximately 1500 m2/gm). Although, experimental data on CO
adsorption on any MOF is scarce, a few recent findings on Cr-BDC and Cu-BTC do indicate a
difference in uptake. Cr-BDC showed greater affinity for CO as well compared to other
adsorbents studied in this work. The experimental findings on adsorption of CO and CO2 on
important MOFs of our consideration are given in Appendix. The following figures illustrate
some of our model fits on experimental data (retrieved from literature) both for CO2 and CO.
36
(A) (B)
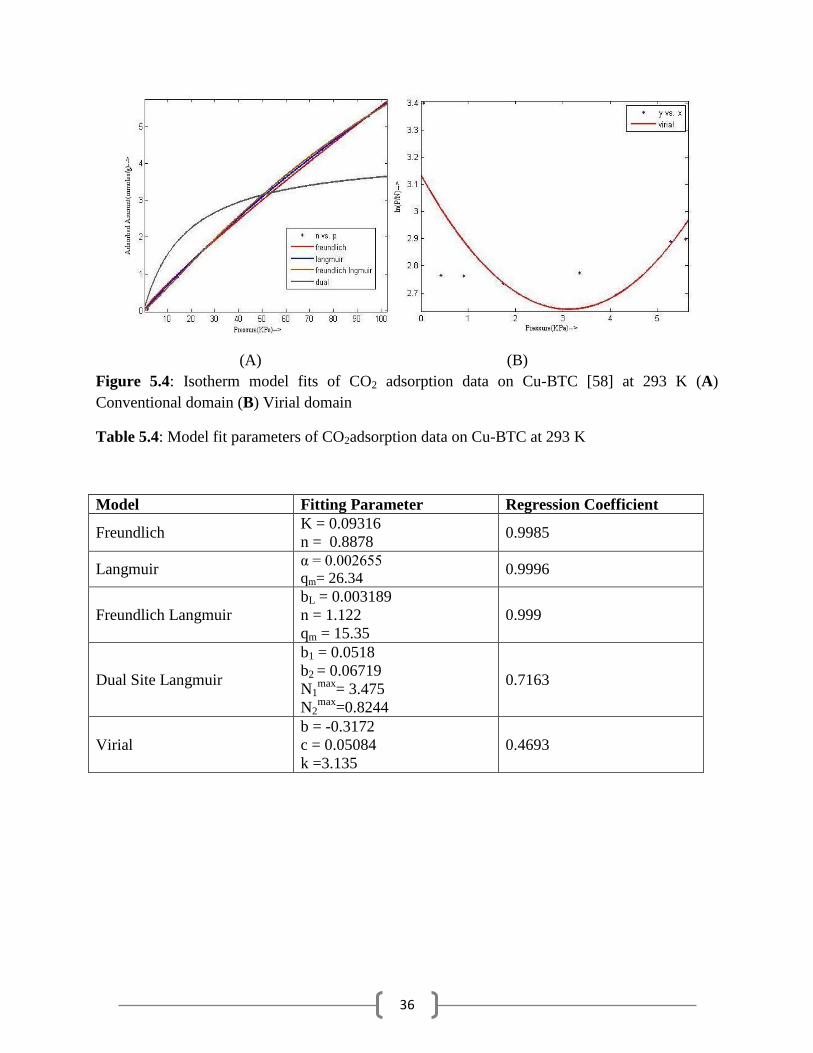
Figure 5.4: Isotherm model fits of CO2 adsorption data on Cu-BTC [58] at 293 K (A)
Conventional domain (B) Virial domain
Table 5.4: Model fit parameters of CO2adsorption data on Cu-BTC at 293 K
Model Fitting Parameter Regression Coefficient
Freundlich K = 0.09316
n = 0.8878 0.9985
Langmuir α = 0.002655
qm= 26.34 0.9996
Freundlich Langmuir
bL = 0.003189
n = 1.122
qm = 15.35
0.999
Dual Site Langmuir
b1 = 0.0518
b2 = 0.06719
N1max
= 3.475
N2max
=0.8244
0.7163
Virial
b = -0.3172
c = 0.05084
k =3.135
0.4693
37
(A) (B)
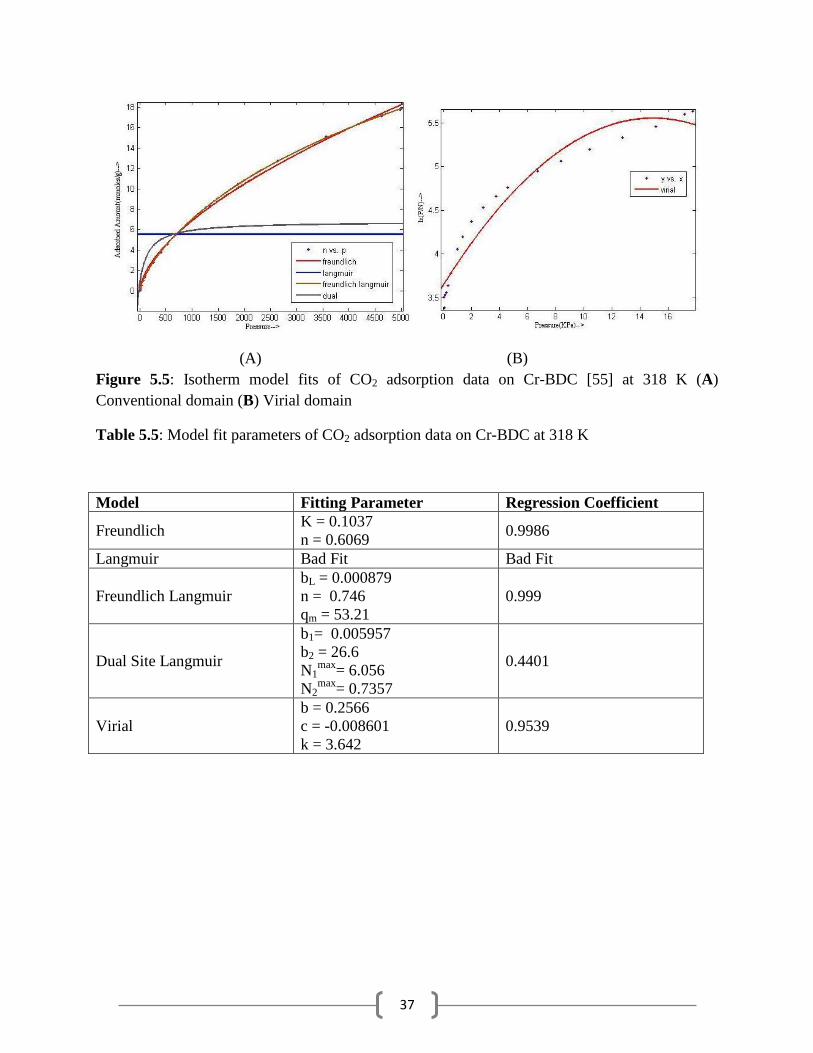
Figure 5.5: Isotherm model fits of CO2 adsorption data on Cr-BDC [55] at 318 K (A)
Conventional domain (B) Virial domain
Table 5.5: Model fit parameters of CO2 adsorption data on Cr-BDC at 318 K
Model Fitting Parameter Regression Coefficient
Freundlich K = 0.1037
n = 0.6069 0.9986
Langmuir Bad Fit Bad Fit
Freundlich Langmuir
bL = 0.000879
n = 0.746
qm = 53.21
0.999
Dual Site Langmuir
b1= 0.005957
b2 = 26.6
N1max
= 6.056
N2max
= 0.7357
0.4401
Virial
b = 0.2566
c = -0.008601
k = 3.642
0.9539
38
(A) (B)
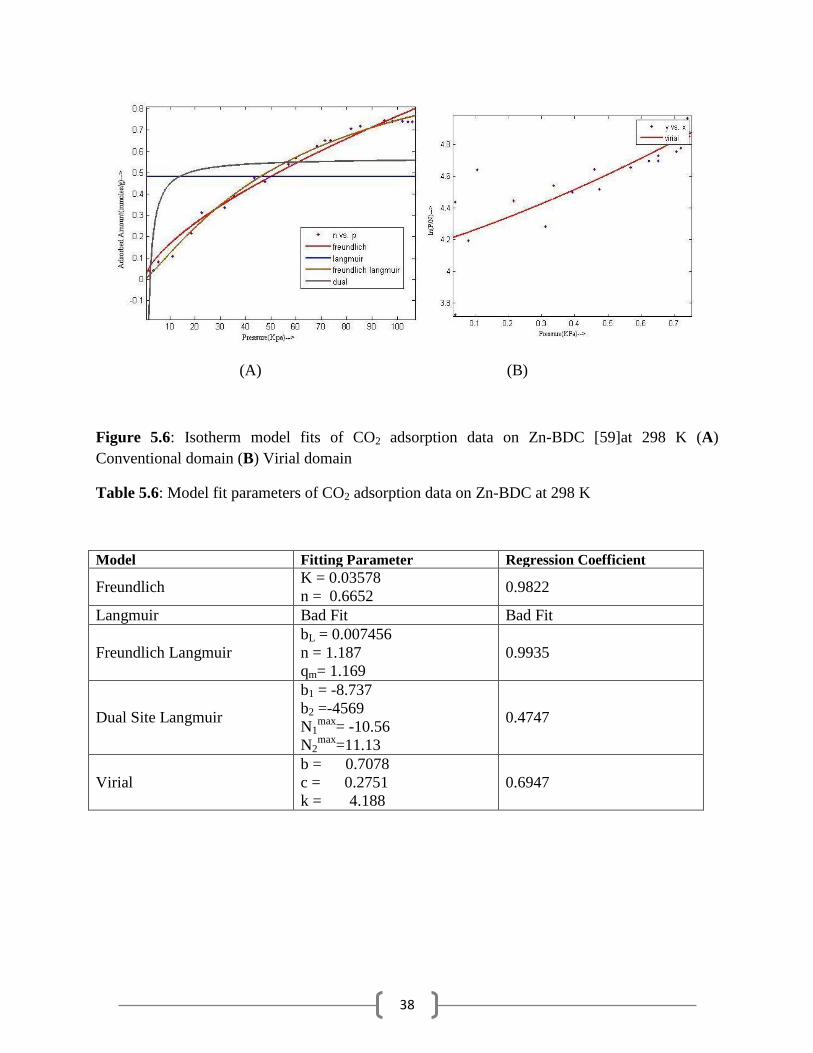
Figure 5.6: Isotherm model fits of CO2 adsorption data on Zn-BDC [59]at 298 K (A)
Conventional domain (B) Virial domain
Table 5.6: Model fit parameters of CO2 adsorption data on Zn-BDC at 298 K
Model Fitting Parameter Regression Coefficient
Freundlich K = 0.03578
n = 0.6652 0.9822
Langmuir Bad Fit Bad Fit
Freundlich Langmuir
bL = 0.007456
n = 1.187
qm= 1.169
0.9935
Dual Site Langmuir
b1 = -8.737
b2 =-4569
N1max
= -10.56
N2max
=11.13
0.4747
Virial
b = 0.7078
c = 0.2751
k = 4.188
0.6947
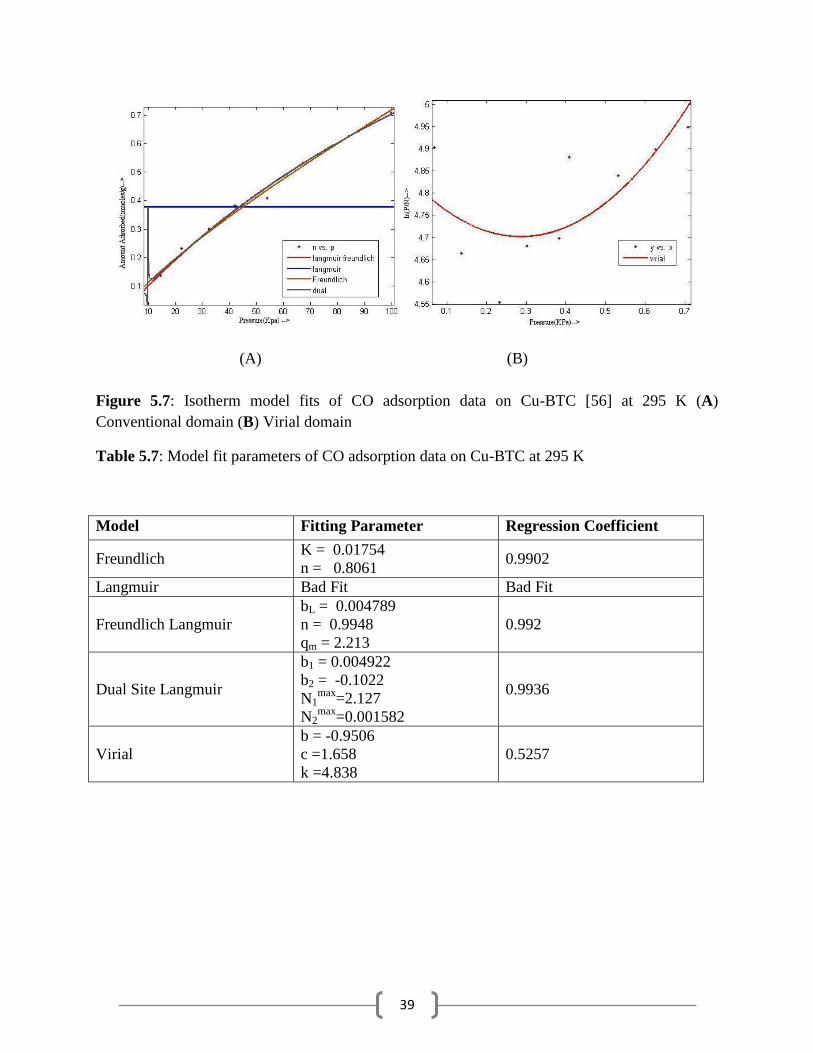
39
(A) (B)
Figure 5.7: Isotherm model fits of CO adsorption data on Cu-BTC [56] at 295 K (A)
Conventional domain (B) Virial domain
Table 5.7: Model fit parameters of CO adsorption data on Cu-BTC at 295 K
Model Fitting Parameter Regression Coefficient
Freundlich K = 0.01754
n = 0.8061 0.9902
Langmuir Bad Fit Bad Fit
Freundlich Langmuir
bL = 0.004789
n = 0.9948
qm = 2.213
0.992
Dual Site Langmuir
b1 = 0.004922
b2 = -0.1022
N1max
=2.127
N2max
=0.001582
0.9936
Virial
b = -0.9506
c =1.658
k =4.838
0.5257
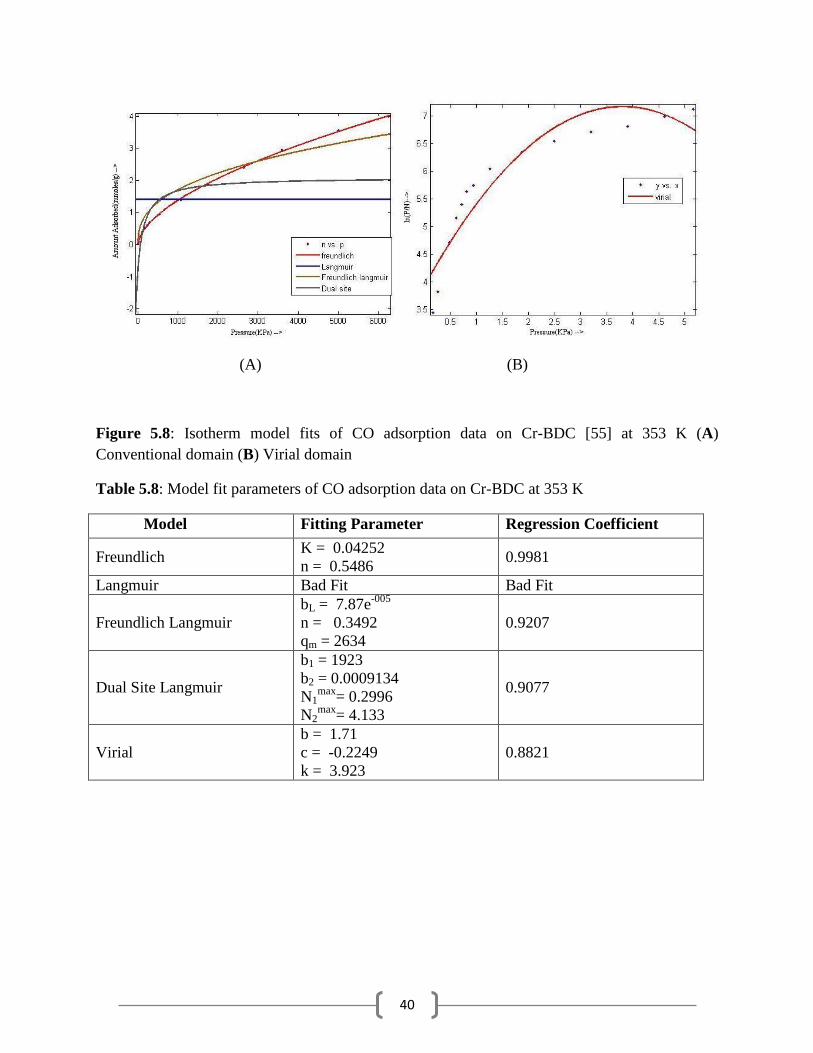
40
(A) (B)
Figure 5.8: Isotherm model fits of CO adsorption data on Cr-BDC [55] at 353 K (A)
Conventional domain (B) Virial domain
Table 5.8: Model fit parameters of CO adsorption data on Cr-BDC at 353 K
Model Fitting Parameter Regression Coefficient
Freundlich K = 0.04252
n = 0.5486 0.9981
Langmuir Bad Fit Bad Fit
Freundlich Langmuir
bL = 7.87e-005
n = 0.3492
qm = 2634
0.9207
Dual Site Langmuir
b1 = 1923
b2 = 0.0009134
N1max
= 0.2996
N2max
= 4.133
0.9077
Virial
b = 1.71
c = -0.2249
k = 3.923
0.8821
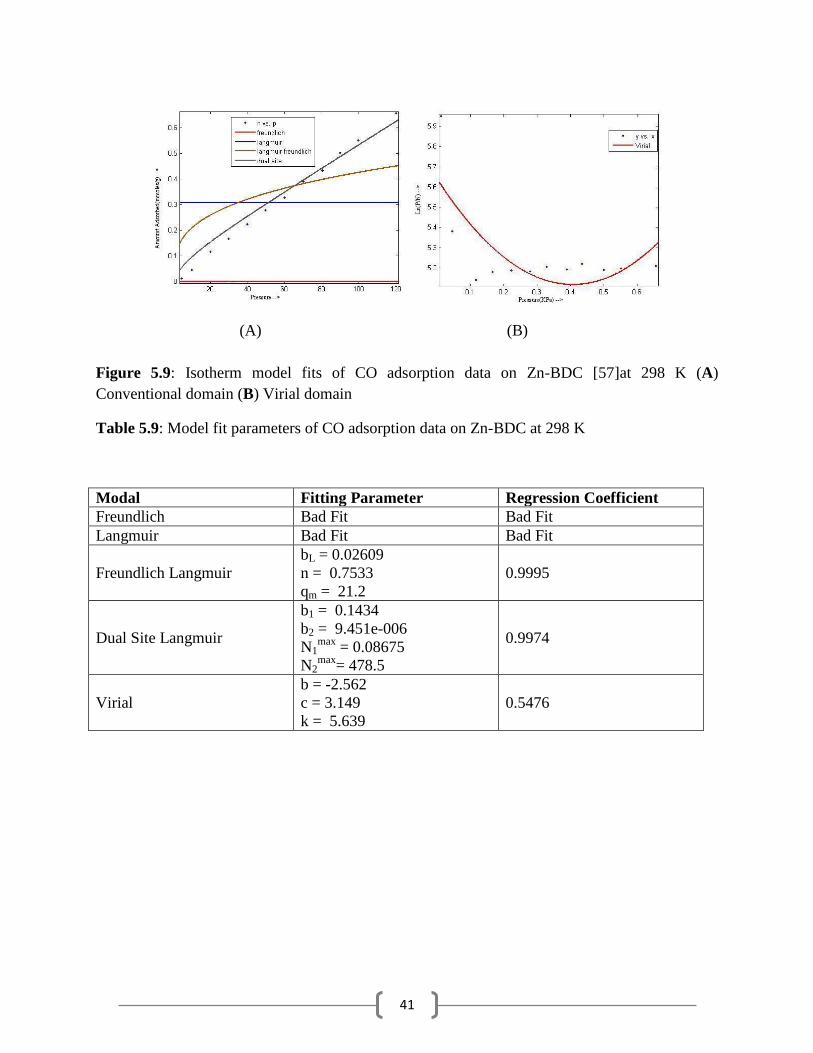
41
(A) (B)
Figure 5.9: Isotherm model fits of CO adsorption data on Zn-BDC [57]at 298 K (A)
Conventional domain (B) Virial domain
Table 5.9: Model fit parameters of CO adsorption data on Zn-BDC at 298 K
Modal Fitting Parameter Regression Coefficient
Freundlich Bad Fit Bad Fit
Langmuir Bad Fit Bad Fit
Freundlich Langmuir
bL = 0.02609
n = 0.7533
qm = 21.2
0.9995
Dual Site Langmuir
b1 = 0.1434
b2 = 9.451e-006
N1max
= 0.08675
N2max
= 478.5
0.9974
Virial
b = -2.562
c = 3.149
k = 5.639
0.5476
42
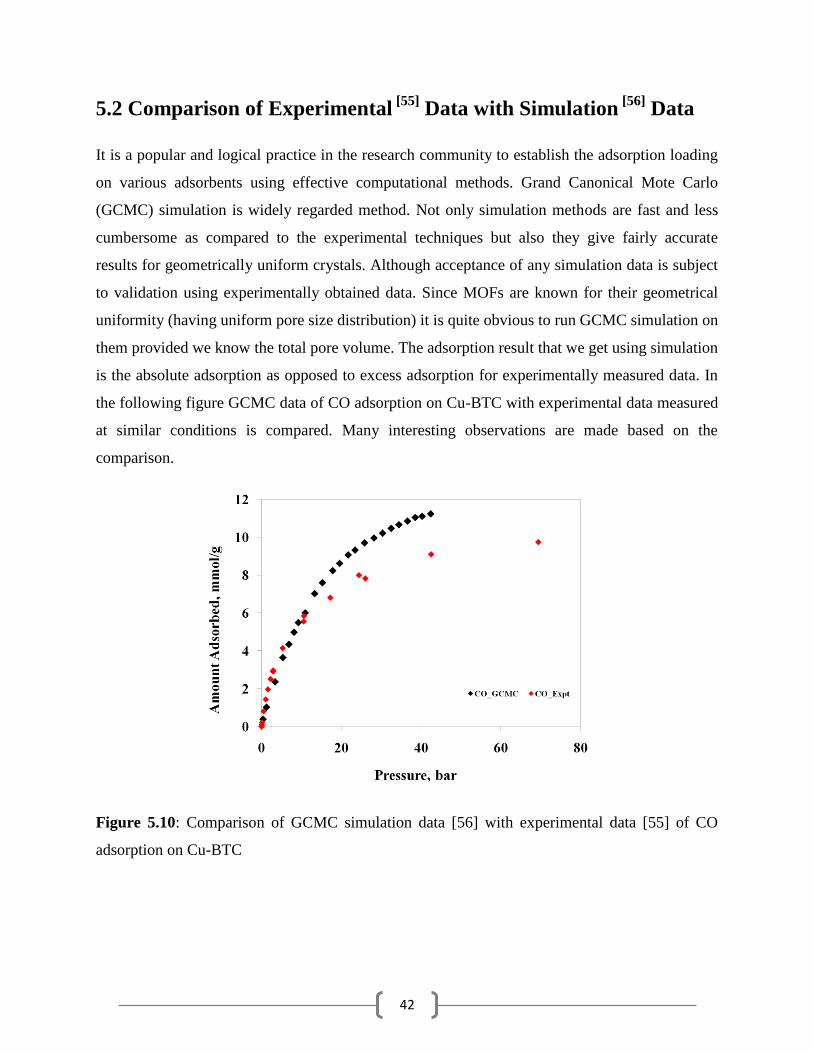
5.2 Comparison of Experimental [55]
Data with Simulation [56]
Data
It is a popular and logical practice in the research community to establish the adsorption loading
on various adsorbents using effective computational methods. Grand Canonical Mote Carlo
(GCMC) simulation is widely regarded method. Not only simulation methods are fast and less
cumbersome as compared to the experimental techniques but also they give fairly accurate
results for geometrically uniform crystals. Although acceptance of any simulation data is subject
to validation using experimentally obtained data. Since MOFs are known for their geometrical
uniformity (having uniform pore size distribution) it is quite obvious to run GCMC simulation on
them provided we know the total pore volume. The adsorption result that we get using simulation
is the absolute adsorption as opposed to excess adsorption for experimentally measured data. In
the following figure GCMC data of CO adsorption on Cu-BTC with experimental data measured
at similar conditions is compared. Many interesting observations are made based on the
comparison.
Figure 5.10: Comparison of GCMC simulation data [56] with experimental data [55] of CO
adsorption on Cu-BTC
43
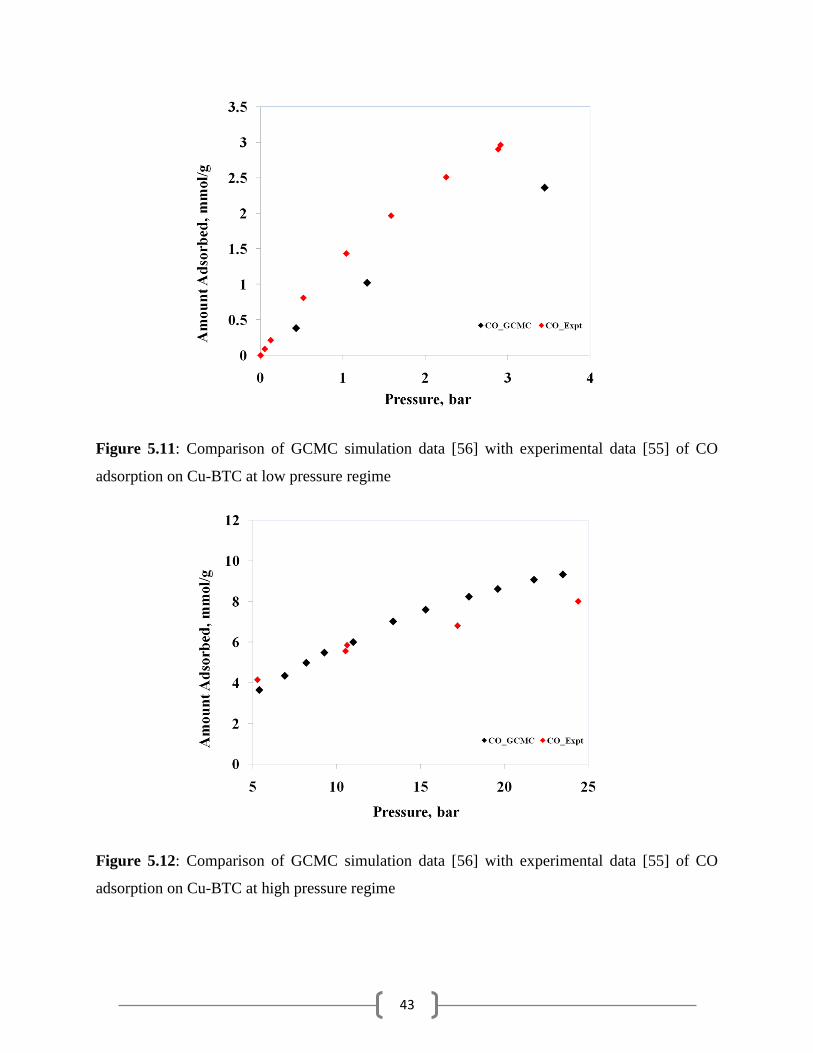
Figure 5.11: Comparison of GCMC simulation data [56] with experimental data [55] of CO
adsorption on Cu-BTC at low pressure regime
Figure 5.12: Comparison of GCMC simulation data [56] with experimental data [55] of CO
adsorption on Cu-BTC at high pressure regime
44
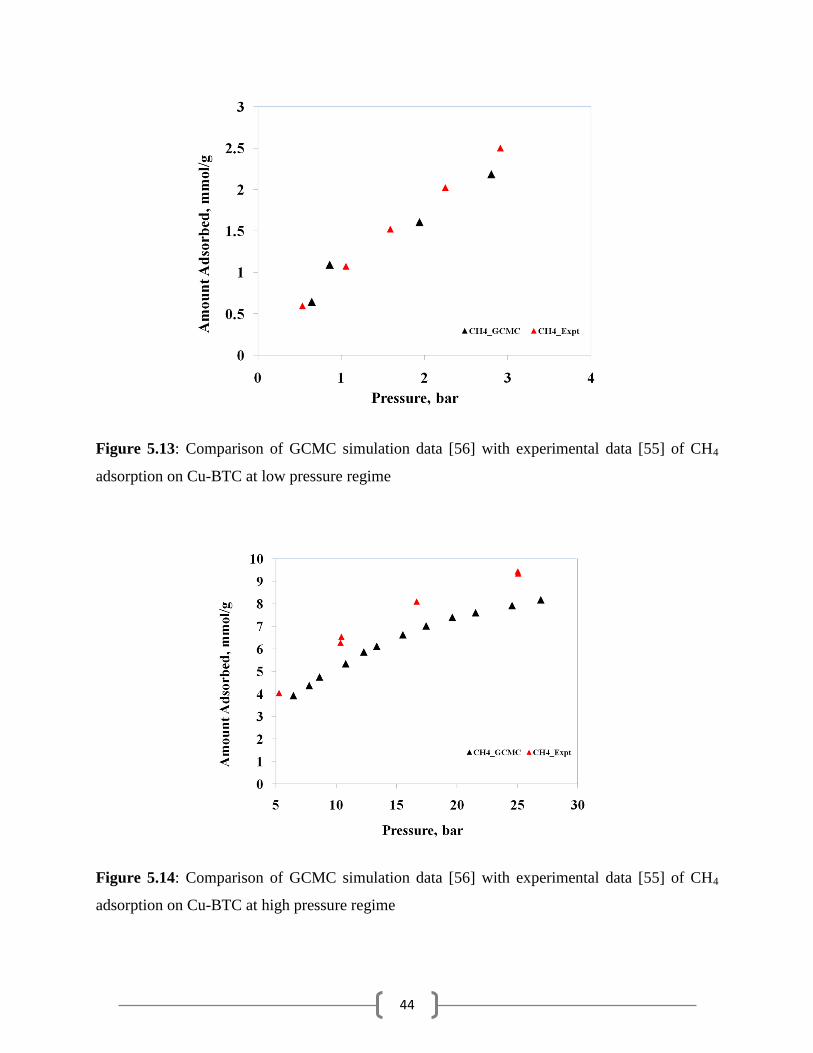
Figure 5.13: Comparison of GCMC simulation data [56] with experimental data [55] of CH4
adsorption on Cu-BTC at low pressure regime
Figure 5.14: Comparison of GCMC simulation data [56] with experimental data [55] of CH4
adsorption on Cu-BTC at high pressure regime
45
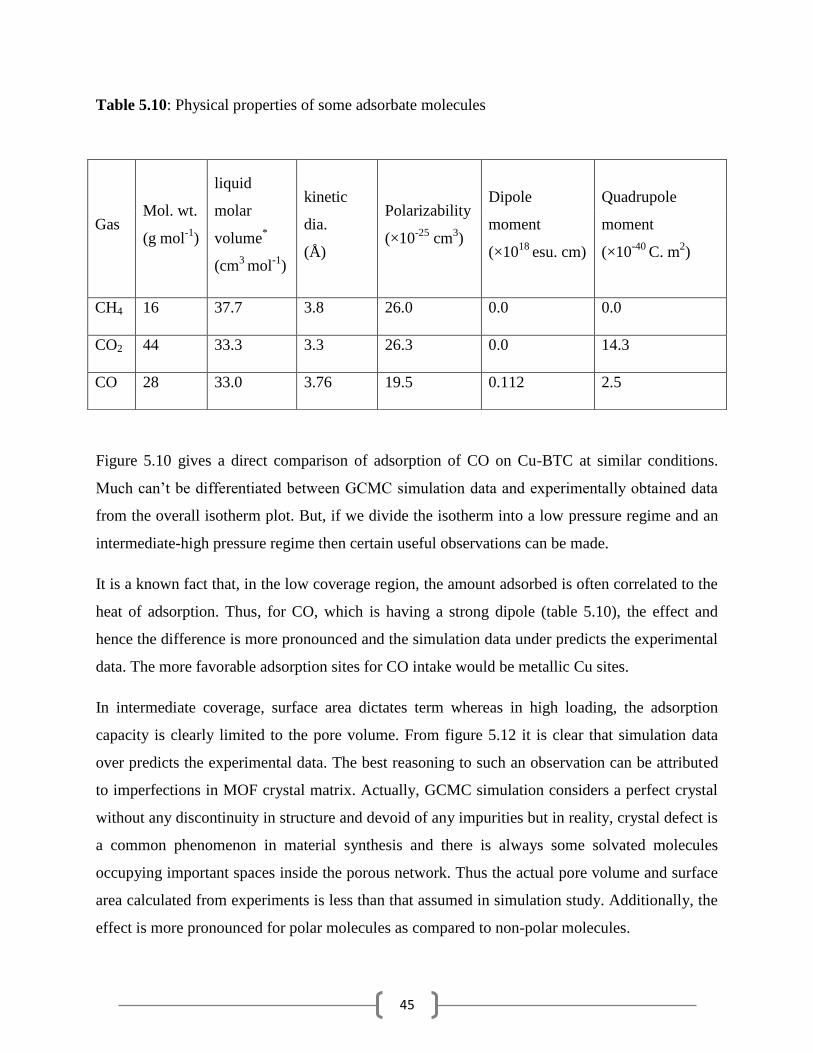
Table 5.10: Physical properties of some adsorbate molecules
Figure 5.10 gives a direct comparison of adsorption of CO on Cu-BTC at similar conditions.
Much can‟t be differentiated between GCMC simulation data and experimentally obtained data
from the overall isotherm plot. But, if we divide the isotherm into a low pressure regime and an
intermediate-high pressure regime then certain useful observations can be made.
It is a known fact that, in the low coverage region, the amount adsorbed is often correlated to the
heat of adsorption. Thus, for CO, which is having a strong dipole (table 5.10), the effect and
hence the difference is more pronounced and the simulation data under predicts the experimental
data. The more favorable adsorption sites for CO intake would be metallic Cu sites.
In intermediate coverage, surface area dictates term whereas in high loading, the adsorption
capacity is clearly limited to the pore volume. From figure 5.12 it is clear that simulation data
over predicts the experimental data. The best reasoning to such an observation can be attributed
to imperfections in MOF crystal matrix. Actually, GCMC simulation considers a perfect crystal
without any discontinuity in structure and devoid of any impurities but in reality, crystal defect is
a common phenomenon in material synthesis and there is always some solvated molecules
occupying important spaces inside the porous network. Thus the actual pore volume and surface
area calculated from experiments is less than that assumed in simulation study. Additionally, the
effect is more pronounced for polar molecules as compared to non-polar molecules.
Gas Mol. wt.
(g mol-1
)
liquid
molar
volume*
(cm3
mol-1
)
kinetic
dia.
(Å)
Polarizability
(×10-25
cm3)
Dipole
moment
(×1018
esu. cm)
Quadrupole
moment
(×10-40
C. m2)
CH4 16 37.7 3.8 26.0 0.0 0.0
CO2 44 33.3 3.3 26.3 0.0 14.3
CO 28 33.0 3.76 19.5 0.112 2.5

46
To have a comparison, similar exercise is carried out with CH4 on Cu-BTC. As shown in the
figures 5.13 and 5.14, the effects are less pronounced as compared to CO.
This difference in simulation and experimental data reflects on more rationality during
comparison. Actually, crystal defects and presence of solvent molecules inside the adsorbent
matrix during experimentation may lead to some anomalies in comparison with simulation
results, since during simulation a perfect crystal is assumed.
47
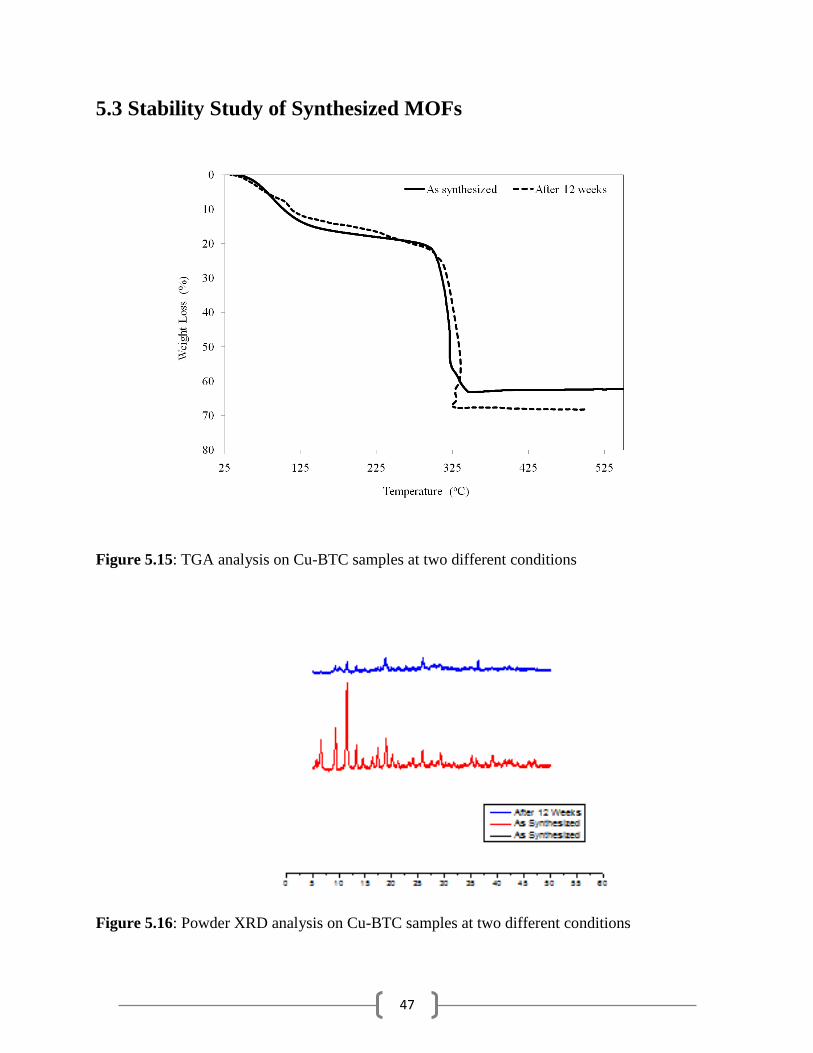
5.3 Stability Study of Synthesized MOFs
Figure 5.15: TGA analysis on Cu-BTC samples at two different conditions
Figure 5.16: Powder XRD analysis on Cu-BTC samples at two different conditions
48
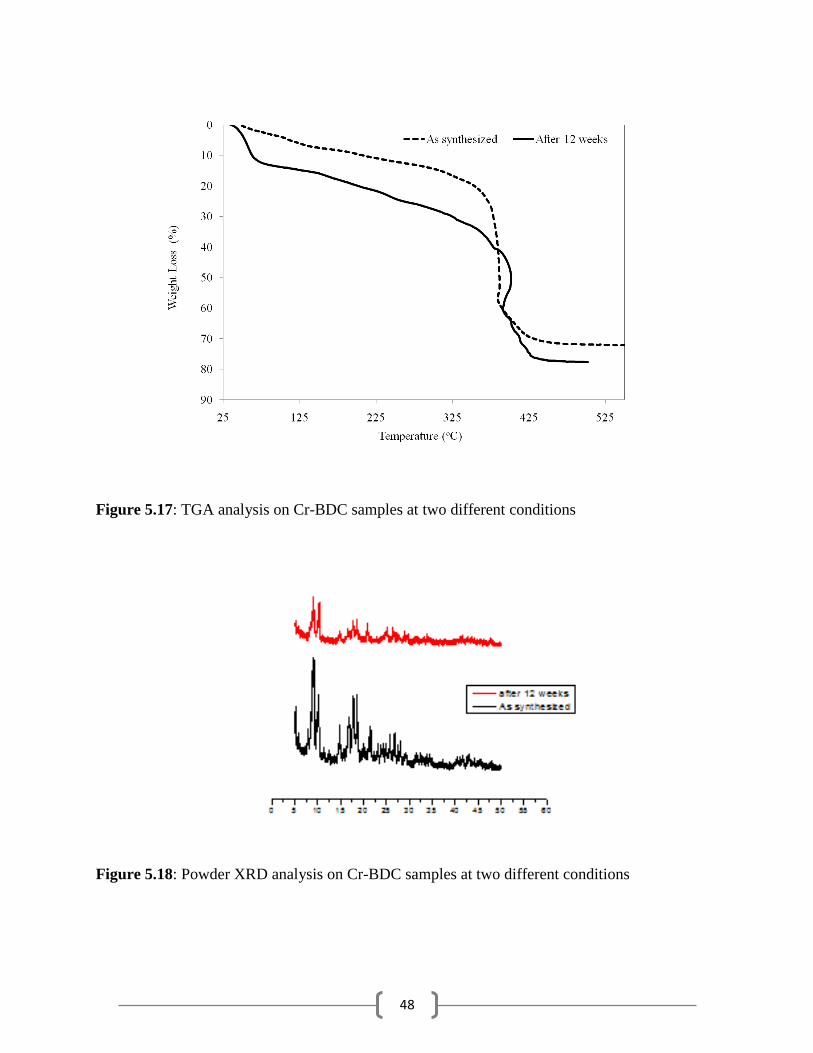
Figure 5.17: TGA analysis on Cr-BDC samples at two different conditions
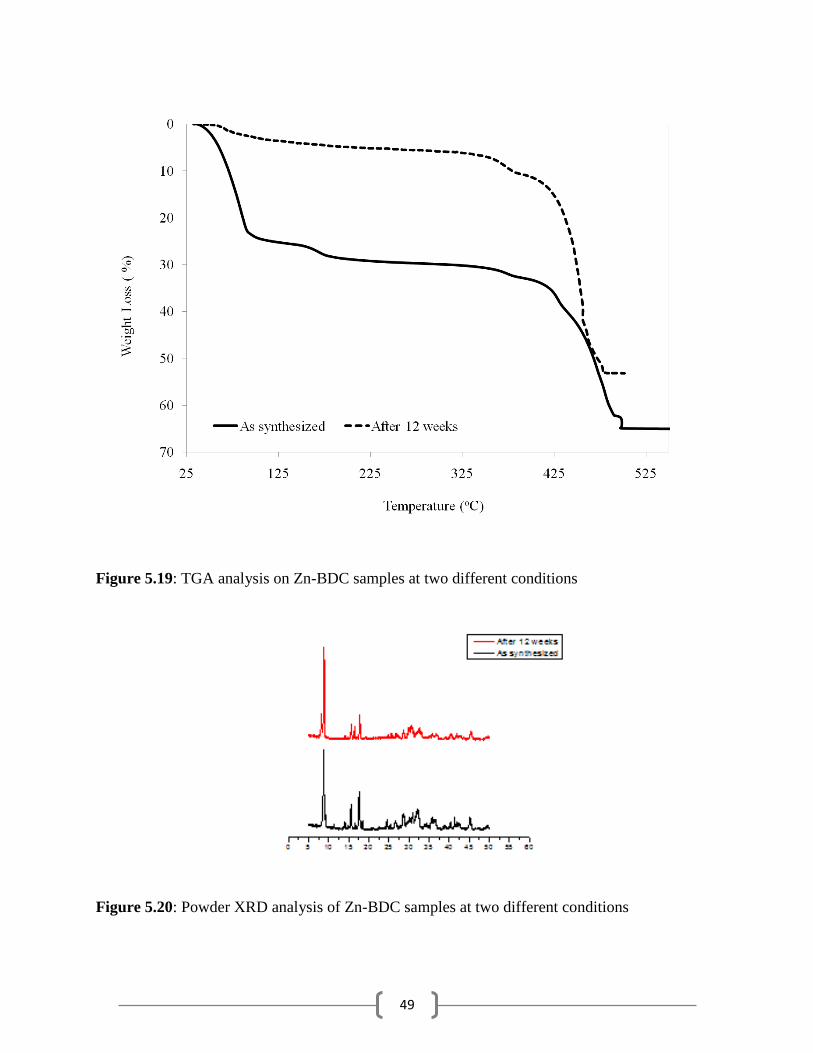
Figure 5.18: Powder XRD analysis on Cr-BDC samples at two different conditions
49
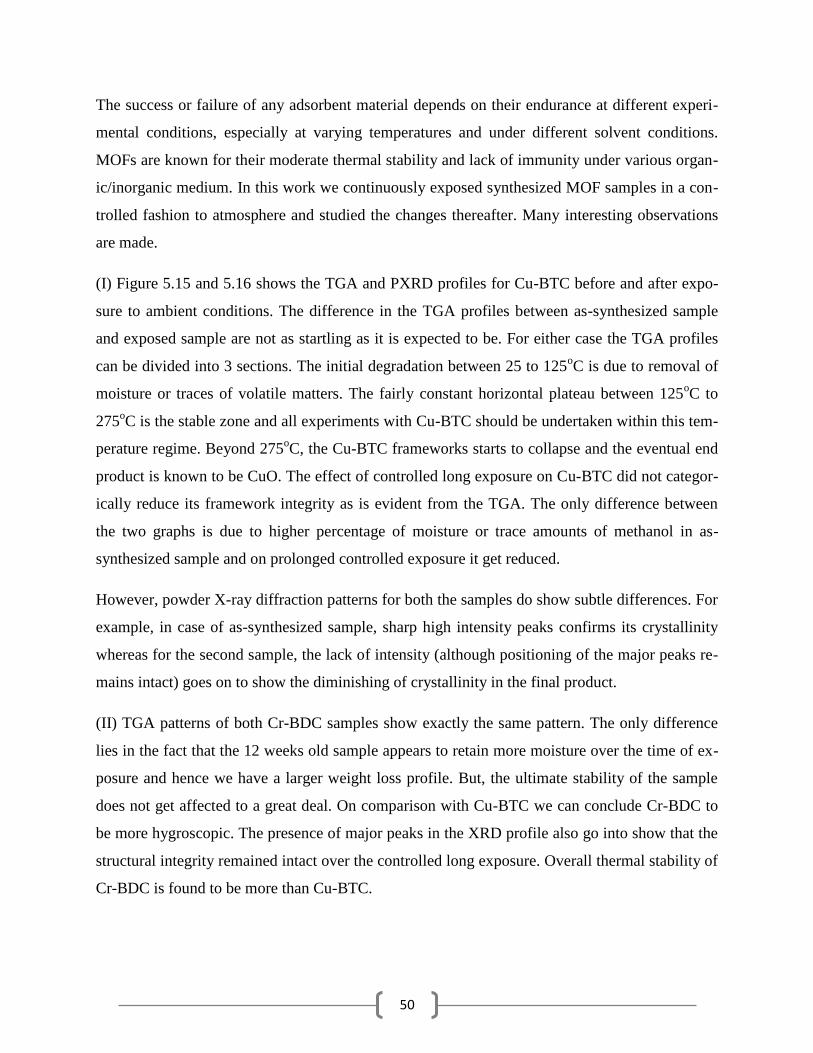
Figure 5.19: TGA analysis on Zn-BDC samples at two different conditions
Figure 5.20: Powder XRD analysis of Zn-BDC samples at two different conditions
50
The success or failure of any adsorbent material depends on their endurance at different experi-
mental conditions, especially at varying temperatures and under different solvent conditions.
MOFs are known for their moderate thermal stability and lack of immunity under various organ-
ic/inorganic medium. In this work we continuously exposed synthesized MOF samples in a con-
trolled fashion to atmosphere and studied the changes thereafter. Many interesting observations
are made.
(I) Figure 5.15 and 5.16 shows the TGA and PXRD profiles for Cu-BTC before and after expo-
sure to ambient conditions. The difference in the TGA profiles between as-synthesized sample
and exposed sample are not as startling as it is expected to be. For either case the TGA profiles
can be divided into 3 sections. The initial degradation between 25 to 125oC is due to removal of
moisture or traces of volatile matters. The fairly constant horizontal plateau between 125oC to
275oC is the stable zone and all experiments with Cu-BTC should be undertaken within this tem-
perature regime. Beyond 275oC, the Cu-BTC frameworks starts to collapse and the eventual end
product is known to be CuO. The effect of controlled long exposure on Cu-BTC did not categor-
ically reduce its framework integrity as is evident from the TGA. The only difference between
the two graphs is due to higher percentage of moisture or trace amounts of methanol in as-
synthesized sample and on prolonged controlled exposure it get reduced.
However, powder X-ray diffraction patterns for both the samples do show subtle differences. For
example, in case of as-synthesized sample, sharp high intensity peaks confirms its crystallinity
whereas for the second sample, the lack of intensity (although positioning of the major peaks re-
mains intact) goes on to show the diminishing of crystallinity in the final product.
(II) TGA patterns of both Cr-BDC samples show exactly the same pattern. The only difference
lies in the fact that the 12 weeks old sample appears to retain more moisture over the time of ex-
posure and hence we have a larger weight loss profile. But, the ultimate stability of the sample
does not get affected to a great deal. On comparison with Cu-BTC we can conclude Cr-BDC to
be more hygroscopic. The presence of major peaks in the XRD profile also go into show that the
structural integrity remained intact over the controlled long exposure. Overall thermal stability of
Cr-BDC is found to be more than Cu-BTC.
51
(III) Thermally, Zn-BDC or MOF-5 is found to be the most stable out of the three MOFs that we
have studied. Although TGA profiles of both the samples show a constant pattern, presence of a
high percentage of DMF from post-synthesis treatment causes a greater weight-loss in the as-
synthesized sample whereas over the prolonged exposure to atmosphere causes Zn-BDC to lose
most of the solvated DMF and hence we can see a less weight loss for a 12 week old sample.
However, the structural integrity of the crystals remains intact as is evident from the powder
XRD profile.
To help corroborate our findings the SEM imaging of all the samples are taken.
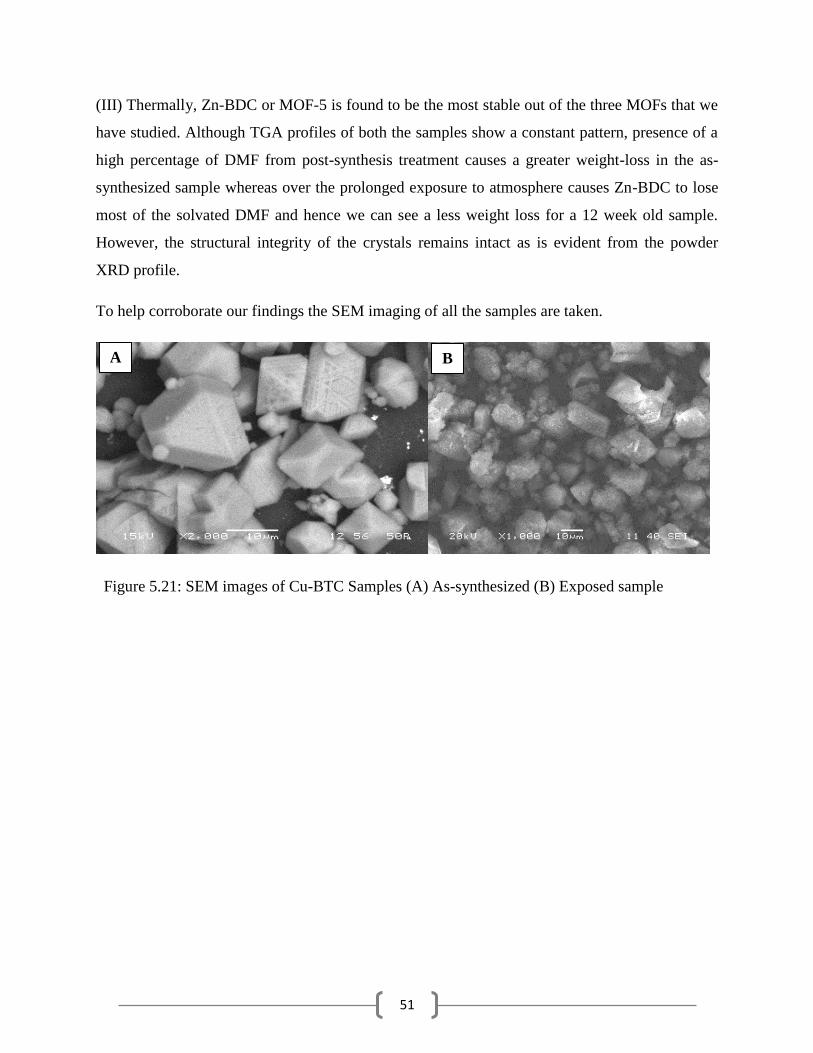
Figure 5.21: SEM images of Cu-BTC Samples (A) As-synthesized (B) Exposed sample
A B
52
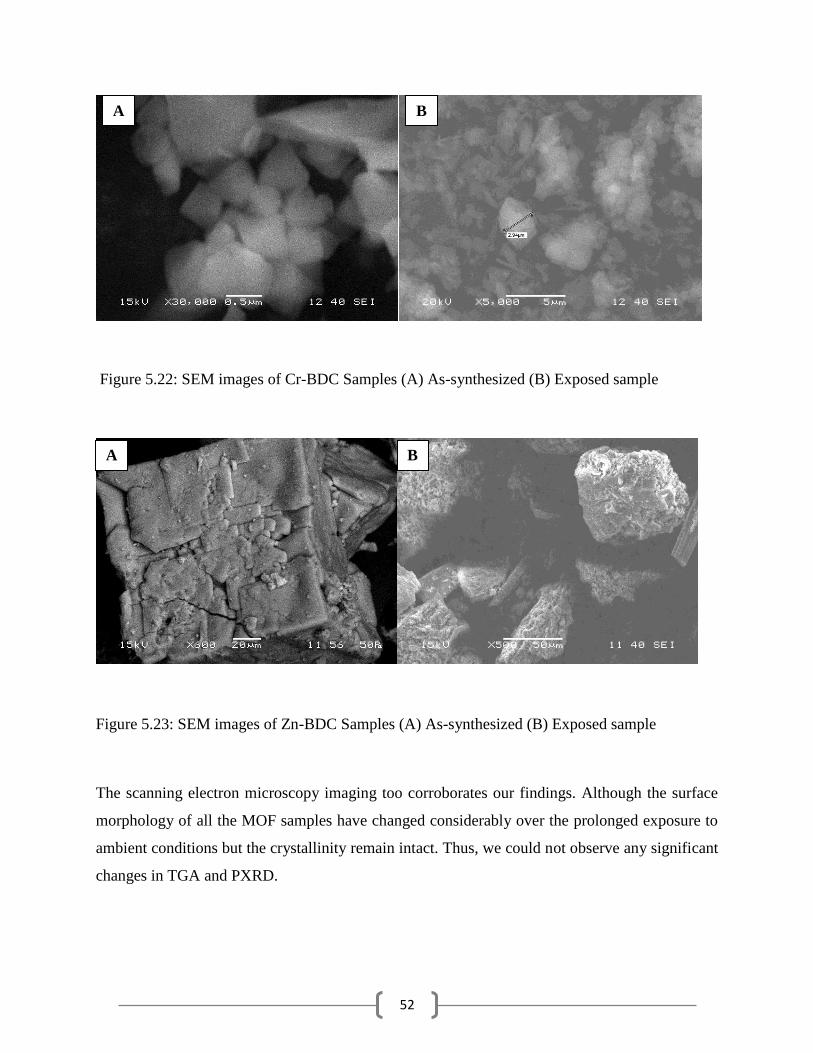
Figure 5.22: SEM images of Cr-BDC Samples (A) As-synthesized (B) Exposed sample
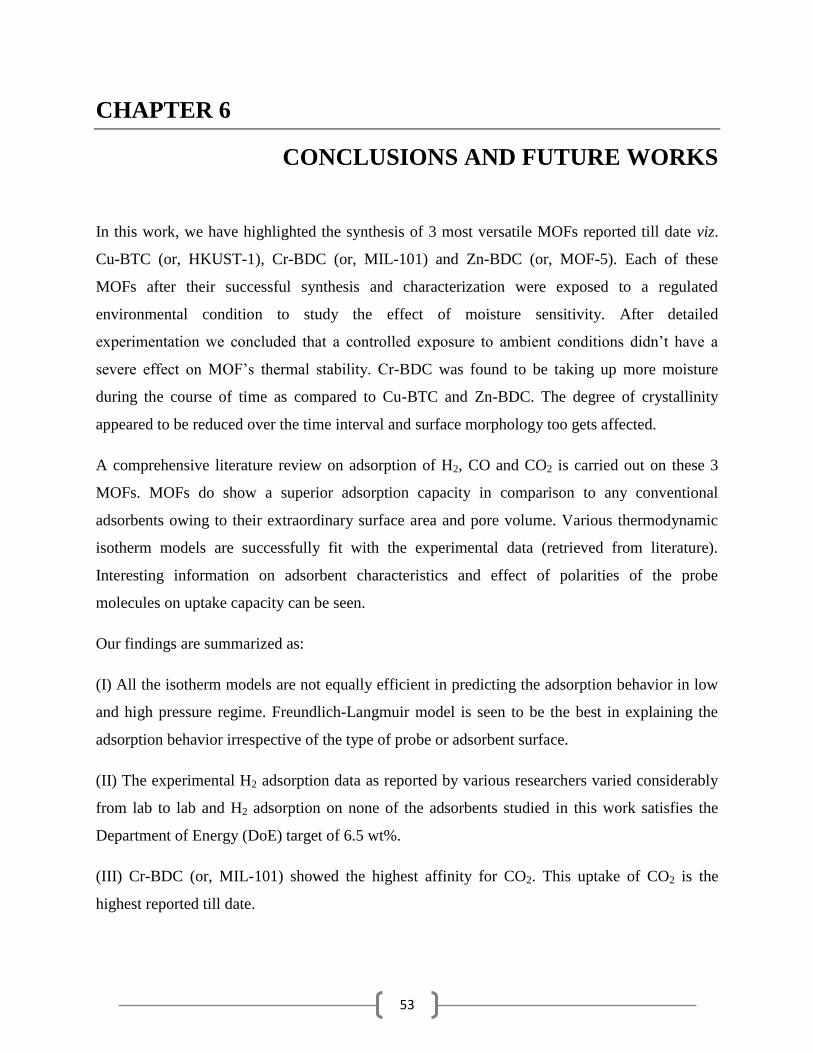
Figure 5.23: SEM images of Zn-BDC Samples (A) As-synthesized (B) Exposed sample
The scanning electron microscopy imaging too corroborates our findings. Although the surface
morphology of all the MOF samples have changed considerably over the prolonged exposure to
ambient conditions but the crystallinity remain intact. Thus, we could not observe any significant
changes in TGA and PXRD.
A B
A B
53
CHAPTER 6
CONCLUSIONS AND FUTURE WORKS
In this work, we have highlighted the synthesis of 3 most versatile MOFs reported till date viz.
Cu-BTC (or, HKUST-1), Cr-BDC (or, MIL-101) and Zn-BDC (or, MOF-5). Each of these
MOFs after their successful synthesis and characterization were exposed to a regulated
environmental condition to study the effect of moisture sensitivity. After detailed
experimentation we concluded that a controlled exposure to ambient conditions didn‟t have a
severe effect on MOF‟s thermal stability. Cr-BDC was found to be taking up more moisture
during the course of time as compared to Cu-BTC and Zn-BDC. The degree of crystallinity
appeared to be reduced over the time interval and surface morphology too gets affected.
A comprehensive literature review on adsorption of H2, CO and CO2 is carried out on these 3
MOFs. MOFs do show a superior adsorption capacity in comparison to any conventional
adsorbents owing to their extraordinary surface area and pore volume. Various thermodynamic
isotherm models are successfully fit with the experimental data (retrieved from literature).
Interesting information on adsorbent characteristics and effect of polarities of the probe
molecules on uptake capacity can be seen.
Our findings are summarized as:
(I) All the isotherm models are not equally efficient in predicting the adsorption behavior in low
and high pressure regime. Freundlich-Langmuir model is seen to be the best in explaining the
adsorption behavior irrespective of the type of probe or adsorbent surface.
(II) The experimental H2 adsorption data as reported by various researchers varied considerably
from lab to lab and H2 adsorption on none of the adsorbents studied in this work satisfies the
Department of Energy (DoE) target of 6.5 wt%.
(III) Cr-BDC (or, MIL-101) showed the highest affinity for CO2. This uptake of CO2 is the
highest reported till date.
54
(IV) Although experimental data on CO adsorption on any MOF material is scarce, but still
within our review, we have found Cr-BDC to have the highest loading of CO. The higher loading
can be attributed to very high surface area (ca. 3000 m2 g
-1) for Cr-BDC amongst the studied
MOFs.
(V) The comparison of simulation with experimental data of CO and CH4 on Cu-BTC has shown
that for polar molecule e.g. CO, simulation data under predicts the experimental data whereas in
the higher loading region simulation data over predicts. This is less marked for non-polar gas like
CH4. It is worth mentioning that even though there are variations in simulation result predictions
with experimental data but still Grand Canonical Monte Carlo (GCMC) simulation is a strong
method in predicting experimental excess adsorption data particularly when total pore volume
information and single crystal XRD data is available.
Moreover, similar exercises can be done for other industrially important gases for a better
understanding on adsorption. Elaborate GCMC simulation should be done assuming probable
crystal imperfections for a better comparison. Newer derivatives of MOFs must be synthesized
and studied with an aim on improved performances, before establishing itself to be a force to
reckon with in near future.
55
REFERENCES
[1] http://en.wikipedia.org
[2] http://www.xamplified.com/adsorption/
[3] Yaghi, O. M., O‟Keeffe, M., Ockwig, N. W., Chae, H. K., Eddaoudi, M., and Kim, J.,
“Reticular Synthesis and the design of New Materials,” Nature, 423, 705-714 (2003).
[4] Rowsell, J. L. C., and Yaghi, O. M.,“ Metal–organic frameworks: a new class of porous
materials,” Micropor. Mesopor.Mater., 73, 3-14 (2004).
[5] Jinchen Liu, Jeffrey T. Culp, Sittichai Natesakhawat, Bradley C. Bockrath, Brian Zande, S.
G. Sankar, Giovanni Garberoglio, and J. Karl Johnson, “Experimental and Theoretical Studies of
Gas Adsorption in Cu3(BTC)2” J. Phys. Chem. C., 111, 9305-9313(2007).
[6] Chui, S. S.-Y., Lo, S. M.-F., Charmant, J. P. H., Orpen, A. G., and Williams, I. D.,“A
Chemically Functionalizable Nanoporous material [Cu3(TMA)2(H2O)3]n,” Science, 283, 1148-
1150 (1999).
[7] Wang, Q.M., Shen, D., Bülow, M., Lau, M. L., Deng, S., Fitch, F. R., Lemcoff, N. O.,
Semanscin, J., “Metallo-organic molecular sieve for gas separation and purification,” Micropor.
Mesopor.Mater., 55, 217-230 (2002).
[8] Vishnyakov, A., Ravikovitch, P. I., Neimark, A. V., Bülow, M., Wang, Q. M.,“Nanopore
structure and sorption properties of Cu-BTC metal-organic framework,” Nano Lett., 3, 713-718
(2003).
[9] Schlichte, K., Kratzke, T., and Kaskel, S.,“Improved synthesis, thermal stability and catalytic
properties of the metal-organic framework compound Cu3(BTC)2,” Micropor. Mesopor.Mater.,
73, 81-88 (2004).
[10] Millward, A. R., and Yaghi, O. M.,“ Metal-Organic Frameworks with Exceptionally High
Capacity for Storage of Carbon Dioxide at Room Temperature,” J. Am. Chem. Soc., 127, 17998-
17999 (2005).
56
[11] Rowsell, J. L. C., and Yaghi, O. M., “Effects of Functionalization, Catenation, and
Variation of the Metal Oxide and Organic Linking Units on the Low-Pressure Hydrogen
Adsorption Properties of Metal-Organic Frameworks,” J. Am. Chem. Soc., 128, 1304-1315
(2006).
[12] Krungleviciute, V., Lask, K., Heroux, L., Migone, A. D., Lee, J. -Y., Li, J., and Skoulidas,
A.,“ Argon Adsorption on Cu3(Benzene-1,3,5-tricarboxylate)2(H2O)3 Metal-Organic
Framework,” Langmuir, 23, 3106-3109 (2007).
[13] Jiangfeng Yang, Qiang Zhao, Jinping Li , and Jinxiang Dong, “ Synthesis of metal–organic
framework MIL-101 in TMAOH-Cr(NO3)3-H2BDC-H2O and its hydrogen-storage behavior,”
Microporous and Mesoporous Materials, 130, 174–179 (2010).
[14] Do-Young Hong, Young Kyu Hwang, Christian Serre, Ge´rardFe´rey, and Jong-San Chang,
“Porous Chromium Terephthalate MIL-101 with Coordinatively Unsaturated Sites: Surface
Functionalization, Encapsulation, Sorption and Catalysis,” Adv. Funct. Mater., 19, 1537–1552
(2009).
[15] Li, Y., and Yang, R.T., “Hydrogen Storage in Metal-Organic and Covalent-Organic
Frameworks by Spillover,” AIChE J., 54, 269-279 (2008).
[16] Senkovska, I. and Kaskel, S.,“ High pressure methane adsorption in the metal-organic
frameworks Cu3(btc)2, Zn2(bdc)2dabco, and Cr3F(H2O)2O(bdc)3,” Micropor. Mesopor.Mater.,
112, 108-115 (2008).
[17] Li, H., Eddaoudi, M., O‟Keeffe, M., and Yaghi O.M., “Design and synthesis of an
exceptionally stable and highly porous metal–organic framework,” Nature, 402, 276–279 (1999).
[18] Huang, L., Wang, H., Chen, J., Wang, Z., Sun, J., and Zhao, D., “Synthesis, morphology
control, and properties of porous metal–organic coordination polymers,” Micropor Mesopor
Mater, 58(2), 105–114 (2003).
[19] Rowsell, J. L. C., Milward, A. R., Park, K. S., and Yaghi, O. M., “Hydrogen sorption in
functionalized metal–organic frameworks,” J. Am. Chem. Soc. 126(18), 5666–7 (2004).

57
[20] Panella, B., and Hirscher, M., “Hydrogen physisorption in metal– organic porous crystals,”
Adv. Mater. 17(5), 538–41 (2005).
[21] Panella, B., Hirscher, M., Putter, H., and Muller, U., “Hydrogen adsorption in metal–
organic frameworks: Cu-MOFs and Zn-MOFs compared,” AdvFunct Mater, 16(4), 520–4
(2006).
[22] Rowsell, J. L. C., Millward, A. R., Park, K. S., and Yaghi, O. M.,“ Hydrogen Sorption in
Functionalized Metal-Organic Frameworks,” J. Am. Chem. Soc., 126, 5666-5667 (2004).
[23] Wong-Foy, A. G., Matzger, A. J., and Yaghi, O. M., “Exceptional H2 Saturation Uptake in
Microporous Metal-Organic Frameworks,” J. Am. Chem. Soc., 128, 3494-3495 (2006).
[24] Pan, L., Sander, M. B., Huang, X., Li, J., Smith, M., Bittner, E., Bockrath, B., and Karl
Johnson, J.,“ Microporous Metal Organic Materials: Promising Candidates as Sorbents for
Hydrogen Storage,” J. Am. Chem. Soc., 126, 1308-1309 (2004).
[25] Férey, G., Latroche, M., Serre, C., Millange, F., Loiseau, T., and Percheron-Guégan, A.,
“Hydrogen adsorption in the nanoporous metal-benzenedicarboxylateM(OH)(O2C–C6H4–CO2)
(M = Al3+
, Cr3+
), MIL-53,” Chem. Commun., 2976-2977 (2003).
[26] Latroche, M., Surblé S., Serre, C., Mellot-Draznieks, C., Llewellyn, P. L., Lee, J. H, Chang,
J. S., Jhung, S. H., and Férey, G., “Hydrogen Storage in the Giant-Pore Metal-Organic
Frameworks MIL-100 and MIL-101,” Angew. Chem. Int. Ed., 45, 8227-8231 (2006).
[27] Li, Y., and Yang, R. T.,“Significantly Enhanced Hydrogen Storage in Metal-Organic
Frameworks via Spillover,” J. Am. Chem. Soc., 128, 726-727 (2006).
[28] Van de Voorde, M., Verelst, H., and Baron, G.V., “Measurement of O2-N2 Binary Sorption
on 5A Zeolite by Isotope Tracer and Perturbation Chromatography,” J. Porous Materials, 2, 51-
57 (1995).
58
[29] Staudt, R., Herbst, A., Beutekamp S., and Harting, P., “Adsorption of Pure Gases and
Mixtures on Porous Solids up to High Pressures,” Adsorption, 11, 379-384 (2005).
[30] Shen, D., and Bülow, M., “Comparison of Experimental Techniques for Measuring Isosteric
Heat of Adsorption,” Adsorption, 6, 275-286 (2000).
[31] Talu, O., andZwiebel, I., “Multicomponent Adsorption Equilibria of Nonideal Mixtures”,
AIChE J.,32, 1263-1276 (1986).
[32] Li, Y., and Yang, R.T., “Gas Adsorption and storage in Metal-Organic Framework MOF-
177,” Langmuir, 23, 12937-12944 (2007).
[33] Wang, S., Yang, Q., and Zhong, C.,“Adsorption and separation of binary mixtures in a
metal-organic framework Cu-BTC: A computational study,” Sep. Purf. Tech., 60, 30-35 (2008).
[34] Yazaydin, A.O., Snurr, R.Q., Park, T.-H., Koh, K., Liu, J., LeVan, M.D., Benin, A.I.,
Jakubczak, P., Lanuza, M., Galloway, D.B., Low, J.J., and Willis, R.R., “Screening of Metal-
Organic Frameworks for Carbon Dioxide Capture from Flue Gas Using a Combined
Experimental and Modeling Approach,” J. Am. Chem. Soc., 131, 18198-18199 (2009).
[35] Myers, A.L., “Characterization of nanopores by standard enthalpy and entropy of adsorption
of probe molecules,” Colloids and Surfaces A, 241, 9-14 (2004).
[36] Zhao, Z., Li, Z., and Lin, Y.S., “Adsorption and Diffusion of Carbon Dioxide on Metal-
Organic Framework (MOF-5),” Ind. Eng. Chem. Res., 48, 10015-10020 (2009).
[37] Rosi, N. L., Eckert, J., Eddaoudi, M., Vodak, D. T., Kim, J., O‟Keeffe, M., and Yaghi, O.
M.,“ Hydrogen Storage in Microporous Metal-Organic Frameworks,” Science, 300, 1127-1129
(2003).
[38] Siperstein, F.R., and Myers, A.L., “Mixed-Gas Adsorption,” AIChE J., 47, 1141-1159
(2001).
59
[39] Dunne, J.A., Rao, M., Sircar, S., Gorte, R.J., and Myers, A.L.,“ Calorimetric Heats of
Adsorption and Adsorption Isotherms. 2. O2, N2, Ar, CO2, CH4, C2H6, and SF6 on NaX, H-ZSM-
5, and Na-ZSM-5 Zeolites,” Langmuir, 12,5896-5904 (1996).
[40] García-Pérez, E., Gascón, J., Morales-Flórez, V., Castillo, J.M., Kapteijn, F., and Calero, S.,
“Identification of Adsorption sites in Cu-BTC by Experimentation and Molecular Simulation,”
Langmuir, 25, 1725-1731 (2009).
[41] Sun, M.S., Shah, D. B.,Xu, H. H., and Talu, O., “Adsorption Equilibria of C1 to C4 Alkanes,
CO2, and SF6 on Silicalite,” J. Phys. Chem. B,102, 1466-1473(1998).
[42] Golden, T.C., andSircar, S., “Gas Adsorption on Silicalite,” J. Coll. Inter. Sci., 162, 182-188
(1994).
[43] Dunne, J.A., Mariwala, R., Rao, M., Sircar, S., Gorte, R.J., and Myers A.L., “Calorimetric
Heats of Adsorption and adsorption Isotherms.1. O2, N2, Ar, CO2, CH4, C2H6, and SF6 on
Silicalite,” Langmuir, 12, 5888-5895 (1996).
[44] Talu, O., Zhang, S.-Y., and Hayhurst, D.T., “Effect of Cations on Methane Adsorption by
NaY, MgY, CaY, SrY, and BaY Zeolites,” J. Phys. Chem., 97, 12894-12898 (1993).
[45] Li, P., and Tezel, F.H., “Pure and Binary Adsorption of Methane and Nitrogen by
Silicalite,” J. Chem. Engg. Data,54, 8-15 (2009).
[46] Liang, Z., Marshall, M., and Chaffee, A.L., “CO2 Adsorption-Based Separation by Metal
Organic framework (Cu-BTC) versus Zeolite (13X),” Energy & Fuels, 23, 2785-2789 (2009).
[47] Gas Adsorption equilibria, experimental methods and Adsorptive Isotherms by
jurgenU.Keller,Reinerstaudt
[48] http://en.wikipedia.org/wiki/Langmuir_adsorption_model
[49] NIST Chemistry web book [http://webbook.nist.gov/chemistry/]
[50] Chui, S. S.-Y., Lo, S. M.-F., Charmant, J. P. H., Orpen, A. G., and Williams, I. D.,“A
Chemically Functionalizable Nanoporous material [Cu3(TMA)2(H2O)3]n,” Science, 283, 1148-
1150 (1999).
60
[51] Rowsell, J. L. C., and Yaghi, O. M., “Effects of Functionalization, Catenation, and
Variation of the Metal Oxide and Organic Linking Units on the Low-Pressure Hydrogen
Adsorption Properties of Metal-Organic Frameworks,” J. Am. Chem. Soc., 128, 1304-1315
(2006).
[52] Férey, G., Mellot-Draznieks, C., Serre, C., Millange, F., Dutour, J., Surblé S., and
Margiolaki, I., “A Chromium Terephthalate-Based Solid with Unusually Large Pore Volumes
and Surface Area,” Science, 309, 2040-2042 (2005).
[53] Henrik Fanø Clausen, Rasmus Damgaard Poulsen, Andrew D. Bond, Marie-Agnes
S.Chevallier, Bo Brummerstedt Iversen, “Solvothermal synthesis of new metal organic
framework structures in the zinc–terephthalic acid–dimethyl formamide system” Solid State
Chemistry 178, 3342–3351(2005).
[54] Jinping Li, Shaojuan Cheng, Qiang Zhao, Peipei Long, Jinxiang Dong, “Synthesis and
hydrogen-storage behavior of metal–organic framework MOF-5” hydrogen energy 34, 1377-
1382 (2009).
[55] PradipChowdhury ,SamuelMekala, FriederDreisbach, Sasidhar Gumma a, “Adsorption of
CO, CO2 and CH4 on Cu-BTC and MIL-101 metal organic frameworks: Effect of open metal
sites and adsorbate polarity”, Microporous and Mesoporous Materials 152 (2012) 246–252
[56] Jagadeswara R. Karra, and Krista S. Walton, “Effect of Open Metal Sites on Adsorption of
Polar and Nonpolar Molecules in Metal”, Langmuir, 2008, 24 (16), 8620-8626
[57] Karra, J. R.; Walton, K. S. "Molecular Simulations and Experimental Studies of CO 2 , CO ,
and N 2 Adsorption in Metal-Organic Frameworks". Adsorption Journal Of The International
Adsorption Society 2010, 15735-15740
61
[58] Aprea, P.; Caputo, D.; Gargiulo, N.; Iucolano, F.; Pepe, F.; Ii, F.; Tecchio, P.; Ingegneria,
D.; Roma, P. “Modeling Carbon Dioxide Adsorption on Microporous Substrates : Comparison
between Cu-BTC Metal-Organic Framework and 13X Zeolitic Molecular Sieve”. Engineering
2010, 3655-3661.
[59] Saha, D.; Bao, Z. on “MOF-5 , MOF-177 , and Zeolite 5A”. Environmental Science &
Technology 2010, 44, 1820-1826.
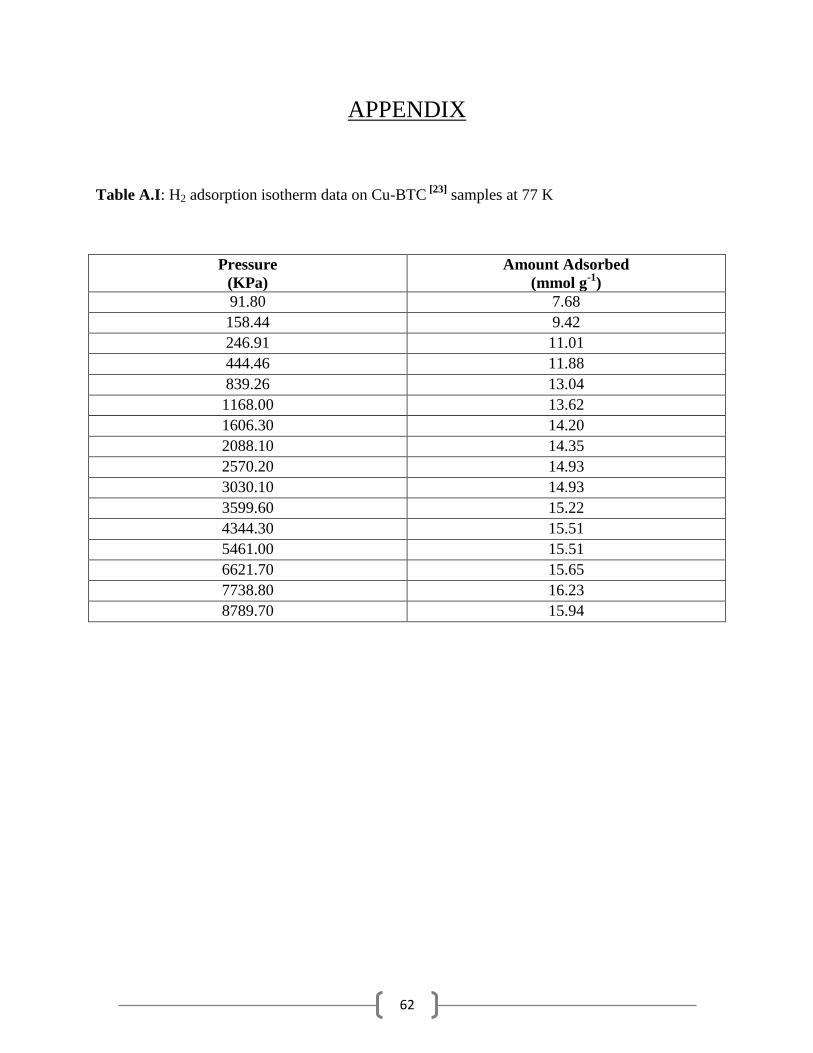
62
APPENDIX
Table A.I: H2 adsorption isotherm data on Cu-BTC [23]
samples at 77 K
Pressure
(KPa)
Amount Adsorbed
(mmol g-1
)
91.80 7.68
158.44 9.42
246.91 11.01
444.46 11.88
839.26 13.04
1168.00 13.62
1606.30 14.20
2088.10 14.35
2570.20 14.93
3030.10 14.93
3599.60 15.22
4344.30 15.51
5461.00 15.51
6621.70 15.65
7738.80 16.23
8789.70 15.94
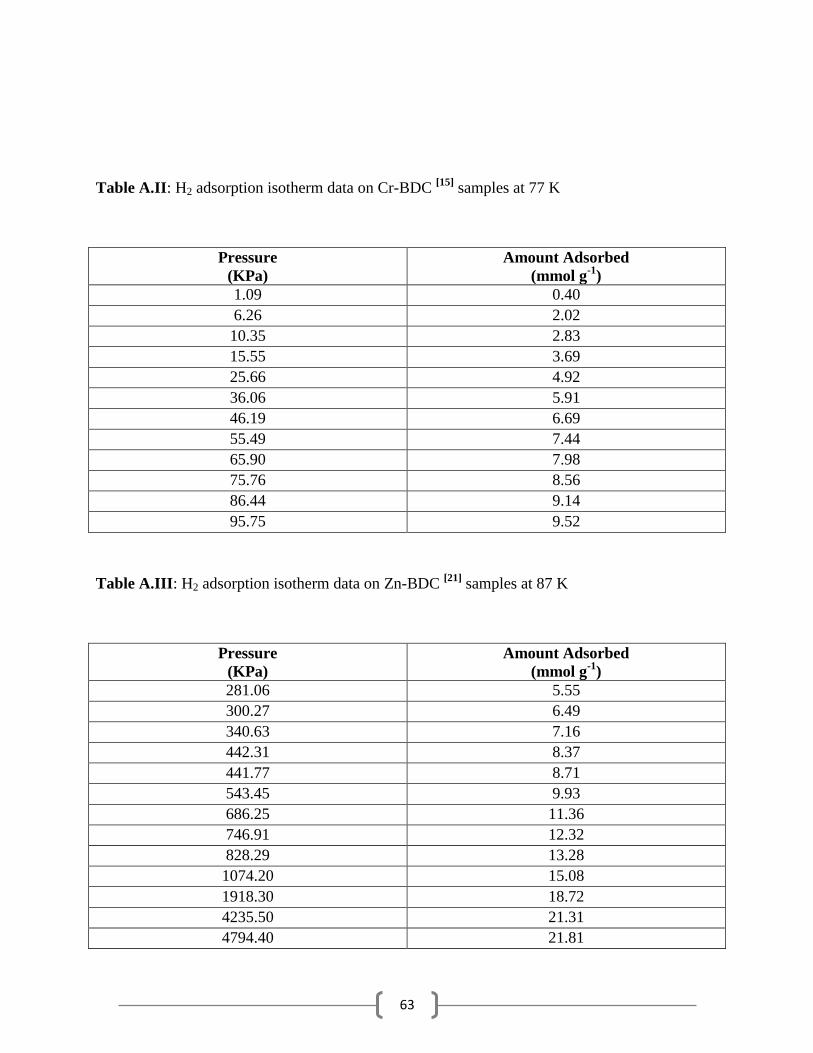
63
Table A.II: H2 adsorption isotherm data on Cr-BDC [15]
samples at 77 K
Pressure
(KPa)
Amount Adsorbed
(mmol g-1
)
1.09 0.40
6.26 2.02
10.35 2.83
15.55 3.69
25.66 4.92
36.06 5.91
46.19 6.69
55.49 7.44
65.90 7.98
75.76 8.56
86.44 9.14
95.75 9.52
Table A.III: H2 adsorption isotherm data on Zn-BDC [21]
samples at 87 K
Pressure
(KPa)
Amount Adsorbed
(mmol g-1
)
281.06 5.55
300.27 6.49
340.63 7.16
442.31 8.37
441.77 8.71
543.45 9.93
686.25 11.36
746.91 12.32
828.29 13.28
1074.20 15.08
1918.30 18.72
4235.50 21.31
4794.40 21.81
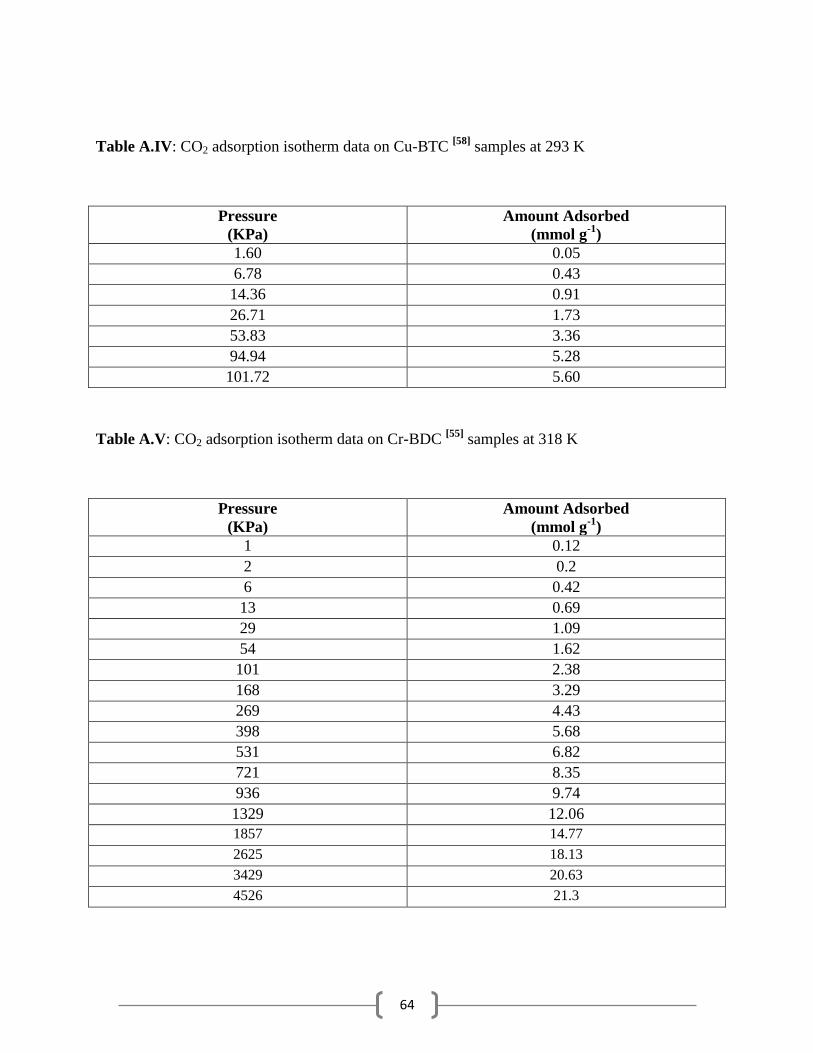
64
Table A.IV: CO2 adsorption isotherm data on Cu-BTC [58]
samples at 293 K
Pressure
(KPa)
Amount Adsorbed
(mmol g-1
)
1.60 0.05
6.78 0.43
14.36 0.91
26.71 1.73
53.83 3.36
94.94 5.28
101.72 5.60
Table A.V: CO2 adsorption isotherm data on Cr-BDC [55]
samples at 318 K
Pressure
(KPa)
Amount Adsorbed
(mmol g-1
)
1 0.12
2 0.2
6 0.42
13 0.69
29 1.09
54 1.62
101 2.38
168 3.29
269 4.43
398 5.68
531 6.82
721 8.35
936 9.74
1329 12.06
1857 14.77
2625 18.13
3429 20.63
4526 21.3
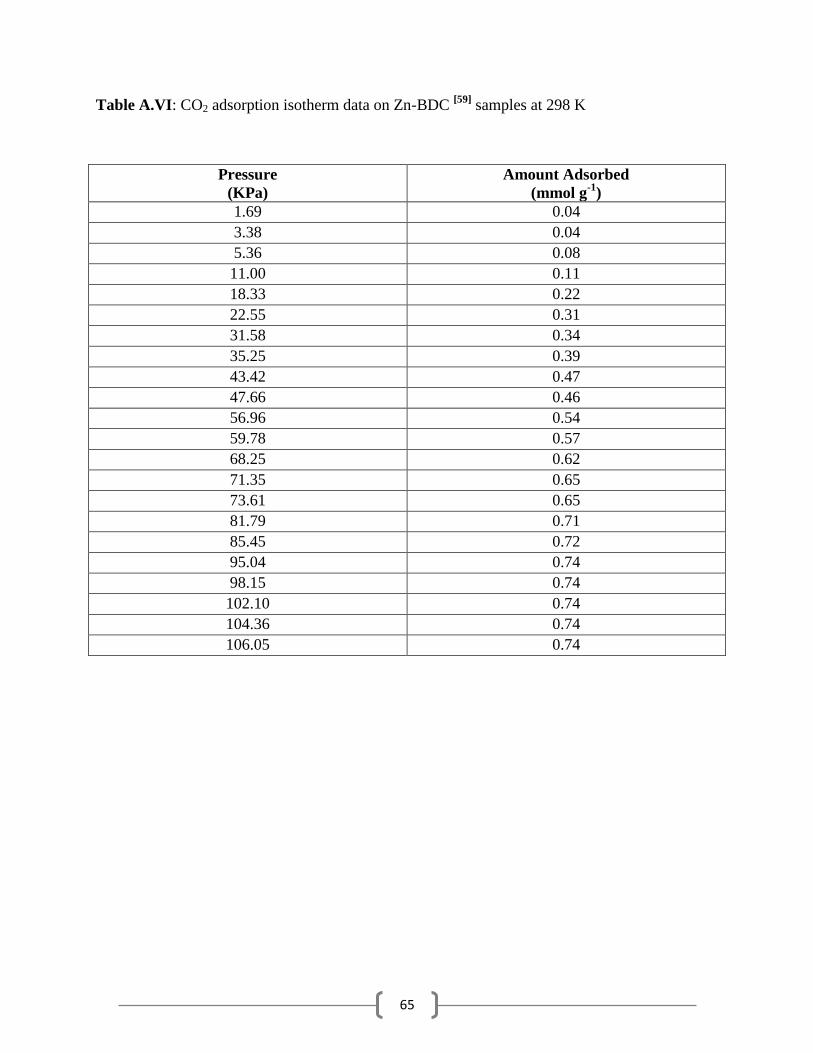
65
Table A.VI: CO2 adsorption isotherm data on Zn-BDC [59]
samples at 298 K
Pressure
(KPa)
Amount Adsorbed
(mmol g-1
)
1.69 0.04
3.38 0.04
5.36 0.08
11.00 0.11
18.33 0.22
22.55 0.31
31.58 0.34
35.25 0.39
43.42 0.47
47.66 0.46
56.96 0.54
59.78 0.57
68.25 0.62
71.35 0.65
73.61 0.65
81.79 0.71
85.45 0.72
95.04 0.74
98.15 0.74
102.10 0.74
104.36 0.74
106.05 0.74
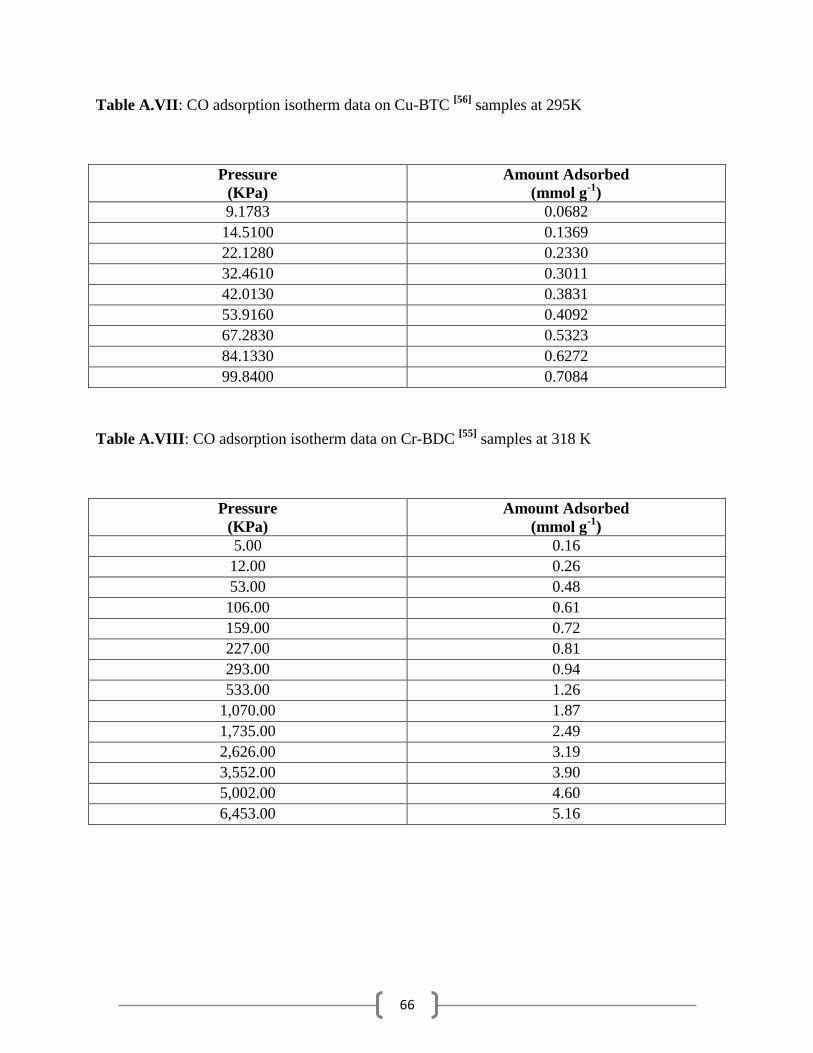
66
Table A.VII: CO adsorption isotherm data on Cu-BTC [56]
samples at 295K
Pressure
(KPa)
Amount Adsorbed
(mmol g-1
)
9.1783 0.0682
14.5100 0.1369
22.1280 0.2330
32.4610 0.3011
42.0130 0.3831
53.9160 0.4092
67.2830 0.5323
84.1330 0.6272
99.8400 0.7084
Table A.VIII: CO adsorption isotherm data on Cr-BDC [55]
samples at 318 K
Pressure
(KPa)
Amount Adsorbed
(mmol g-1
)
5.00 0.16
12.00 0.26
53.00 0.48
106.00 0.61
159.00 0.72
227.00 0.81
293.00 0.94
533.00 1.26
1,070.00 1.87
1,735.00 2.49
2,626.00 3.19
3,552.00 3.90
5,002.00 4.60
6,453.00 5.16
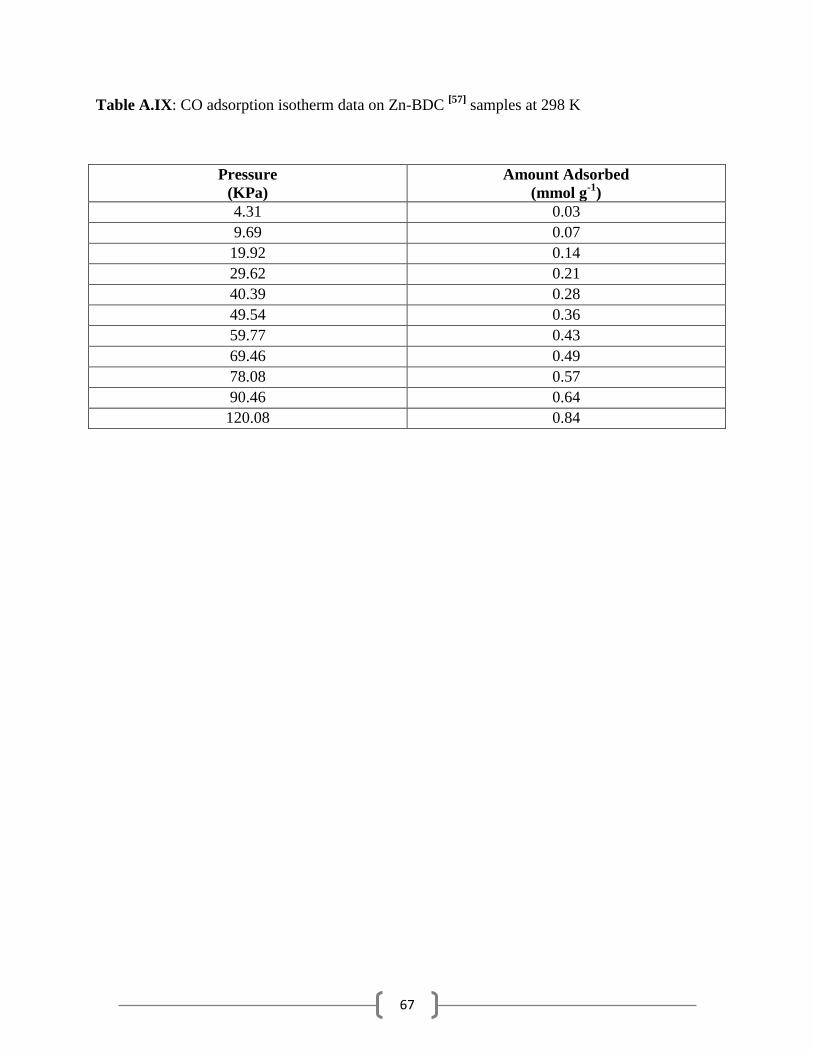
67
Table A.IX: CO adsorption isotherm data on Zn-BDC [57]
samples at 298 K
Pressure
(KPa)
Amount Adsorbed
(mmol g-1
)
4.31 0.03
9.69 0.07
19.92 0.14
29.62 0.21
40.39 0.28
49.54 0.36
59.77 0.43
69.46 0.49
78.08 0.57
90.46 0.64
120.08 0.84

68
RESEARCH PUBLICATIONS
[1] Vinay Agarwal, K Bantraj, and Pradip Chowdhury, “Stability analysis and a systematic
review on study of gas adsorption of CO2, CH4 and CO on Cu-BTC and Cr-BDC Metal Organic
Frameworks,” to be submitted.
Related Documents