1 Supplementary Materials for Improving the Stability of Solar Cells Using Metal-Organic Frameworks Vagif Nevruzoglu 1# , Selçuk Demir 2#* , Gokcehan Karaca 3 , Murat Tomakin 3 , Nuray Bilgin 1 , Fatih Yilmaz 2 1 Recep Tayyip Erdoğan University, Faculty of Engineering, Department of Energy Systems Engineering, Rize, Turkey. 2 Recep Tayyip Erdoğan University, Faculty of Arts and Sciences, Department of Chemistry, Rize, Turkey. 3 Recep Tayyip Erdoğan University, Faculty of Arts and Sciences, Department of Physic, Rize, Turkey. L1: Biphenyl-4,4’-dicarboxylate L2: 2,2’-bipyridine-5,5’-dicarboxylate # These authors contributed equally to this work. * e-mail: [email protected] Electronic Supplementary Material (ESI) for Journal of Materials Chemistry A. This journal is © The Royal Society of Chemistry 2016

Welcome message from author
This document is posted to help you gain knowledge. Please leave a comment to let me know what you think about it! Share it to your friends and learn new things together.
Transcript
1
Supplementary Materials for
Improving the Stability of Solar Cells Using Metal-Organic
Frameworks
Vagif Nevruzoglu1 Selccediluk Demir2 Gokcehan Karaca3 Murat Tomakin3 Nuray Bilgin1
Fatih Yilmaz2
1 Recep Tayyip Erdoğan University Faculty of Engineering Department of Energy Systems
Engineering Rize Turkey
2 Recep Tayyip Erdoğan University Faculty of Arts and Sciences Department of Chemistry
Rize Turkey
3 Recep Tayyip Erdoğan University Faculty of Arts and Sciences Department of Physic
Rize Turkey
L1 Biphenyl-44rsquo-dicarboxylate
L2 22rsquo-bipyridine-55rsquo-dicarboxylate
These authors contributed equally to this work e-mail selcukdemirerdoganedutr
Electronic Supplementary Material (ESI) for Journal of Materials Chemistry AThis journal is copy The Royal Society of Chemistry 2016
2
Results of Zr-L1 MOF
Figure S1 XRD patterns of the Zr-L1 Zr-L1-activated and Zr-L1Cu MOFs
000 010 020 030 040 050 060 070 080 090 1000
100
200
300
400
500
600
VolumeSTP
(ccg)
Relative Pressure
Zr-L1-Activated
Zr-L1Cu
Figure S2 Adsorption (sphere) and desorption (square) isotherms of the Zr-L1-activated and Zr-L1Cu MOFs
3
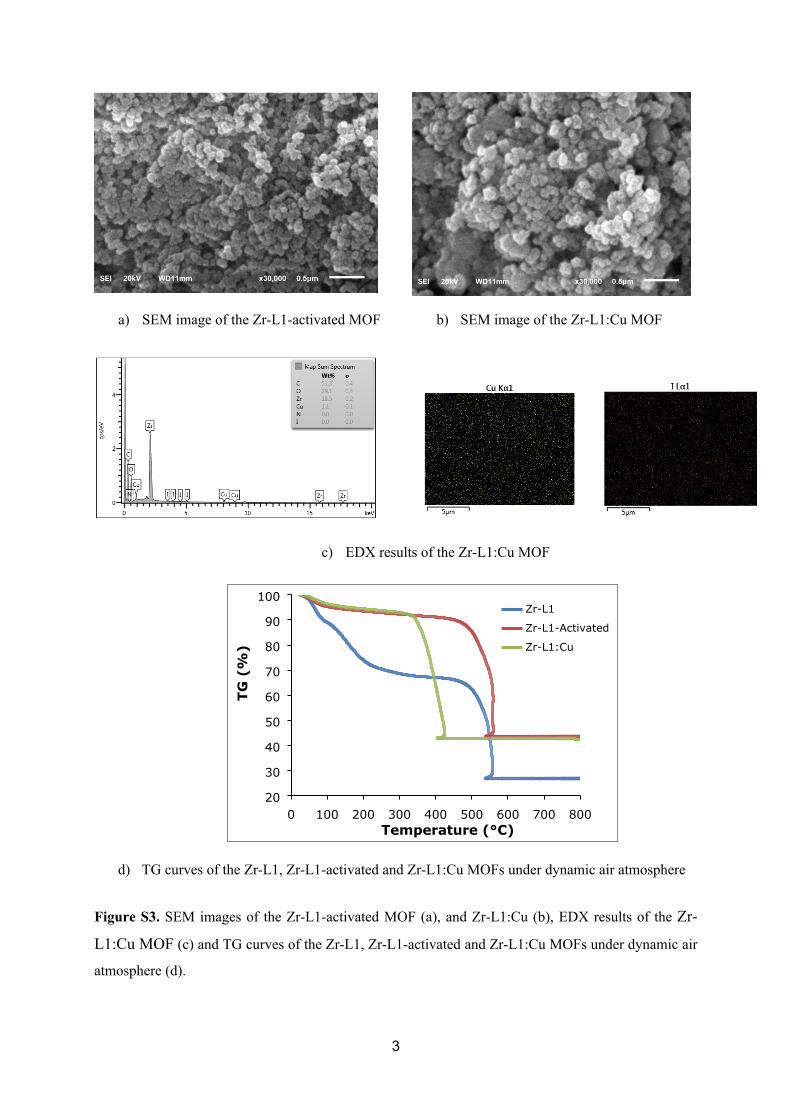
a) SEM image of the Zr-L1-activated MOF b) SEM image of the Zr-L1Cu MOF
c) EDX results of the Zr-L1Cu MOF
0 100 200 300 400 500 600 700 80020
30
40
50
60
70
80
90
100Zr-L1
Zr-L1-Activated
Zr-L1Cu
Temperature (degC)
TG (
)
d) TG curves of the Zr-L1 Zr-L1-activated and Zr-L1Cu MOFs under dynamic air atmosphere
Figure S3 SEM images of the Zr-L1-activated MOF (a) and Zr-L1Cu (b) EDX results of the Zr-
L1Cu MOF (c) and TG curves of the Zr-L1 Zr-L1-activated and Zr-L1Cu MOFs under dynamic air
atmosphere (d)
4
Results of Zr-L2 MOF
Figure S4 XRD patterns of the Zr-L2 Zr-L2-activated and Zr-L2Cu MOFs
000 020 040 060 080 1000
100
200
300
400
500
600
700
800
Relative PressurePP0)
Vol
um
eS
TP(c
cg
)
Zr-L2Cu
Zr-L2-Activated
Figure S5 Adsorption (sphere) and desorption (square) isotherms of the Zr-L2-activated and Zr-
L2Cu MOFs
5
a) SEM image of the Zr-L2-activated MOF b) SEM image of the Zr-L2Cu MOF
c) EDX results of the Zr-L2Cu MOF
0 100 200 300 400 500 600 700 8000102030405060708090100
Zr-L2
Zr-L2-Activated
Zr-L2Cu2
Temperature ( C)
TG (
)
d) TG curves of the Zr-L2 Zr-L2-activated and Zr-L2Cu MOFs under dynamic air atmosphere
Figure S6 SEM images of the Zr-L2-activated MOF (a) and Zr-L2Cu (b) EDX results of the Zr-
L2Cu MOF (c) and TG curves of the Zr-L2 Zr-L2-activated and Zr-L2Cu MOFs under dynamic air
atmosphere (d)
6
Results of Zr-L1L2 MOF
Figure S7 XRD patterns of the Zr-L1L2 Zr-L1L2-activated and Zr-L1L2Cu MOFs
000 020 040 060 080 1000
100
200
300
400
500
600
700
VolumeSTP
(ccg)
Relative Pressure
Zr-L1L2- Activated
Zr-L1L2Cu
Figure S8 Adsorption (sphere) and desorption (square) isotherms of the Zr-L1L2-activated and Zr-
L1L2Cu MOFs
7
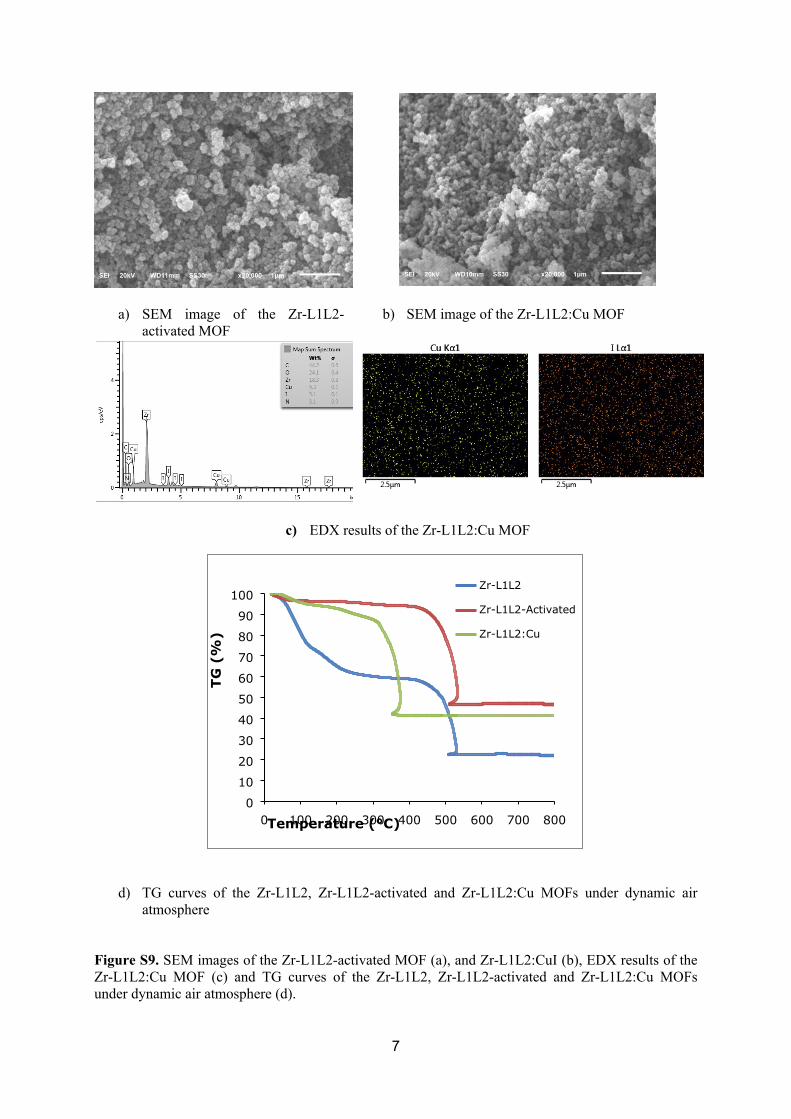
a) SEM image of the Zr-L1L2-activated MOF
b) SEM image of the Zr-L1L2Cu MOF
c) EDX results of the Zr-L1L2Cu MOF
0 100 200 300 400 500 600 700 8000
10
20
30
40
50
60
70
80
90
100Zr-L1L2
Zr-L1L2-Activated
Zr-L1L2Cu
Temperature (degC)
TG (
)
d) TG curves of the Zr-L1L2 Zr-L1L2-activated and Zr-L1L2Cu MOFs under dynamic air atmosphere
Figure S9 SEM images of the Zr-L1L2-activated MOF (a) and Zr-L1L2CuI (b) EDX results of the Zr-L1L2Cu MOF (c) and TG curves of the Zr-L1L2 Zr-L1L2-activated and Zr-L1L2Cu MOFs under dynamic air atmosphere (d)
8
Table S1 Elemental composition and some physical properties of the Zr-MOFs
Mol Formula MA (gmol)
C (Wt)
H(Wt)
N
(Wt)
Zr
(Wt)
Cu (Wt)
H2O
( TG)
BET (m2g)
Particle size (nm)
Zr-L1- activated
Zr6O4(OH)4 (C14H8O4)6 6H2O
22287 4669 (4527)
267 (289) - 2343
(2456) - 570 (484) 1405 70-100nm
Zr-L1Cu Zr6O4(OH)4(C14H8O4)6 (CuI)056H2O
23240 4283 (4341)
299 (278) - 2305
(2355)110
(137)510
(465) 1226 70-100nm
Zr-L2- activated
Zr6O4(OH)4 (C12H6N2O4)6 8H2O
22766 3792 (3798)
241 (248)
738 (738)
1720 (2404) - 570
(632) 2360 200-300
Zr-L2Cu Zr6O4(OH)4 (C12H6N2O4)6 (CuI)618H2O
35995 2365 (2402)
224 (213)
471 (467)
1490(1521)
910 (1059)
870 (900) 1392 200-300
Zr-L1L2-activated
Zr6O4(OH)4 (C14H8O4)3 (C12H6N2O4)3 8H2O
22707 4024 (4126)
269 (275)
427 (370)
2272 (2410) - 540
(634) 1921 70-120
Zr-L1L2Cu
Zr6O4(OH)4(C14H8O4)3 (C12H6N2O4)3 (CuI)36H2O
28060 3371(3339)
217(208)
374 (300)
1836 (1951)
530 (679)
420(385) 1235 50-120
Calculated values were given in the parentheses
Thermal Properties
In order to determine the amount of occluded solvents as well as information about the
thermal stabilities of the prepared metal-organic frameworks we performed
thermogravimetric analysis (TGA) under a dynamic air atmosphere Though the as-prepared
materials (Zr-L1 Zr-L2 and Zr-L1L2) exhibit significant weight losses (35-45) before their
thermal decomposition dried materials (Zr-L1-activated Zr-L2-activated and Zr-L1L2-
activated) display limited weight losses This indicates successful activation (Figures S3d
S6d and S9d) The weight losses in the as-prepared TGA curves were attributed to occluded
solvent molecules within the pores Furthermore the experimental and calculated water
content is compatible with the corresponding activated (dried) samples (Table S1) However
the calculated final residues (ZrO2 + CuO) show some discrepancy The residue values are
between ZrO2 + CuO and ZrO2 + Cu2O Thus it is likely that some of the Cu ions were not
oxidized during the TGA measurement and remain as Cu2O Additionally any defects present
9
can increase these deviations The as-prepared and activated materials are stable up to
approximately 400-450 C Furthermore metalated samples display much lower thermal
stability when compared to the activated samples We attribute this to the impregnated copper
ions catalyzing the decomposition of the MOFs A lower thermal stability of metalated MOFs
has precedence in the literature [ref 37 SI]rdquo
Thickness of Solar Cells
It is known that the serial resistance is one of the reasons which affect the yield of a solar cell
Thus in order to determine the effect of thickness of Cu-MOF layer onto the resistance we
prepared layers with different thicknesses between two ITO substrates as in ldquopreparation of
solar cellrdquo section and measured I-V characteristics As a result the thickness of the Cu-MOF
layers with a suitable resistance was determined as 30-150 nm for this work The prepared
system produced noise for the layer thicker than 150 nm and leakage current for the layer
thinner than 30 nm Consequently we chose 50 nm as a working thickness
10
Figure S10 J-V curves of the Zr-L1L2CuCu2-xSCdS cell measured on different days
11
Figure S11 Jsc curve of the Zr-L1L2CuCu2-xSCdS cell measured between the MOF
strips (see Figure 1- model c)
12
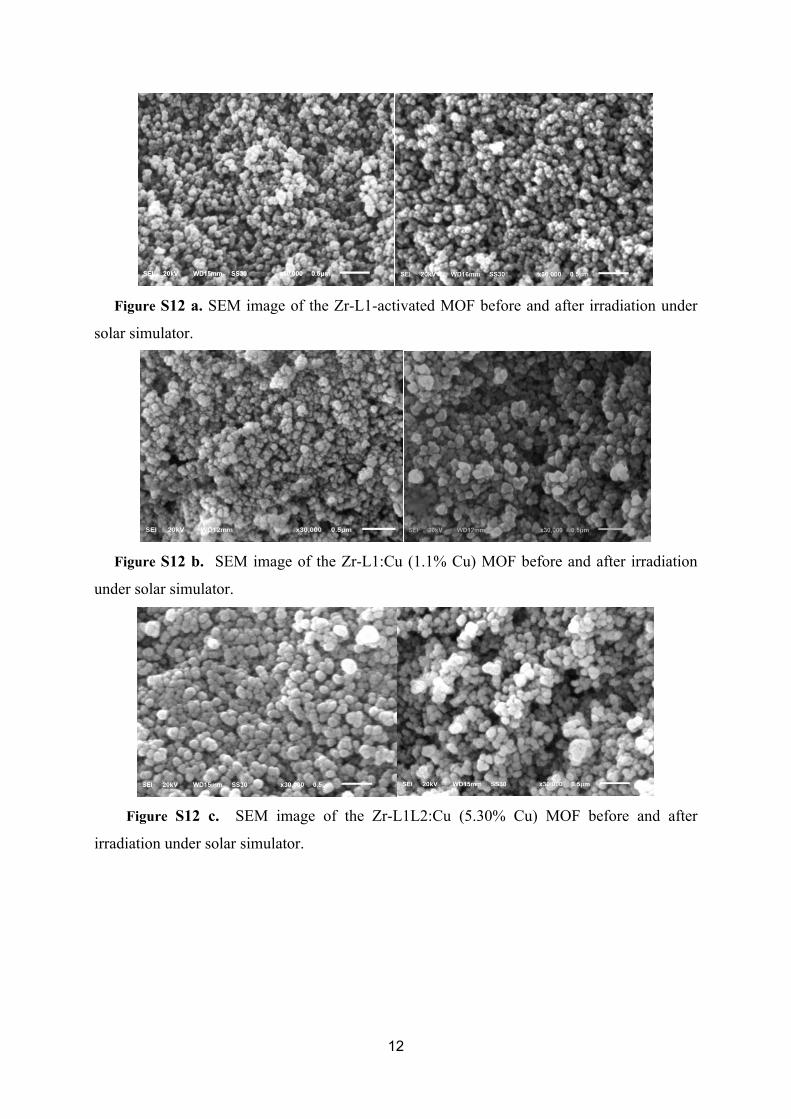
Figure S12 a SEM image of the Zr-L1-activated MOF before and after irradiation under
solar simulator
Figure S12 b SEM image of the Zr-L1Cu (11 Cu) MOF before and after irradiation
under solar simulator
Figure S12 c SEM image of the Zr-L1L2Cu (530 Cu) MOF before and after
irradiation under solar simulator
13
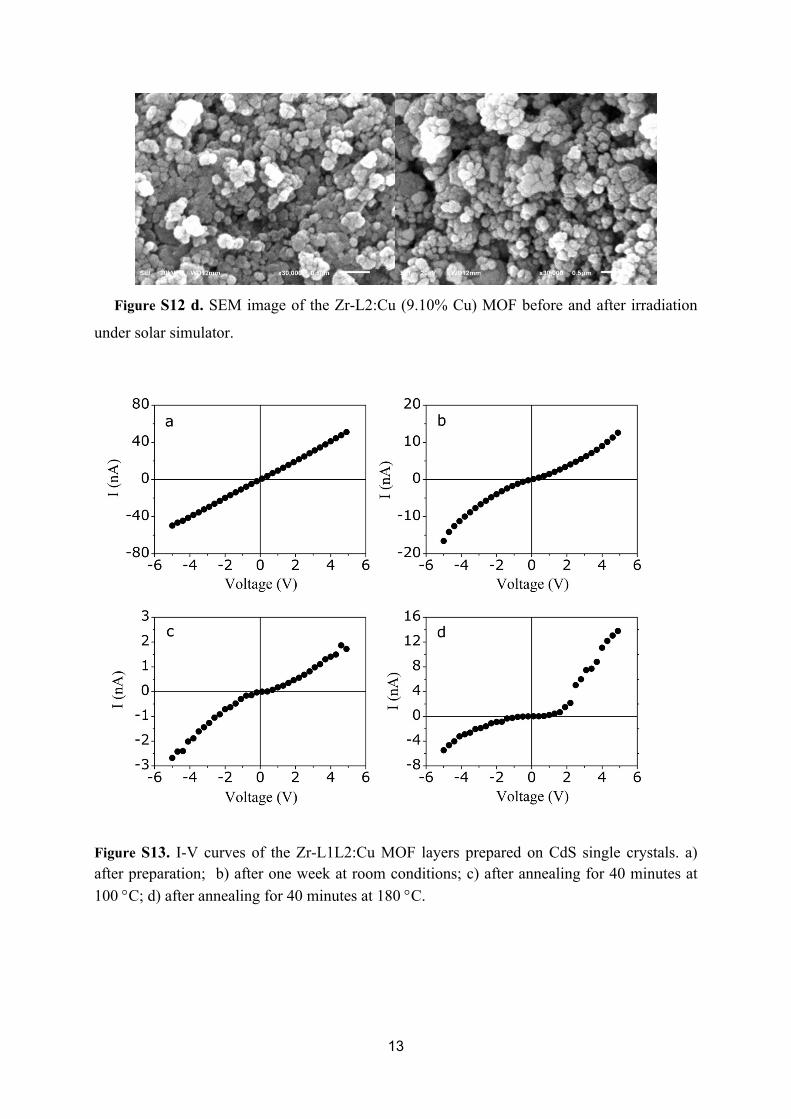
Figure S12 d SEM image of the Zr-L2Cu (910 Cu) MOF before and after irradiation
under solar simulator
Figure S13 I-V curves of the Zr-L1L2Cu MOF layers prepared on CdS single crystals a) after preparation b) after one week at room conditions c) after annealing for 40 minutes at 100 C d) after annealing for 40 minutes at 180 C

2
Results of Zr-L1 MOF
Figure S1 XRD patterns of the Zr-L1 Zr-L1-activated and Zr-L1Cu MOFs
000 010 020 030 040 050 060 070 080 090 1000
100
200
300
400
500
600
VolumeSTP
(ccg)
Relative Pressure
Zr-L1-Activated
Zr-L1Cu
Figure S2 Adsorption (sphere) and desorption (square) isotherms of the Zr-L1-activated and Zr-L1Cu MOFs
3
a) SEM image of the Zr-L1-activated MOF b) SEM image of the Zr-L1Cu MOF
c) EDX results of the Zr-L1Cu MOF
0 100 200 300 400 500 600 700 80020
30
40
50
60
70
80
90
100Zr-L1
Zr-L1-Activated
Zr-L1Cu
Temperature (degC)
TG (
)
d) TG curves of the Zr-L1 Zr-L1-activated and Zr-L1Cu MOFs under dynamic air atmosphere
Figure S3 SEM images of the Zr-L1-activated MOF (a) and Zr-L1Cu (b) EDX results of the Zr-
L1Cu MOF (c) and TG curves of the Zr-L1 Zr-L1-activated and Zr-L1Cu MOFs under dynamic air
atmosphere (d)
4
Results of Zr-L2 MOF
Figure S4 XRD patterns of the Zr-L2 Zr-L2-activated and Zr-L2Cu MOFs
000 020 040 060 080 1000
100
200
300
400
500
600
700
800
Relative PressurePP0)
Vol
um
eS
TP(c
cg
)
Zr-L2Cu
Zr-L2-Activated
Figure S5 Adsorption (sphere) and desorption (square) isotherms of the Zr-L2-activated and Zr-
L2Cu MOFs
5
a) SEM image of the Zr-L2-activated MOF b) SEM image of the Zr-L2Cu MOF
c) EDX results of the Zr-L2Cu MOF
0 100 200 300 400 500 600 700 8000102030405060708090100
Zr-L2
Zr-L2-Activated
Zr-L2Cu2
Temperature ( C)
TG (
)
d) TG curves of the Zr-L2 Zr-L2-activated and Zr-L2Cu MOFs under dynamic air atmosphere
Figure S6 SEM images of the Zr-L2-activated MOF (a) and Zr-L2Cu (b) EDX results of the Zr-
L2Cu MOF (c) and TG curves of the Zr-L2 Zr-L2-activated and Zr-L2Cu MOFs under dynamic air
atmosphere (d)
6
Results of Zr-L1L2 MOF
Figure S7 XRD patterns of the Zr-L1L2 Zr-L1L2-activated and Zr-L1L2Cu MOFs
000 020 040 060 080 1000
100
200
300
400
500
600
700
VolumeSTP
(ccg)
Relative Pressure
Zr-L1L2- Activated
Zr-L1L2Cu
Figure S8 Adsorption (sphere) and desorption (square) isotherms of the Zr-L1L2-activated and Zr-
L1L2Cu MOFs
7
a) SEM image of the Zr-L1L2-activated MOF
b) SEM image of the Zr-L1L2Cu MOF
c) EDX results of the Zr-L1L2Cu MOF
0 100 200 300 400 500 600 700 8000
10
20
30
40
50
60
70
80
90
100Zr-L1L2
Zr-L1L2-Activated
Zr-L1L2Cu
Temperature (degC)
TG (
)
d) TG curves of the Zr-L1L2 Zr-L1L2-activated and Zr-L1L2Cu MOFs under dynamic air atmosphere
Figure S9 SEM images of the Zr-L1L2-activated MOF (a) and Zr-L1L2CuI (b) EDX results of the Zr-L1L2Cu MOF (c) and TG curves of the Zr-L1L2 Zr-L1L2-activated and Zr-L1L2Cu MOFs under dynamic air atmosphere (d)
8
Table S1 Elemental composition and some physical properties of the Zr-MOFs
Mol Formula MA (gmol)
C (Wt)
H(Wt)
N
(Wt)
Zr
(Wt)
Cu (Wt)
H2O
( TG)
BET (m2g)
Particle size (nm)
Zr-L1- activated
Zr6O4(OH)4 (C14H8O4)6 6H2O
22287 4669 (4527)
267 (289) - 2343
(2456) - 570 (484) 1405 70-100nm
Zr-L1Cu Zr6O4(OH)4(C14H8O4)6 (CuI)056H2O
23240 4283 (4341)
299 (278) - 2305
(2355)110
(137)510
(465) 1226 70-100nm
Zr-L2- activated
Zr6O4(OH)4 (C12H6N2O4)6 8H2O
22766 3792 (3798)
241 (248)
738 (738)
1720 (2404) - 570
(632) 2360 200-300
Zr-L2Cu Zr6O4(OH)4 (C12H6N2O4)6 (CuI)618H2O
35995 2365 (2402)
224 (213)
471 (467)
1490(1521)
910 (1059)
870 (900) 1392 200-300
Zr-L1L2-activated
Zr6O4(OH)4 (C14H8O4)3 (C12H6N2O4)3 8H2O
22707 4024 (4126)
269 (275)
427 (370)
2272 (2410) - 540
(634) 1921 70-120
Zr-L1L2Cu
Zr6O4(OH)4(C14H8O4)3 (C12H6N2O4)3 (CuI)36H2O
28060 3371(3339)
217(208)
374 (300)
1836 (1951)
530 (679)
420(385) 1235 50-120
Calculated values were given in the parentheses
Thermal Properties
In order to determine the amount of occluded solvents as well as information about the
thermal stabilities of the prepared metal-organic frameworks we performed
thermogravimetric analysis (TGA) under a dynamic air atmosphere Though the as-prepared
materials (Zr-L1 Zr-L2 and Zr-L1L2) exhibit significant weight losses (35-45) before their
thermal decomposition dried materials (Zr-L1-activated Zr-L2-activated and Zr-L1L2-
activated) display limited weight losses This indicates successful activation (Figures S3d
S6d and S9d) The weight losses in the as-prepared TGA curves were attributed to occluded
solvent molecules within the pores Furthermore the experimental and calculated water
content is compatible with the corresponding activated (dried) samples (Table S1) However
the calculated final residues (ZrO2 + CuO) show some discrepancy The residue values are
between ZrO2 + CuO and ZrO2 + Cu2O Thus it is likely that some of the Cu ions were not
oxidized during the TGA measurement and remain as Cu2O Additionally any defects present
9
can increase these deviations The as-prepared and activated materials are stable up to
approximately 400-450 C Furthermore metalated samples display much lower thermal
stability when compared to the activated samples We attribute this to the impregnated copper
ions catalyzing the decomposition of the MOFs A lower thermal stability of metalated MOFs
has precedence in the literature [ref 37 SI]rdquo
Thickness of Solar Cells
It is known that the serial resistance is one of the reasons which affect the yield of a solar cell
Thus in order to determine the effect of thickness of Cu-MOF layer onto the resistance we
prepared layers with different thicknesses between two ITO substrates as in ldquopreparation of
solar cellrdquo section and measured I-V characteristics As a result the thickness of the Cu-MOF
layers with a suitable resistance was determined as 30-150 nm for this work The prepared
system produced noise for the layer thicker than 150 nm and leakage current for the layer
thinner than 30 nm Consequently we chose 50 nm as a working thickness
10
Figure S10 J-V curves of the Zr-L1L2CuCu2-xSCdS cell measured on different days
11
Figure S11 Jsc curve of the Zr-L1L2CuCu2-xSCdS cell measured between the MOF
strips (see Figure 1- model c)
12
Figure S12 a SEM image of the Zr-L1-activated MOF before and after irradiation under
solar simulator
Figure S12 b SEM image of the Zr-L1Cu (11 Cu) MOF before and after irradiation
under solar simulator
Figure S12 c SEM image of the Zr-L1L2Cu (530 Cu) MOF before and after
irradiation under solar simulator
13
Figure S12 d SEM image of the Zr-L2Cu (910 Cu) MOF before and after irradiation
under solar simulator
Figure S13 I-V curves of the Zr-L1L2Cu MOF layers prepared on CdS single crystals a) after preparation b) after one week at room conditions c) after annealing for 40 minutes at 100 C d) after annealing for 40 minutes at 180 C
Related Documents