Stability, mobility and failure mechanism for landslides at the Upper Conti- nental Slope off Vester˚ alen, Norway J.S. L’Heureux, M. Vanneste, L. Rise, J. Brendryen, C.F. Forsberg, F. Nadim, O. Longva, S. Chand, T.J. Kvalstad, H. Haflidason PII: S0025-3227(13)00202-8 DOI: doi: 10.1016/j.margeo.2013.09.009 Reference: MARGO 4987 To appear in: Marine Geology Received date: 4 October 2012 Revised date: 22 September 2013 Accepted date: 23 September 2013 Please cite this article as: L’Heureux, J.S., Vanneste, M., Rise, L., Brendryen, J., Fors- berg, C.F., Nadim, F., Longva, O., Chand, S., Kvalstad, T.J., Haflidason, H., Stabil- ity, mobility and failure mechanism for landslides at the Upper Continental Slope off Vester˚ alen, Norway, Marine Geology (2013), doi: 10.1016/j.margeo.2013.09.009 This is a PDF file of an unedited manuscript that has been accepted for publication. As a service to our customers we are providing this early version of the manuscript. The manuscript will undergo copyediting, typesetting, and review of the resulting proof before it is published in its final form. Please note that during the production process errors may be discovered which could affect the content, and all legal disclaimers that apply to the journal pertain.

Welcome message from author
This document is posted to help you gain knowledge. Please leave a comment to let me know what you think about it! Share it to your friends and learn new things together.
Transcript

�������� ����� ��
Stability, mobility and failure mechanism for landslides at the Upper Conti-nental Slope off Vesteralen, Norway
J.S. L’Heureux, M. Vanneste, L. Rise, J. Brendryen, C.F. Forsberg, F.Nadim, O. Longva, S. Chand, T.J. Kvalstad, H. Haflidason
PII: S0025-3227(13)00202-8DOI: doi: 10.1016/j.margeo.2013.09.009Reference: MARGO 4987
To appear in: Marine Geology
Received date: 4 October 2012Revised date: 22 September 2013Accepted date: 23 September 2013
Please cite this article as: L’Heureux, J.S., Vanneste, M., Rise, L., Brendryen, J., Fors-berg, C.F., Nadim, F., Longva, O., Chand, S., Kvalstad, T.J., Haflidason, H., Stabil-ity, mobility and failure mechanism for landslides at the Upper Continental Slope offVesteralen, Norway, Marine Geology (2013), doi: 10.1016/j.margeo.2013.09.009
This is a PDF file of an unedited manuscript that has been accepted for publication.As a service to our customers we are providing this early version of the manuscript.The manuscript will undergo copyediting, typesetting, and review of the resulting proofbefore it is published in its final form. Please note that during the production processerrors may be discovered which could affect the content, and all legal disclaimers thatapply to the journal pertain.

ACC
EPTE
D M
ANU
SCR
IPT
ACCEPTED MANUSCRIPT
1
Stability, mobility and failure mechanism for landslides at the
Upper Continental Slope off Vesterålen, Norway
J.S L’Heureux1, M. Vanneste
2, L. Rise
3, J. Brendryen
4, C.F. Forsberg
2, F. Nadim
2, O. Longva
3, S.
Chand3, T.J. Kvalstad
2, H. Haflidason
4
1- Norwegian Geotechnical Institute (NGI), Trondheim, Norway
2- Norwegian Geotechnical Institute (NGI), Oslo, Norway
3- Geological Survey of Norway (NGU), Trondheim, Norway
4- Department of Earth Science, University of Bergen (UIB), Bergen, Norway
Abstract
Several relatively small and spatially-isolated landslides with low mobility characterise the
geomorphology of the upper continental slope off the Vesterålen islands. Here, we present results
from a multidisciplinary study that integrates swath bathymetry data, high-resolution seismic
reflection profiles and a multitude of geological and geotechnical laboratory tests from a 12 m
long piston core in order to investigate the origin and hazard potential of these shallow landslides.
Four of the landslides have their upper headwall around the 500 m isobath, whereas the main
escarpments of another four landslides lie around 700 to 800 m. The slip planes of the
translational landslides lie within laminated glacial marine clays, overlying a well-defined seismic
horizon. These clays have a higher plasticity and water content compared to the surrounding soils
(sandy clays), and they exhibit a modest strain-softening behaviour in triaxial tests. The
interdisciplinary data set is used as input to various numerical analyses in order to assess the
failure and triggering mechanisms for these landslides, as well as their hazard potential. Stability
analyses, dynamic analyses and post-earthquake pore pressure dissipation modelling suggest that

ACC
EPTE
D M
ANU
SCR
IPT
ACCEPTED MANUSCRIPT
2
the margin is essentially stable and that it would require a large magnitude earthquake to trigger
landslides. The resulting deformation and excess pore pressure generation occur primarily within
the top 10 m of the soil, and they become more pronounced towards the surface. Finally, the run-
out distance of these landslides is limited and strongly depends on the volume of displaced
material and the slope angle. Mobility analyses reveal that the acceleration phase lasts about 1
minute and that peak velocities may have reached up to 17 m/s. Hence, the consequences of such
flows during a time of active seabed exploitation or the impact with seabed infrastructure could
be devastating.
Keywords: Lofoten and Vesterålen margin; submarine landslides; slope stability; dynamic
analysis; landslide mobility; pre-conditioning and triggering factors; hazard potential.
1. Introduction
Submarine landslides represent a major threat for both offshore infrastructures and coastal
communities. Assessing the hazard posed by such landslides is a challenging task in offshore
engineering projects. It requires information about the timing and frequency-magnitude of the
events, the soil conditions, the potential triggering factors and the post-failure behaviour of the
landslide. One should also take into account the potential for reactivation in areas where slope
failures have taken place previously.
The causes of submarine mass movements on high-latitude continental margins are often linked
to factors such as high sedimentation rates, unfavourable soil layering, climate variability
affecting sedimentation processes, erosion/oversteepening, fluid flow factors (e.g. gas, hydrates,
diapirism), earthquake, or a combination of these (Locat and Lee, 2002; Masson et al., 2006).
However, for many submarine mass movements, the actual trigger is unknown and difficult to
pinpoint as multiple factors can play a role.

ACC
EPTE
D M
ANU
SCR
IPT
ACCEPTED MANUSCRIPT
3
In 2010, the Norwegian Petroleum Directorate (NPD) estimated that 200 million standard cubic
metres of oil equivalent could be found on the continental shelf and slope off Lofoten and
Vesterålen (NPD, 2010). Hence, the Lofoten and Vesterålen margin (LVM) now receives
increased attention as it may be one of the next, albeit environmentally debated, areas opened for
hydrocarbon exploration off Norway. This pristine region of the Norwegian margin is
characterised by several deep canyon systems and numerous landslides have been mapped
(Laberg et al., 2005a; 2007; Thorsnes et al., 2009; Rise et al., 2012). Swath bathymetry data also
reveals several smaller-scale landslides (Rise et al., 2012; Vanneste et al., 2012).
The goal of this study is to increase our knowledge regarding the origin, the causes and the
mobility of the observed landslides on the upper slope off the LVM. The potential failure
mechanisms and mobility are investigated using an integrated data set containing geological,
geophysical and geotechnical data combined with slope stability back-analyses and run-out
analyses. The results are of particular importance for a future hazard assessment of this area and
may have direct implication for the understanding of similar small-scale submarine landslides on
high-latitude continental margins.
2. Regional setting
The study area lies west of Andøya on the Lofoten and Vesterålen passive margin (LVM) (Fig.
1). The continental shelf off LVM is narrow compared to the much wider shelves off mid-
Norway (Rise et al., 2005) and in the Barents Sea (Andreassen et al., 2008). The shelf is only
about 25 km wide west of Andøya. The LVM is part of the north Atlantic margin, which has
experienced multiple rifting episodes since the collapse of the Caledonides in the Devonian (e.g.
Løseth and Tveten, 1996). Following the final opening of the proto-Atlantic Ocean in the Eocene,
the LVM has remained a passive margin. Since the Plio-Pleistocene, glacial processes became
prominent, with periods of shelf-edge glaciations alternated with marine open-ocean conditions
(e.g. Vorren et al., 1998). The seabed geomorphology and stratigraphy in the area distinctly
ACC
EPTE
D M
ANU
SCR
IPT
ACCEPTED MANUSCRIPT
4
reflects the glacial history. Following the Last Glacial Maximum (LGM), glacio-isostatic rebound
took place.
Cross-shelf troughs separate shallow banks on the shelf area. The banks are typically
overconsolidated due to ice loading during peak glacial periods, whereas the throughs were
eroded by fast-flowing ice streams originating in the high mountain areas to the east (Ottesen et
al., 2005). Fifteen canyon systems occur on the LVM, several eroded to 500-1100 m below their
adjacent shoulders (Rise et al., 2013; Fig. 1). The slopes of the canyon walls generally exceed
30°.
Tills, generally less than 20 m thick, dominate the Quaternary succession on the shelf (Sættem
and Rokoengen, 1983). The sediment thickness increases to around 50 m along the outermost
shelf, but also locally in cross-shelf troughs (Rise et al., 1988). Fine-grained glaciomarine
sediments and Holocene sands drape the till in the troughs (Bøe et al., 2009). Along most of the
continental slope, the stratified sediments are mainly of contouritic and hemipelagic
(glaciomarine) origin (Laberg et al., 1999, 2005b; Rise et al., 2012).
Seismic monitoring stations are operating since 1987 in this region (Byrkjeland et al., 2000). The
seismicity of the LVM is relatively high and amongst the highest along the Norwegian
continental margin. Several earthquakes with a magnitude up to 5.7 have been recorded macro-
seismically since 1880 (Bungum et al., 1991; Havskov et al., 1992). The maximum peak ground
accelerations (PGA) with 90% probability of no exceedance for 475- and 10,000-year return
period offshore Vesterålen are shown in Table 1.
3. Data and methods
3.1 Geophysical data
The MAREANO seafloor mapping programme (www.mareano.no) released the multibeam
bathymetry data of the 175 km2
large study area . The data were collected using Simrad EM710

ACC
EPTE
D M
ANU
SCR
IPT
ACCEPTED MANUSCRIPT
5
and EM1002 echosounder systems. The bathymetry grids have cell size of 5 m by 5 m beyond the
12 nm range from the coastline and 50 m by 50 m grid cell size within. In 2010, a total of ~280
km of high-resolution reflection data was acquired using a hull-mounted parametric Topas Sub-
bottom Profiler System (Kongsberg Topas PS18) onboard R/V G.O. Sars. The system
compensates for roll, heave and pitch. It operates with primary frequencies between 15 and 21
kHz, which generate a broadband difference energy between 0.5 and 6 kHz.
3.2 Core data and geotechnical testing
Using a Kullenberg piston core, an 11.9 m long sediment core was recovered in 2010 from an
undisturbed part of the slope between landslide scars (for location, see Fig. 2). This core provided
material for detailed sediment physical logging and geotechnical characterization. X-ray imagery
was performed in addition to multi-sensor core logging (MSCL) for P-wave velocity, bulk
density, and magnetic susceptibility using either a loop sensor on whole cores or point sensor on
split cores. Geotechnical tests included grain size analyses using the Sedigraph method, water
content (i.e., the ratio of mass of water and mass of solids in the soil) and density measurements,
undrained shear strength (fall cone and pocket vane) of undisturbed and remoulded clays, as well
as Atterberg limits (liquid and plastic limits). In addition, four oedometer tests, four
anisotropically-consolidated triaxial tests under compression (CAUC) and two direct simple shear
tests (DSS) were conducted on specific samples from the different lithologies identified on the X-
ray data. All samples were consolidated to in situ effective stresses prior to shearing in the CAUC
and/or the DSS tests. The advanced geotechnical tests followed state-of-the-art practise at the
Norwegian Geotechnical Institute (NGI) (e.g. Sandbækken et al., 1986; Berre, 1998).
Six AMS 14
C dates from marine calcareous fossils allowed establishing an age-depth model. The
14C ages were converted to calendar ages using the Calib 6.0 software (Stuiver et al., 2005) and
the Intcal Marine09 calibration curve (Reimer et al., 2009). A reservoir age of 250±250 was used
in the calibration.

ACC
EPTE
D M
ANU
SCR
IPT
ACCEPTED MANUSCRIPT
6
3.3 Stability analyses
To shed light on the failure and triggering mechanism of the landslides off Vesterålen, a series of
deterministic slope stability back-analyses were performed. The Slope/W software was used with
limit equilibrium methods in 2D. The outcome of deterministic analyses comes in the form of
factors of safety (FoS). A slope is stable when the FoS exceeds unity, and unstable when less than
unity. In deterministic analysis, failure takes place when the mobilized shear strength exceeds the
maximum shear strength available. The simplest case occurs when a slab of soil slips on a plane
parallel to the ground surface (infinite slope analysis). This approach is well suited for modelling
translational landslides moving along specific slip planes, e.g. the Vesterålen case study. In
infinite slope stability analyses, the FoS is defined as the shear strength (s) divided by the
mobilized shear stress () (e.g., Nash, 1987):
(1)
where su is the undrained shear strength, γ´ the buoyant unit weight (kN/m3), z is the depth below
seafloor (m) and β the slope angle. By including a uniform horizontal seismic acceleration, Eq.
(1) may be written as:
(2)
where γ is the total unit weight (kN/m3) and Kx is the maximum horizontal component of seismic
acceleration in g.
A pseudo-static FoS < 1 during the peak earthquake-induced load does not necessarily indicate
slope failure with large movement of soil masses. The maximum earthquake load lasts only for a
fraction of a second. As long as the soil does not experience a significant reduction in its shear
strength, the consequence of full mobilization of soil strength along a slip surface will be limited

ACC
EPTE
D M
ANU
SCR
IPT
ACCEPTED MANUSCRIPT
7
permanent deformations. If a slope is subject to an earthquake with peak ground acceleration
greater than the acceleration giving a factor of safety of unity, permanent deformations along the
slip surface will occur. One-dimensional (1D) non-linear earthquake response analyses were
performed in this study using the AMPLE2000 code (Pestana and Nadim, 2000). In this code, the
base rock acceleration time history is scaled to the relevant peak ground acceleration (PGA)
design criteria and the response of a 1D soil column from base rock to seabed is calculated.
AMPLE2000 has several options for the constitutive soil models. In this study, the SIMPLE DSS
model (Pestana et al., 2000) was chosen for simulating the stress-strain-strength relationships for
normally to lightly overconsolidated clays in cyclic simple shear, as this model is best suited for
slope stability assessment (Biscontin et al., 2004). This soil model allows simulating different
shear strain and stress reversal histories as well as providing a realistic description of the
accumulation of plastic shear strains and excess pore pressures during successive loading cycles.
Since AMPLE2000 was specifically designed to describe the response of submerged slopes to
dynamic loading, the inclination of soil layers is an input value describing the geometry and is
automatically accounted for by the program as a state variable. This allows the SIMPLE DSS
model to predict soil response based on the initial shear stresses acting in the sediments.
3.4 Post-failure analysis
The 1D flow dynamic model (BING) presented by Imran et al. (2001a), was used to analyse the
mobility of the failed sediment mass. BING was developed for the study of debris flows and can
be used with various rheological models (i.e. Bingham, Herschel-Bulkley and Bilinear). As no
rheology data are available from the area, both the Herschel-Bulkley and Bilinear rheologies were
included in the analysis. The visco-plastic rheology governed by the Herschel-Bulkley model is
given by the following relationship:
(3)
ACC
EPTE
D M
ANU
SCR
IPT
ACCEPTED MANUSCRIPT
8
where τ is the flow resistance (kPa), τy is the critical yield strength (kPa), γ is the shear rate (-)
and n is the Herschel-Bulkley exponent (-). The parameter K in Eq. (3) is defined as:
(4)
where γr is the strain rate defined as
(5)
and where τya is the yield strength and μdh is the plastic viscosity. Locat (1997) proposed the
Bilinear flow model in order to represent the rheology of clayey silt mixtures which often show
pseudo-plastic flow behaviour. This model assumes that the initial phase of the flow is Newtonian
and evolves – after reaching a threshold shear rate value – into a Bingham type flow. The
constitutive equation for the Bilinear model is given by (Locat 1997):
(6)
where γ0 is the shear rate at the transition from a Newtonian to a Bingham behaviour. In BING,
the constitutive equation for the Bilinear flow is expressed as follows (Imran et al., 2001b):
(7)
where r is the ratio of strain rates expressed as:
(8)
We refer to the section 7 for further details for the rheological parameters used here.
ACC
EPTE
D M
ANU
SCR
IPT
ACCEPTED MANUSCRIPT
9
4. Geomorphology and landslide architecture
On the continental margin immediately west of Andøya, the continental shelf break is located at
about 150 m water depth (see SB; Fig. 2). The shelf itself is characterized by several moraine
ridges sub-parallel to the shelf edge (Fig. 2). From the shelf break to about 400 m water depth, the
seafloor gently dips (c. 1–2°) and shows many slope-parallel furrows interpreted as iceberg
scours (see also Laberg et al., 2007). A steeper slope segment (c. 4–5°) between the 400 m to 475
m isobaths marks a transition between the iceberg-grooved seafloor above and the smoother
seafloor morphology below. The bathymetry data from this area reveals the presence of several
smaller-scale but well defined, isolated, landslides with their upper headwall at/or just above the
500 m isobaths (SL1–SL4; Fig. 2). The landslides do not directly connect to either the glacially-
influenced area upslope or the larger canyon systems further downslope.
Landslides SL1 to SL4 have horseshoe escarpments. They are, up to 10 m high and 5 to 10°
steep, with peaks up to 20° (Figs. 2-3). The undisturbed seafloor adjacent to these headwalls has a
maximum gradient of 3–4°. Both the evacuation zone surrounded by the headwalls and
accumulation zone of the landslides are clear on the morphology. The depositional lobes are well
defined with rougher seafloor topography with respect to the surroundings. In the depositional
area, the slope dips at 1–3°. The mobility of these landslides is limited and their total length (i.e.
from the headscarp to the toe of the deposits) ranges from 1500 to 3300 m (Table 2). Another
landslide (SLW) with its headwall at about 700 m water depth has a 15 m high escarpment (Fig.
2). However, it is not possible to identify the deposits for this landslide, as the remobilized mass
was most probably dispersed as a thin veneer of sediment further downslope. The slope angle is
typically less than 1–2° between SLW and SL1-SL4. The bathymetry data also reveal a subtle,
linear depression on the seafloor between these landslides (Fig. 2). The depression is 300 m wide,
6 km long and less than 5 m deep. Several short curvi-linear depressions, 20-25 m wide, 1-2 m
ACC
EPTE
D M
ANU
SCR
IPT
ACCEPTED MANUSCRIPT
10
deep interpreted as seafloor cracks are also detected to the northeast of the lineament in water
depths between 650 and 800 m (Fig. 2).
The upper part of the canyon walls and their shoulders on either side of the study area are
sculpted by landslide scars of various dimensions (Figs. 1-3). The largest landslide (SLA) is part
of a complex extending upslope of the Andøya Canyon system (Fig. 2). Also this landslide has its
upper escarpment along the same steeper slope segment as landslides SL1-SL4. Bathymetric data
shows that the flow of material originating from SLA eroded the seabed downstream towards the
western branch of the Andøya Canyon.
Figure 3 presents characteristic sub-bottom profiles across and along the landslide complexes 3.
The landslide deposits consist of transparent seismic facies, up to 15 m thick (assuming a velocity
of 1660 ms-1
for the sediment) that thin downslope where it eventually overrides the intact
sediment deposits. Despite the short mobilization distance, the failed mass appears entirely
remoulded and deformed resulting in the loss of all internal stratification. However, some chaotic
and discontinuously stratified facies are observed in the proximal parts of the landslides masses
(i.e. within the landslide scar). The stratification outside the landslide areas is mainly
characterized by continuous, parallel to sub-parallel reflections, typical for glacio-marine to
marine sedimentary processes. The horizons labelled a, b and c are distinct reflections and
continuous across the whole area. Horizons b and c seem to have acted as failure planes or lie
close to the slip planes for most of the landslides (Fig. 3). The clean surfaces exposed on the
bathymetric data just below the landslide scars also suggest a control of the bedding on the
location of the failure plane (e.g. SLA and SLW; Fig. 3).
Accurately determining the dimensions of the landslides is difficult due to the limited seismic
data coverage. However, an assessment based on the swath bathymetry data complemented with
the seismic lines gives a first-order volume estimate in the range 6−70·106 m
3 for these landslides
(Table 2).

ACC
EPTE
D M
ANU
SCR
IPT
ACCEPTED MANUSCRIPT
11
5. Sedimentological and geotechnical properties
5.1 Sedimentology
Core GS-10-163-05PC was retrieved from the undisturbed area in between landslides SL2 and
SL3 (Fig. 2). Visual inspection of X-radiographic imagery and split core surface shows that the
core stratigraphy consists of several sedimentary units that can be distinguished by colour,
structure and texture (Figs. 4-5). Three main facies are identified:
Facies 1 is characterized by a structure-less appearance and a variable, but generally high, content
of coarse sand to pebble-sized clasts interpreted as ice rafted debris (IRD) (Fig. 5A). The IRD are
dispersed in a dark grey to brownish silty clay matrix, sometimes concentrated in diffuse strata
(Figs. 4 and 5A). The sand content in this facies often exceeds 20-40 % (weight), causing peaks
in the MSCL logs of density, P-wave velocity and magnetic susceptibility. The sandy clay
sediment is interpreted to be hemipelagically deposited with a large component of IRD (glacial-
marine clay).
Facies 2 is laminated and has much lower IRD content (Fig. 5B). This sedimentary facies occurs
in seven well-defined intervals which can be over one meter thick. IRD, when present, is
concentrated in distinct laminae as well as in some diamictons. This laminated facies have higher
clay and fine silt content compared to the sandy clays of facies 1. The MSCL-values of P-wave
velocity, density and magnetic susceptibility are typically low, but larger values occur over IRD
rich lamina and strata (Fig. 4). Facies 2 is as a silty clay.
Facies 3 is a specific dense and well-graded sandy sediment, only found at a depth of 2.3 to 3.1 m
in core GS-10-163-05PC (Fig. 4). X-ray radiographs reveal that this unit has an erosive base.
Furthermore, the sediments appear remoulded suggesting that they were rapidly deposited, e.g.,
by sediment gravity flows (e.g. a debrite). This facies is absent in nearby cores. Therefore, it is a
local feature and not representative for the general stratigraphy in the area.

ACC
EPTE
D M
ANU
SCR
IPT
ACCEPTED MANUSCRIPT
12
Six AMS 14
C dates on planktonic foraminifers and a bivalve provide the chronological framework
for the GS10-163-05PC stratigraphy (Table 3). Except for the shell, the ages fall in chronological
order. The bottom of the core is dated to >30 000 cal. yrs BP (Fig. 4). The debrite between 2.3
and 3.1 mbsf has a maximum age of ~19 000 cal. yrs BP, based on a date obtained from
immediately underneath the debrite.
5.2 Geotechnical properties
From a geotechnical point of view, the sediments fall into two geotechnical soil types: 1) the
sandy clay with a plasticity index of 15-32%; and 2) the silty clay with plasticity index around
25%. The undrained shear strength on the sediments retrieved was thoroughly evaluated using the
fall cone test, torvane tests, triaxial compression tests and direct simple shear tests (Fig. 4). The
ratios of undrained shear strength and effective vertical stress range from 0.27 to 0.52. In general,
the silty clays have lower undrained shear strength, a higher sensitivity (up to 3.5; from fall cone)
and a greater plasticity than the sandy clays with IRD. Oedometer tests on three silty clay samples
from 6.7, 8.7, and 11.6 m depth indicate that the sediments are normally-consolidated. Similarly,
these tests allowed determining a coefficient of consolidation (cv) ranging from 3.0−7.0 x 10⁻⁸
m2/s for the silty clays.
During the triaxial and DSS shear tests, shear strains reached typically 15 to 20% (Fig. 6). Modest
strain softening, (i.e., loss of strength after peak strength is reached with ongoing strain)in a silty
clay sample collected at a depth of 8.6 m. The silty clays exhibit a strength reduction of about
22% of peak strength when sheared to 20% (Fig. 6). The sandy clay deposits with high content
IRD showed little to no strain softening. Strength anisotropy in the silty clays, determined from
comparing results from samples subjected to similar consolidation stresses in compression
(CAUC) and in direct simple shear (DSS), yield a ratio of 0.75.

ACC
EPTE
D M
ANU
SCR
IPT
ACCEPTED MANUSCRIPT
13
Results from Triaxial and DSS tests were also use to obtain the drained strength parameters of the
soils. The friction angle (φ’) for the silty clays is close to 28° with a cohesion intercept (c’) of 5
kPa. The friction angle estimated from laboratory measurements agrees well with the morphology
of the eroded slopes in the study areas (i.e. slope of escarpments and canyons at c. 30°).
Although X-ray and CT-scans showed little signs of sample disturbance, the oedometer and the
CAUC tests indicate relatively poor sample quality. The sample quality was assessed based on the
volumetric change during re-consolidation to in situ effective stresses and the approach proposed
by Lunne et al. (2006). Sample disturbance can affect the geotechnical measurements, as it may
reduce the peak undrained shear strength. Also the strain-softening behaviour might become less
pronounced compared to perfect conditions and the soil's strength might be too high at large
strains. One should keep this in mind when interpreting the laboratory results in stability analysis.
Correlation of the core and seismic reflection data is hampered by the fact that we lack the P-
wave velocity log from the upper 4.5 m of the core. In addition, the along-slope seismic line ends
200 m from the core location. From 4.5 to 12 m in the core, the mean P-wave velocity from the
MSCL logs is 1660 m/s. The core does not penetrate horizon c at 19–20 ms two way time
thickness (ms twt) (16–17 m). Using a constant velocity of 1660 m/s, horizon a lies at a depth of
8.0 m below the seafloor (9.5 ms twt). Similarly, the uppermost slip plane (i.e. horizon b at 12 ms
twt) corresponds to a depth of c. 10 m below the seafloor. The laminated fine-grained layer with
few IRD-clasts at 9.8–10.2 m may therefore host the failure plane at the depth of horizon b.
6. Slope stability analysis
6.1 Static slope stability analyses
In order to perform 2D stability analyses with the Slope/W software, one requires a morpho-
stratigraphic model with information about the topography prior to failure. One also needs the
soil’s geotechnical properties. From the sub-bottom profiling data across the undisturbed part of

ACC
EPTE
D M
ANU
SCR
IPT
ACCEPTED MANUSCRIPT
14
the Vesterålen margin, the pre-landslide surface topography can safely be reconstructed across the
landslides (Fig. 7). The two soil materials presented in Table 4 define the geotechnical
stratigraphy. Based on the integration of the core and seismic data, the depths of the high
amplitude seismic reflections such as horizon a, b and c are assumed to represent laminated, silty
clay layers. However, and for simplicity, the thinner silty clay layers were not included in the
model. This has very limited influence on the stability analyses.
The silty clays exhibits strength anisotropy. Therefore, the results of the DSS tests are used for
the undrained shear strength (suDSS) along the slip planes. The undrained shear strength is then a
function of the effective overburden stress:
(9)
where σ’v is the vertical effective stress (kPa), αDSS is the normalised undrained DSS strength, and
∆u the excess pore pressure (kPa). αDSS equals 0.27 for the silty clays (Table 3). The inclined
portions of the critical slip surfaces, as shown in Figure 7, pass through the upper layer of the
sandy clay. In such case, the normalised undrained compressive strength, αC is more
representative. In both cases, the undrained shear strength anisotropy is kept constant at 0.75 (see
Table 3). For drained analysis, the Mohr-Coulomb failure criteria is used with estimates of φ’ and
c’ as presented above.
Results from slope stability analyses show that neither the undrained shear strength nor the
drained strength parameters are sufficiently low to produce the observed slope failures off
Vesterålen. In the drained case, the stability analysis yields a FoS of 7.5 and the critical slip
surface does not match the observations, as it tend to go too deep. The calculated FoS is 3.6 in the
undrained case. Here the most critical slip surface matches the depth and partly the extent of the
observed landslide (Fig. 7).

ACC
EPTE
D M
ANU
SCR
IPT
ACCEPTED MANUSCRIPT
15
Slope stability scenarios were further evaluated by including excess pore pressure in the
simulations for static slope conditions, using Slope/W. As a result, critical values were obtained
for the excess pore pressure ratio (Ru) needed for failure to occur. The excess pore pressure ratio
is defined as the ratio between the excess pore pressure (i.e., in situ pressure minus hydrostatic
pressure) and the difference between lithostatic and hydrostatic pressure. For the drained case,
failure requires a Ru value close to 0.9. Again, the most critical slip surface lies deep below the
seafloor, and was discarded as it does not fit with the observed landslide morphology. The excess
pore pressure ratio also affects the soil’s undrained shear strength as shown in Eq. 7. In such case
a Ru coefficient of 0.7 leads to slope failure.
The results above imply that an external load (e.g. earthquake) or a very high excess pore
pressure is necessary to set off the landslides off Vesterålen. Since both the shear strength of the
sediment and the failure surface are fixed in the analyses, the remaining instability factors for
modelling slope failure at Vesterålen are linked to 1) effect of external forces (i.e. earthquake, 2)
generation of excess pore pressure and/or 3) strength degradation. These effects will be evaluated
below.
6.2 Pseudo-static stability analyses
Infinite slope stability analyses (i.e. 1D) show that a peak ground acceleration (PGA) close to
0.18-0.20g is required to trigger a landslide at Vesterålen for 3 to 4° slope angle and undrained
shear strength from DSS tests (Fig. 8). The relative poor sample quality is accounted for in the
analyses by increasing the normalized undrained shear strength from 0.27 to 0.35. Results show
that a 10 000-yr earthquake is necessary to trigger sliding or permanent deformation (Fig. 8).
However, note that sample disturbance does not always cause a reduction in undrained shear
strength. The estimates using the lower normalized shear strength value of 0.27 are more
conservative. In summary, both results from 1D and 2D pseudo-static analysis show that the FoS
drops below one when a large-magnitude earthquake strikes the LVM margin.
ACC
EPTE
D M
ANU
SCR
IPT
ACCEPTED MANUSCRIPT
16
6.3 1D dynamic earthquake analyses
For submarine slopes in clays, the pseudo-static factor of safety presents only a rough estimate of
the seismic response of the slope during an earthquake. Earthquakes generate vibrations and mass
inertia forces, which at times cause large shear stresses in the down-slope direction. The duration
of the loads is, however, typically short and in most situations, the main effects are accumulation
of down-slope displacements accompanied by a moderate cyclic degradation of strength. To study
this aspect, 1D non-linear earthquake response analyses were performed in AMPLE2000 using
the SIMPLE DSS constitutive soil model (Pestana and Nadim, 2000). This soil model includes
pore pressure generation and degradation in shear modulus during cyclic loading.
The slope angle in the dynamic analyses was set at 4°. The modelled soil profile is uniform and
normally-consolidated. Rise et al. (2013) shows that the sediment thickness is about 25 m on the
continental shelf and that it increases westwards of the shelf break. In addition, the Topas seismic
data more than 50 m of sediment below the seabed in most of the study area. To evaluate the
influence of the depth to bedrock, simulations were carried out for sediment thicknesses of 25, 50
and 100 m.
No shear wave velocity or shear stiffness at small strains (i.e. Gmax) measurements are available
from this area. Therefore, we rely on published data to estimate Gmax as a function of depth, z, for
normally consolidated clays (e.g. Biscontin et al., 2004):
(10)
The same relationship presented in Eq. (10) was also used in offshore studies on the Møre and
Vøring plateau (NGI, 1998) and off the Helland Hansen area (Leynaud et al., 2004). This
relationship gives a reasonable estimate of Gmax and shear wave velocity when compared to shear
wave velocity from Norwegian marine clays (e.g. Long and Donohue, 2007), and is in agreement
with NGI's rock physical model for low effective stress environments. The undrained strength for

ACC
EPTE
D M
ANU
SCR
IPT
ACCEPTED MANUSCRIPT
17
the inclined soil is anisotropic with normalized SHANSEP properties (Ladd and Foot, 1974). The
viscous damping ratio in the soil column was set constant at 1.5%, which is typical for clay. The
other input parameters into the simple DSS soil model follow the work by Pestana and Nadim
(2000) and Biscontin et al. (2004) (i.e. failure ratio, β=0.35; slenderness parameter, m=0.5; large
strain obliquity angle, ψ=28; backbone curve parameters, Gp=10; θ=25; λ=30). The last two
parameters (i.e. θ and λ) control the effective stress path for loading and the shear stiffness during
cyclic loading, respectively.
Unfortunately, no earthquake data from this area are available. Hence, we selected two well-
known reference earthquake motions from the literature in order to evaluate the effect of different
frequency content on the soil’s response. The Friuli Tarcento event (May 6, 1976; Ms= 6.5,
duration=34.24s) contains mainly high frequencies (periods lower < 0.5 seconds). The second
event is the Loma Prieta earthquake (October 17, 1989; Ms=7.1, duration = 39.95 s) which
contains low and high frequency events. Both records are scaled to a 10 000-year return period
(i.e. 0.224 g) and are specified as rock outcrop motion (cf. Pestana and Nadim 2000). The scaled
acceleration time history and the spectral acceleration for both earthquake records are presented
in Figure 9.
Figure 10 presents the predicted maximum shear strains and displacements as a function of
depth. The results show the accumulation of deformation with increasing importance near the
surface for sediment thicknesses of 25, 50 and 100 m. The largest strains and displacements occur
within the top 10 m of the soil. Similarly, and during both earthquake events, the dynamic FoS
falls below unity for the layers in the uppermost 11.5 m. This depth range fits the depth of the
failure planes observed on the seismic data reasonably well. As seen from Figure 10, the
accumulated strains and displacements are higher for earthquakes with lower frequency
components (e.g., Loma Prieta event) compared to earthquakes with higher frequency
components (e.g., Friuli Tarcento event). The frequency component of the earthquake also has a

ACC
EPTE
D M
ANU
SCR
IPT
ACCEPTED MANUSCRIPT
18
larger influence on the results than the sediment thickness. Figure 11 shows the impact of PGA on
the predicted maximum strains and displacements, considering the Loma Prieta event and a
sediment thickness of 100 m. The modelling returns maximum shear strains of 1% and 0.5% at
depths of 5 m and 10 m, respectively.
Figure 10 also illustrates the predictions of excess pore pressure ratio generated by the Friuli
Tarcento and Loma Prieta events (scaled to 0.224 g). The simulations indicate that the highest
excess pore pressure ratios would occur within the top 15-20 m of the soil. At larger depths, the
excess pore pressure ratios tend to be nearly constant with depth. The results furthermore reveal
large differences in generation of pore pressure with respect to the frequency components of the
earthquake records. Excess pore pressure generation is higher for a seismic event containing low-
frequency components (e.g., Loma Prieta). In this case, the model predicts an excess pore
pressure ratio around 13% at 10-15 m below seafloor at the end of the earthquake (Fig. 10).
6.4 Post-earthquake pore pressure dissipation and slope stability
Excess pore pressure generated in a normally-consolidated deposit dissipates over time following
a seismic event. The time to reach steady-state conditions may be very long for fine-grained soils
(years to decades). During the re-equilibration process, an upward fluid flow towards the seabed
may exist in the soil and this can affect the post-earthquake stability of the slope. Core results as
well as seismic reflection data show that the soil profile off Vesterålen is well stratified. Under
such conditions, upwards migrating pore water may become trapped underneath a soil unit having
lower permeability, ultimately leading to the build-up of excess pore pressure. Consequently,
effective stresses will drop and this process may well undermine the stability of the slope.
Laboratory tests by Kokusho and Kojima (2002) using stratified sandy and silty soils confirmed
this type of delayed failure.

ACC
EPTE
D M
ANU
SCR
IPT
ACCEPTED MANUSCRIPT
19
The possibility and implications of this mechanism was investigated using AMPLE2000, by
performing a consolidation analysis and considering seepage normal to the slope. The excess pore
pressure profile predicted at the end of a Loma Prieta type earthquake (100 m sediment thickness)
was considered as an input (Fig. 9). The results are sensitive to the coefficient of consolidation
(cv), which must be representative and realistic, which is challenging. Scatter may be up to
several order of magnitude depending whether the consolidation coefficient is estimated from
laboratory results or in situ (e.g. Leroueil et al., 1995; Leroueil and Hight, 2003). This parameter
also depends on the compressibility of the material, its hydraulic conductivity and the stress level.
The analyses presented here should therefore only be considered as a first approximation, but they
are nevertheless based on the best possible data from the area available. Two different scenarios
were analysed. In the first scenario (scenario I), the coefficient of consolidation does not vary
with depth and equals the average values defined from laboratory results (i.e. 5 x 10⁻⁸
m2/s). In the
second scenario (scenario II), the coefficient of consolidation for a layer at 8 to 12 m depth (silty
clay soil) uses the same average value. The other sediment units (i.e. sandy clay soil) are given a
consolidation coefficient that is two orders of magnitude higher. A higher cv below and above this
depth interval is realistic considering the higher sand content in the deposits and thus higher
hydraulic conductivities.
For scenario I, the excess pore pressure ratio decreases very slowly over time (Fig. 12). In
contrast, for scenario II, the silty clay unit with lower permeability traps the upwards flowing
water causing the build-up of excess pore pressures at a depth of 12.5 and 15 m. Excess pore
pressure reaches its peak approximately 4,750 days (c. 13 years) after the earthquake. The
increase in excess pore pressure ratio is substantial for this scenario (i.e., from 11% to 24%; Fig.
12). This leads to a reduction in effective stresses over time within specific intervals, which may
subsequently drive the slope to unstable conditions. Results from pseudo-static analyses
following the build-up of pore pressure suggest that a small earthquake with a PGA of 0.05 (i.e.,
ACC
EPTE
D M
ANU
SCR
IPT
ACCEPTED MANUSCRIPT
20
475 years return period) may trigger slope instability when the excess pore pressure in the slope is
25% (Fig. 8). As such, repeated earthquake activity could be a potential scenario to explain the
landslides on the LVM.
7. Mobility analysis
In order to carry out a mobility analysis of the landslide off Vesterålen with BING, one needs
input on the geometry of the landslide at the onset of failure, a flow path and information about
the rheological parameters of the failed material. This is accomplished in 2D.
7.1 Geometrical parameters
For the mobility analyses, the length, the width and the depth of the failing masses come directly
from the multibeam data and the seismic data (Table 2). The run-out simulation considers that the
failure takes place instantaneously, i.e., the failure release all material at one given time. The
geophysical data support this assumption, as neither the seismic nor the bathymetry data reveal
evidence of multiphase landslide development. It is furthermore in agreement with the slope
stability simulations presented above (e.g. Fig. 7). The shape of the initial landslide masses are
half ellipses in the BING simulation. In reality, the shapes of the landslides are closer to a
rectangular shape but, according to Imran et al. (2001a; b), this has little influence on the final
results. The flow path was derived directly from the multibeam bathymetry.
7.2 Rheological parameters
Rheological data are not available for the landslides off Vesterålen. Therefore, one can has to use
an indirect approach to estimate the yield strength, i.e., based on the geomorphology in the
depositional area. For mudflows and debris flows, the minimum thickness of the remobilized
material (Hc, in metres) for a flow to take place can be approximated using the following
relationship (Hampton, 1972):
ACC
EPTE
D M
ANU
SCR
IPT
ACCEPTED MANUSCRIPT
21
(11)
where γ’ (kN/m3) is the submerged unit weight of the sediment and β is the slope angle.
Constrained by the field data, one obtains values of yield strength, c (kPa), in the range 1.5-3.0
kPa when using an average submerged unit weight of 8 kN/m3 (slope angle in the depositional
zone of 2.0° and Hc of 5-10 m). Similarly, laboratory experiments reported by Locat (1997)
showed that the yield strength of cohesive mixtures depends on the liquidity index (IL):
(12)
This relationship was successfully used to e.g. model the mobility of the giant Storegga landslide
(Gauer et al., 2005). Eq. (12) with an IL value of 0.98 (as measured in the core) gives a yield
strength value around 2.5 kPa. The estimated values of yield strength obtained from Eqs. (11-12)
are slightly lower than the measured remoulded shear strength in the core (Fig. 4).
Values related to plastic viscosity, i.e. the strain rate, γr, and the ratio of strain rates, r, are selected
to match the geomorphology of the landslides and in particular the observed run-out distances. An
r value of 1000 gives adequate results, and this value is comparable to rheological testing results
from other clays (e.g. Locat 1997, Locat and Lee 2005).
7.3 Run-out distances and flow dynamics
The Bilinear flow model was used in BING to compute the relationship between the initial
volume of failed sediments and the run-out distances using the soil parameters given above (Fig.
13). For landslides SL1-SL4, SLW and SLA, the modelled run-out varies between 1800 and 3700
m. In order to reach the run-out distances observed from the geophysical data, each landslide
must have occurred rapidly as one single event (complete volume mobilization, which confirms
the above). Therefore, the various features observed in the failure zone were most likely created
ACC
EPTE
D M
ANU
SCR
IPT
ACCEPTED MANUSCRIPT
22
during the main event(s). The modelled run-out distance for landslide SLA is much larger than
the other landslides, about 6000 m, suggesting that the failed mass must have reached the western
branch of the Andøya canyon. Once entering the canyon, the mass was fed into the main channel
and transported towards the lower part of the continental slope. This is supported by the scouring
and erosive seafloor morphology at the base of SLA (Fig. 3).
BING also allows estimating the velocity of the failing mass, which is an essential parameter with
respect to the potential hazards imposed by these small landslides (i.e. tsunami and/or impact on
seafloor structures). Figure 14 presents the velocity of the debris front during the flow of SL3,
i.e., as a function of the distance travelled from the headscarp. The simulations yield peak flow
velocities of 16 m/s and 17 m/s for the Bingham and Bilinear flow models, respectively. The
velocity increases rapidly over the first 100 m travelled, after which it stabilises near its peak
velocity for nearly 800 to 1000 m before a rapid deceleration. Results from both rheological
models are very similar, in both the behaviour over time and the peak velocities values. The time
between release and final deposition for these landslides is in the order of 10 to 20 minutes. The
acceleration phase alone is completed after only 1.1 minute. The maximum acceleration for
landslide SL3 is in the order of 0.20 m/s2.
8. Discussion
8.1 Failure and triggering mechanisms
The landslides in the study area are interpreted as translational landslides resulting from the
development of a shear surface along well-defined, parallel strata interpreted as glacial marine
sediments. As most of the landslides have common slip planes (i.e. horizons b and c) and
environmental controls, it is likely that the individual landslides have the same preconditioning
factors and triggering mechanism(s). The headwall for landslides SL1-SL4 and SLA all stopped
at a similar water depth at/or just above the 500 m isobaths. This may be explained by 1) a slight
ACC
EPTE
D M
ANU
SCR
IPT
ACCEPTED MANUSCRIPT
23
change in slope angle (c. 0.5 to 1° change), and 2) a thinning of the sedimentary cover above
horizons b and c upslope (see Fig. 3B). Both factors lead to a reduction in the potential energy
available for remoulding the sediments and to an increase in safety factor (e.g. Tavenas et al.,
1983).
Unfortunately, core GS10-163-05PC did not penetrate horizon c. However, samples at the depth
corresponding to horizons a and b show laminated silty clay with higher plasticity than the
surrounding core material (i.e. sandy clay). They also have higher water content, greater fine
content and a contractive behaviour when subjected to shear. The softer and weaker properties of
these horizons are, however, not sufficient to explain how the failure can occur on slope angles
less than 3-4°.
Excess pore pressure is often postulated for triggering submarine landslides since the movement
of large sediment slabs on slope angles less than 3-4° requires very low shear resistance (e.g.
Kvalstad et al., 2005). In the marine environment, excess pore-pressure can results from one, or a
combination, of the following processes: erosion, high sedimentation rate, groundwater seepage
forces resulting from a coastal aquifer, gas hydrate dissociation, earthquakes, mud
diapirism/volcanism, diagenetic processes, and fluid accumulation underneath a permeability
barrier.
At this stage, the Vesterålen area lacks direct and indirect evidence of fluid flow phenomena (free
gas, pockmarks, mud diapirs, hydrate) from geophysical data or core samples. As such, we
exclude these factors in the discussion in order to avoid speculation.
Erosion in clay material causes a reduction in mean stress and an increase in shear stresses which
together lead to the development of negative excess pore pressure (Bishop and Bjerrum 1960). As
the clay deposits swells, the negative excess pore pressure will dissipate until steady-state
conditions are reached. During this process, the factor of safety decreases towards its long term
conditions. In the study area, however, erosion at the base of the continental slope is likely to be a

ACC
EPTE
D M
ANU
SCR
IPT
ACCEPTED MANUSCRIPT
24
slow process which would be difficult to link to excess pore pressure generation required for
destabilizing the slope.
Excess pore-pressure generation due to high sedimentation rates during peak glacial time is an
important factor contributing to submarine slope failure on high-latitude continental margins, e.g.,
the Norwegian-Barents-Svalbard margin (e.g. Dymakis et al., 2000; Bryn et al., 2005; Kvalstad et
al., 2005; Leynaud et al., 2007) and the Canadian east coast (Piper and McCall, 2003; Piper et al.,
2003; Mosher et al., 2004). The rate of overpressure generation depends on the sedimentation
rate, sedimentation duration, sediment compressibility and its permeability. In addition, slope
geometry and flow focusing play a role for overpressure originating from sediment loading (e.g.
Flemings et al., 2002; Stigall and Dugan, 2010; Urgeles et al., 2010; Dugan 2012). Offshore the
Vesterålen margin, however, the sedimentation rate is relatively low (i.e. nearly no sedimentation
during the last 10 000 years and less than 1 m/ka over the last 30 000 years; see Fig. 4). The
reason for these low sedimentation rates is that the high mountain ranges of the Lofoten and
Vesterålen islands formed a natural barrier, such that the mainland ice masses did not connect
directly to the LVM. These mountains diverted the large ice streams into the deep Andfjorden and
Vestfjorden troughs (Fig. 1). Consequently, only small amounts of glacial debris was transported
and distributed on the continental slope (Rise et al., 2013). Excess pore pressures originating from
high sedimentation rate, sediment consolidation and/or coastal aquifers can therefore most
probably be ruled out to explain the landslides on the upper continental slope off Vesterålen.
The required excess pore pressure for failure to take place may have been of limited duration.
This is in agreement with the steep canyon slopes (generally exceeding 30°) and the steep
landslide escarpments. Indeed, and assuming a Mohr–Coulomb failure criterion, the slope angle
in the canyons off Vesterålen and the different landslide scarps would present much lower
gradients (i.e. only a few degrees) if elevated excess pore pressure would still remain in the
slopes.
ACC
EPTE
D M
ANU
SCR
IPT
ACCEPTED MANUSCRIPT
25
Earthquakes can easily trigger large submarine instabilities as they typically increase the loads on
a slope and the pore pressures (Locat and Lee 2002). Our analyses show that, during an
earthquake, the largest strains and displacements occur within the top 10 m of the soil which
corresponds well to the landslide thickness (Figs. 2-3). Furthermore, the calculated earthquake-
induced permanent displacement, in the order of 10-20 cm (Figs. 10-11), could explain the
development of the small seafloor cracks and the longer linear depression observed (Fig. 2).
Nadim and Kalsnes (1997) and Nadim et al. (2007) showed that creep strains and reduction of
static shear strength becomes significant in marine clays when the earthquake-induced cyclic
shear strain exceeds c. 1-2%. Since the soils off Vesterålen exhibit a modest contractive
behaviour and have sensitivity up to 3.4, a large earthquake and/or repeated seismicity along the
LVM may have induced a reduction in static shear strength and hence stability. In summary, the
results from pseudo-static calculations, dynamic slope stability analyses and post-earthquake pore
pressure dissipation support the idea of earthquake loading as the main triggering mechanism
(Table 5). However, it is unclear whether or not the landslides occurred because of one single,
large earthquake or repeated earthquake activity. Only dating of the landslide could elucidate this,
however. Unfortunately, accurate dating of the landslides is difficult with the currently available
samples. A larger data set of cores and in situ geotechnical tests would also be beneficial to
understand the failure mechanism following an earthquake in the region as this is governed by
local soil conditions and stratigraphy. Therefore, even if the landslides mapped off Vesterålen
were governed by the same pre-conditioning and triggering mechanisms, they might have
occurred at different times.
8.2 Hazard potential
The seismic activity of the LVM is relatively high and amongst the highest along the Norwegian
continental margin (Byrkjeland et al., 2000). There is macro-seismic evidence of several strong
earthquakes since 1880 (Bungum et al., 1991; Havskov et al. 1992). Globally, however, the

ACC
EPTE
D M
ANU
SCR
IPT
ACCEPTED MANUSCRIPT
26
seismicity is modest, and there are other areas with significantly higher seismicity (e.g., off Japan,
Eastern Mediterranean, Marmara Sea, Chili). Seismicity related to glacio-isostatic rebound
following deglaciation after the LGM was much higher than today. One of high-magnitude
earthquake due to glacio-isostatic rebound was the likely trigger for the giant Storegga landslide
(Kvalstad et al., 2005). As shown from the stability analyses, only a large earthquake or repeated
seismic activity, can also set off landslides in the Vesterålen area. It must be stressed, however,
that repeated seismicity may also result in re-consolidation and excess pore pressure dissipation,
and therefore, strengthening of the soils rather than weakening them. Due to the lack of high
quality soil samples and in situ measurements, the present analyses remain preliminary, and
future research should take into account uncertainty and regional variability in soil parameters.
As seen from the mobility analyses, the run-out distances of the different landslides are limited.
The run-out strongly depends on the volume of displaced material and on the slope angle. The
subtle change in dip downslope of the initial landslide may also be in part responsible for the
rapid deceleration. The acceleration phase is completed within 1 minute for most of the
landslides, and they reach peak velocities up to 17 m/s. These velocities fall in the same range as
those recorded during historical events (e.g. Grand banks landslide, Kuenen (1952);
Orkdalsfjorden landslide, Andersen and Bjerrum (1967) and the Rissa landslide; L’Heureux et al.,
(2012). The socio-economic consequences of such debris flows during a time of active
exploitation or with seabed infrastructure could be devastating.
Relationships between landslide parameters and maximum surface elevation can be used to
provide a first approximation of the tsunami hazard from potential landsliding in the Lofoten-
Vesterålen area. A parametric study by Løvholt et al. (2005) for similar water depths on the
Storegga slide escarpment showed that a landslide with a volume 20 times the ones observed off
Vesterålen (e.g. SL3), would only produce surface elevations in the order of decimetres in coastal
areas (landslide F6 in Løvholt et al., 2005). In that particular analysis, the landslide had a run-out

ACC
EPTE
D M
ANU
SCR
IPT
ACCEPTED MANUSCRIPT
27
distance three times the one observed off Vesterålen and maximum velocities in the range 10-20
m/s. Similar results are obtained if the acceleration of the landslides is considered. It is thus
reasonable to assume that waves from a potential landslide in the Lofoten-Vesterålen area will be
felt locally but will attenuate rapidly.
9. Conclusions
In this study, a combination of geophysical, geological and geotechnical data with slope stability
and mobility analyses was used to understand the occurrence of smaller-scale isolated landslides
off the Lofoten and Vesterålen margin. The main conclusions of the work are:
The slip planes of the isolated landslide features occur in well-defined seismic facies,
which correlate, to laminated glacial marine clays, above a distinct and continuous
reflection. These soils exhibit modest strain-softening. As the landslides have a common
slip planes and the same environmental controls (sedimentation history), it is likely that
these individual landslides have the same preconditioning factors and triggering
mechanism(s).
Compared to many other high-latitude continental margins, the continental slope off
Vesterålen has lower sedimentation rates (nearly no sedimentation during the last 10 000
years and less than 1 m/ka over the last 30 000 years). Therefore, excess pressure due to
sediment loading is highly unlikely to develop. The data currently available do not
witness evidence of fluid flow. Neither the samples nor the seismic data indicate shallow
gas.
The margin per se is stable (Factor of Safety well beyond 1). Results from pseudo-static
analysis, dynamic analysis and post-earthquake pore-pressure dissipation show that
severe earthquake loading with a very low probability of occurrence or repeated
earthquake activity was necessary for these landslides to occur. Large and frequent

ACC
EPTE
D M
ANU
SCR
IPT
ACCEPTED MANUSCRIPT
28
earthquakes may have occurred following the last glaciations due to glacio-isostatic uplift
of the area.
The mobility of these landslides is in general limited. Run-out strongly depends on the
volume of displaced material as well as the slope angle. For most of the landslides, the
acceleration phase only last about 1 minute and the peak velocities may reach up to 17
m/s. Hence, the consequences of such flows during a time of active exploitation or with
seabed infrastructure could be devastating.
The simulations depend strongly on the input parameters, which are determined from a
limited number of samples, geotechnical tests and geophysical data. Therefore, the results
must be seen as preliminary. Additional sediment cores and in situ geotechnical tests data
are planned to gain further insights into the variety of slope processes in this pristine
region of the Norwegian margin.
Acknowledgements
The authors acknowledge funding from the SEABED-Project through the Norwegian DeepWater
Programme (www.ndwp.org) and the MAREANO programme (www.mareano.no) for providing
the multibeam bathymetric data. We are also thankful to Nabil Sultan, Roger Urgeles and David
Piper for their constructive comments, which helped to improve the paper. This is contribution #
XXX from the International Centre for Geohazards.
References
Andreassen, K., Laberg, J.S., Vorren, T.O., 2008. Seafloor geomorphology of the SW Barents
Sea and its glaci-dynamic implications. Geomorphology 97, 157-177.
Andresen, A., Bjerrum, L., 1967. Slides in subaqueous slopes in loose sand and silt. Richards,
A.F. (Ed.), Marine Géotechnique. University of Illinois Press, 221-239.
Berre, T., 1998. Triaxial testing at the Norwegian Geotechnical Institute. Geotechnical Testing
Journal 5: 3-17.

ACC
EPTE
D M
ANU
SCR
IPT
ACCEPTED MANUSCRIPT
29
Biscontin, G., Pestana, J.M., Nadim, F., 2004. Seismic triggering of submarine slides in soft
cohesive soil deposits. Marine Geology, 203: 341-354.
Bishop, A.W., Bjerrum, L. 1960. The relevance of the triaxial test to the solution of stability
problems. In Proceedings of the ASCE Research Conference on Shear Strength of Cohesive Soils,
Boulder, Colo., June 1960. ASCE, New York. pp. 437–501.
Bungum H, Alsaker, A., Kvamme, L.B., Hansen, R.A., 1991. Seismicity and seismotectonics of
Norway and surrounding continental shelf areas. Journal of Geophysical Research 96, 2249-2265.
Bryn, P., Berg, K., Forsberg, C.F., Solheim, A., Kvalstad, T.J., 2005. Explaining the Storegga
slide. Marine and Petroleum Geology 22: 11-19.
Byrkjeland, U., Bungum, H., Eldholm, O., 2000. Seismotectonics of the Norwegian continental
margin. Journal of Geophysical Research 105 (B3), 6221-6236.
Bøe, R., Bellec, V.K., Dolan, M.F.J., Buhl-Mortensen, P.B., Buhl-Mortensen, L., Rise, L., 2009.
Giant sand waves in the Hola glacial trough off Vesterålen, North Norway. Marine Geology 267,
36-54.
Dugan, B., 2012. A Review of Overpressure, Flow Focusing, and Slope Failure. In Yamada et al.
(eds) Submarine Mass Movements and Their Consequences (pp. 267-276). Springer Netherlands.
Dimakis, P., Elverhøi, A., Høeg, K., Solheim, A., Harbitz, C., Laberg, J.S.,Marr, J., 2000.
Submarine slope stability on high-latitude glaciated Svalbard–Barents Sea margin. Marine
Geology 162(2), 303-316.
Flemings, P.B., Stump, B.B., Finkbeiner, T., Zoback, M., 2002. Flow focusing in overpressured
sandstones: Theory, observations, and applications. American Journal of Science, 302(10), 827-
855.
Gauer, P., T. J. Kvalstad, C. F. Forsberg, P. Bryn, K. Berg (2005), The last phase of the Storegga
Slide: Simulation of retrogressive slide dynamics and comparison with slide-scar morphology,
Marine and Petroleum Geology 22, 171– 178.
Havskov, J., Kvamme, L.B., Hansen, R.A., Bungum, H., Lindholm, C.D., 1992. The northern
Norway seismic network: Design, operation, and results. Bulletin of the Seismological Society of
America, 82(1), 481-496.
Hampton, M.A., 1972. The role of subaqueous debris flow in generating turbidity currents.
Journal of Sedimentary Research, 42(4), 775-793.
Imran, J., Harff, P., Parker, G., 2001a. A numerical model of submarine debris flow with
graphical user interface. Computers and Geosciences 27, 717–729.
Imran, J., Parker, G., Locat, J., Lee, H., 2001b. A 1-D numerical model of muddy subaqueous and
subaerial debris flows. Journal of hydraulic Engineering 127, 959–968.
Kokusho, T., Kojima, T., 2002. Mechanism for post-liquefaction water film generation in layered
sand. Journal of Geotechnical and Geoenvironmental Engineering 128: 129-137.
ACC
EPTE
D M
ANU
SCR
IPT
ACCEPTED MANUSCRIPT
30
Kuenen, P.H., 1952. Estimated size of the Grand Banks turbidity current. American Journal of
Science. 250, 874– 884.
Kvalstad, T.J., Andresen, L., Forsberg, C.F., Berg, K., Bryn, P., Wangen, M. 2005. The Storegga
slide: evaluation of triggering sources and slide mechanics. Marine and Petroleum Geology
22:245-256.
Laberg, J.S., Vorren, T.O., Kenyon, N.H., Ivanov, M., Andersen, E.S., 2005a. A modern canyon-
fed sandy turbidite system of the Norwegian Continental Margin. Norwegian Journal of Geology
85, 267-277.
Laberg, J.S., Stoker, M.S., Dahlgren, K.I.T., de Haas, H., Haflidason, H., Hjelstuen, B.O.,
Nielsen, T., Shannon, P.M., Vorren, T.O., van Weering, T.C.E., Ceramicola, S., 2005b. Cenozoic
along-slope processes and sedimentation on the NW European Atlantic margin. Marine and
Petroleum Geology 22, 1069-1088.
Laberg, J.S., Guidard, S., Mienert, J., Vorren, T.O., Haflidason, H., Nygård,A., 2007.
Morphology and morphogenesis of a high-latitude canyon area; the Andøya Canyon, Norwegian
Sea. Marine Geology 246, 68–85.
Ladd, C.C., Foott, R., 1974. New design procedure for stability of soft clays, Proceedings of
ASCE, GT7 1974 pp. 763–786.
Leroueil, S., Demers, D., La Rochelle, P., Martel, G., Virely, D., 1995. Practical applications of
the piezocone in Champlain sea clays. Proc. Int. Symp. on Cone Penetration Testing, CPT-95,
Linköping, pp. 515–522.
Leroueil, S., Hight, D.W., 2003. Behaviour and properties of natural soils and soft rocks. In T. S.
Tan et al., eds. Characterisation and Engineering Properties of Natural soils. Swets & Zeitlinger,
pp. 29-254.
Leynaud, D., Mienert, J., Nadim, F., 2004. Slope stability assessment of the Helland Hansen area
offshore the mid-Norwegian margin. Marine Geology 213, 457-480.
Leynaud, D., Sultan, N., Mienert, J., 2007. The role of sedimentation rate and permeability in the
slope stability of the formerly glaciated Norwegian continental margin: the Storegga slide model.
Landslides 4, 297-309.
L’Heureux, J.S., Eilertsen, R.S., Glimstad, S., Issler, D., Solberg, I.-L., Harbitz, C.B., 2012. The
1978 quick clay landslide at Rissa, mid-Norway: subaqueous morphology and tsunami
simulations. In: Y. Yamada et al. (Eds.), Submarine Mass Movements and Their Consequences,
Advances in Natural and Technological Hazards Research, 31, 507-516, Springer.
Locat, J., 1997. Normalized rheological behaviour of fine muds and their low properties in a
pseudoplastic regime. ASCE, First Conference on Debris Flows Hazards Mitigation, Mechanics,
Prediction and assessment, pp. 260–269.
Locat, J., Lee, H.J., 2002. Submarine landslides: advances and challenges. Canadian Geotechnical
Journal 39, 193-212.

ACC
EPTE
D M
ANU
SCR
IPT
ACCEPTED MANUSCRIPT
31
Locat, J., Lee, H.J., 2005. Subaqueous debris flows. Chapter 9. In: Mathias, Hungr (Eds.), Debris-
flows Hazards and Related Phenomena. Springer, pp. 203–245.
Long, M., Donohue, S., 2007. In situ shear wave velocity from multichannel analysis of sur-face
waves (MASW) tests at eight Norwegian research sites. Canadian Geotechnical Journal 44: 533-
544.
Lunne, T., Berre, T., Andersen, K.H., Strandvik, S., Sjursen, S., 2006. Effects of sample
disturbance and consolidation procedures on measured shear strength of soft marine Norwegian
clays. Canadian Geotechnical Journal, Vol. 43, 726-750.
Løseth, H., Tveten, E., 1996. Post-Caledonian structural evolution of the Lothten and Vesterfilen
offshore and onshore areas, Norwegian Journal of Geology 76, 215-229.
Løvholt, F., Harbitz, C.B., Haugen, K.B., 2005. A parametric study of tsunamis generated by
submarine slides in the Ormen Lange/Storegga area off western Norway. Marine and Petroleum
Geology 22: 219-231.
Masson, D.G., Harbitz, C.B., Wynn, R.B., Pedersen, G., Løvholt, F., 2006. Submarine landslides:
processes, triggers and hazard prediction. Philosophical Transactions of the Royal Society A:
Mathematical, Physical and Engineering Sciences, 364(1845), 2009-2039.
Mosher, D.C., Piper, D.J.W., Campbell, D.C., Jenner, K.A., 2004. Near-surface geology and
sediment-failure geohazards of the central Scotian Slope: American Association of Geologists,
Bulletin, v. 88, p. 703-723.
Nadim, F., Kalsnes, B., 1997. Evaluation of clay strength for seismic slope stability analysis.
Proc., XIV ICSMFE, Hamburg, Germany, Vol. 1, 377-379.
Nadim, F., Biscontin, G., Kaynia, A., 2007. Seismic triggering of submarine slides. In: Offshore
technology conference ′07, OTC paper 18911, Houston, 2007
Nash, D., 1987. A comparative review of limit equilibrium methods of stability analysis. In:
Anderson, M.G., Richards, K.S. (Eds.), Slope Stability. John Wiley and Sons, pp. 11– 75.
Norwegian Geotechnical Institute (NGI), 1998. Møre and Vøring soil investigation 1997, vol. I
and II. Report No. 972521-1, Oslo, Norway.
NORSAR, 1998. Development of a Seismic Zonation for Norway. Norwegian council for
Building Standardization (NBR). 162 p.
NPD. 2010. Petroleum resources in the sea areas off Lofoten, Vesterålen and Senja. 54 pp.
http://www.npd.no/en/Publications/Reports/Petroleum-resources-in-the-sea-areas-off-Lofoten-
Vesteralen-and-Senja/
Ottesen, D., Dowdeswell, J. A., Rise, L., 2005. Submarine landforms and the reconstruction of
fast-flowing ice streams within a large Quaternary ice sheet: The 2500-km-long Norwegian-
Svalbard margin (57–80 N). Geological Society of America Bulletin, 117(7-8), 1033-1050.
Pestana, J.M., G. Biscontin, F. Nadim, Andersen, K.H., 2000. Modeling cyclic behavior of lightly
overconsolidated clays in simple shear. Soil Dynamics and Earthquake Engineering 19, 501–519.

ACC
EPTE
D M
ANU
SCR
IPT
ACCEPTED MANUSCRIPT
32
Pestana, J.M., Nadim, F., 2000. Nonlinear site response analysis of submerged slopes. Tech. Rep.
UCB/GT/2000-04, Department of Civil and Environmental Engineering, University of California,
Berkeley, CA.Pestana, J.M. and Biscontin, G,. 2000. A simplified model describing the cyclic
behaviour of lightly overconsolidated clays in simple shear, Geotechnical Engng Report No.
UCB/GT/ 2000-03, Dep. of Civil and Environ. Eng., University of California, 67 pp. Berkeley,
CA.
Piper, D.J.W., McCall, C., 2003. A synthesis of the distribution of submarine mass movements on
the eastern Canadian margin, In: Locat, J. and Mienert, J., eds., Submarine Mass Movements and
Their Consequences: Advances in Natural and Technological Hazards Research, 19: Dordrecht,
Kluwer Academic Publishers, p. 291-298.
Piper, D.J.W., Mosher, D.C., Gauley, B.-J., Jenner, K., Campbell, D.C., 2003. The chronology
and recurrence of submarine mass movements on the continental slope off southeastern Canada,
In: Locat, J. and Mienert, J., eds., Submarine Mass Movements and Their Consequences:
Advances in Natural and Technological Hazards Research, 19: Dordrecht, Kluwer Academic
Publishers, p. 299-306.
Reimer, P.J., Baillie, M.G.L., Bard, E., Bayliss, A., Beck, J.W., Blackwell, P.G., Bronk Ramsey ,
C., Buck, C.E., Burr, G.S., Edwards, R.L., Friedrich, M., Grootes, P.M., Guilderson, T.P., Hajdas,
I., Heaton, T.J., Hogg, A.G., Hughen, K.A., Kaiser, K.F., Kromer, B., McCormac, F.G.,
Manning, S.W., Reimer, R.W., Richards, D.A., Southon, J.R., Talamo, S., Turney, C.S.M., van
der Plicht, J. and Weyhenmeyer, C.E., 2009. INTCAL 09 and MARINE09 radiocarbon age
calibration curves, 0-50,000 years Cal BP. Radiocarbon, 51 (4). pp. 1111-1150. ISSN 0033-8222
Rise, L., Bøe, R., Riis, F., Bellec, V. K., Laberg, J. S., Eidvin, T., Thorsnes, T., 2013. The
Lofoten-Vesterålen continental margin, North Norway: Canyons and mass-movement activity.
Marine and Petroleum Geology 45: 134-149.
Rise, L., Chand, S., Haflidason, H., L'Heureux, J.-S., Hjelstuen, B.O., Bellec, V., Longva, O.,
Brendryen, J., Vanneste, M., Bøe, R., 2012. Investigations of Slides at the Upper Continental
Slope off Vesterålen, North Norway. In: Yamada, Y., Kawamura, K., Ikehara, K., Ogawa, Y.,
Urgeles, R., Mosher, D.C., Chaytor, J., Strasser, M. (Eds.), Submarine Mass Movements and
Their Consequences (5th International Symposium). Springer, pp. 167-176.
Rise, L., Ottesen, D., Berg, K., Lundin, E., 2005. Large-scale development of the Mid-Norwegian
margin during the last 3 million years. Marine and Petroleum Geology 22 (1-2), 33-44.
Rise, L., Rokoengen, K., Sættem, J., Bugge, T., 1988. Thickness of Quaternary Deposits on the
Mid Norwegian Continental Shelf. M 1:1 000 000. Continental Shelf Institute (IKU). Publication
No. 119, 1988.
Sandbækken, G., Berre, T., Lacasse, S., 1986. Oedometer testing at the Norwegian Geotechnical
Institute. In Consolidation of Soils: Testing and Evaluation, RN Yong and FC Townsend (Eds),
329-353. Philadelphia: American Society for Testing and Materials
Stigall, J., Dugan, B., 2010. Overpressure and earthquake initiated slope failure in the Ursa
region, northern Gulf of Mexico. Journal of Geophysical Research: Solid Earth, 115(B4).
Stuiver, M., Reimer, P. J., Reimer, R. W., 2005. CALIB 5.0. [WWW program and
documentation]. http://calib.qub.ac.uk/calib/
ACC
EPTE
D M
ANU
SCR
IPT
ACCEPTED MANUSCRIPT
33
Sættem, J., Rokoengen, K., 1983. Shallow bedrock geology and Quaternary thickness of northern
Helgeland, Vestfjorden and Lofoten. Continental Shelf Institute (IKU) report P-155/2/83, 44 pp.
Tavenas, F., Flon, P., Leroueil, S., Lebuis, J., 1983. Remolding energy and risk of retrogression in
sensitive clays. Symposium on slopes on soft clays, Linkoping, Swedish Geotechnical Institute
Report, No. 17: 205-262.
Thorsnes, T., Erikstad, L., Dolan, M. F., Bellec, V. K., 2009. Submarine landscapes along the
Lofoten–Vesterålen–Senja margin, northern Norway. Norwegian Journal of Geology, 89(1), 5-16.
Urgeles, R., Locat, J., Sawyer, D.E., Flemings, P.B., Dugan, B., Binh, N.T.T., 2010. History of
pore pressure build up and slope instability in mud-dominated sediments of Ursa Basin, Gulf of
Mexico continental slope. In Mosher et al. (eds) Submarine Mass Movements and Their
Consequences (pp. 179-190). Springer Netherlands.
Vanneste, M., L'Heureux, J.-S., Baeten, N., Brendryen, J., Vardy, M.E., Steiner, A., Forsberg,
C.F., Kvalstad, T.J., Laberg, J.S., Chand, S., Longva, O., Rise, L., Haflidason, H., Hjelstuen,
B.O., Forwick, M., Morgan, E., Lecomte, I., Kopf, A., Vorren, T.O., Reichel, T., 2012. Shallow
Landslides and their Dynamics in Coastal and Deepwater Environments, Norway. In: Yamada,
Y., Kawamura, K., Ikehara, K., Ogawa, Y., Urgeles, R., Mosher, D.C., Chaytor, J., Strasser, M.
(Eds.), Submarine Mass Movements and Their Consequences. Springer, pp. 29-41.
Vorren, T.O., Laberg, J.S., Blaume, F., Dowdeswell, J.A., Kenyon, N.H., Mienert, J., Rumohr, J.,
Werner, F., 1998. The Norwegian–Greenland Sea continental margins: morphology and late
Quaternary sedimentary processes and environment. In: Elverhøi, A. (Ed.), Glacial and Oceanic
History of the Polar North Atlantic Margins, Vol. 17. Quaternary Science Review, pp. 273–302.

ACC
EPTE
D M
ANU
SCR
IPT
ACCEPTED MANUSCRIPT
34
Table caption
Table 1: Maximum peak ground acceleration with 90% probability of no exceedance for 475- and
10,000-year return period offshore Vesterålen (NORSAR 1998).
Table 2: Estimated size, volume and run-out distances for landslides SL1-SL4, SLW and SLA. (See
Figures 2-3 for location). Length, thicknesses and width data are given for the failure area.
Table 3: Radiocarbon ages obtained from foraminiferas and a shell in core GS-10-163-05PC.
Table 4: Summary of soil conditions and soil parameters used for the stability analyses at Vesterålen.
Table 5: Summary of stability analyses for the Vesterålen slopes.
Figure caption:
Figure 1: Location of the Lofoten – Vesterålen continental margin. The Andøya Canyon (AC) is the
second northernmost of c. 15 deep features intersecting the continental slope. The study area is
shown with the rectangle. The yellow circles on the Norwegian map represent recorded earthquakes
with a magnitude larger than 3.5 since 1979.
Figure 2: Shaded relief bathymetric image of the study area (100 m contour interval) with named
landslides as well as cracks and a pronounced linear depression (modified from Rise et al. 2012).
Both the landslide scars and accumulation zone are shown, illustrating the low mobility of these
landslides. SB: Shelf break.
Figure 3: 3D bathymetric projection towards the southeast showing detail morphology of the study
area. Section AA’, BB’ and CC’ present sections of high resolution seismic profiles (Topas) through
the landslides.
Figure 4: Stratigraphy and geotechnical data from core GS-10-163-05PC.
Figure 5: X-ray imagery showing A) a typical sandy clay facies (depth in core 390-425 cm) and B) a
typical silty clay with laminae (depth in core 181-216 cm).
Figure 6: (left) Normalised shear stress and (right) normalised pore pressure response upon axial
strain or shear strain from CAUC and DSS strength tests for six samples. Prior to shearing in the
CAUC the samples A2, C6, C2 and D2 were consolidated at 114.7 kPa, 89.9 kPa, 79.8 kPa, and 69.9
kPa, respectively. Samples C4 and D2 were initially consolidated at 85.0 and 71.0 kPa before
shearing in DSS, respectively. Note the modest contractive response for sample C6 collected at a
depth of 8.6 m.
ACC
EPTE
D M
ANU
SCR
IPT
ACCEPTED MANUSCRIPT
35
Figure 7: Simplified morpho-stratigraphic model used in the 2D slope stability analysis with
SLOPE/W. The 10 most critical failure surfaces are shown in red while the green band represents the
most critical surface. The post-failure profile is also shown together with the depth of seismic
horizons a, b and c (see Figs. 3 and 4). (Vertical exaggeration [V.E.] is 10).
Figure 8: Factor of safety from infinite slope and 2D slope stability analyses as a function of the peak
ground acceleration (PGA) for landslide SL2. For the 2D analyses with Ru=0 and Ru=0.25 the results
are shown for normalized undrained shear strength (αDSS) ranging from 0.27 to 0.35.
Figure 9: Acceleration time history (scaled to 0.22 g) and spectral acceleration for the Ms 6.5 Friuli
Tarcento earthquake and the Ms= 7.1 Loma Prieta earthquake.
Figure 10: Maximum shear strain, maximum displacement and excess pore pressure ratio at the end
of a Friuli and Loma Prieta type earthquake scale to the 10 000 year return period off Vesterålen
(PGA= 0.22 g). The largest strains and displacements occur within the top 10 m of the soil. The
results are shown for a sediment thickness varying from 25 to 100 m below the seafloor.
Figure 11: Effect of the PGA on the maximum shear strain (left) and displacement (right) at 5 and 15
m below the seabed for a Loma Prieta type earthquake and a sediment thickness of 100 m.
Figure 12: Pore pressure dissipation following a Loma Pierta type earthquake a sediment thickness
of 100 m. Case I: cv is constant with depth at 5 x 10⁻⁸
m2/s. Case II: cv for a layer at 8 to 12 m below
seafloor is set to 5 x 10⁻⁸
m2/s whereas the overlying and underlying sediments are given a cv that is
two orders of magnitude higher.
Figure 13: Comparison of initial landslide volumes with run-out distances from multibeam
bathymetric data and with the results from BING analyses.
Figure 14: Results from mobility analysis using both Bingham and Bilinear models in BING and
showing the velocity profile of the frontal element as a function of the distance for SL3 off Vesterålen.

ACC
EPTE
D M
ANU
SCR
IPT
ACCEPTED MANUSCRIPT
36
Figure 1

ACC
EPTE
D M
ANU
SCR
IPT
ACCEPTED MANUSCRIPT
37
Figure 2
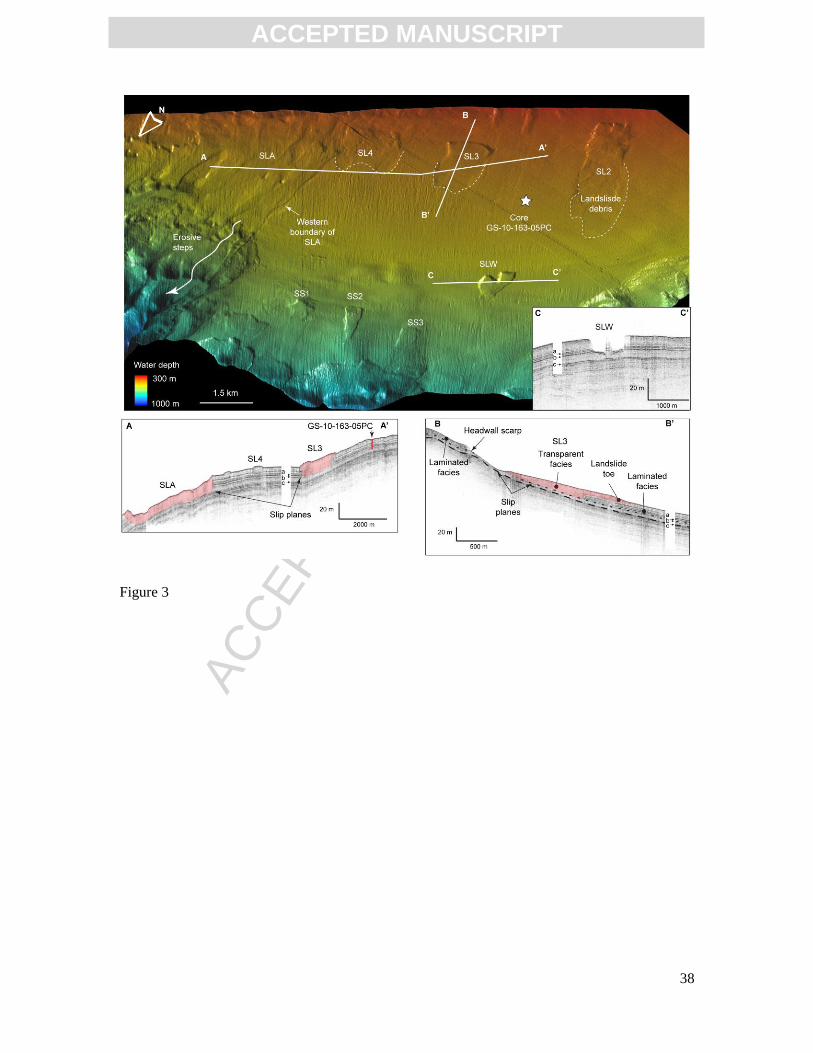
ACC
EPTE
D M
ANU
SCR
IPT
ACCEPTED MANUSCRIPT
38
Figure 3

ACC
EPTE
D M
ANU
SCR
IPT
ACCEPTED MANUSCRIPT
39
Figure 4
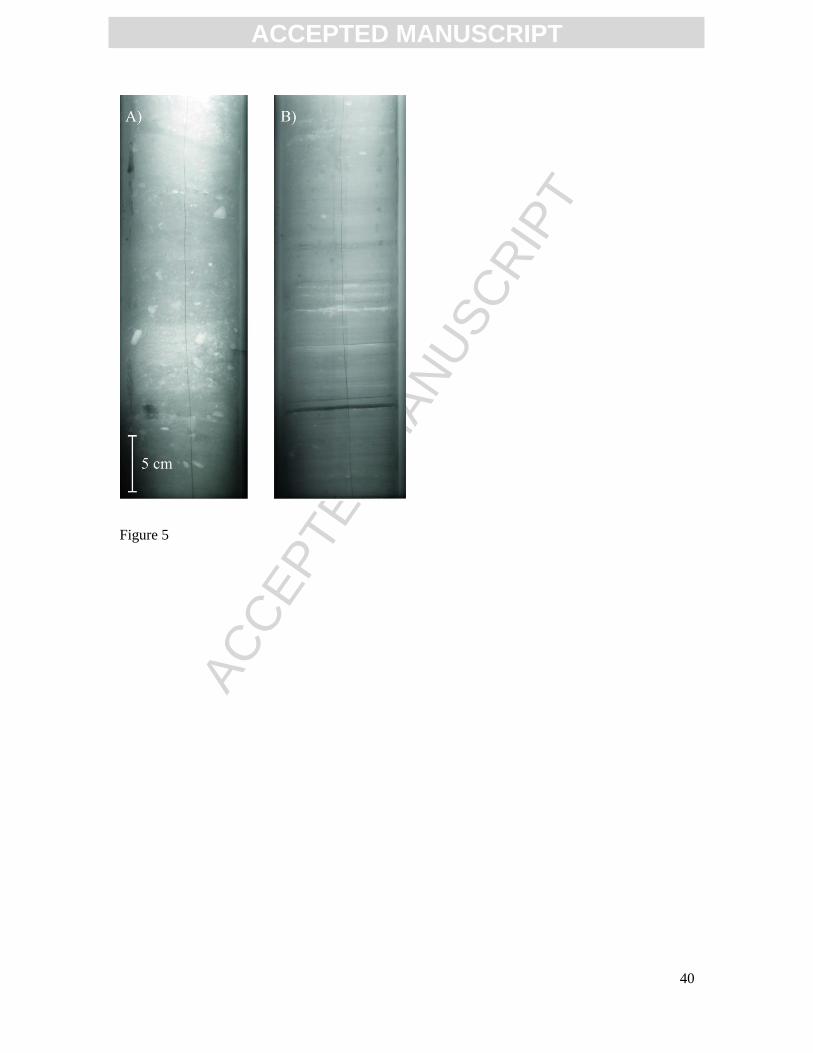
ACC
EPTE
D M
ANU
SCR
IPT
ACCEPTED MANUSCRIPT
40
Figure 5
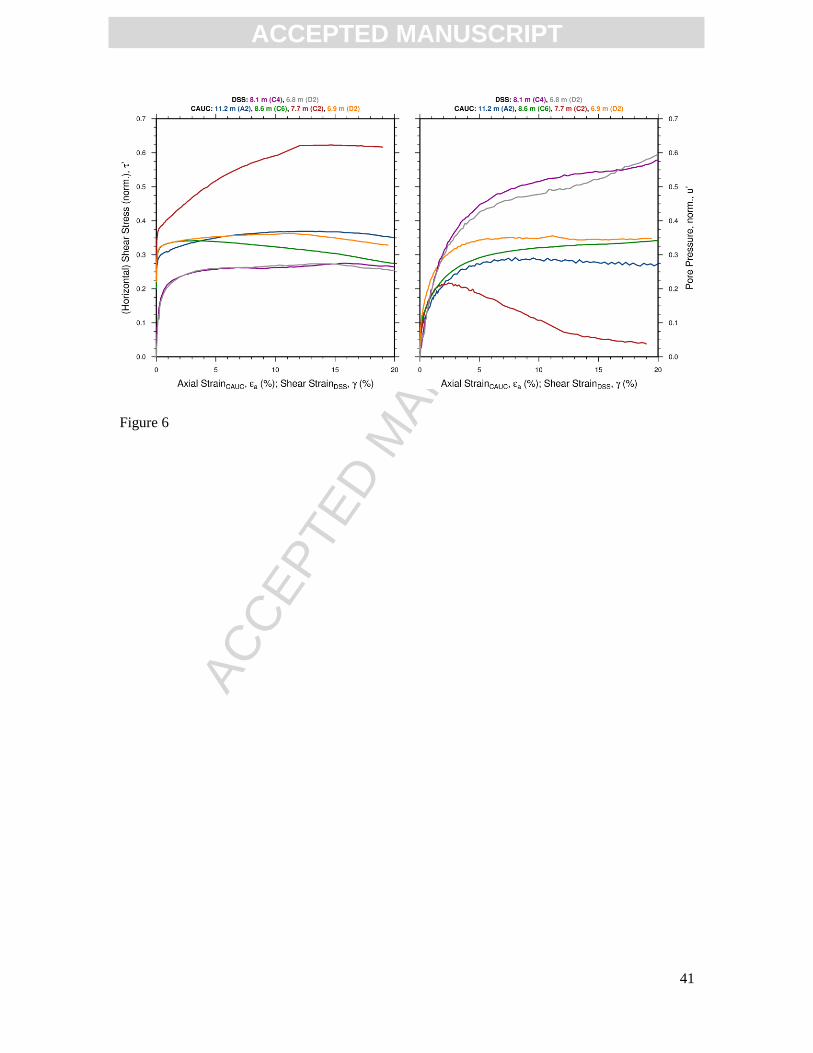
ACC
EPTE
D M
ANU
SCR
IPT
ACCEPTED MANUSCRIPT
41
Figure 6
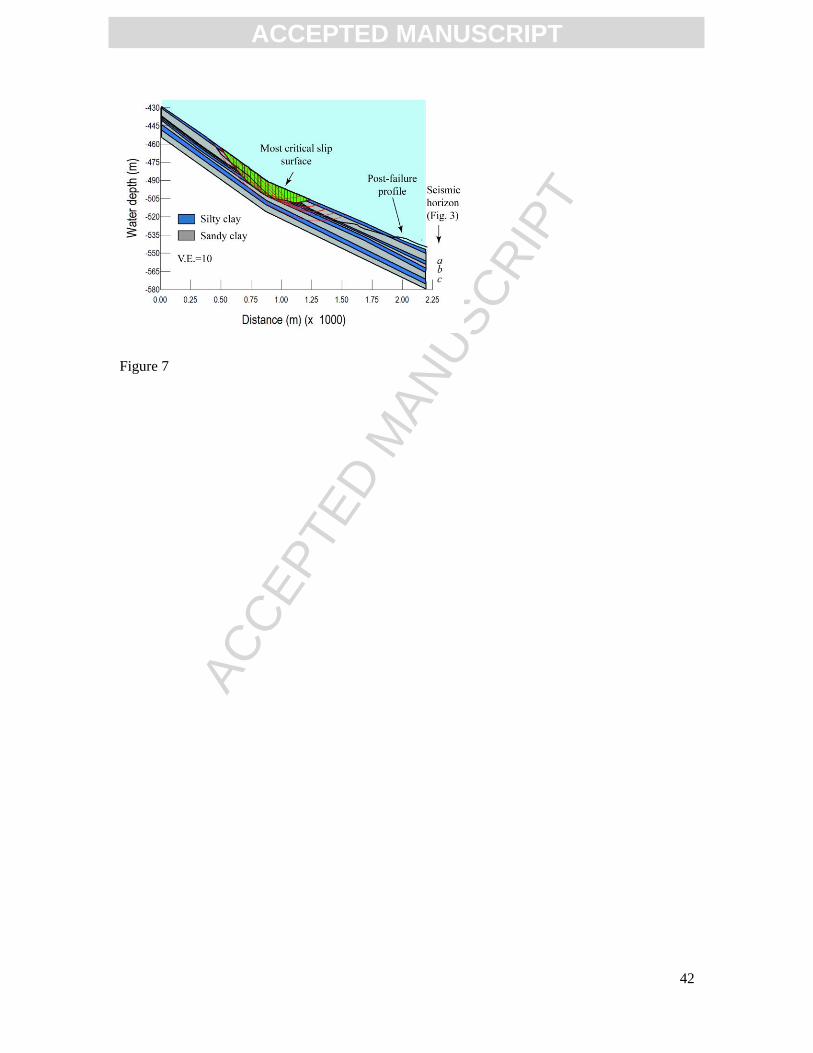
ACC
EPTE
D M
ANU
SCR
IPT
ACCEPTED MANUSCRIPT
42
Figure 7
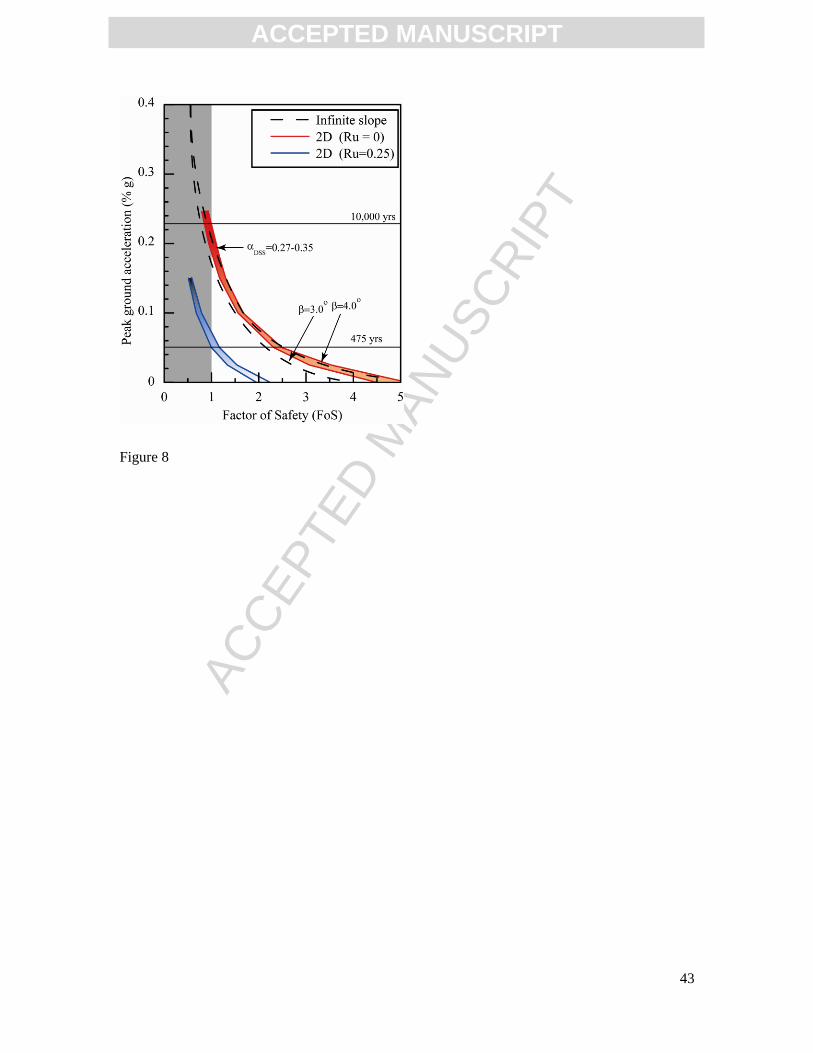
ACC
EPTE
D M
ANU
SCR
IPT
ACCEPTED MANUSCRIPT
43
Figure 8

ACC
EPTE
D M
ANU
SCR
IPT
ACCEPTED MANUSCRIPT
44
Figure 9
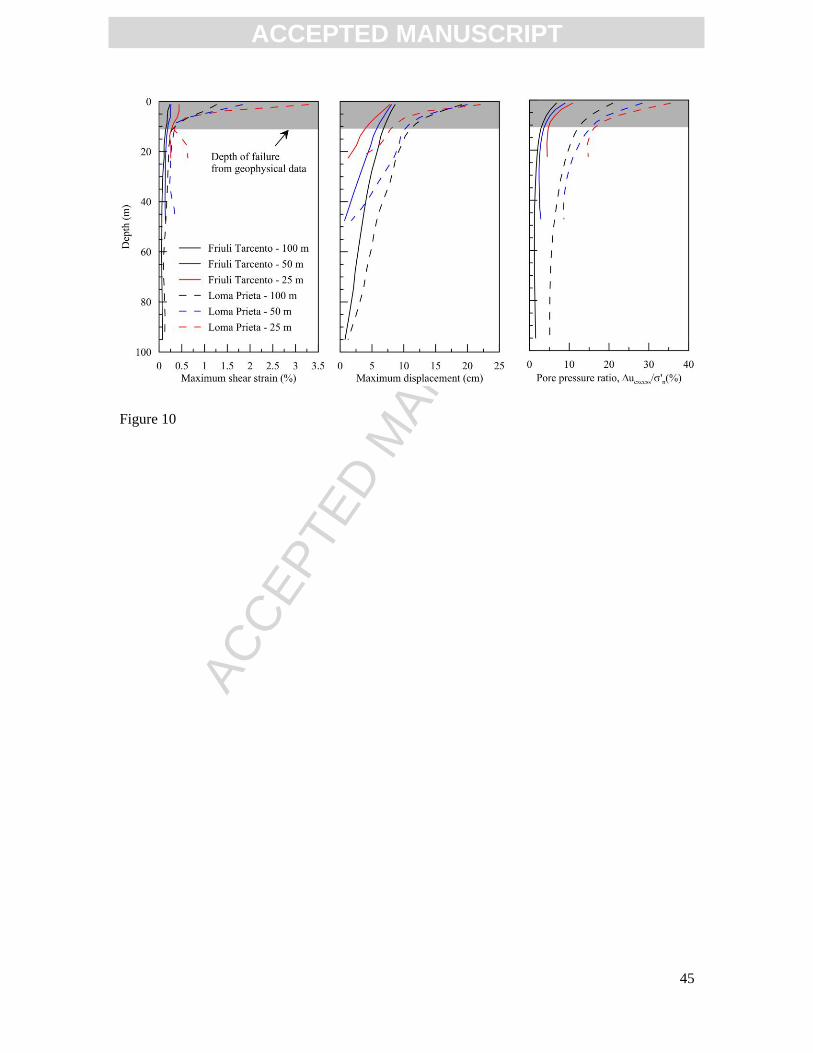
ACC
EPTE
D M
ANU
SCR
IPT
ACCEPTED MANUSCRIPT
45
Figure 10

ACC
EPTE
D M
ANU
SCR
IPT
ACCEPTED MANUSCRIPT
46
Figure 11

ACC
EPTE
D M
ANU
SCR
IPT
ACCEPTED MANUSCRIPT
47
Figure 12

ACC
EPTE
D M
ANU
SCR
IPT
ACCEPTED MANUSCRIPT
48
Figure 13

ACC
EPTE
D M
ANU
SCR
IPT
ACCEPTED MANUSCRIPT
49
Figure 14

ACC
EPTE
D M
ANU
SCR
IPT
ACCEPTED MANUSCRIPT
50
Table 1: Maximum peak ground acceleration with 90% probability of no exceedance for 475- and
10,000-year return period offshore Vesterålen (NORSAR 1998).
90% probability of no
exceedance during
time (years)
Return period
(years)
PGA
(g)
50 475 0.051
1000 10 000 0.224
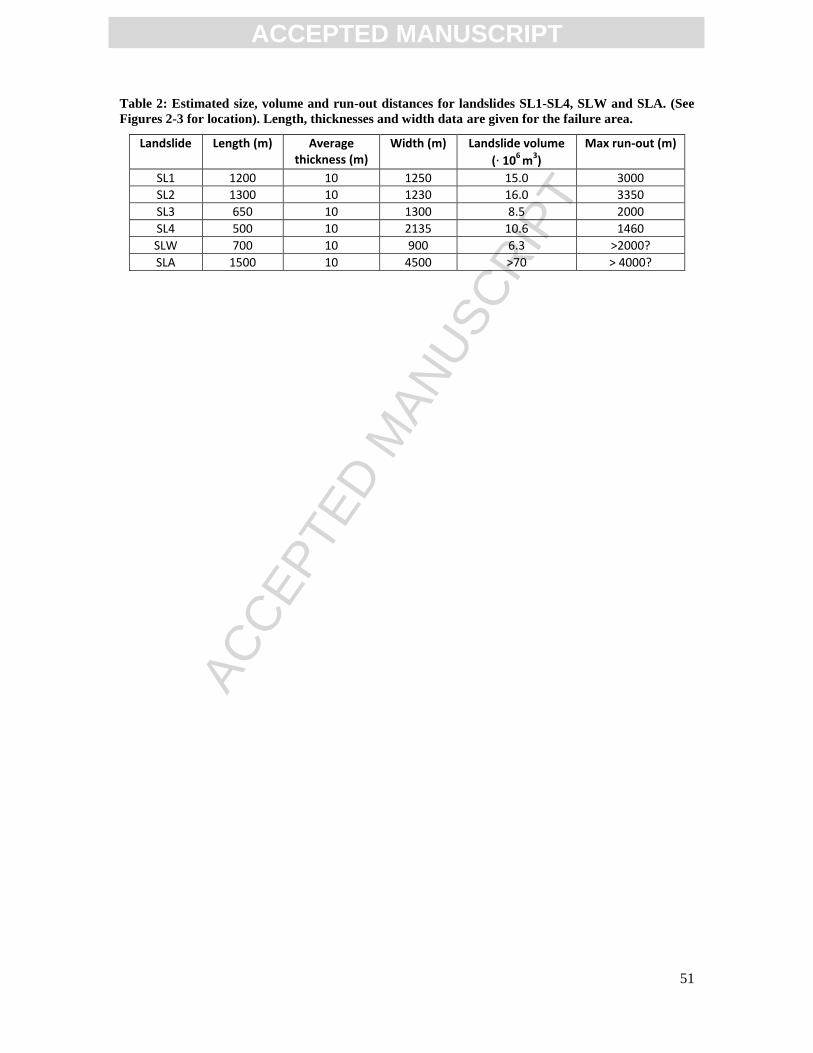
ACC
EPTE
D M
ANU
SCR
IPT
ACCEPTED MANUSCRIPT
51
Table 2: Estimated size, volume and run-out distances for landslides SL1-SL4, SLW and SLA. (See
Figures 2-3 for location). Length, thicknesses and width data are given for the failure area.
Landslide Length (m) Average thickness (m)
Width (m) Landslide volume
(· 106
m3)
Max run-out (m)
SL1 1200 10 1250 15.0 3000
SL2 1300 10 1230 16.0 3350
SL3 650 10 1300 8.5 2000
SL4 500 10 2135 10.6 1460
SLW 700 10 900 6.3 >2000?
SLA 1500 10 4500 >70 > 4000?

ACC
EPTE
D M
ANU
SCR
IPT
ACCEPTED MANUSCRIPT
52
Table 3: Radiocarbon ages obtained from foraminiferas and a shell in core GS-10-163-05PC.
Lab
number
Sample depth
interval (cm) Material
Radiocarbon
age (BP)
(BP = 1950)
Error Delta R Calibrated age (cal BP)
– median probability
Top Base
Beta-
304868 316 318
Foraminifera,
Nps 16 390 60 250 18 949
Beta-
305841 639 640
Foraminifera,
Nps 20 480 80 250 23 691
Beta-
305842 705 706
Foraminifera,
Nps 21 080 80 250 24 377
Beta-
305843 1008 1009
Foraminifera,
Nps 25 190 130 250 29 342
Beta-
304869 1086 1087 Shell 25 870 120 250 30 008
Beta-
304870 1114 1116
Foraminifera,
Nps 25 590 110 250 29 834

ACC
EPTE
D M
ANU
SCR
IPT
ACCEPTED MANUSCRIPT
53
Table 4: Summary of soil conditions and soil parameters used for the stability analyses at Vesterålen.
Material γ (kN/m3)
Clay
content
(%)
Sand
content
(%)
w (%) St αDSS αC αDSS / αC
Sandy clay 17.7 < 40 20-40 45 1.0-
3.0 - 0.52 -
Silty clay 18.4 50-65 < 10 40-47 3.4 0.27 0.46 0.75
γ: bulk unit weight, w: water content, St: sensitivity, αDSS: undrained shear strength ratio from direct simple
shear test, αC: undrained shear strength ratio from anisotropically consolidated undrained triaxial test
(CAUC).

ACC
EPTE
D M
ANU
SCR
IPT
ACCEPTED MANUSCRIPT
54
Table 5: Summary of stability analyses for the Vesterålen slopes.
Type of analysis Factor of
safety,
FoS
Remarks
Static drained FoS > 7 Need an excess pore pressure of 90 % to reach FoS =1.
The depth and length of the critical failure surface does
not match landslide morphology.
Static undrained FoS > 3 Critical slip surface matches the depth and extent of
actual failure.
Pseudo-static analysis
su/’vcDSS
=0.27
su/’vcDSS
increased to 0.35 (to account
for sample disturbance)
FoS > 2
FoS=1
For 475-yr earthquake
For 10 000-yr earthquake
1D dynamic earthquake analyses FoS = 1
Fails in
layer at
11.5m
Accumulation of deformations in top 10 m, 10 000-yr
earthquake.
Post-earthquake slope stability analysis
coupled with pseudo-static analysis
FoS = 1 Accumulation of excess pore-pressure (Ru= 25%)
following a 10 000-yr earthquake.
Pseudostatic analyses with a 475-yr earthquake leads to
slope failure (i.e. repeated earthquake activity).
ACC
EPTE
D M
ANU
SCR
IPT
ACCEPTED MANUSCRIPT
55
Highlights
Landslides on the upper continental slope off the Vesterålen islands are investigated.
The slip planes of the landslides lie within laminated glacial marine clays .
Modest strain-softening behavior is observed in laminated glacial marine clays.
Earthquake analyses suggest that the margin is essentially stable.
Mobility analyses reveal peak velocities up to 17 m/s for these landslides.
Related Documents