National Aeronautics and Space Administration Landslides Earth on the Move www.nasa.gov

Welcome message from author
This document is posted to help you gain knowledge. Please leave a comment to let me know what you think about it! Share it to your friends and learn new things together.
Transcript
National Aeronautics andSpace Administration
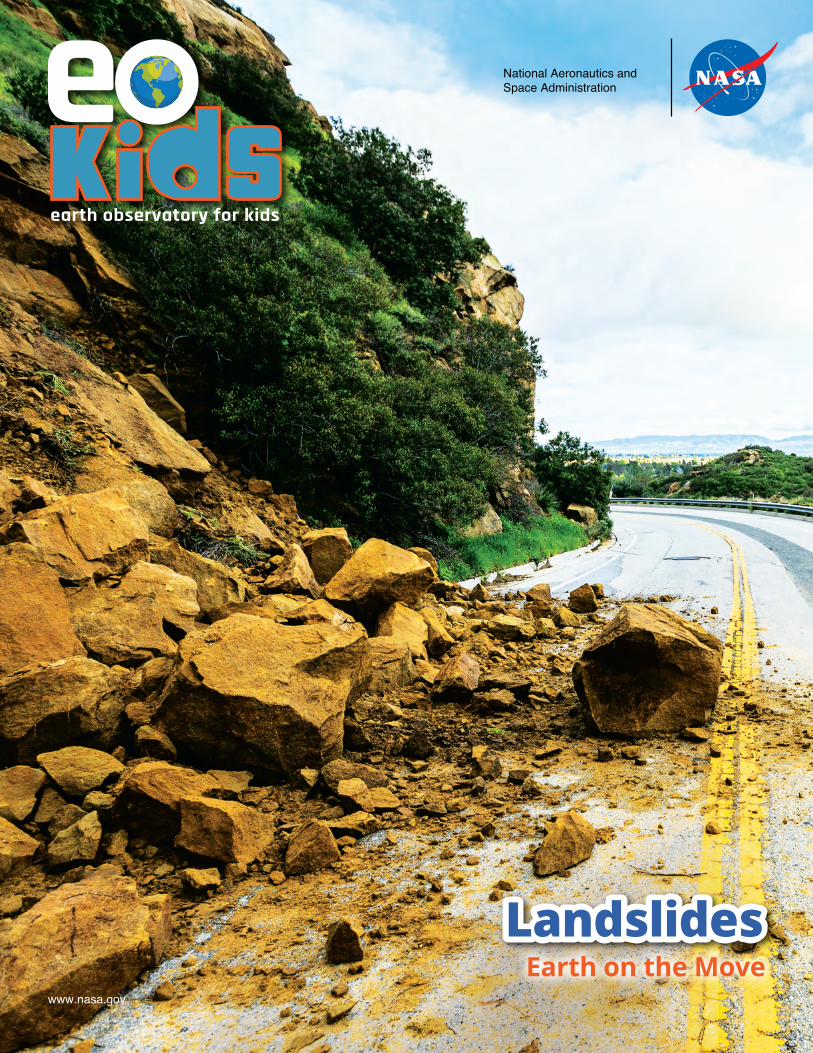
LandslidesEarth on the Move
www.nasa.gov
2
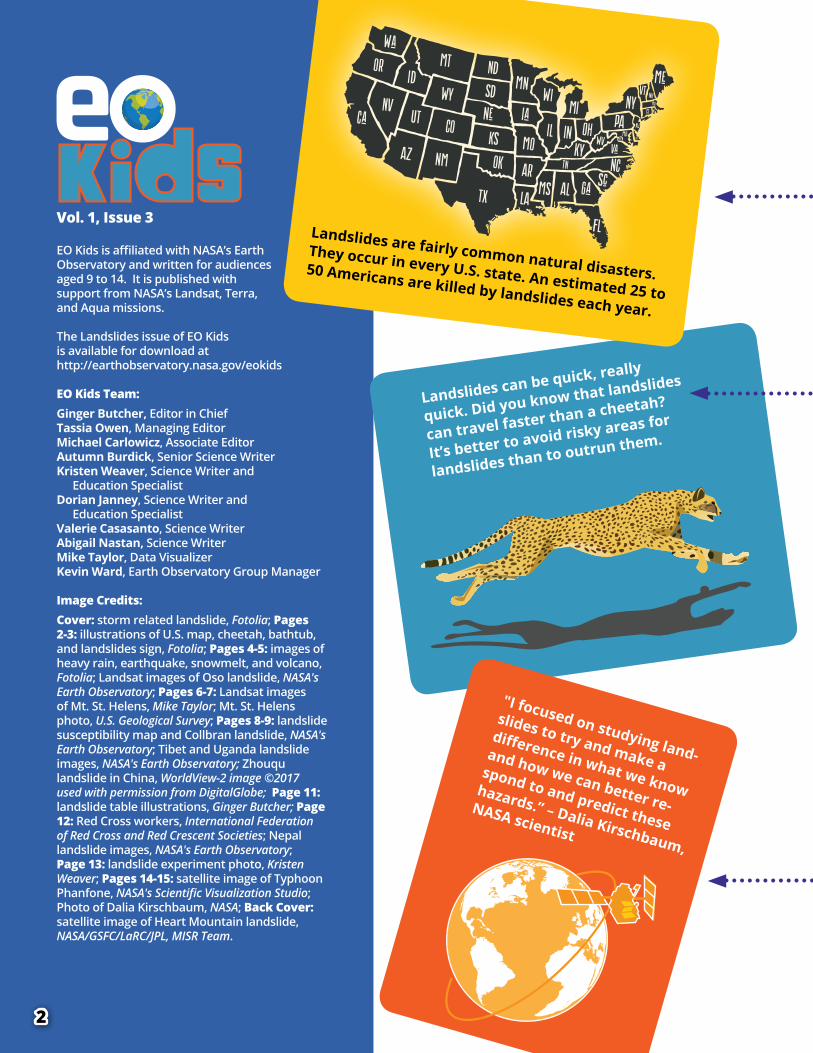
EO Kids is affiliated with NASA’s Earth Observatory and written for audiences aged 9 to 14. It is published with support from NASA’s Landsat, Terra, and Aqua missions.
The Landslides issue of EO Kids is available for download at http://earthobservatory.nasa.gov/eokids
EO Kids Team:Ginger Butcher, Editor in ChiefTassia Owen, Managing Editor Michael Carlowicz, Associate Editor Autumn Burdick, Senior Science Writer Kristen Weaver, Science Writer and Education SpecialistDorian Janney, Science Writer and Education SpecialistValerie Casasanto, Science Writer Abigail Nastan, Science WriterMike Taylor, Data Visualizer Kevin Ward, Earth Observatory Group Manager
Image Credits:Cover: storm related landslide, Fotolia; Pages 2-3: illustrations of U.S. map, cheetah, bathtub, and landslides sign, Fotolia; Pages 4-5: images of heavy rain, earthquake, snowmelt, and volcano, Fotolia; Landsat images of Oso landslide, NASA's Earth Observatory; Pages 6-7: Landsat images of Mt. St. Helens, Mike Taylor; Mt. St. Helens photo, U.S. Geological Survey; Pages 8-9: landslide susceptibility map and Collbran landslide, NASA's Earth Observatory; Tibet and Uganda landslide images, NASA's Earth Observatory; Zhouqu landslide in China, WorldView-2 image ©2017 used with permission from DigitalGlobe; Page 11: landslide table illustrations, Ginger Butcher; Page 12: Red Cross workers, International Federation of Red Cross and Red Crescent Societies; Nepal landslide images, NASA's Earth Observatory; Page 13: landslide experiment photo, Kristen Weaver; Pages 14-15: satellite image of Typhoon Phanfone, NASA's Scientific Visualization Studio; Photo of Dalia Kirschbaum, NASA; Back Cover: satellite image of Heart Mountain landslide, NASA/GSFC/LaRC/JPL, MISR Team.
Vol. 1, Issue 3
Landslides can be quick, really
quick. Did you know that landslides
can travel faster than a cheetah?
It’s better to avoid risky areas for
landslides than to outrun them.
Landslides are fairly common natural disasters. They occur in every U.S. state. An estimated 25 to
50 Americans are killed by landslides each year.
"I focused on studying land-
slides to try and make a
difference in what we know
and how we can better re-
spond to and predict these
hazards.” – Dalia Kirschbaum,
NASA scientist
3
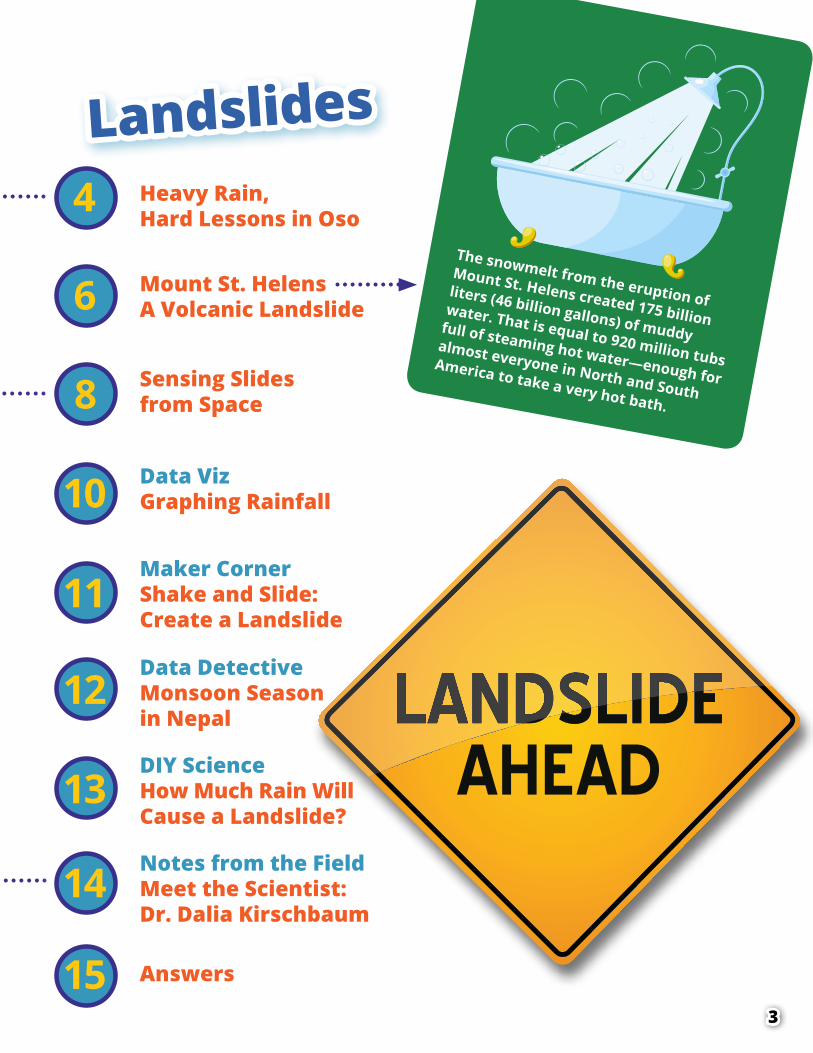
The snowmelt from the eruption of
Mount St. Helens created 175 billion
liters (46 billion gallons) of muddy
water. That is equal to 920 million tubs
full of steaming hot water—enough for
almost everyone in North and South
America to take a very hot bath.
4
8
11
6
10
12
13
14
15
LandslidesHeavy Rain,Hard Lessons in Oso
Mount St. HelensA Volcanic Landslide
Sensing Slidesfrom Space
Maker CornerShake and Slide:Create a Landslide
DIY ScienceHow Much Rain Will Cause a Landslide?
Data Detective Monsoon Season in Nepal
Notes from the FieldMeet the Scientist:Dr. Dalia Kirschbaum
Answers
Data VizGraphing Rainfall
What Triggers Landslides?
4
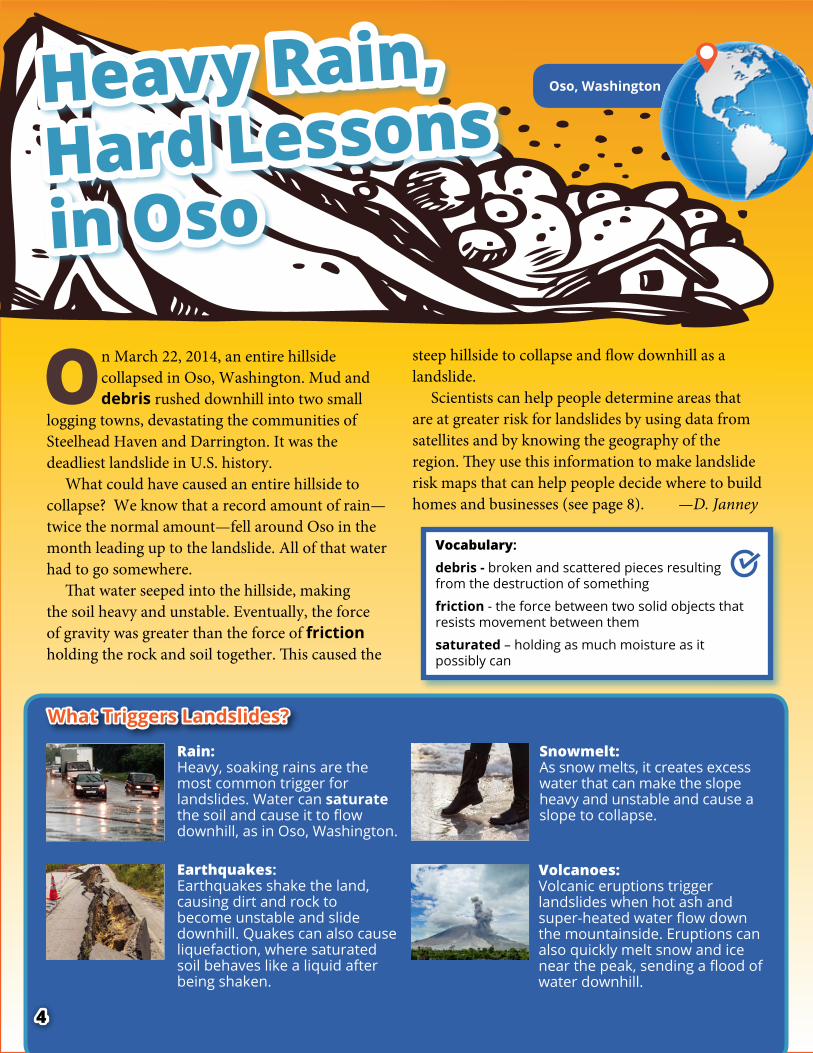
Vocabulary:debris - broken and scattered pieces resulting from the destruction of something
friction - the force between two solid objects that resists movement between them
saturated – holding as much moisture as it possibly can
On March 22, 2014, an entire hillside collapsed in Oso, Washington. Mud and debris rushed downhill into two small
logging towns, devastating the communities of Steelhead Haven and Darrington. It was the deadliest landslide in U.S. history.
What could have caused an entire hillside to collapse? We know that a record amount of rain— twice the normal amount—fell around Oso in the month leading up to the landslide. All of that water had to go somewhere.
That water seeped into the hillside, making the soil heavy and unstable. Eventually, the force of gravity was greater than the force of friction holding the rock and soil together. This caused the
steep hillside to collapse and flow downhill as a landslide.
Scientists can help people determine areas that are at greater risk for landslides by using data from satellites and by knowing the geography of the region. They use this information to make landslide risk maps that can help people decide where to build homes and businesses (see page 8). —D. Janney
Oso, Washington
Rain: Heavy, soaking rains are the most common trigger for landslides. Water can saturate the soil and cause it to flow downhill, as in Oso, Washington.
Volcanoes: Volcanic eruptions trigger landslides when hot ash and super-heated water flow down the mountainside. Eruptions can also quickly melt snow and ice near the peak, sending a flood of water downhill.
Earthquakes: Earthquakes shake the land, causing dirt and rock to become unstable and slide downhill. Quakes can also cause liquefaction, where saturated soil behaves like a liquid after being shaken.
Snowmelt: As snow melts, it creates excess water that can make the slope heavy and unstable and cause a slope to collapse.
Heavy Rain, Hard Lessons in Oso
5
A lot of research has been done to try to determine whether logging on the hillside might have contributed to the 2014 landslide. Tree roots help anchor the soil and soak up rain.
However, scientists have also found evidence that landslides occurred near Oso long before people began removing trees.
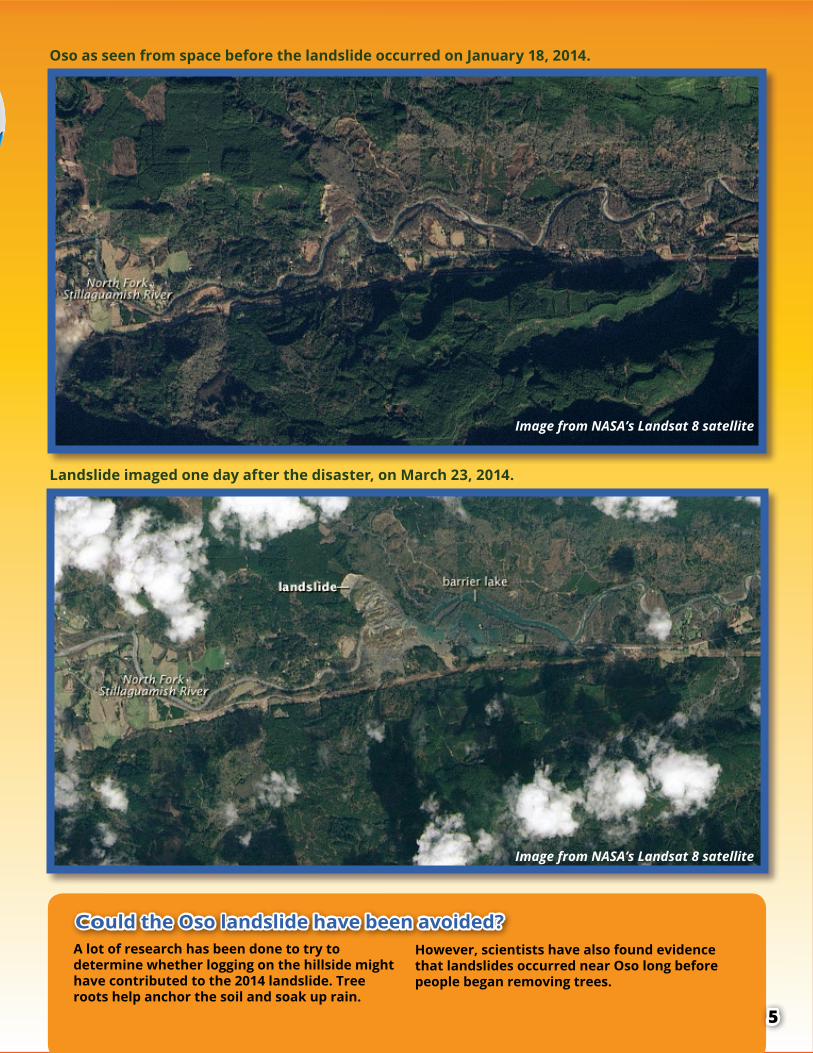
Oso as seen from space before the landslide occurred on January 18, 2014.
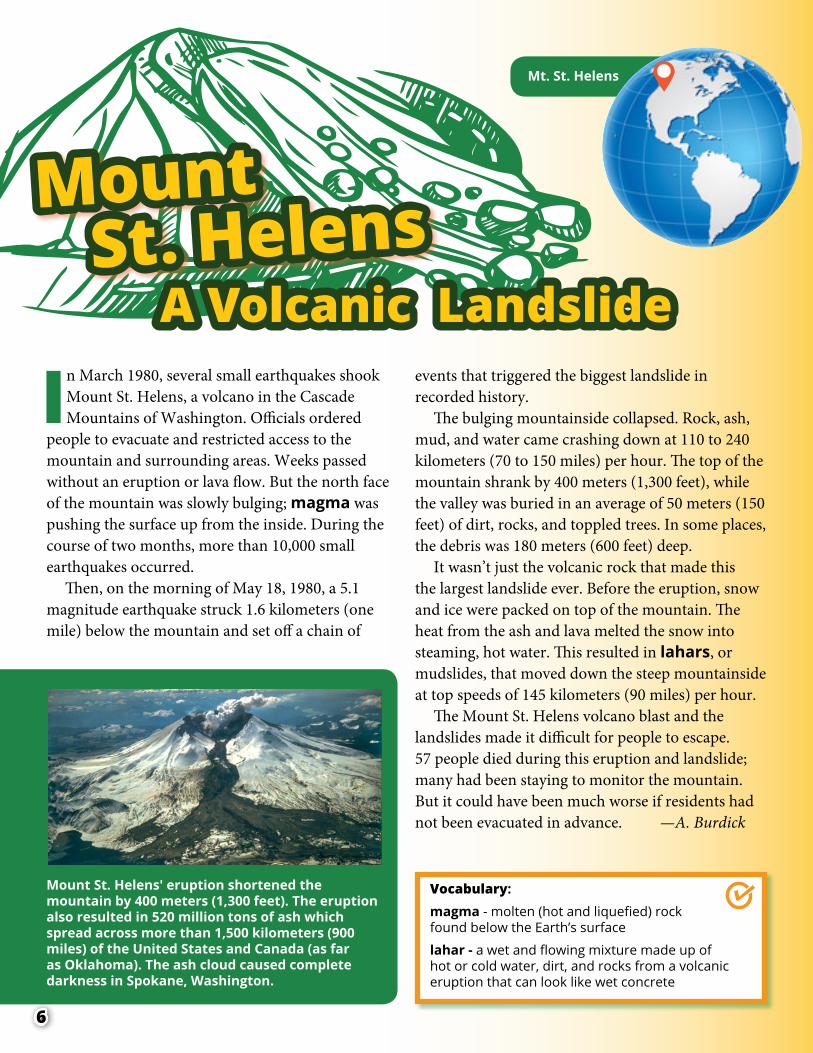
Landslide imaged one day after the disaster, on March 23, 2014.
Could the Oso landslide have been avoided?
Image from NASA’s Landsat 8 satellite
Image from NASA’s Landsat 8 satellite
6
Vocabulary: magma - molten (hot and liquefied) rock found below the Earth’s surface
lahar - a wet and flowing mixture made up of hot or cold water, dirt, and rocks from a volcanic eruption that can look like wet concrete
In March 1980, several small earthquakes shook Mount St. Helens, a volcano in the Cascade Mountains of Washington. Officials ordered
people to evacuate and restricted access to the mountain and surrounding areas. Weeks passed without an eruption or lava flow. But the north face of the mountain was slowly bulging; magma was pushing the surface up from the inside. During the course of two months, more than 10,000 small earthquakes occurred.
Then, on the morning of May 18, 1980, a 5.1 magnitude earthquake struck 1.6 kilometers (one mile) below the mountain and set off a chain of
events that triggered the biggest landslide in recorded history.
The bulging mountainside collapsed. Rock, ash, mud, and water came crashing down at 110 to 240 kilometers (70 to 150 miles) per hour. The top of the mountain shrank by 400 meters (1,300 feet), while the valley was buried in an average of 50 meters (150 feet) of dirt, rocks, and toppled trees. In some places, the debris was 180 meters (600 feet) deep.
It wasn’t just the volcanic rock that made this the largest landslide ever. Before the eruption, snow and ice were packed on top of the mountain. The heat from the ash and lava melted the snow into steaming, hot water. This resulted in lahars, or mudslides, that moved down the steep mountainside at top speeds of 145 kilometers (90 miles) per hour.
The Mount St. Helens volcano blast and the landslides made it difficult for people to escape. 57 people died during this eruption and landslide; many had been staying to monitor the mountain. But it could have been much worse if residents had not been evacuated in advance. —A. Burdick
Mt. St. Helens
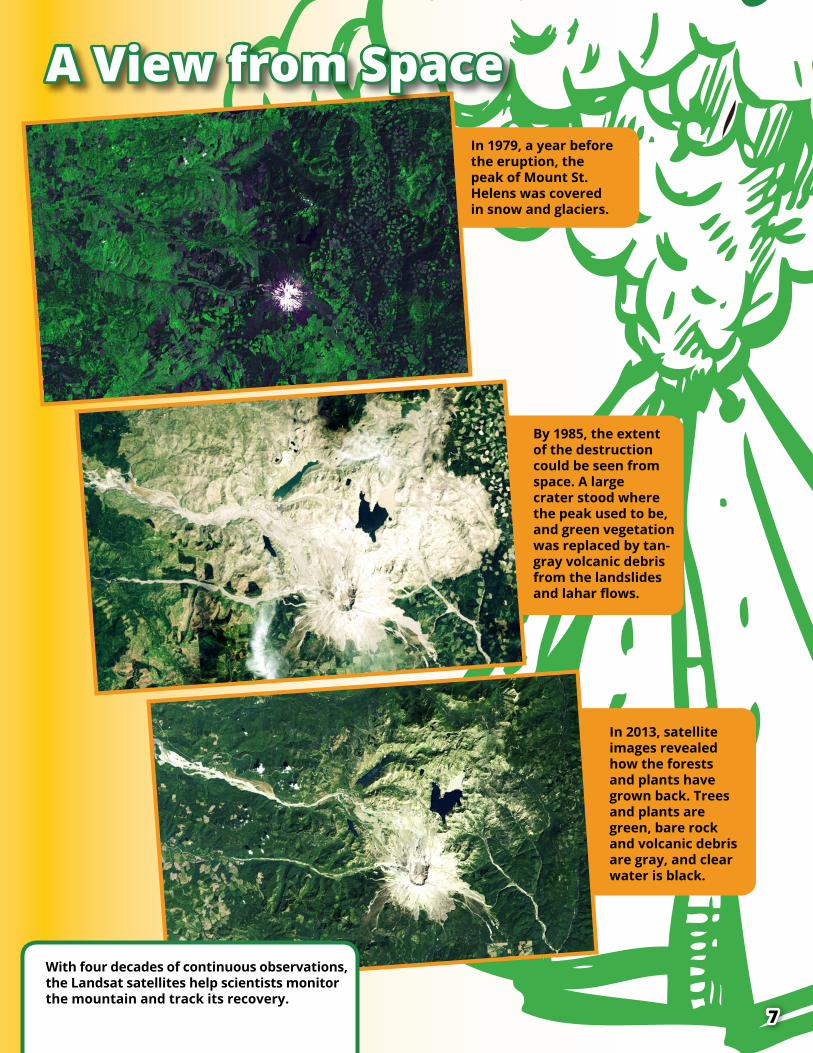
Mount St. Helens' eruption shortened the mountain by 400 meters (1,300 feet). The eruption also resulted in 520 million tons of ash which spread across more than 1,500 kilometers (900 miles) of the United States and Canada (as far as Oklahoma). The ash cloud caused complete darkness in Spokane, Washington.
Mount St. Helens A Volcanic Landslide
7
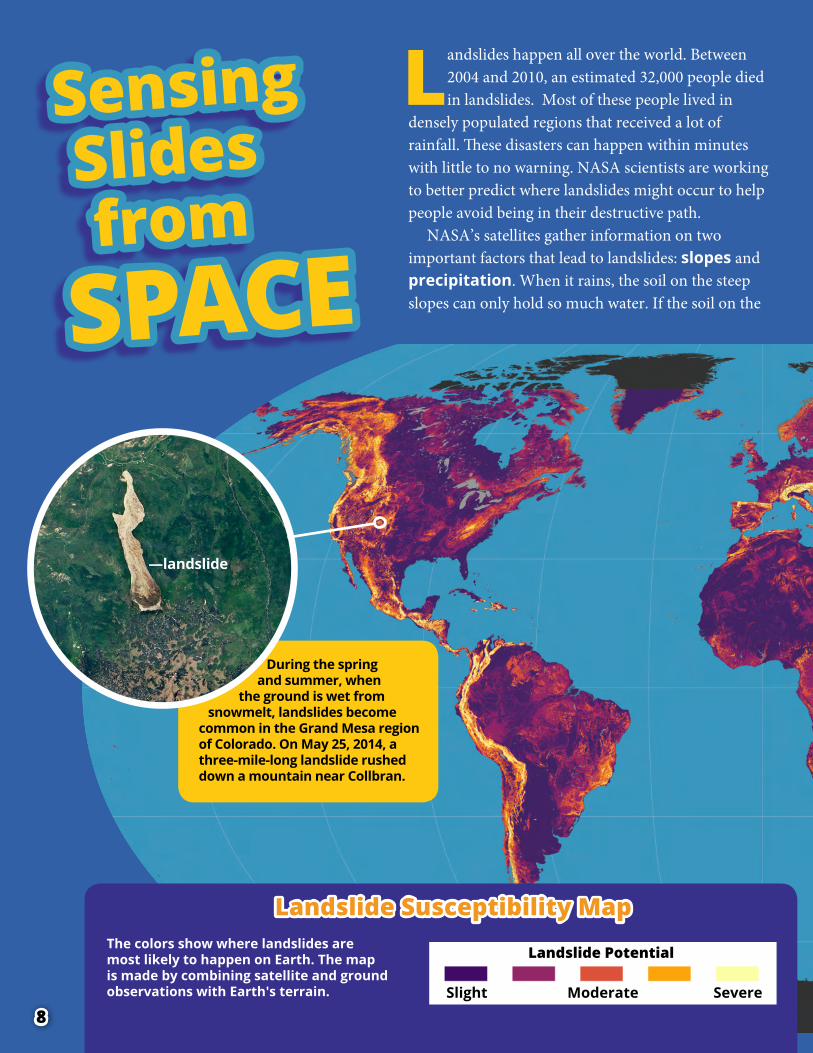
In 2013, satellite images revealed how the forests and plants have grown back. Trees and plants are green, bare rock and volcanic debris are gray, and clear water is black.
In 1979, a year before the eruption, the peak of Mount St. Helens was covered in snow and glaciers.
By 1985, the extent of the destruction could be seen from space. A large crater stood where the peak used to be, and green vegetation was replaced by tan-gray volcanic debris from the landslides and lahar flows.
A View from Space
With four decades of continuous observations, the Landsat satellites help scientists monitor the mountain and track its recovery.
8
During the spring and summer, when
the ground is wet from snowmelt, landslides become
common in the Grand Mesa region of Colorado. On May 25, 2014, a three-mile-long landslide rushed down a mountain near Collbran.
Landslide Susceptibility Map
Landslides happen all over the world. Between 2004 and 2010, an estimated 32,000 people died in landslides. Most of these people lived in
densely populated regions that received a lot of rainfall. These disasters can happen within minutes with little to no warning. NASA scientists are working to better predict where landslides might occur to help people avoid being in their destructive path.
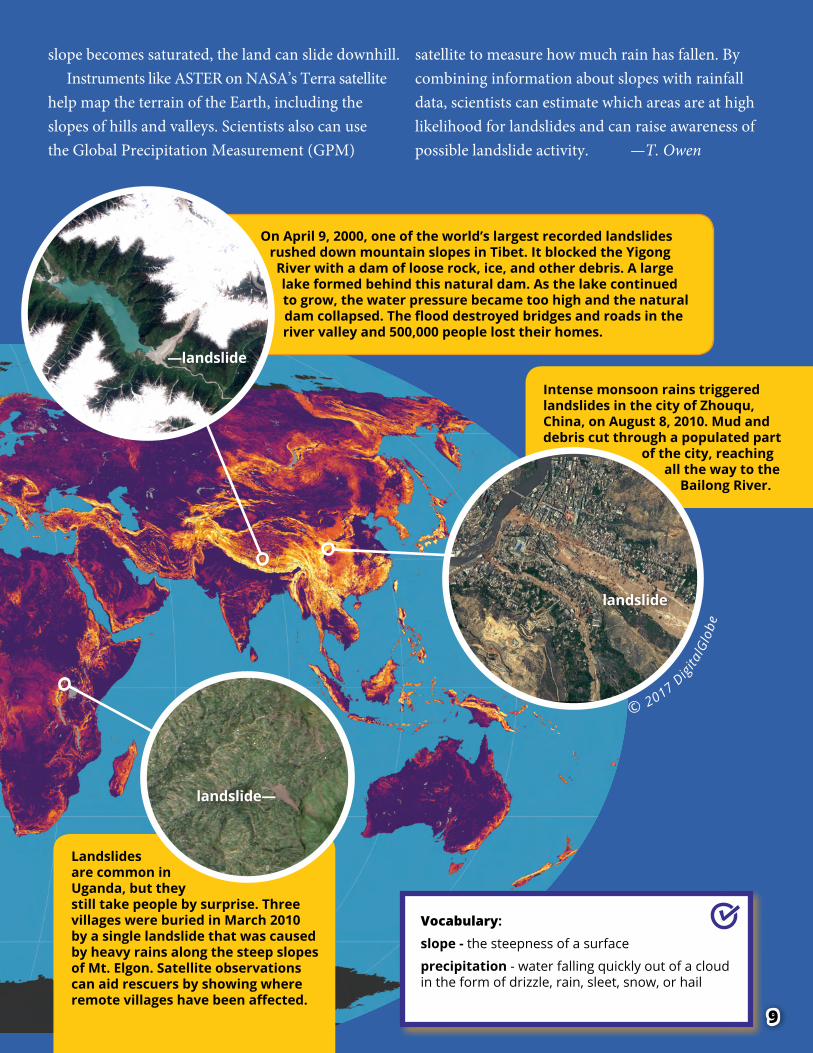
NASA’s satellites gather information on two important factors that lead to landslides: slopes and precipitation. When it rains, the soil on the steep slopes can only hold so much water. If the soil on the
The colors show where landslides are most likely to happen on Earth. The map is made by combining satellite and ground observations with Earth's terrain.
Landslide Potential
Slight Moderate Severe
—landslide
Sensing Slides from SPACE
9
Landslides are common in Uganda, but they still take people by surprise. Three villages were buried in March 2010 by a single landslide that was caused by heavy rains along the steep slopes of Mt. Elgon. Satellite observations can aid rescuers by showing where remote villages have been affected.
Intense monsoon rains triggered landslides in the city of Zhouqu, China, on August 8, 2010. Mud and debris cut through a populated part
of the city, reaching all the way to the
Bailong River.
On April 9, 2000, one of the world’s largest recorded landslides rushed down mountain slopes in Tibet. It blocked the Yigong River with a dam of loose rock, ice, and other debris. A large lake formed behind this natural dam. As the lake continued to grow, the water pressure became too high and the natural dam collapsed. The flood destroyed bridges and roads in the river valley and 500,000 people lost their homes.
Vocabulary: slope - the steepness of a surface
precipitation - water falling quickly out of a cloud in the form of drizzle, rain, sleet, snow, or hail
slope becomes saturated, the land can slide downhill. Instruments like ASTER on NASA’s Terra satellite
help map the terrain of the Earth, including the slopes of hills and valleys. Scientists also can use the Global Precipitation Measurement (GPM)
satellite to measure how much rain has fallen. By combining information about slopes with rainfall data, scientists can estimate which areas are at high likelihood for landslides and can raise awareness of possible landslide activity. —T. Owen
© 2017 Digi
talG
lobe
—landslide
landslide—
landslide
JUN ‘13 AUG ‘13 OCT‘13 DEC ‘13 FEB ‘14 APR ‘14JUL ‘13 SEP‘13 NOV ‘13 JAN ‘14 MAR ‘14 MAY ‘14
50
100
150
200
250
300
350
400
450
500
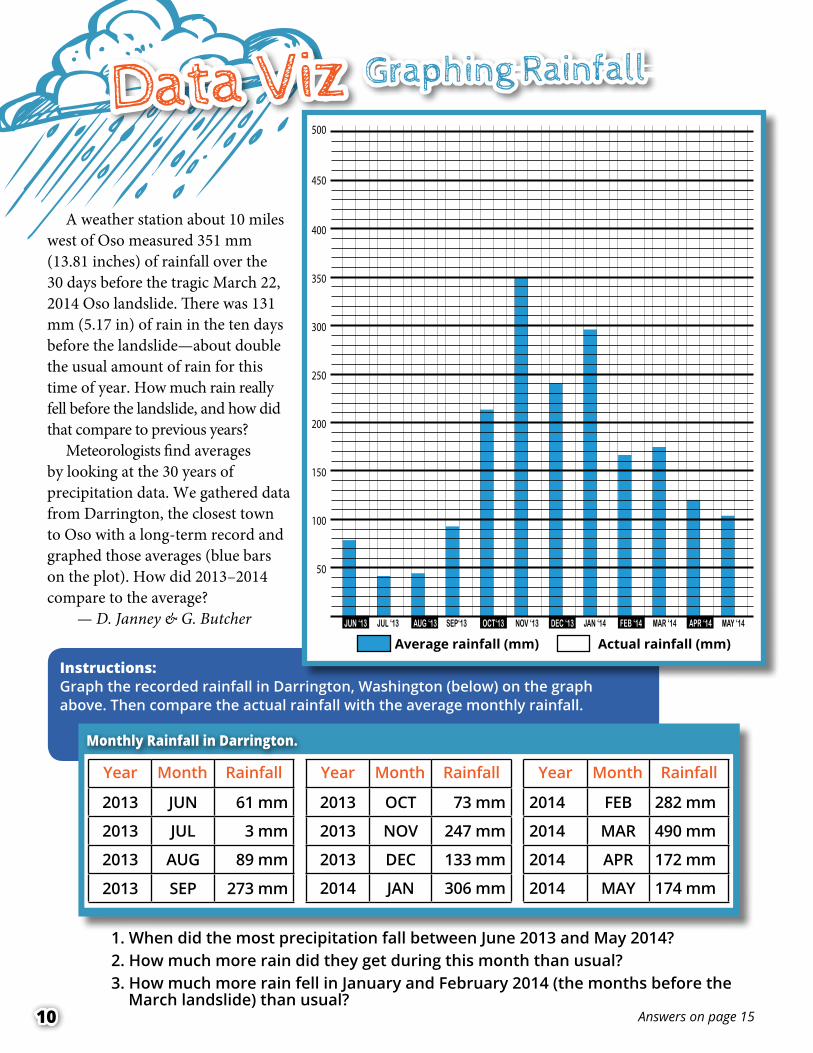
Year Month Rainfall
2013 JUN 61 mm
2013 JUL 3 mm
2013 AUG 89 mm
2013 SEP 273 mm
Year Month Rainfall
2013 OCT 73 mm
2013 NOV 247 mm
2013 DEC 133 mm
2014 JAN 306 mm
Year Month Rainfall
2014 FEB 282 mm
2014 MAR 490 mm
2014 APR 172 mm
2014 MAY 174 mm
Average rainfall (mm) Actual rainfall (mm)
10
A weather station about 10 miles west of Oso measured 351 mm (13.81 inches) of rainfall over the 30 days before the tragic March 22, 2014 Oso landslide. There was 131 mm (5.17 in) of rain in the ten days before the landslide—about double the usual amount of rain for this time of year. How much rain really fell before the landslide, and how did that compare to previous years?
Meteorologists find averages by looking at the 30 years of precipitation data. We gathered data from Darrington, the closest town to Oso with a long-term record and graphed those averages (blue bars on the plot). How did 2013–2014 compare to the average?
— D. Janney & G. Butcher
1. When did the most precipitation fall between June 2013 and May 2014?2. How much more rain did they get during this month than usual? 3. How much more rain fell in January and February 2014 (the months before the
March landslide) than usual?Answers on page 15
Monthly Rainfall in Darrington.
Instructions:Graph the recorded rainfall in Darrington, Washington (below) on the graph above. Then compare the actual rainfall with the average monthly rainfall.
Data Viz Graphing Rainfall

11
Materials:• half-gallon carton • scissors • cap for spout or duct tape• bin large enough to hold the carton • soil or sand • water• marker
When the ground shakes during an earthquake, buildings may fall. But buildings are not the only objects. Dirt and rocks can also tumble. When earthquakes occur near steep and unstable slopes, they can cause landslides. Create your own earthquake triggered landslide. — K. Weaver
What's Happening ?The shaking can cause what’s called “liquefaction.” With just the right amount of water, the shaking will cause the sand or soil to behave more like a liquid than a solid, and it will flow downhill.
Instructions:1. Cut out one side of the carton to
make an open tray. Leave cap on spout or cover with duct tape.
2. Fill the bottom of the tray with soil. Mix in enough water so the soil will stay in place when the carton is placed at an angle.
3. Prop the carton up on the short side of the bin at a steep angle.
4. Shake the bin from side to side to simulate an earthquake.
5. Watch for the soil or sand to slide. Mark the top edge of the soil on the carton to show how far the landslide moved.
1
2
3
4
5
Shake and Slide: Create a LandslideMaker Corner
12
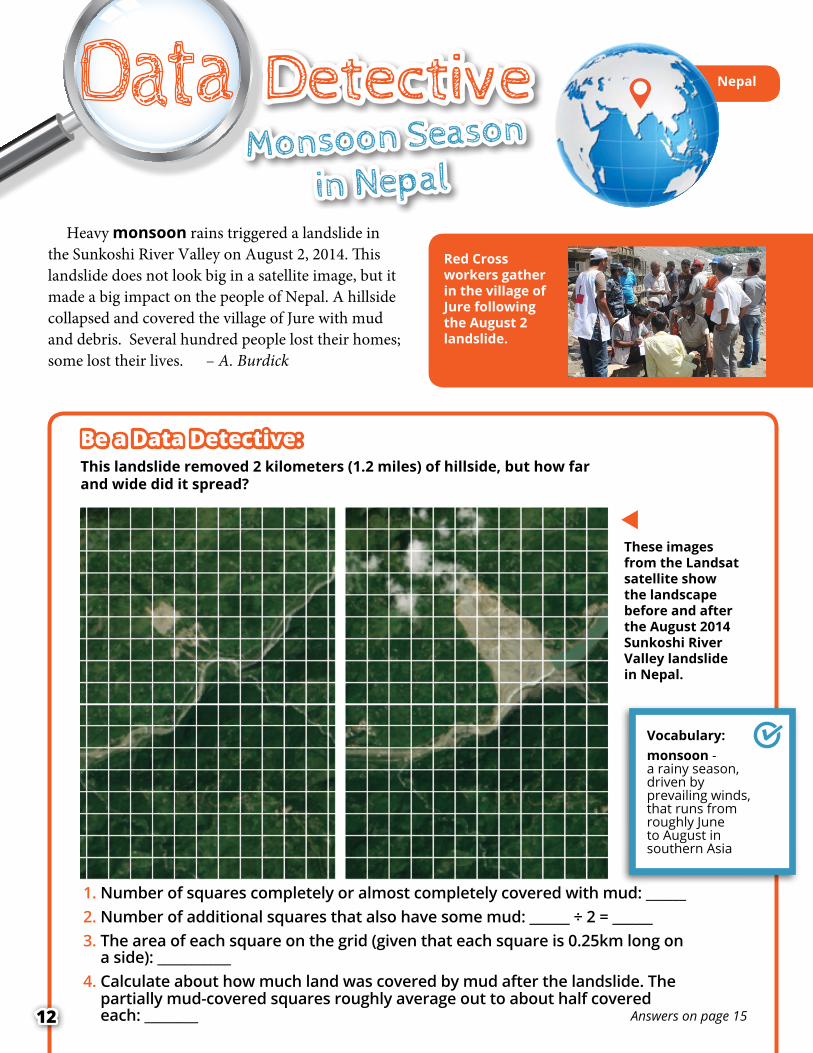
Be a Data Detective: This landslide removed 2 kilometers (1.2 miles) of hillside, but how far and wide did it spread?
1. Number of squares completely or almost completely covered with mud: ______2. Number of additional squares that also have some mud: ______ ÷ 2 = ______3. The area of each square on the grid (given that each square is 0.25km long on
a side): ___________4. Calculate about how much land was covered by mud after the landslide. The
partially mud-covered squares roughly average out to about half covered each: ________
Red Cross workers gather in the village of Jure following the August 2 landslide.
These images from the Landsat satellite show the landscape before and after the August 2014 Sunkoshi River Valley landslide in Nepal.
Answers on page 15
Heavy monsoon rains triggered a landslide in the Sunkoshi River Valley on August 2, 2014. This landslide does not look big in a satellite image, but it made a big impact on the people of Nepal. A hillside collapsed and covered the village of Jure with mud and debris. Several hundred people lost their homes; some lost their lives. – A. Burdick
Vocabulary:monsoon - a rainy season, driven by prevailing winds, that runs from roughly June to August in southern Asia
NepalDetectiveMonsoon Season
in Nepal

Record the number of sprays it
takes to create a landslide. Use
the table to tallly the number of
sprays.
13
What you need:• landslide tray from Maker Corner (p.11)• sand and soil (enough to fill carton at
least half way)• water• spray bottle• marker
Have you ever seen a hill where dirt has slipped down the steep slope? Maybe it was after a heavy rain or after the soil was disturbed by the construction of a new road or building. The likelihood of landslides, big or small, depends on how steep the slope is, the type of soil or sand, and whether there are plants growing in the soil. This DIY Science experiment will examine how heavy rain can be one of the triggers of landslides. —K. Weaver
If you want to know exactly how much water caused each landslide, weigh your spray bottle before you start spraying and then after the landslide has occurred. Each milliliter of water weighs one gram. You may need a cooking or postage scale to measure grams.
Experiment:1. Fill the bottom of your landslide tray with
sand or soil. Prop it up in the larger bin.2. Draw a line a centimeter or two below the
top of the landslide tray; when the sand or soil moves below that line, it will count as a landslide.
3. Make a prediction – which material (sand or soil) will slide with the least amount of “precipitation” (fewest sprays from the spray bottle)?
4. Start spraying water at the top of the tray. Count how many sprays until you see the sand or soil slide below your line. Use the table below to tally the number of sprays.
5. Empty the tray and repeat the process with the second material.
Was your prediction correct?
My Prediction: Sand or Soil ? ________________________
Sand Soil
How Much Rain Will
Cause a Landslide?
DIY Science
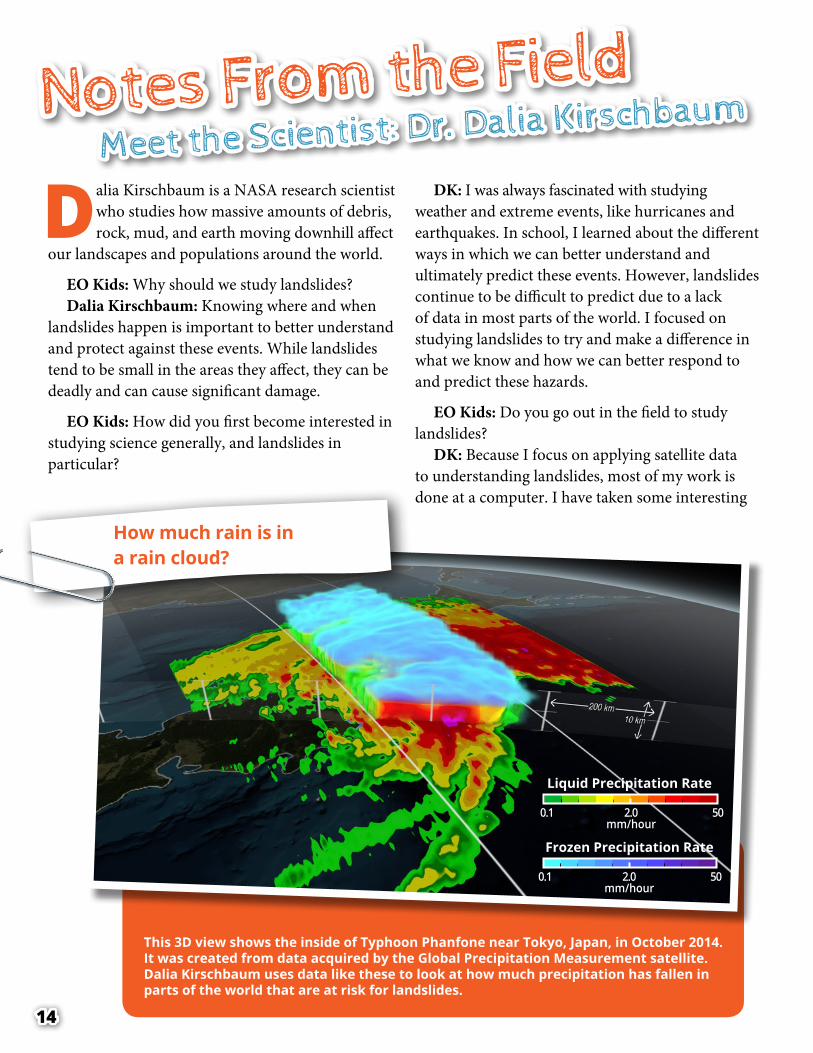
Liquid Precipitation Rate
0.1 2.0 50mm/hour
Frozen Precipitation Rate
0.1 2.0 50mm/hour
14
Dalia Kirschbaum is a NASA research scientist who studies how massive amounts of debris, rock, mud, and earth moving downhill affect
our landscapes and populations around the world.
EO Kids: Why should we study landslides?Dalia Kirschbaum: Knowing where and when
landslides happen is important to better understand and protect against these events. While landslides tend to be small in the areas they affect, they can be deadly and can cause significant damage.
EO Kids: How did you first become interested in studying science generally, and landslides in particular?
DK: I was always fascinated with studying weather and extreme events, like hurricanes and earthquakes. In school, I learned about the different ways in which we can better understand and ultimately predict these events. However, landslides continue to be difficult to predict due to a lack of data in most parts of the world. I focused on studying landslides to try and make a difference in what we know and how we can better respond to and predict these hazards.
EO Kids: Do you go out in the field to study landslides?
DK: Because I focus on applying satellite data to understanding landslides, most of my work is done at a computer. I have taken some interesting
This 3D view shows the inside of Typhoon Phanfone near Tokyo, Japan, in October 2014. It was created from data acquired by the Global Precipitation Measurement satellite. Dalia Kirschbaum uses data like these to look at how much precipitation has fallen in parts of the world that are at risk for landslides.
How much rain is in a rain cloud?
Notes From the FieldMeet the Scientist: Dr. Dalia Kirschbaum

15
field trips to learn more about geology and geomorphology—the study of how landscapes change—but I rarely go into the field to study specific events.
EO Kids: Can we predict when and where landslides will occur? How do we observe landslides after they have occurred?
DK: Predicting landslides is very difficult because you need to know when and where it might rain and how intense or long that storm may be. We can use different types of data from satellites to tell us how steep the slopes are, where the loss of trees could increase the potential for a landslide, and where it has rained. Those measurements give us important clues to anticipate hazards. We can also use satellite images to tell us, after the fact, where landslides have occurred.
EO Kids: Can we prevent landslides?DK: There are lots of different ways engineers
can try to prevent landslides on a specific slope, such as building retaining walls or reinforcing and strengthening the slope. However, the biggest impact from landslides comes when roads or houses or buildings are built at the base of these slopes. The best way to prevent damage from landslides is to avoid building in these high risk areas.
EO Kids: Have you observed or learned anything about landslides that surprised you?
DK: When I first started research on this topic, I was very surprised to learn how little data there was on where and when landslides happen. So, I
Data Detective: 1. Number of covered or mostly
covered squares = 10 2. Number of additional squares
that also have some mud = 123. Grid square area = 0.0625 km2
4. Total land covered (10 + 12 ÷ 6) × .0625 = 1 km2 This answer will be approximate since not all of the partial squares are equal.
Data Viz:1. March 2014
2. 315 mm
3. 430 mm
Where on Earth?The prehistoric Heart Mountain landslide occurred in northwestern Wyoming near Yellowstone National Park.
Answers
began developing a catalog based on media reports and other information in order to identify landslides around the world that were triggered by rainfall. I quickly learned how extensive landslide impacts can be and how many people are affected every year. Now our team is working to better understand these patterns at the global scale and to provide more timely information to groups that respond to these events.
EO Kids: What has your team done?DK: We have developed a system that is updated
every 30 minutes to estimate potential areas of landslide activity. We use rainfall information from satellites with information on the terrain susceptibility. The hope is that others can use this information to better respond and to ultimately prevent landslide disasters. — Interview by D. Janney
Dr. Dalia Kirschbaum is a research scientist who studies rainfall and landslides at NASA.
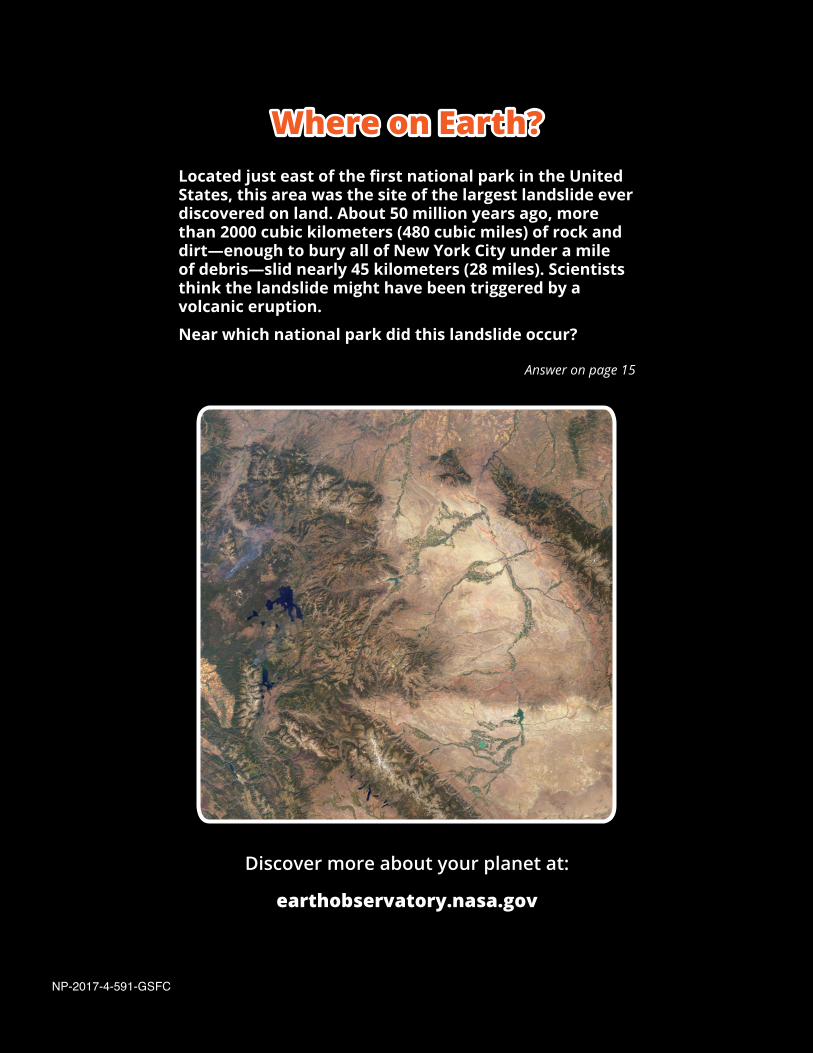
Located just east of the first national park in the United States, this area was the site of the largest landslide ever discovered on land. About 50 million years ago, more than 2000 cubic kilometers (480 cubic miles) of rock and dirt—enough to bury all of New York City under a mile of debris—slid nearly 45 kilometers (28 miles). Scientists think the landslide might have been triggered by a volcanic eruption.
Near which national park did this landslide occur?
Answer on page 15
Discover more about your planet at:
earthobservatory.nasa.gov
NP-2017-4-591-GSFC
Where on Earth?
Related Documents