www.ejbps.com 1 STABILITY-INDICATING SPECTROPHOTOMETRIC DETERMINATION OF NALBUPHINE HYDROCHLORIDE USING FIRST DERIVATIVE OF RATIO SPECTRA AND RATIO DIFFERENCE METHODS Khalid Abdel-Salam Attia, Mohammed Wafaa Nassar, Ahmed El-Olemy * Pharmaceutical Analytical Chemistry Department, Faculty of Pharmacy, Al-Azhar University, 11751, Nasr City, Cairo, Egypt. Article Received on 10/05/2014 Article Revised on 03/06/2014 Article Accepted on 28/06/2014 ABSTRACT Spectrophotometric stability-indicating procedures are described for determination of nalbuphine hydrochloride (NAL) in pure and dosage forms. First derivative of ratio spectra ( 1 DD) and ratio difference methods are proposed for determination of nalbuphine in presence of its oxidative degradate. Beer’s law was obeyed in the concentration range of 1-20 µg/ml for both methods. The proposed methods can selectively analyse the drug in presence of up to 80 % of its degradate with mean recoveries of 101.26± 0.48 and 98.85±0.61 for derivative ratio and ratio difference methods respectively. These methods were validated and successfully applied for the determination of NAL in its commercial preparation and the obtained results were statistically compared with those of the reported method by applying t-test and F-test at 95% confidence level and no significant differences were observed regarding accuracy and precision. Keywords: Nalbuphine; stability-indicating; derivative ratio; ratio difference. *Correspondence for Author Dr. Ahmed El-Olemy Pharmaceutical Analytical Chemistry Department, Faculty of Pharmacy, Al- Azhar University, 11751, Nasr City, Cairo, Egypt. [email protected] EuropEan Journal of BiomEdical AND Pharmaceutical sciences http://www.ejbps.com ISSN 2349-8870 Volume: 1 Issue: 1 Page No: 01-11 Year: 2014 Research Article ejbps, 2014, Volume1, Issue 1, 01-11.

Welcome message from author
This document is posted to help you gain knowledge. Please leave a comment to let me know what you think about it! Share it to your friends and learn new things together.
Transcript

www.ejbps.com
1
El-Olemy et al. European Journal of Biomedical and Pharmaceutical Sciences
STABILITY-INDICATING SPECTROPHOTOMETRIC
DETERMINATION OF NALBUPHINE HYDROCHLORIDE USING
FIRST DERIVATIVE OF RATIO SPECTRA AND RATIO
DIFFERENCE METHODS
Khalid Abdel-Salam Attia, Mohammed Wafaa Nassar, Ahmed El-Olemy *
Pharmaceutical Analytical Chemistry Department, Faculty of Pharmacy, Al-Azhar
University, 11751, Nasr City, Cairo, Egypt.
Article Received on 10/05/2014 Article Revised on 03/06/2014 Article Accepted on 28/06/2014
ABSTRACT
Spectrophotometric stability-indicating procedures are described for
determination of nalbuphine hydrochloride (NAL) in pure and dosage
forms. First derivative of ratio spectra (1DD) and ratio difference
methods are proposed for determination of nalbuphine in presence of
its oxidative degradate. Beer’s law was obeyed in the concentration
range of 1-20 µg/ml for both methods. The proposed methods can
selectively analyse the drug in presence of up to 80 % of its degradate
with mean recoveries of 101.26± 0.48 and 98.85±0.61 for derivative
ratio and ratio difference methods respectively. These methods were validated and
successfully applied for the determination of NAL in its commercial preparation and the
obtained results were statistically compared with those of the reported method by applying
t-test and F-test at 95% confidence level and no significant differences were observed
regarding accuracy and precision.
Keywords: Nalbuphine; stability-indicating; derivative ratio; ratio difference.
*Correspondence for
Author
Dr. Ahmed El-Olemy
Pharmaceutical Analytical
Chemistry Department,
Faculty of Pharmacy, Al-
Azhar University, 11751,
Nasr City, Cairo, Egypt. [email protected]
EuropEan Journal of BiomEdical AND
Pharmaceutical sciences http://www.ejbps.com
ISSN 2349-8870 Volume: 1
Issue: 1 Page No: 01-11
Year: 2014
Research Article ejbps, 2014, Volume1, Issue 1, 01-11.

www.ejbps.com
2
El-Olemy et al. European Journal of Biomedical and Pharmaceutical Sciences
INTRODUCTION
Nalbuphine hydrochloride (Fig. 1) is (56 (-17-) Cyclobutylmethyl)-4,5-epoxymorphinan-
3,6,14-triol hydrochloride [1].It is a phenanthrene derivative opioid analgesic. It has mixed
opioid agonist and antagonist activity. It is used for the relief of moderate to severe pain,
including that associated with myocardial infarction, and as an adjunct to anaesthesia[2].
Figure 1: Structural formula of nalbuphine hydrochloride.
Few analytical methods have been reported for analysis of nalbuphine including
spectrophotometric[3, 4], spectrofluorimetric[4, 5], electro-chemical[6] and chromatographic
methods[7-13].
Under computer-controlled instrumentation, first derivative of ratio spectra (1DD) and ratio
difference methods are playing a very important role in the analysis of binary mixtures
without previous separation by UV–VIS spectrophotometry[14-19].
In this work, both first derivative of ratio spectra and ratio difference methods were applied
to the determination of nalbuphine in presence of its oxidative degradate. The proposed
procedures were successfully applied for determination of nalbuphine in bulk powder and in
its pharmaceutical dosage form.
MATERIALS AND METHODS
Apparatus
Shimadzu UV-Vis. 1650 Spectrophotometer, (Tokyo, Japan), equipped with 10 mm
matched quartz cells.
Hot plate, Torrey pines scientific, USA.

www.ejbps.com
3
El-Olemy et al. European Journal of Biomedical and Pharmaceutical Sciences
Materials and reagents
Pure sample
Nalbuphine hydrochloride was kindly supplied by Amoun Pharmaceutical Company, Cairo,
Egypt. The purity was assigned as 99.25%.
Pharmaceutical preparation
NALUFIN® ampoules, each ampoule (1 ml) claimed to contain 20 mg nalbuphine
hydrochloride (B.No. 369, manufactured by Amoun Pharmaceutical Company), purchased
from local market. Reagents and solvents
All chemicals and reagents used throughout the work were of analytical grade.
Water used throughout the procedures was freshly double distilled.
Methanol (Sigma–Aldrich, USA).
Ethanol (Riedell-detlean, Germany).
Hydrogen peroxide (50%) (El Nasr Co., Egypt). Standard solutions
Standard Solution of Intact NAL
A standard solution of NAL (100 µg/ml) was prepared by dissolving 10 mg of NAL in 50 ml
of water and complete to 100 ml with water. This solution was stable for one month when
kept in the refrigerator [3]. Standard Solution of Degraded Sample
100 mg of pure NAL powder were dissolved in 45 ml distilled water and transferred to a 100-
ml round bottomed flask to which 5 ml of 50% H2O2 was added. The solution was heated
under reflux for 6 hours and evaporated to dryness under vacuum. The obtained residue was
extracted with ethanol (2 × 10 ml), filtered into a 100-mL volumetric flask and diluted to
volume with ethanol to obtain a stock solution labeled to contain degradate derived from 1
mg/ml of NAL[3].This solution was diluted with water when needed. Procedures
Construction of the calibration curve (General procedure)
Different aliquots of NAL standard solution ranging from (10–200) µg were transferred to a
10-ml volumetric flasks and completed to volume with water. The absorption spectra (from
200 to 400 nm) of these solutions were recorded using water as a blank, and then divided by
the spectrum of NAL degradate solution (12 µg/ml).

www.ejbps.com
4
El-Olemy et al. European Journal of Biomedical and Pharmaceutical Sciences
a. First derivative of ratio spectra method
The first derivative corresponding to each ratio spectrum was recorded, using Δλ = 2 nm. The
amplitude values at 214.6 nm were measured. The measured amplitude values versus the
final concentrations in µg/ml were plotted to get the calibration graph. Alternatively, the
regression equation was derived.
b. Ratio difference method
The difference in the peak amplitudes (ΔP) at the ratio spectra was measured at 206.8 and
229.2 nm (ΔP 206.8-229.2 nm). The measured ΔP values versus the final concentrations in µg/ml
were plotted to get the calibration graph. Alternatively, the regression equation was derived.
Analysis of pharmaceutical preparation
Contents of 10 NALUFIN® ampoules (each containing 20 mg NAL) were mixed well. A
volume equivalent to 10 mg of NAL was transferred into 100-mL volumetric flask and
completed to volume with water to obtain a solution labeled to contain 100 µg/ml of NAL.
Transfer aliquots covering the working concentration range into 10 ml volumetric flasks.
Proceed as described under “General Procedure” for each method. Determine the content of
the ampoules either from the calibration curve or using the corresponding regression
equation.
RESULTS AND DISCUSSION
Degradation of NAL: Stressed degradation of NAL was studied by refluxing the drug using
different media; aqueous, 1M NaOH, 1M HCl and 50% H2O2 for different time intervals. No
degradation took place using aqueous, acidic or basic conditions, whereas complete
degradation was attained when the drug was refluxed with 50% H2O2 for 6 hours[3](Fig. 2).
Figure (2): proposed degradation pathway of nalbuphine.
The zero-order absorption spectra of NAL and its oxidative degradate (Fig. 3) show severe
overlap, which does not permit direct determination of NAL in presence of its degradate.In
O
N
O H
H O
H O
R e f lu x 6 h o u rs
w it h 5 0 % H 2 O 2
O
N
O H
H O
O
N a lb up h in eO x id at i v e d eg ra d a te

www.ejbps.com
5
El-Olemy et al. European Journal of Biomedical and Pharmaceutical Sciences
this work we develop two spectrophoto- metric methods which allow direct determination of
NAL in presence of its degradate without previous separation.
Spectral characteristics and optimization of the methods
First derivative of ratio spectra method
In this method, the absorption spectra of the drug were divided by a suitable absorption
spectrum of the degradate (divisor) to get the ratio spectra. By application of the first-
derivative to these ratio spectra, NAL can be quantitatively determined at 214.6 nm without
any interference from its degradation product, as shown in Figs. 4, 5. Careful choice of the
divisor and the working wavelength were of great importance so different concentrations of
degradation product were tried as a divisor (4, 8, 12, 16 and 20 µg/ml); the best one was 12
µg/ml as it produced minimum noise and gave better results in accordance with selectivity. Ratio difference method
In this method, the absorption spectra of the drug were divided by a suitable absorption
spectrum of the degradate (divisor) to get the ratio spectra. The difference in peak amplitudes
between two selected wavelengths in the ratio spectra is proportional to the concentration of
the drug without interference from its degradate (divisor), as shown in Fig. 6. The method
comprises two critical steps, the first is the choice of the divisor, the selected divisor should
compromise between minimal noise and maximum sensitivity. The divisor concentrations of
12 µg /ml gave the best results. The second critical step is the choice of the wavelengths at
which measurements are recorded. Any two wavelengths can be chosen provided that they
exhibit different amplitudes in the ratio spectrum and good linearity is present at each
wavelength individually. The selected wavelengths are 206.8 and 229.2 nm (ΔP 206.8-229.2 nm)
which gave the best results.
Figure (3): Absorption spectra of nalbuphine (16 µg/ ml) and its oxidative degradate (16 µg/ ml).

www.ejbps.com
6
El-Olemy et al. European Journal of Biomedical and Pharmaceutical Sciences
Figure (4): First derivative of the ratio spectra of nalbuphine (16 µg/ml) and its
oxidative degradate (16 µg/ml) using 12 µg/ml of degradate as a divisor.
Figure (5): First derivative of the ratio spectra of nalbuphine at various concentrations
(1, 4, 8, 10, 12, 16 and 20 µg/ml) using 12 µg/ml of degradate as a divisor.
Figure (6): Ratio spectra of nalbuphine at various concentrations (1, 4, 8, 10, 12, 16 and
20 µg/ml) using 12 µg/ml of degradate as a divisor.
www.ejbps.com
7
El-Olemy et al. European Journal of Biomedical and Pharmaceutical Sciences
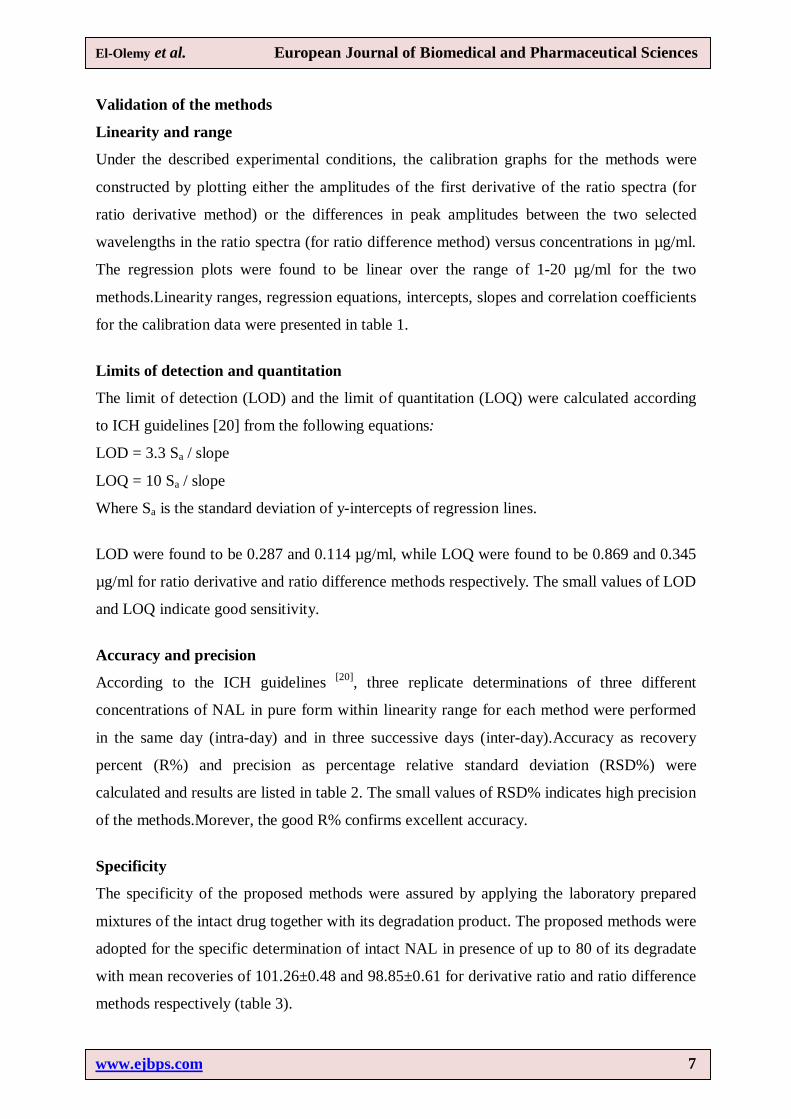
Validation of the methods
Linearity and range
Under the described experimental conditions, the calibration graphs for the methods were
constructed by plotting either the amplitudes of the first derivative of the ratio spectra (for
ratio derivative method) or the differences in peak amplitudes between the two selected
wavelengths in the ratio spectra (for ratio difference method) versus concentrations in µg/ml.
The regression plots were found to be linear over the range of 1-20 µg/ml for the two
methods.Linearity ranges, regression equations, intercepts, slopes and correlation coefficients
for the calibration data were presented in table 1.
Limits of detection and quantitation
The limit of detection (LOD) and the limit of quantitation (LOQ) were calculated according
to ICH guidelines [20] from the following equations:
LOD = 3.3 Sa / slope
LOQ = 10 Sa / slope
Where Sa is the standard deviation of y-intercepts of regression lines.
LOD were found to be 0.287 and 0.114 µg/ml, while LOQ were found to be 0.869 and 0.345
µg/ml for ratio derivative and ratio difference methods respectively. The small values of LOD
and LOQ indicate good sensitivity.
Accuracy and precision
According to the ICH guidelines [20], three replicate determinations of three different
concentrations of NAL in pure form within linearity range for each method were performed
in the same day (intra-day) and in three successive days (inter-day).Accuracy as recovery
percent (R%) and precision as percentage relative standard deviation (RSD%) were
calculated and results are listed in table 2. The small values of RSD% indicates high precision
of the methods.Morever, the good R% confirms excellent accuracy.
Specificity
The specificity of the proposed methods were assured by applying the laboratory prepared
mixtures of the intact drug together with its degradation product. The proposed methods were
adopted for the specific determination of intact NAL in presence of up to 80 of its degradate
with mean recoveries of 101.26±0.48 and 98.85±0.61 for derivative ratio and ratio difference
methods respectively (table 3).

www.ejbps.com
8
El-Olemy et al. European Journal of Biomedical and Pharmaceutical Sciences
Pharmaceutical Applications
The proposed methods were applied to the determination of the studied drug in NALUFIN®
ampoules. The results were validated by comparison to a previously reported method[4]. No
significant difference was found by applying t-test and F-test at 95% confidence level[21],
indicating good accuracy and precision of the proposed methods for the analysis of the
studied drug in its pharmaceutical dosage form (table 4).
Table (1): Spectral data for determination of nalbuphine by the proposed methods.
Parameters Ratio derivative Ratio difference Wavelength (nm) 214.6 nm 206.8 and 229.2 nm Linearity range (µgml-1) 1 — 20 1 — 20 LOD (µgml-1) 0.287 0.114 LOQ (µgml-1) 0.869 0.345 Regression equation* Slope (b) Intercept (a)
0.0275 0.0032
0.2224 0.0158
Correlation coefficient (r2) 0.9997 1.0000 * y= a + bx where y is the response and x is the concentration.
Table (2): Intraday and interday accuracy and precision for the determination of
nalbuphine by the proposed methods.
Met
hod
Conc g.ml-1 Intraday Interday
Found Conc. + SD
Accuracy (R%)
Precision (RSD%)
Found Conc. + SD
Accuracy (R%)
Precision (RSD%)
Rat
io
deriv
ativ
e 4 3.99 ± 0.036 99.79 0.910 4.00 ± 0.041 100.06 1.023 10 9.96 ± 0.091 99.63 0.918 10.01 ± 0.117 100.11 1.167 16 16.01 ± 0.147 100.04 0.917 15.99 ± 0.151 99.97 0.946
Rat
io
diff
eren
ce
4 4.01 ±0.052 100.29 1.293 3.98 ±0.029 99.5 0.741 10 10.13 ±0.049 101.32 0.487 9.99 ±0.095 99.85 0.947 16 15.87 ±0.144 99.19 0.909 15.91 ±0.109 99.41 0.683

www.ejbps.com
9
El-Olemy et al. European Journal of Biomedical and Pharmaceutical Sciences
Table (3): Determination of intact nalbuphine in mixtures with its oxidative degradate
by the proposed methods.
Method Intact (µg ml-1)
Degradate (µg ml-1)
Degradate %
Intact found (µg ml-1)
Recovery % of Intact
Rat
io
deriv
ativ
e
18 2 10 18.25 101.39 16 4 20 16.11 100.69 12 8 40 12.20 101.67 8 12 60 8.06 100.80 4 16 80 4.07 101.75
Mean ± RSD% 101.26+0.48
Rat
io
diff
eren
ce
18 2 10 17.88 99.33 16 4 20 15.85 99.06 12 8 40 11.78 98.17 8 12 60 7.96 99.44 4 16 80 3.93 98.25
Mean ± RSD% 98.85+0.61 Table (4): Determination of nalbuphine in NALUFIN® ampoules by the proposed and
reported methods.
Parameters Ratio derivative
Ratio difference
Reported method[4]
N* 5 5 5 X‾ 100.29 99.92 99.61 SD 0.98 0.96 1.03
RSD% 0.98 0.96 1.03
t** 1.07 (2.31)
0.49 (2.31) ——
F** 1.11 (6.39)
1.15 (6.39) ——
* No. of experimental.
** The values in the parenthesis are tabulated values of t and F at (p= 0.05).
CONCLUSION
The proposed methods are simple, rapid, accurate and precise and can be used for the
analysis of NAL in pure form and in pharmaceutical dosage form (either alone or in the
presence of its degradation product).
ACKNOWLEDGMENT
I am deeply thankful to ALLAH, by the grace of whom this work was realized. I wish to
express my indebtedness and gratitude to staff members Pharmaceutical Analytical
www.ejbps.com
10
El-Olemy et al. European Journal of Biomedical and Pharmaceutical Sciences
Chemistry Department, Faculty of Pharmacy Al-Azhar University, Cairo, Egypt for their
valuable supervision, continuous guidance, and encouragement throughout the whole work.
REFERENCES
1. The Merck index. 14th ed. Whitehouse Station, NJ, USA; Merk & Co, Inc: 2006.
2. Sweetman S. Martindale: The Complete Drug Reference. 36th ed. The Pharmaceutical
Press. London: 2009.
3. Fouad MM, Abdel Razeq SA, Elsayed ZA and Hussin LA. Stability indicating methods
for determination of nalbuphine- hydrochloride. British J Pharm Res, 2013; 3(2): 259-
272.
4. El-Didamony AM and Ali II. New spectrofluorimetric and spectrophoto-metric methods
for the determination of the analgesic drug, nalbuphine in pharmaceutical and biological
fluids. Luminescence, 2013; 28(5): 745-750.
5. Attia KA, Nassar ME, El-Olemy Allam A. Stability-indicating spectrofluorimetric
determination of nalbuphine hydrochloride in raw material and pharmaceutical
preparation. Int J Pharm Sci Res, 2014; 5(4): 1253-1258.
6. El-Tohamy M, El-Maamly M, Shalaby A and Aboul- Eneiny H. Development of
nalbuphine- selective membrane electrode and its applications in pharmaceutical analysis.
Anal Lett, 2007; 40(7-9): 1569-1578.
7. Cai LJ, Zhang J, Wang XM, Zhu RH, Yang J, Zhang QZ, et al. Validated LC-MS/MS
assay for the quantitative determination of nalbuphine in human plasma and its
application to a pharmacokinetic study. Biomed Chromatogr, 2011; 25(12): 1308-1314.
8. Huang PW, Liu HT, Hsiong CH, Pao LH, Lu CC, Ho ST, et al. Simultaneous
determination of nalbuphine and its prodrug sebacoly dinalbuphine ester in human plasma
by ultra-performance liquid chromatography-tandem mass spectrometry and its
application to pharmacokinetic study in humans. Biomed Chromatogr, 2013; 27(7): 831-
837.
9. Groenendoal D, Roosemalen M, Danhof M, Lange E. High-performance liquid
chromatography of nalbuphine, butorphenol and morphine in blood and brain
microdialysate samples. J Chromatogr B, 2005; 822: 230-237.
10. Pav L, Hisong C, Hu O, Shung H. High-Performance liquid chromatographic method for
the simultaneous determination of nalbuphine and its prodrug sebacoyl dinalbuphine ester
www.ejbps.com
11
El-Olemy et al. European Journal of Biomedical and Pharmaceutical Sciences
in dog plasma and application to pharmacokinetic studies in dogs. J Chromatogr B, 2006;
746: 241-247.
11. Cazanove F, Kinowski J, Audran M, Rochette A, Bressolle F. Determination of
nalbuphine in human plasma by high-performance liquid chromatography with
electrochemical detection. J chromatogr B, 1997; 690: 203-210.
12. Ho S, Wang J, Hu O, Chiang P, Lee S. Determination of nalbuphine by high-
performance liquid chromatography with ultraviolet detection. J Chromatog B, 1996; 678:
289-296.
13. Nicolle E, Michaut S, Serre–Debeauvais F, Bessard G. Rapid and sensitive high-
performance liquid chromatographic assay for nalbuphine in plasma. J Chromatog B,
1995; 663: 111-117.
14. El-Ragehy NA, Abbas SS, El-Khateeb SZ. Stability indicating spectrophotometric
methods for determination of glafenine using first derivative of ratio spectra and
chemometric techniques. Anal Chim Acta, 2002; 461: 155–168.
15. Issa YM, Zayed SIM, Habib IHI. Simultaneous determination of ibuprofen and
paracetamol using derivatives of the ratio spectra method. Arabian J Chem, 2011; 4: 259-
263.
16. Abdallah OM, Badawey AM. Derivative- ratio spectrophotometric, chemometric and
HPLC validated methods for simultaneous determination of amlodipine and atorvastatin
in combined dosage form. Int J Ind Chem, 2011; 2(2): 78-85.
17. EL-Bagary RI, Abo-talib NF, Nor-Eldin MB. Validated stability indicating assay of
gemifloxacin by different chromatographic and spectrophotometric methods of analysis. J
Chem Pharm Res, 2011; 3(6): 562-570.
18. Elzanfaly ES, Saad AS, Abd Elaleem AB. A smart simple spectrophotometric method for
simultaneous determination of binary mixtures. J Pharm Anal, 2012; 2(5): 382-385.
19. Belal TS, Daabees HG, Abdel-Khalek MM, Mahrous MS, Khamis MM. New simple
spectrophotometric method for determination of the binary mixtures (atorvastatin calcium
and ezetimibe; candesartan cilexetil and hydrochlorothiazide) in tablets. J Pharm Anal,
2013; 3(2): 118-126.
20. ICH Q2 (R1): Validation of analytical procedure. Text and methodology. Geneva:
International conference on Harmonization: 2005.
21. Armitage P, Berry G. Statistical Methods in Medical Research. 3rd ed. Oxford, UK;
Blackwell: 1994.
Related Documents


