FR-11l6-l0l -,.,., 1 (!;e -/ :2 g 8 f; FINAL REPORT ADDITIONAL STUDIES FOR THE SPECTROPHOTOMETRIC OF IODINE IN WATER (NASA-CR-128585) ADDITIONAL STUDIES FOR N73-10172 THE SPECTROPHOTOMETRIC MEASUREMENT OF IODINE IN WATER Final Report (Beckman Instruments, Inc.) 31 Aug. 1972 40 P CSCL Unclas 07D G3/06 45536 Contract NAS 9-12769 31 August 1972 Prepared for: National Aeronautics and Space Administration Manned Spacecraft Center Houston, Texas 77058 [BeCkffianj INSTRUMENTS, INC. ADVANCED TECHNOLOGY OPERATIONS FULLERTON, CALI FORNIA • 92634 / / tAl)

Welcome message from author
This document is posted to help you gain knowledge. Please leave a comment to let me know what you think about it! Share it to your friends and learn new things together.
Transcript

FR-11l6-l0l
-,.,., 1
(!;e - / :2 g~ 8 f;
FINAL REPORT
ADDITIONAL STUDIES FOR THE
SPECTROPHOTOMETRIC MEASURE~1ENT
OF IODINE IN WATER
(NASA-CR-128585) ADDITIONAL STUDIES FOR N73-10172THE SPECTROPHOTOMETRIC MEASUREMENT OFIODINE IN WATER Final Report (BeckmanInstruments, Inc.) 31 Aug. 1972 40 P CSCL Unclas
07D G3/06 45536
Contract NAS 9-12769
31 August 1972
Prepared for:
National Aeronautics and Space AdministrationManned Spacecraft Center
Houston, Texas 77058
[BeCkffianj INSTRUMENTS, INC.
ADVANCED TECHNOLOGY OPERATIONSFULLERTON, CALI FORNIA • 92634
// tAl)

CONTENTS
SECTION PAGE
1.0 .INTRODUCTION 1
2.0 IODINE-IODIDE SPECTROSCOPY 1
3.0 TURBIDITY AND INTERFERENCES 11
4.0 FLOW-THROUGH CELL 15
5.0 MECHANICAL-OPTICAL SYSTEM 17
6.0 ELECTRONICS FOR THE IODINE MONITOR 24
6.1 Functions of the Electronics 25
6.2 Measurement Electronics 25
6.3 Timing and Power Control 34
7.0 CONCLUSIONS 36
8.0 RECOMMENDATIONS 37
/
FR-1116-101 ii
~
II

ABSTRACT
Previous work in Iodine Spectroscopy is briefly reviewed. Continuedstudies of the direct spectrophotometric determination of aqueousiodine complexed with potassium iodide sho~v that free iodine isoptimally determined at the isosbestic for these solutions. Theeffects on iodine determinations of turbidity and chemical substances(in trace amounts) is discussed and illustrated. At the levels tested,iodine measurements are not significantly altered by such substances.
The main objective of the present work--a preliminary design for anon-line, automated iodine monitor with eventual capability of operatingalso as a controller--is analyzed and developed in detail with respectto optics) mechanics, and circuitry. The resulting design features asingle beam colorimeter operating at two wavelengths (using a rotatingfilter wheel). A flow-through sample cell allows the instrument tooperate continuously, except for momentary stop flow when measurementsare made. The timed automatic cycling of the system may be interruptedwhenever desired, for manual operation. An analog output signalpermits controlling an iodine generator.
FR-1l16-101 iii

1.0 INTRODUCTION
NASA-MSC has a need for an automated iodine monitoring system which will also
function as a control system for an iodine generator/applicator in the potable
water system of future spacecraft.
Of the several methods of measuring aqueous iodine, the direct spectrophotometric
technique appeared best suited for the spacecraft application. Not only does
this approach offer the desired sensitivity, operational convenience, and simple
instrumentation, it also lends itself, through appropriate design, to actuating
and controlling an iodine generator.*
Having previously demonstrated the feasibility of direct spectrometric deter
minations of aqueous iodine, Beckman Instruments, Inc. developed a prototype
instrument, under Contract NAS 9-11879, for the NASA Manned Spacecraft Center.
This instrument, successfully used at MSC,.was a portable, battery-powered,
specific-for-iodine colorimeter requiring manual operation and a stock solution
(pure H20) to get a reading.
Because the development program for this instrument was so successful, it appeared
feasible to incorporate the basic design into a fully-automated, on-line monitor
with eventual capability of serving not only as a monitor but also a controller.
The further study of iodine spectroscopy and the development of a preliminary
design for such an instrument is the subject of this report.
2.0 IODINE-IODIDE SPECTROSCOPY
Iodine imparts a yellow-brown color to water, even in high dilution. In the
visible region, aqueous iodine shows a broad absorption band centered at 460 nm
;\-For example, a modification of the unit developed by Life Systems, Inc.(NASA CR-111854, Contract NAS 1-9917).
FR-ll16-l0l -1- .

(Figure 1). If iodide (KI in our work) is als~ present, a narrower, more
pronounced band--representing the tri-iodide absorption--appears at 350 nm in
the near ultraviolet (Figure 2). The iodine-iodide complex largely distorts
the 460 nm iodine band (low KI levels) or even removes it (higher KI concen
trations) as shown in Figure 2. A close inspection of these spectrograms shows
that although iodine alone may be measured at 460 nm, its accurate determination
in an iodide solution will be subject to appreciable error (depending on the KI
level) if measured at this wavelength. However, consider the family of curves
converging and crossing at 467 nm (Figure 3). '~en the iodine concentration
changes (two levels sho\vn in Figure 2), this point moves up or down accordingly,
but always at the same \vavelength~ Large variations in the potassium iodide
level do not disturb this point where, for a given iodine level, the absorption
is constant.
This crossover point (which could occur an~vhere) is very close to the iodine
maximum absorption wavelength. If it were displaced very much on either side
of this maximum, sensitivity·would suffer, as clearly illustrated in Figure 4,
where the absorbance mode of the DK Spectrophotometer was used to generate the
spectrograms.
This crossover phenomenon is identified as the "isosbestic point" (Greek:
isos, equal; bestos, extinguished). It occurs \vhen dissolved substances can
exist in two or more light absorbing forms in equilibrium. Potassium iodide
is colorless across the 700-350 nm spectrum, but when it interacts with iodine,
the result is more than additive and an entirely new spectrogram appears. The
absorption depends on the amount of iodine available to complex with the
potassium iodide. Iodine, _therefore, may be quantitated at this unique point,
and its accurate determination will be unaltered by any variation in the iodide
concentration. In a family of different equilibria (e.g., 0-20 ppm 1 2), one
maximum rises and the other falls as the equilibrium shifts, but the inter
section (isosbestic) remains constant. In Figures 3 and 4, we see the iodine
solutions become more transparent on the long wavelength side of the point as
the KI is increased and less so on the short wavelength side. The symmetry of
this effect is useful, since it permits us to use a wider bandpass filter in an
iodine colorimeter than would otherwise be possible.
FR-1116-l0l -2-

Q)
I::.,-l
'0oH
u.,-lp..ouCJlo,...+JUOJp..(/)
CJl::JoQ)
; ::J0"~
4-loI::mu, (/)
G\) ~4),-:
~ \\
~ "\~~
~
\
.~'--

7i.OJ? sin] 50 LU"CC
plwl-oh.,( flip/iel'- Det eC+u r~
Refen:'vlcc: Il~O,
DI(- 2 1-\ S pee-hop hu t-t,)1'1 de,
So {mY) pa fh
.Iodine ppm (0l-15raVlt
;< I ppm Vet-rh J30 ppm Ie Iq r'pm Xl.
<':>0 ppm 1<1'1 ppm :[1.
1,,-/'fill J< I'j ppm 1";1.
4~---------------~-
o I'pm /<1Ct ('en1 :r").
3
90-'------
],
20----
If0-----
7CJ-----
%r80 ".
~-'o---
60----
/0-·--~-
'to:.'
;l: )')In
s2 0 3S() JI. 1_o J---"N-1Jo -/---=--__1 1 ,'-_.If-4~_()---'
Figu~e 2. Iodine-Potassium Iodide Scans. 1 2 content held constant.
FR-1116-101 -4-

FR-1116- "101
·Q)'"(j
o;:;::
J..<o
4-l
(-lZHof.l-I
UH(-lCf.lILl(:QCf.loCf.lH

.T-a ~rtl'l
~ '2oy;;::L-,-~
.r1 cYll,~/ofP •.10
•'20
OJ)
• 00 ---'----4-
Figure 4. ISOSBESTIC POINT. The cross-over points are clearly shownin this Absorbance Mode presentation.
FR-11l6 -10 1 - 6-

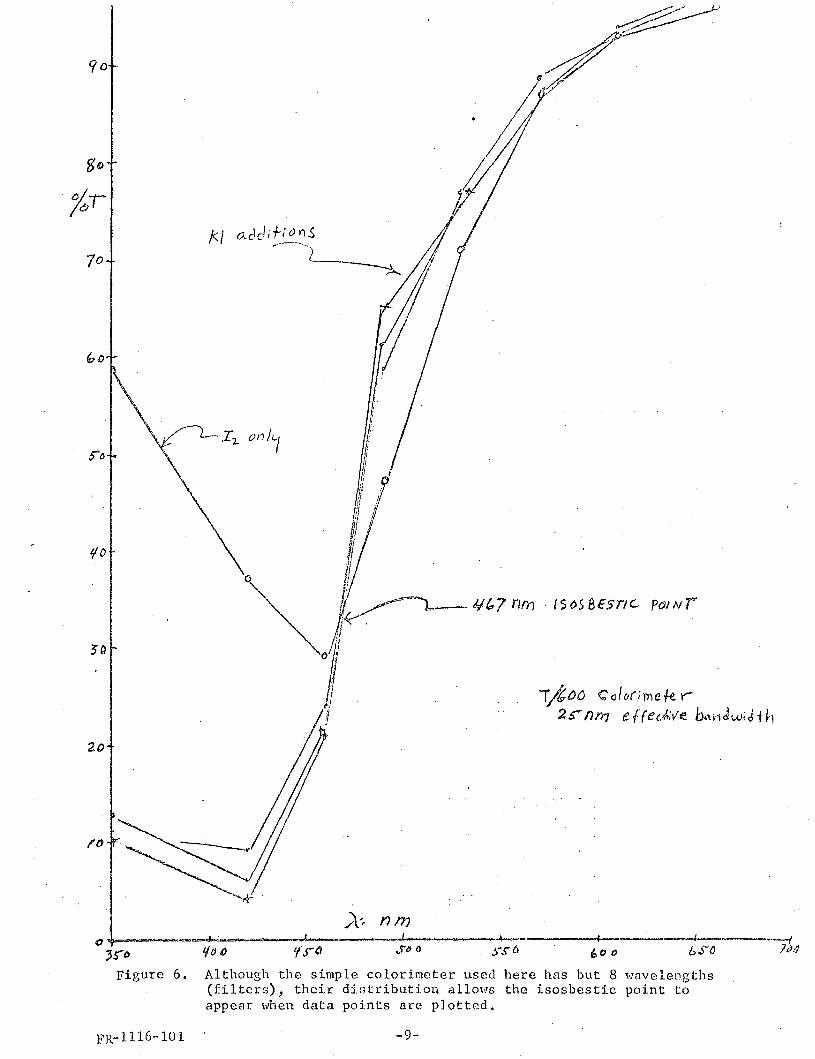
That this is so was demonstrated by measuring 1 2 -KI solutions in two different
colorim~ters having much wider bandpasses than that of the DK Spectrophotometer
(half bandwidth, at 460 nm, of only 0.2 nm). One colorimeter, a grating
instrument (continuous spectrum), has a constant half bandwidth of 20 nm; that
of the other instrument (eight filtered wavelengths) is 25 nm. The test
results are shown in Figures 5 and 6. The agreement on the location of the
isosbestic point for the spectrophotometer and the two colorimeters is indeed
remarkable--considering the differences in the instruments. Even so, the exact
location of this point has yet to be determined, and will have to await a care
ful check of the calibration of the DK Spectrophotometer. Although the bandwidth
can be quite 'vide for the iodine filter, as the colorimeter tests proved, it is
still important that it be centered at the isosbe~tic wavelength as a few
nanometers either way will introduce error in the iodine extinction value.
in addition to the "iodine filter", the proposed iodine monitor will also
require a "reference filter" in order to establish a "zero iodine" signal (one
of two signals required for setting "span"). Figures 2 and 3 show that there is
a "spectral 'vindmv" from about 625 to 700 nm where iodine solutions show no
significant absorption. This region, then, can be used in lieu of a reference
cell. That it is suitable for this purpose is shown by the 700 nm curve of the
Beer's Law plots in Figure 7. The other plots in Figure 7 show, in addition to
conformity with Beer's La,v, how the isosbestic point compares with the scans at
460 nm and 550 nm for aqueous iodine and iodine-iodide.
there are four standard expressions for the comparison of absorption intensities
in current regular use. These formulae are defined and, substituting numerical
values in the expressions, a value for iodine extinction at 467 nm is obtained:
1. E molar extinction
E = ODpath (ern) x molar cone
where: OD 0.089 for 7 ppm 1 2 (for example)
FR-ll16-10l
Path = 5.0 em
Molar Cone = 2.8 x 10⁻⁵ M
-7-

%T
f\\~
\"-.'
of k l
---L--2.hd 6.Jd;tio'rl of Ie I
srJ e<J.LhoY1 a~ 1<- \
.Vlfbsnm
~5"O
Figure 5',
A~ nrno ...- l-...- -/....--,-..-.....--...-~-""'"'""'" _t _-l.-M· ee- ..·w_·,fj '" t)~ ....... ~.;.~-"""'......,...l:..a..;,.~~ ....~-...- .............,._..._._J\
tlso J"O iJ 50 c /Ps'o
ISQSBESTIC POINT for a grati.ng colorimeter. The hand\vidthhere is lOOX that of the DK.
1°
FR-1l16-101 -8-
1/&00 Co/ti'(irnete. \'"".
2S- /)lf1 e. f (e'foVe b,:q'idwiJ ·d"
1<1 udcLf-/ () n.$....---.....
I/O
20
10
;\-:. nm
Although the simple colorimeter used here has but 8 wavelengths(filters), their distribution allows the isosbestic point toappear when data points are plotted.
() ....... ....==,..g..,;.~ •.•...=-~~_,_•..,AI .~"'.. +-- ........I _._----i _
'JS'"o 'to IJ tl.rl;l .s" () s.) (,I ~ 0 0 bS"{)
Figure 6.
FR-lll6-l0 1 -9-

If~ 0 li~\' 1'1-- k IVA'" i (' S w,'4 h k \ LO;'\<.•
UJU:?:t:tt1> ,~/S'
doV'\
ro<
./0
,to
.I2- - I< I ;
])/.[ )pe(ffDfL+tlr.,;€~~~."
S-() h UY\ pc.. ·P....Yef,~ /./'l.D
Figure 7. Absorbance Vs. Concentration (ppm 1 2 ) at four wavelengths for1 2 and Iz-KI solutions. Note that there is little loss ofsensitivity at 470 nm (isosbestic) compared with maximumsensitivity at 460 nm.
FR-11l6-l0l -10-

Then,
2. Log E
Log E
E0.089
5 x 2.8 x 10-5
= 6.4 x 10 2 l/mol-cm
logarithm (to base 10) of above
log 6.4 x 10 2
3.
= 2.806
1%E (1%, 1 em) or Ei or Ei-cmnm
E (1%, 1 em)
E
ODpath (em) x cone % w/v
0.0895 x 7 x 10-4
25.4 cm- l % w/v- l
4. Specific a
a ODpath (em) x cone g/liter
Specific a differs from formula 3 in the concentration unit by a
factor of 10 and therefore, in our example, specific a = 2.54.
3.0 TURBIDITY AND INTERFERENCES
Although the iodine-potassium iodide solutions are practically transparent in
the lI~vindow region ll (650-700 nm), the transparency here can be degraded if
there should be enough particulate matter in the water. Since the lowered
transparency (due to light scattering) would be evident across the entire
spectrum, this source of error can be substantially eliminated electronically
at the time the span is adjusted. The signal for 100% '1' bears a fixed ratio
to zero percent transmission; thus, any change in %'1' at 700 nm is automatically
adjusted by the circuitry to preserve the required ratio.
It is assumed that any turbidity arising from particulate matter in the water
supply will have particle radii much longer than the light wavelengths
FR-1l16-l0l -11-

(700-470 nm). For this assumption, the scattered light energy is nearly
independent of wavelength. In our turbidity experiments we found this to
be so.
Figure 8 shows one experiment. Scans were made of an iodine-iodide solution
with and without a little very fine soil in the solution. The spectrophotometer
gain (%T control) was then increased to just compensate for the displacement of
the two traces at 650 nm. A third scan was then made. The " adjusted curve"
shows accurate tracking of the "\Vithout soil" scan from 650 to the iodine
measuring wavelength (470 nm) \Vhere there is a negligible non-congruence. The
manual adjustment performed in this experiment will be done electronically in
an automated colorimeter.
In another interesting experiment, a silicone emulsion* provided a different
species of turbidity. Figure 9 shows the results of applying the same procedures
used in the previous experiment. Again, the " adjusted curve" shows good agree
ment with the "turbidity-free" scan. In both cases, the deviations at 470 nm
represent an iodine error of less than 0.5 ppm.
Turbidity evaluations are rendered somewhat uncertain because of variable inter
actions bet\Veen iodine and the turbidity agents. If the interaction is simply
adsorption \Vhich removes some iodine from optical absorbance, then the colorimeter
will still accurately measure the level of free iodine available for germicidal
activity. Color changes resulting from the interaction would be a source of
~rror, but we have not seen this happen with turbidity agents. Color changes
are more to be expected in the interaction bet\Veen iodine, iodide, and active
chemical substances.
In the course of our previous iodine work we tested ten compounds for iodine
interference. At concentrations below the maximum acceptable for potable water,
we found no serious interference with the iodine determination. Our guide for
these levels was "Water Management Results for the 90-Day Space Station Simulator
Test" (HDAC paper \-1D1582, April 71, McDonnell-Douglas Corp.). This document
*Dow-Corning Antifoam B Emulsion (10%).
FR-1l16-l0l -12-

~,'J
~-------~
~._~-.-/-----------
.~-
,..---.--
._-----
---
,b~
';/
~--;>
lIrU
rbid
,.fl
"f-
8,~p
pmr l
t-3{)
?~rn
kI
"~
Iff
c<"I
Yfur
krI
CI..O
-ve
2-=
--
t-'
0"' I
, I ! It-
'!
~5--
i I I i i
oj
10
'.
~$5
5"
w I%j /00
\l-:
:j,
:;0 I t-' ,....
C'u
.ne'
3',
CtA
V'V
c'2.
ad
jvsk
do..*
""~~~
hw
..
~-
~/
t'f-
tJco
""'.
::j4
e.'"
'-',f-
v.c.<
..,r
lit:
1....
,\II
'"
."
\~
rL<r
\'d;
~6.9'~t;t~
"M,"~
,",""I
f-,
I",2
0f
.k.,
Pfo
ved.
<A..(
Ii'.1'c
ir0
.+J(
)l.J
hh
ol
b«(~
2<
'Ii"
I.
It:
&~
g,f;-
PP
i11.
Ii.+
-3
0Pj
OM
K,.,1
-:Y~
I
i(
.I/'/
l'Jec
kYJ'1
(v"A
OK
-J.A
5'pec.
~rkt-.
....<ek
y
!.
:::.~//'
$'t
Jh
iyY
J~cc
f-/...
..!r~
rej,
u.<
;,'
?'(
'IIfit
I,
;.
t?
jI
IIS
Oijl.
r:O5'
oi)
SS
D&
OQ
I:;!
iDIf
bc
7
;t.'.
nm
Fig
ure
8.
Inte
rfere
nce
Ex
per
imen
t.T
urb
idit
yp
rod
uce
dby
asp
ecie
so
fso
ilin
ver
yfi
ne
part
icle
form
(50%
<10~
dia
.).

-. I bS
c
...".
"""OJI_
.......~..
."'---=
=-==
-~;<%
-
c.....
'("v-e
.2.
o.J~
u.\
Led
0..
t
L.~u.,,,,,,,~
U''''C~de
w,'w
..c:
~,-\'rt
.i.
DK
.-2A
5pec
h·""
pi"t
e,...
.ek
v3
7)
n7;1
.!jJ
,.f-i
....r-
e!.
1Il
.0
-i (.-0
0
Ct-<
..'C'v-
e...'
3',
1:5e
(k'''-
lCL
N-
"t.
I·+....
."
I..
~)
Te.-<
rill
Id
.'1
A<te
\),:t~
/£:)j'
lD
ov-'
L{;0
1:v'i
'~'
A....'
·ft'f
l;tlV
"I
Gi
\',f,
:CI'l
lUl.
.C.
~-------
---~~
----
----
JI...O
8ppt
rlT'l+
JOff
m1<1
...._
\'Aci
!l-l':
d·-e
d/:
CIA
VY
e.'2
.
7()
//~
~~~-
.{/~~~~
--~-
::..
if./
//
//
~//'
//?
/j//r
......~
8fp
mI
+-">
//
~+-
,,~
,0p
pm
kI
/r~cb.J+
80-f'
'/.·
'1"1
,,,t"
I//Y
/r/~/
,~
I7
S~.
--:-
'IDO
----
,~I
,
1/5
6J.j
(;,o
--r-/-
.5'i'~
---
l
SS-O
qS-
I8s
-~ I I I
I t-'
+'
I
I':::j :-<::l I t-' ~
%Tl
!I
t-'
I~/oo
-+
.A'·
nm
Fig
ure
9.
Inte
rface
Ex
per
imen
t.T
urb
idit
yag
en
tssh
owa
gen
era
lab
sorp
tio
nacro
ssth
een
tire
spectr
al
ran
ge
(70
0-4
00
nm
).

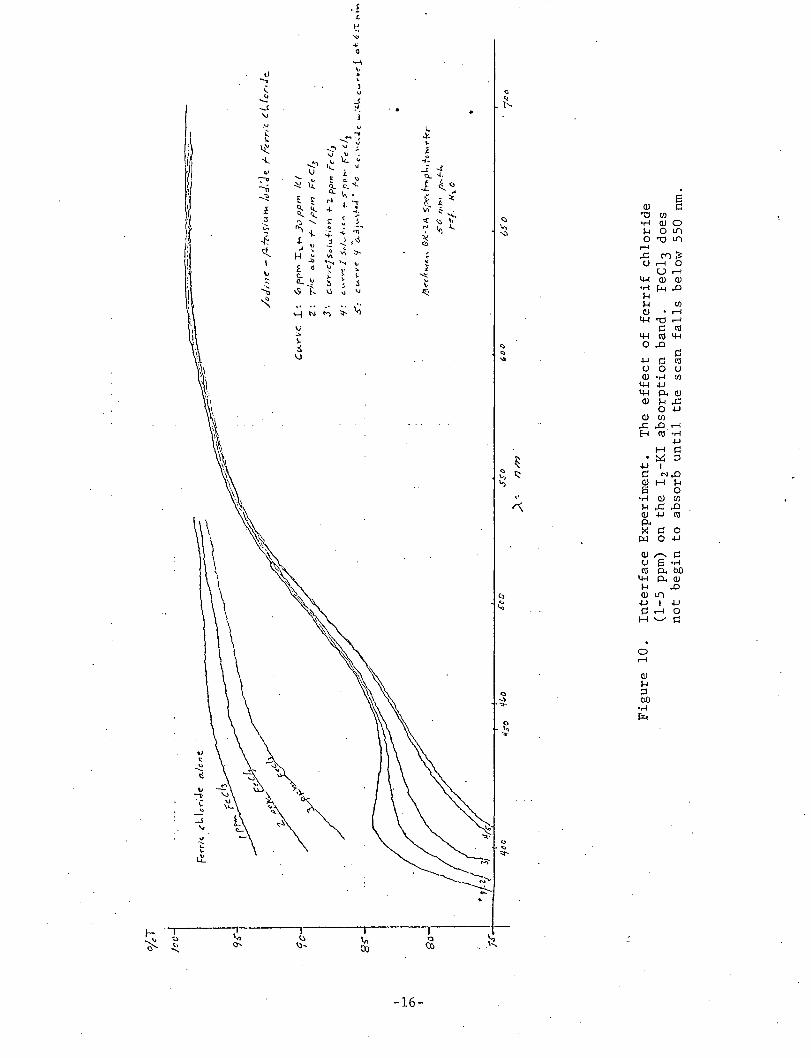
reported test results for a large number of chemical substances in \vater. The
concentrations found were generally much less than one part per million. Ferric
chloride, in our work, showed the greatest effect. Figure 10 shows that this
compound begins to absorb light below 550 nm and therefore would be expected to
affect the iodine measurement. Figure 10 also shows that as much as 2 ppm FeC13
will not seriously affect the iodine readout. Curve 4 shows a scan of what is
really an unrealistically high level (5 ppm) of FeCl3 in the I 2-KI solution. An
attempt to compensate for the displaced curve by the "adjustment" technique
appears unsuccessful, but the chemistry of the reaction indicates that the
iodine determination was probably correct:
2 Fe-H+ + 2 r - 2 Fe++ + 1 2
That is, if there is enough iodide present, the ferric ion is oxidized to ferrous
with the formation of more iodine~ We have~ in previous work, already observed
that the ferrous ion, at low levels, does not color the solution or affect the
iodine level. Chemistry also reports that the cupric ion is similarly oxidized
to the cuprous state by reaction with iodide, again yielding iodine:
2 Cu++ + 4 r ~ 2 CuI + 1 2
4.0 FLOlv-THROUGH CELL
Since the planned Iodine Monitor has "on-line" status, it will have water
flowing through it continuously (via a shunt), except for a brief period when
iodine measurements are required. One of its components will, therefore, be a
flow-through cell. Such a cell has been under test during most of the weeks
of this project. Scrupulously clean cell windmvs are mandatory in accurate
spectroscopy, but it would be difficult, if not impractical, to maintain this
condition in the flow-through cell. Fortunately, the colorimeter electrical
system can compensate nicely for an appreciable degree of signal reduction
caused by dirty cell windows. Of course, the generous path length for the
sample (50 mm) helps to maintain an adequate signal to "this-species-of-noise"
ratio.
FR-11l6-101 -15-
t-·
~-----"~-~~
--------~
~'""
"...
;..-
:-.;
.--
~_.
;i~'
~/<
lJil1
(!_
p,.f
r..J
5iu.
....
/<!d
:JtrF
an
"(cl..
.lcr.J~
C",,
"r~"
e1~
'"'{
'PM
I,.t
--Jv/,
pm
1(1
Z:
,J,e
,,11<
"cr-
/rp
mF<
c/;
3',
c-I
.n'c
jso
l....f
;."
f-2
pp
mf'
<C
!:J
If:
c.t..
.....Y
l:l
$;J~.f,t..,
f""~-f'P>--
F'"~
(/1
.5
..C
(,..o
.rvt
"'I
'~jjv-')fed"
1-1;
'-c;\
·c...:
Jc
_:.;...J
..,.c:
........
...~1
0.+G
J"!':
,..."
'"
I l-'
0'\ I
°/~T
/cO 9::"
7C
..J
8~ 80 1"
"
FH
r;<
"cL.
lc("
;,Je
(1..l
c"e
fcch
£!Y"
~yc)
~rj
Jfce
1/,,0
1/(,0
.reo
ssc
)..
,'7
/77
,OD
/!I"
"d,,
,,,~
,,I)
K-1
Aspe,~p~"+c,,,,<kr
soI~/"
p_-.
f-I..
ref.
}(~o
,,5
0.
7°0
Fig
ure
10
.In
terf
ace
Ex
per
imen
t.T
heeff
ect
of
ferr
ifch
lori
de
(1-5
ppm
)on
the
I2-K
Iab
sorp
tio
nb
and
.F
eCl3
do
esn
ot
beg
into
abso
rbu
nti
lth
esc
anfa
lls
bel
ow
550
nm.

In order to get some idea of how long a flow-through cell will be serviceable,
the usuil cleaning of the cell between samples was omitted over a period of
several weeks. During this period, any fall-off in percent transmission was, of
course, compensated by adjusting the gain control of the DK Spectrophotometer.
At the end of the test period a final recording was made of the cell transmission
using plain water as the sample. The cell was then thoroughly cleaned, filled
with water, and another scan was recorded. Figure 11 shows that the diff~rence
in %T between "before" and "after" cleaning amounts to about two percent. This
offset is easily compensated by the electrical system of any spectrophotometric
instrument.
We have redesigned the flow-through cell for the planned colorimeter. The cell
used in this project has the inlet and outlet ports set in slightly from the
ends. The new design features inlet and outlets tangent to the windows. This
geometry will allow a flow of water across the windows, which accomplishes two
things: facilitates complete sample changing, and provides mechanical washing
of the windmvs. Our tests suggest that throughout the longest mission any
decreased windo,v clarity will not exceed the compensatory capability of the
electronic system.
5.0 MECt~NICAL-OPTICALSYSTEM
Figure 12 shows the general construction features of a small, rugged, single
beam iodine colorimeter prototype based on our Preliminary Design concepts.
The functional optical components are, in succession: a tungsten lamp source,
a source lens, a filter wheel (two filters), a flow-through sample cell, a
detector lens, and a PIN Silicon Photodiode detector (usable wavelength range
from 400 to 1100 nm).
The source lens images the radiant tungsten filament directly on the detector
lens so that the image nearly fills the 10 mm square opening and aperture stop
in front of the detector lens. This requires that the source lens magnification
be 5.6X (for a filament of 1.8 nun2). The source is a tungsten lamp with a I-inch
diameter bulb. At 28 Vdc and 0.2 A it will require approximately 6 watts
(filament temperature 'viII be 2700 0 K). The rather large bulb has been selected
FR-U16-l0l -17-

320
-
After- cleOt-nin'l
/ooJ-----------
q 0 -W-----#-------jll------~·_+I------::-'!-f(Poo 7t}(J
A~ notncme/er:,
Figure 11. FLOH-THROUGH CELL. The cell \Vas used for many Iz-KI samplesover a period of several ~veeks. Cleaning between sampleswas omitted. The "before cl.eaning" sampl.e was HzO. Thecell was cleaned and H20 filled. The spectral response forthe two samples is shown here.
FR-1l16-l0l -18-

~~
110
o'==:l
i!I
I'Ii
I:It
P
ilV
1'1r:
:::=
"'\
1Cl
>AI<
we..
..~
I1'rr
'1Ii
:r~~/i!
III~)
:l'I
!'~II
II'
~_,
:1
~F
iG"
~'-
1:-
1-I:
u:~
R,
'_.
i,
i~
~\
Q •v
I.,
8II
\\
~~------
I
ii'
I:i
I,;
;,,-
ce
rRO
NI
I'
I
';.0
C";
AR
e..
.I
-I
II
II
Ii(""
"eN.
~I
'""•
.-;:;
'1;II
B,'8
i~~:--,,-,_.-,-,
-'i:--,.-,j--~-
,~l
Jr~~D
'I~~,\,(j_tll;(
jlI
I_
)'I.
I,"
..,:,;=t~,.=~l'
[C,
~:I
"I
•I'I!
,,'0=,,
~,,:i.
...~rlC
7L.
tJ,~,
/:"h\
II'']'
.,.ll
"'/
_.~-
~•
r,'""
"'o,c:
-:,,/'I
'I:,\;",
'-,.___
:Ii
'iO
-:-'
;,:'
:o,-
~....
./1;;'~"
...--
---
.(C
"",
---'
//["
,/1
"-,,,
..
~ov"R'~-J
~l!~~'!~I~~
'\\':~
\,~(:"
~_
_r.
r;5-
;:"J
~~
'---
--'.
p,:;~~~
i~A
..A
___
....o",::
'oow
'"~'--
OF
r£cro
R"")
"~'''G
6,A
.'.
__
I\\C
"_W
I-_
.""I
\"tD
ee
,er<
>'<
LS
N$
[Do
A""
':?),I=
~_"___
~:~:'::R
,u~<~
OoS"JG
IO"N
e"-.-.
[®-'I"
l~~'l'
;..':~:~::'
:&~,.r
I0·"
"""~,
"•••
.',.
I•
•8A~
I~';
'~I'
...:\
¢=LD
,rort
1!,F
-I
I'r
III,
'" 0\ t 'I I i I i ,
~
IIi
I~~I)
ril©=
j-'.
-t=
©
'fL...
/' [I I! ii ©
~tY'
-l Ii t i I I ~ !
I t-'
\.0 I
r'<
'4A
-tli
'k.4
0/J
T~M1"U!
,Ai
Fig
ure
12
.M
ech
anic
alL
ayo
ut
of
Iod
ine
Mo
nit
or

because of its sturdiness, and the large envelope volume causes the.tungsten
coating of the inside of the bulb to occur more slowly.
The detector lens images the 10 mm square aperture stop at the source lens
directly on the sensitive area of the detector with a 1/5.6X magnification.
This two-lens system provides excellent stray light control because the optical
geometry prevents the detector from "seeing" areas outside the maximum ray
boundaries.
The filter \vheel, sketched in Figure 13, carries t\vO filters: a "reference"
filter for light transmission at 650 nm, and a "sample" filter for transmitted
light at 467 nm. The "notch" in the wheel permits energy from three light
emitting diodes to fall upon three photodetectors used to provide position
references for controlling the signal phase adjustment (Figure 14). The filter
wheel is rotated by a small stepping motor. The electrical system is discussed
in a following section of this report.
All the components of this system can be rigidly mounted on machined and lapped
surfaces of an aluminum (or magnesium) casting or machined housing (Figure 12).
The rigid mounting will permit the instrument to withstand high g forces and
severe vibration loads without damage or misalignment of optical elements. One
design concept for housing this instrument is sho\·m in Figure 15. As shown,
the overall dimensions are: width 6-3/8 inches, height 4-3/4 inches, and
overall depth 8-3/4 inches. The weight can be held well under three pounds.
Figure 15 shmvs two switches on the front of the housing. These are the only
controls, and normally will not be used. The power switch simply turns the
+28 V primary power to the instrument on or off.
The Manual Switch initiates or terminates a manually-imposed duty cycle on
the automatic sequencing mode of the system (it does not interrupt it). This
switch has a center-off position and two momentary positions. In the "start"
position (momentary), the manual cycle is initiated. If, during the manual
cycle, the switch is placed in the "off" position (momentary), the manual
cycle is terminated. If, hmvever, the unit is put into the manual mode and
FR-1116-l0l -20-

/I
·.>
\
\
. r"
>,,~ IHpleF tI 'l.\'V'1-67
Figure 13. Filter Wheel Iodine Nonitor
FR-1l1.6-l01 - 21-

/".."
\\
-1f
/
/\
,./
=:
X J fVil{'!J )(5
vvhC::'cI 5'1Vl('.
cree oJfif' () C(! t/ !.
Fi.gure 14. I~cations of Detector andWheel Sync. Decode.r Pairs
FR-1l16-l01 -22-

-23-

the manual s\vitch is never placed in the "off" position, the manual cycle will
continue for ten minutes and then shut off, unless the monitor has gone into
the "periodic auto cycle."
The Preliminary Design features ease of disassembly for cleaning and replacement
(or change) of components. Reassembly will maintain accuracy of component
alignment without special tools or fixtures.
Instead of the conventional all-glass sample cell, our design will incorporate
a metal shell and special glass window assembly fabricated to withstand 60 psia.
Self-cleaning of the cell, especially the windows, will be facilitated by the
tangential, spiral flow of the solutions from inlet to outlet creating a wiping
action on the cell windows and walls.
6.0 ELECTRONICS FOR THE IODINE MONITOR
The spacecraft water supply will eventually require an automatic feedback control
system which will sample the iodine content of the water and add iodine, as
required, to maintain a predetermined level. Thus, two main components of the
control system will be the iodine monitor and the iodine gene!ator. In general,
the monitor determines \vhen to sample; it then generates a signal proportional
to the iodine content and feeds this information to the generator which adds the
required amount of iodine. This system must operate automatically and unattended
for long periods of time, so it should not require periodic maintenance or
calibration.
Such a system imposes certain restrictions on the iodine monitor electronics,
which must be small, lightweight, rugged, reliable, and low in power dissipa
tion. These goals of design are best achieved by utilizing solid-state circuits.
The use of discrete semiconductors and preferably integrated circuits greatly
decrease size and weight, and also enhance reliability. The use of MIL approved,
screened components, properly derated and in ceramic packages, improves relia
bility even more.
FR-1l16-l0l -24-

6.1 Functions of the Electronics
The func"tions of the iodine monitor electronics may be broken down specifically
into the following categories:
1. Measure the amount of iodine in the water and produce an analog
signal, 0 to +5 volts, corresponding to 0 to 20 ppm of iodine. The
electronics will automatically compensate for source lamp variations,
water turbidity, etc.
2. Periodically turn on the iodine monitor, allow a warm-up period, close
the inlet valve, and measure the iodine content--while at the same
time alerting the iodine generator (by means of a relay contact
closure) and sending it the analog signal. The sampling frequency
will be easily programmable over a wide range. During the sample
sequence, the meter on the iodine monitor will display the iodine
content in ppm.
3. Respond to a manual input, turn on and display the iodine content on
the meter, but without sending a signal to the iodine g~nerator.
This function will not interfere with the periodic sample sequence.
The iodine monitor electronics diagram is shown in Figure 16.
The electronics may "also be divided into two very broad areas:
1. Measurement
2. Timing and power control
Each of these two areas will be discussed in turn. Available choices are
explored and reasons are given for the approach which was selected.
6.2 Measurement Electronics
The heart of the measurement system is the filter wheel, containing two
filters--one at a reference wavelength of 650 nm and the other at a sample
wavelength of 467 nm. The tungsten source lamp sends light through both the
sample and the filter wheel, where it is then picked up by the detector.
FR-J.l16-l0l
c-25-

To(Klinenerator]Command
Valve
~IS
" Regulated!----!t;p 1Vo tages
Figure 1.6.. Block Diagram, Iodine Monitor-26-
Po\verSupply
FR-l1l6-10 1
SpacecraftPC)\vC t' 0-
Bus
Clmp e--" amp.e e
I Iq," ValveIr -
IDriver
S:>1 :=~ =._~iltcr Hheel" =P-- ./ I-- /' I I
~-- /' I--A~ %
~Sync. Sync. Sync. Motor Detector
Pickoff Pickoff PickoffZero Sample Referenc1
~;)
~tIOscillator
& Hotor Preamp.Driver
-..., Holding Referencev
~ 4 Lamp.' Gate Circuit & Control.j
,Amplifier
- Holding Sampl I PPM'" Gate .. Circuit & 1Expression 1v ....v Amplifier ~ Generator
~ 4~
~ Holdingy Zero ReferenceGate 1---;'> Circuit & Generator
v Amplifier
.
I ~'T
S\vi tching /.Base Sequence ( 0-20
. " .... r--t;:,:Timer Timer & POHer '\ PPM
Control ~ter
4' /,\ L Analogl
Nanual Input 0-- 1 -l ---{>-SignalI- -- -
.. Turn-On Ge.'

Figure 13 sho\vs the general layout of the filter ,,,heel with the sample and
reference filters. It might be considered that t~e wlleel r~ally has a third
filter--the zero offset filter--through which no light is passed, but where a
zero offset can be measured by the electronics.
The notch on the outer rim operates three optical s,,,i tches ,,,hich serve to pick
up information about where the wheel is in its rotation cycle (or actually
reveals ,,,hich filter is in front of the detector at a given time).
Figure 14 shows the relative locations of the detector and optical switches.
Figure 17 relates Figures 13 and 14 and shows the signals at the optical switch
outputs (Xl through X3) and the detector as a function of time. After the
signal from the detector is amplified (by the preamp), it is fed through three
FET s,,,itches to three holding circuits. The FET switches are operated by the
outputs of the optical switches, such that the holding circuits have outputs
corresponding to reference, sample and zero offset.
Since the light transmission, sample path and detector are highly critical.
parts of the system, the next section shows the specific considerations which
went into the choice and use of the detector.
o Calculation of Signal to Detector
Radiant Flux from Tungsten Filament:
== Spectral radiance of filament in watts/cm2/~-str.
(Af-..) ==
3.0 watts/cm2/~-str. at 0.46
9.0 watts/cm2/~-str. at 0.65
Spectral bandpass in ~
.11I~ Tungsten filament at 2700 0 K
== 0 .04 ~
FR-1116-101 -27-

II II n
-c .s. ~
~~
- .- ~
I :c J:
Xf'.J N)
X )(
~~ -V' "..·s ;;,
<ij ~)C:,
.-.S:' --~~......
,lJ ..... ~J
V )"1 --i.J""..
~.
.~ "~~ ~.;~
\/\
.-'
1 '; \)\'-' ..
'u-.<::~-.
""QI
t'....';';;'" '0.~ ~
i.),~
\J\~
..\!)
'\:;\.1\
_.~_.. ~...,..- ._------
i
__ ._1_ i_... !--. .... --,----1
I -_.,--. I
.. .LJ-- I._ ..... _ r - -
i---·
f
----_..··.._····--·-·-·b·-.. -.,----~--- . --_._•.~,
" .._._-- ..-"-- ._----_ .. '_.'--._.'-
I
__ .. ,__,__' _. I . I,.------- -._.L-:~· -- ...I -- ---'
o
--~.. _-----'--
o
_._~ ....._._._-------
----- '-- ._ ...-..-
+FR-1116-101 -28-

TAn Transmission of each of the two lenses and single source envelope
::: 0.87
TAc ::: Transmission of H20 \vithout iodine in solution (50 nm optical path)
TAf Transmission of either filter
0.6
T Period of illumination during each filter cycle
1.0 Consider peak power
As ::: Effective area of tungsten filament
0.011 cm2
T sA
:::
:::
=
Effective area of source lens
Focal distance of tungsten filament from source lens
1.5 em
Transmission of iodine (applies only at sample A = 0.46 ~)
1.0 0 ppm of iodine
::: 0.536 20 ppm of iodine
Flux to detector at ref A 0.65 ~:
PAR = (1\)2 (9) (0.04) (0.87)3 (0.94) (1.0) (.011)
= 1088 ~ \vat ts
FR-1116-l0l -29-

Flux to detector at sample A for 0 ppm:
PA!!.. = (1\)2 (3) (0.04) (0.87)3 (0.94) (1.0) (0.011) (1.0)
364 fl watts
Flux to detector at sample A for 20 ppm:
P SA = P 12 x 0.536A 196 fl watts
o Choice of Detector Type
Six general types of detectors are considered:
1. Photo Emissive
2. Photoconductive (bulk effect)
3. Phototransistor
4. Photovoltaic (junction)
5. Photoconductive Shottky Barrier (junction)
6. Photoconductive-Diffused (junction)
The following criteria are most important for the iodine monitor's
detector:
1. Visual response
2. Lifetime stability
3. Linearity
4. Ruggedness
5. Responsivity
6. Pmver consumption
7. Speed
Using the above information, it appears, in general, that the Shottky
Barrier and the Diffused types are best for this application.
FR-1116-10 1 -30-

e Choice Between Shottky and Diffused and Modes of Use for Detector
Either type of detector may be used in either the Photovoltaic or the
photoconductive mode. The following table compares specific parameters:
Shottky Planar Diffused
Parameter Photovoltaic Photocond. Photovoltaic Photocond.
Responsivity variation -0.3"101 of ±0.07%/oF ±0.05%/oF +0.07%/oFwith temp. for.oT = 50°F -15% ±3.5% ±2.5% +3.5%
Responsivity variation 0.22/0.28 0.22/0.2.8 0.11/0.21 0.11/0.21with A at 467 versus
= 0.79 = 0.79 = 0.52 =0.52650 nm
Dark Current Variation No Dark Doubles No Dark DoublesCurrent Every Current Every
+lO°F +lO°F
Linearity Good (RL) Good (RL)- Good - Good(RL)
-Poor Poor (RL)
Response Time microseconds 10 ns microseconds 10 ns
The planar diffused detector, operated in the photovoltaic or unbiased
modes, gives the least variation with temperature, although any temperature
variations would be taken care of by the constant reference system.
No dark current is present in this mode. Speed of response should not be a
problem, since the preamplifier output will be sampled after the detector
has settled down.
Best linearity is achieved by running the detector at zero bias and
operating the first stage in a current input mode.
FR-1l16-l0l -31-

If too much incident power strikes the detector, its response becomes
non-linear, and linearity is of primary concern. In the reference mode,
1088 JlW strike the detector, with an effective area of 8 x 10- 3 cm2,
giving 136 mW per square centimeter. For linearity, power density on the
PIN-040B should be less than 1 milliwatt per square centimeter. This can
be remedied by a filter to cut down the light. A filter which cuts the
light to 0.0027 of its original value will be used. This reduces the
peak intensity to 0.367 mW/cm2 .
Power levels on the ~etector will now be:
Reference:
Sample, 0 ppm:
Sample, 20 ppm:
3 JlW
11..M
0.55 JlW
SiN for sample 20 ppm will be:
SiNpsig
N.E.P.5.5 x 10- 7
9 x 1O-1L~6.1 x 10 6
Q Expression Generator
After the three desired quantities (reference, sample and zero) are
obtained in th~ holding circuits, they must be processed to obtain the
correct analog signal (0 to +5 V) corresponding to the sample strength
(0 to 20 ppm). The expression generator consists of several operational
amplifiers which add, subtract, and multiply the three input quantities
to obtain the analog signal. The process is greatly simplified by
keeping the reference signal at a fixed value. This is done by means of
a feedback system to control the source lamp. This also cancels out any
variations due to water turbidity or blackening of the lamp envelope.
The analog signal obtained is not really quite linear (see Figure 18).
This is due to the non-linear, light-filtering properties of iodine in
water. For example, if 10 ppm of iodine in water allows K% of light
through, then 20 ppm does not allow ~ percent through, but K2 percent.
FR-1l16-l0l -32-

IJIII
- sv·
-_.•..._-_.,----- .r-.~-_._.-10
·---tl·-----~--p·
2D
Figure 18. Non-Linearity Due to Iodine Solution
FR-11l6-101 -33-

This gives rise to the curve in Figure 18. If it were carried beyond 20
ppm, it would asymptotically approach zero for an infiriite concentration
of iodine. This non-linear output (in contrast to a linear output shown
as the idealized straight line) would make no difference in the operation
and control of current iodine generator designs.
6.3 Timing and Power Control
It is assumed that the iodine monitor will turn on periodically, warm up for 10
minutes and then go through a brief sampling period. During this time a command
signal (relay contact closure) and an analog signal (0 to 5 V representing 0 to
20 ppm of iodine) will be sent to the iodine generator. During the warm-up
and sample intervals, the meter on the front panel of the monitor will display
the iodine level. Water from the tank will normally be circulated through the
iodine monitor, but during warmup and sample periods, the water flow will be
shut off (to prevent noise input into the system).
In addition to the automatic operation of the monitor, a manual mode may also
be used. The manual and automatic modes are separate and do not interfere with
each other. If the operator places the manual mode switch tu ON, a complete
warmup cycle is initiated, but no signals are sent to the iodine generator. At
the end of the 10 minute warmup period the unit shuts off automatically, or the
operator may terminate the manual mode by placing the mode switch in OFF.
The base timer which generates the automatic sequence cycle will be a MOS counter
Time-Base (Mostek MK5009P). This unit is essentially an oscillator which can
have its frequency controlled by an external RC network, from one MHz dO,vn to dc.
In addition, the unit may be programmed so that the output is the oscillator
frequency divided by a factor ranging from unity up to 36 x 108 . These counters
can be set up to provide output pulse trains with periods in seconds, minutes,
hours, or even years. The iodine monitor will be programmable for any desired
sampling rate less than six times per hour.
When the base timer puts out a pulse at its programmed interval, it will activate
two interval timers (which ,vill also be Mostek MK5009P' s). One interval timer
will come on for ten minutes and the second one will come on for a slightly longer
FR-1l16-l0l -34-

time. Logic 'viII look at the outputs of the two interval timers and control
the mete'r, solenoid valve, relays, etc. Hhen both interval timers are on, the
monitor will be in the warmup phase. The measurement electronics will be
activated, the solenoid valve will be shut off (through a transistor valve
driver) and the panel meter \vill display the ppm of iodine. When one timer
goes off, but the other is still on, the monitor is in the sample phase, which
is identical to the 'varmup phase except that a relay closes and sends a command
signal and analog signal out to the iodine generator. \~1en both timers shut
down, the monitor goes back to the standby phase, in which only the timer
circuits have power. The solenoid valve opens again, and the measurement
electronics is shut down.
When the operator places the monitor in the manual phase, a third interval
timer (independent of the automatic timers) is turned on. This comes on for
ten minutes, or until the operator terminates the manual phase. During this
time, the monitor is placed in a mode identical to that of the warmup phase
in automatic. The solenoid valve is closed, the measurement electronics comes
on and ppm of iodine is displayed on the panel meter. After termination of
the manual phase (by the operator or timer), the monitor goes back to the
standby.phase.
Power and signal sw~tching will be done by small relays, except for the
solenoid valve, which will be driven by a solid-state valve driver, capable
of driving a load up to one ampere.
All dc voltages for the electronics will be obtained from a dc-de converter,
operating from the spacecraft power bus.
During standby, the monitor should dissipate between 360 and 367 milliwatts. '
During the warmup, sample and manual phases, the monitor will use much more
power, \vhich will largely depend on the type of solenoid valve used:
FR-l116-l0l -35-

POIver (w)
Minimum MaximumComponent Case Case
Electronics 1.0 1.3
Motor 2.8 2.8
Lamp 18.0 20.0
Solenoid Valve 1.4 28.0-- --
TOTAL 23.2 52.1
o Filter Hheel Motor and Driver
The motor considered for this design is a stepping motor, but an
alternate choice is a synchronous motor. In either case, an oscillator
and a driver circuit would be required.
7.0 CONCLUSIONS
The feasibility of measuring iodine in iodine-iodide solutions over the speci
fied range of 0-10 ppm by direct spectrophotometric techniques was established
under a previous contract and verified by additional studies during the present
endeavor. Turbidity and interfering chemical substances, at the maximum
expected levels, do not introduce significant error in the free iodine deter
mination. The Preliminary Design insures that the Iodine Monitor will operate
in all orientations and be gravity independent. Manual operation of the system,
except when desired, has been eliminated. The system is completely automated
throughout, from sample introduction, instrument calibration and zeroing, to
iodine readout. The present electronic design is quite flexible with respect
to interfacing with an iodine generator. At this point, specific materials
compatible with manned spacecraft requirements have not been called out for the
preliminary design, but in view of the structures involved, we anticipate no
problem in this area. Also, from the size and weight viewpoint, the present
dimensions and mass could undoubtedly be minimized for a final design.
I
FR-l116-l0l -36-

No expendables except electricity are required jor this device, and the sample
water is simply returned to the downstream system. No inf1ight maintenance is
normally required, and the sample cell should not require cleaning during the
longest mission. The spacecraft power of 28 Vdc will satisfy the voltage
requirement of the Iodine Monitor.
8.0 RECOMMENDATIONS
Iodine spectroscopy shows four properties of iodine-iodide solutions which
enhance the feasibility of an iodine colorimeter: .
1. Iodine is sufficiently absorbent over the desired concentration
range to be easily measured in a colorimeter system.
2. The free iodine component is measurable in the visible spectrum.
This simplifies both optical and electrical systems.
3. The isosbestic point, required for accurate measurement, is
located near the iodine maximum absorbance wavelength.
4. Scattering by particulate matter is nearly independent of wave
length. This means that the "adjustment" technique exercised at
650 nm (or 700 nm) is adequate for compensating turbidity effects.
Our Pre1i~inary Design draws upon and exploits the experimental data which have
clearly displayed the characteristics of these four properties. The next
~ogica1 step, recommended here, is the translation of the Preliminary Design
into a breadboard status for further study and refinement, to be followed by
an automated prototype suitable for interfacing an iodine generator.
\
FR-1116-101 -37-
Related Documents