1 1 Slide Slide © © 2006 Thomson/South 2006 Thomson/South - - Western Western Slides Prepared by JOHN S. LOUCKS St. Edward’s University Slides Prepared by Slides Prepared by JOHN S. LOUCKS JOHN S. LOUCKS St. Edward St. Edward ’ ’ s University s University

Welcome message from author
This document is posted to help you gain knowledge. Please leave a comment to let me know what you think about it! Share it to your friends and learn new things together.
Transcript

11SlideSlide©© 2006 Thomson/South2006 Thomson/South--WesternWestern
Slides Prepared by
JOHN S. LOUCKSSt. Edward’s University
Slides Prepared bySlides Prepared by
JOHN S. LOUCKSJOHN S. LOUCKSSt. EdwardSt. Edward’’s Universitys University

22SlideSlide©© 2006 Thomson/South2006 Thomson/South--WesternWestern
Chapter 1Chapter 1Data and StatisticsData and Statistics
I need help!I need help!
Applications in Business and EconomicsDataData SourcesDescriptive StatisticsStatistical InferenceComputers and
Statistical Analysis

33SlideSlide©© 2006 Thomson/South2006 Thomson/South--WesternWestern
Applications in Applications in Business and EconomicsBusiness and Economics
AccountingAccounting
EconomicsEconomics
Public accounting firms use statisticalPublic accounting firms use statisticalsampling procedures when conductingsampling procedures when conductingaudits for their clients.audits for their clients.
Economists use statistical informationEconomists use statistical informationin making forecasts about the future ofin making forecasts about the future ofthe economy or some aspect of it.the economy or some aspect of it.

44SlideSlide©© 2006 Thomson/South2006 Thomson/South--WesternWestern
Applications in Applications in Business and EconomicsBusiness and Economics
A variety of statistical quality A variety of statistical quality control charts are used to monitorcontrol charts are used to monitorthe output of a production process.the output of a production process.
ProductionProduction
Electronic pointElectronic point--ofof--sale scanners atsale scanners atretail checkout counters are used toretail checkout counters are used tocollect data for a variety of marketingcollect data for a variety of marketingresearch applications.research applications.
MarketingMarketing

55SlideSlide©© 2006 Thomson/South2006 Thomson/South--WesternWestern
Applications in Applications in Business and EconomicsBusiness and Economics
Financial advisors use priceFinancial advisors use price--earnings ratios andearnings ratios anddividend yields to guide their investmentdividend yields to guide their investmentrecommendations.recommendations.
FinanceFinance

66SlideSlide©© 2006 Thomson/South2006 Thomson/South--WesternWestern
Data and Data SetsData and Data Sets
DataData are the facts and figures collected, summarized,are the facts and figures collected, summarized,analyzed, and interpreted.analyzed, and interpreted.
The data collected in a particular study are referredThe data collected in a particular study are referredto as the to as the data setdata set..

77SlideSlide©© 2006 Thomson/South2006 Thomson/South--WesternWestern
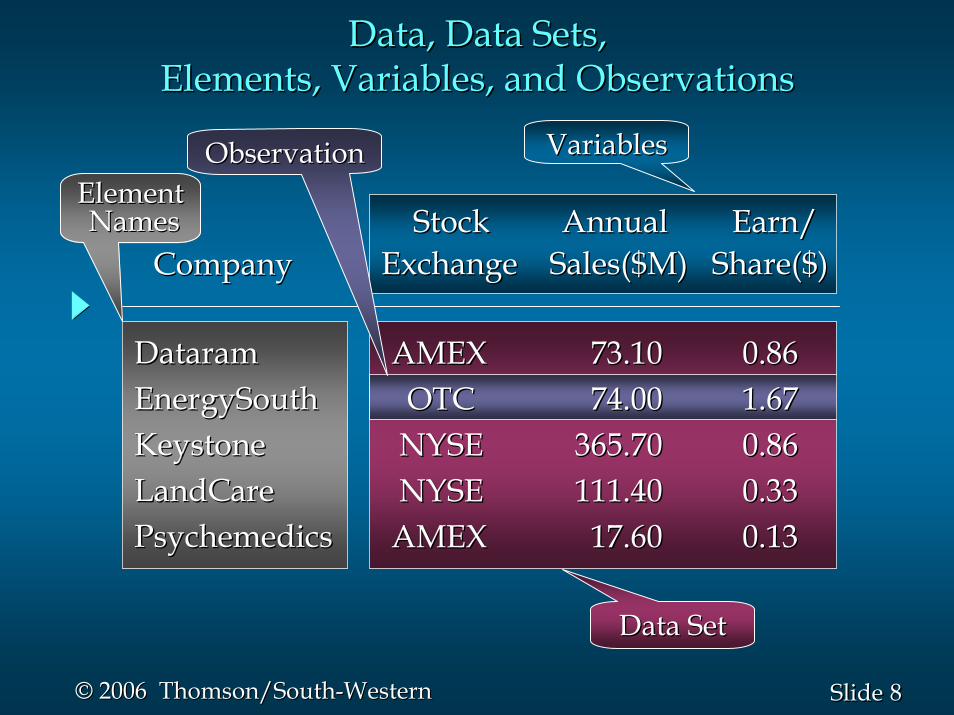
The The elementselements are the entities on which data areare the entities on which data arecollected.collected.A A variablevariable is a characteristic of interest for the elements.is a characteristic of interest for the elements.
The set of measurements collected for a particularThe set of measurements collected for a particularelement is called an element is called an observationobservation..
The total number of data values in a data set is theThe total number of data values in a data set is thenumber of elements multiplied by the number ofnumber of elements multiplied by the number ofvariables.variables.
Elements, Variables, and ObservationsElements, Variables, and Observations
88SlideSlide©© 2006 Thomson/South2006 Thomson/South--WesternWestern
Stock Annual Earn/Stock Annual Earn/Exchange Sales($M) Share($)Exchange Sales($M) Share($)
Data, Data Sets, Data, Data Sets, Elements, Variables, and ObservationsElements, Variables, and Observations
CompanyCompany
DataramDataramEnergySouthEnergySouthKeystoneKeystoneLandCareLandCarePsychemedicsPsychemedics
AMEXAMEX 73.1073.10 0.860.86OTCOTC 74.0074.00 1.671.67NYSENYSE 365.70365.70 0.86 0.86 NYSENYSE 111.40111.40 0.330.33AMEXAMEX 17.6017.60 0.130.13
VariablesVariables
ElementElementNamesNames
Data SetData Set
ObservationObservation

99SlideSlide©© 2006 Thomson/South2006 Thomson/South--WesternWestern
Scales of MeasurementScales of Measurement
The scale indicates the data summarization andstatistical analyses that are most appropriate.The scale indicates the data summarization andThe scale indicates the data summarization andstatistical analyses that are most appropriate.statistical analyses that are most appropriate.
The scale determines the amount of informationcontained in the data.The scale determines the amount of informationThe scale determines the amount of informationcontained in the data.contained in the data.
Scales of measurement include:Scales of measurement include:Scales of measurement include:
NominalNominal
OrdinalOrdinal
IntervalInterval
RatioRatio

1010SlideSlide©© 2006 Thomson/South2006 Thomson/South--WesternWestern
Scales of MeasurementScales of Measurement
NominalNominal
A nonnumeric label or numeric code may be used.A A nonnumeric labelnonnumeric label or or numeric codenumeric code may be used.may be used.
Data are labels or names used to identify anattribute of the element.Data are Data are labels or nameslabels or names used to identify anused to identify anattribute of the element.attribute of the element.

1111SlideSlide©© 2006 Thomson/South2006 Thomson/South--WesternWestern
Example:Students of a university are classified by theschool in which they are enrolled using anonnumeric label such as Business, Humanities,Education, and so on.
Alternatively, a numeric code could be used forthe school variable (e.g. 1 denotes Business,2 denotes Humanities, 3 denotes Education, andso on).
Example:Example:Students of a university are classified by theStudents of a university are classified by theschool in which they are enrolled using aschool in which they are enrolled using anonnumeric label such as Business, Humanities,nonnumeric label such as Business, Humanities,Education, and so on.Education, and so on.
Alternatively, a numeric code could be used forAlternatively, a numeric code could be used forthe school variable (e.g. 1 denotes Business,the school variable (e.g. 1 denotes Business,2 denotes Humanities, 3 denotes Education, and2 denotes Humanities, 3 denotes Education, andso on).so on).
Scales of MeasurementScales of Measurement
NominalNominal

1212SlideSlide©© 2006 Thomson/South2006 Thomson/South--WesternWestern
Scales of MeasurementScales of Measurement
OrdinalOrdinal
A nonnumeric label or numeric code may be used.A A nonnumeric labelnonnumeric label or or numeric codenumeric code may be used.may be used.
The data have the properties of nominal data andthe order or rank of the data is meaningful.The data have the properties of nominal data andThe data have the properties of nominal data andthe the order or rank of the data is meaningfulorder or rank of the data is meaningful..

1313SlideSlide©© 2006 Thomson/South2006 Thomson/South--WesternWestern
Scales of MeasurementScales of Measurement
OrdinalOrdinal
Example:Students of a university are classified by theirclass standing using a nonnumeric label such as Freshman, Sophomore, Junior, or Senior.
Alternatively, a numeric code could be used forthe class standing variable (e.g. 1 denotesFreshman, 2 denotes Sophomore, and so on).
Example:Example:Students of a university are classified by theirStudents of a university are classified by theirclass standing using a nonnumeric label such as class standing using a nonnumeric label such as Freshman, Sophomore, Junior, or Senior.Freshman, Sophomore, Junior, or Senior.
Alternatively, a numeric code could be used forAlternatively, a numeric code could be used forthe class standing variable (e.g. 1 denotesthe class standing variable (e.g. 1 denotesFreshman, 2 denotes Sophomore, and so on).Freshman, 2 denotes Sophomore, and so on).

1414SlideSlide©© 2006 Thomson/South2006 Thomson/South--WesternWestern
Scales of MeasurementScales of Measurement
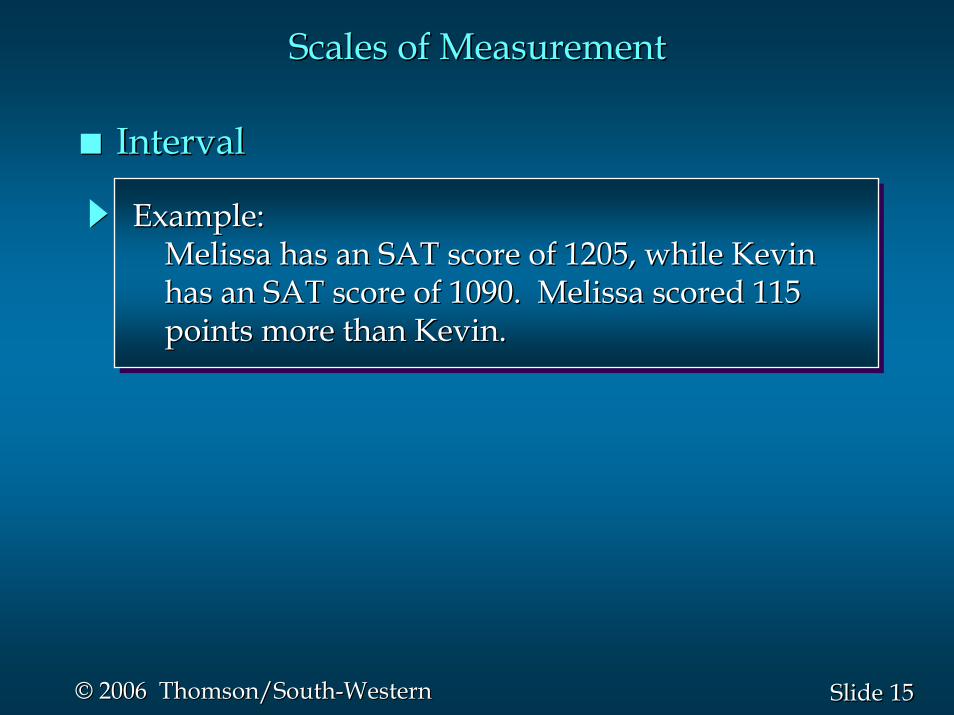
IntervalInterval
Interval data are always numeric.Interval data are Interval data are always numericalways numeric..
The data have the properties of ordinal data, andthe interval between observations is expressed interms of a fixed unit of measure.
The data have the properties of ordinal data, andThe data have the properties of ordinal data, andthe interval between observations is expressed inthe interval between observations is expressed interms of a fixed unit of measure.terms of a fixed unit of measure.
1515SlideSlide©© 2006 Thomson/South2006 Thomson/South--WesternWestern
Scales of MeasurementScales of Measurement
IntervalInterval
Example:Melissa has an SAT score of 1205, while Kevinhas an SAT score of 1090. Melissa scored 115points more than Kevin.
Example:Example:Melissa has an SAT score of 1205, while KevinMelissa has an SAT score of 1205, while Kevinhas an SAT score of 1090. Melissa scored 115has an SAT score of 1090. Melissa scored 115points more than Kevin.points more than Kevin.

1616SlideSlide©© 2006 Thomson/South2006 Thomson/South--WesternWestern
Scales of MeasurementScales of Measurement
RatioRatio
The data have all the properties of interval dataand the ratio of two values is meaningful.The data have all the properties of interval dataThe data have all the properties of interval dataand the and the ratio of two values is meaningfulratio of two values is meaningful..
Variables such as distance, height, weight, and timeuse the ratio scale.Variables such as distance, height, weight, and timeVariables such as distance, height, weight, and timeuse the ratio scale.use the ratio scale.
This scale must contain a zero value that indicatesthat nothing exists for the variable at the zero point.This This scale must contain a zero valuescale must contain a zero value that indicatesthat indicatesthat nothing exists for the variable at the zero point.that nothing exists for the variable at the zero point.

1717SlideSlide©© 2006 Thomson/South2006 Thomson/South--WesternWestern
Scales of MeasurementScales of Measurement
RatioRatio
Example:Melissa’s college record shows 36 credit hoursearned, while Kevin’s record shows 72 credit hours earned. Kevin has twice as many credithours earned as Melissa.
Example:Example:MelissaMelissa’’s college record shows 36 credit hourss college record shows 36 credit hoursearned, while Kevinearned, while Kevin’’s record shows 72 credit s record shows 72 credit hours earned. Kevin has twice as many credithours earned. Kevin has twice as many credithours earned as Melissa.hours earned as Melissa.

1818SlideSlide©© 2006 Thomson/South2006 Thomson/South--WesternWestern
Data can be further classified as being qualitativeor quantitative.Data can be further classified as being qualitativeData can be further classified as being qualitativeor quantitative.or quantitative.
The statistical analysis that is appropriate dependson whether the data for the variable are qualitativeor quantitative.
The statistical analysis that is appropriate dependsThe statistical analysis that is appropriate dependson whether the data for the variable are qualitativeon whether the data for the variable are qualitativeor quantitative.or quantitative.
In general, there are more alternatives for statisticalanalysis when the data are quantitative.In general, there are more alternatives for statisticalIn general, there are more alternatives for statisticalanalysis when the data are quantitative.analysis when the data are quantitative.
Qualitative and Quantitative DataQualitative and Quantitative Data

1919SlideSlide©© 2006 Thomson/South2006 Thomson/South--WesternWestern
Qualitative DataQualitative Data
Labels or names used to identify an attribute of eachelementLabels or namesLabels or names used to identify an attribute of eachused to identify an attribute of eachelementelement
Often referred to as categorical dataOften referred to as Often referred to as categorical datacategorical data
Use either the nominal or ordinal scale ofmeasurementUse either the nominal or ordinal scale ofUse either the nominal or ordinal scale ofmeasurementmeasurement
Can be either numeric or nonnumericCan be either numeric or nonnumericCan be either numeric or nonnumeric
Appropriate statistical analyses are rather limitedAppropriate statistical analyses are rather limitedAppropriate statistical analyses are rather limited

2020SlideSlide©© 2006 Thomson/South2006 Thomson/South--WesternWestern
Quantitative DataQuantitative Data
Quantitative data indicate how many or how much:Quantitative data indicate Quantitative data indicate how many or how much:how many or how much:
discrete, if measuring how manydiscretediscrete, if measuring how many, if measuring how many
continuous, if measuring how muchcontinuouscontinuous, if measuring how much, if measuring how much
Quantitative data are always numeric.Quantitative data are Quantitative data are always numericalways numeric..
Ordinary arithmetic operations are meaningful forquantitative data.Ordinary arithmetic operations are meaningful forOrdinary arithmetic operations are meaningful forquantitative data.quantitative data.

2121SlideSlide©© 2006 Thomson/South2006 Thomson/South--WesternWestern
Scales of MeasurementScales of Measurement
QualitativeQualitativeQualitative QuantitativeQuantitativeQuantitative
NumericalNumericalNumerical NumericalNumericalNumericalNonnumericalNonnumericalNonnumerical
DataDataData
NominalNominalNominal OrdinalOrdinalOrdinal NominalNominalNominal OrdinalOrdinalOrdinal IntervalIntervalInterval RatioRatioRatio

2222SlideSlide©© 2006 Thomson/South2006 Thomson/South--WesternWestern
CrossCross--Sectional DataSectional Data
Cross-sectional data are collected at the same orapproximately the same point in time.CrossCross--sectional datasectional data are collected at the same orare collected at the same orapproximately the same point in time.approximately the same point in time.
Example: data detailing the number of buildingpermits issued in June 2003 in each of the countiesof Ohio
ExampleExample: data detailing the number of building: data detailing the number of buildingpermits issued in June 2003 in each of the countiespermits issued in June 2003 in each of the countiesof Ohioof Ohio

2323SlideSlide©© 2006 Thomson/South2006 Thomson/South--WesternWestern
Time Series DataTime Series Data
Time series data are collected over several timeperiods.Time series dataTime series data are collected over several timeare collected over several timeperiods.periods.
Example: data detailing the number of buildingpermits issued in Lucas County, Ohio in each ofthe last 36 months
ExampleExample: data detailing the number of building: data detailing the number of buildingpermits issued in Lucas County, Ohio in each ofpermits issued in Lucas County, Ohio in each ofthe last 36 monthsthe last 36 months

2424SlideSlide©© 2006 Thomson/South2006 Thomson/South--WesternWestern
Data SourcesData Sources
Existing SourcesExisting Sources
Within a firmWithin a firm –– almost any departmentalmost any departmentBusiness database servicesBusiness database services –– Dow Jones & Co.Dow Jones & Co.Government agenciesGovernment agencies -- U.S. Department of LaborU.S. Department of LaborIndustry associationsIndustry associations –– Travel Industry AssociationTravel Industry Association
of Americaof AmericaSpecialSpecial--interest organizationsinterest organizations –– Graduate ManagementGraduate Management
AdmissioAdmission Counciln CouncilInternetInternet –– more and more firmsmore and more firms

2525SlideSlide©© 2006 Thomson/South2006 Thomson/South--WesternWestern
Statistical StudiesStatistical Studies
Data SourcesData Sources
In experimental studies the variables of interestare first identified. Then one or more factors arecontrolled so that data can be obtained about howthe factors influence the variables.
In In experimental studiesexperimental studies the variables of interestthe variables of interestare first identified. Then one or more factors areare first identified. Then one or more factors arecontrolled so that data can be obtained about howcontrolled so that data can be obtained about howthe factors influence the variables.the factors influence the variables.
In observational (nonexperimental) studies noattempt is made to control or influence thevariables of interest.
In In observationalobservational ((nonexperimentalnonexperimental) ) studiesstudies nonoattempt is made to control or influence theattempt is made to control or influence thevariables of interest.variables of interest.
a survey is aa survey is agood examplegood example

2626SlideSlide©© 2006 Thomson/South2006 Thomson/South--WesternWestern
Data Acquisition ConsiderationsData Acquisition Considerations
Time RequirementTime Requirement
Cost of AcquisitionCost of Acquisition
Data ErrorsData Errors
•• Searching for information can be time consuming.Searching for information can be time consuming.•• Information may no longer be useful by the time itInformation may no longer be useful by the time it
is available.is available.
•• Organizations often charge for information evenOrganizations often charge for information evenwhen it is not their primary business activity.when it is not their primary business activity.
•• Using any data that happens to be available orUsing any data that happens to be available orthat were acquired with little care can lead to poorthat were acquired with little care can lead to poorand misleading information.and misleading information.

2727SlideSlide©© 2006 Thomson/South2006 Thomson/South--WesternWestern
Descriptive StatisticsDescriptive Statistics
Descriptive statisticsDescriptive statistics are the tabular, graphical, and are the tabular, graphical, and numerical methods used to numerical methods used to summarizesummarize data.data.

2828SlideSlide©© 2006 Thomson/South2006 Thomson/South--WesternWestern
Example: Hudson Auto RepairExample: Hudson Auto Repair
The manager of Hudson AutoThe manager of Hudson Autowould like to have a betterwould like to have a betterunderstanding of the costunderstanding of the costof parts used in the engineof parts used in the enginetunetune--ups performed in theups performed in theshop. She examines 50shop. She examines 50customer invoices for tunecustomer invoices for tune--ups. The costs of parts,ups. The costs of parts,rounded to the nearest dollar, are listed on the nextrounded to the nearest dollar, are listed on the nextslide.slide.

2929SlideSlide©© 2006 Thomson/South2006 Thomson/South--WesternWestern
91 78 93 57 75 52 99 80 97 6271 69 72 89 66 75 79 75 72 76104 74 62 68 97 105 77 65 80 10985 97 88 68 83 68 71 69 67 7462 82 98 101 79 105 79 69 62 73
91 78 93 57 75 52 99 80 97 6271 69 72 89 66 75 79 75 72 76104 74 62 68 97 105 77 65 80 10985 97 88 68 83 68 71 69 67 7462 82 98 101 79 105 79 69 62 73
Example: Hudson Auto RepairExample: Hudson Auto Repair
Sample of Parts Cost for 50 TuneSample of Parts Cost for 50 Tune--upsups

3030SlideSlide©© 2006 Thomson/South2006 Thomson/South--WesternWestern
Tabular Summary:Tabular Summary:Frequency and Percent FrequencyFrequency and Percent Frequency
5050--59596060--69697070--79798080--89899090--9999
100100--109109
2213131616777755
5050
4426263232141414141010
100100
(2/50)100(2/50)100
PartsPartsCost ($)Cost ($)
PartsPartsFrequencyFrequency
PercentPercentFrequencyFrequency

3131SlideSlide©© 2006 Thomson/South2006 Thomson/South--WesternWestern
Graphical Summary: HistogramGraphical Summary: Histogram
22
44
66
88
1010
1212
1414
1616
1818
PartsCost ($)Parts
Cost ($)
Freq
uenc
yFr
eque
ncy
50−59 60−69 70−79 80−89 90−99 100-11050−59 60−69 70−79 80−89 90−99 100-110
TuneTune--up Parts Costup Parts Cost

3232SlideSlide©© 2006 Thomson/South2006 Thomson/South--WesternWestern
Numerical Descriptive StatisticsNumerical Descriptive Statistics
HudsonHudson’’s average cost of parts, based on the 50s average cost of parts, based on the 50tunetune--ups studied, is $79 (found by summing theups studied, is $79 (found by summing the50 cost values and then dividing by 50).50 cost values and then dividing by 50).
The most common numerical descriptive statisticThe most common numerical descriptive statisticis the is the averageaverage (or (or meanmean).).

3333SlideSlide©© 2006 Thomson/South2006 Thomson/South--WesternWestern
Statistical InferenceStatistical Inference
PopulationPopulation
SampleSample
Statistical inferenceStatistical inference
CensusCensus
Sample surveySample survey
−− the set of all elements of interest in athe set of all elements of interest in aparticular studyparticular study
−− a subset of the populationa subset of the population
−− the process of using data obtainedthe process of using data obtainedfrom a sample to make estimatesfrom a sample to make estimatesand test hypotheses about theand test hypotheses about thecharacteristics of a populationcharacteristics of a population
−− collecting data for a populationcollecting data for a population
−− collecting data for a samplecollecting data for a sample

3434SlideSlide©© 2006 Thomson/South2006 Thomson/South--WesternWestern
Process of Statistical InferenceProcess of Statistical Inference
11. Population . Population consists of allconsists of all
tunetune--ups. Averageups. Averagecost of parts iscost of parts is
unknownunknown.
22. A sample of 50. A sample of 50engine tuneengine tune--ups ups
is examined.is examined.
33. The sample data . The sample data provide a sampleprovide a sampleaverage parts costaverage parts costof $79 per tuneof $79 per tune--up.up.
44. The sample average. The sample averageis used to estimate theis used to estimate the
population average.population average.

3535SlideSlide©© 2006 Thomson/South2006 Thomson/South--WesternWestern
Computers and Statistical AnalysisComputers and Statistical Analysis
Statistical analysis often involves working withStatistical analysis often involves working withlarge amounts of datalarge amounts of data..Computer softwareComputer software is typically used to conduct theis typically used to conduct theanalysis.analysis.Statistical software packages such as Statistical software packages such as Microsoft ExcelMicrosoft Exceland and MinitabMinitab are capable of data management, analysis,are capable of data management, analysis,and presentation.and presentation.Instructions for using Excel and Minitab are providedInstructions for using Excel and Minitab are providedin chapter appendices.in chapter appendices.
3636SlideSlide©© 2006 Thomson/South2006 Thomson/South--WesternWestern
End of Chapter 1End of Chapter 1
Related Documents