Combining process data and subjective data to better understand online behavior Martijn Willemsen Human-Technology Interaction

Welcome message from author
This document is posted to help you gain knowledge. Please leave a comment to let me know what you think about it! Share it to your friends and learn new things together.
Transcript

Combining
process data
and subjective
data to better
understand
online behavior
Martijn Willemsen
Human-Technology
Interaction
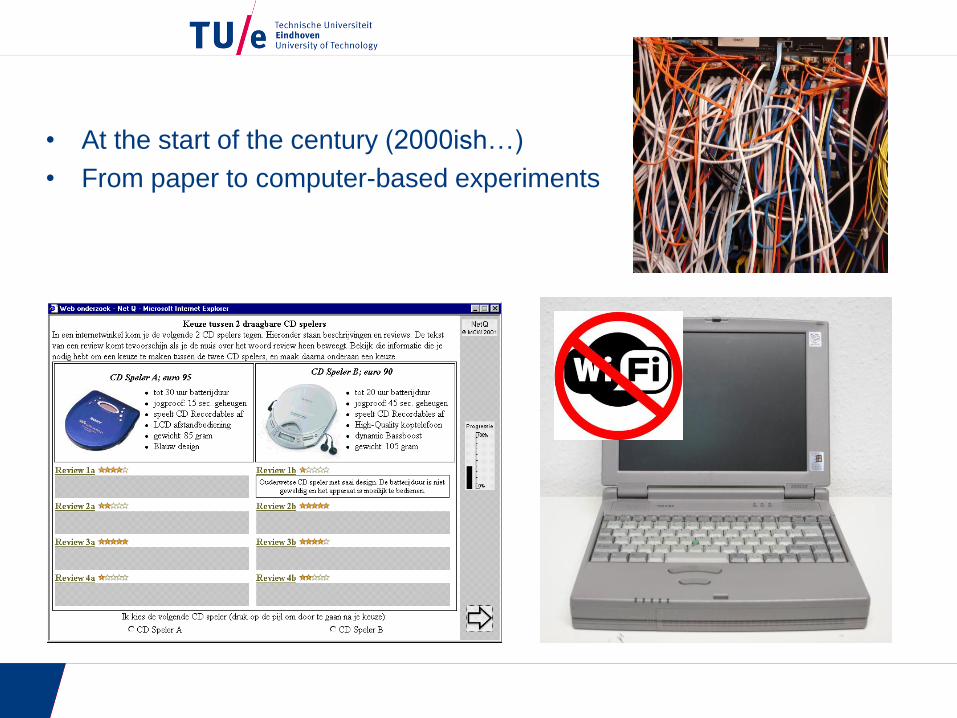
• At the start of the century (2000ish…)
• From paper to computer-based experiments
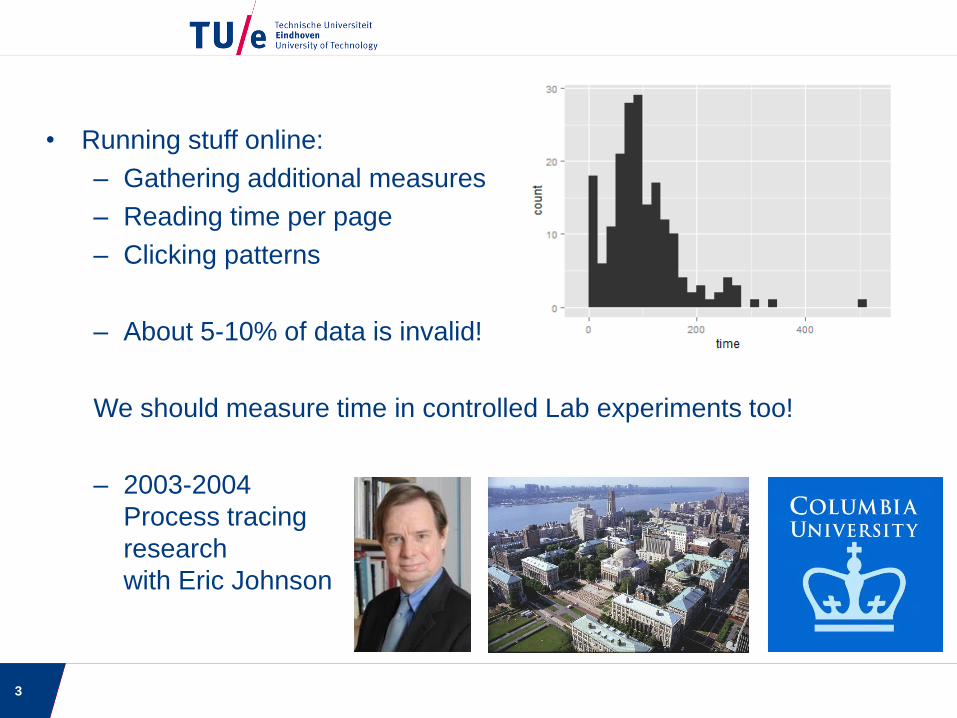
• Running stuff online:
– Gathering additional measures
– Reading time per page
– Clicking patterns
– About 5-10% of data is invalid!
We should measure time in controlled Lab experiments too!
– 2003-2004
Process tracing
research
with Eric Johnson
3

MouselabWEBOnline process tracing tool to measure decision processes
4
1988
2004/2008
www.mouselabweb.org

• Tradeoff between Target and Competitor
– Price versus Quality
• Adding 3rd option: Decoy Da to TC set
• D is dominated by target T but not by
competitor C (and hardly ever chosen)
• P(T;DTC) > P(T;TC)
• Violation of independence of irrelevant
alternatives
Attraction Effect
TC DTC
T 46% 53%
C 54% 47%

6
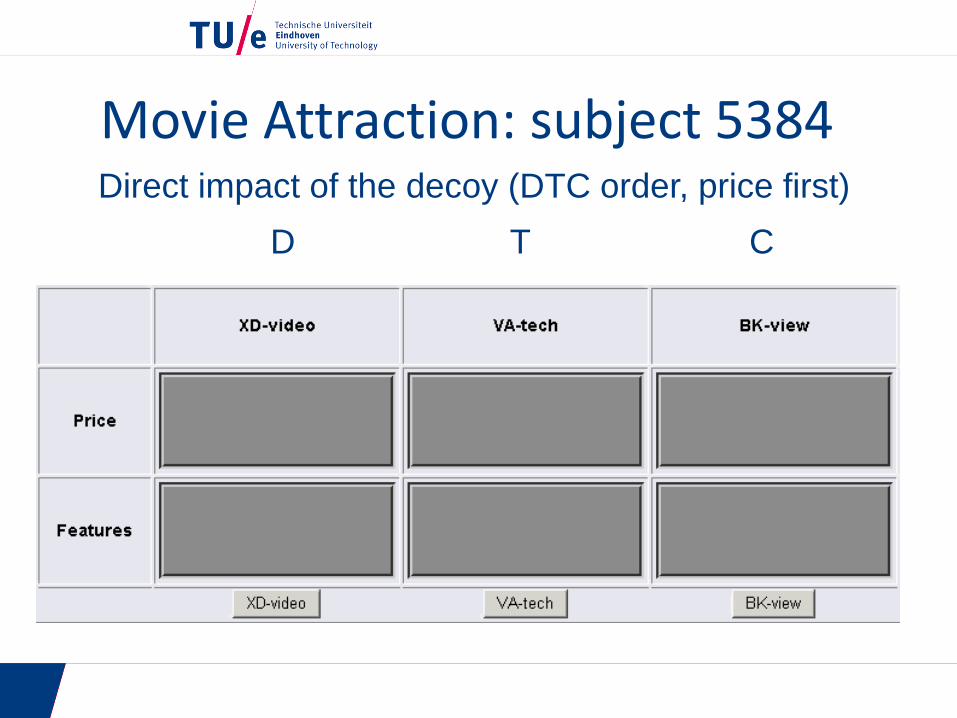
Movie Attraction: subject 5384Direct impact of the decoy (DTC order, price first)
D T C

• Using Icon Graphs to plot the process data
• Dynamics:
– Scanning Phase (all acquisitions until all boxes have been
opened once)
– Choice phase (all remaining acquisitions)
– For Choice of target and not
8
Combining process with
subjective data
The case of recommender systems
9

• Iyengar and Lepper (2000): jam-study
• Apparently, satisfaction is not only a
function of attractiveness but also
of the choice difficulty
Choice overload
More attractive3% sales
Less attractive30% sales
Higher purchasesatisfaction

Using a movie recommender
Top5 1 2 3 4 5 - - - - - - - - - - - - - - -
Top20 1 2 3 4 5 6 7 8 9 10 11 12 13 14 15 16 17 18 19 20
Lin20 1 2 3 4 5 99 199 299 399 499 599 699 799 899 999 1099 1199 1299 1399 1499

Results
perceived recommendation
varietyperceived recommendation
quality
Top-20vs Top-5 recommendations
movie
expertisechoice
satisfaction
choice
difficulty
+
+
+
+
-+
.401 (.189)p < .05
.170 (.069)p < .05
.449 (.072)p < .001
.346 (.125)p < .01
.445 (.102)p < .001
-.217 (.070)p < .005
Objective System Aspects (OSA)
Subjective System Aspects (SSA)
Experience (EXP)
Personal Characteristics (PC)
Interaction (INT)
Lin-20vs Top-5 recommendations
+
+ - +
.172 (.068)p < .05
.938 (.249)p < .001
-.540 (.196)p < .01
-.633 (.177)p < .001
.496 (.152)p < .005
-0.1
0
0.1
0.2
0.3
0.4
0.5
Top-5 Top-20 Lin-20
Choice satisfaction

•Median Choice rank
•Top 20: 8.5
•Lin 20: 3.0
•Looking time per item:
•Top 20: 2.8 sec
•Lin 20: 1.4 sec
•Acq. Freq per item:
•Top 20: .64
•Lin 20: .44
Frequency
Time
Behavioral data

14
Psychologists and HCI people are mostly interested in experience…
User-Centric Evaluation Framework

15
Computers Scientists (and marketing researchers) would study
behavior…. (they hate asking the user or just cannot (AB tests))
User-Centric Evaluation Framework

16
Though it helps to triangulate experience and behavior…
User-Centric Evaluation Framework

17
Our framework adds the intermediate construct of perception that explains
why behavior and experiences changes due to our manipulations
User-Centric Evaluation Framework

18
And adds personal
and situational
characteristics
Relations modeled
using factor analysis
and SEM
Knijnenburg, B.P., Willemsen, M.C., Gantner, Z., Soncu, H., Newell, C. (2012). Explaining
the User Experience of Recommender Systems. User Modeling and User-Adapted
Interaction (UMUAI), vol 22, p. 441-504
http://bit.ly/umuai
User-Centric Evaluation Framework

• Two cases that clearly shows the importance of the triangulation of
Behavioral data & Subjective data!
• Video recommender service: satisfaction versus clicks and
viewing times
• Diversification: continuing the choice overload work
– Can Diversification reduce choice overload?
– Choice difficulty: effort versus cognitive difficulty
19

20
Video Recommender system: EMIC Pre-trial in UMUAI paper
Knijnenburg, B.P., Willemsen, M.C. & Hirtbach, S. (2010). Receiving recommendations and providing feedback :the user-experience of a recommender system. E-Commerce and Web Technologies (11th InternationalConference, EC-Web 2010, Lecture Notes in Business Information Processing, Vol. 61, pp. 207-216)

21

• Diversification and list length as two experimental factors
– list sizes: 5 and 20
– Diversification: none (top 5/20), medium, high
• Dependent measure: choice satisfaction
– Choice difficulty versus attractiveness
– Subjective choice difficulty (scale) and objective choice difficulty (effort: hovers)
• 159 Participants from an online database
– Rating task to train the system (15 ratings)
– Choose one item from a list of recommendations
– Answer user experience questionnaire
Diversification & Choice Satisfaction

• Perceived recommendation diversity
– 5 items, e.g. “The list of movies was varied”
• Perceived recommendation attractiveness
– 5 items, e.g. “The list of recommendations was attractive”
• Choice satisfaction
– 6 items, e.g. “I think I would enjoy watching the chosen movie”
• Choice difficulty
– 5 items, e.g.: “It was easy to select a movie”
Questionnaire-items
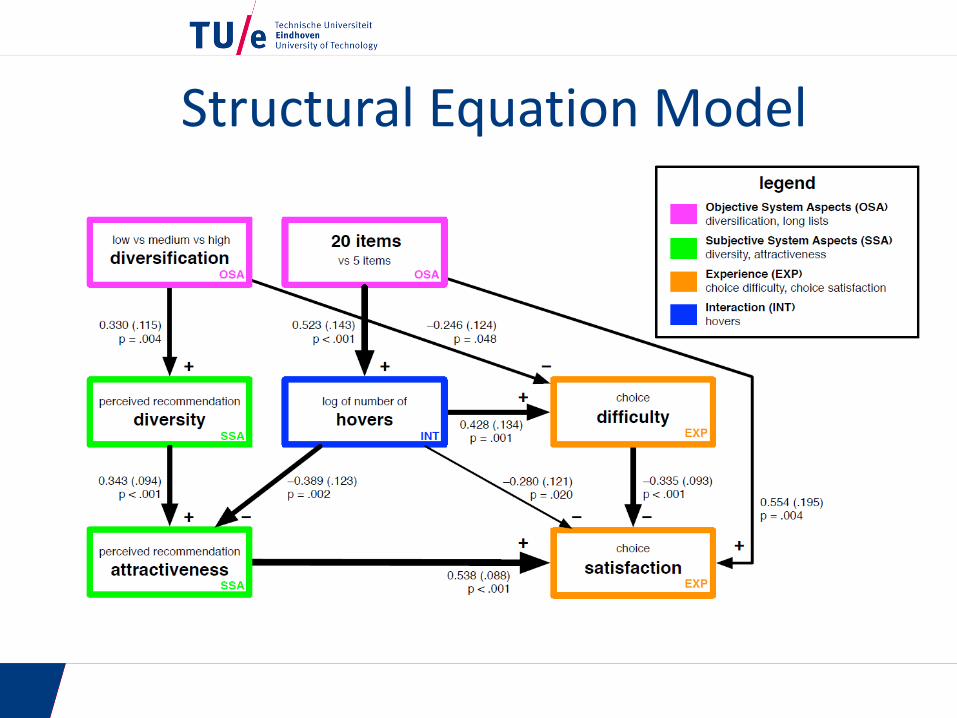
Structural Equation Model

• Perceived Diversity increases with Diversification
– Similarly for 5 and 20 items
– Perc. Diversity increases attractiveness
• Perceived difficulty goes down with diversification
• Effort (behavioral difficulty) goes up with list length
• Perceived attractiveness goes up with diversification
• Diverse 5 item set excels…
– Just as satisfying as 20 items
– Less difficult to choose from
– Less cognitive load…!
-0.5
0
0.5
1
1.5
none med highstan
dar
diz
ed s
core
diversification
Perc. Diversity
5 items
20 items
-0.2
0
0.2
0.4
0.6
0.8
1
none med highst
and
ard
ized
sco
re
diversification
Choice Satisfaction
5 items20 items

• Behavioral and subjective data are two parts of the same story: you often need both to really get it!
• Try to capture as much of the process as you can, using smart interface designs, event tracking (hovers, clicks) or even cooler stuff such as modern cheap eye trackers (Tobii EyeX, EyeTribe)
• User-centric framework allows us to understand WHY particular approaches work or not– Concept of mediation: user perception
helps understanding..
What you should take away…
Contact:
Martijn Willemsen
@MCWillemsen
www.martijnwillemsen.nl
Thanks to my co-authors:
Mark Graus
Bart Knijnenburg
Dirk Bollen
Eric Johnson
Questions?
Related Documents