150, St. Joseph’s Street, Colombo 01400, Sri Lanka. Tel: +94 112490900, Email: [email protected], www.jbs.lk 31 st July 2013 Sri Lanka: Outlook for Equities - 2013/14 Searching for value… Gold Winner - Equity Research Report 2013

Sri Lanka Outlook for Equities - 2013-14
Oct 28, 2015
Provides an overall take on the outlook for the Sri Lankan equity market and the general macroeconomic enivronment for 2013-14
Welcome message from author
This document is posted to help you gain knowledge. Please leave a comment to let me know what you think about it! Share it to your friends and learn new things together.
Transcript
150, St. Joseph’s Street, Colombo 01400, Sri Lanka.Tel: +94 112490900, Email: [email protected], www.jbs.lk
31st July 2013
Sri Lanka: Outlook for Equities - 2013/14Searching for value…
Gold Winner - Equity Research Report 2013
Page 2JB Securities Research July 2013
Market SnapshotCountry Snapshot
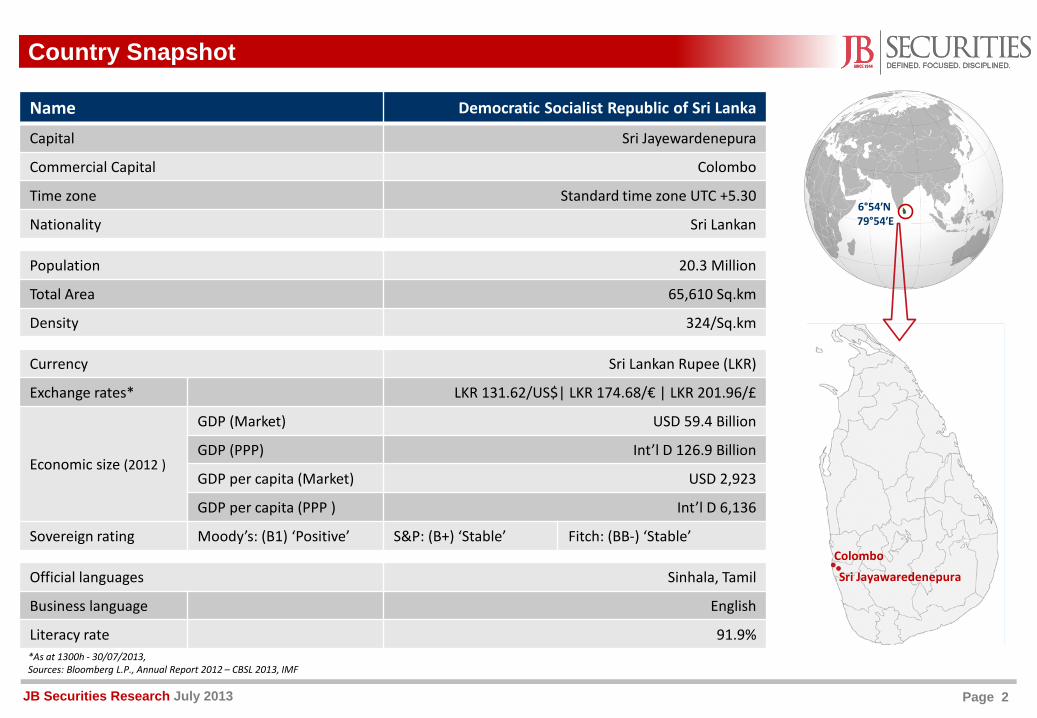
Name Democratic Socialist Republic of Sri Lanka
Capital Sri Jayewardenepura
Commercial Capital Colombo
Time zone Standard time zone UTC +5.30
Nationality Sri Lankan
Population 20.3 Million
Total Area 65,610 Sq.km
Density 324/Sq.km
Currency Sri Lankan Rupee (LKR)
Exchange rates* LKR 131.62/US$| LKR 174.68/€ | LKR 201.96/£
Economic size (2012 )
GDP (Market) USD 59.4 Billion
GDP (PPP) Int’l D 126.9 Billion
GDP per capita (Market) USD 2,923
GDP per capita (PPP ) Int’l D 6,136
Sovereign rating Moody’s: (B1) ‘Positive’ S&P: (B+) ‘Stable’ Fitch: (BB-) ‘Stable’
Official languages Sinhala, Tamil
Business language English
Literacy rate 91.9%
6°54′N79°54′E
*As at 1300h - 30/07/2013, Sources: Bloomberg L.P., Annual Report 2012 – CBSL 2013, IMF
Sri Jayawaredenepura
Colombo
Page 3JB Securities Research July 2013
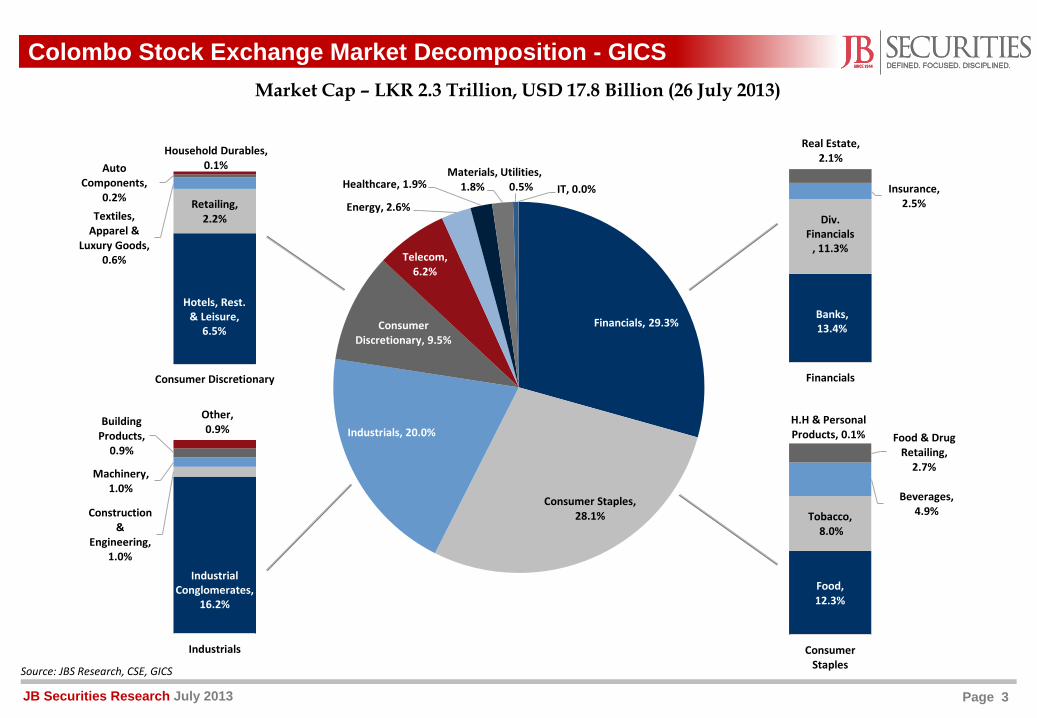
Financials, 29.3%
Consumer Staples, 28.1%
Industrials, 20.0%
Consumer Discretionary, 9.5%
Telecom, 6.2%
Energy, 2.6%
Healthcare, 1.9%Materials,
1.8%Utilities,
0.5% IT, 0.0%
Colombo Stock Exchange Market Decomposition - GICS
Retailing, 2.2%Textiles,
Apparel & Luxury Goods,
0.6%
Auto Components,
0.2%
Household Durables, 0.1%
Consumer Discretionary
Hotels, Rest. & Leisure,
6.5%
Construction &
Engineering, 1.0%
Machinery, 1.0%
Building Products,
0.9%
Other, 0.9%
Industrials
Industrial Conglomerates,
16.2%Food, 12.3%
Tobacco,8.0%
Beverages, 4.9%
Food & Drug Retailing,
2.7%
H.H & Personal Products, 0.1%
ConsumerStaples
Insurance, 2.5%
Real Estate, 2.1%
Financials
Div. Financials
, 11.3%
Banks, 13.4%
Source: JBS Research, CSE, GICS
Market Cap – LKR 2.3 Trillion, USD 17.8 Billion (26 July 2013)
Page 4JB Securities Research July 2013
Recap of the last 12 months…
Potential risks exist…
Investment case remains…
Page 5JB Securities Research July 2013
80
100
120
140
160
180
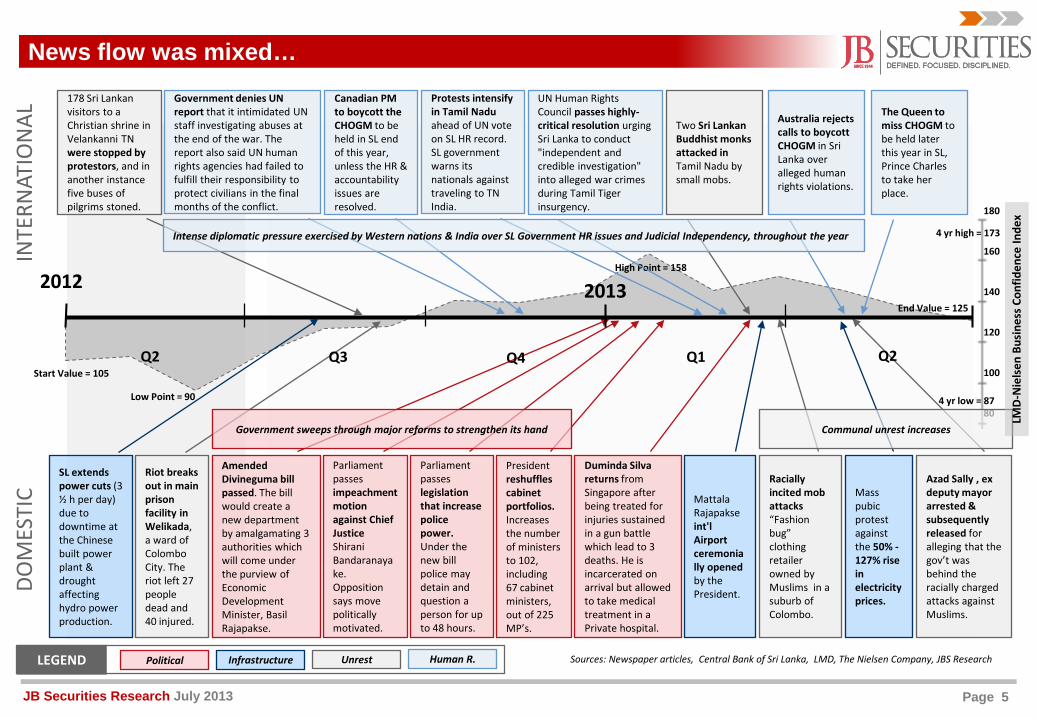
Start Value = 105
End Value = 125
Low Point = 90
News flow was mixed…
Amended Divineguma bill passed. The bill would create a new department by amalgamating 3 authorities which will come under the purview of Economic Development Minister, Basil Rajapakse.
Riot breaks out in main prison facility in Welikada, a ward of Colombo City. The riot left 27 people dead and 40 injured.
2012
Q1
INTE
RNAT
ION
ALDO
MES
TIC
Sources: Newspaper articles, Central Bank of Sri Lanka, LMD, The Nielsen Company, JBS Research
High Point = 158
Government denies UN report that it intimidated UN staff investigating abuses at the end of the war. The report also said UN human rights agencies had failed to fulfill their responsibility to protect civilians in the final months of the conflict.
178 Sri Lankan visitors to a Christian shrine in Velankanni TN were stopped by protestors, and in another instance five buses of pilgrims stoned.
Canadian PM to boycott the CHOGM to be held in SL end of this year, unless the HR & accountability issues are resolved.
Protests intensify in Tamil Nadu ahead of UN vote on SL HR record. SL government warns its nationals against traveling to TN India.
UN Human Rights Council passes highly-critical resolution urging Sri Lanka to conduct "independent and credible investigation" into alleged war crimes during Tamil Tiger insurgency.
Parliament passes impeachment motion against Chief Justice Shirani Bandaranayake. Opposition says move politically motivated.
Two Sri Lankan Buddhist monks attacked in Tamil Nadu by small mobs.
Australia rejects calls to boycott CHOGM in Sri Lanka over alleged human rights violations.
Parliament passes legislation that increase police power. Under the new bill police may detain and question a person for up to 48 hours.
President reshuffles cabinet portfolios. Increases the number of ministers to 102, including 67 cabinet ministers, out of 225 MP’s.
Intense diplomatic pressure exercised by Western nations & India over SL Government HR issues and Judicial Independency, throughout the year
Duminda Silva returns from Singapore after being treated for injuries sustained in a gun battle which lead to 3 deaths. He is incarcerated on arrival but allowed to take medical treatment in a Private hospital.
Mattala Rajapakse int'l Airport ceremonially opened by the President.
Racially incited mob attacks “Fashion bug” clothing retailer owned by Muslims in a suburb of Colombo.
Mass pubic protest against the 50% -127% rise in electricity prices.
Azad Sally , ex deputy mayor arrested & subsequently released for alleging that the gov’t was behind the racially charged attacks against Muslims.
The Queen to miss CHOGM to be held later this year in SL, Prince Charles to take her place.
4 yr low = 87
4 yr high = 173
Communal unrest increases
Political Human R.Infrastructure UnrestLEGEND
Q4 Q2Q3Q2
2013
SL extends power cuts (3 ½ h per day) due to downtime at the Chinese built power plant & drought affecting hydro power production.
Government sweeps through major reforms to strengthen its hand
LMD
-Nie
lsen
Bus
ines
s Co
nfid
ence
Inde
x
Page 6JB Securities Research July 2013
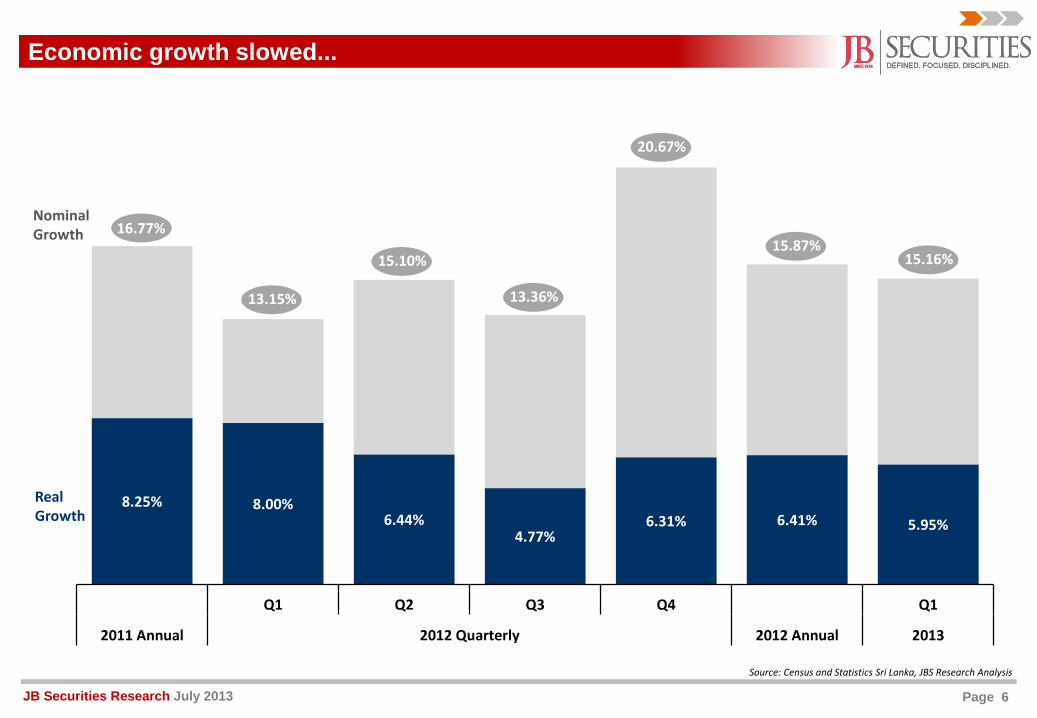
8.25% 8.00%6.44%
4.77%6.31% 6.41% 5.95%
Q1 Q2 Q3 Q4 Q1
2011 Annual 2012 Quarterly 2012 Annual 2013
16.77%
13.15%
15.10%
13.36%
20.67%
15.87%15.16%
Economic growth slowed...
NominalGrowth
RealGrowth
Source: Census and Statistics Sri Lanka, JBS Research Analysis
Page 7JB Securities Research July 2013
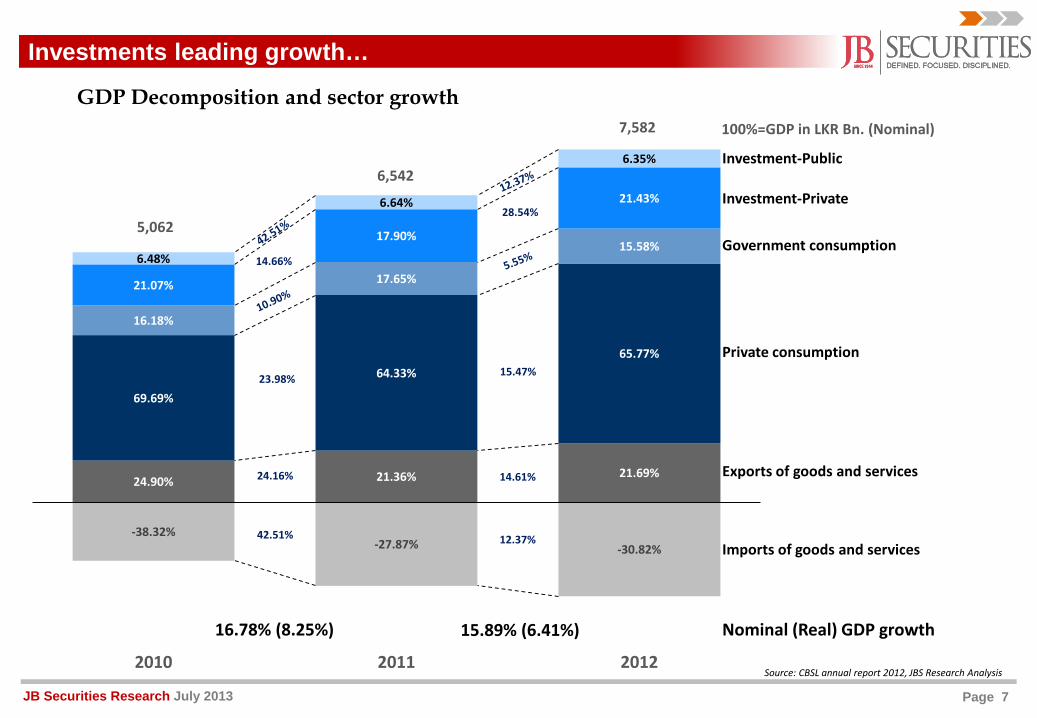
Investments leading growth…
Source: CBSL annual report 2012, JBS Research Analysis
24.90% 21.36% 21.69%
69.69%
64.33%65.77%
16.18%
17.65%
15.58%
21.07%
17.90%
21.43%
6.48%
6.64%
6.35%
-38.32%-27.87% -30.82%
2010 2011 2012
Imports of goods and services
Exports of goods and services
Private consumption
Government consumption
Investment-Private
Nominal (Real) GDP growth
Investment-Public
15.89% (6.41%)16.78% (8.25%)
100%=GDP in LKR Bn. (Nominal)
12.37%42.51%
24.16% 14.61%
15.47%23.98%
14.66%
28.54%5,062
6,542
7,582
GDP Decomposition and sector growth
Page 8JB Securities Research July 2013
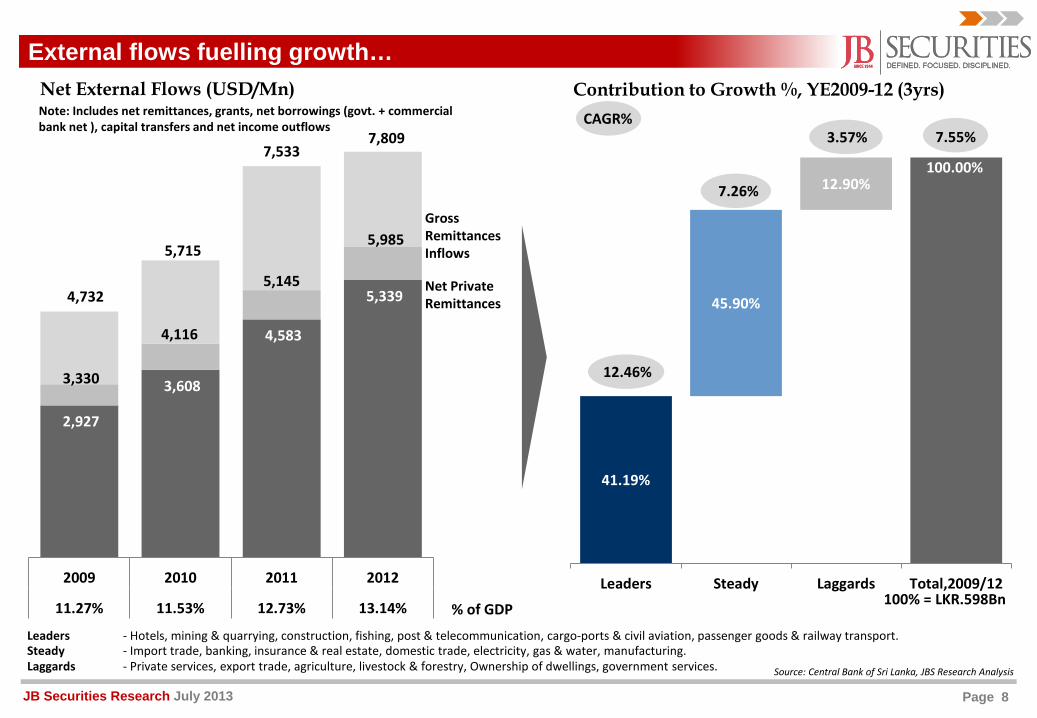
Contribution to Growth %, YE2009-12 (3yrs)
External flows fuelling growth…
Source: Central Bank of Sri Lanka, JBS Research Analysis
2,927
3,608
4,583
5,339
3,330
4,116
5,145
5,985
4,732
5,715
7,5337,809
2009 2010 2011 2012
11.27% 11.53% 12.73% 13.14% % of GDP
41.19%
100.00%
45.90%
12.90%
Leaders Steady Laggards Total,2009/12
12.46%
7.26%
3.57%
Note: Includes net remittances, grants, net borrowings (govt. + commercial bank net ), capital transfers and net income outflows
Net External Flows (USD/Mn) CAGR%
7.55%
100% = LKR.598Bn
Net Private Remittances
Gross Remittances Inflows
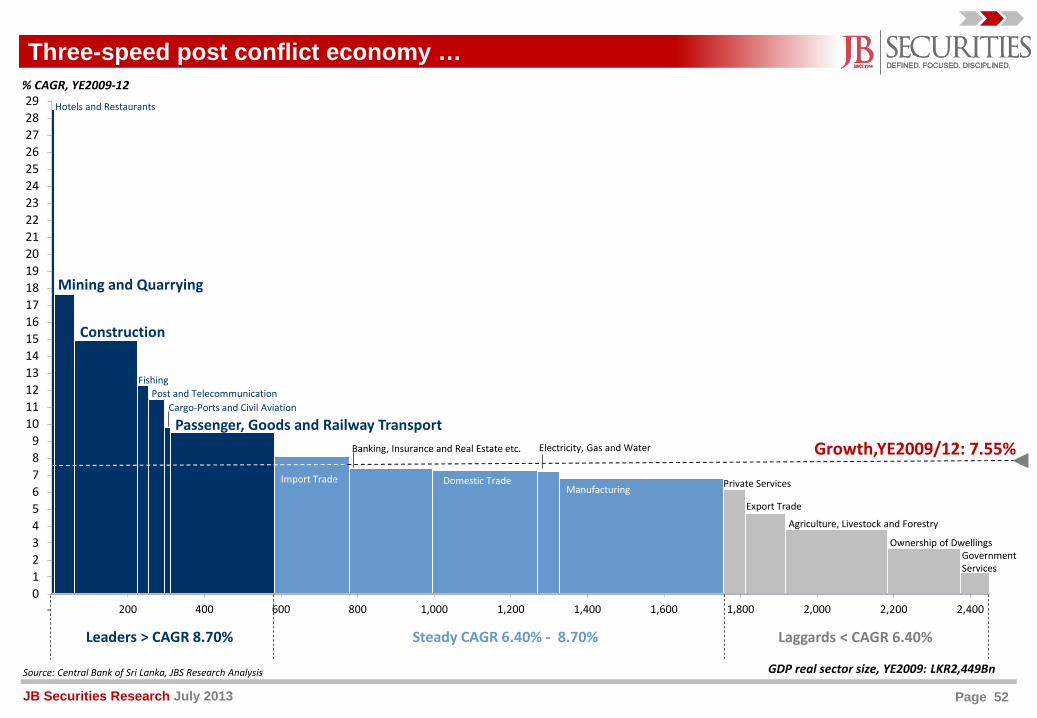
Leaders - Hotels, mining & quarrying, construction, fishing, post & telecommunication, cargo-ports & civil aviation, passenger goods & railway transport.Steady - Import trade, banking, insurance & real estate, domestic trade, electricity, gas & water, manufacturing.Laggards - Private services, export trade, agriculture, livestock & forestry, Ownership of dwellings, government services.
Page 9JB Securities Research July 2013
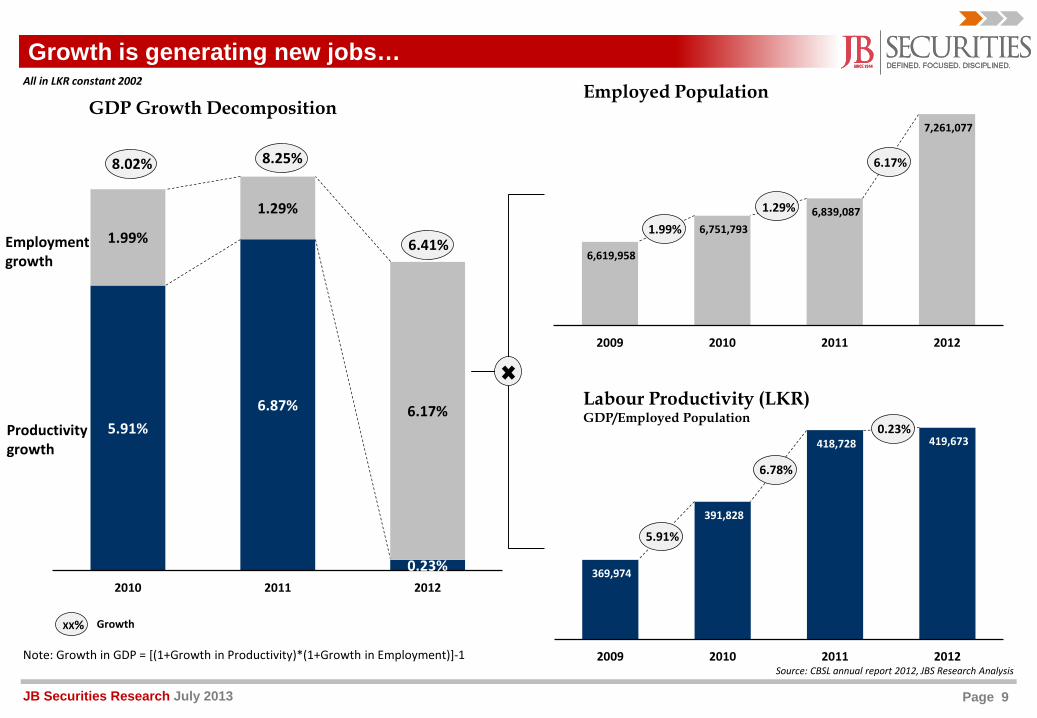
6,619,958
6,751,793 6,839,087
7,261,077
2009 2010 2011 2012
1.99%
1.29%
6.17%
369,974
391,828
418,728 419,673
2009 2010 2011 2012
5.91%
6.78%
0.23%
Growth is generating new jobs…Employed Population
Labour Productivity (LKR)GDP/Employed Population
GDP Growth Decomposition
Source: CBSL annual report 2012, JBS Research Analysis
5.91%6.87%
0.23%
1.99%
1.29%
6.17%
2010 2011 2012
8.02% 8.25%
6.41%Employmentgrowth
Productivitygrowth
All in LKR constant 2002
XX% Growth
Note: Growth in GDP = [(1+Growth in Productivity)*(1+Growth in Employment)]-1
Page 10JB Securities Research July 2013
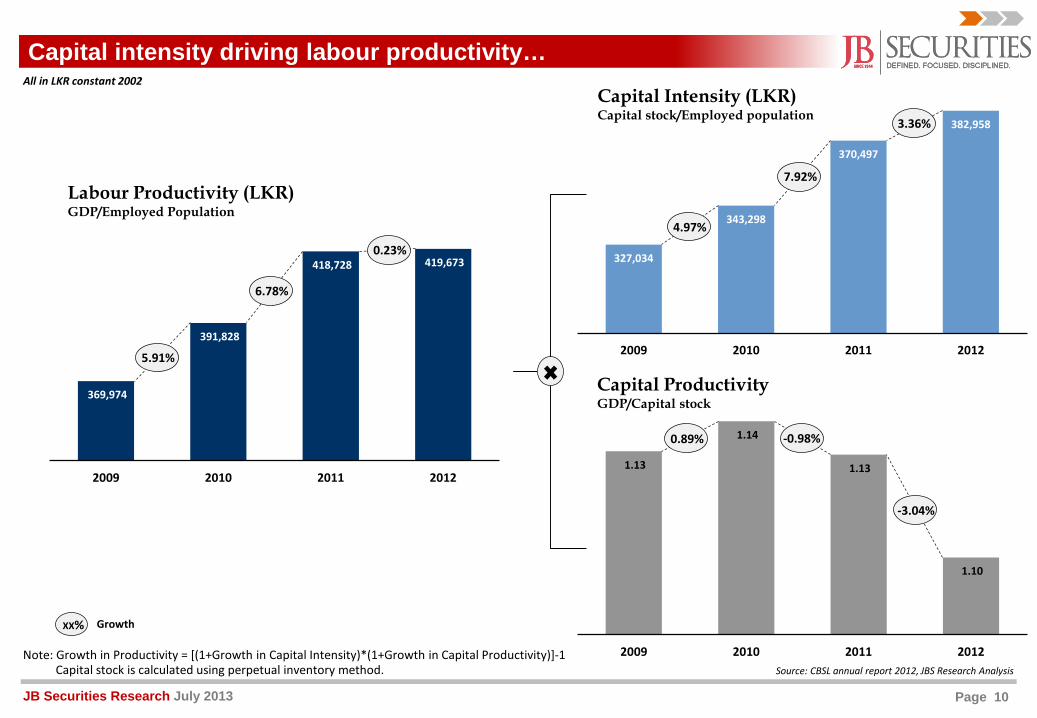
1.13
1.14
1.13
1.10
2009 2010 2011 2012
0.89%
-3.04%
-0.98%
Capital ProductivityGDP/Capital stock
327,034
343,298
370,497
382,958
2009 2010 2011 2012
4.97%
7.92%
3.36%
Capital Intensity (LKR)Capital stock/Employed population
Capital intensity driving labour productivity…
XX% Growth
All in LKR constant 2002
Source: CBSL annual report 2012, JBS Research AnalysisNote: Growth in Productivity = [(1+Growth in Capital Intensity)*(1+Growth in Capital Productivity)]-1
Capital stock is calculated using perpetual inventory method.
369,974
391,828
418,728 419,673
2009 2010 2011 2012
5.91%
6.78%
0.23%
Labour Productivity (LKR)GDP/Employed Population
Page 11JB Securities Research July 2013
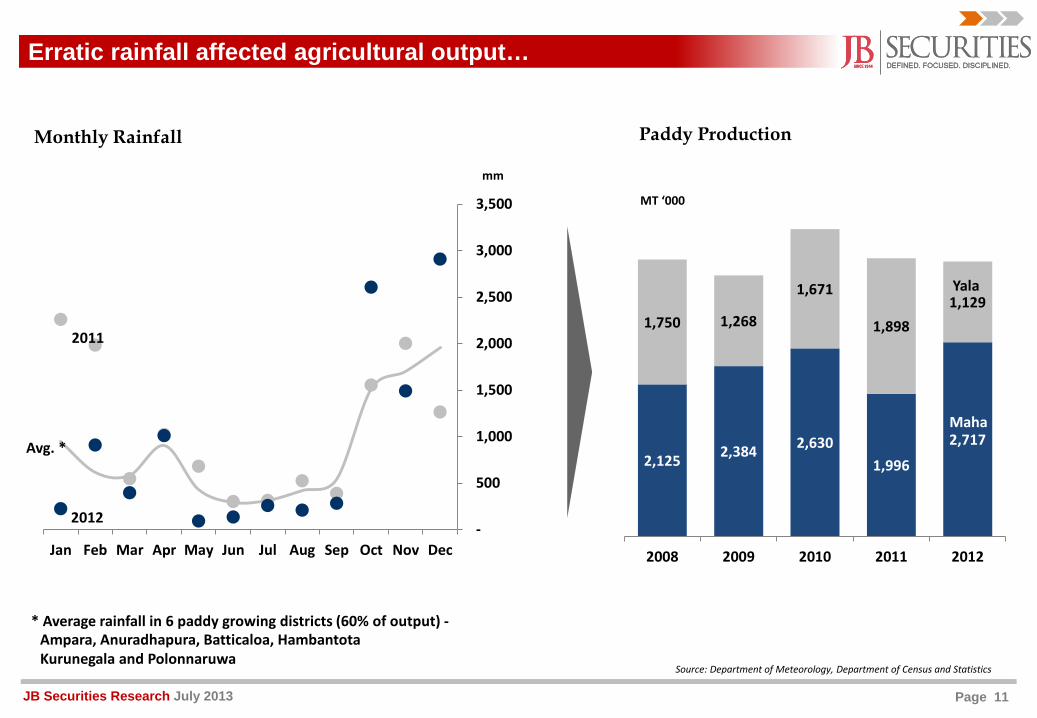
Erratic rainfall affected agricultural output…
2,125 2,384 2,6301,996
2,717
1,750 1,268
1,671
1,8981,129
2008 2009 2010 2011 2012
Paddy Production
-
500
1,000
1,500
2,000
2,500
3,000
3,500
Jan Feb Mar Apr May Jun Jul Aug Sep Oct Nov Dec
mm
Monthly Rainfall
MT ‘000
Yala
Maha
* Average rainfall in 6 paddy growing districts (60% of output) -Ampara, Anuradhapura, Batticaloa, HambantotaKurunegala and Polonnaruwa
2011
2012
Avg. *
Source: Department of Meteorology, Department of Census and Statistics
Page 12JB Securities Research July 2013
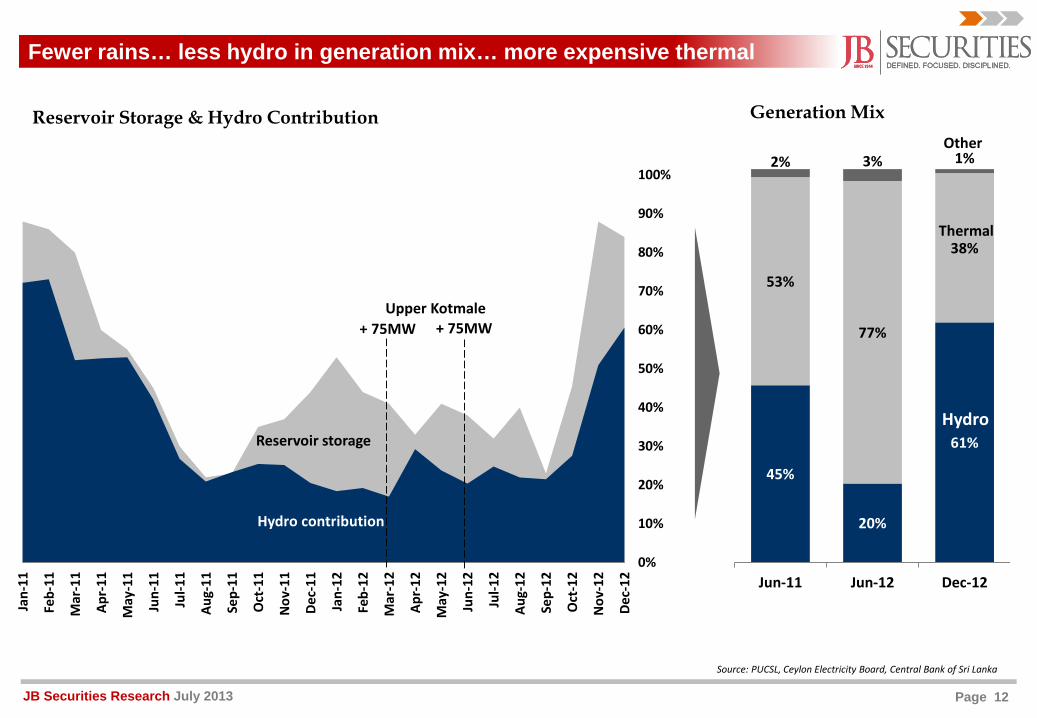
Fewer rains… less hydro in generation mix… more expensive thermal
0%
10%
20%
30%
40%
50%
60%
70%
80%
90%
100%
Jan-
11
Feb-
11
Mar
-11
Apr-
11
May
-11
Jun-
11
Jul-1
1
Aug-
11
Sep-
11
Oct
-11
Nov
-11
Dec-
11
Jan-
12
Feb-
12
Mar
-12
Apr-
12
May
-12
Jun-
12
Jul-1
2
Aug-
12
Sep-
12
Oct
-12
Nov
-12
Dec-
12
Hydro contribution
Reservoir storage
45%
20%
61%
53%
77%
38%
2% 3% 1%
Jun-11 Jun-12 Dec-12
Hydro
Thermal
Other
+ 75MW + 75MWUpper Kotmale
Source: PUCSL, Ceylon Electricity Board, Central Bank of Sri Lanka
Reservoir Storage & Hydro Contribution Generation Mix
Page 13JB Securities Research July 2013
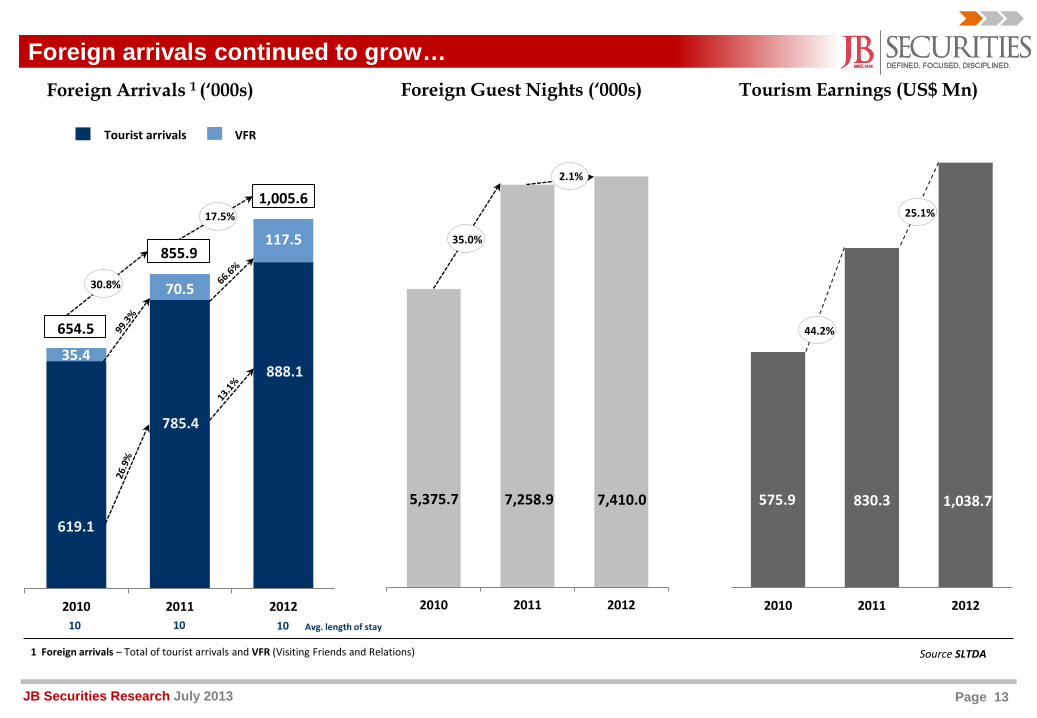
Foreign arrivals continued to grow…
2010 2011 2012
1,005.6
2010 2011 20122010 2011 2012
Foreign Arrivals 1 (‘000s)
Source SLTDA
Foreign Guest Nights (‘000s)
1 Foreign arrivals – Total of tourist arrivals and VFR (Visiting Friends and Relations)
5,375.7 7,410.07,258.9
Tourism Earnings (US$ Mn)
575.9 830.3 1,038.7
619.1
785.4
888.135.4
70.5
117.5
VFRTourist arrivals
10 10 10 Avg. length of stay
855.9
654.5
30.8%
17.5%
35.0%
2.1%
44.2%
25.1%
Page 14JB Securities Research July 2013
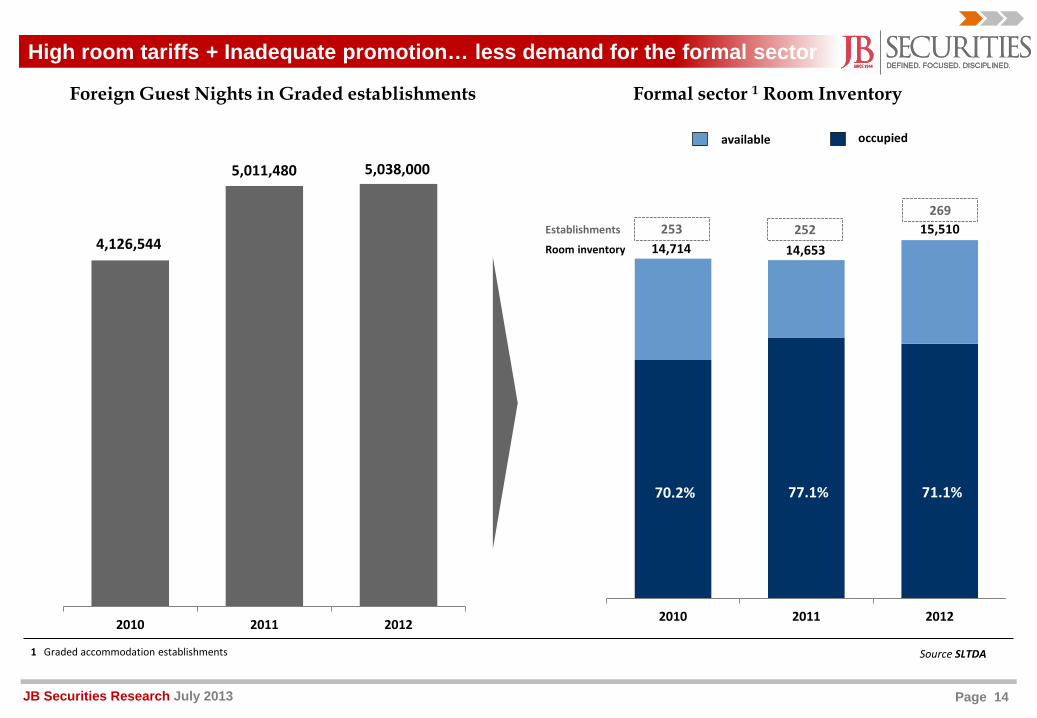
High room tariffs + Inadequate promotion… less demand for the formal sector
2010 2011 2012 2010 2011 2012
Formal sector 1 Room Inventory
70.2%
Foreign Guest Nights in Graded establishments
1 Graded accommodation establishments Source SLTDA
occupiedavailable
77.1% 71.1%
25214,653
26915,510
4,126,544
5,011,480 5,038,000
25314,714
Establishments
Room inventory
Page 15JB Securities Research July 2013
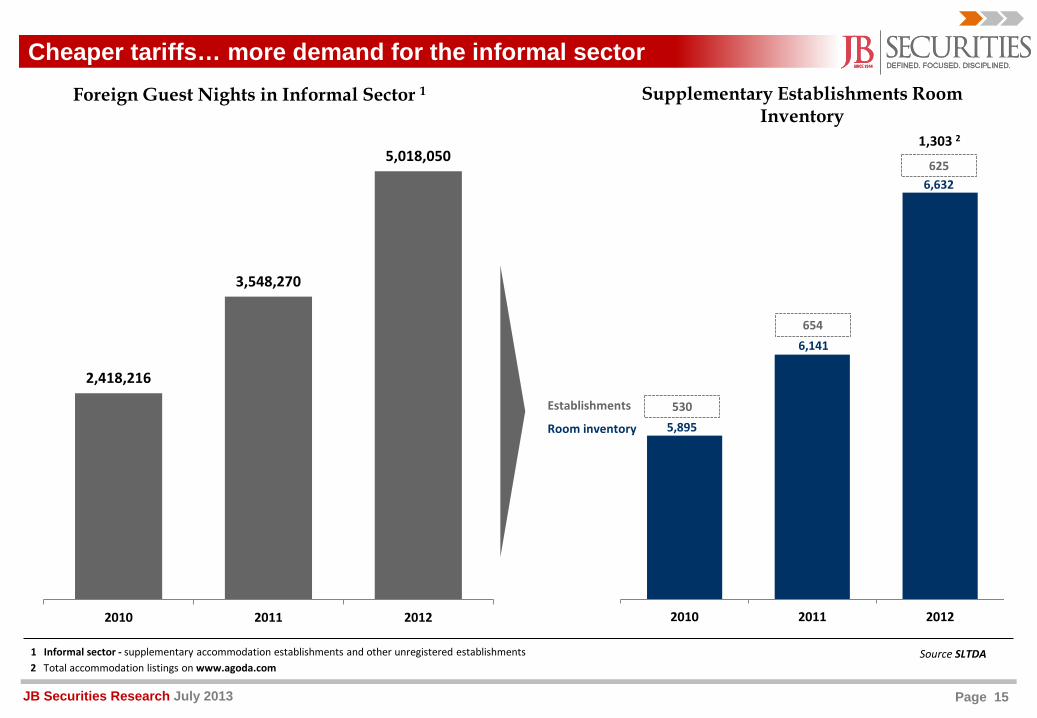
Cheaper tariffs… more demand for the informal sectorSupplementary Establishments Room
Inventory
1 Informal sector - supplementary accommodation establishments and other unregistered establishments Source SLTDA
2,418,216
3,548,270
5,018,050
2010 2011 2012
Foreign Guest Nights in Informal Sector 1
2010 2011 2012
6546,141
6256,632
5305,895
Establishments
Room inventory
1,303 2
2 Total accommodation listings on www.agoda.com
Page 16JB Securities Research July 2013
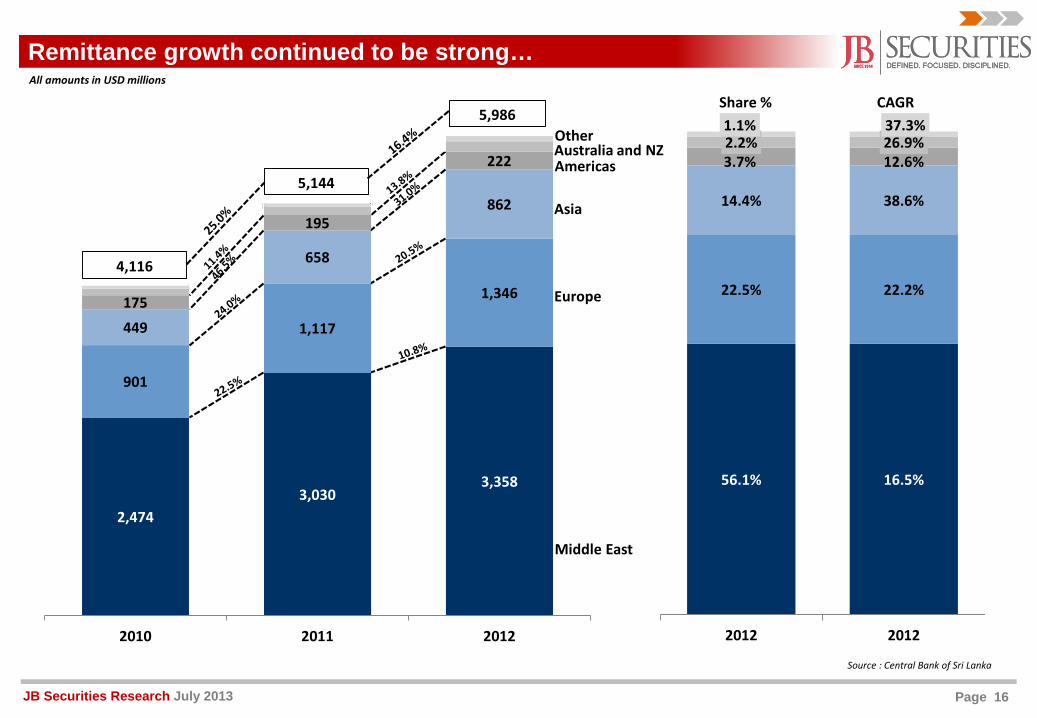
2,4743,030
3,358
901
1,117
1,346
449
658
862
175
195
222
2010 2011 2012
5,144
5,986
56.1% 16.5%
22.5% 22.2%
14.4% 38.6%
3.7% 12.6%2.2% 26.9%1.1% 37.3%
2012 2012
Middle East
Europe
Americas
OtherAustralia and NZ
Asia
Share % CAGRAll amounts in USD millions
4,116
Source : Central Bank of Sri Lanka
Remittance growth continued to be strong…
Page 17JB Securities Research July 2013
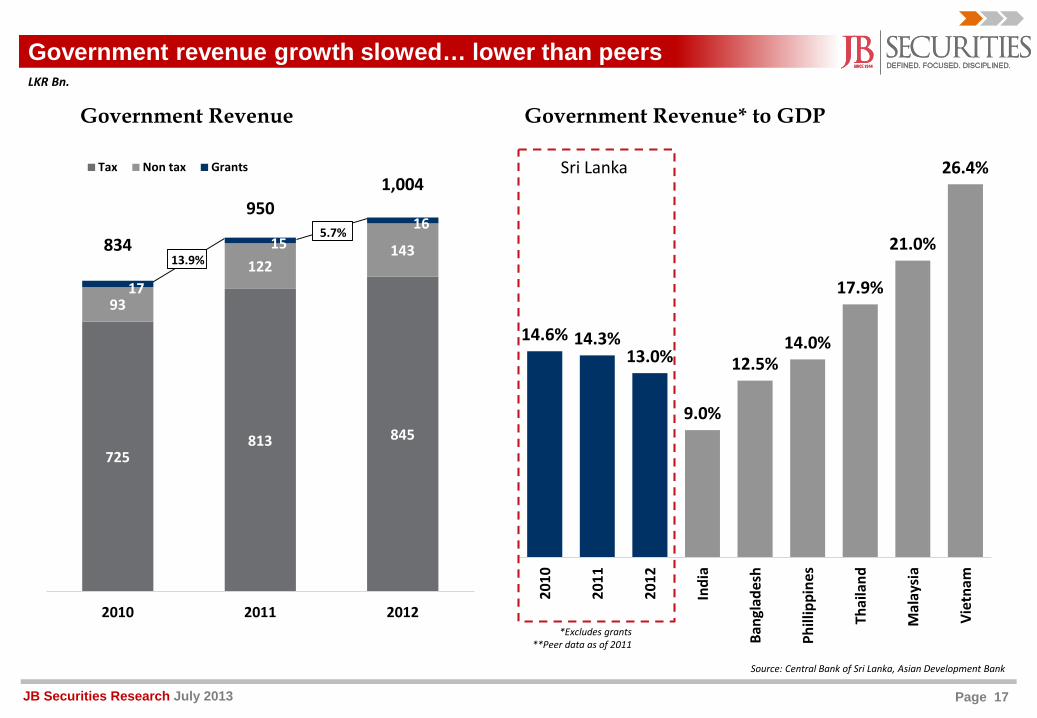
14.6% 14.3%13.0%
9.0%
12.5%14.0%
17.9%
21.0%
26.4%
2010
2011
2012
Indi
a
Bang
lade
sh
Phill
ippi
nes
Thai
land
Mal
aysi
a
Viet
nam
725813 845
93
122143
17
1516
2010 2011 2012
Tax Non tax Grants
Government revenue growth slowed… lower than peers
13.9%
5.7%834
9501,004
*Excludes grants **Peer data as of 2011
Government Revenue Government Revenue* to GDP
LKR Bn.
Source: Central Bank of Sri Lanka, Asian Development Bank
Sri Lanka
Page 18JB Securities Research July 2013
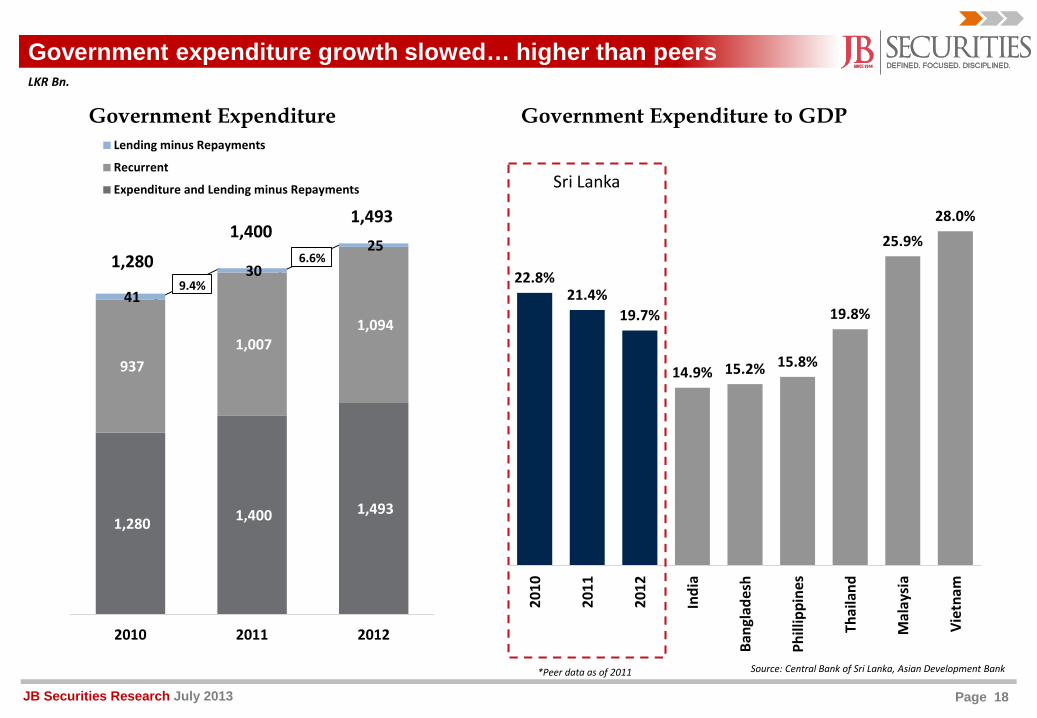
22.8%21.4%
19.7%
14.9% 15.2% 15.8%
19.8%
25.9%28.0%
2010
2011
2012
Indi
a
Bang
lade
sh
Phill
ippi
nes
Thai
land
Mal
aysi
a
Viet
nam
1,280 1,400 1,493
937 1,007
1,094
41
30
25
2010 2011 2012
Lending minus Repayments
Recurrent
Expenditure and Lending minus Repayments
Government expenditure growth slowed… higher than peers
9.4%
6.6%1,280
1,4001,493
Government Expenditure to GDPGovernment Expenditure
Source: Central Bank of Sri Lanka, Asian Development Bank
LKR Bn.
*Peer data as of 2011
Sri Lanka
Page 19JB Securities Research July 2013
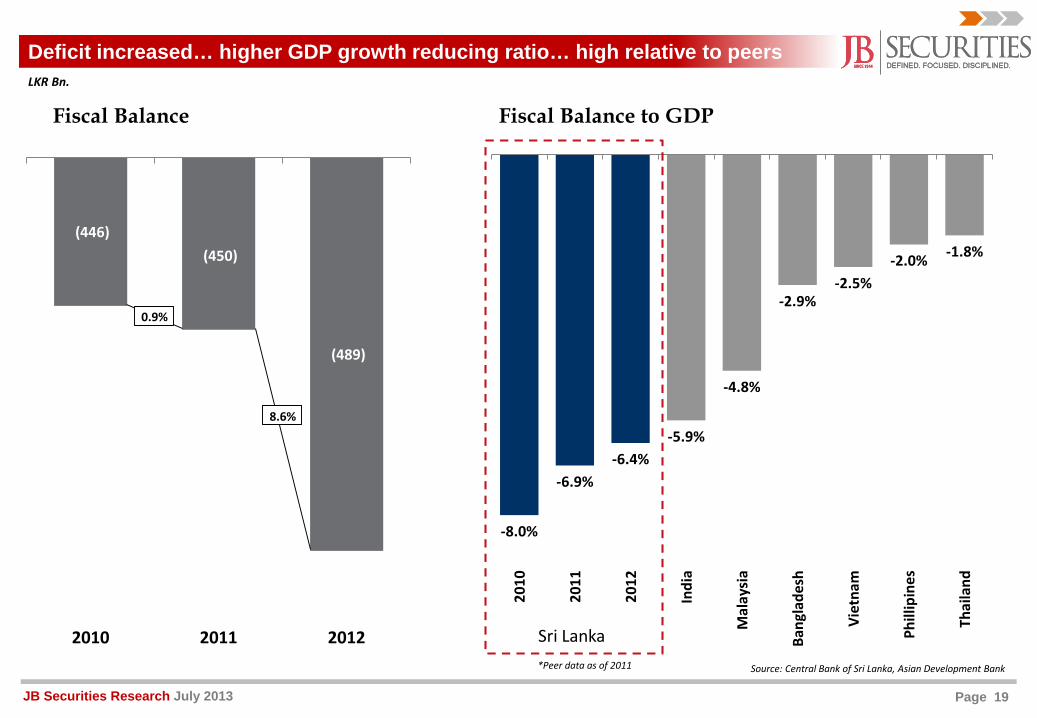
-8.0%
-6.9%-6.4%
-5.9%
-4.8%
-2.9%-2.5%
-2.0% -1.8%
2010
2011
2012
Indi
a
Mal
aysi
a
Bang
lade
sh
Viet
nam
Phill
ipin
es
Thai
land
(446)(450)
(489)
2010 2011 2012
0.9%
8.6%
Deficit increased… higher GDP growth reducing ratio… high relative to peers
Source: Central Bank of Sri Lanka, Asian Development Bank
Fiscal Balance to GDPFiscal Balance
LKR Bn.
*Peer data as of 2011
Sri Lanka
Page 20JB Securities Research July 2013
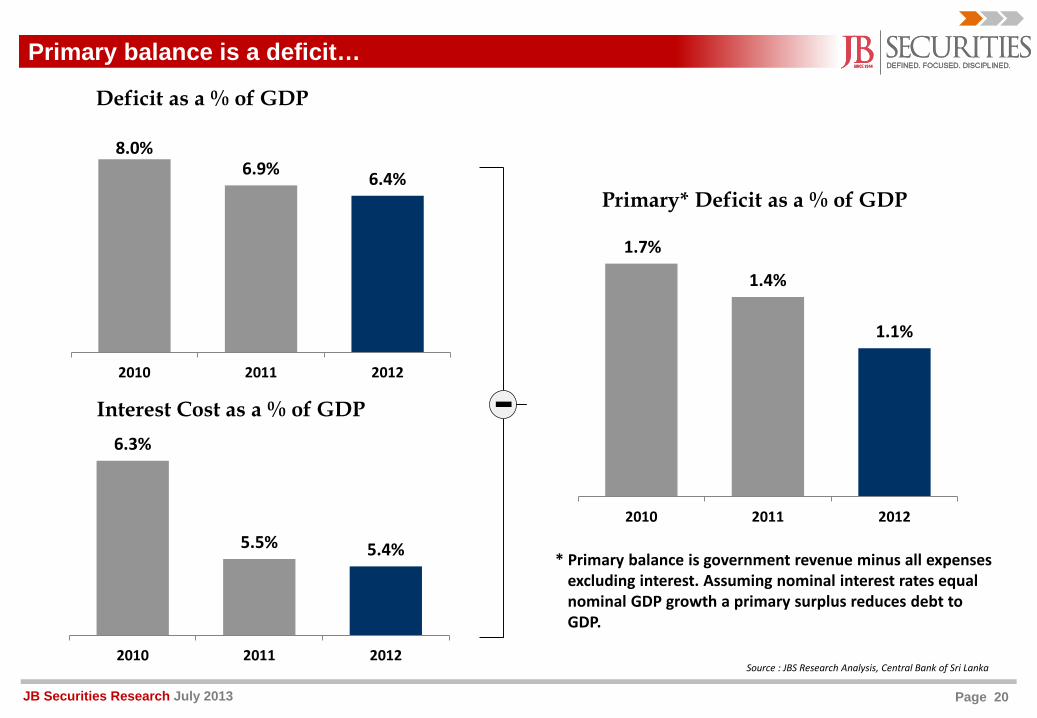
Primary balance is a deficit…
* Primary balance is government revenue minus all expenses excluding interest. Assuming nominal interest rates equal nominal GDP growth a primary surplus reduces debt to GDP.
Deficit as a % of GDP
Interest Cost as a % of GDP
Primary* Deficit as a % of GDP
Source : JBS Research Analysis, Central Bank of Sri Lanka
8.0%6.9% 6.4%
2010 2011 2012
6.3%
5.5% 5.4%
2010 2011 2012
1.7%
1.4%
1.1%
2010 2011 2012
Page 21JB Securities Research July 2013
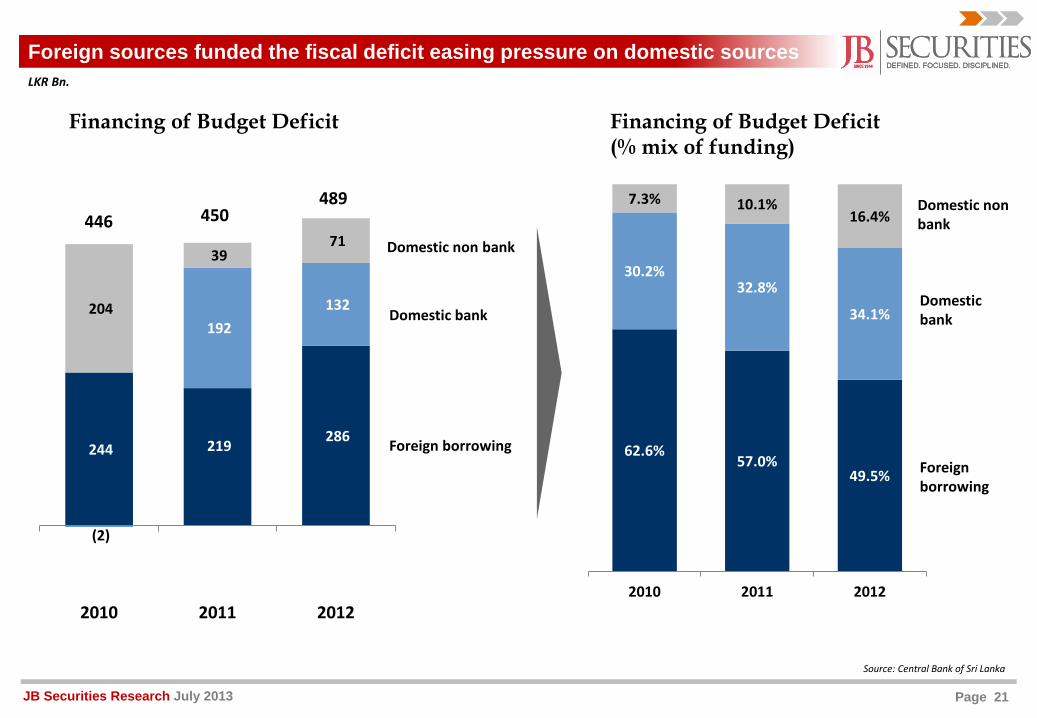
244 219 286
(2)
192 132 204
39 71
2010 2011 2012
Financing of Budget Deficit
Foreign borrowing
Domestic bank
Domestic non bank
LKR Bn.
446 450489
Foreign borrowing
Domestic bank
Domestic non bank
Financing of Budget Deficit (% mix of funding)
Source: Central Bank of Sri Lanka
Foreign sources funded the fiscal deficit easing pressure on domestic sources
62.6%57.0%
49.5%
30.2%32.8%
34.1%
7.3% 10.1%16.4%
2010 2011 2012
Page 22JB Securities Research July 2013
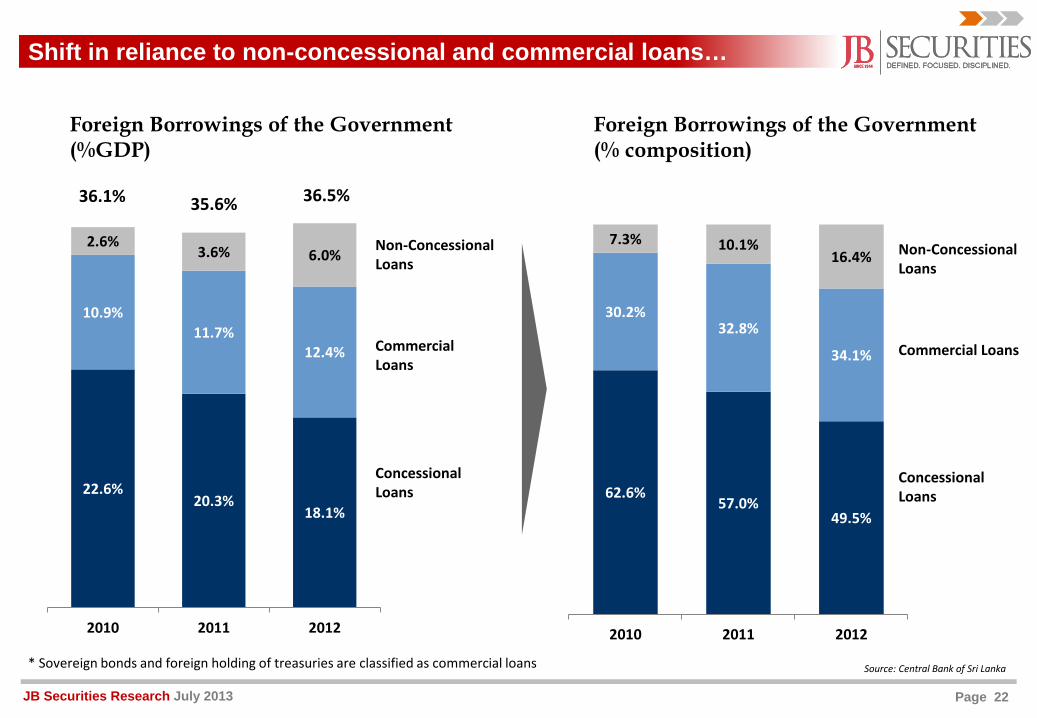
Concessional Loans
Non-Concessional Loans
Commercial Loans
* Sovereign bonds and foreign holding of treasuries are classified as commercial loans
Foreign Borrowings of the Government(%GDP)
Foreign Borrowings of the Government(% composition)
Source: Central Bank of Sri Lanka
Shift in reliance to non-concessional and commercial loans…
22.6%20.3%
18.1%
10.9%11.7%
12.4%
2.6%3.6% 6.0%
2010 2011 2012
36.1% 35.6% 36.5%
Concessional Loans
Non-Concessional Loans
Commercial Loans
62.6%57.0%
49.5%
30.2%32.8%
34.1%
7.3% 10.1%16.4%
2010 2011 2012
Page 23JB Securities Research July 2013
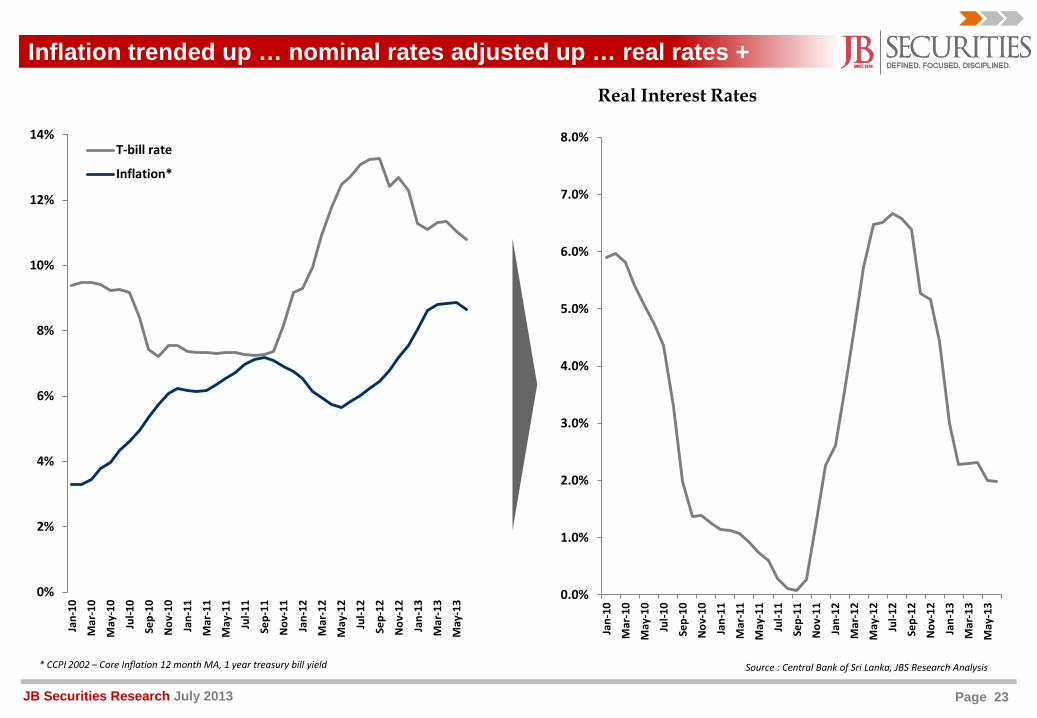
Real Interest Rates
Source : Central Bank of Sri Lanka, JBS Research Analysis* CCPI 2002 – Core Inflation 12 month MA, 1 year treasury bill yield
Inflation trended up … nominal rates adjusted up … real rates +
0.0%
1.0%
2.0%
3.0%
4.0%
5.0%
6.0%
7.0%
8.0%
Jan-
10
Mar
-10
May
-10
Jul-1
0
Sep-
10
Nov
-10
Jan-
11
Mar
-11
May
-11
Jul-1
1
Sep-
11
Nov
-11
Jan-
12
Mar
-12
May
-12
Jul-1
2
Sep-
12
Nov
-12
Jan-
13
Mar
-13
May
-13
0%
2%
4%
6%
8%
10%
12%
14%
Jan-
10
Mar
-10
May
-10
Jul-1
0
Sep-
10
Nov
-10
Jan-
11
Mar
-11
May
-11
Jul-1
1
Sep-
11
Nov
-11
Jan-
12
Mar
-12
May
-12
Jul-1
2
Sep-
12
Nov
-12
Jan-
13
Mar
-13
May
-13
T-bill rate
Inflation*
Page 24JB Securities Research July 2013
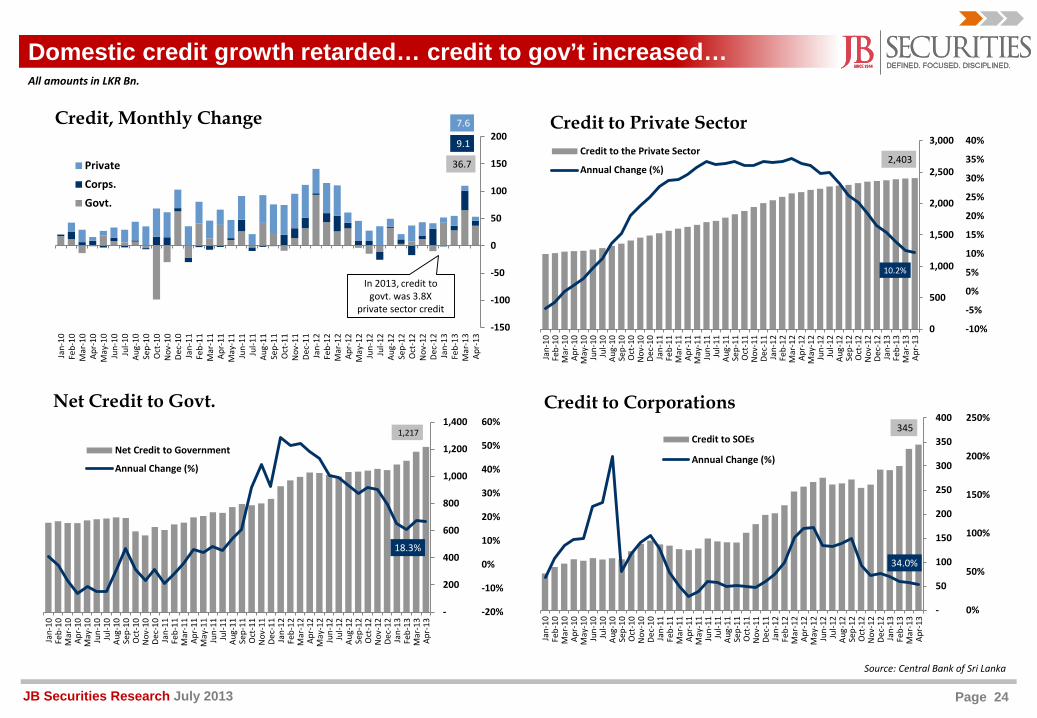
Domestic credit growth retarded… credit to gov’t increased…
Source: Central Bank of Sri Lanka
All amounts in LKR Bn.
In 2013, credit to govt. was 3.8X
private sector credit
36.7
9.1
7.6
-150
-100
-50
0
50
100
150
200
Jan-
10Fe
b-10
Mar
-10
Apr-
10M
ay-1
0Ju
n-10
Jul-1
0Au
g-10
Sep-
10O
ct-1
0N
ov-1
0De
c-10
Jan-
11Fe
b-11
Mar
-11
Apr-
11M
ay-1
1Ju
n-11
Jul-1
1Au
g-11
Sep-
11O
ct-1
1N
ov-1
1De
c-11
Jan-
12Fe
b-12
Mar
-12
Apr-
12M
ay-1
2Ju
n-12
Jul-1
2Au
g-12
Sep-
12O
ct-1
2N
ov-1
2De
c-12
Jan-
13Fe
b-13
Mar
-13
Apr-
13
Credit, Monthly Change
PrivateCorps.Govt.
1,217
18.3%
-20%
-10%
0%
10%
20%
30%
40%
50%
60%
-
200
400
600
800
1,000
1,200
1,400
Jan-
10Fe
b-10
Mar
-10
Apr-
10M
ay-1
0Ju
n-10
Jul-1
0Au
g-10
Sep-
10O
ct-1
0N
ov-1
0De
c-10
Jan-
11Fe
b-11
Mar
-11
Apr-
11M
ay-1
1Ju
n-11
Jul-1
1Au
g-11
Sep-
11O
ct-1
1N
ov-1
1De
c-11
Jan-
12Fe
b-12
Mar
-12
Apr-
12M
ay-1
2Ju
n-12
Jul-1
2Au
g-12
Sep-
12O
ct-1
2N
ov-1
2De
c-12
Jan-
13Fe
b-13
Mar
-13
Apr-
13
Net Credit to Govt.
Net Credit to Government
Annual Change (%)
345
34.0%
0%
50%
100%
150%
200%
250%
-
50
100
150
200
250
300
350
400
Jan-
10Fe
b-10
Mar
-10
Apr-
10M
ay-1
0Ju
n-10
Jul-1
0Au
g-10
Sep-
10O
ct-1
0N
ov-1
0De
c-10
Jan-
11Fe
b-11
Mar
-11
Apr-
11M
ay-1
1Ju
n-11
Jul-1
1Au
g-11
Sep-
11O
ct-1
1N
ov-1
1De
c-11
Jan-
12Fe
b-12
Mar
-12
Apr-
12M
ay-1
2Ju
n-12
Jul-1
2Au
g-12
Sep-
12O
ct-1
2N
ov-1
2De
c-12
Jan-
13Fe
b-13
Mar
-13
Apr-
13
Credit to Corporations
Credit to SOEs
Annual Change (%)
2,403
10.2%
-10%
-5%
0%
5%
10%
15%
20%
25%
30%
35%
40%
0
500
1,000
1,500
2,000
2,500
3,000
Jan-
10Fe
b-10
Mar
-10
Apr-
10M
ay-1
0Ju
n-10
Jul-1
0Au
g-10
Sep-
10O
ct-1
0N
ov-1
0De
c-10
Jan-
11Fe
b-11
Mar
-11
Apr-
11M
ay-1
1Ju
n-11
Jul-1
1Au
g-11
Sep-
11O
ct-1
1N
ov-1
1De
c-11
Jan-
12Fe
b-12
Mar
-12
Apr-
12M
ay-1
2Ju
n-12
Jul-1
2Au
g-12
Sep-
12O
ct-1
2N
ov-1
2De
c-12
Jan-
13Fe
b-13
Mar
-13
Apr-
13
Credit to Private SectorCredit to the Private Sector
Annual Change (%)
Page 25JB Securities Research July 2013
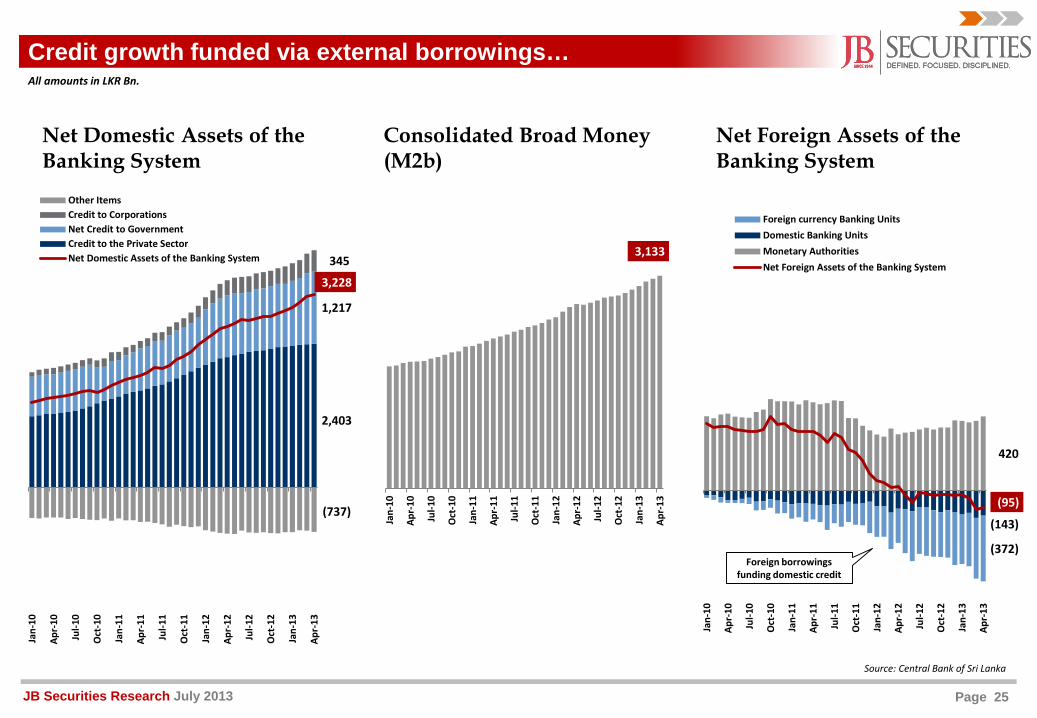
Credit growth funded via external borrowings…All amounts in LKR Bn.
Source: Central Bank of Sri Lanka
Net Foreign Assets of the Banking System
420
(143)
(372)
(95)
Jan-
10
Apr-
10
Jul-1
0
Oct
-10
Jan-
11
Apr-
11
Jul-1
1
Oct
-11
Jan-
12
Apr-
12
Jul-1
2
Oct
-12
Jan-
13
Apr-
13
Foreign currency Banking UnitsDomestic Banking UnitsMonetary AuthoritiesNet Foreign Assets of the Banking System
Consolidated Broad Money (M2b)
3,133
Jan-
10
Apr-
10
Jul-1
0
Oct
-10
Jan-
11
Apr-
11
Jul-1
1
Oct
-11
Jan-
12
Apr-
12
Jul-1
2
Oct
-12
Jan-
13
Apr-
13
Net Domestic Assets of the Banking System
2,403
1,217
345
(737)
3,228
Jan-
10
Apr-
10
Jul-1
0
Oct
-10
Jan-
11
Apr-
11
Jul-1
1
Oct
-11
Jan-
12
Apr-
12
Jul-1
2
Oct
-12
Jan-
13
Apr-
13
Other ItemsCredit to CorporationsNet Credit to GovernmentCredit to the Private SectorNet Domestic Assets of the Banking System
Foreign borrowings funding domestic credit
Page 26JB Securities Research July 2013
457406
222
12
-4
6
116173
121
30119
6
2011 2012 Apr-13
LKR Deposits
LKR Borrowings
FCY Borrowings
FCY Deposits
515434
60-36
2
111
108
42
3 142
221
8
-4
4
2011 2012 Apr-13
LKR LoansDebt securities and othersFCY LoansGovernment SecuritiesShares and Unit trusts
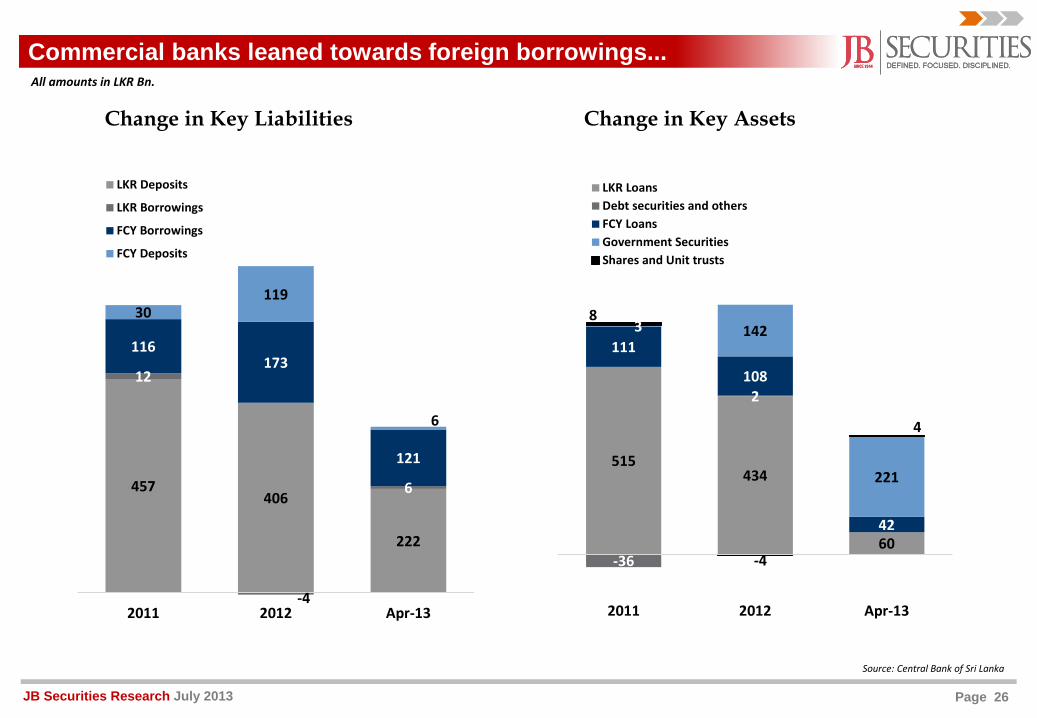
Change in Key Liabilities Change in Key Assets
Commercial banks leaned towards foreign borrowings...All amounts in LKR Bn.
Source: Central Bank of Sri Lanka
Page 27JB Securities Research July 2013
5%
7%
9%
11%
13%
15%
17%
30-D
ec-1
109
-Jan-
1218
-Jan-
1226
-Jan-
1203
-Feb
-12
15-F
eb-1
224
-Feb
-12
05-M
ar-1
215
-Mar
-12
23-M
ar-1
202
-Apr
-12
11-A
pr-1
223
-Apr
-12
02-M
ay-1
211
-May
-12
21-M
ay-1
229
-May
-12
07-Ju
n-12
15-Ju
n-12
25-Ju
n-12
04-Ju
l-12
12-Ju
l-12
20-Ju
l-12
30-Ju
l-12
08-A
ug-1
216
-Aug
-12
24-A
ug-1
204
-Sep
-12
12-S
ep-1
220
-Sep
-12
01-O
ct-1
209
-Oct
-12
17-O
ct-1
225
-Oct
-12
05-N
ov-1
214
-Nov
-12
22-N
ov-1
203
-Dec
-12
11-D
ec-1
219
-Dec
-12
31-D
ec-1
208
-Jan-
1317
-Jan-
1328
-Jan-
1307
-Feb
-13
15-F
eb-1
326
-Feb
-13
07-M
ar-1
315
-Mar
-13
25-M
ar-1
304
-Apr
-13
12-A
pr-1
323
-Apr
-13
03-M
ay-1
313
-May
-13
21-M
ay-1
330
-May
-13
07-Ju
n-13
17-Ju
n-13
25-Ju
n-13
03-Ju
l-13
11-Ju
l-13
19-Ju
l-13
Repo Reverse Repo AWPLR AWDR Call Money Rate
SLIBOR(1 month) T bill(3month) gross T bill(3month) AWFDR AWLR
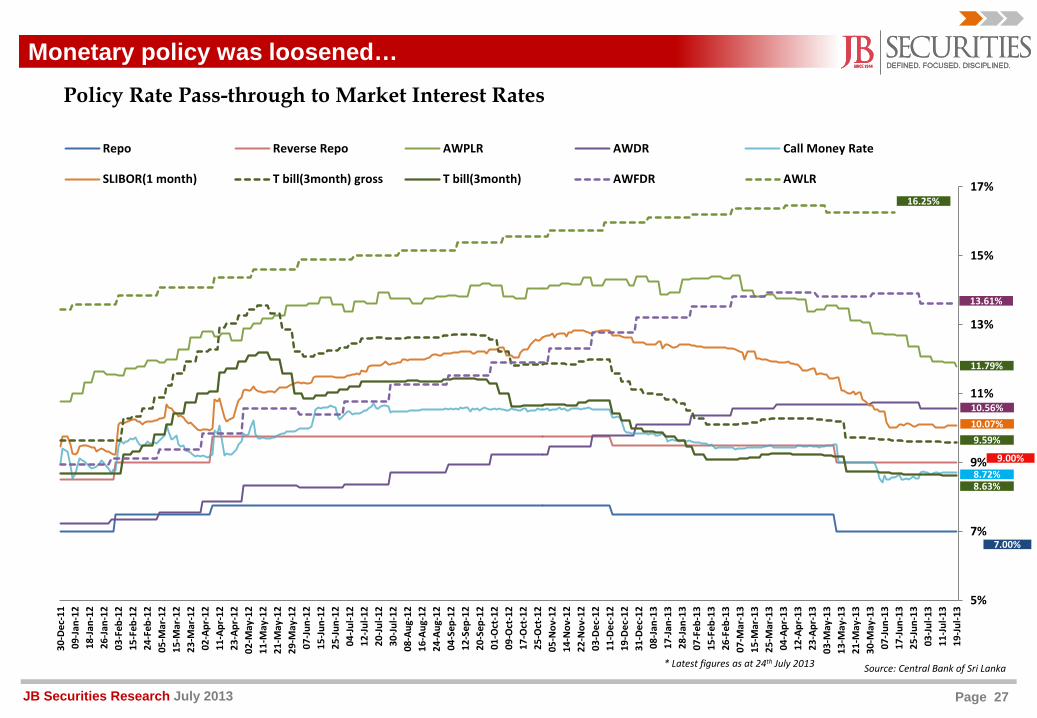
Policy Rate Pass-through to Market Interest Rates
Monetary policy was loosened…
Source: Central Bank of Sri Lanka
7.00%
9.00%
10.07%
11.79%
10.56%
8.72%
9.59%
8.63%
13.61%
16.25%
* Latest figures as at 24th July 2013
Page 28JB Securities Research July 2013
10%
11%
12%
13%
14%
15%
16%
17%
30-D
ec-1
109
-Jan-
1218
-Jan-
1226
-Jan-
1203
-Feb
-12
15-F
eb-1
224
-Feb
-12
05-M
ar-1
215
-Mar
-12
23-M
ar-1
202
-Apr
-12
11-A
pr-1
223
-Apr
-12
02-M
ay-1
211
-May
-12
21-M
ay-1
229
-May
-12
07-Ju
n-12
15-Ju
n-12
25-Ju
n-12
04-Ju
l-12
12-Ju
l-12
20-Ju
l-12
30-Ju
l-12
08-A
ug-1
216
-Aug
-12
24-A
ug-1
204
-Sep
-12
12-S
ep-1
220
-Sep
-12
01-O
ct-1
209
-Oct
-12
17-O
ct-1
225
-Oct
-12
05-N
ov-1
214
-Nov
-12
22-N
ov-1
203
-Dec
-12
11-D
ec-1
219
-Dec
-12
31-D
ec-1
208
-Jan-
1317
-Jan-
1328
-Jan-
1307
-Feb
-13
15-F
eb-1
326
-Feb
-13
07-M
ar-1
315
-Mar
-13
25-M
ar-1
304
-Apr
-13
12-A
pr-1
323
-Apr
-13
03-M
ay-1
313
-May
-13
21-M
ay-1
330
-May
-13
07-Ju
n-13
17-Ju
n-13
25-Ju
n-13
03-Ju
l-13
11-Ju
l-13
19-Ju
l-13
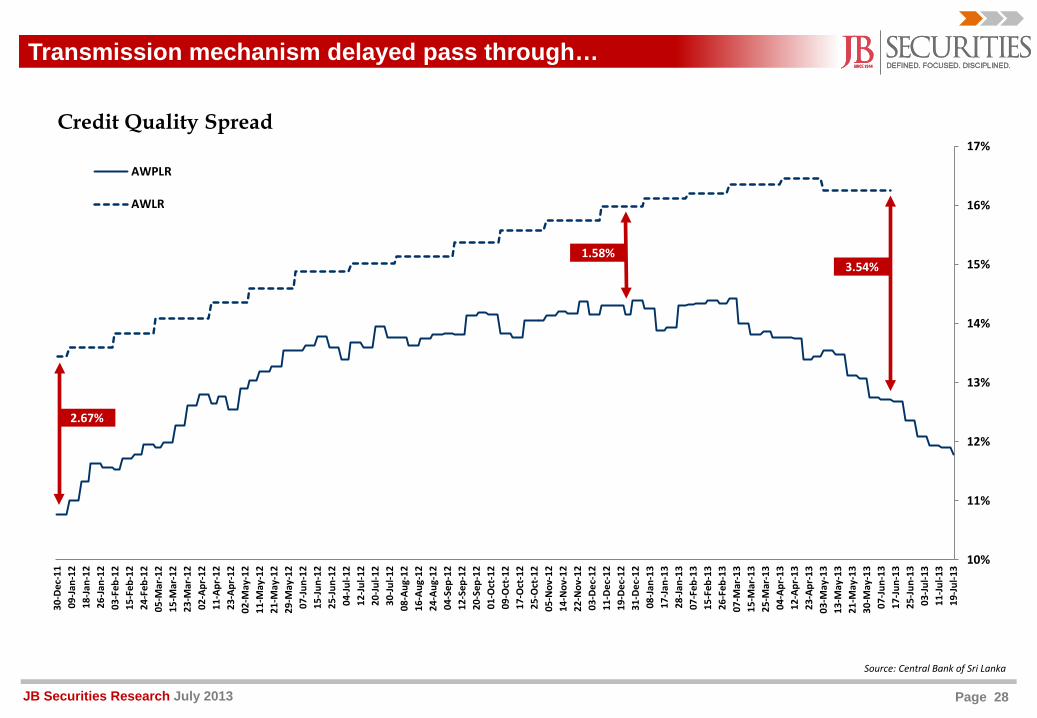
AWPLR
AWLR
3.54%1.58%
2.67%
Credit Quality Spread
Transmission mechanism delayed pass through…
Source: Central Bank of Sri Lanka
Page 29JB Securities Research July 2013
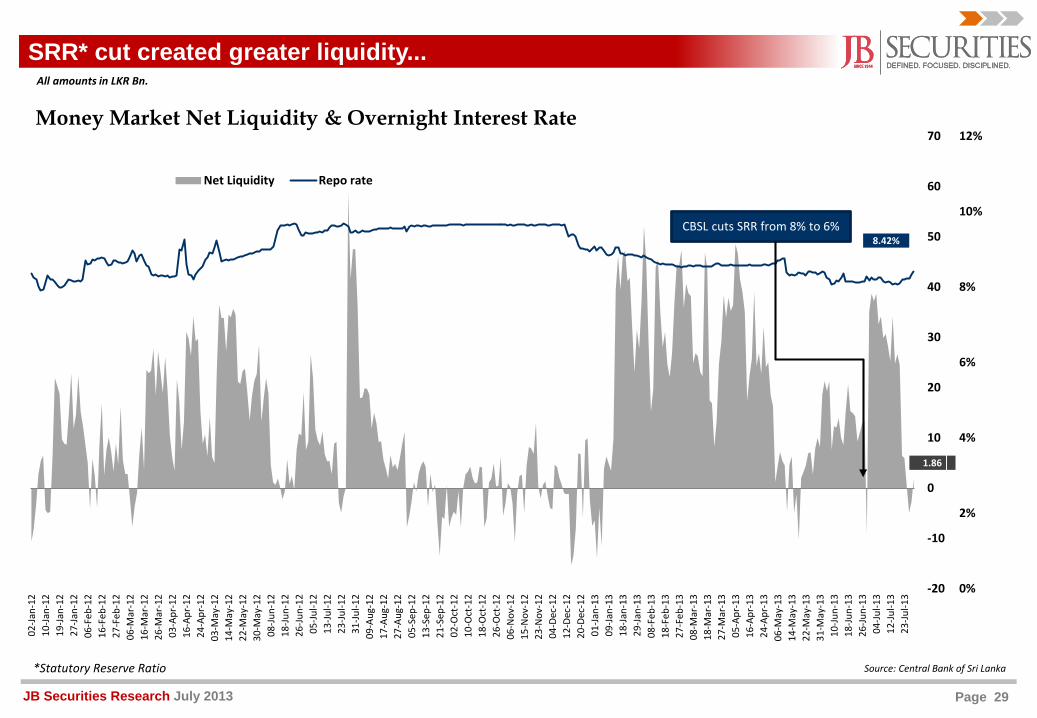
SRR* cut created greater liquidity...
8.42%
Money Market Net Liquidity & Overnight Interest Rate
Source: Central Bank of Sri Lanka
All amounts in LKR Bn.
*Statutory Reserve Ratio
1.86
0%
2%
4%
6%
8%
10%
12%
-20
-10
0
10
20
30
40
50
60
70
02-Ja
n-12
10-Ja
n-12
19-Ja
n-12
27-Ja
n-12
06-F
eb-1
216
-Feb
-12
27-F
eb-1
206
-Mar
-12
16-M
ar-1
226
-Mar
-12
03-A
pr-1
216
-Apr
-12
24-A
pr-1
203
-May
-12
14-M
ay-1
222
-May
-12
30-M
ay-1
208
-Jun-
1218
-Jun-
1226
-Jun-
1205
-Jul-1
213
-Jul-1
223
-Jul-1
231
-Jul-1
209
-Aug
-12
17-A
ug-1
227
-Aug
-12
05-S
ep-1
213
-Sep
-12
21-S
ep-1
202
-Oct
-12
10-O
ct-1
218
-Oct
-12
26-O
ct-1
206
-Nov
-12
15-N
ov-1
223
-Nov
-12
04-D
ec-1
212
-Dec
-12
20-D
ec-1
201
-Jan-
1309
-Jan-
1318
-Jan-
1329
-Jan-
1308
-Feb
-13
18-F
eb-1
327
-Feb
-13
08-M
ar-1
318
-Mar
-13
27-M
ar-1
305
-Apr
-13
16-A
pr-1
324
-Apr
-13
06-M
ay-1
314
-May
-13
22-M
ay-1
331
-May
-13
10-Ju
n-13
18-Ju
n-13
26-Ju
n-13
04-Ju
l-13
12-Ju
l-13
23-Ju
l-13
Net Liquidity Repo rate
CBSL cuts SRR from 8% to 6%
Page 30JB Securities Research July 2013
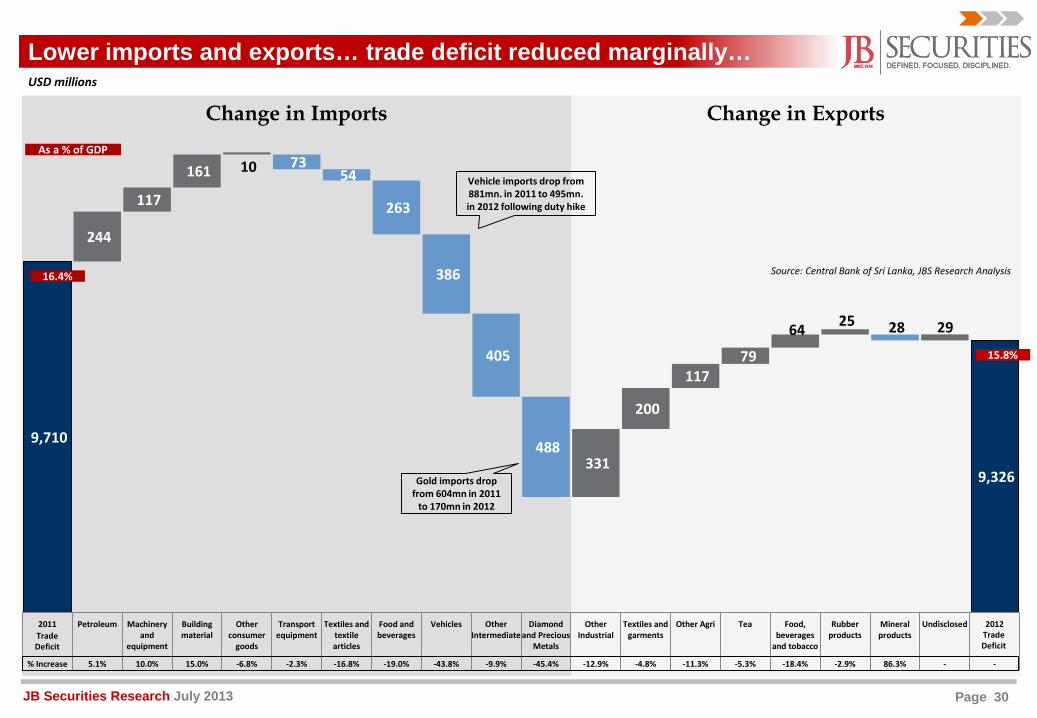
Change in Imports Change in Exports
9,710
9,326
244
117
161 10 73 54
263
386
405
488 331
200
117 79
64 25 28 29
2011 Petroleum Machineryand
equipment
Buildingmaterial
Otherconsumer
goods
Transportequipment
Textiles andtextilearticles
Food andbeverages
Vehicles OtherIntermediate
Diamondand Precious
Metals
OtherIndustrial
Textiles andgarments
Other Agri Tea Food,beverages
and tobacco
Rubberproducts
Mineralproducts
Undisclosed 2012
% Increase 5.1% 10.0% 15.0% -6.8% -2.3% -16.8% -19.0% -43.8% -9.9% -45.4% -12.9% -4.8% -11.3% -5.3% -18.4% -2.9% 86.3% - -
Trade Deficit
Trade Deficit
Lower imports and exports… trade deficit reduced marginally…USD millions
As a % of GDP
16.4%
15.8%
Gold imports drop from 604mn in 2011
to 170mn in 2012
Vehicle imports drop from 881mn. in 2011 to 495mn. in 2012 following duty hike
Source: Central Bank of Sri Lanka, JBS Research Analysis
Page 31JB Securities Research July 2013
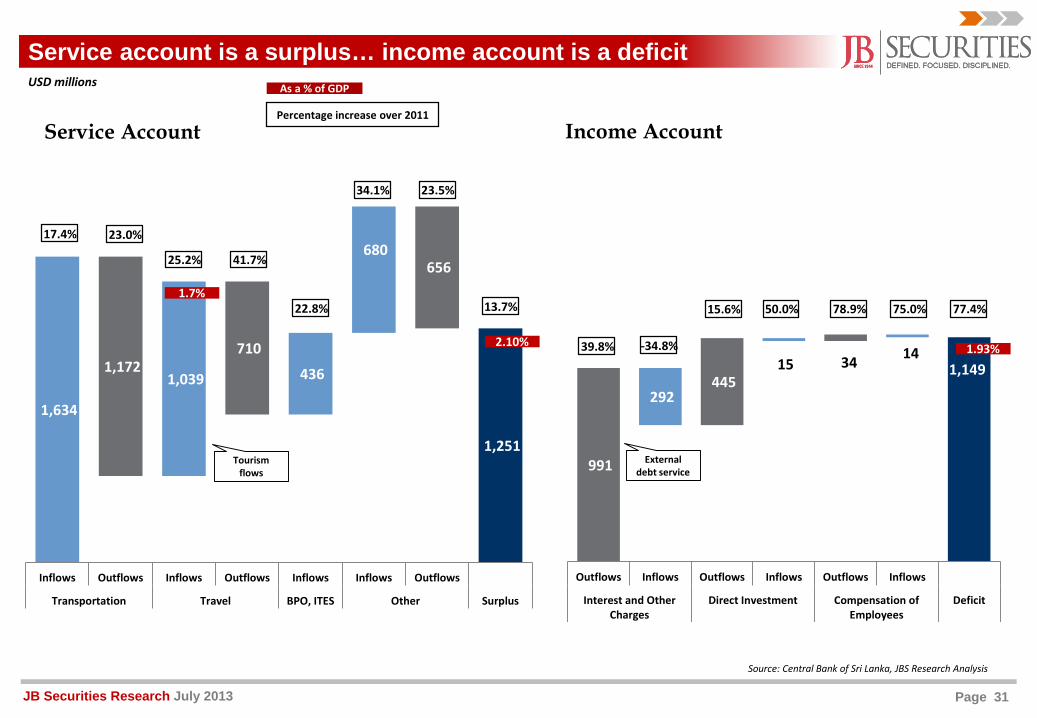
Service account is a surplus… income account is a deficit
Source: Central Bank of Sri Lanka, JBS Research Analysis
1,634
1,251
1,172 1,039
710
436
680 656
Inflows Outflows Inflows Outflows Inflows Inflows Outflows
Transportation Travel BPO, ITES Other Surplus
991
1,149
292 445
15 34 14
Outflows Inflows Outflows Inflows Outflows Inflows
Interest and OtherCharges
Direct Investment Compensation ofEmployees
Deficit
Income AccountService Account
USD millions
23.0%17.4%
41.7%
34.1% 23.5%
78.9% 75.0% 77.4%
25.2%
22.8% 50.0%15.6%
-34.8%39.8%
13.7%
Tourism flows
External debt service
As a % of GDP
2.10% 1.93%
1.7%
Percentage increase over 2011
Page 32JB Securities Research July 2013
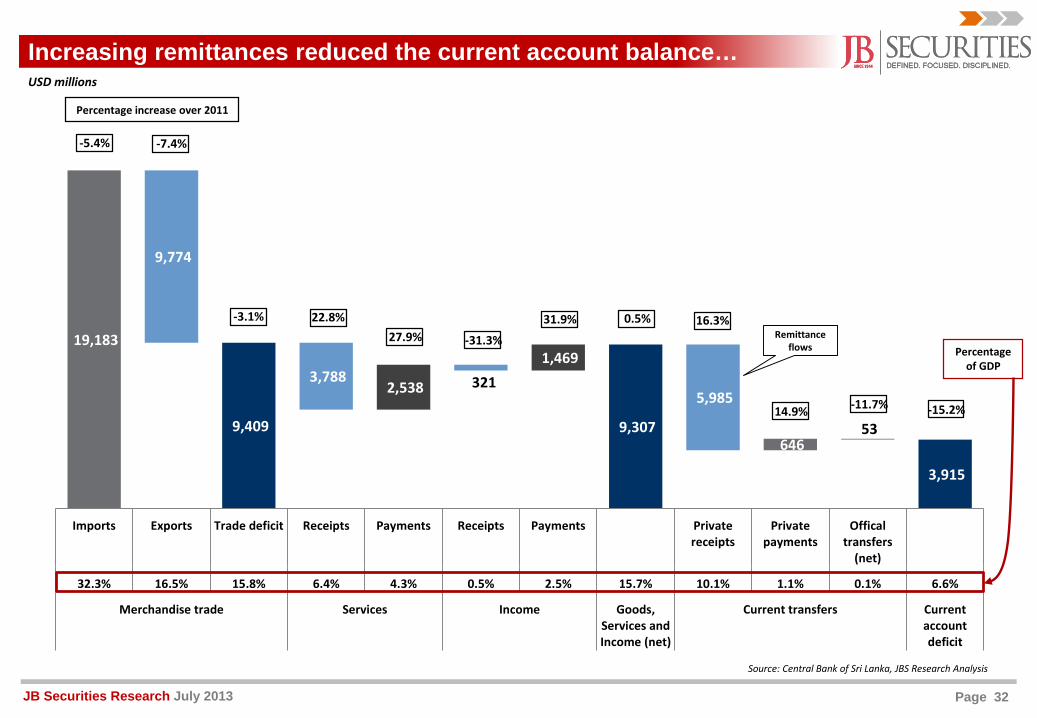
19,183
9,409 9,307
3,915
9,774
3,788 2,538 321
1,469
5,985
646 53
Imports Exports Trade deficit Receipts Payments Receipts Payments Privatereceipts
Privatepayments
Officaltransfers
(net)
32.3% 16.5% 15.8% 6.4% 4.3% 0.5% 2.5% 15.7% 10.1% 1.1% 0.1% 6.6%
Merchandise trade Services Income Goods,Services andIncome (net)
Current transfers Currentaccountdeficit
Increasing remittances reduced the current account balance…
Source: Central Bank of Sri Lanka, JBS Research Analysis
-7.4%-5.4%
27.9%16.3%22.8%-3.1%
14.9% -11.7% -15.2%
-31.3%
31.9% 0.5%
USD millions
Remittance flows
Percentage increase over 2011
Percentage of GDP
Page 33JB Securities Research July 2013
7.0%
7.5%
8.0%
8.5%
9.0%
9.5%
10.0%
10.5%
11.0%
11.5%
12.0%
12.5%
13.0%
50
60
70
80
90
100
110
5-Ja
n-11
5-M
ar-1
1
5-M
ay-1
1
5-Ju
l-11
5-Se
p-11
5-N
ov-1
1
5-Ja
n-12
5-M
ar-1
2
5-M
ay-1
2
5-Ju
l-12
5-Se
p-12
5-N
ov-1
2
5-Ja
n-13
5-M
ar-1
3
5-M
ay-1
3
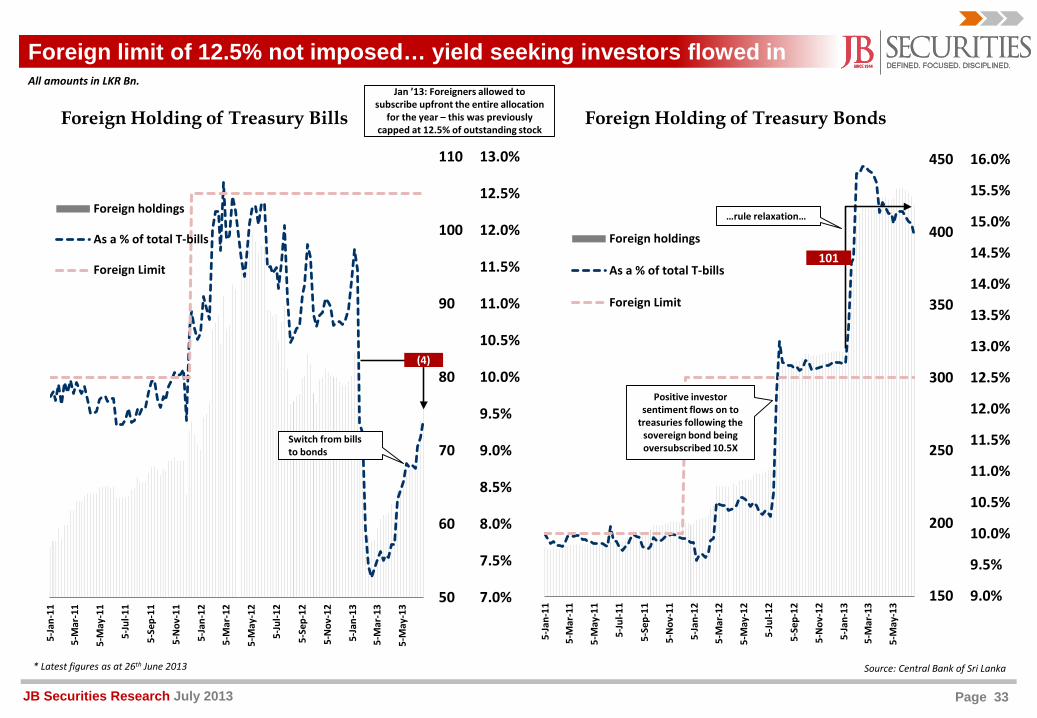
Foreign holdings
As a % of total T-bills
Foreign Limit
Switch from bills to bonds
9.0%
9.5%
10.0%
10.5%
11.0%
11.5%
12.0%
12.5%
13.0%
13.5%
14.0%
14.5%
15.0%
15.5%
16.0%
150
200
250
300
350
400
450
5-Ja
n-11
5-M
ar-1
1
5-M
ay-1
1
5-Ju
l-11
5-Se
p-11
5-N
ov-1
1
5-Ja
n-12
5-M
ar-1
2
5-M
ay-1
2
5-Ju
l-12
5-Se
p-12
5-N
ov-1
2
5-Ja
n-13
5-M
ar-1
3
5-M
ay-1
3
Foreign holdings
As a % of total T-bills
Foreign Limit
Positive investor sentiment flows on to
treasuries following the sovereign bond being oversubscribed 10.5X
…rule relaxation…
Jan ’13: Foreigners allowed to subscribe upfront the entire allocation
for the year – this was previously capped at 12.5% of outstanding stock
Foreign Holding of Treasury BondsForeign Holding of Treasury Bills
Foreign limit of 12.5% not imposed… yield seeking investors flowed in
Source: Central Bank of Sri Lanka
All amounts in LKR Bn.
(4)
* Latest figures as at 26th June 2013
101
Page 34JB Securities Research July 2013
75
80
85
90
95
100
105
95
100
105
110
115
120
125
130
135
140
Jan
11Fe
b 11
Mar
11
Apr 1
1M
ay 1
1Ju
n 11
Jul 1
1Au
g 11
Sep
11O
ct 1
1N
ov 1
1De
c 11
Jan
12Fe
b 12
Mar
12
Apr 1
2M
ay 1
2Ju
n 12
Jul 1
2Au
g 12
Sep
12O
ct 1
2N
ov 1
2De
c 12
Jan
13Fe
b 13
Mar
13
Apr 1
3M
ay 1
3Ju
n 13
Jul 1
3
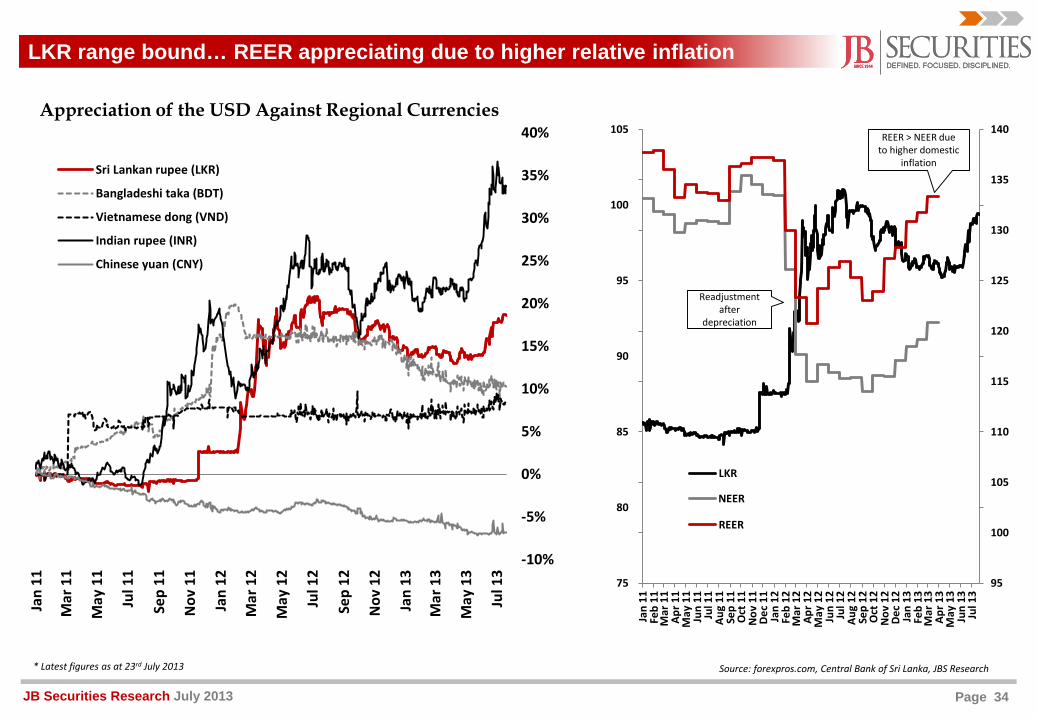
REER
NEER
LKR
Appreciation of the USD Against Regional Currencies
LKR range bound… REER appreciating due to higher relative inflation
Source: forexpros.com, Central Bank of Sri Lanka, JBS Research
REER > NEER due to higher domestic
inflation
Readjustment after
depreciation
-10%
-5%
0%
5%
10%
15%
20%
25%
30%
35%
40%
Jan
11
Mar
11
May
11
Jul 1
1
Sep
11
Nov
11
Jan
12
Mar
12
May
12
Jul 1
2
Sep
12
Nov
12
Jan
13
Mar
13
May
13
Jul 1
3
Sri Lankan rupee (LKR)
Bangladeshi taka (BDT)
Vietnamese dong (VND)
Indian rupee (INR)
Chinese yuan (CNY)
* Latest figures as at 23rd July 2013
Page 35JB Securities Research July 2013
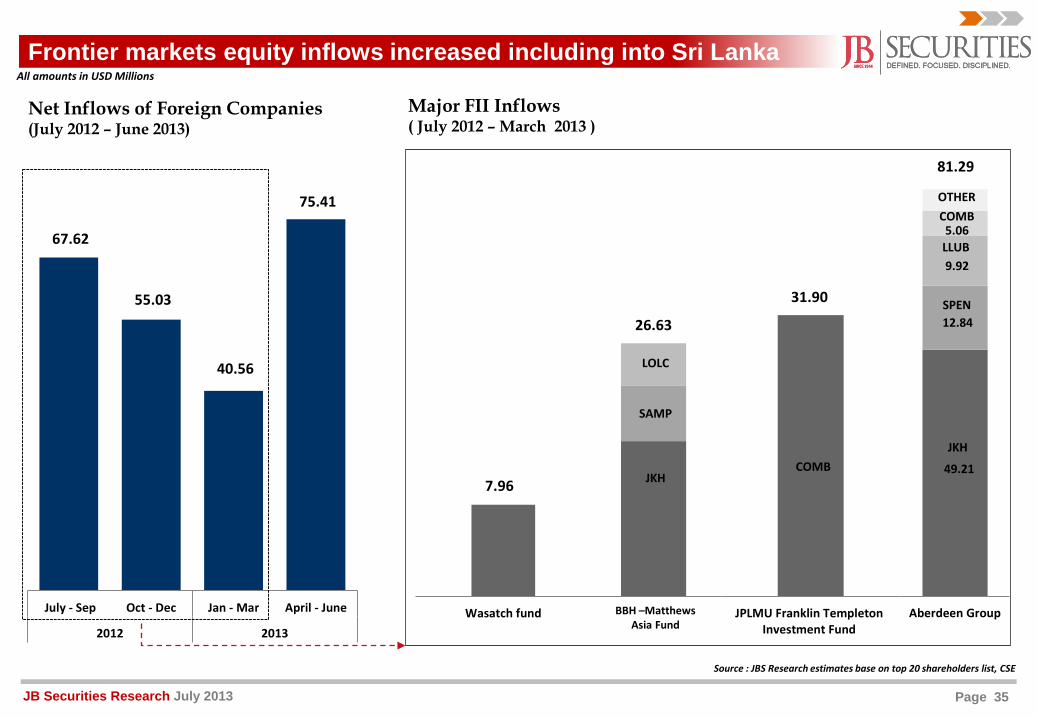
Frontier markets equity inflows increased including into Sri Lanka
67.62
55.03
40.56
75.41
July - Sep Oct - Dec Jan - Mar April - June
2012 2013
Net Inflows of Foreign Companies (July 2012 – June 2013)
Major FII Inflows ( July 2012 – March 2013 )
Source : JBS Research estimates base on top 20 shareholders list, CSE
Aberdeen Group
12.84
9.92
5.06
JKH
SPEN
LLUB
COMBOTHER
81.29
49.21JKH
SAMP
LOLC
16.33
5.87
4.42
BBH –Matthews Asia Fund
26.63
JPLMU Franklin TempletonInvestment Fund
31.90
COMB
Wasatch fund
7.96
All amounts in USD Millions
Page 36JB Securities Research July 2013
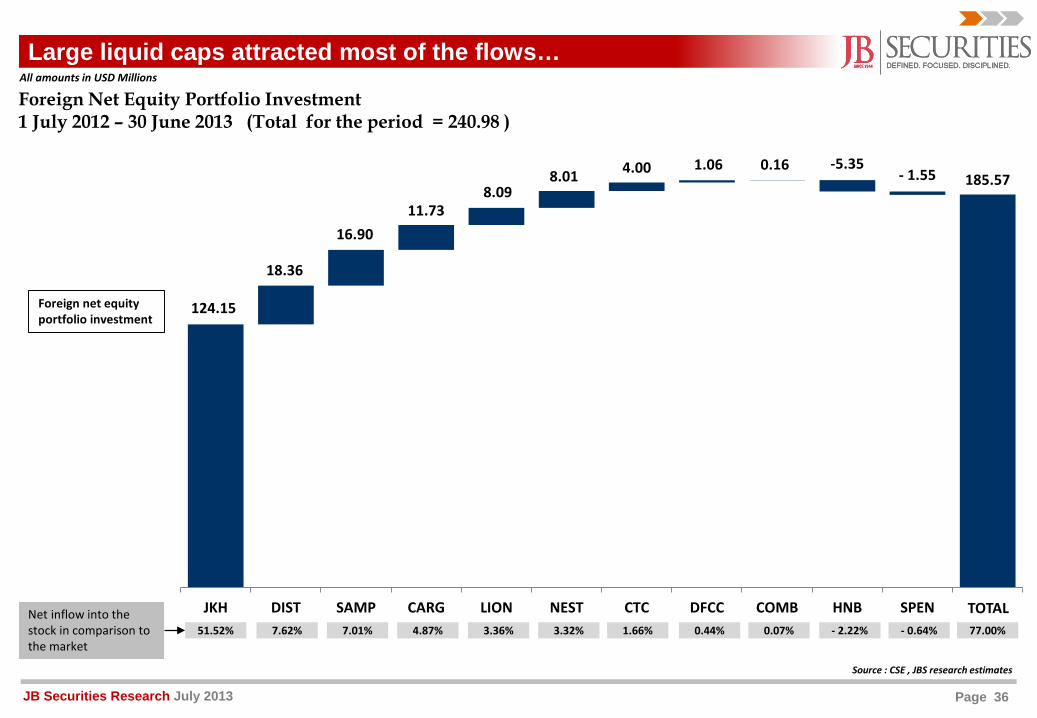
Large liquid caps attracted most of the flows…
Source : CSE , JBS research estimates
Foreign Net Equity Portfolio Investment1 July 2012 – 30 June 2013 (Total for the period = 240.98 )
185.57
124.15
18.36
16.9011.73
8.098.01 4.00 1.06 0.16 -5.35
- 1.55
JKH DIST SAMP CARG LION NEST CTC DFCC COMB HNB SPEN51.52% 7.62% 7.01% 4.87% 3.36% 3.32% 1.66% 0.44% 0.07% - 2.22% - 0.64%
Net inflow into the stock in comparison to the market
Foreign net equity portfolio investment
TOTAL77.00%
All amounts in USD Millions
Page 37JB Securities Research July 2013
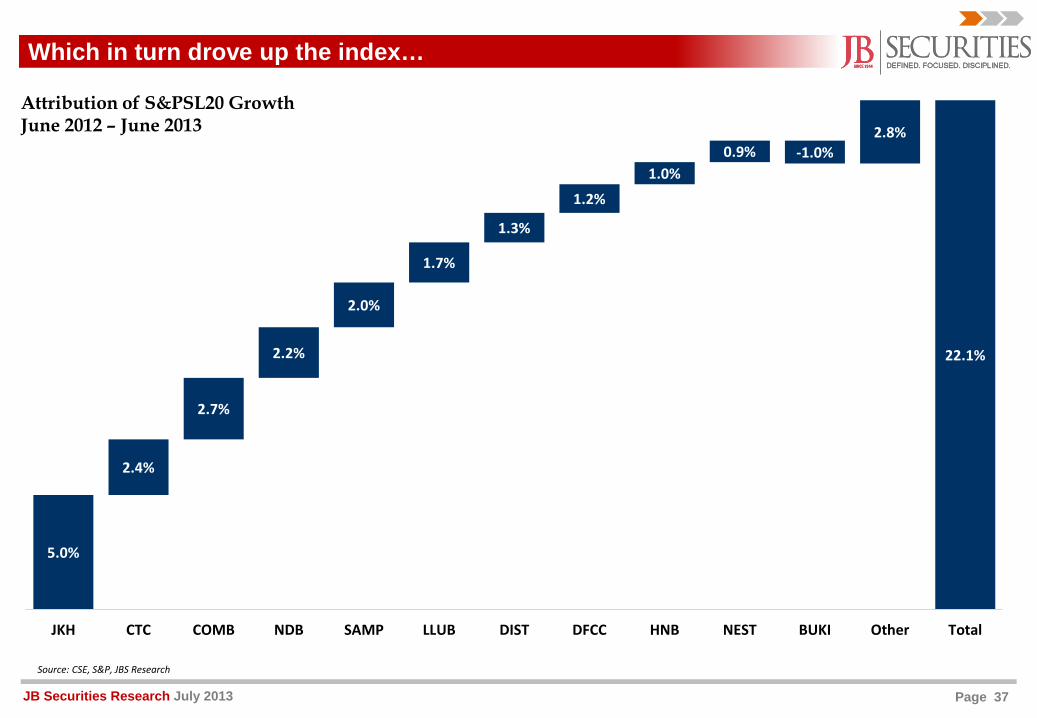
5.0%
2.4%
2.7%
2.2%
2.0%
1.7%
1.3%
1.2%
1.0%0.9% -1.0%
2.8%
22.1%
JKH CTC COMB NDB SAMP LLUB DIST DFCC HNB NEST BUKI Other Total
Attribution of S&PSL20 Growth June 2012 – June 2013
Which in turn drove up the index…
Source: CSE, S&P, JBS Research
Page 38JB Securities Research July 2013
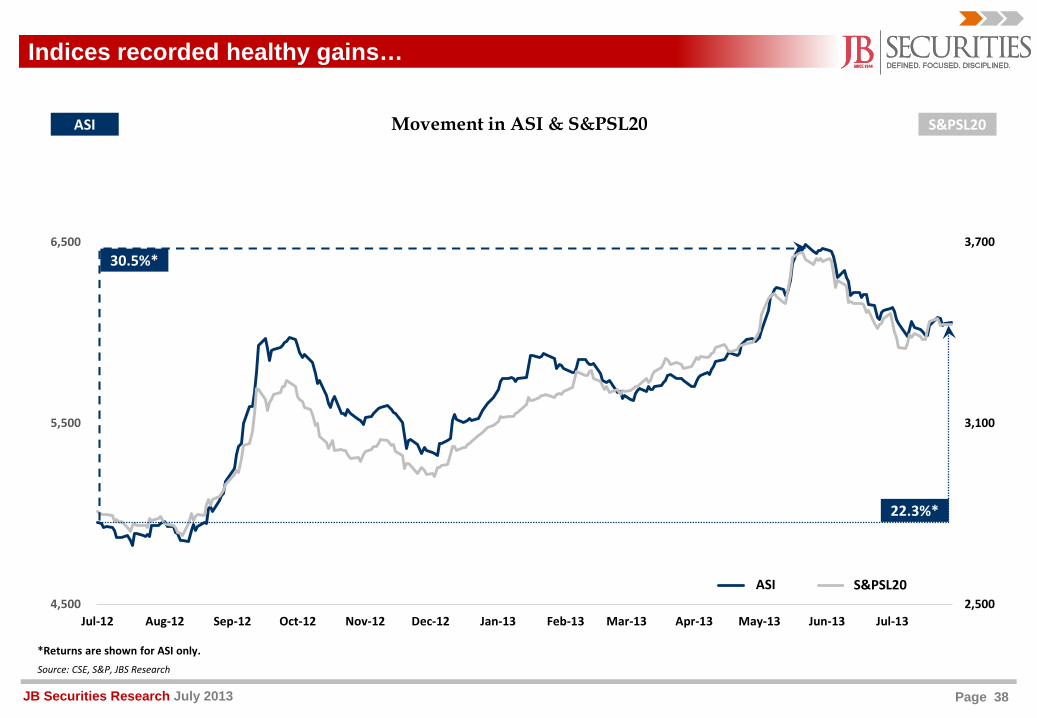
Indices recorded healthy gains…
Source: CSE, S&P, JBS Research
2,500
3,100
3,700
4,500
5,500
6,500
Jul-12 Aug-12 Sep-12 Oct-12 Nov-12 Dec-12 Jan-13 Feb-13 Mar-13 Apr-13 May-13 Jun-13 Jul-13
Movement in ASI & S&PSL20
Series1 Series2ASI S&PSL20
ASI S&PSL20
22.3%*
30.5%*
*Returns are shown for ASI only.
Page 39JB Securities Research July 2013
-10%
0%
10%
20%
30%
40%
50%
60%
Jul-12 Aug-12 Sep-12 Oct-12 Nov-12 Dec-12 Jan-13 Feb-13 Mar-13 Apr-13 May-13 Jun-13
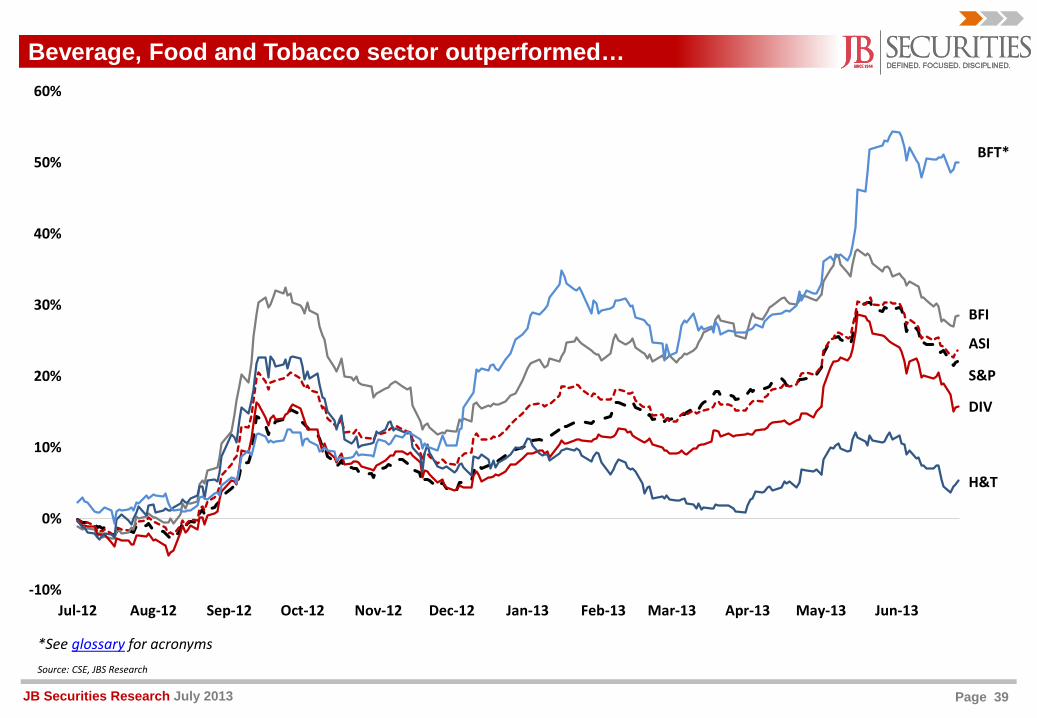
Beverage, Food and Tobacco sector outperformed…
Source: CSE, JBS Research
*See glossary for acronyms
BFT*
BFI
ASI
S&P
DIV
H&T
Page 40JB Securities Research July 2013
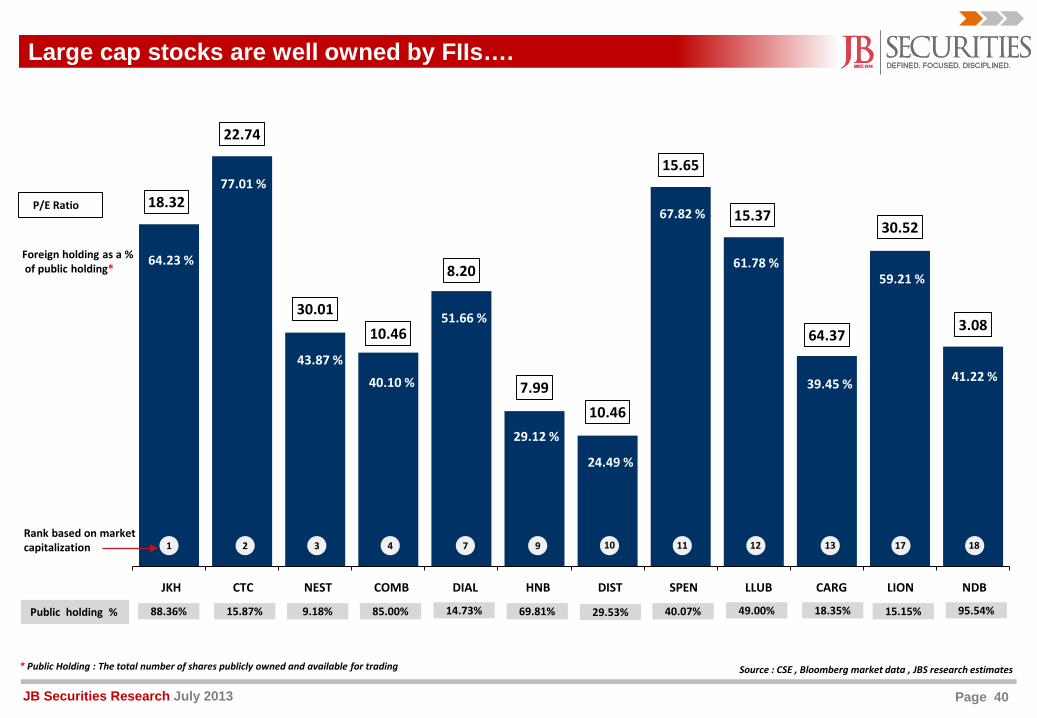
Foreign holding as a %of public holding*
18.32
22.74
30.0110.46
8.20
7.9910.46
15.65
15.37
64.37
30.52
3.08
0.00%
10.00%
20.00%
30.00%
40.00%
50.00%
60.00%
70.00%
80.00%
90.00%
JKH CTC NEST COMB DIAL HNB DIST SPEN LLUB CARG LION NDB
Large cap stocks are well owned by FIIs….
Source : CSE , Bloomberg market data , JBS research estimates
64.23 %
77.01 %
43.87 %
40.10 %
51.66 %
29.12 %
24.49 %
67.82 %
61.78 %
39.45 %
59.21 %
41.22 %
* Public Holding : The total number of shares publicly owned and available for trading
88.36% 15.87% 9.18% 85.00% 14.73% 69.81% 29.53% 40.07% 49.00% 18.35% 15.15% 95.54%
JKH CTC NEST COMB DIAL HNB DIST SPEN LLUB CARG LION NDB
7 93 421 10 11 12 13 17 18
P/E Ratio
Public holding %
Rank based on market capitalization
Page 41JB Securities Research July 2013
11.0%
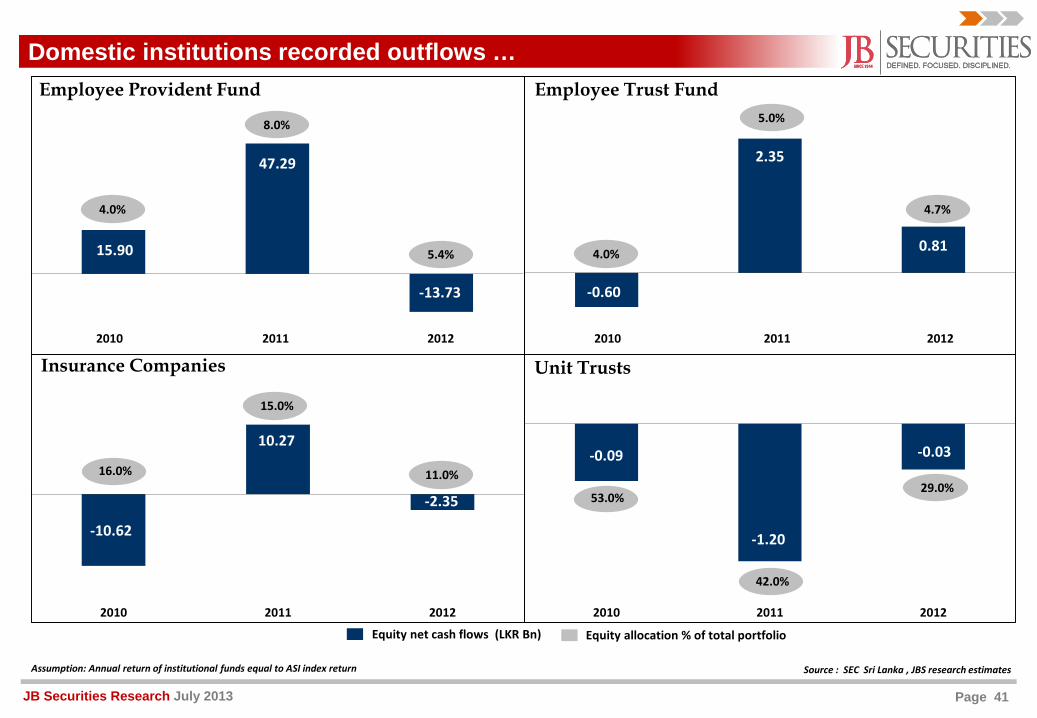
Domestic institutions recorded outflows …
-13.73
47.29
15.90
2012 (DEC)2011 (Dec)2010 (Dec)
5.4% 0.81
2.35
-0.60
201220112010
Employee Trust Fund
-2.35
10.27
-10.62
201220112010
Insurance Companies
-0.03
-1.20
-0.09
201220112010
Unit Trusts
Equity net cash flows (LKR Bn) Equity allocation % of total portfolio
Source : SEC Sri Lanka , JBS research estimates
4.0%
8.0%
16.0%
15.0%
53.0%
42.0%
29.0%
4.0%
5.0%
4.7%
Assumption: Annual return of institutional funds equal to ASI index return
2010 2011 2010 2011 20122012
Employee Provident Fund
Page 42JB Securities Research July 2013
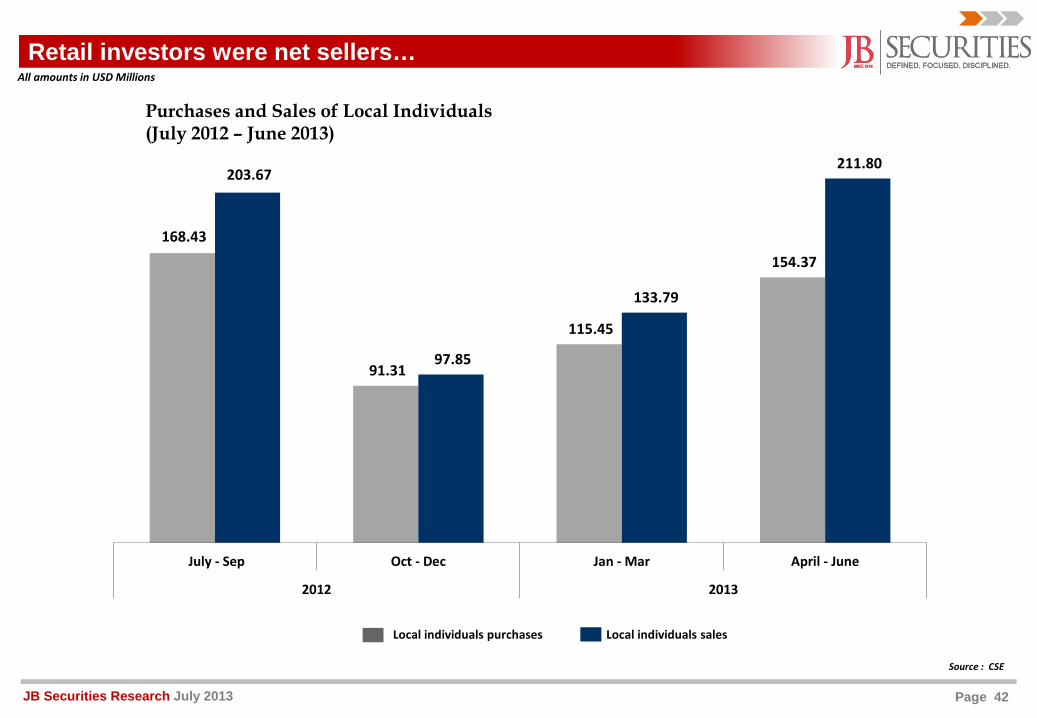
168.43
91.31
115.45
154.37
203.67
97.85
133.79
211.80
July - Sep Oct - Dec Jan - Mar April - June
2012 2013
Retail investors were net sellers…
Purchases and Sales of Local Individuals(July 2012 – June 2013)
Local individuals purchases Local individuals sales
Source : CSE
All amounts in USD Millions
Page 43JB Securities Research July 2013
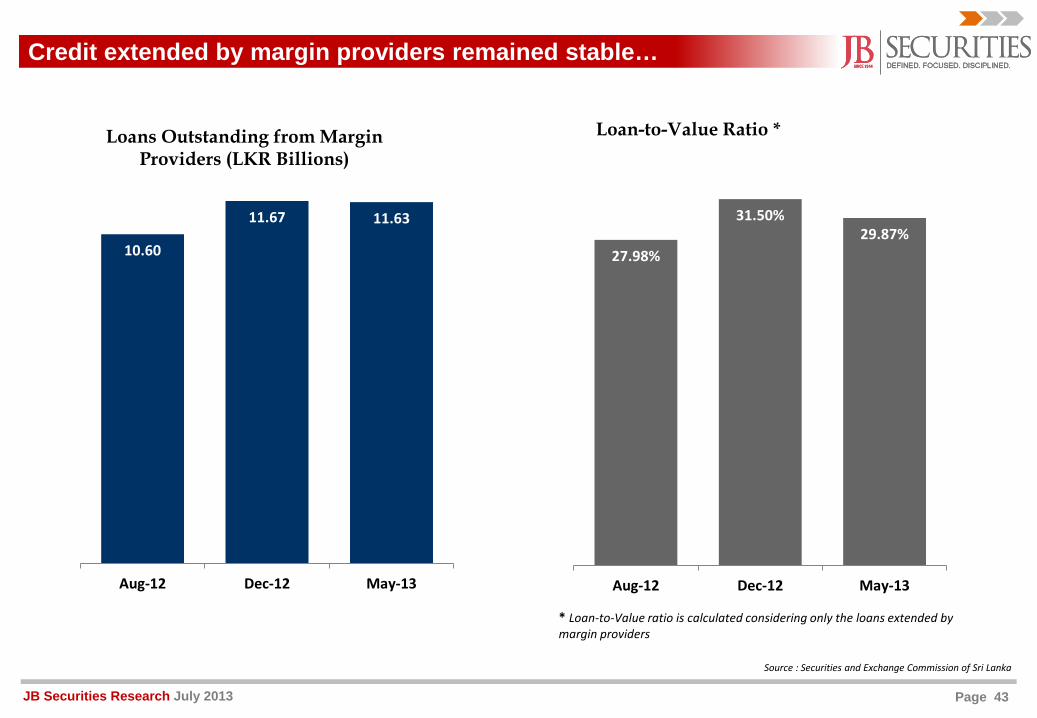
Credit extended by margin providers remained stable…
Source : Securities and Exchange Commission of Sri Lanka
* Loan-to-Value ratio is calculated considering only the loans extended by margin providers
10.60
11.67 11.63
Aug-12 Dec-12 May-13
Loans Outstanding from Margin Providers (LKR Billions)
27.98%
31.50%29.87%
Aug-12 Dec-12 May-13
Loan-to-Value Ratio *
Page 44JB Securities Research July 2013
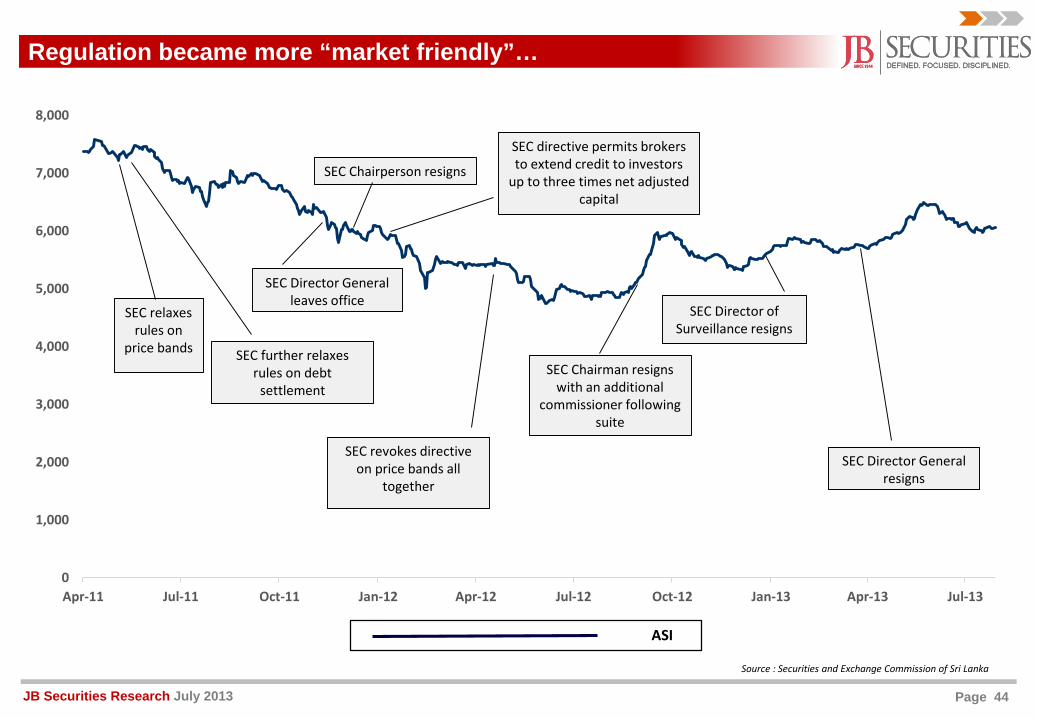
0
1,000
2,000
3,000
4,000
5,000
6,000
7,000
8,000
Apr-11 Jul-11 Oct-11 Jan-12 Apr-12 Jul-12 Oct-12 Jan-13 Apr-13 Jul-13
Regulation became more “market friendly”…
ASI
Source : Securities and Exchange Commission of Sri Lanka
SEC relaxes rules on
price bands SEC further relaxes rules on debt
settlement
SEC Director General leaves office
SEC Chairperson resigns
SEC directive permits brokers to extend credit to investors
up to three times net adjusted capital
SEC revokes directive on price bands all
together
SEC Chairman resigns with an additional
commissioner following suite
SEC Director General resigns
SEC Director of Surveillance resigns
Page 45JB Securities Research July 2013
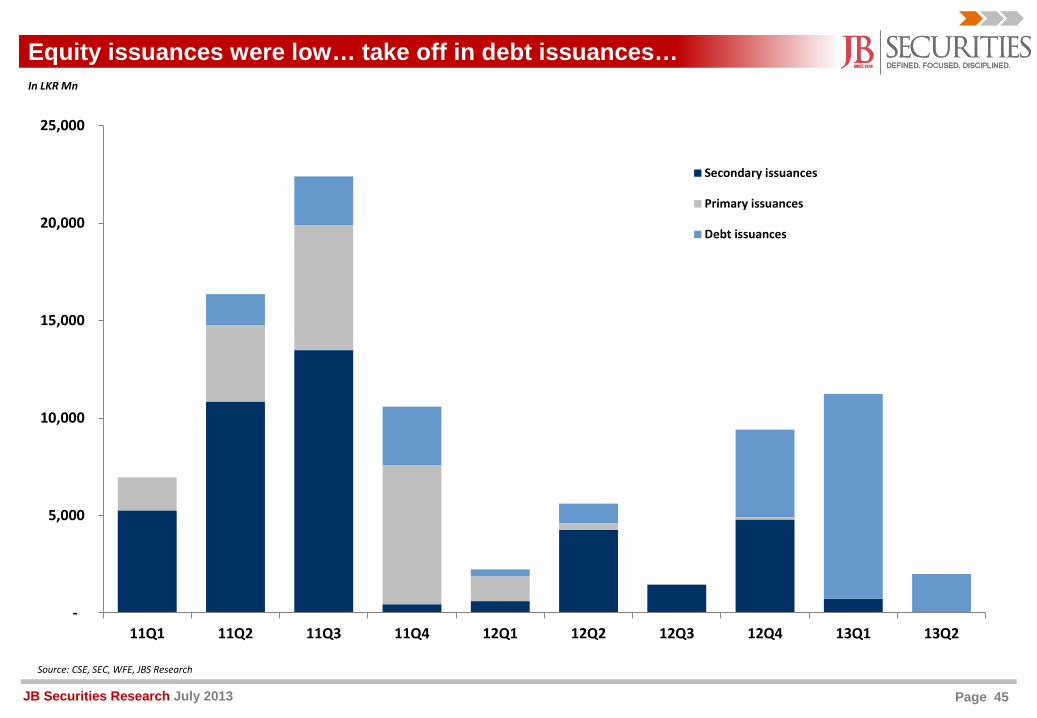
Equity issuances were low… take off in debt issuances…In LKR Mn
Source: CSE, SEC, WFE, JBS Research
-
5,000
10,000
15,000
20,000
25,000
11Q1 11Q2 11Q3 11Q4 12Q1 12Q2 12Q3 12Q4 13Q1 13Q2
Secondary issuances
Primary issuances
Debt issuances
Page 46JB Securities Research July 2013
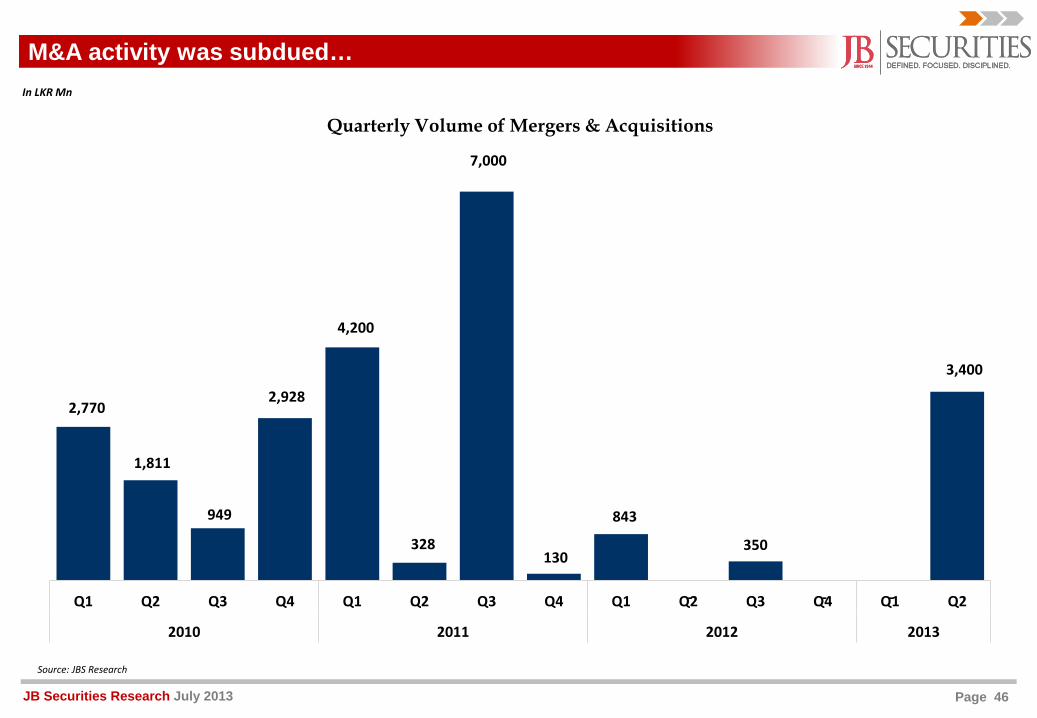
M&A activity was subdued…
2,770
1,811
949
2,928
4,200
328
7,000
130
843
-
350
- -
3,400
Q1 Q2 Q3 Q4 Q1 Q2 Q3 Q4 Q1 Q2 Q3 Q4 Q1 Q2
2010 2011 2012 2013
Quarterly Volume of Mergers & Acquisitions
In LKR Mn
Source: JBS Research
Page 47JB Securities Research July 2013
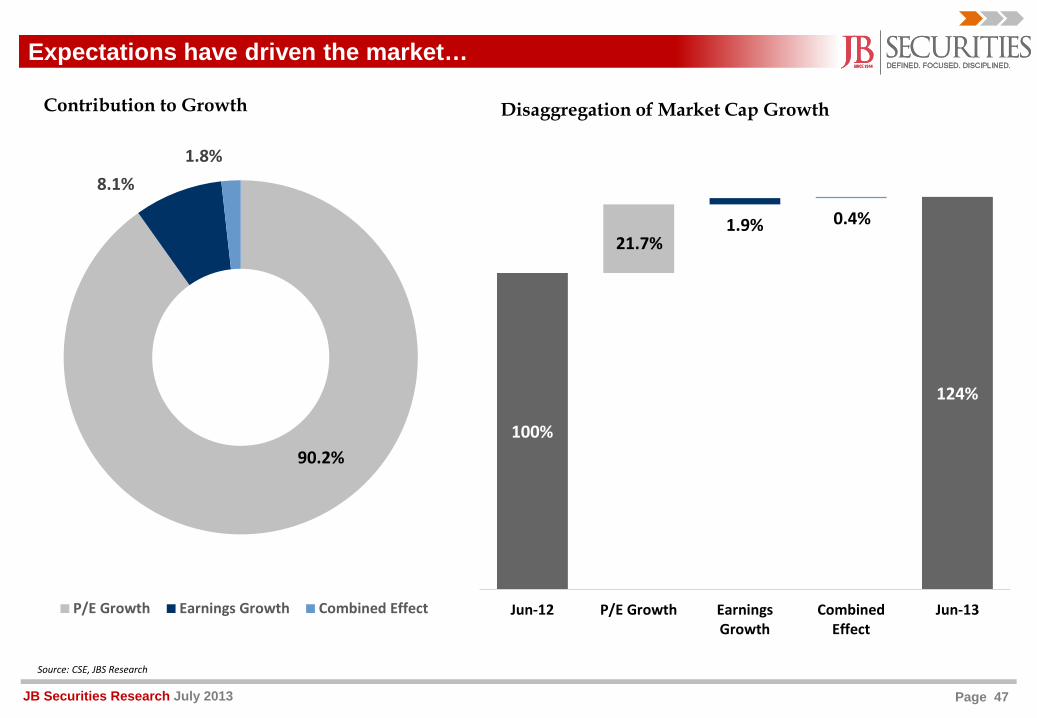
90.2%
8.1%1.8%
Contribution to Growth
P/E Growth Earnings Growth Combined Effect
100%
21.7%1.9% 0.4%
124%
Jun-12 P/E Growth EarningsGrowth
CombinedEffect
Jun-13
Disaggregation of Market Cap Growth
Expectations have driven the market…
Source: CSE, JBS Research
Page 48JB Securities Research July 2013
0
5
10
15
20
25
0
5
10
15
20
25
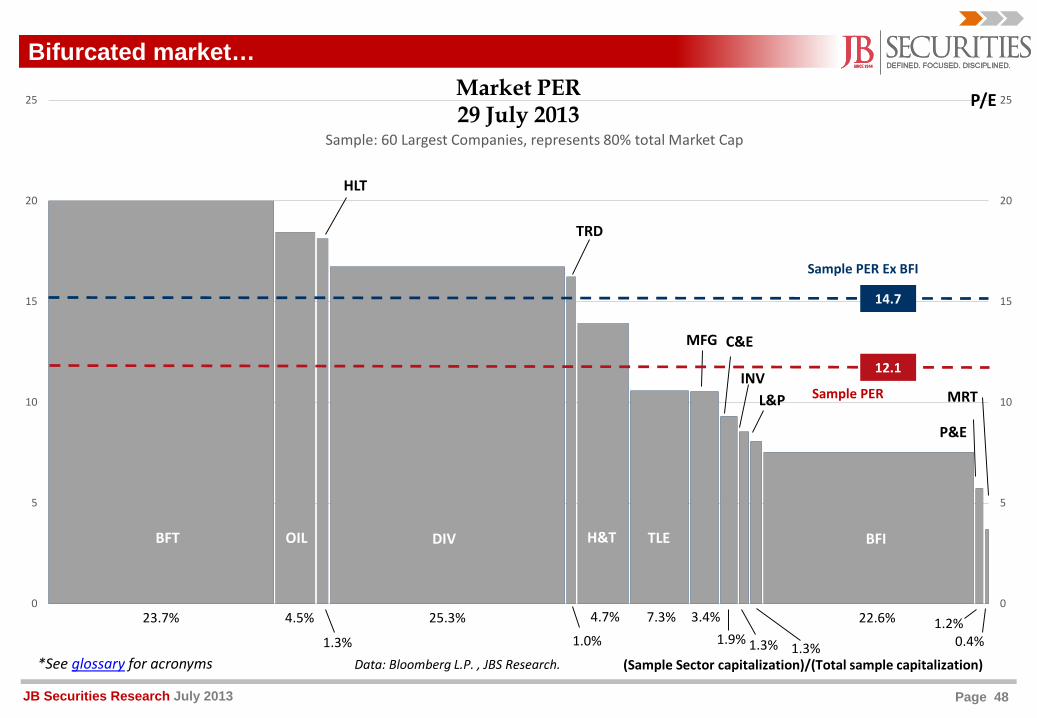
TRD
P&E
Sample PER
Sample PER Ex BFI
Bifurcated market…
23.7% 4.5% 25.3% 4.7% 7.3% 22.6%
1.3%
3.4%1.9% 1.3% 1.3%
1.2%0.4%
Market PER 29 July 2013
Sample: 60 Largest Companies, represents 80% total Market Cap
12.1
14.7
P/E
(Sample Sector capitalization)/(Total sample capitalization)Data: Bloomberg L.P. , JBS Research.
BFT OIL DIV H&T TLE BFI
MFG
HLT
C&E
INVL&P MRT
1.0%*See glossary for acronyms
Page 49JB Securities Research July 2013
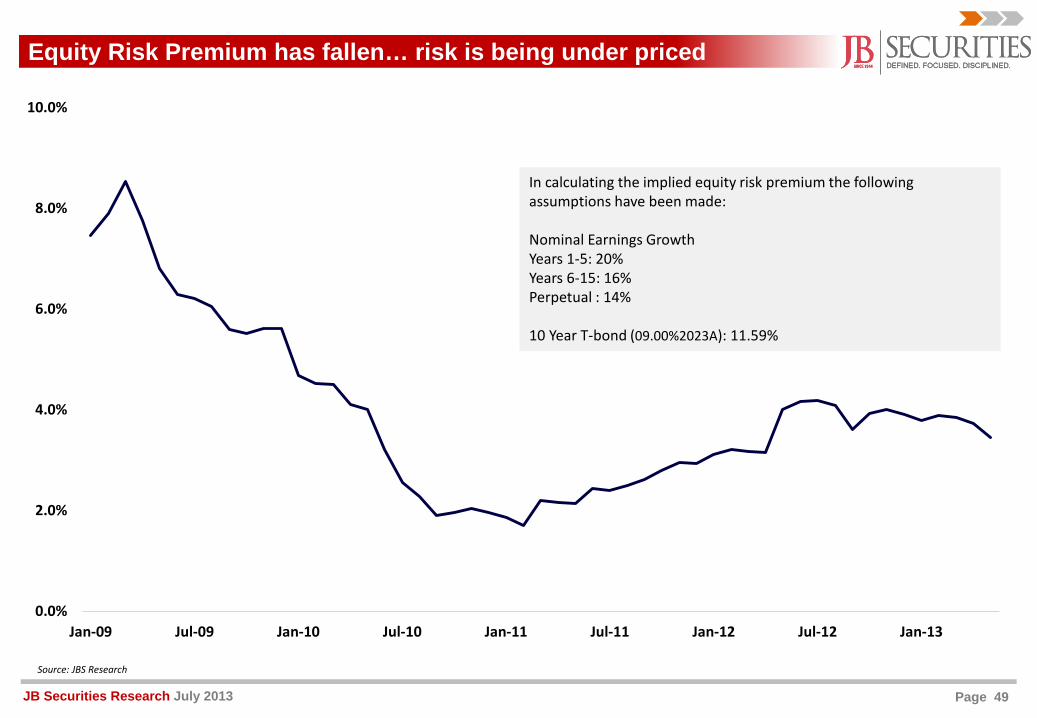
Equity Risk Premium has fallen… risk is being under priced
0.0%
2.0%
4.0%
6.0%
8.0%
10.0%
Jan-09 Jul-09 Jan-10 Jul-10 Jan-11 Jul-11 Jan-12 Jul-12 Jan-13
Source: JBS Research
In calculating the implied equity risk premium the following assumptions have been made:
Nominal Earnings GrowthYears 1-5: 20%Years 6-15: 16%Perpetual : 14%
10 Year T-bond (09.00%2023A): 11.59%
Page 50JB Securities Research July 2013
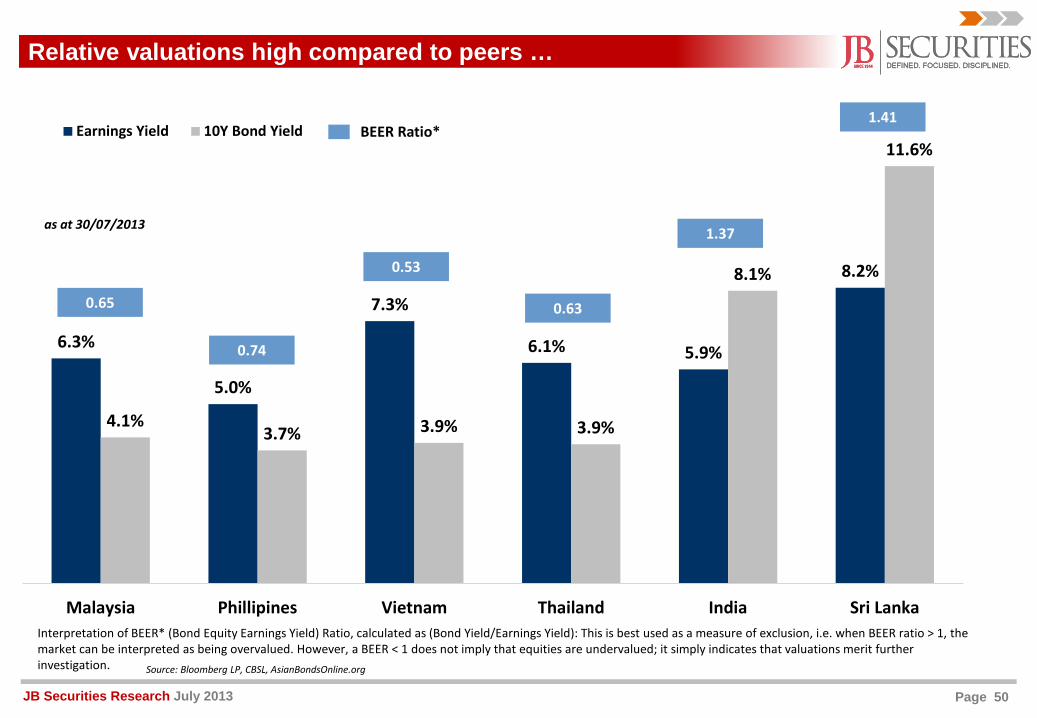
Relative valuations high compared to peers …
6.3%
5.0%
7.3%
6.1% 5.9%
8.2%
4.1%3.7% 3.9% 3.9%
8.1%
11.6%
Malaysia Phillipines Vietnam Thailand India Sri Lanka
Earnings Yield 10Y Bond Yield
as at 30/07/2013
Source: Bloomberg LP, CBSL, AsianBondsOnline.org
BEER Ratio*
0.65
0.74
0.53
0.63
1.37
1.41
Interpretation of BEER* (Bond Equity Earnings Yield) Ratio, calculated as (Bond Yield/Earnings Yield): This is best used as a measure of exclusion, i.e. when BEER ratio > 1, the market can be interpreted as being overvalued. However, a BEER < 1 does not imply that equities are undervalued; it simply indicates that valuations merit further investigation.
Page 51JB Securities Research July 2013
Recap of the last 12 months…
Potential risks exist…
Investment case remains…
Page 52JB Securities Research July 2013
Three-speed post conflict economy …
Leaders > CAGR 8.70% Steady CAGR 6.40% - 8.70% Laggards < CAGR 6.40%
Hotels and Restaurants
Construction
Mining and Quarrying
Post and TelecommunicationCargo-Ports and Civil Aviation
Import Trade Domestic Trade
Electricity, Gas and Water
0123456789
1011121314151617181920212223242526272829
- 200 400 600 800 1,000 1,200 1,400 1,600 1,800 2,000 2,200 2,400
Private Services
Export Trade
Agriculture, Livestock and Forestry
Government Services
Ownership of Dwellings
% CAGR, YE2009-12
GDP real sector size, YE2009: LKR2,449Bn
Growth,YE2009/12: 7.55%
Source: Central Bank of Sri Lanka, JBS Research Analysis
Passenger, Goods and Railway TransportBanking, Insurance and Real Estate etc.
Fishing
Manufacturing
Page 53JB Securities Research July 2013
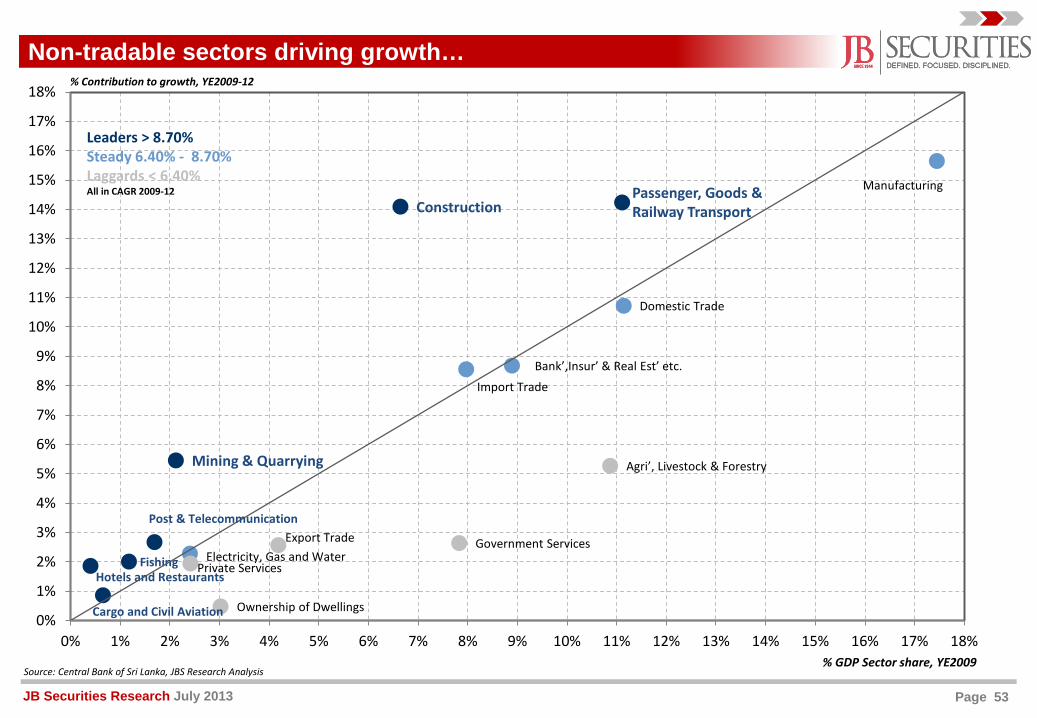
ConstructionManufacturing
Domestic Trade
Bank’,Insur’ & Real Est’ etc.Import Trade
Mining & Quarrying Agri’, Livestock & Forestry
Export TradeElectricity, Gas and WaterFishing Private Services
Hotels and Restaurants
Government Services
Cargo and Civil Aviation Ownership of Dwellings0%
1%
2%
3%
4%
5%
6%
7%
8%
9%
10%
11%
12%
13%
14%
15%
16%
17%
18%
0% 1% 2% 3% 4% 5% 6% 7% 8% 9% 10% 11% 12% 13% 14% 15% 16% 17% 18%
% Contribution to growth, YE2009-12
Leaders > 8.70%Steady 6.40% - 8.70%Laggards < 6.40%All in CAGR 2009-12 Passenger, Goods &
Railway Transport
Post & Telecommunication
% GDP Sector share, YE2009Source: Central Bank of Sri Lanka, JBS Research Analysis
Non-tradable sectors driving growth…
Page 54JB Securities Research July 2013
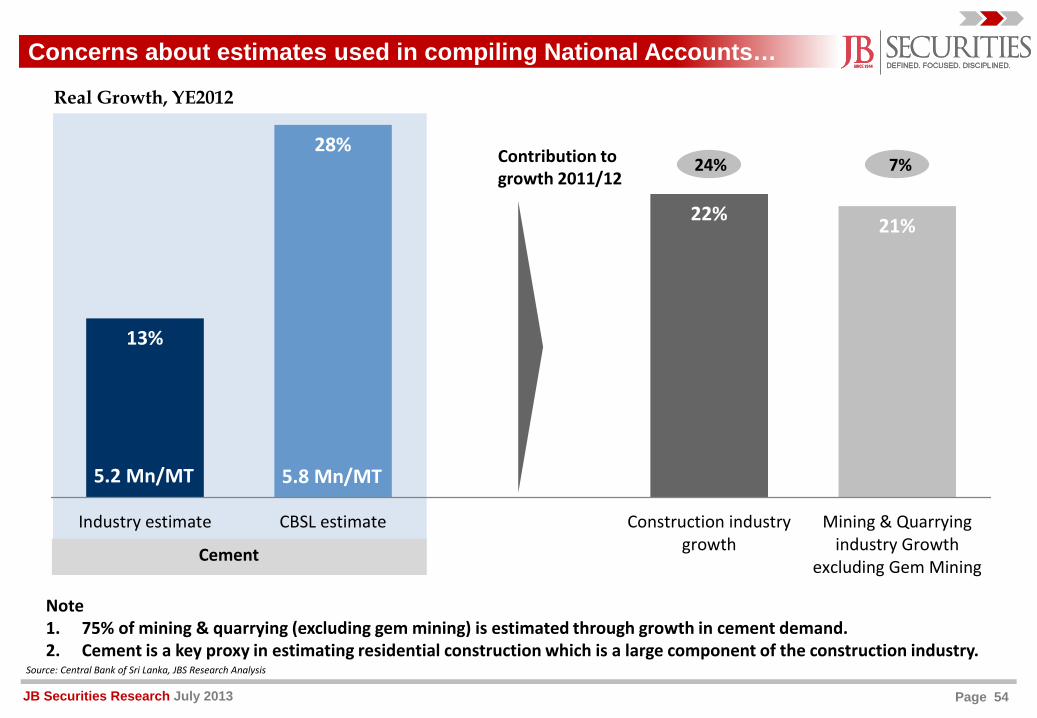
Concerns about estimates used in compiling National Accounts…
Note1. 75% of mining & quarrying (excluding gem mining) is estimated through growth in cement demand.2. Cement is a key proxy in estimating residential construction which is a large component of the construction industry.
13%
28%
22% 21%
Industry estimate CBSL estimate Construction industrygrowth
Mining & Quarryingindustry Growth
excluding Gem MiningCement
5.2 Mn/MT 5.8 Mn/MT
Real Growth, YE2012
Source: Central Bank of Sri Lanka, JBS Research Analysis
Contribution to growth 2011/12
24% 7%
Page 55JB Securities Research July 2013
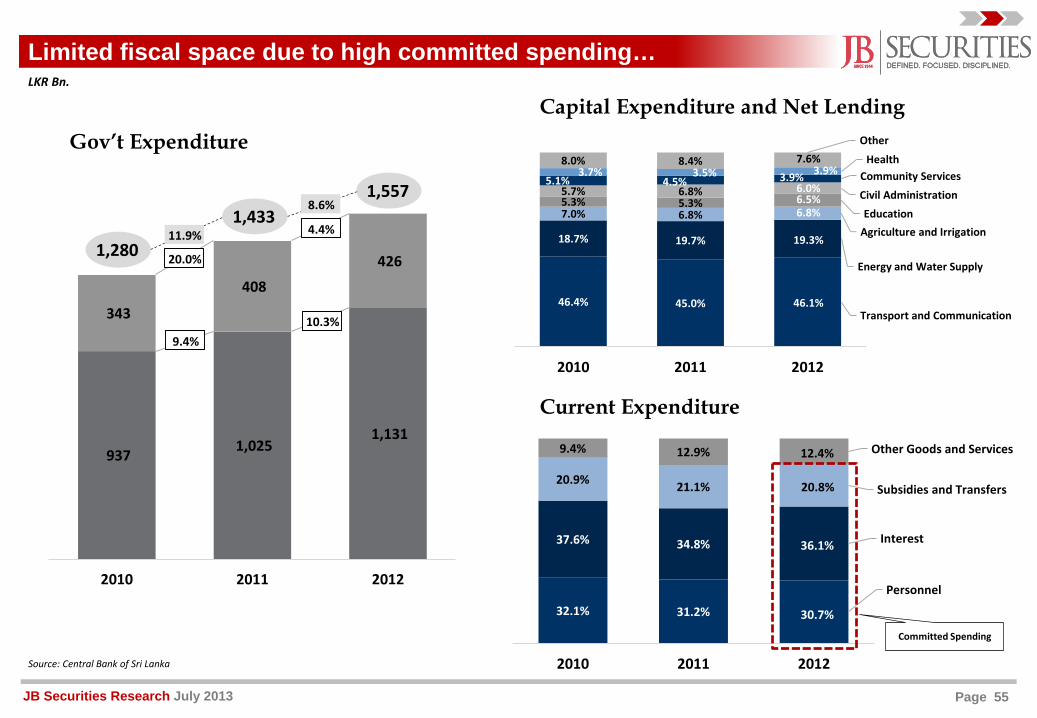
937 1,025 1,131
343
408
426
2010 2011 2012
Limited fiscal space due to high committed spending…
32.1% 31.2%
Personnel
37.6% 34.8% Interest
20.9% 21.1% Subsidies and Transfers
9.4% 12.9% Other Goods and Services
2010 2011 2012
20.0%
4.4%
1,280
30.7%
36.1%
20.8%
12.4%
46.4% 45.0%Transport and Communication
18.7% 19.7%
Energy and Water Supply
7.0% 6.8%Agriculture and Irrigation
5.3% 5.3%Education
5.7% 6.8% Civil Administration5.1% 4.5% Community Services 3.7% 3.5%
Health8.0% 8.4%
Other
2010 2011 2012
19.3%
46.1%
6.5%6.0%
7.6%
6.8%
3.9%3.9%
Current Expenditure
Capital Expenditure and Net Lending
Committed Spending
Source: Central Bank of Sri Lanka
LKR Bn.
Gov’t Expenditure
9.4%10.3%
1,5571,433
11.9%
8.6%
Page 56JB Securities Research July 2013
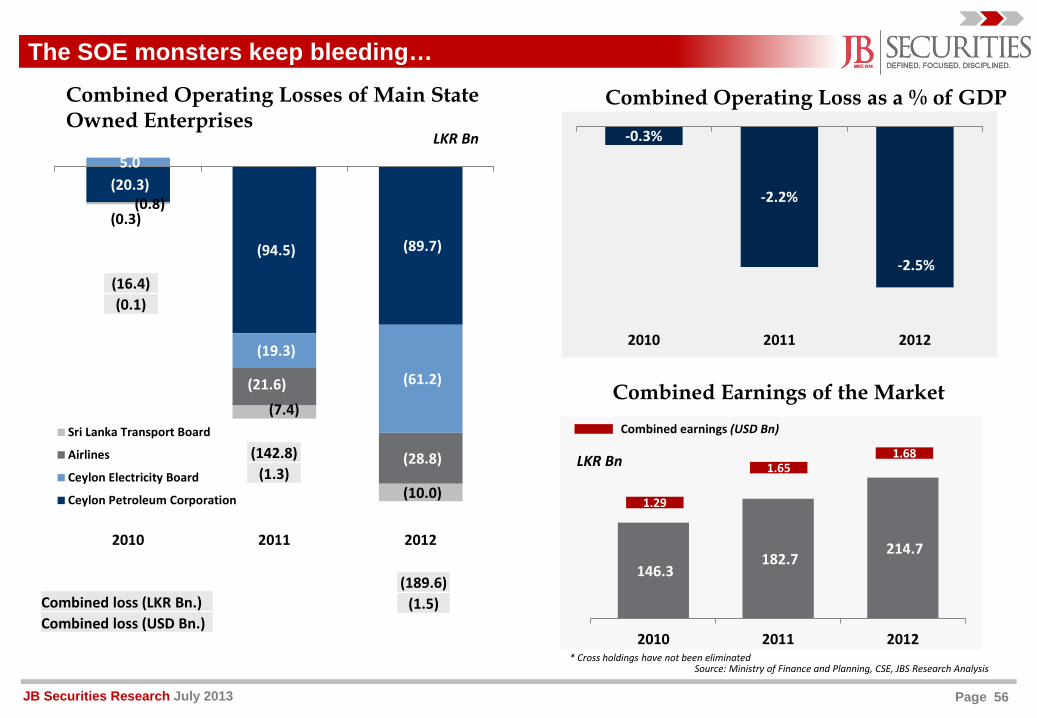
(20.3)
(94.5) (89.7)
5.0
(19.3)
(61.2)
(0.3)
(21.6)
(28.8)
(0.8)
(7.4)
(10.0)
2010 2011 2012
Sri Lanka Transport Board
Airlines
Ceylon Electricity Board
Ceylon Petroleum Corporation
Combined Operating Losses of Main State Owned Enterprises
Combined Earnings of the Market
Combined Operating Loss as a % of GDP
LKR Bn
LKR Bn
Combined earnings (USD Bn)
Source: Ministry of Finance and Planning, CSE, JBS Research Analysis* Cross holdings have not been eliminated
The SOE monsters keep bleeding…
(189.6)(1.5)
(142.8)(1.3)
(16.4)(0.1)
Combined loss (LKR Bn.)Combined loss (USD Bn.)
-0.3%
-2.2%
-2.5%
2010 2011 2012
146.3 182.7
214.7
2010 2011 2012
1.651.68
1.29
Page 57JB Securities Research July 2013
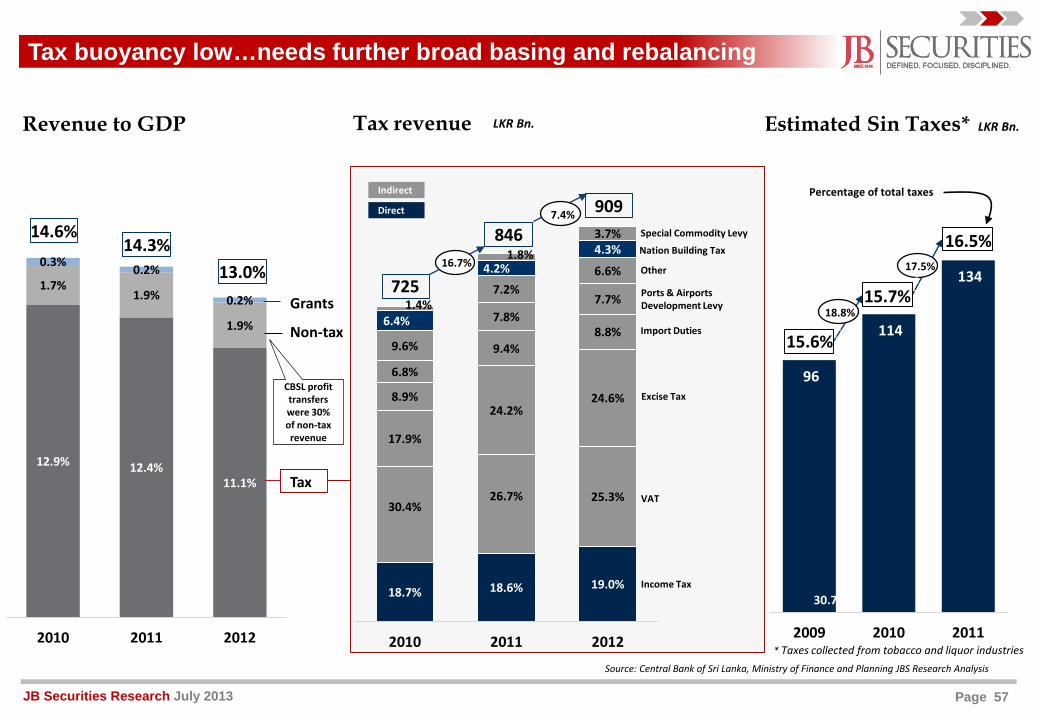
96
114
134
2009 2010 2011
12.9% 12.4%11.1%
1.7%1.9%
1.9%
0.3% 0.2%
0.2%
2010 2011 2012
Tax buoyancy low…needs further broad basing and rebalancing
14.6%14.3%
13.0%
30.7%
Revenue to GDP Tax revenue LKR Bn.
Grants
Non-tax
Tax
725
846909
CBSL profit transfers were 30% of non-tax revenue
Estimated Sin Taxes*
Source: Central Bank of Sri Lanka, Ministry of Finance and Planning JBS Research Analysis
LKR Bn.
18.7% 18.6% 19.0%
30.4%26.7% 25.3%
17.9%
24.2%24.6%8.9%
9.4%8.8%
6.8%
7.8%7.7%
9.6%
7.2%6.6%
6.4%
4.2%4.3%
1.4%
1.8%3.7%
2010 2011 2012
1
Special Commodity Levy
Other
Excise Tax
Ports & Airports Development Levy
Import Duties
VAT
Income Tax
Nation Building Tax
Direct
Indirect Percentage of total taxes
16.5%
15.7%
15.6%
* Taxes collected from tobacco and liquor industries
16.7%
7.4%
16.7%
16.7%18.8%
17.5%
Page 58JB Securities Research July 2013
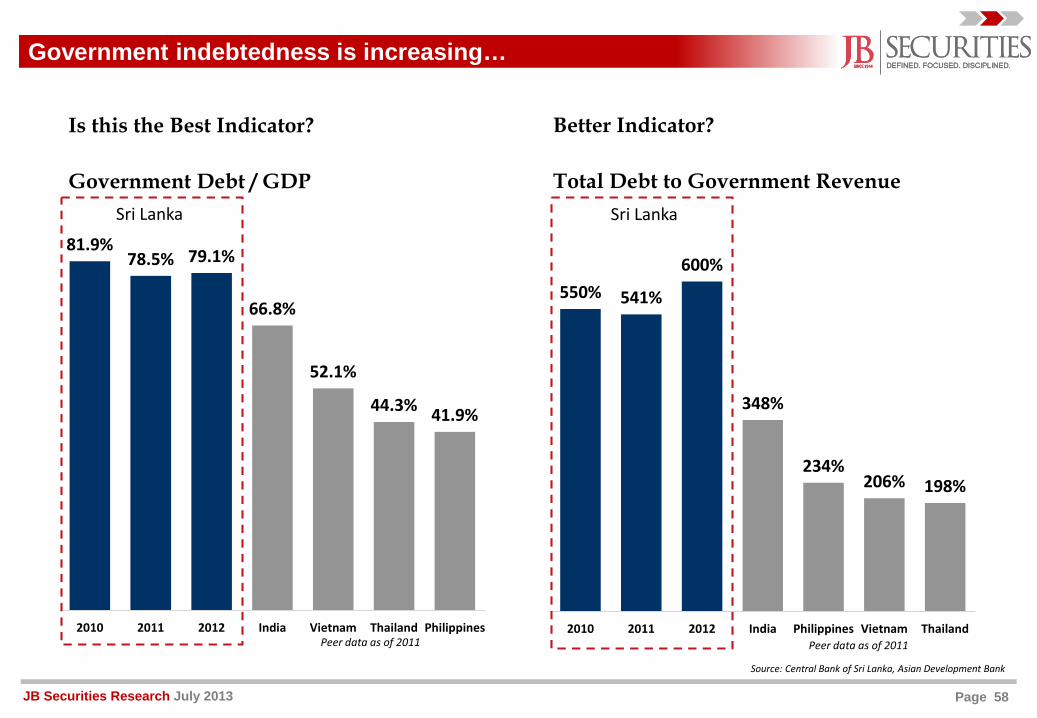
Government indebtedness is increasing…
Better Indicator?Is this the Best Indicator?
81.9%78.5% 79.1%
66.8%
52.1%
44.3% 41.9%
2010 2011 2012 India Vietnam Thailand Philippines
550% 541%
600%
348%
234%206% 198%
2010 2011 2012 India Philippines Vietnam Thailand
Total Debt to Government RevenueGovernment Debt / GDP
Source: Central Bank of Sri Lanka, Asian Development Bank
Peer data as of 2011Peer data as of 2011
Sri Lanka Sri Lanka
Page 59JB Securities Research July 2013
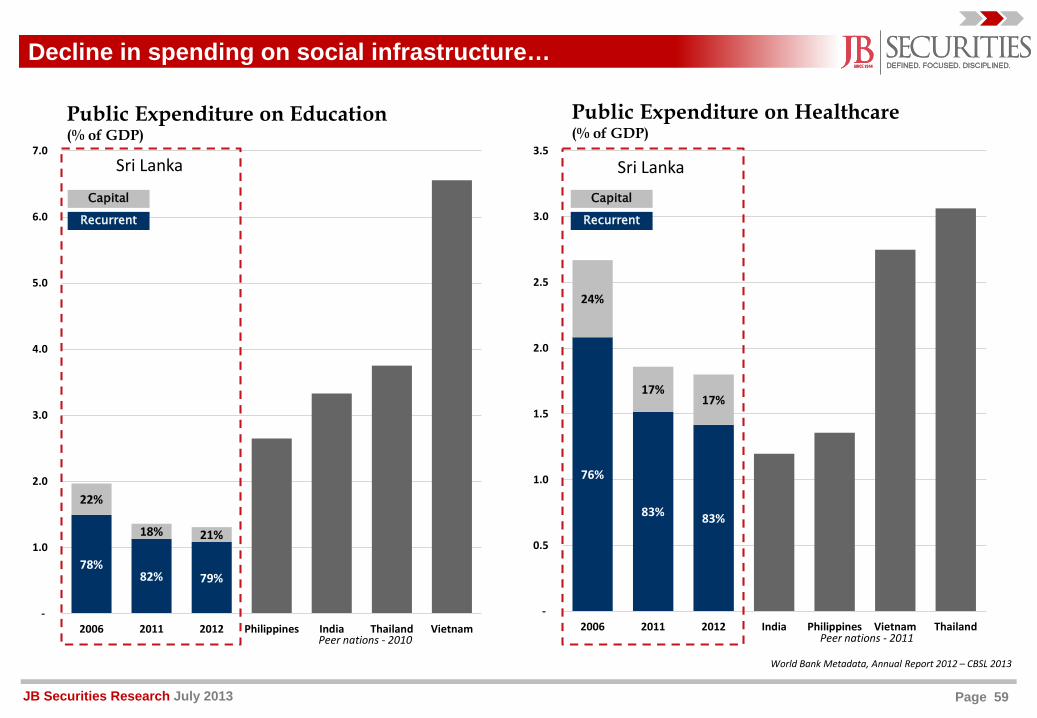
78%82% 79%
22%
18% 21%
-
1.0
2.0
3.0
4.0
5.0
6.0
7.0
2006 2011 2012 Philippines India Thailand Vietnam
Decline in spending on social infrastructure…
Recurrent
Capital
Public Expenditure on Education(% of GDP)
Public Expenditure on Healthcare(% of GDP)
76%
83% 83%
24%
17%17%
-
0.5
1.0
1.5
2.0
2.5
3.0
3.5
2006 2011 2012 India Philippines Vietnam Thailand
Recurrent
Capital
Sri Lanka Sri Lanka
World Bank Metadata, Annual Report 2012 – CBSL 2013
Peer nations - 2010 Peer nations - 2011
Page 60JB Securities Research July 2013
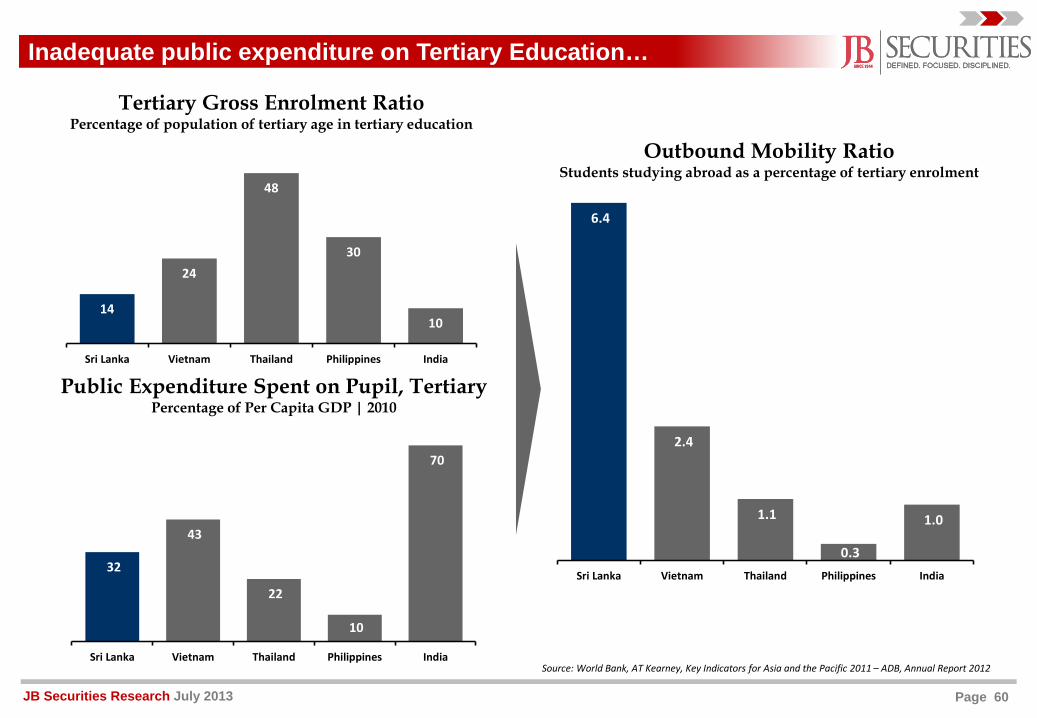
Inadequate public expenditure on Tertiary Education…
6.4
2.4
1.1
0.3
1.0
Sri Lanka Vietnam Thailand Philippines India
Outbound Mobility RatioStudents studying abroad as a percentage of tertiary enrolment
32
43
22
10
70
Sri Lanka Vietnam Thailand Philippines India
Public Expenditure Spent on Pupil, TertiaryPercentage of Per Capita GDP | 2010
14
24
48
30
10
Sri Lanka Vietnam Thailand Philippines India
Tertiary Gross Enrolment RatioPercentage of population of tertiary age in tertiary education
Source: World Bank, AT Kearney, Key Indicators for Asia and the Pacific 2011 – ADB, Annual Report 2012
Page 61JB Securities Research July 2013
USD/Oz
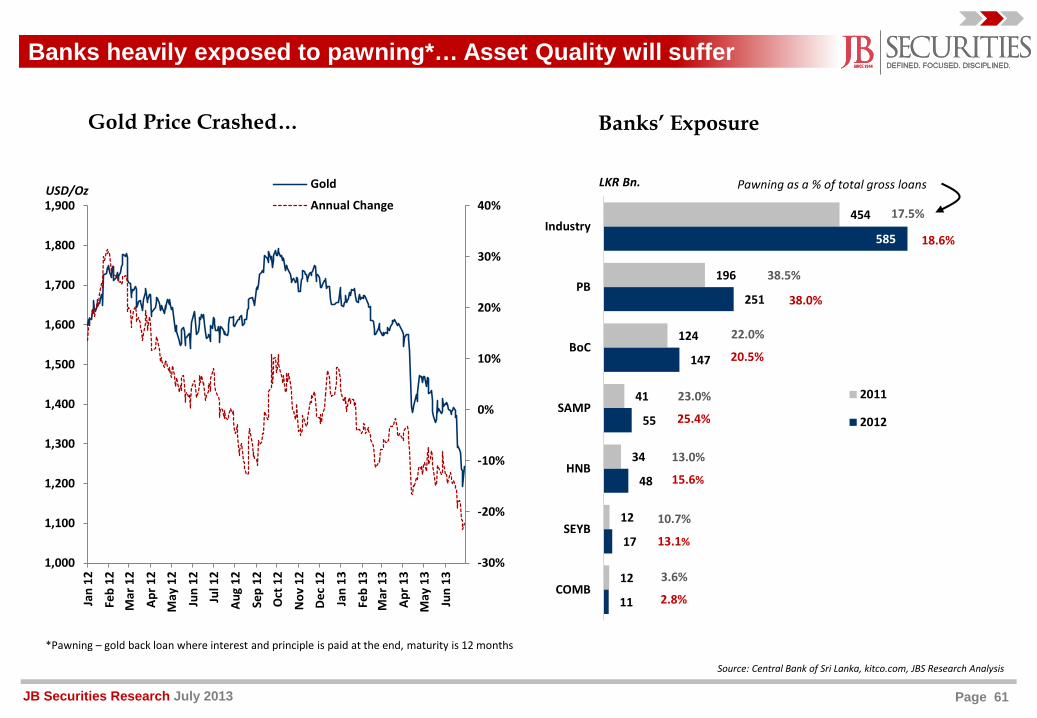
Banks heavily exposed to pawning*… Asset Quality will suffer
-30%
-20%
-10%
0%
10%
20%
30%
40%
Jan
12
Feb
12M
ar 1
2
Apr 1
2M
ay 1
2
Jun
12Ju
l 12
Aug
12
Sep
12O
ct 1
2
Nov
12
Dec
12
Jan
13
Feb
13M
ar 1
3
Apr 1
3M
ay 1
3
Jun
13
1,000
1,100
1,200
1,300
1,400
1,500
1,600
1,700
1,800
1,900
Gold
Annual Change
Gold Price Crashed…
454
196
124
41
34
12
12
585
251
147
55
48
17
11
Industry
PB
BoC
SAMP
HNB
SEYB
COMB
2011
2012
Banks’ Exposure
10.7%
17.5%
38.5%
22.0%
13.0%
23.0%
3.6%
13.1%
18.6%
38.0%
20.5%
15.6%
25.4%
2.8%
Pawning as a % of total gross loans
Source: Central Bank of Sri Lanka, kitco.com, JBS Research Analysis
LKR Bn.
*Pawning – gold back loan where interest and principle is paid at the end, maturity is 12 months
Page 62JB Securities Research July 2013
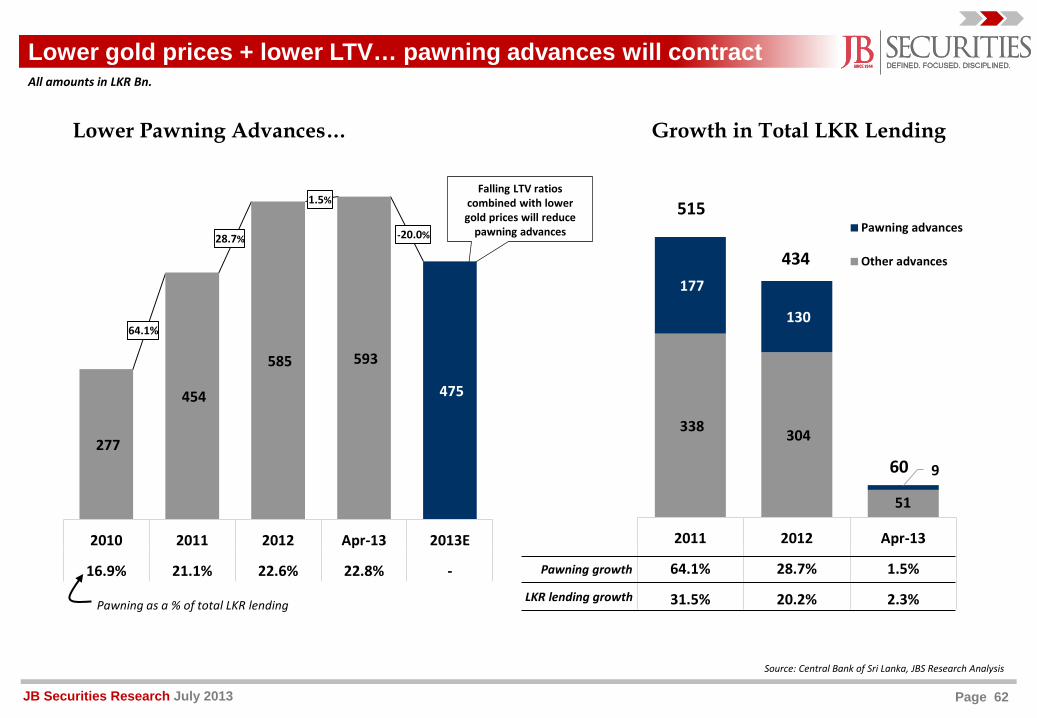
Lower gold prices + lower LTV… pawning advances will contract
Growth in Total LKR LendingLower Pawning Advances…
Falling LTV ratios combined with lower gold prices will reduce
pawning advances
515
434
60
All amounts in LKR Bn.
277
454
585 593
475
2010 2011 2012 Apr-13 2013E
16.9% 21.1% 22.6% 22.8% -
-
100
200
300
400
500
600
700
64.1%
28.7%
1.5%
-20.0%
Pawning as a % of total LKR lending
338 304
51
177
130
9
2011 2012 Apr-13
64.1% 28.7% 1.5%
31.5% 20.2% 2.3%
Pawning advances
Other advances
Pawning growth
LKR lending growth
Source: Central Bank of Sri Lanka, JBS Research Analysis
Page 63JB Securities Research July 2013
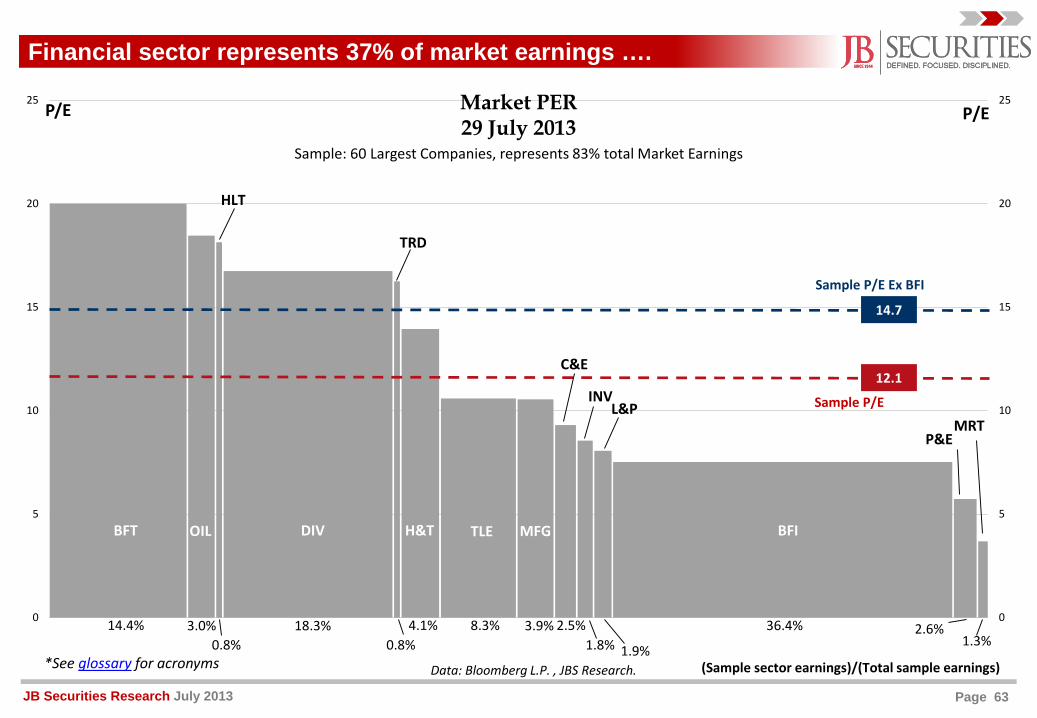
0
5
10
15
20
25
0
5
10
15
20
25
BFT OIL DIV H&T TLE BFI
HLT
TRD
MFG
INVL&P
P&EMRT
P/E
Sample P/E Ex BFI
Sample P/E
P/E
12.1
14.7
14.4% 3.0% 18.3% 4.1% 8.3% 36.4%0.8% 0.8%
3.9% 2.5%
1.9%1.8%2.6%
1.3%
Data: Bloomberg L.P. , JBS Research. (Sample sector earnings)/(Total sample earnings)
Market PER29 July 2013
Sample: 60 Largest Companies, represents 83% total Market Earnings
C&E
Financial sector represents 37% of market earnings ….
*See glossary for acronyms
Page 64JB Securities Research July 2013
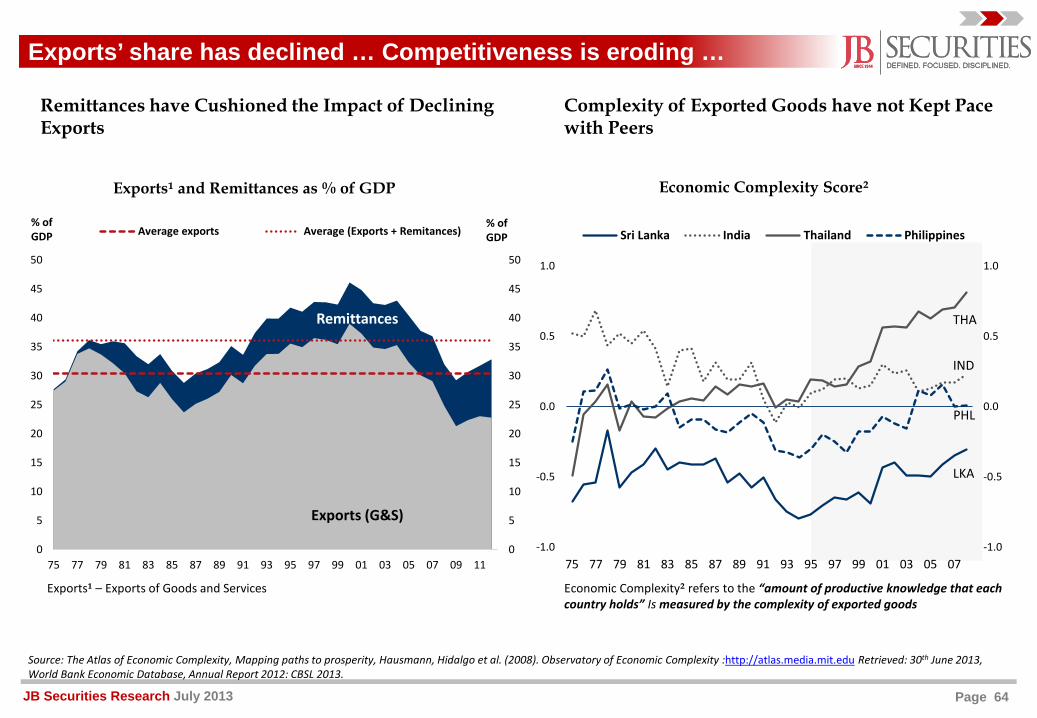
Exports’ share has declined … Competitiveness is eroding …
-1.0
-0.5
0.0
0.5
1.0
-1.0
-0.5
0.0
0.5
1.0
75 77 79 81 83 85 87 89 91 93 95 97 99 01 03 05 07
Economic Complexity Score²
Sri Lanka India Thailand Philippines
LKA
PHL
IND
THA
Source: The Atlas of Economic Complexity, Mapping paths to prosperity, Hausmann, Hidalgo et al. (2008). Observatory of Economic Complexity :http://atlas.media.mit.edu Retrieved: 30th June 2013,World Bank Economic Database, Annual Report 2012: CBSL 2013.
Economic Complexity² refers to the “amount of productive knowledge that each country holds” Is measured by the complexity of exported goods
Exports¹ – Exports of Goods and Services
0
5
10
15
20
25
30
35
40
45
50
0
5
10
15
20
25
30
35
40
45
50
75 77 79 81 83 85 87 89 91 93 95 97 99 01 03 05 07 09 11
Exports¹ and Remittances as % of GDP
Average exports Average (Exports + Remitances)% of GDP
% of GDP
Exports (G&S)
Remittances
Remittances have Cushioned the Impact of Declining Exports
Complexity of Exported Goods have not Kept Pace with Peers
Page 65JB Securities Research July 2013
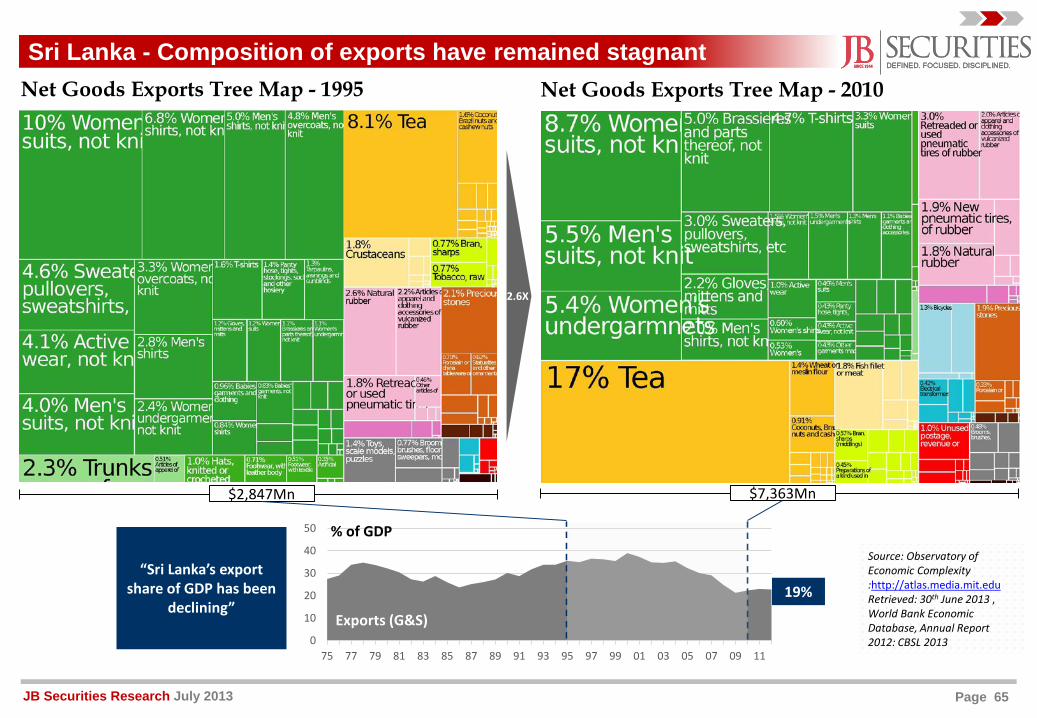
Sri Lanka - Composition of exports have remained stagnantNet Goods Exports Tree Map - 2010Net Goods Exports Tree Map - 1995
$2,847Mn $7,363Mn
0
10
20
30
40
50
75 77 79 81 83 85 87 89 91 93 95 97 99 01 03 05 07 09 11
Exports (G&S)
“Sri Lanka’s export share of GDP has been
declining”
% of GDP
19%
2.6X
Source: Observatory of Economic Complexity :http://atlas.media.mit.eduRetrieved: 30th June 2013 , World Bank Economic Database, Annual Report 2012: CBSL 2013
Page 66JB Securities Research July 2013
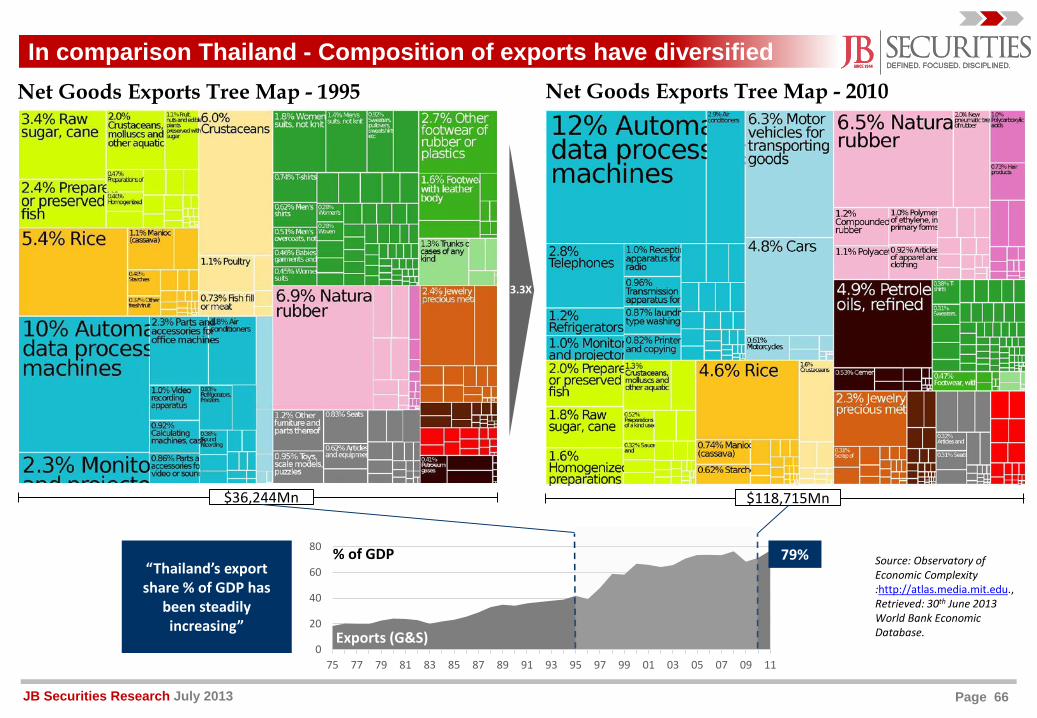
In comparison Thailand - Composition of exports have diversifiedNet Goods Exports Tree Map - 2010Net Goods Exports Tree Map - 1995
$36,244Mn $118,715Mn
0
20
40
60
80
75 77 79 81 83 85 87 89 91 93 95 97 99 01 03 05 07 09 11
“Thailand’s export share % of GDP has
been steadily increasing”
Exports (G&S)
% of GDP 79%
3.3X
Source: Observatory of Economic Complexity :http://atlas.media.mit.edu.,Retrieved: 30th June 2013World Bank Economic Database.
Page 67JB Securities Research July 2013
Source: Central Bank of Sri Lanka, Asian Development Bank
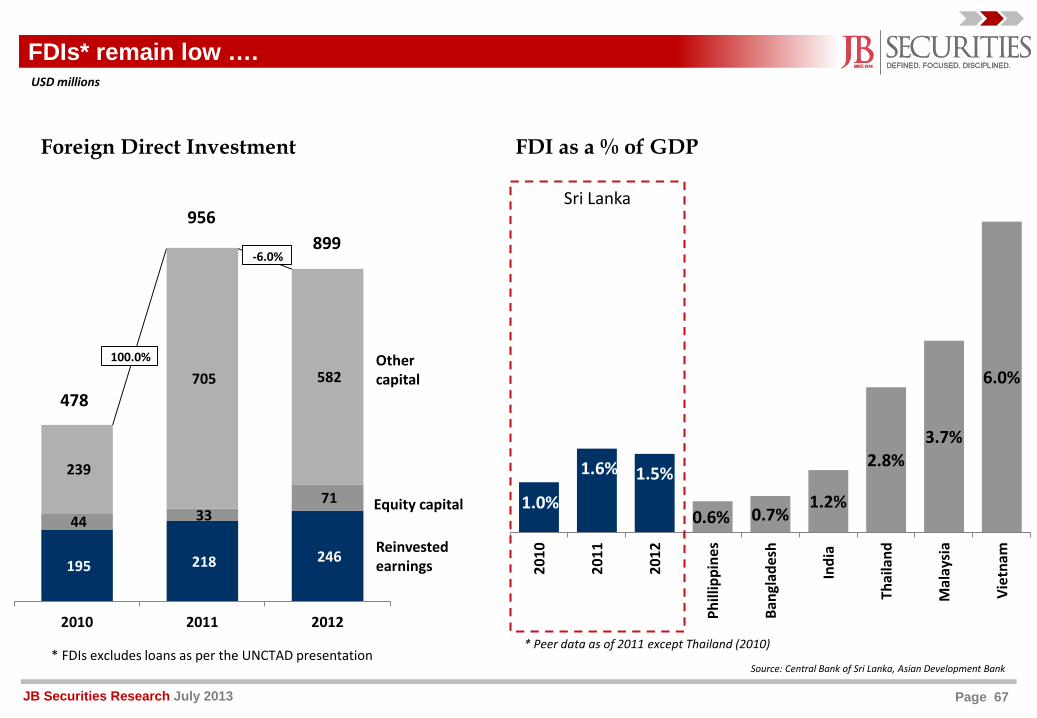
Foreign Direct Investment FDI as a % of GDP
* FDIs excludes loans as per the UNCTAD presentation* Peer data as of 2011 except Thailand (2010)
FDIs* remain low ….
Reinvested earnings
Other capital
Equity capital
USD millions
195 218 246
44 33 71
239
705 582
2010 2011 2012
956
1.0%
1.6% 1.5%
0.6% 0.7%1.2%
2.8%3.7%
6.0%
2010
2011
2012
Phill
ippi
nes
Bang
lade
sh
Indi
a
Thai
land
Mal
aysi
a
Viet
nam
478
899
100.0%
-6.0%
Sri Lanka
Page 68JB Securities Research July 2013
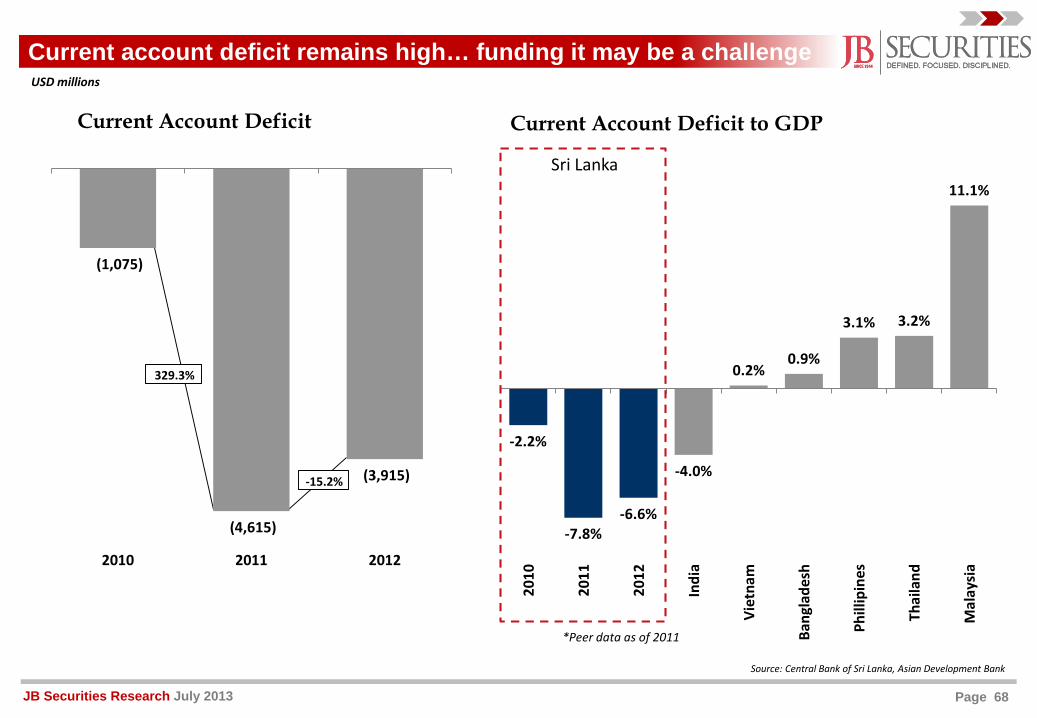
-2.2%
-7.8%-6.6%
-4.0%
0.2%0.9%
3.1% 3.2%
11.1%
2010
2011
2012
Indi
a
Viet
nam
Bang
lade
sh
Phill
ipin
es
Thai
land
Mal
aysi
a
(1,075)
(4,615)
(3,915)
2010 2011 2012
Current account deficit remains high… funding it may be a challenge
Current Account Deficit to GDPCurrent Account Deficit
USD millions
Source: Central Bank of Sri Lanka, Asian Development Bank
*Peer data as of 2011
329.3%
-15.2%
Sri Lanka
Page 69JB Securities Research July 2013
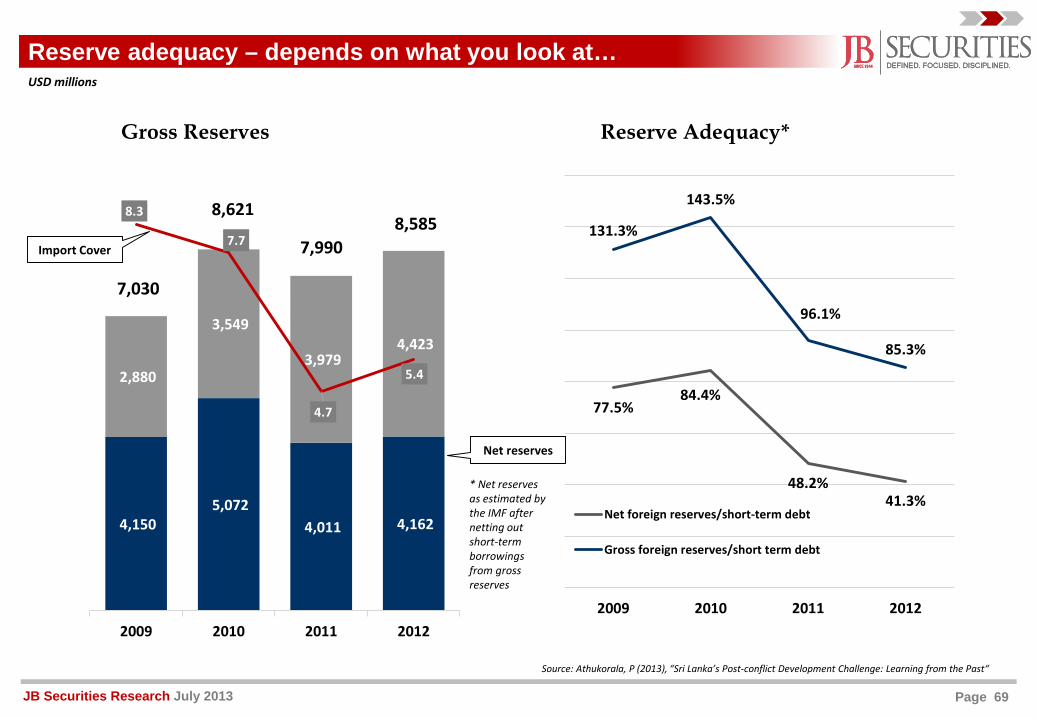
4,150 5,072
4,011 4,162
2,880
3,549
3,979 4,423
8.3
7.7
4.7
5.4
0
1
2
3
4
5
6
7
8
9
-
1,00 0
2,00 0
3,00 0
4,00 0
5,00 0
6,00 0
7,00 0
8,00 0
9,00 0
10,0 00
2009 2010 2011 2012
Reserve Adequacy*Gross Reserves
Reserve adequacy – depends on what you look at…USD millions
Net reserves
7,030
8,621
7,9908,585
77.5%84.4%
48.2%41.3%
131.3%
143.5%
96.1%
85.3%
2009 2010 2011 2012
Net foreign reserves/short-term debt
Gross foreign reserves/short term debt
Source: Athukorala, P (2013), “Sri Lanka’s Post-conflict Development Challenge: Learning from the Past“
* Net reserves as estimated by the IMF after netting out short-term borrowings from gross reserves
Import Cover
Page 70JB Securities Research July 2013
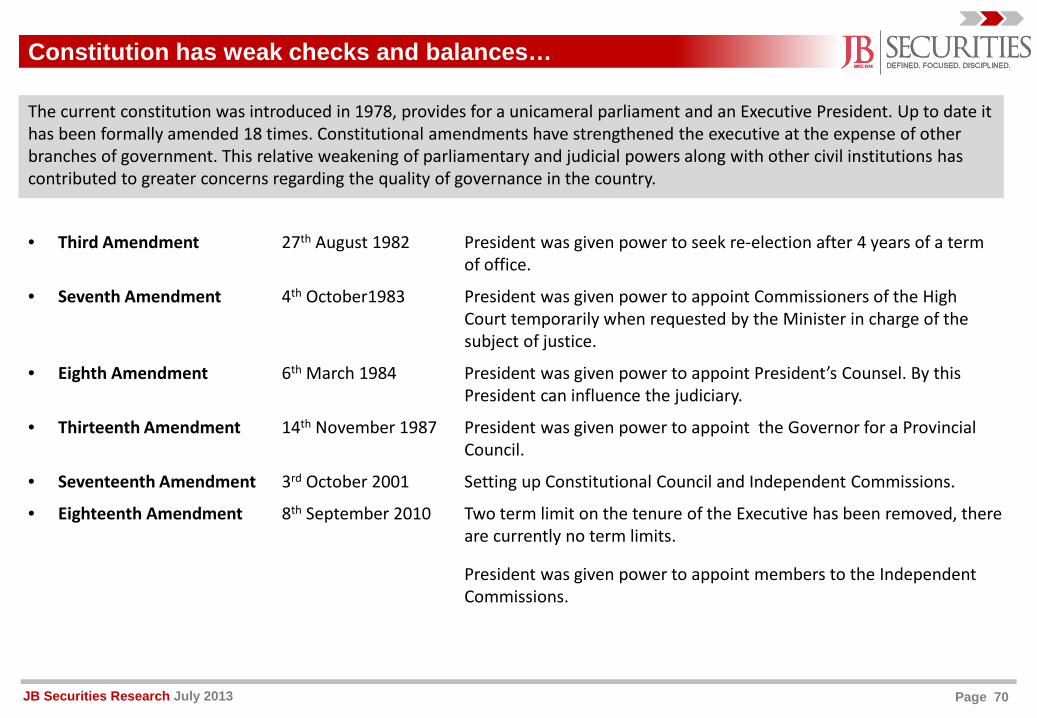
• Third Amendment 27th August 1982 President was given power to seek re-election after 4 years of a term of office.
• Seventh Amendment 4th October1983 President was given power to appoint Commissioners of the High Court temporarily when requested by the Minister in charge of the subject of justice.
• Eighth Amendment 6th March 1984 President was given power to appoint President’s Counsel. By this President can influence the judiciary.
• Thirteenth Amendment 14th November 1987 President was given power to appoint the Governor for a Provincial Council.
• Seventeenth Amendment 3rd October 2001 Setting up Constitutional Council and Independent Commissions.
• Eighteenth Amendment 8th September 2010 Two term limit on the tenure of the Executive has been removed, there are currently no term limits.
President was given power to appoint members to the Independent Commissions.
The current constitution was introduced in 1978, provides for a unicameral parliament and an Executive President. Up to date it has been formally amended 18 times. Constitutional amendments have strengthened the executive at the expense of other branches of government. This relative weakening of parliamentary and judicial powers along with other civil institutions has contributed to greater concerns regarding the quality of governance in the country.
Constitution has weak checks and balances…
Page 71JB Securities Research July 2013
Recap of the last 12 months…
Potential risks exist…
Investment case remains…
Page 72JB Securities Research July 2013
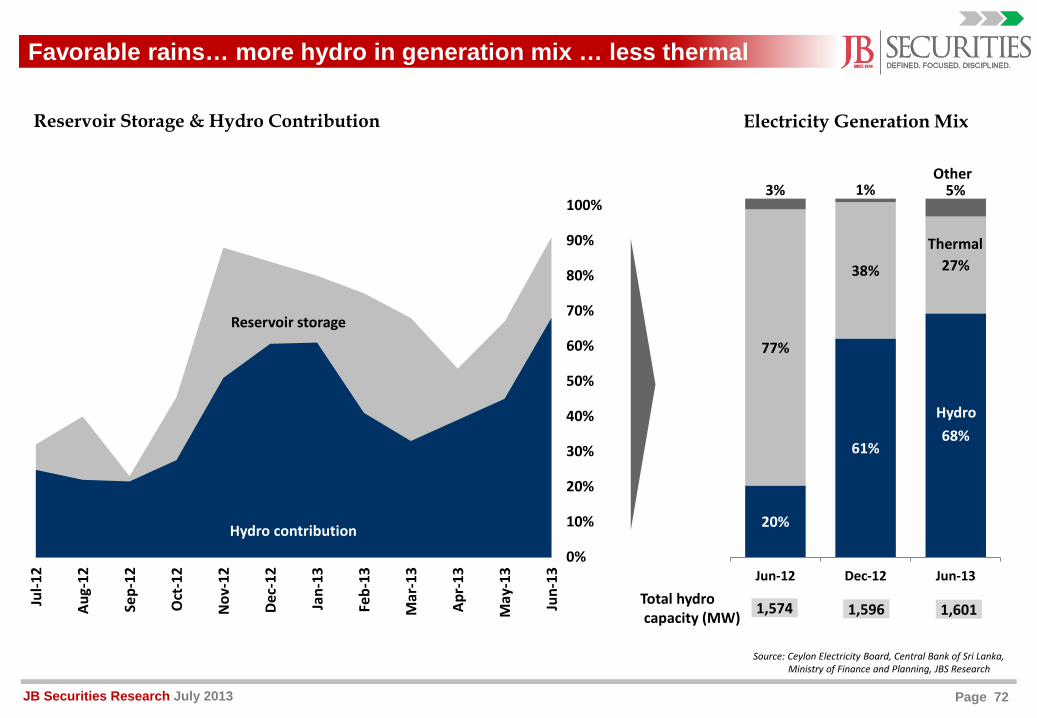
Favorable rains… more hydro in generation mix … less thermal
Total hydrocapacity (MW)
0%
10%
20%
30%
40%
50%
60%
70%
80%
90%
100%
Jul-1
2
Aug-
12
Sep-
12
Oct
-12
Nov
-12
Dec-
12
Jan-
13
Feb-
13
Mar
-13
Apr-
13
May
-13
Jun-
13Hydro contribution
Reservoir storage
20%
61%68%
77%
38% 27%
3% 1% 5%
Jun-12 Dec-12 Jun-13
Hydro
Thermal
Other
Source: Ceylon Electricity Board, Central Bank of Sri Lanka,Ministry of Finance and Planning, JBS Research
1,574 1,596 1,601
Reservoir Storage & Hydro Contribution Electricity Generation Mix
Page 73JB Securities Research July 2013
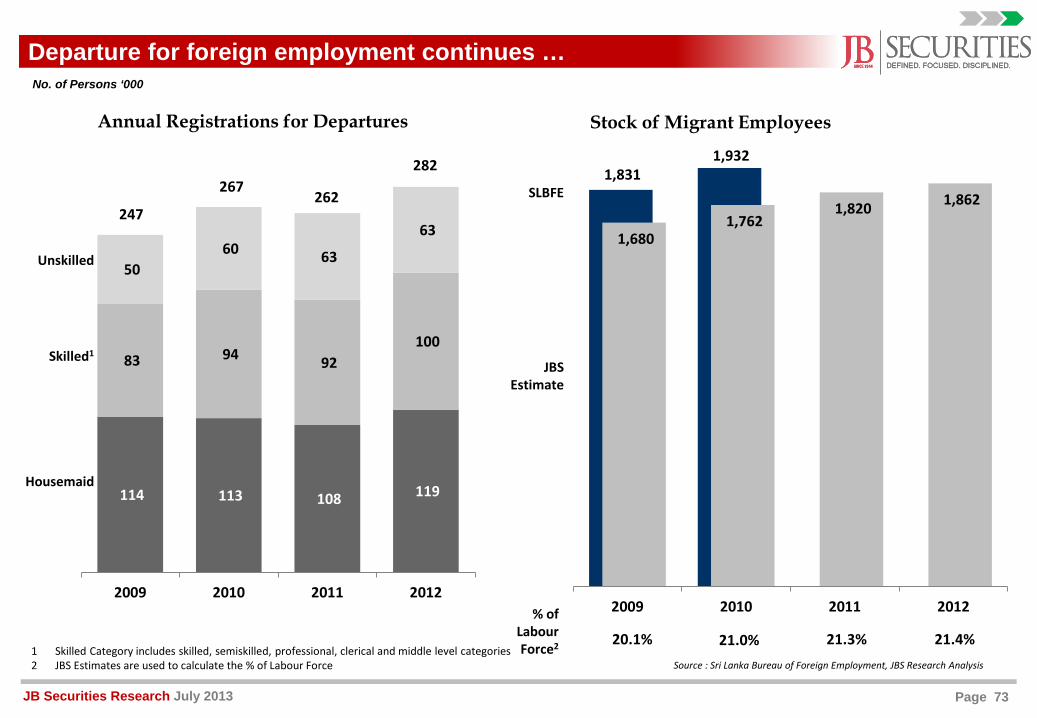
20.1% 21.0% 21.3% 21.4%
No. of Persons ‘000
114 113 108 119
83 94 92 100
50 60 63
63
2009 2010 2011 2012
Housemaid
Unskilled
Skilled1
247
267262
282
SLBFE
JBS Estimate
% of LabourForce21 Skilled Category includes skilled, semiskilled, professional, clerical and middle level categories
2 JBS Estimates are used to calculate the % of Labour Force Source : Sri Lanka Bureau of Foreign Employment, JBS Research Analysis
1,831 1,932
1,680 1,762
1,820 1,862
2009 2010 2011 2012
Departure for foreign employment continues …
Stock of Migrant EmployeesAnnual Registrations for Departures
Page 74JB Securities Research July 2013
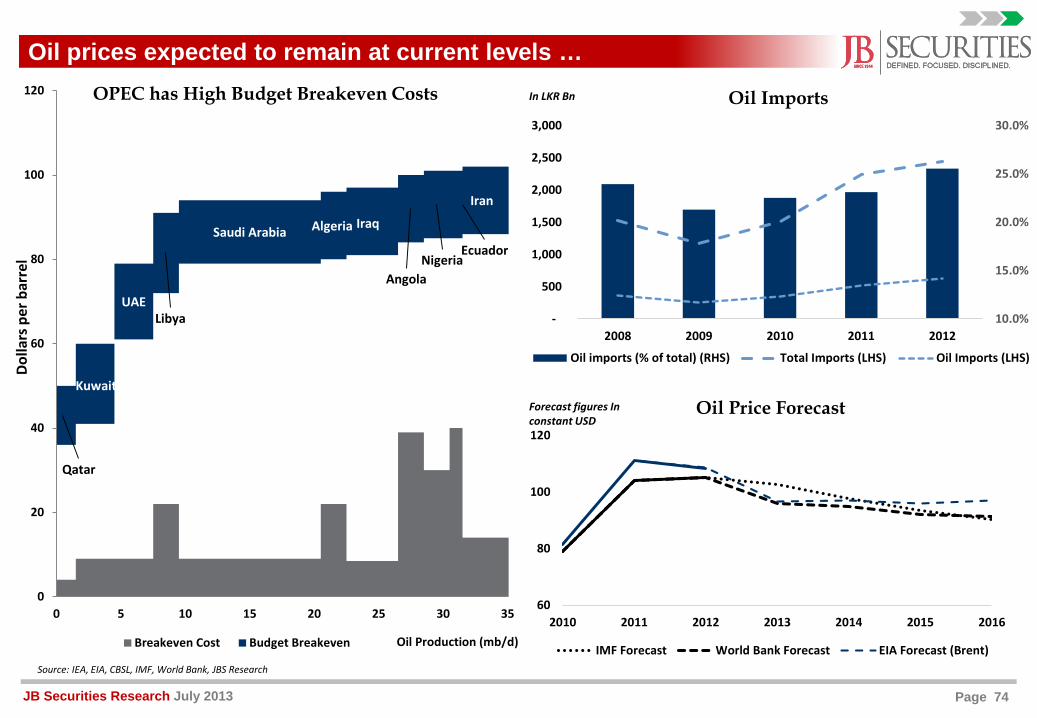
Qatar
Kuwait
UAELibya
Saudi Arabia Algeria Iraq
AngolaNigeria
Ecuador
Iran
0
20
40
60
80
100
120
0 5 10 15 20 25 30 35
Dolla
rs p
er b
arre
l
Oil Production (mb/d)
OPEC has High Budget Breakeven Costs
Breakeven Cost Budget Breakeven
Oil prices expected to remain at current levels …
60
80
100
120
2010 2011 2012 2013 2014 2015 2016
Oil Price Forecast
IMF Forecast World Bank Forecast EIA Forecast (Brent)
10.0%
15.0%
20.0%
25.0%
30.0%
-
500
1,000
1,500
2,000
2,500
3,000
2008 2009 2010 2011 2012
Oil Imports
Oil imports (% of total) (RHS) Total Imports (LHS) Oil Imports (LHS)
Source: IEA, EIA, CBSL, IMF, World Bank, JBS Research
In LKR Bn
Forecast figures In constant USD
Page 75JB Securities Research July 2013
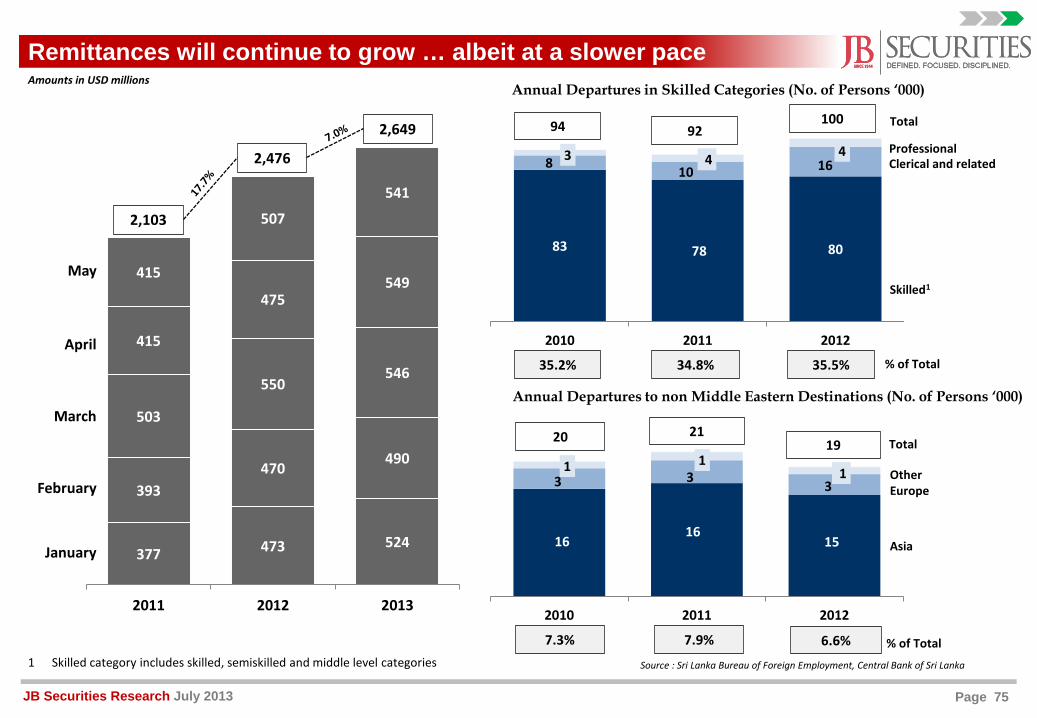
377 473 524
393470 490
503
550546
415
475549
415
507
541
2011 2012 2013
Amounts in USD millions
2,103
2,476
2,649
Annual Departures in Skilled Categories (No. of Persons ‘000)
Annual Departures to non Middle Eastern Destinations (No. of Persons ‘000)
Source : Sri Lanka Bureau of Foreign Employment, Central Bank of Sri Lanka1 Skilled category includes skilled, semiskilled and middle level categories
1616
15
3 3 31 1
1
2010 2011 2012
Europe
Asia
Other
20 2119
7.3% 7.9% 6.6%
83 78 80
8 10 163 4 4
2010 2011 2012
Professional
Skilled1
Clerical and related
94
35.2%
92100
34.8% 35.5%
Total
% of Total
Total
% of Total
January
February
March
April
May
Remittances will continue to grow … albeit at a slower pace
Page 76JB Securities Research July 2013
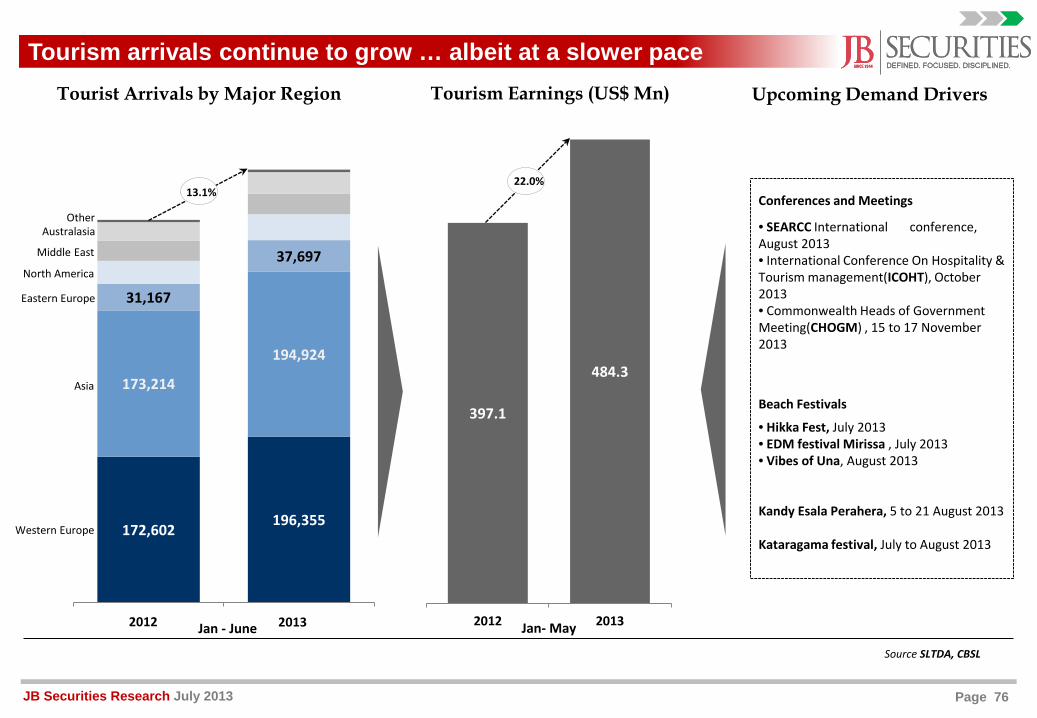
Tourism arrivals continue to grow … albeit at a slower pace
397.1
484.3
2012 2013
172,602 196,355
173,214
194,924
31,167
37,697
2012 2013
Source SLTDA, CBSL
Middle East
Eastern Europe
Australasia
Asia
Western Europe
Other
North America
Tourist Arrivals by Major Region
Jan - June
Conferences and Meetings
• SEARCC International conference, August 2013• International Conference On Hospitality & Tourism management(ICOHT), October 2013• Commonwealth Heads of Government Meeting(CHOGM) , 15 to 17 November 2013
Beach Festivals
• Hikka Fest, July 2013• EDM festival Mirissa , July 2013• Vibes of Una, August 2013
Kandy Esala Perahera, 5 to 21 August 2013
Kataragama festival, July to August 2013
20132012
Upcoming Demand DriversTourism Earnings (US$ Mn)
Jan- May
13.1%22.0%
Page 77JB Securities Research July 2013
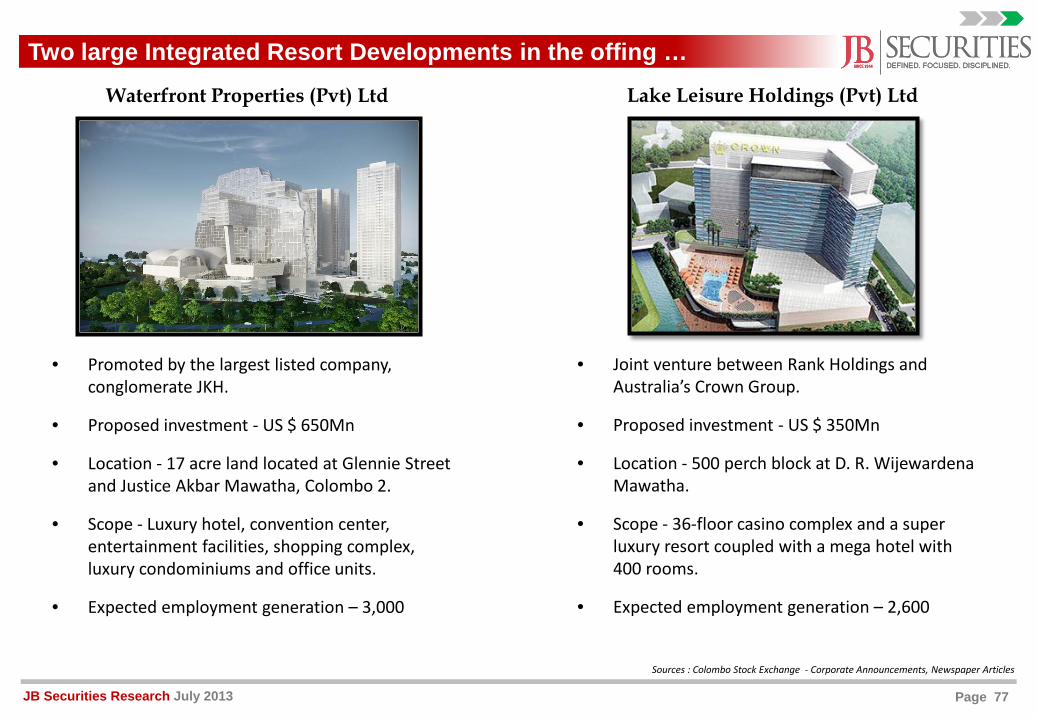
Two large Integrated Resort Developments in the offing …
Sources : Colombo Stock Exchange - Corporate Announcements, Newspaper Articles
Waterfront Properties (Pvt) Ltd
• Promoted by the largest listed company, conglomerate JKH.
• Proposed investment - US $ 650Mn
• Location - 17 acre land located at Glennie Street and Justice Akbar Mawatha, Colombo 2.
• Scope - Luxury hotel, convention center, entertainment facilities, shopping complex, luxury condominiums and office units.
• Expected employment generation – 3,000
Lake Leisure Holdings (Pvt) Ltd
• Joint venture between Rank Holdings and Australia’s Crown Group.
• Proposed investment - US $ 350Mn
• Location - 500 perch block at D. R. Wijewardena Mawatha.
• Scope - 36-floor casino complex and a super luxury resort coupled with a mega hotel with 400 rooms.
• Expected employment generation – 2,600
Page 78JB Securities Research July 2013
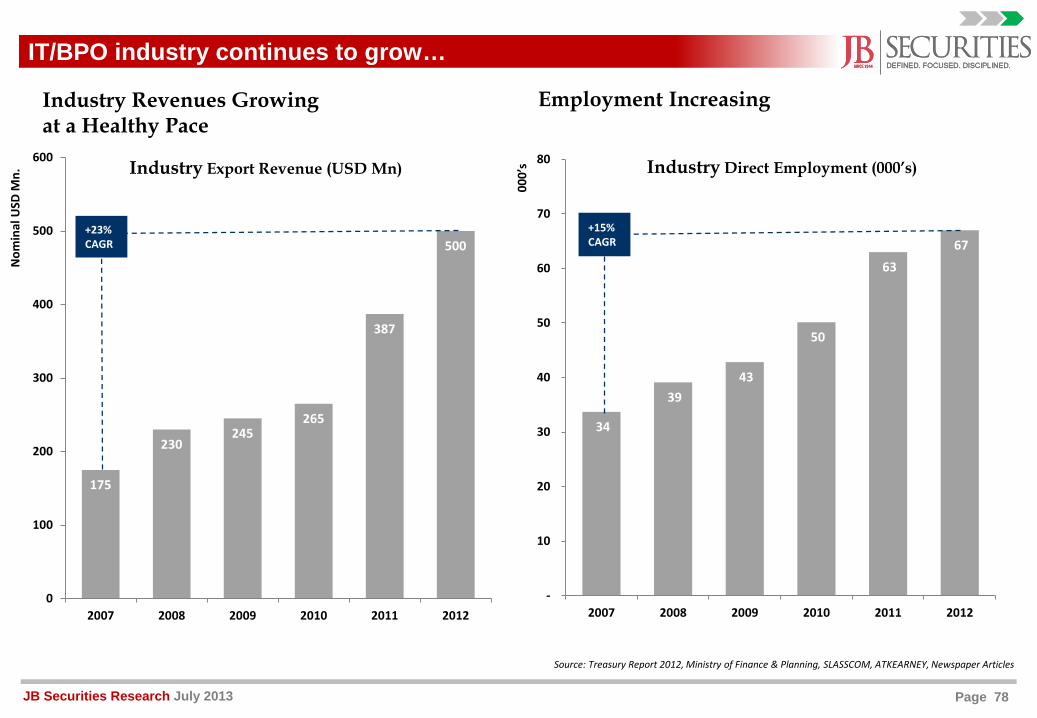
Source: Treasury Report 2012, Ministry of Finance & Planning, SLASSCOM, ATKEARNEY, Newspaper Articles
Industry Revenues Growing at a Healthy Pace
Nom
inal
USD
Mn.
IT/BPO industry continues to grow…
Employment Increasing
34
39 43
50
63 67
-
10
20
30
40
50
60
70
80
2007 2008 2009 2010 2011 2012
000’
s
+15% CAGR
Industry Direct Employment (000’s)
175
230245
265
387
500
0
100
200
300
400
500
600
2007 2008 2009 2010 2011 2012
+23% CAGR
Industry Export Revenue (USD Mn)
Page 79JB Securities Research July 2013
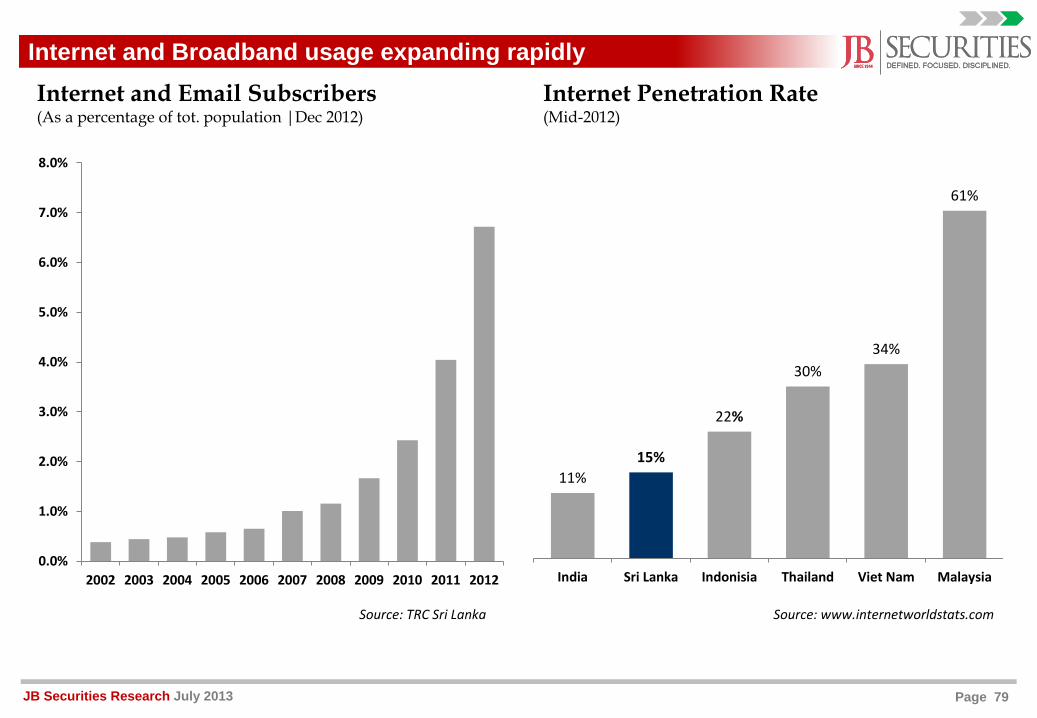
0.0%
1.0%
2.0%
3.0%
4.0%
5.0%
6.0%
7.0%
8.0%
2002 2003 2004 2005 2006 2007 2008 2009 2010 2011 2012
Source: www.internetworldstats.comSource: TRC Sri Lanka
Internet and Email Subscribers(As a percentage of tot. population |Dec 2012)
Internet and Broadband usage expanding rapidlyInternet Penetration Rate(Mid-2012)
11%15%
22%
30%34%
61%
India Sri Lanka Indonisia Thailand Viet Nam Malaysia
Page 80JB Securities Research July 2013
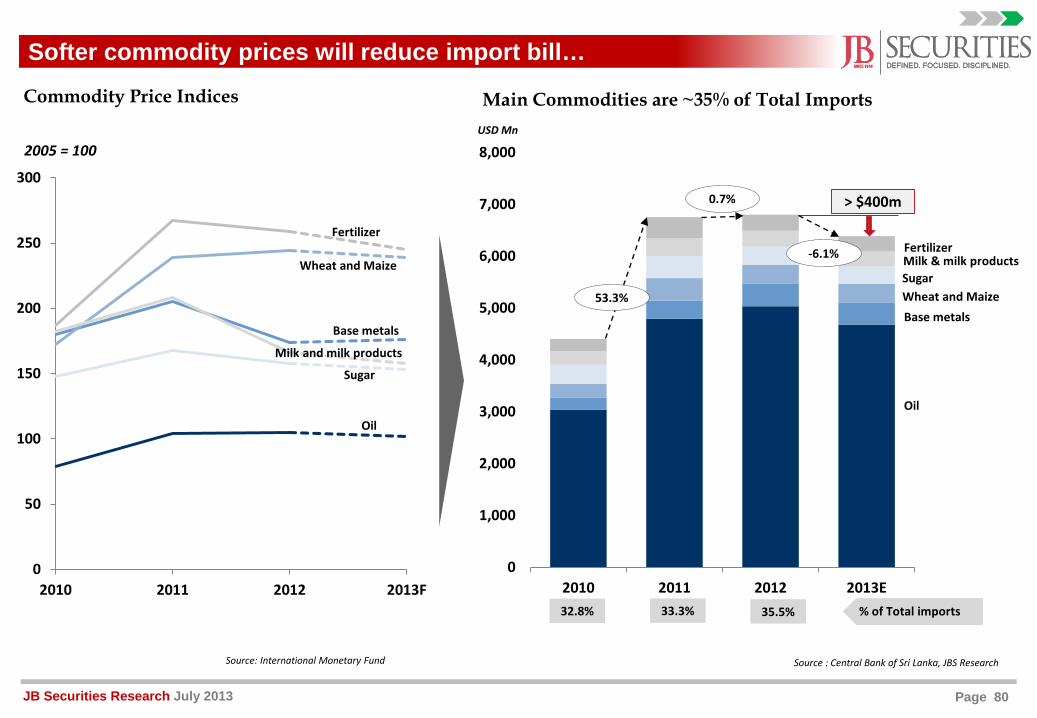
0
1,000
2,000
3,000
4,000
5,000
6,000
7,000
8,000
2010 2011 2012 2013E
Main Commodities are ~35% of Total Imports
Milk & milk products
32.8% 33.3% 35.5% % of Total imports
> $400m
0
50
100
150
200
250
300
2010 2011 2012 2013F
Commodity Price Indices
2005 = 100
Source: International Monetary Fund
Oil
Base metals
Sugar
Milk and milk products
Wheat and Maize
Fertilizer
0.7%
-6.1%
53.3%
Oil
Base metalsWheat and MaizeSugar
Fertilizer
Source : Central Bank of Sri Lanka, JBS Research
USD Mn
Softer commodity prices will reduce import bill…
Page 81JB Securities Research July 2013
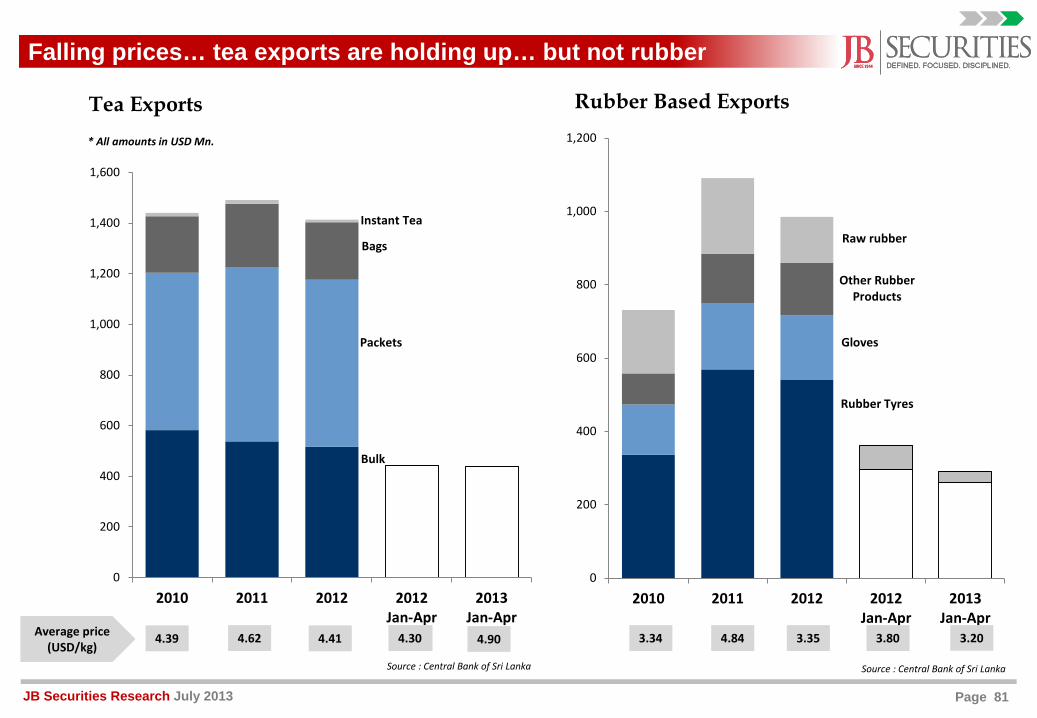
Rubber Tyres
Gloves
Other Rubber Products
Raw rubber
0
200
400
600
800
1,000
1,200
2010 2011 2012 2012Jan-Apr
2013Jan-Apr
Rubber Based Exports
3.203.803.34 4.84 3.35
Source : Central Bank of Sri Lanka
Bulk
Packets
Bags
Instant Tea
0
200
400
600
800
1,000
1,200
1,400
1,600
2010 2011 2012 2012Jan-Apr
2013Jan-Apr
Tea Exports
4.30 4.90
Source : Central Bank of Sri Lanka
4.39 4.62 4.41Average price(USD/kg)
* All amounts in USD Mn.
Falling prices… tea exports are holding up… but not rubber
Page 82JB Securities Research July 2013
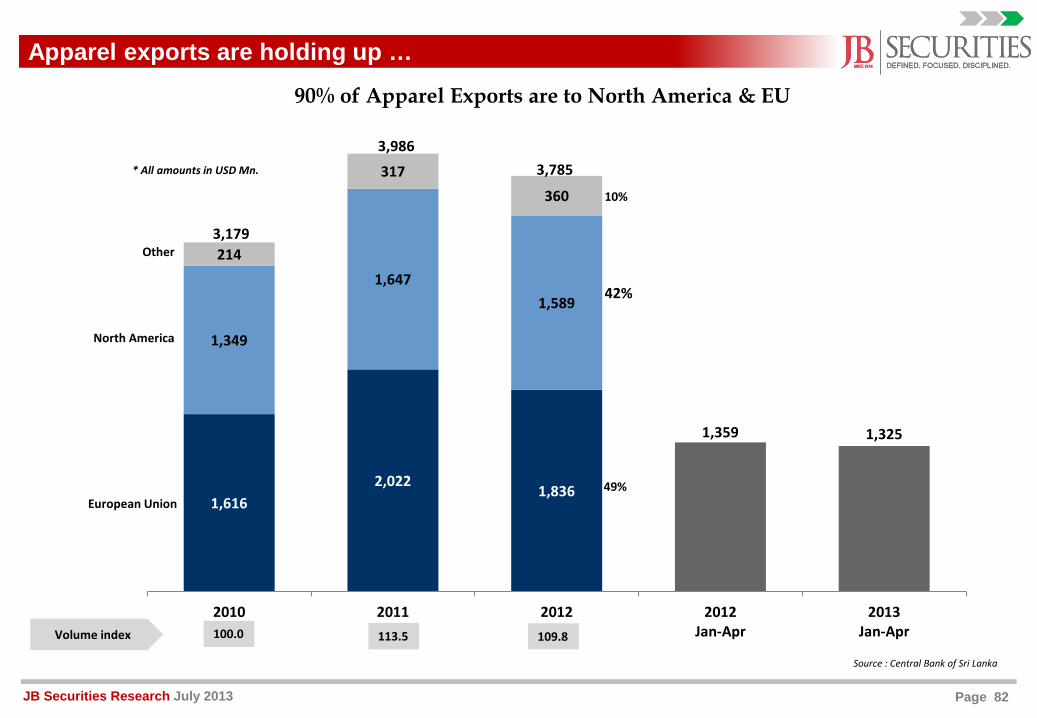
1,6162,022
1,836
1,359 1,325
1,349
1,6471,589
214
317360
0
500
1,000
1,500
2,000
2,500
3,000
3,500
4,000
4,500
2010 2011 2012 2012Jan-Apr
2013Jan-Apr
90% of Apparel Exports are to North America & EU
49%
109.8100.0 113.5Volume index
Source : Central Bank of Sri Lanka
European Union
North America
Other3,179
3,9863,785
10%
42%
* All amounts in USD Mn.
Apparel exports are holding up …
Page 83JB Securities Research July 2013
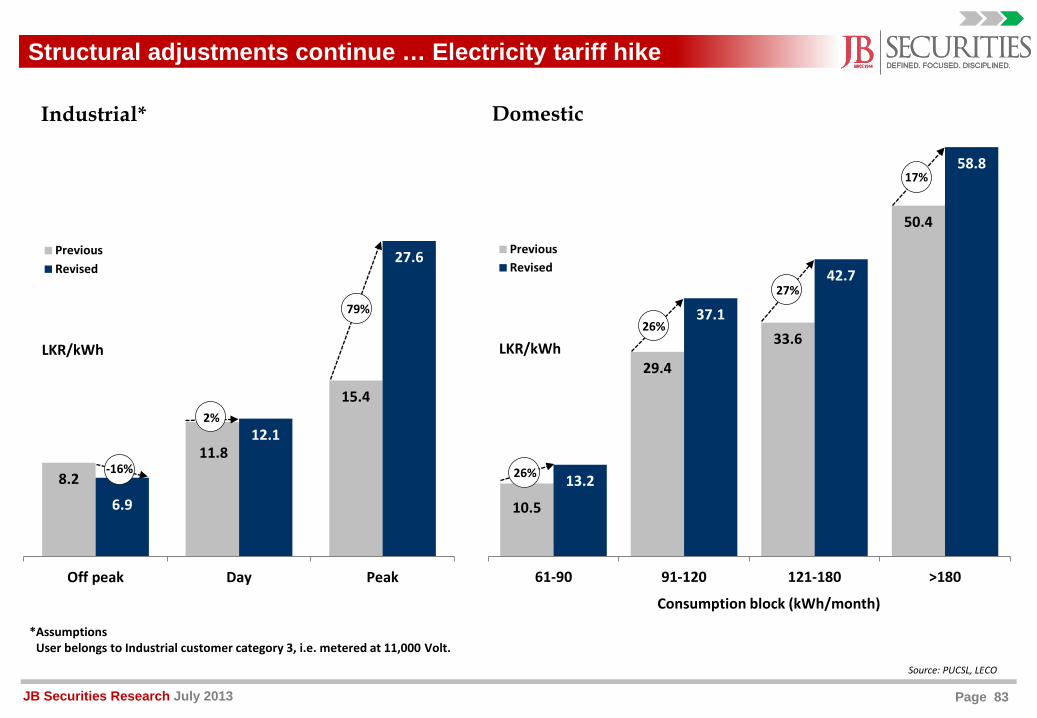
Structural adjustments continue … Electricity tariff hike
8.2
11.8
15.4
6.9
12.1
27.6
Off peak Day Peak
Industrial*
PreviousRevised
10.5
29.4
33.6
50.4
13.2
37.1
42.7
58.8
61-90 91-120 121-180 >180
Consumption block (kWh/month)
Domestic
PreviousRevised
LKR/kWh
Source: PUCSL, LECO
*AssumptionsUser belongs to Industrial customer category 3, i.e. metered at 11,000 Volt.
79%
2%
-16% 26%
26%
27%
17%
LKR/kWh
Page 84JB Securities Research July 2013
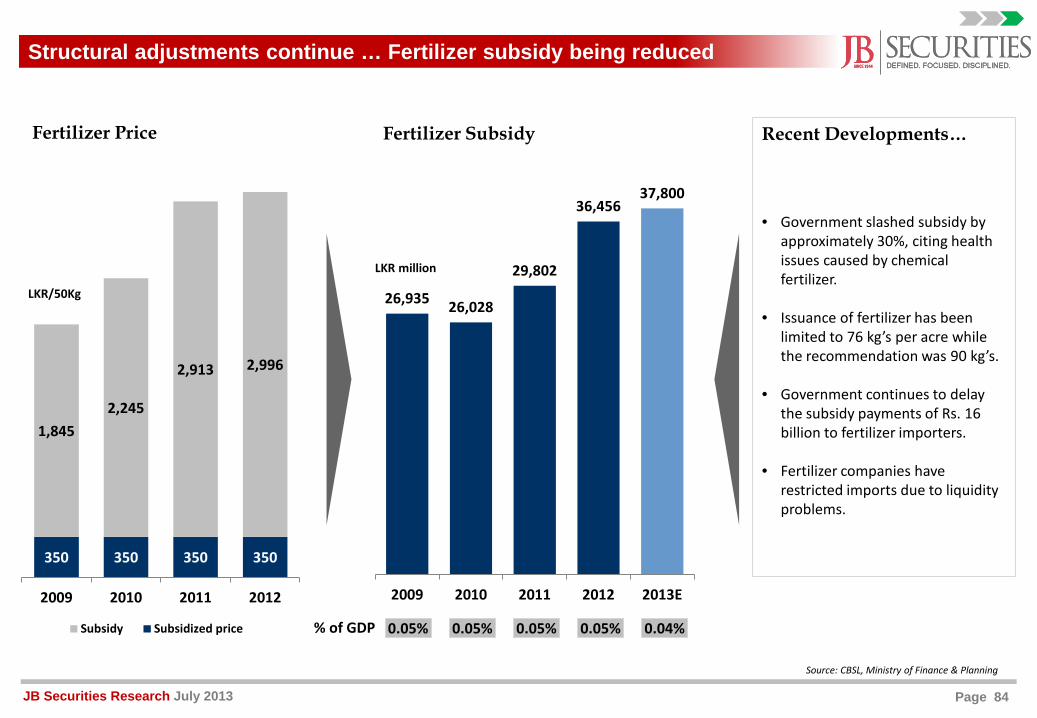
Structural adjustments continue … Fertilizer subsidy being reduced
26,935 26,028
29,802
36,45637,800
2009 2010 2011 2012 2013E
Fertilizer Subsidy
0.05% 0.05% 0.05%0.05% 0.04%% of GDP
LKR million
Source: CBSL, Ministry of Finance & Planning
350 350 350 350
1,8452,245
2,913 2,996
2009 2010 2011 2012
Subsidy Subsidized price
Fertilizer Price
LKR/50Kg
Recent Developments…
• Government slashed subsidy by approximately 30%, citing health issues caused by chemical fertilizer.
• Issuance of fertilizer has been limited to 76 kg’s per acre while the recommendation was 90 kg’s.
• Government continues to delay the subsidy payments of Rs. 16 billion to fertilizer importers.
• Fertilizer companies have restricted imports due to liquidity problems.
Page 85JB Securities Research July 2013
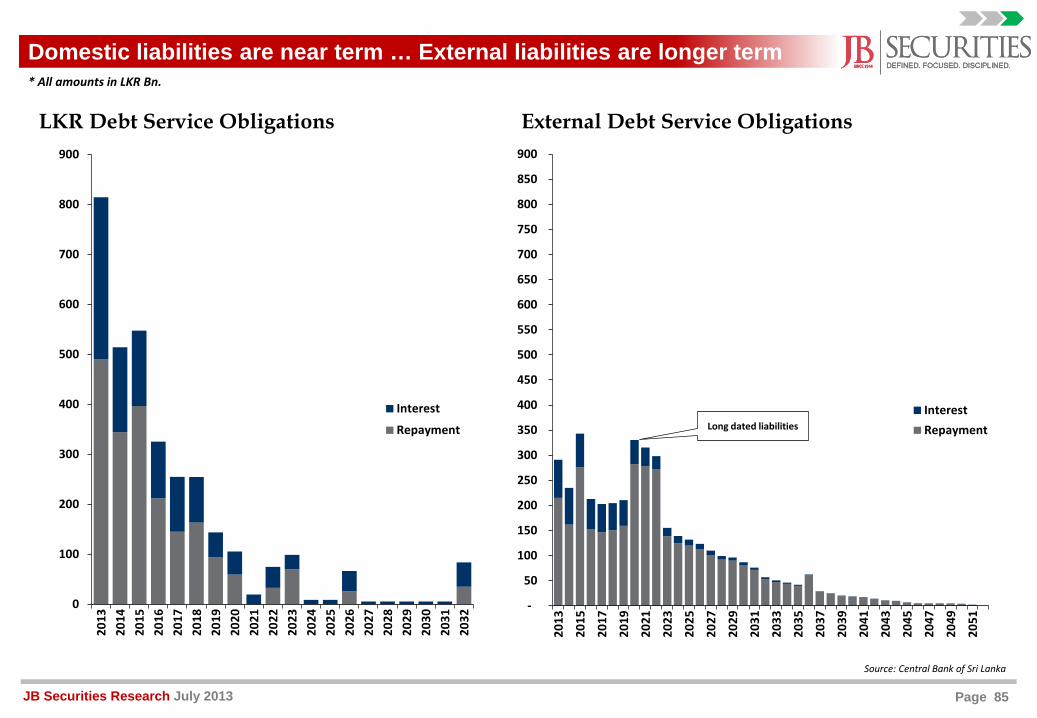
LKR Debt Service Obligations External Debt Service Obligations
0
100
200
300
400
500
600
700
800
900
2013
2014
2015
2016
2017
2018
2019
2020
2021
2022
2023
2024
2025
2026
2027
2028
2029
2030
2031
2032
Interest
Repayment
-
50
100
150
200
250
300
350
400
450
500
550
600
650
700
750
800
850
900
2013
2015
2017
2019
2021
2023
2025
2027
2029
2031
2033
2035
2037
2039
2041
2043
2045
2047
2049
2051
InterestRepayment
Domestic liabilities are near term … External liabilities are longer term* All amounts in LKR Bn.
Source: Central Bank of Sri Lanka
Long dated liabilities
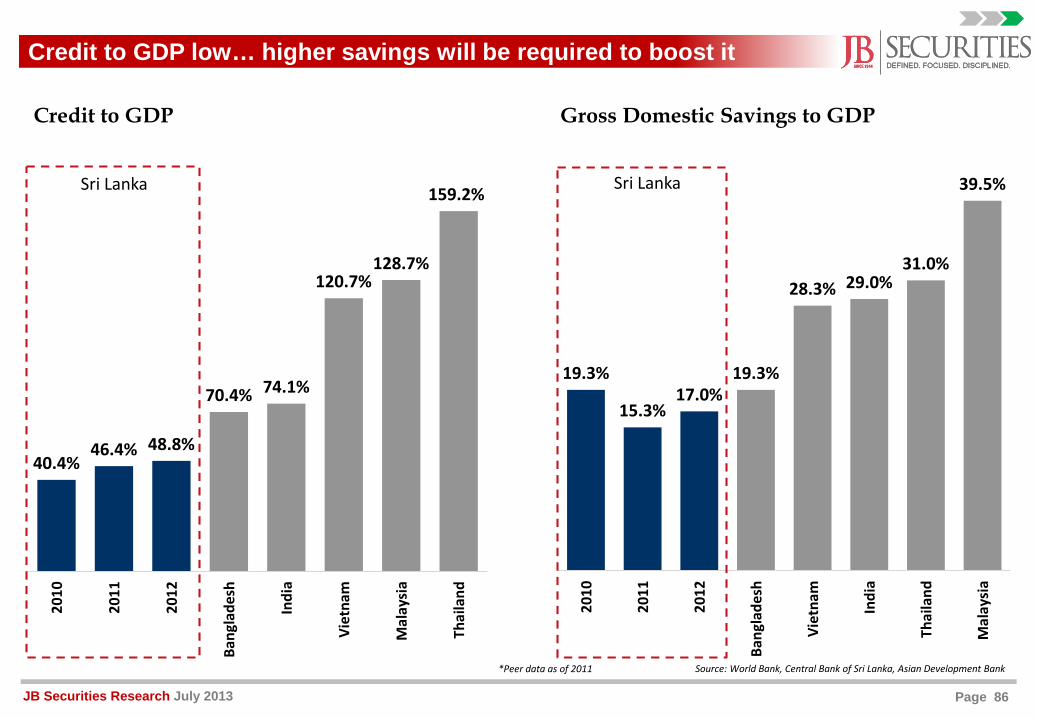
Page 86JB Securities Research July 2013
Credit to GDP low… higher savings will be required to boost it
Credit to GDP
19.3%
15.3%17.0%
19.3%
28.3% 29.0%31.0%
39.5%
2010
2011
2012
Bang
lade
sh
Viet
nam
Indi
a
Thai
land
Mal
aysi
a
40.4%46.4% 48.8%
70.4% 74.1%
120.7%128.7%
159.2%
2010
2011
2012
Bang
lade
sh
Indi
a
Viet
nam
Mal
aysi
a
Thai
land
Gross Domestic Savings to GDP
*Peer data as of 2011 Source: World Bank, Central Bank of Sri Lanka, Asian Development Bank
Sri LankaSri Lanka
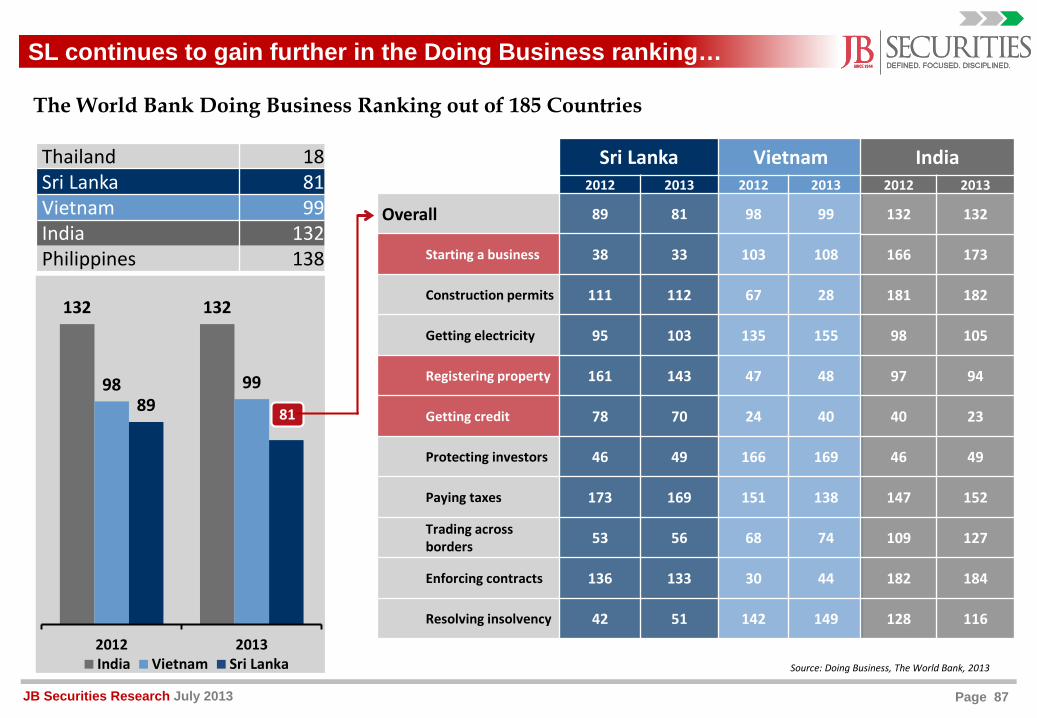
Page 87JB Securities Research July 2013
132 132
98 9989
2012 2013India Vietnam Sri Lanka
SL continues to gain further in the Doing Business ranking…
Sri Lanka Vietnam2012 2013 2012 2013
Overall 89 81 98 99
Starting a business 38 33 103 108
Construction permits 111 112 67 28
Getting electricity 95 103 135 155
Registering property 161 143 47 48
Getting credit 78 70 24 40
Protecting investors 46 49 166 169
Paying taxes 173 169 151 138
Trading across borders 53 56 68 74
Enforcing contracts 136 133 30 44
Resolving insolvency 42 51 142 149
81
The World Bank Doing Business Ranking out of 185 Countries
Source: Doing Business, The World Bank, 2013
Thailand 18 Sri Lanka 81 Vietnam 99India 132Philippines 138
India2012 2013
132 132
166 173
181 182
98 105
97 94
40 23
46 49
147 152
109 127
182 184
128 116
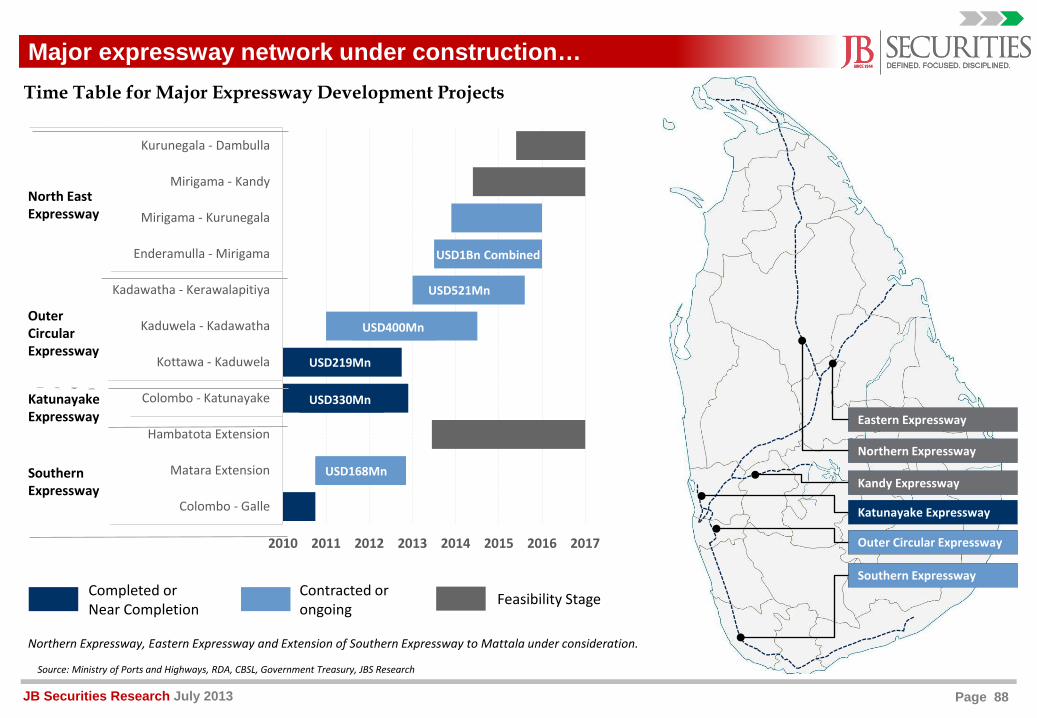
Page 88JB Securities Research July 2013
2010 2011 2012 2013 2014 2015 2016 2017
Colombo - Galle
Matara Extension
Hambatota Extension
Colombo - Katunayake
Kottawa - Kaduwela
Kaduwela - Kadawatha
Kadawatha - Kerawalapitiya
Enderamulla - Mirigama
Mirigama - Kurunegala
Mirigama - Kandy
Kurunegala - Dambulla
Sout
hern
Expr
essw
ay
Katu
nay
ake
Expr
ess
way
Out
er C
ircul
arEx
pres
sway
Nor
th-E
aste
rnEx
pres
sway
SouthernExpressway
Katunayake Expressway
USD1Bn Combined
Outer Circular Expressway
North East Expressway
Eastern Expressway
Northern Expressway
Outer Circular Expressway
Kandy Expressway
Katunayake Expressway
Southern ExpresswayCompleted orNear Completion
Contracted or ongoing
Feasibility Stage
Northern Expressway, Eastern Expressway and Extension of Southern Expressway to Mattala under consideration.
USD168Mn
USD330Mn
USD219Mn
USD400Mn
USD521Mn
Time Table for Major Expressway Development Projects
Source: Ministry of Ports and Highways, RDA, CBSL, Government Treasury, JBS Research
Major expressway network under construction…
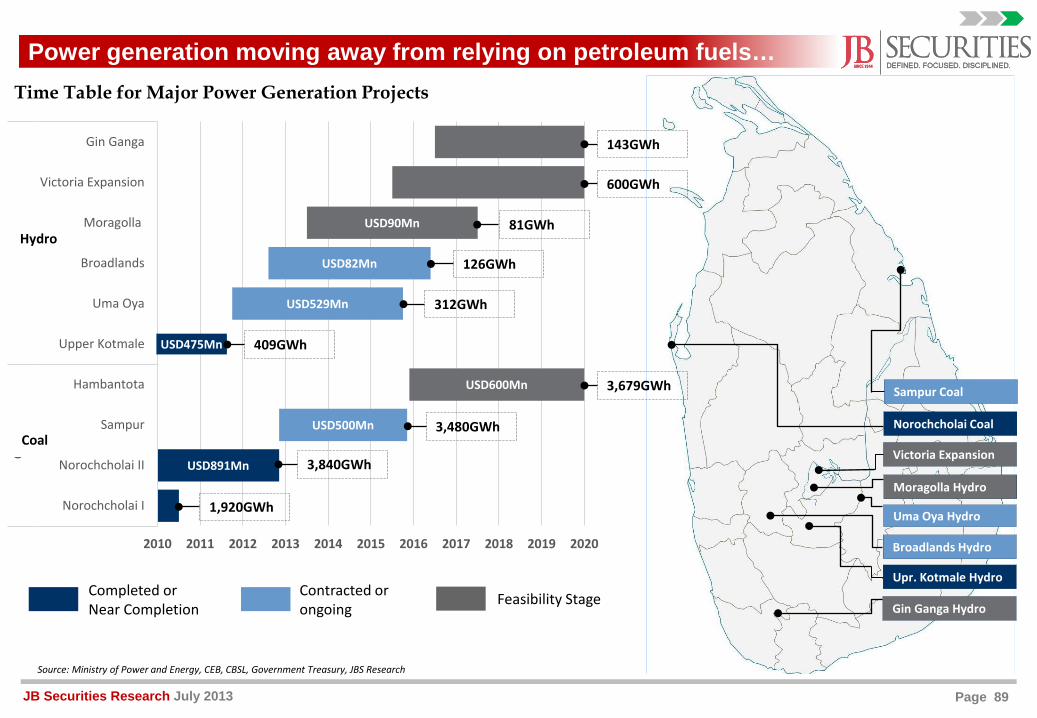
Page 89JB Securities Research July 2013
USD475Mn
USD891Mn
USD500Mn
USD600Mn
USD529Mn
USD82Mn
USD90Mn
2010 2011 2012 2013 2014 2015 2016 2017 2018 2019 2020
Norochcholai I
Norochcholai II
Sampur
Hambantota
Upper Kotmale
Uma Oya
Broadlands
Moragolla
Victoria Expansion
Gin Ganga
Coal
Hydr
o
Power generation moving away from relying on petroleum fuels…
Sampur Coal
Time Table for Major Power Generation Projects
Hydro
CoalNorochcholai Coal
Victoria Expansion
Broadlands Hydro
Upr. Kotmale Hydro
Moragolla Hydro
Gin Ganga Hydro
Uma Oya Hydro
Completed orNear Completion
Contracted or ongoing
Feasibility Stage
1,920GWh
3,840GWh
3,480GWh
3,679GWh
409GWh
312GWh
126GWh
81GWh
600GWh
143GWh
Source: Ministry of Power and Energy, CEB, CBSL, Government Treasury, JBS Research
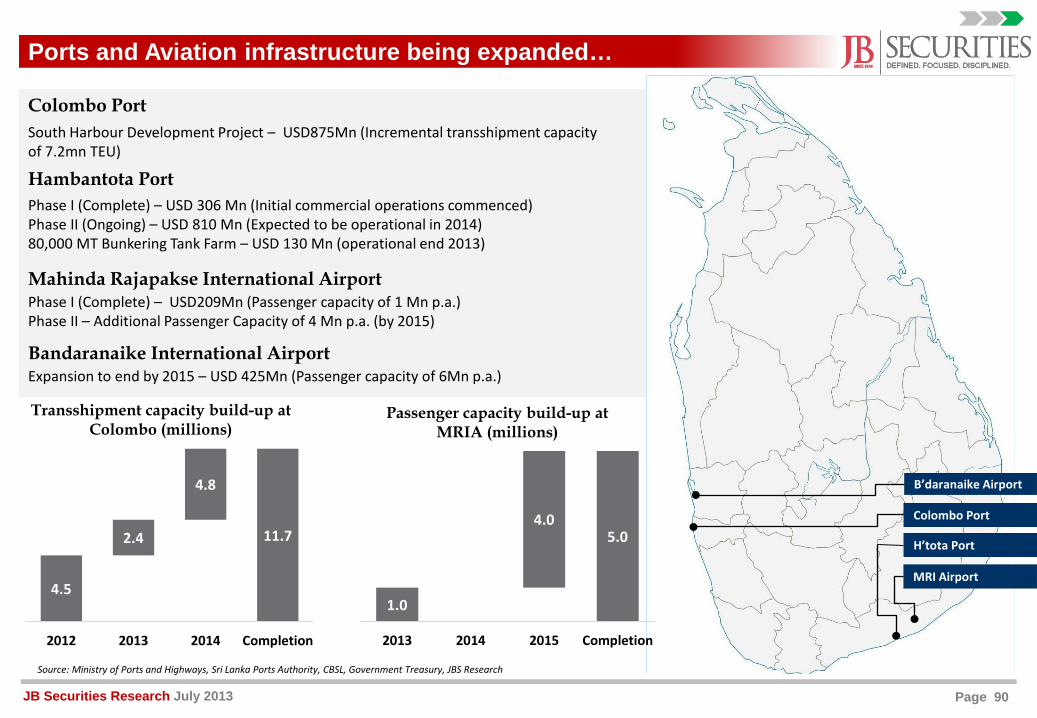
Page 90JB Securities Research July 2013
Ports and Aviation infrastructure being expanded…
Colombo PortSouth Harbour Development Project – USD875Mn (Incremental transshipment capacity of 7.2mn TEU)
4.5
2.4
4.8
11.7
2012 2013 2014 Completion
Transshipment capacity build-up at Colombo (millions)
Hambantota PortPhase I (Complete) – USD 306 Mn (Initial commercial operations commenced)Phase II (Ongoing) – USD 810 Mn (Expected to be operational in 2014)80,000 MT Bunkering Tank Farm – USD 130 Mn (operational end 2013)
Mahinda Rajapakse International AirportPhase I (Complete) – USD209Mn (Passenger capacity of 1 Mn p.a.)Phase II – Additional Passenger Capacity of 4 Mn p.a. (by 2015)
Bandaranaike International AirportExpansion to end by 2015 – USD 425Mn (Passenger capacity of 6Mn p.a.)
1.0
4.05.0
2013 2014 2015 Completion
Passenger capacity build-up at MRIA (millions)
Colombo Port
H’tota Port
MRI Airport
B’daranaike Airport
Source: Ministry of Ports and Highways, Sri Lanka Ports Authority, CBSL, Government Treasury, JBS Research
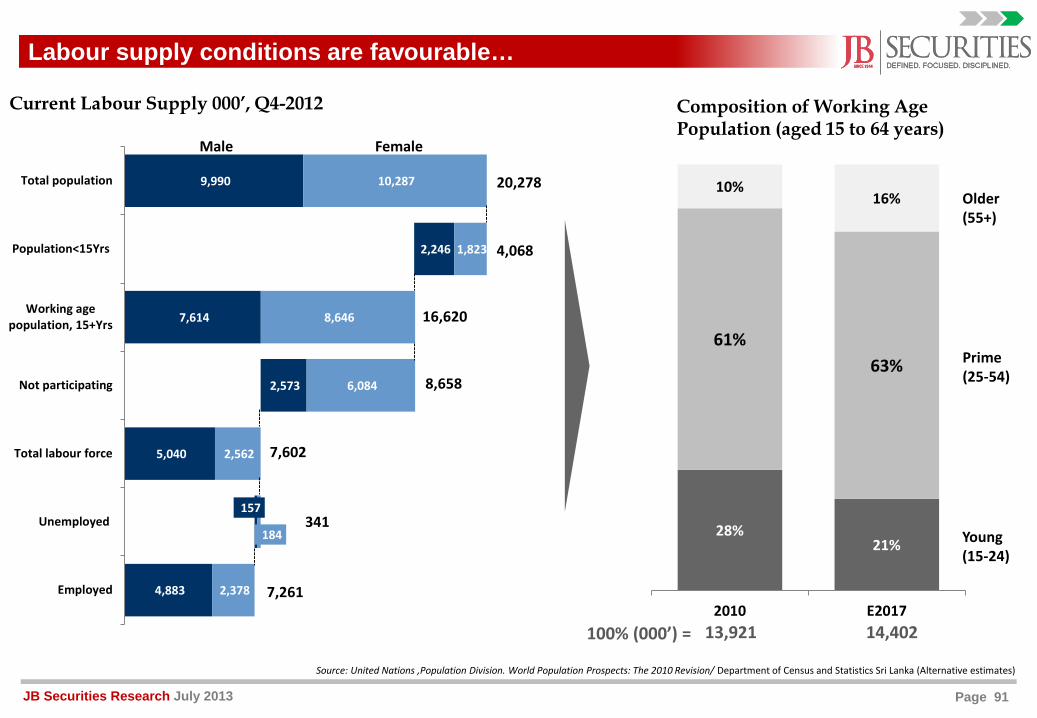
Page 91JB Securities Research July 2013
Labour supply conditions are favourable…
Source: United Nations ,Population Division. World Population Prospects: The 2010 Revision/ Department of Census and Statistics Sri Lanka (Alternative estimates)
28%21%
61%63%
10%16%
2010 E2017100% (000’) = 13,921 14,402
Older (55+)
Prime(25-54)
Young(15-24)
Composition of Working Age Population (aged 15 to 64 years)
Current Labour Supply 000’, Q4-2012
9,990
7,614
5,040
4,883
10,287
2,246
8,646
2,573
2,562
157
2,378
1,823
6,084
184
Total population
Population<15Yrs
Working agepopulation, 15+Yrs
Not participating
Total labour force
Unemployed
Employed
20,278
4,068
16,620
8,658
7,602
341
7,261
Male Female
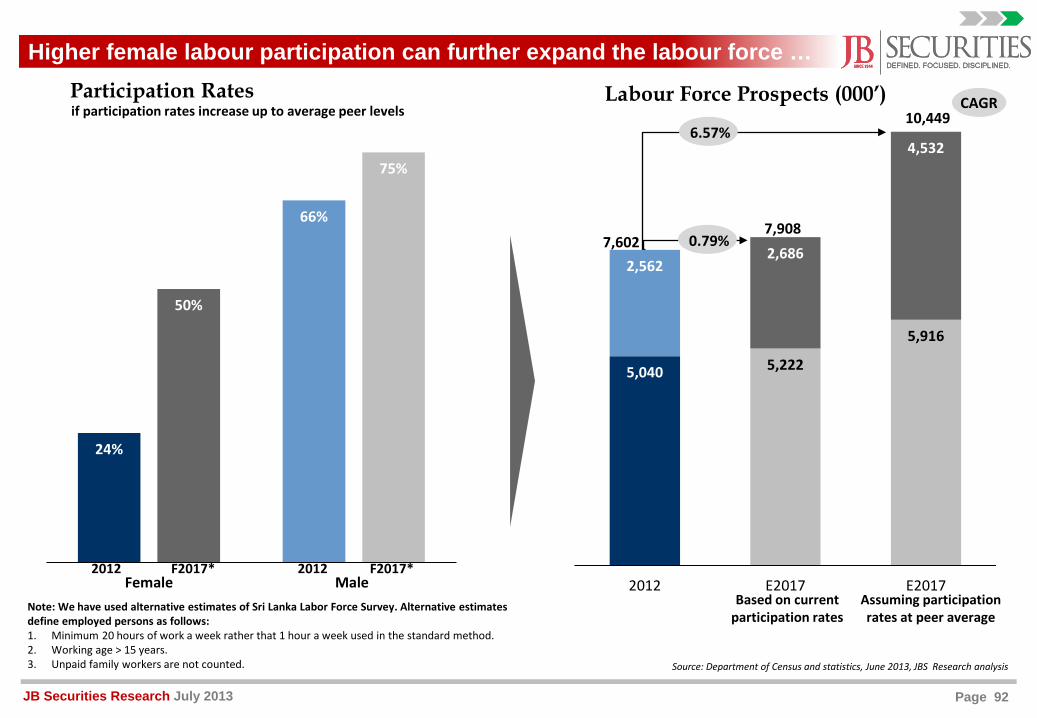
Page 92JB Securities Research July 2013
Source: Department of Census and statistics, June 2013, JBS Research analysis
5,040 5,222
5,916
2,5622,686
4,532
2012 E2017 E2017
0.79%
6.57%
24%
66%
50%
75%
Female Male2012 F2017* 2012 F2017*
Participation Rates
Based on current participation rates
Assuming participation rates at peer average
Labour Force Prospects (000’) CAGRif participation rates increase up to average peer levels
Note: We have used alternative estimates of Sri Lanka Labor Force Survey. Alternative estimates define employed persons as follows:1. Minimum 20 hours of work a week rather that 1 hour a week used in the standard method.2. Working age > 15 years.3. Unpaid family workers are not counted.
7,6027,908
10,449
Higher female labour participation can further expand the labour force …
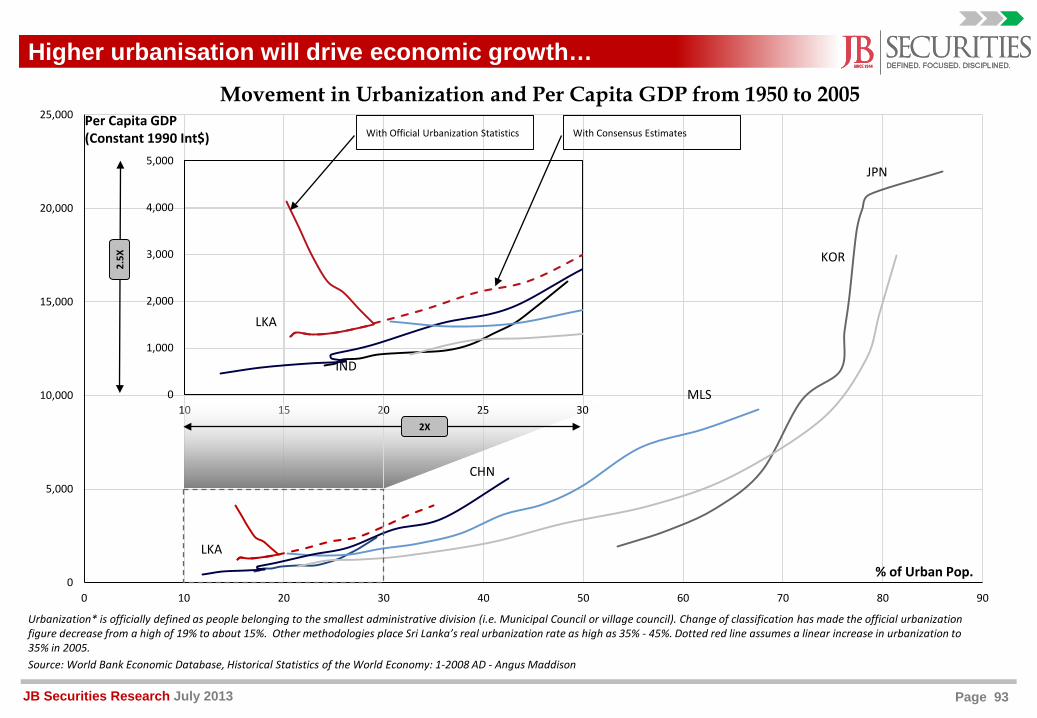
Page 93JB Securities Research July 2013
Higher urbanisation will drive economic growth…Movement in Urbanization and Per Capita GDP from 1950 to 2005
Source: World Bank Economic Database, Historical Statistics of the World Economy: 1-2008 AD - Angus Maddison
0
5,000
10,000
15,000
20,000
25,000
0 10 20 30 40 50 60 70 80 90
% of Urban Pop.
With Official Urbanization Statistics With Consensus Estimates
0
1,000
2,000
3,000
4,000
5,000
10 15 20 25 30
2.5X
Per Capita GDP (Constant 1990 Int$)
Urbanization* is officially defined as people belonging to the smallest administrative division (i.e. Municipal Council or village council). Change of classification has made the official urbanization figure decrease from a high of 19% to about 15%. Other methodologies place Sri Lanka’s real urbanization rate as high as 35% - 45%. Dotted red line assumes a linear increase in urbanization to 35% in 2005.
JPN
KOR
MLS
CHN
IND
LKA
LKA
2X
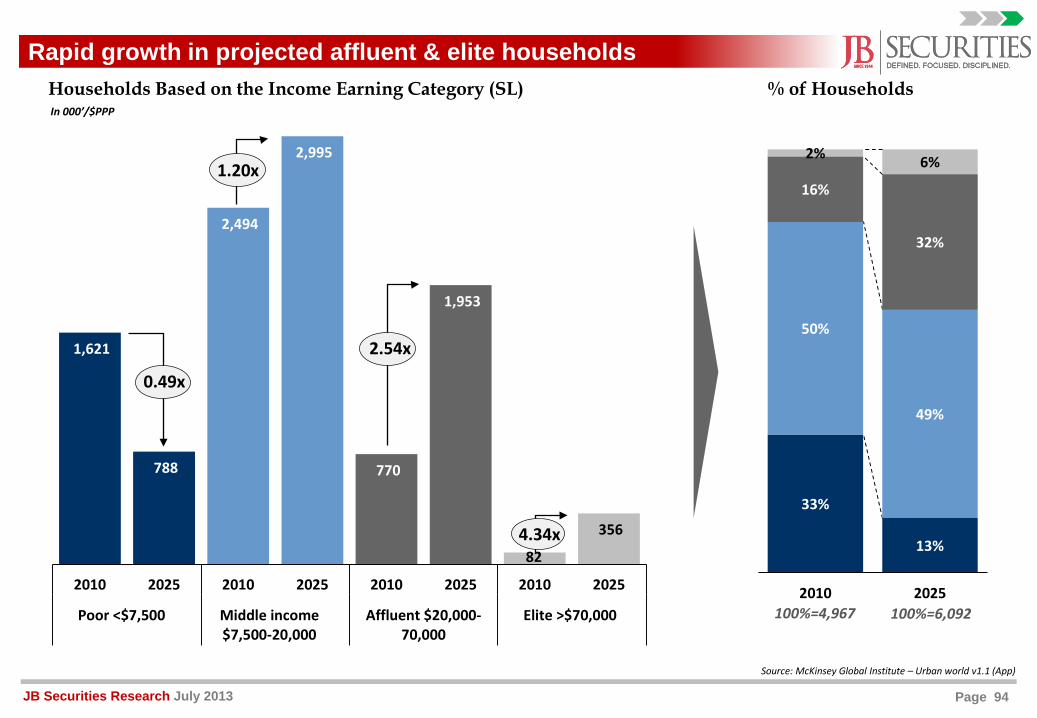
Page 94JB Securities Research July 2013
Households Based on the Income Earning Category (SL)
Source: McKinsey Global Institute – Urban world v1.1 (App)
1,621
788
2,494
2,995
770
1,953
82
356
2010 2025 2010 2025 2010 2025 2010 2025
Poor <$7,500 Middle income$7,500-20,000
Affluent $20,000-70,000
Elite >$70,000
33%
13%
50%
49%
16%
32%
2% 6%
2010 2025
% of Households
2.54x
1.20x
4.34x
0.49x
100%=4,967 100%=6,092
In 000’/$PPP
Rapid growth in projected affluent & elite households
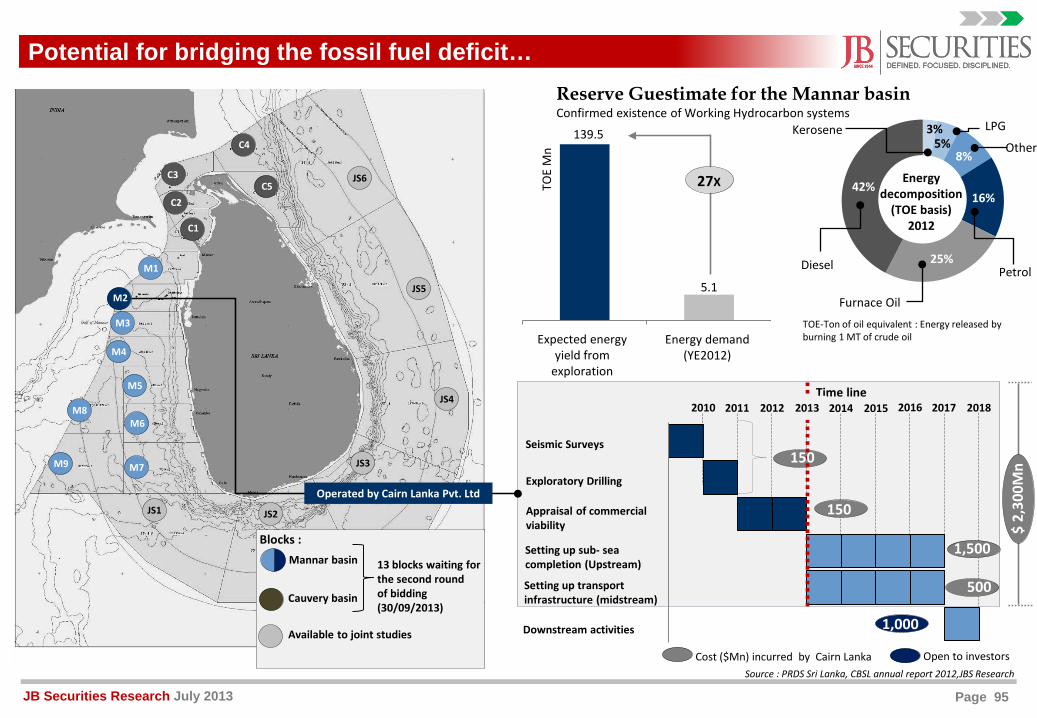
Page 95JB Securities Research July 2013
3%5%
8%
16%
25%
42%
Reserve Guestimate for the Mannar basinConfirmed existence of Working Hydrocarbon systems
Diesel
Furnace Oil
LPGKeroseneOther
139.5
5.1
Expected energy yeildfrom exploration
Energy demand(YE2011)
TOE
Mn
27X
Petrol
TOE-Ton of oil equivalent : Energy released by burning 1 MT of crude oil
Energy decomposition
(TOE basis)2012
Expected energy yield from
exploration
Energy demand(YE2012)
C1
C2
C3
C4
C5
M1
M2
M3
M4
M5
M8M6
M7M9
JS1 JS2
JS3
JS4
JS5
JS6
Blocks :Mannar basin
Cauvery basin
Available to joint studies
$ 2,
300M
n
Seismic Surveys
Exploratory Drilling
Appraisal of commercial viability
Setting up sub- sea completion (Upstream)
Setting up transport infrastructure (midstream)
Downstream activities
2010 2011 2012 2014 2015 2016 2017 2018
150
1,500
1,000
500
Time line
Cost ($Mn) incurred by Cairn Lanka Open to investors
Operated by Cairn Lanka Pvt. Ltd
13 blocks waiting forthe second round of bidding (30/09/2013)
Potential for bridging the fossil fuel deficit…
Source : PRDS Sri Lanka, CBSL annual report 2012,JBS Research
2013
150
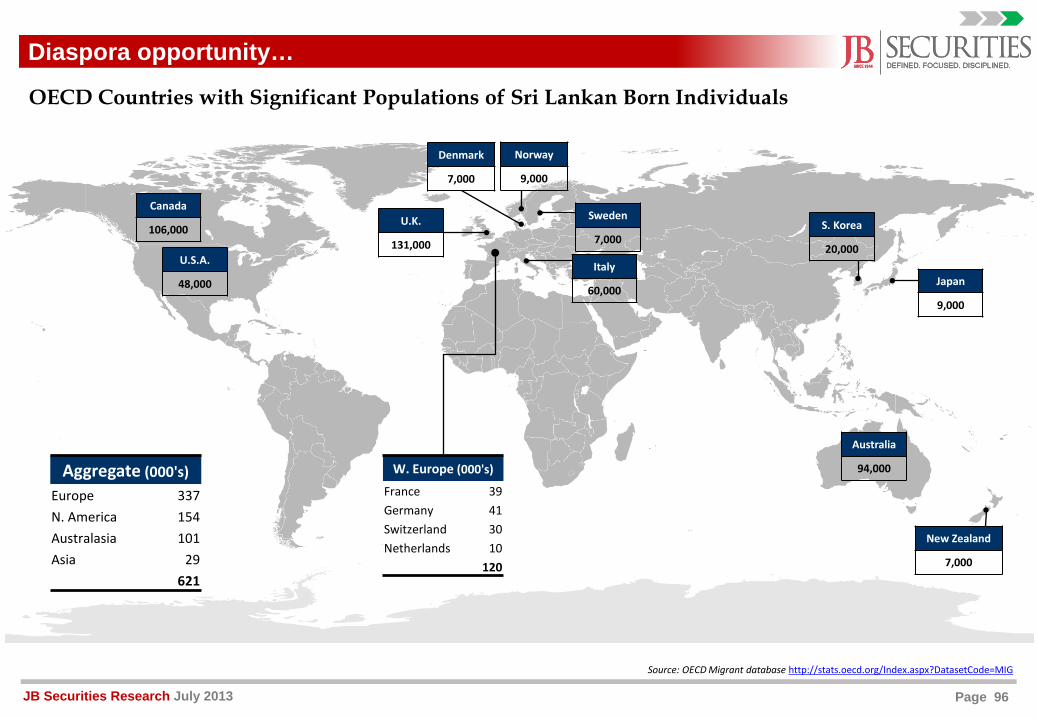
Page 96JB Securities Research July 2013
Diaspora opportunity…
W. Europe (000's)
France 39Germany 41Switzerland 30Netherlands 10
120
Canada
106,000
Italy
60,000
Australia
94,000
New Zealand
7,000
Sweden
7,000
Norway
9,000
U.K.
131,000
S. Korea
20,000
Japan
9,000
Denmark
7,000
Aggregate (000's)Europe 337N. America 154Australasia 101Asia 29
621
U.S.A.
48,000
OECD Countries with Significant Populations of Sri Lankan Born Individuals
Source: OECD Migrant database http://stats.oecd.org/Index.aspx?DatasetCode=MIG
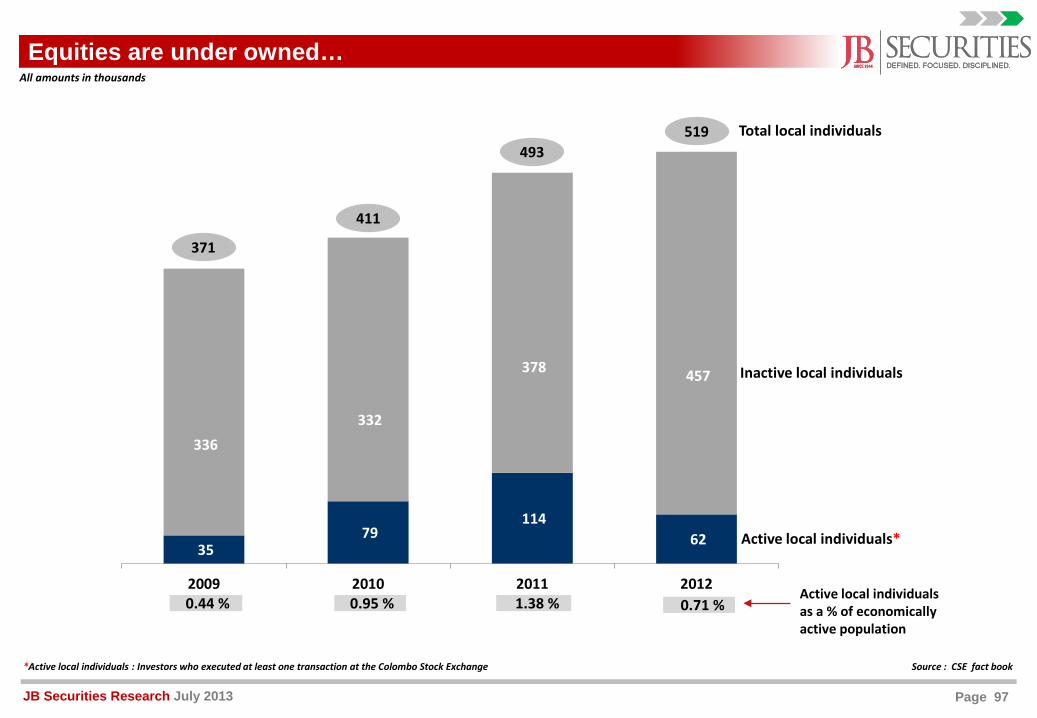
Page 97JB Securities Research July 2013
Total local individuals
Equities are under owned…
Source : CSE fact book*Active local individuals : Investors who executed at least one transaction at the Colombo Stock Exchange
35 79
114 62
336332
378 457
2009 2010 2011 20120.44 % 0.95 % 1.38 % 0.71 %
Inactive local individuals
Active local individuals*
Active local individuals as a % of economically active population
371
411
493519
All amounts in thousands
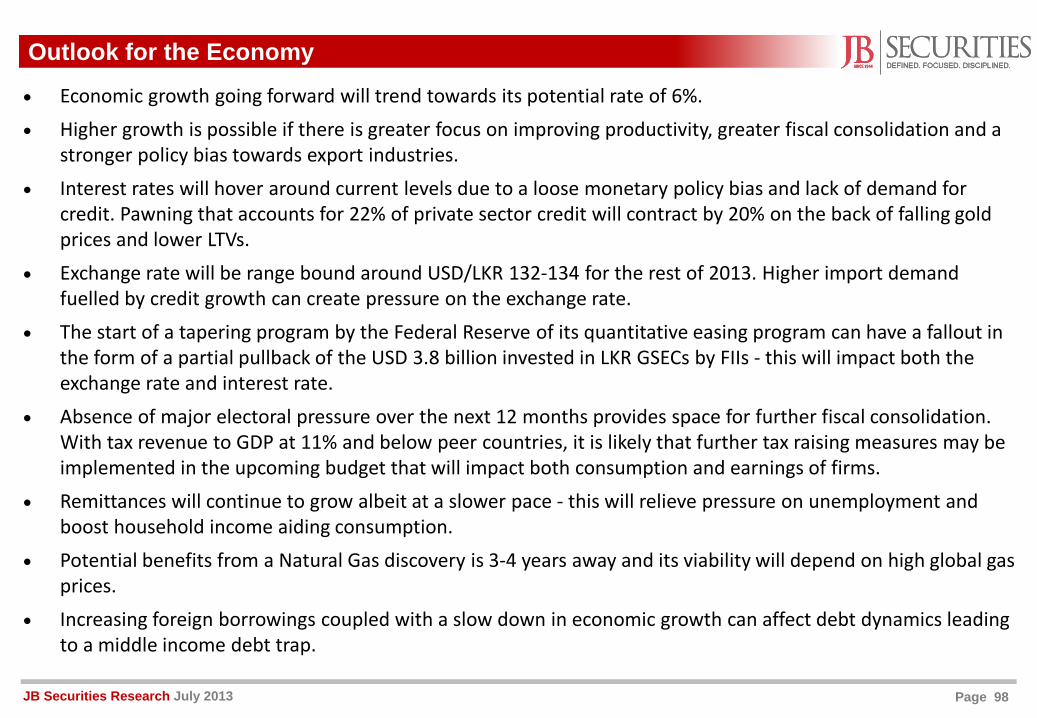
Page 98JB Securities Research July 2013
Outlook for the Economy
• Economic growth going forward will trend towards its potential rate of 6%.• Higher growth is possible if there is greater focus on improving productivity, greater fiscal consolidation and a
stronger policy bias towards export industries.• Interest rates will hover around current levels due to a loose monetary policy bias and lack of demand for
credit. Pawning that accounts for 22% of private sector credit will contract by 20% on the back of falling gold prices and lower LTVs.
• Exchange rate will be range bound around USD/LKR 132-134 for the rest of 2013. Higher import demand fuelled by credit growth can create pressure on the exchange rate.
• The start of a tapering program by the Federal Reserve of its quantitative easing program can have a fallout in the form of a partial pullback of the USD 3.8 billion invested in LKR GSECs by FIIs - this will impact both the exchange rate and interest rate.
• Absence of major electoral pressure over the next 12 months provides space for further fiscal consolidation. With tax revenue to GDP at 11% and below peer countries, it is likely that further tax raising measures may be implemented in the upcoming budget that will impact both consumption and earnings of firms.
• Remittances will continue to grow albeit at a slower pace - this will relieve pressure on unemployment and boost household income aiding consumption.
• Potential benefits from a Natural Gas discovery is 3-4 years away and its viability will depend on high global gas prices.
• Increasing foreign borrowings coupled with a slow down in economic growth can affect debt dynamics leading to a middle income debt trap.
Page 99JB Securities Research July 2013
Outlook for the Equity Market• The sideway market continues into its 3rd year after the unprecedented bull market that ended in mid 2011. A
sideway market is characterized by rising earnings but is negated by falling multiples thus prices remain range bound.
• Although the market has pulled back in the last month, valuations especially on the large cap counters remain very high. Adjusted for the risk free rate and the equity risk premium, market PE multiples excluding financials are at elevated levels.
• Financials account for 37% of total market earnings, outlook for the sector in 2013 is poor on the back of low credit growth, deteriorating asset quality, falling NIMs due to timing mismatches in repricing assets and liabilities and the absence of one off translation gains from a large depreciation of the currency. Lower earnings from financials in the absence of lower prices will increase the market PER going forward.
• It is unlikely that FIIs would pull out of the market if the Federal Reserve starts tapering its QE program BUT the level of inflows that were witnessed in the previous 12 months will not be maintained.
• Incremental demand for equities will have to come from domestic sources both institutional and retail - falling interest rates provide a favourable environment but concerns about lower earnings growth may negate this.
• New supply of equities from primary and secondary capital raisings will be subdued over the next 12 months. We do not foresee any large sell downs especially from government controlled financial institutions over this period.
• An investment strategy based on morphing the index or investing across the board will yield poor results due to potential gains being eroded by falling multiples. A more nuanced strategy based on hunting for value stocks has the potential to yield superior returns.
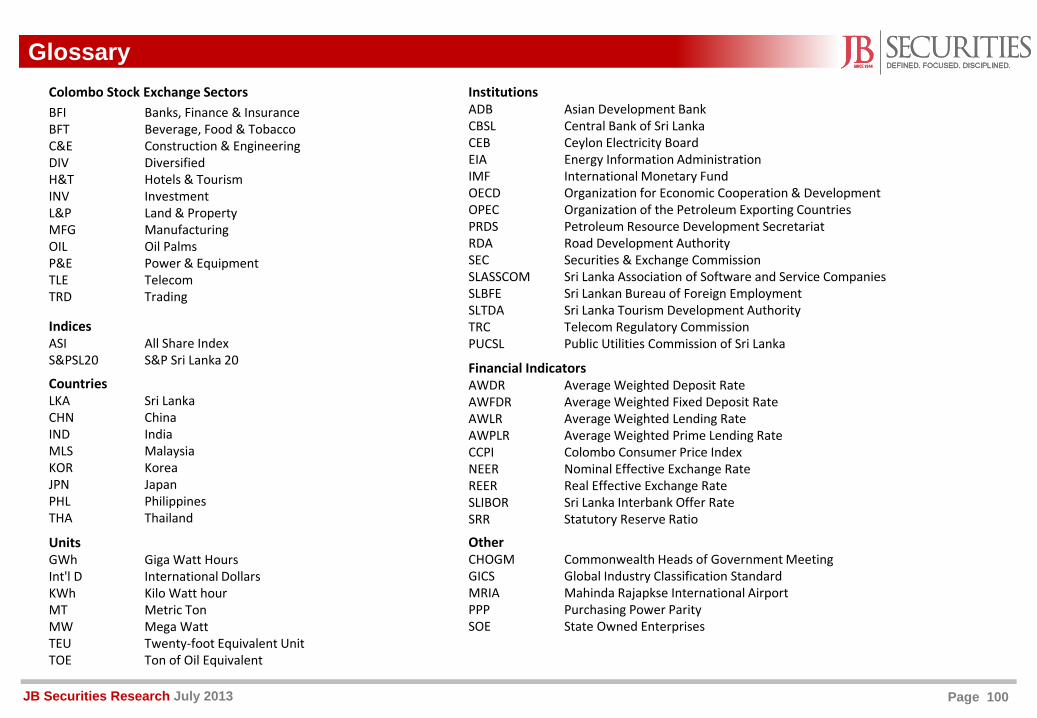
Page 100JB Securities Research July 2013
Glossary
BFI Banks, Finance & InsuranceBFT Beverage, Food & TobaccoC&E Construction & EngineeringDIV DiversifiedH&T Hotels & TourismINV InvestmentL&P Land & PropertyMFG ManufacturingOIL Oil PalmsP&E Power & EquipmentTLE TelecomTRD Trading
IndicesASI All Share IndexS&PSL20 S&P Sri Lanka 20
CountriesLKA Sri LankaCHN ChinaIND IndiaMLS MalaysiaKOR KoreaJPN JapanPHL PhilippinesTHA Thailand
Colombo Stock Exchange Sectors InstitutionsADB Asian Development BankCBSL Central Bank of Sri LankaCEB Ceylon Electricity BoardEIA Energy Information AdministrationIMF International Monetary FundOECD Organization for Economic Cooperation & DevelopmentOPEC Organization of the Petroleum Exporting CountriesPRDS Petroleum Resource Development Secretariat RDA Road Development AuthoritySEC Securities & Exchange CommissionSLASSCOM Sri Lanka Association of Software and Service CompaniesSLBFE Sri Lankan Bureau of Foreign Employment SLTDA Sri Lanka Tourism Development AuthorityTRC Telecom Regulatory CommissionPUCSL Public Utilities Commission of Sri Lanka
UnitsGWh Giga Watt HoursInt'l D International DollarsKWh Kilo Watt hourMT Metric TonMW Mega WattTEU Twenty-foot Equivalent UnitTOE Ton of Oil Equivalent
OtherCHOGM Commonwealth Heads of Government MeetingGICS Global Industry Classification StandardMRIA Mahinda Rajapkse International AirportPPP Purchasing Power ParitySOE State Owned Enterprises
Financial IndicatorsAWDR Average Weighted Deposit RateAWFDR Average Weighted Fixed Deposit RateAWLR Average Weighted Lending RateAWPLR Average Weighted Prime Lending RateCCPI Colombo Consumer Price IndexNEER Nominal Effective Exchange RateREER Real Effective Exchange RateSLIBOR Sri Lanka Interbank Offer RateSRR Statutory Reserve Ratio
Page 101JB Securities Research July 2013
About Us
JB Securities Ltd is a full service brokerage firm that is licensed to operate on the Colombo Stock Exchange (CSE). The firm was a founding member of the Colombo Stock Exchange in 1985 and has extensive experience dealing with domestic and foreign institutional investors and high net worth individuals and family offices.
In order to provide unique investment insights to our clients we conduct extensive deep-dive research in the industry verticals pertaining to the large listed companies to identify their industry and business dynamics. This process is aided by the largest team of equity analysts in the country, a majority of them either being CFA charter holders or CFA candidates who have undergone a 20 month intensive in-house training program based on international curricula. The firm continues to invest in the development of its analyst team to widen and deepen its research coverage.
The firm is part of the family owned Jafferjee Brothers group based in Sri Lanka that was founded in 1944. The group’s business interest spans a wide array of activities in trading, manufacturing and services and has extensive experience dealing with global companies.
Equity and Debt Brokerage Manager JB Unit Trust Margin Financing
Page 102JB Securities Research July 2013
For further information contact:Murtaza Jafferjee CFA
+94 11 [email protected]
150, St. Joseph’s Street, Colombo 01400, Sri Lanka.Tel: +94 112490900, Email: [email protected], www.jbs.lk
© Copyright 2013, JB Securities (Pvt) Ltd, All rights reserved.
This research is for our clients only. Other than disclosures relating to JB Securities, this research is based on current publicly available information that we consider reliable, but we do not represent it as accurate or complete, and it should not be construed as such. We seek to update our research as appropriate.
JB Securities shall have no liability, contingent or otherwise, to the user or to third parties, for the quality, accuracy, timeliness, continued availability or completeness of the data or calculations in this document, nor for any special, indirect, incidental or consequential damages which may be incurred or experienced because of the use of the data or calculations made available herein.
JB Securities does and seeks to do business with companies covered in its research reports. Investors should be aware that the firm may have a conflict of interest that could affect the objective of this report. Investors would consider this report as only a single aid in making their investment decision.
No part of this material may be modified or altered without the prior consent of the firm.
Related Documents