Sri Lanka Human Capital Development Realizing the Promise and Potential of Human Capital Harsha Aturupane, Hideki Higashi, Roshini Ebenezer, Deepika Attygalle, Shobhana Sosale, Sangeeta Dey, and Rehana Wijesinghe INTERNATIONAL DEVELOPMENT IN FOCUS Public Disclosure Authorized Public Disclosure Authorized Public Disclosure Authorized Public Disclosure Authorized

Welcome message from author
This document is posted to help you gain knowledge. Please leave a comment to let me know what you think about it! Share it to your friends and learn new things together.
Transcript
Sri Lanka Human Capital DevelopmentRealizing the Promise and Potential of Human Capital
Harsha Aturupane, Hideki Higashi, Roshini Ebenezer, Deepika Attygalle, Shobhana Sosale, Sangeeta Dey, and Rehana Wijesinghe
INT
ER
NA
TIO
NA
L D
EV
EL
OP
ME
NT
IN
FO
CU
S
Pub
lic D
iscl
osur
e A
utho
rized
Pub
lic D
iscl
osur
e A
utho
rized
Pub
lic D
iscl
osur
e A
utho
rized
Pub
lic D
iscl
osur
e A
utho
rized

Sri Lanka Human Capital DevelopmentRealizing the Promise and Potential of Human Capital
HARSHA ATURUPANE, HIDEKI HIGASHI, ROSHINI EBENEZER, DEEPIKA ATTYGALLE, SHOBHANA SOSALE, SANGEETA DEY, AND REHANA WIJESINGHE
INTERNATIONAL DEVELOPMENT IN FOCUS

© 2021 International Bank for Reconstruction and Development / The World Bank1818 H Street NW, Washington, DC 20433Telephone: 202-473-1000; Internet: www.worldbank.org
Some rights reserved
1 2 3 4 24 23 22 21
Books in this series are published to communicate the results of World Bank research, analysis, and oper-ational experience with the least possible delay. The extent of language editing varies from book to book.
This work is a product of the staff of The World Bank with external contributions. The findings, interpre-tations, and conclusions expressed in this work do not necessarily reflect the views of The World Bank, its Board of Executive Directors, or the governments they represent. The World Bank does not guarantee the accuracy, completeness, or currency of the data included in this work and does not assume responsibility for any errors, omissions, or discrepancies in the information, or liability with respect to the use of or failure to use the information, methods, processes, or conclusions set forth. The boundaries, colors, denominations, and other information shown on any map in this work do not imply any judgment on the part of The World Bank concerning the legal status of any territory or the endorsement or acceptance of such boundaries.
Nothing herein shall constitute, imply, or be considered to be a limitation upon or waiver of the privileges and immunities of The World Bank, all of which are specifically reserved.
Rights and Permissions
This work is available under the Creative Commons Attribution 3.0 IGO license (CC BY 3.0 IGO) http://creativecommons.org/licenses/by/3.0/igo. Under the Creative Commons Attribution license, you are free to copy, distribute, transmit, and adapt this work, including for commercial purposes, under the following conditions:
Attribution—Please cite the work as follows: Aturupane, Harsha, Hideki Higashi, Roshini Ebenezer, Deepika Attygalle, Shobhana Sosale, Sangeeta Day, and Rehana Wijesinghe. 2021. Sri Lanka Human Capital Development: Realizing the Promise and Potential of Human Capital. International Development in Focus. Washington, DC: World Bank. doi:10.1596/978-1-4648-1718-2. License: Creative Commons Attribution CC BY 3.0 IGO
Translations—If you create a translation of this work, please add the following disclaimer along with the attribution: This translation was not created by The World Bank and should not be considered an official World Bank translation. The World Bank shall not be liable for any content or error in this translation.
Adaptations—If you create an adaptation of this work, please add the following disclaimer along with the attribution: This is an adaptation of an original work by The World Bank. Views and opinions expressed in the adaptation are the sole responsibility of the author or authors of the adaptation and are not endorsed by The World Bank.
Third-party content—The World Bank does not necessarily own each component of the content con-tained within the work. The World Bank therefore does not warrant that the use of any third-party-owned individual component or part contained in the work will not infringe on the rights of those third parties. The risk of claims resulting from such infringement rests solely with you. If you wish to re-use a compo-nent of the work, it is your responsibility to determine whether permission is needed for that re-use and to obtain permission from the copyright owner. Examples of components can include, but are not limited to, tables, figures, or images.
All queries on rights and licenses should be addressed to World Bank Publications, The World Bank Group, 1818 H Street NW, Washington, DC 20433, USA; e-mail: [email protected].
ISBN: 978-1-4648-1718-2DOI: 10.1596/978-1-4648-1718-2
Cover photo: © Johnny Greig / iStockphoto. Used with permission; further permission required for reuse.Cover design: Debra Naylor / Naylor Design Inc.

iii
Contents
Acknowledgments viiAbout the Authors ixAbbreviations xiii
CHAPTER 1 The Potential of Human Capital 1Human capital for economic and social development 1The context for economic development in Sri Lanka 4Human Capital Project and Human Capital Index 5Human Capital Index: Sri Lanka in the global context 5Regional pattern of human capital in Sri Lanka 8Gender differences in human capital development 14Trends in human capital development 15Health and education spending and human capital development 16Conclusions 17Notes 19References 19
CHAPTER 2 Regional Variations in Human Capital Outcomes in Sri Lanka 21Introduction 21Provincial variations in human capital outcomes: Education 21Provincial variations in human capital outcomes:
Health and nutrition 29Conclusions 33References 35
CHAPTER 3 Key Challenges in Human Capital Development: Child and Adult Survival and Stunting 37Introduction 37The challenge of stunting and undernutrition in Sri Lanka 38Under-five mortality in Sri Lanka 49Adult mortality in Sri Lanka 51Aging and its implications for health care and development
in Sri Lanka 57Conclusions and recommendations for Sri Lanka’s health
care sector 67Notes 69References 69

iv | Sri Lanka Human CapitaL DeveLopment
CHAPTER 4 Key Challenges in Human Capital Development: Improving Learning Outcomes 73Introduction 73Investing in socioemotional skills for success 73Investing in the early years 77Improving teacher quality 86Enhancing learning outcomes through technology-based
initiatives 95Using international and national assessments for educational
development 100Improving gender equity in learning outcomes 106Note 107References 107
CHAPTER 5 Human Capital Development: Transforming Higher Education 113Introduction 113Higher education and provincial development 115Mission differentiation of universities 116The development of private higher education institutions 124Internationalization and the development of higher education 126Technology and higher education 127References 128
CHAPTER 6 A Public Consensus on and Stakeholder Commitment to Human Capital Development 131
APPENDIX A Methods for Estimating Human Capital Index at the Provincial Level 133
APPENDIX B Main Issues, Strategic Directions, and Policy Initiatives 139
Boxes
1.1 Education and the extraordinary growth in East Asia and Pacific 22.1 Sources of scores on learning outcomes 243.1 Meeting the health care needs of an aging population: An example
from Thailand 653.2 Meeting the health financing needs: An example from Japan 674.1 The Big Five factors 744.2 Tools for assessing socioemotional skills in schools: An example
from Canada 774.3 Tools for assessing socioemotional skills in schools: An example
from Belgium 774.4 Integrating early childhood day care and early childhood education
in Japan 844.5 Early childhood care and education in the Republic of Korea 864.6 Singapore’s partnership model of teacher education 904.7 School-based professional development in China 914.8 How Khan Academy is partnering with schools to improve education 974.9 Malaysian Smart School Initiative 984.10 Impacts of CAL on learning: Examples from China and India 994.11 International assessment and educational reform: An example
from Poland 1055.1 National Teaching Fellowship Scheme awards: United Kingdom 1215.2 Involvement of external stakeholders in program development and
improvement at Mittelhessen University of Applied Sciences, Glessen, Germany 123
5.3 Private higher education enrollment in the Republic of Korea 1255.4 An international hub for students: Malaysia 127A.1 Process for adjusting mortality rates in national life table 134
Contents | v
Figures
1.1 What matters for economic growth is learning 31.2 Health and economic status are correlated 41.3 Human Capital Index, by selected economies, 2016/17 61.4 Human Capital Index, by region and country income group 61.5 Child survival rates to age five, by region and country income group 71.6 Expected years of schooling, by region and country income group 71.7 Adult survival rates ages 15 to 60, by region and country income group 71.8 Harmonized test scores, by region and country income group 81.9 Share of children under five not stunted, by region and country
income group 81.10 Human Capital Index and GDP per capita, by province:
Sri Lanka, 2016/17 111.11 Human Capital Index performance and per capita income, by province:
Sri Lanka, 2016/17 121.12 Human Capital Index, by gender and province: Sri Lanka, 2012/13
and 2016/17 161.13 Per capita health spending and Human Capital Index, by province:
Sri Lanka, 2018 171.14 Per student education spending and Human Capital Index, by province:
Sri Lanka, 2018 173.1 World Health Organization’s conceptual framework on childhood stunting 403.2 Variations in stunting rates of children under five, by district:
Sri Lanka, 2016 413.3 Trends in nutritional status of children under five: Sri Lanka 423.4 Trends, projections, and targets for stunting of children under five:
Sri Lanka, 1987–2025 433.5 Relationships between infant and young child feeding practices,
Human Capital Index, stunting, and learning outcomes, by province: Sri Lanka 45
3.6 Probability of dying, by age and gender, global average 523.7 Cause of death, ages 15 to 59: Sri Lanka, 2017 533.8 Number of deaths in adult population, ages 15 to 59: Sri Lanka, 1990–2017 533.9 Morbidity in adult population, ages 15 to 59: Sri Lanka, 1990–2017 543.10 Mortality rate of adult population, ages 15 to 59: South Asia, 2000–17 553.11 Population pyramid: Sri Lanka, 2016 573.12 Population pyramids: Sri Lanka, 1981, 2012, 2041 583.13 Aging population, by country: South Asia, 2012 593.14 Aging population: Sri Lanka, 1946–2012 593.15 Trends in the dependency ratio: Sri Lanka, 1946–2012 603.16 Domestic general government health expenditure: Selected countries, 2015 663.17 Shares of public funding and out-of-pocket payments: Sri Lanka, 2010–16 664.1 Rates of return to human capital investment 784.2 Human brain development 794.3 Early childhood care and education net enrollment rates, by location:
Sri Lanka, 2016 804.4 Early childhood care and education net enrollment rates, by province:
Sri Lanka, 2016 804.5 Early childhood care and education staff qualifications, by type and province:
Sri Lanka, 2016 814.6 Impact of contextual factors on a child’s literacy performance at age five:
United Kingdom 824.7 Impact of early childhood home learning environment on English and
mathematics attainment at age 11: United Kingdom 834.8 Teacher competencies 894.9 Competency as the integration of knowledge, skills, attitudes, and values 935.1 Higher education enrollment in international perspective: Selected
countries, 2014–16 1145.2 Higher education enrollment, by province: Sri Lanka, 2016 1145.3 Share of universities, by province: Sri Lanka, 2016/17 115
vi | SRI LANkA HUmAN CAPITAL DEvELOPmENT
5.4 Share of undergraduate university enrollment, by province: Sri Lanka, 2016/17 119
5.5 Share of postgraduate university enrollment, by province: Sri Lanka, 2016/17 119
5.6 Share of professors, by university: Sri Lanka, 2017 1205.7 Structure of an intellectual capital statement: Austria 123
Maps
1.1 Human Capital Index, by province: Sri Lanka, 2016/17 101.2 Human Capital Index, by province and gender: Sri Lanka, 2016/17 141.3 Human Capital Index, by province and gender: Sri Lanka, 2012/13 152.1 Expected years of schooling, by province: Sri Lanka, 2016/17 222.2 Harmonized mathematics test scores, by province: Sri Lanka, 2016/17 252.3 Mathematics learning-adjusted years of schooling, by province:
Sri Lanka, 2016/17 272.4 Child survival rates to age five, by province: Sri Lanka, 2016/17 292.5 Adult survival rates ages 15 to 60, by province: Sri Lanka, 2016/17 312.6 Share of children under five not stunted, by province: Sri Lanka, 2016/17 323.1 Under-five mortality rates, by district: Sri Lanka, 2016 50
Tables
1.1 Human Capital Index, by province: Sri Lanka, 2016/17 101.2 Provinces and comparator economies, per capita income: Sri Lanka,
2016/17 132.1 Expected years of schooling, by province and gender: Sri Lanka, 2016/17 222.2 Public schools, enrollment, and teachers, by province: Sri Lanka, 2017 232.3 Mathematics learning scores, by province and gender: Sri Lanka, 2016/17 252.4 English language learning scores, by province and gender: Sri Lanka,
2016/17 262.5 Learning-adjusted years of schooling, by province and gender, mathematics:
Sri Lanka, 2016/17 282.6 Learning-adjusted years of schooling, by province and gender, English
language: Sri Lanka, 2016/17 282.7 Child survival rates to age five, by province and gender: Sri Lanka, 2016/17 302.8 Adult survival rates ages 15 to 60, by province and gender: Sri Lanka,
2016/17 322.9 Share of children under five not stunted, by province and gender: Sri Lanka,
2016/17 333.1 Prioritized specific interventions in multisectoral action plan for
noncommunicable diseases 564.1 PRACTICE skills, subskills, Big Five traits, and neurobiological foundations 754.2 Stages of development of socioemotional (PRACTICE) skills 764.3 Teacher qualification, by province: Sri Lanka, 2017 874.4 A coherent system covers all aspects of a teacher career cycle 964.5 Differences between national assessments and public examinations 1024.6 Advantages and risks of participating in an international assessment 1034.7 Comparison of PISA and TIMSS 1045.1 Undergraduate enrollment in universities, by province: Sri Lanka,
2016/17 1175.2 Postgraduate enrollment in universities, by province: Sri Lanka,
2016/17 1185.3 Priorities for university-industry partnerships at different stages of
development among provinces 1225.4 Private enrollment as a share of total tertiary education enrollment,
by region 124BA.1.1 Original national life table for females 134BA.1.2 Adjusted national life table for females 135B.1 Short- and medium-term initiatives to address policy objectives,
by thematic area 139
vii
Acknowledgments
The World Bank study team for this report comprised Deepika Attygalle, Harsha Aturupane, Sangeeta Dey, Roshini Ebenezer, Hideki Higashi, Shobhana Sosale, and Rehana Wijesinghe. The team wishes to acknowledge the cooperation and support of the government of Sri Lanka, and especially officials from the follow-ing ministries and councils for their ideas and suggestions and for providing the information and data used in the preparation of this report: ministry of City Planning, Water Supply, and Higher Education; ministry of Education; ministry of Finance; ministry of Health; ministry of Industries and Commerce and Skills Development; ministry of Internal and Home Affairs and Provincial Councils and Local Government; ministry of National Policies, Economic Affairs, Resettlement and Rehabilitation, Northern Province Development and Youth Affairs; ministry of Women and Child Affairs; and provincial councils. We would further like to acknowledge the specific comments provided by staff of the ministry of Health and the medical Research Institute. We also thank all the stakeholders, including academics, researchers, educators, doctors and health personnel, union officials, and teachers, for their views and suggestions on a variety of topics relevant to human capital development.


ix
Deepika Attygalle is a senior health specialist at the World Bank, based in Sri Lanka. She has more than 20 years of experience in public health, with vast knowledge in managing public health, health system development, and maternal and newborn child health and nutrition programs in routine and emergency settings for diverse populations, as well as in a reconciliation and development context. She has worked as a public health specialist in Sri Lanka’s ministry of Health; as a health specialist at the UNICEF office in kabul, Afghanistan; and as the regional coordinator for the South-South program for UNICEF’s South Asia region. Earlier, she served as an assistant research professor at the Center of Health Promotion and Disease Prevention at the University of Albuquerque, New mexico (United States). She holds a basic medical degree and advanced degrees in public health.
Harsha Aturupane is a lead economist in the World Bank’s Education Global Practice. He has worked, written extensively, and led teams in the production of World Bank research reports in the fields of human development, education economics, higher education, general education, and labor economics. He has also led teams in the preparation and supervision of World Bank projects and programs covering health, social protection, economic reform, private sector development, and strengthening fiduciary processes. In addition, he has served as program leader for human development for Sri Lanka, maldives, and Nepal. His work experience covers countries in the East Asia and Pacific, middle East and North Africa, and South Asia regions of the World Bank. He has a PhD and mPhil degree in economics from the University of Cambridge and a bachelor’s degree in economics and a diploma in economic development from the University of Colombo.
Sangeeta Dey is a senior education specialist based in the World Bank’s New Delhi office, where she is leading an early childhood development project in Sri Lanka, co-leading a state-level higher education project in India, and lead-ing analytical work on adolescent girls’ education under a cross human develop-ment initiative with health and social protection in India. She has work experience in Bangladesh, India, and Sri Lanka in the South Asia region, and in Indonesia in the East Asia and Pacific region. Before the World Bank, she worked
About the Authors
x | SRI LANkA HUmAN CAPITAL DEvELOPmENT
in the education sector for 18 years as education adviser in the United kingdom’s Department for International Development, education grants officer at the michael and Susan Dell Foundation, and education specialist in the United States Agency for International Development’s REACH India project; she also taught at the undergraduate level in the University of Delhi. She obtained her mPhil from the University of Delhi in Indian history.
Roshini Ebenezer is a consultant with the World Bank’s Education Global Practice. She has extensive experience in education policy and development and has published widely in several areas of education policy and related fields. Her areas of focus include cross-sector education and health programming, includ-ing school-based health and nutrition, as well as monitoring and evaluation of education sector interventions. She has worked across regions, including Africa, Latin America and the Caribbean, and South Asia. Before the World Bank, she worked for various development and academic institutions, including the Partnership for Child Development at Imperial College, London, and the Education Policy and Data Center at FHI 360. She holds a bachelor of arts and sciences degree from St. John’s College, Annapolis, maryland (United States), and a master’s in international education policy from Harvard University.
Hideki Higashi is a senior health economist at the World Bank, based in Sri Lanka. He focuses on analytical work in health economics, financing, and human capital development in the South Asia region. Before joining the World Bank, he worked in Zambia with the Japan International Cooperation Agency advising the ministry of Health on health economics and management. Previously, he was assistant professor at the Institute for Health metrics and Evaluation, University of Washington (United States), and at the University of Queensland (Australia). He has made key contributions to global health research, including the Global Burden of Disease study and the third edition of Disease Control Priorities (World Bank, 2016). Earlier in his career, he engaged in humanitarian and devel-opment activities in Africa and Asia with various organizations, including médecins sans Frontières. He obtained his master’s in public health from the University of New South Wales in Australia, master’s in health economics from Chulalongkorn University in Thailand, and PhD in health economics from the University of Queensland.
Shobhana Sosale is a senior education specialist with the World Bank’s Education Global Practice. She co-leads the World Bank’s global dialogue on gender and girls’ education and serves as the gender focal point for education in South Asia. She has over 20 years of experience in education and skills development. She has published widely in education and related fields, analyz-ing topics linking political economy and cross-sectoral issues in education, technology, skills development, entrepreneurship, public-private partnerships, finance, gender, service delivery, and networks. She has designed, managed, and implemented education and skills development projects and programs across countries in Africa, East Asia and Pacific, Europe and Central Asia, the middle East and North Africa, and South Asia. She holds graduate degrees in macroeconomics and political economy.

About the Authors | xi
Rehana Wijesinghe is a consultant with the World Bank’s Education Global Practice. She has provided operations support, research expertise, statistical analysis, and implementation support for the Sri Lanka and maldives education sector work over the past several years. She also has experience in hardware design and systems integration into banks. Wijesinghe has focused on providing low-cost technology solutions to rural areas of Sri Lanka through nonprofit foundations. She has a degree in engineering physics from Westmont College and a degree in electrical engineering from the University of California at Santa Barbara.


xiii
BmI body mass indexCAL computer-assisted learningCT cooperating teacherDALY disability-adjusted life yearDCS Department of Census and StatisticsDHS Demographic and Health SurveyECCE early childhood care and educationECD early childhood developmentEGmA Early Grade mathematics AssessmentEGRA Early Grade Reading AssessmentEPSI Enhanced Program for School ImprovementGCE A/L General Certificate of Education Advanced LevelGCE O/L General Certificate of Education Ordinary LevelGDP gross domestic productGER gross enrollment ratioHCI Human Capital IndexHCP Human Capital ProjectHIES Household Income and Expenditure SurveyICS intellectual capital statementICT information and communication technologyIGmE Inter-agency Group for Child mortality Estimation
(United Nations)IQ intelligence quotientIYCF infant and young child feedingLBW low birth weightLmIC lower-middle-income countryLPG Lesson Preparation GroupmCH maternal and child healthmoE ministry of EducationmoH ministry of Health, Nutrition and Indigenous medicinemSSI malaysian Smart School InitiativeNCD noncommunicable diseaseNIE National Institute of Education
Abbreviations

xiv | SRI LANkA HUmAN CAPITAL DEvELOPmENT
OECD Organisation for Economic Co-operation and DevelopmentOLPC One Laptop Per ChildOOP out-of-pocketPHC primary health care PISA Program for International Student AssessmentPLC professional learning communityPRACTICE problem-solving, resilience, achievement motivations, control,
teamwork, initiative, confidence, and ethicsSBPTD school-based professional teacher developmentSDC School Development CommitteeSHPP School Health Promotion ProgramSHSDP Second Health Sector Development ProgramSSQS Smart School Qualification StandardsSTEm science, technology, engineering, and mathematics TImSS Trends in International mathematics and Science StudyTNER total net enrollment rateTRG teaching and research groupTTP teacher training programUBL university-business linkageUIS UNESCO Institute of StatisticsUmIC upper-middle-income countryUN United NationsUNICEF United Nations Children’s FundWASH water, sanitation, and hygiene WHO World Health OrganizationWPP World Population Prospects

1
HUMAN CAPITAL FOR ECONOMIC AND SOCIAL DEVELOPMENT
Human capital is a central determinant of economic well-being and social advancement in the modern world economy. The concept of human capital cov-ers the knowledge, skills, nutrition, and health that people accumulate over their lives, enabling them to realize their potential as productive members of society (World Bank 2019). The global economy is placing an increasing premium on higher-order cognitive skills such as expert thinking and complex communica-tion (World Bank 2018b), as well as socioemotional skills such as problem solv-ing, resilience, achievement motivation, control, teamwork, initiative, confidence, and ethics, or what are known as the PRACTICE skills (Guerra, Modecki, and Cunningham 2014). Building these skills requires strong human capital founda-tions. In recent years, industry, agriculture, and especially services have become increasingly knowledge- and technology-intensive. The chief characteristic that distinguishes advanced economies, middle-income economies, and low-income economies is the knowledge content of their economic activities and production processes. The main components of human capital—education, health, and nutrition—play a central and synergistic role in producing the human capital required for development in the information-rich, technology-intensive world of the future.
Abundant global evidence attests to the importance of education to develop-ment (Barro and Lee 2013; Hanushek and Woessmann 2015). Among advanced economies, education levels are the single most important factor determining economic performance. Among middle- and low-income countries, economies with high education levels enjoy considerable welfare gains. Indeed, cross-country data reveal that schooling drives higher earnings. An additional year of schooling raises an individual’s earnings by 8–10 percent on average (World Bank 2018b).
Education also plays an important role in promoting a stable, peaceful society, which is a vital precondition for sustained economic growth and social develop-ment. Good citizenship values such as tolerance and mutual respect, as well as socioemotional skills such as teamwork and collaboration, are important ingre-dients of peaceful, stable, and prosperous societies—and schools are widely
The Potential of Human Capital1
2 | SRI LAnkA HuMAn CAPITAL DEvELoPMEnT
acknowledged to be one of the most important platforms for developing these values in the citizenry (Reimers, Jaramillo, and Cox 2005). Education systems around the world are increasingly sensitive to this role, and so they are develop-ing programs that will instill these values in students from a young age, thereby producing citizens who have the civic values and socioemotional skills needed to contribute to the development of a strong, stable, and vibrant society.
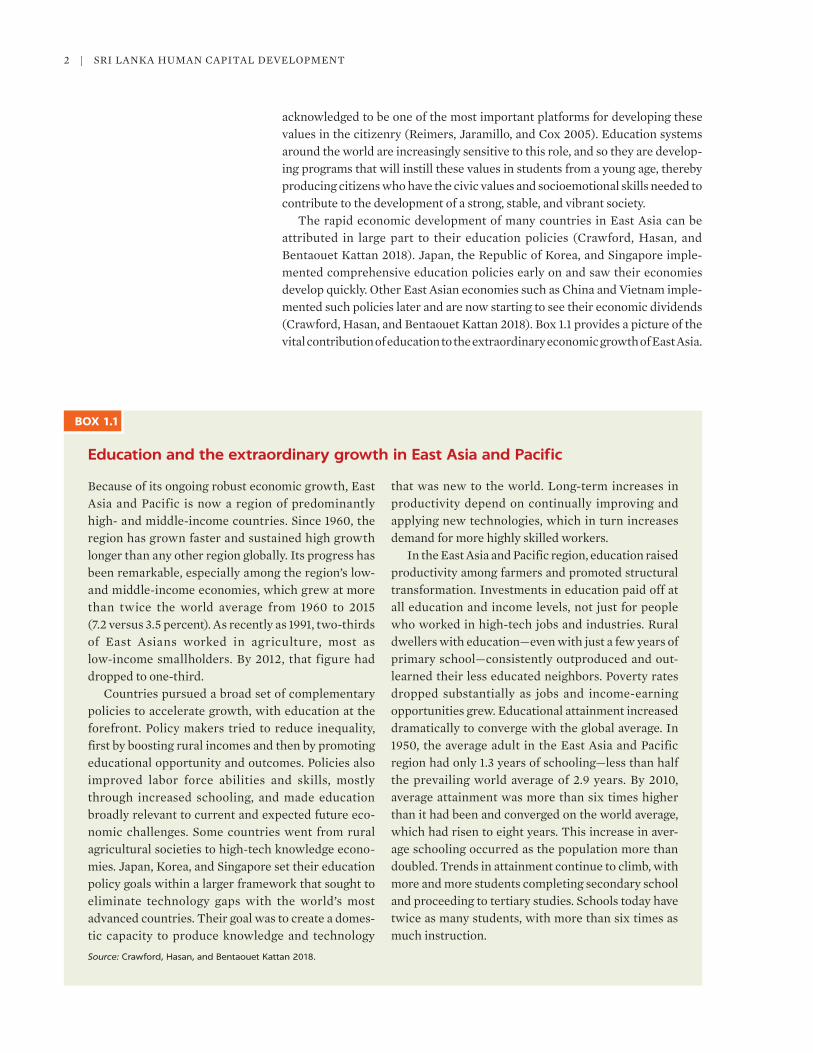
The rapid economic development of many countries in East Asia can be attributed in large part to their education policies (Crawford, Hasan, and Bentaouet kattan 2018). Japan, the Republic of korea, and Singapore imple-mented comprehensive education policies early on and saw their economies develop quickly. other East Asian economies such as China and vietnam imple-mented such policies later and are now starting to see their economic dividends (Crawford, Hasan, and Bentaouet kattan 2018). Box 1.1 provides a picture of the vital contribution of education to the extraordinary economic growth of East Asia.
Education and the extraordinary growth in East Asia and Pacific
Because of its ongoing robust economic growth, East Asia and Pacific is now a region of predominantly high- and middle-income countries. Since 1960, the region has grown faster and sustained high growth longer than any other region globally. Its progress has been remarkable, especially among the region’s low- and middle-income economies, which grew at more than twice the world average from 1960 to 2015 (7.2 versus 3.5 percent). As recently as 1991, two-thirds of East Asians worked in agriculture, most as low-income smallholders. By 2012, that figure had dropped to one-third.
Countries pursued a broad set of complementary policies to accelerate growth, with education at the forefront. Policy makers tried to reduce inequality, first by boosting rural incomes and then by promoting educational opportunity and outcomes. Policies also improved labor force abilities and skills, mostly through increased schooling, and made education broadly relevant to current and expected future eco-nomic challenges. Some countries went from rural agricultural societies to high-tech knowledge econo-mies. Japan, korea, and Singapore set their education policy goals within a larger framework that sought to eliminate technology gaps with the world’s most advanced countries. Their goal was to create a domes-tic capacity to produce knowledge and technology
that was new to the world. Long-term increases in productivity depend on continually improving and applying new technologies, which in turn increases demand for more highly skilled workers.
In the East Asia and Pacific region, education raised productivity among farmers and promoted structural transformation. Investments in education paid off at all education and income levels, not just for people who worked in high-tech jobs and industries. Rural dwellers with education—even with just a few years of primary school—consistently outproduced and out-learned their less educated neighbors. Poverty rates dropped substantially as jobs and income-earning opportunities grew. Educational attainment increased dramatically to converge with the global average. In 1950, the average adult in the East Asia and Pacific region had only 1.3 years of schooling—less than half the prevailing world average of 2.9 years. By 2010, average attainment was more than six times higher than it had been and converged on the world average, which had risen to eight years. This increase in aver-age schooling occurred as the population more than doubled. Trends in attainment continue to climb, with more and more students completing secondary school and proceeding to tertiary studies. Schools today have twice as many students, with more than six times as much instruction.
Source: Crawford, Hasan, and Bentaouet Kattan 2018.
BOX 1.1

The Potential of Human Capital | 3
Likewise, evidence from other regions such as Europe and north America sug-gests a strong association between education and equitable economic growth.
The quality of education, not simply the quantity of schooling, matters for economic growth. The dividends of education vary by level of education. A high-quality basic education lays the foundation for citizens to absorb and adapt to technological change, which can spur economic growth. More advanced lev-els of education support innovation and accelerate economic growth. Whether at the basic education level or at more advanced levels, the evidence increasingly suggests that the quality of schooling, as demonstrated in learning outcomes rather than years of schooling, is the best predictor of economic growth (figure 1.1). The main channel by which schooling improves economic growth is by improving learning and skill acquisition (Glewwe, Maiga, and Zheng 2014; Hanushek and Woessmann 2012). Evidence from 23 organisation for Economic Co-operation and Development (oECD) countries suggests that simple mea-sures of numeracy and reading proficiency explain wages over and above the effect of years of schooling completed (World Bank 2018a).
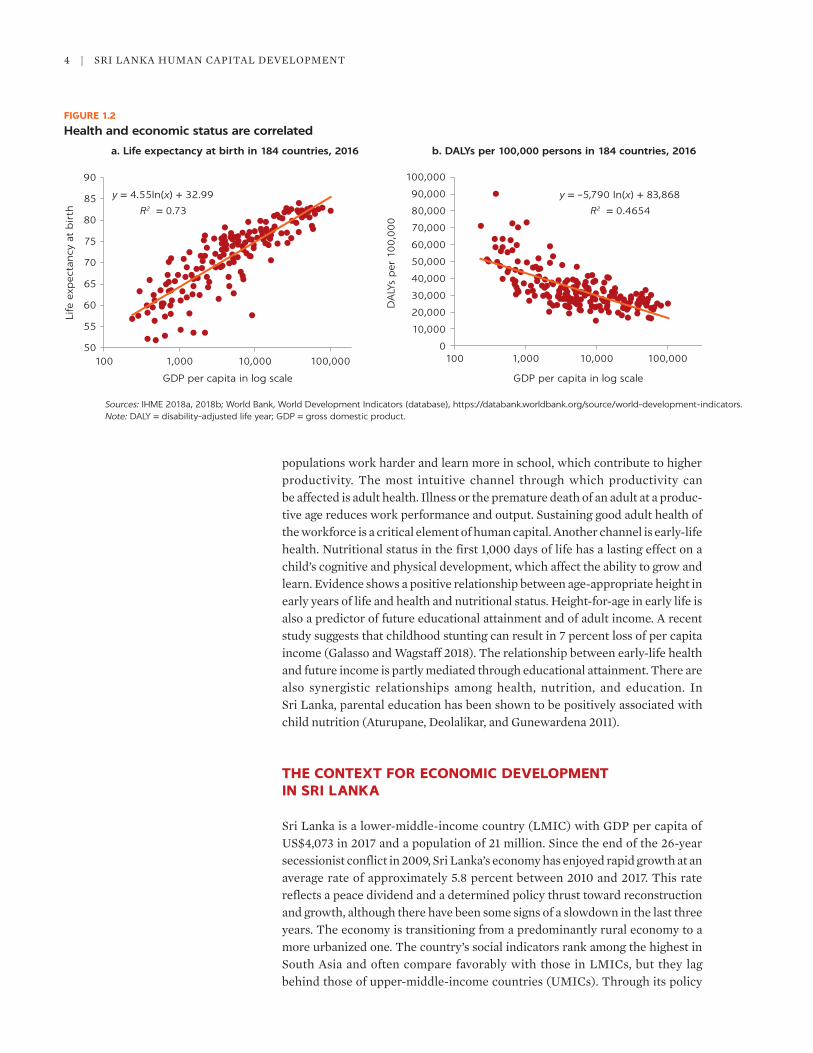
A healthy population translates into higher economic productivity. Indeed, it is well established that the health of a population and the economic status of a country are highly correlated. Figure 1.2 shows the relationship between gross domestic product (GDP) per capita and health-related indicators across 184 countries. Although health outcomes and growth are strongly related over many health indicators, the direction of causality between the two is more complicated.
Economists have investigated the direction of causality with various approaches and settings, and evidence points to multiple causal channels that can run in both directions. Scholars attribute the significant improvements in population health over the last two centuries to three factors stemming from economic growth: higher standards of living, an improved public health environ-ment, and improved health technology (Weil 2014). Conversely, healthier
Source: World Bank 2018b.Note: GDP = gross domestic product.
3
a. Test scores and growth(conditional on initial GDP per capita
and years of schooling)
b. Years of schooling and growth(conditional on initial GDPper capita and test scores)
2
1
0
–1
–2
–1.5 –1.0 –0.5 0
Test scores
Annual
GD
P p
er c
apit
a g
row
th (
%)
0.5 1.0
y = 0.00 + 1.59xt = 7.39R2 = 0.55
y = 0.00 + 0.07xt = 0.82R2 = 0.02
3
2
1
0
–1
–2
–2 –1 0 1
Years of schooling
Annual
GD
P p
er c
apit
a g
row
th (
%)
2 3
FIGURE 1.1
What matters for economic growth is learning
4 | SRI LAnkA HuMAn CAPITAL DEvELoPMEnT
populations work harder and learn more in school, which contribute to higher productivity. The most intuitive channel through which productivity can be affected is adult health. Illness or the premature death of an adult at a produc-tive age reduces work performance and output. Sustaining good adult health of the workforce is a critical element of human capital. Another channel is early-life health. nutritional status in the first 1,000 days of life has a lasting effect on a child’s cognitive and physical development, which affect the ability to grow and learn. Evidence shows a positive relationship between age-appropriate height in early years of life and health and nutritional status. Height-for-age in early life is also a predictor of future educational attainment and of adult income. A recent study suggests that childhood stunting can result in 7 percent loss of per capita income (Galasso and Wagstaff 2018). The relationship between early-life health and future income is partly mediated through educational attainment. There are also synergistic relationships among health, nutrition, and education. In Sri Lanka, parental education has been shown to be positively associated with child nutrition (Aturupane, Deolalikar, and Gunewardena 2011).
THE CONTEXT FOR ECONOMIC DEVELOPMENT IN SRI LANKA
Sri Lanka is a lower-middle-income country (LMIC) with GDP per capita of uS$4,073 in 2017 and a population of 21 million. Since the end of the 26-year secessionist conflict in 2009, Sri Lanka’s economy has enjoyed rapid growth at an average rate of approximately 5.8 percent between 2010 and 2017. This rate reflects a peace dividend and a determined policy thrust toward reconstruction and growth, although there have been some signs of a slowdown in the last three years. The economy is transitioning from a predominantly rural economy to a more urbanized one. The country’s social indicators rank among the highest in South Asia and often compare favorably with those in LMICs, but they lag behind those of upper-middle-income countries (uMICs). Through its policy
90
85
80
75
70
65
60
55
50100 1,000
a. Life expectancy at birth in 184 countries, 2016 b. DALYs per 100,000 persons in 184 countries, 2016
10,000
GDP per capita in log scale GDP per capita in log scale
Life
exp
ecta
ncy
at
bir
th
DA
LYs
per
10
0,0
00
100,000 1000
10,000
20,000
30,000
40,000
50,000
60,000
70,000
80,000
90,000
100,000
1,000 10,000 100,000
y = 4.55In(x) + 32.99
R2 = 0.73
y = –5,790 In(x) + 83,868
R2 = 0.4654
Sources: IHME 2018a, 2018b; World Bank, World Development Indicators (database), https://databank.worldbank.org/source/world-development-indicators.Note: DALY = disability-adjusted life year; GDP = gross domestic product.
FIGURE 1.2
Health and economic status are correlated

The Potential of Human Capital | 5
framework, the government is seeking to promote a globally competitive, export-led economy to generate inclusive, sustained growth.
Sri Lanka is striving to become an upper-middle-income economy, and devel-oping human capital at a higher level is key to achieving this development goal and ultimately becoming a high-income country. To this end, the government is seeking to promote a modern, knowledge-based economy and accelerate growth. These objectives place an increasing premium on higher-order cognitive skills, sociobehavioral skills, reasoning, and self-efficacy. Building these skills requires strong human capital foundations.
HUMAN CAPITAL PROJECT AND HUMAN CAPITAL INDEX
Because human capital is vitally important to economic growth, in 2019 the World Bank launched the Human Capital Project (HCP), which includes the Human Capital Index (HCI).1 The objective of the HCP is to accelerate human capital development around the world. The HCI is a cross-country metric designed to measure and forecast an economy’s human capital (World Bank 2018a). The index follows the trajectory, from birth to adulthood, of a child born today. It measures the amount of human capital that a child can expect to attain by age 18, given the risks of poor health and poor education that exist in the economy at the time of birth. The HCI has three components: (1) a measure of whether children survive from birth to school age (age five); (2) a measure of expected years of quality- adjusted schooling, which combines information on the quantity and quality of education; and (3) two broad measures of nutrition and health—stunting rates and adult survival rates. This framework and metric provides economies with a model for understanding the quantity and quality of their human capital and can help them navigate a path forward to develop their human capital.
HUMAN CAPITAL INDEX: SRI LANKA IN THE GLOBAL CONTEXT
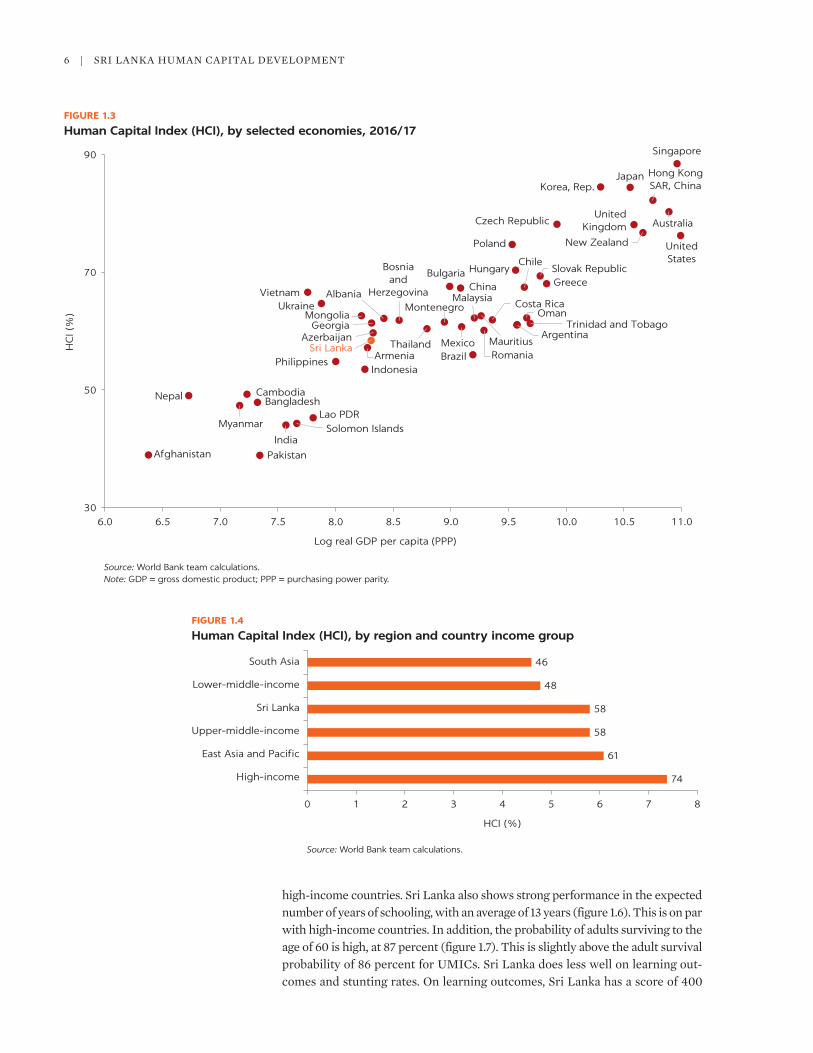
on the HCI, Sri Lanka performs only moderately well, with an overall score of 58 percent (figure 1.3). This means that children born in Sri Lanka today will achieve 58 percent of their potential in adulthood. By contrast, children born in the top-performing economies can expect to achieve much higher levels of human capital. For example, children born today in Singapore can expect to achieve 88 percent of their potential, children born in Japan and korea, 84 percent, and children born in Hong kong SAR, China, 82 percent.
Sri Lanka ranks 74th out of 157 economies included in the HCI. It is the best-performing country in South Asia. However, it lags behind East Asian economies such as China, Malaysia, Mongolia, Thailand, and vietnam, in addi-tion to the top performers just noted. Sri Lanka has an HCI score below those of European economies with similar levels of per capita income such as Albania, and West Asian economies such as Azerbaijan and Georgia.
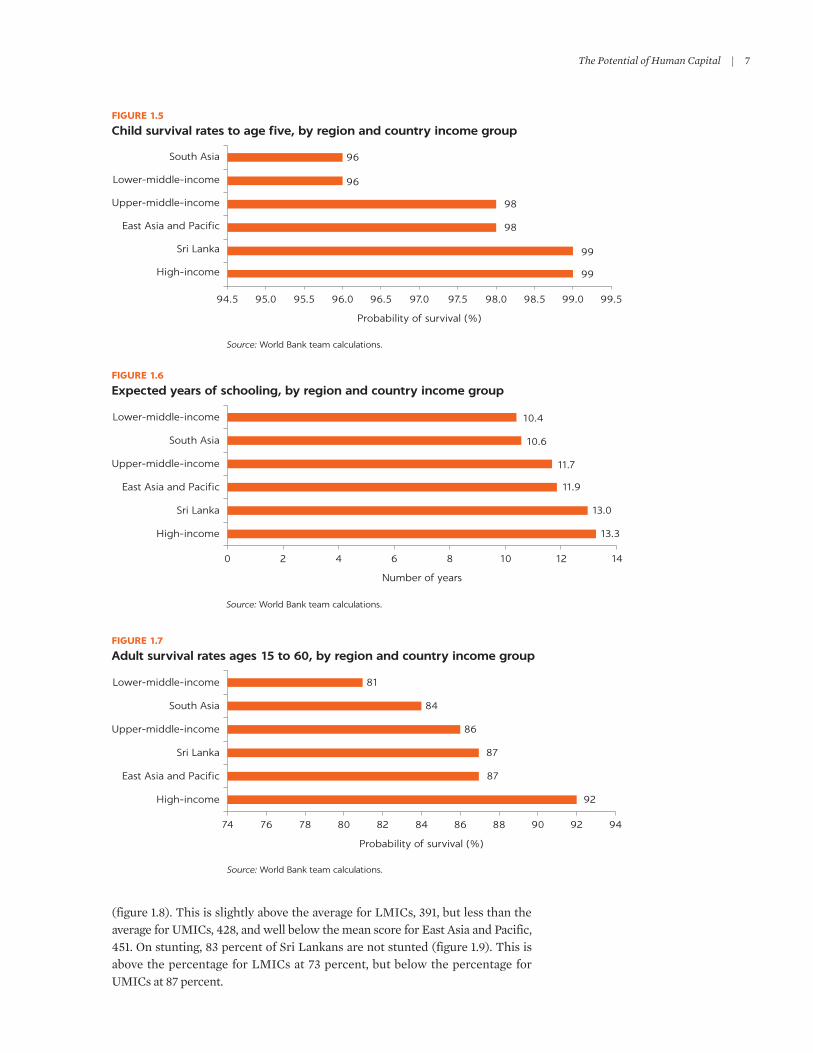
Sri Lanka performs well on some components of the HCI, but less well on others. overall, the HCI for Sri Lanka is above the average for LMICs and on a par with the average for uMICs (figure 1.4). Sri Lanka does well on the probabil-ity of children surviving to age five, with 99 percent of children reaching this age ( figure 1.5). This is equal to the probability of child survival in
6 | SRI LAnkA HuMAn CAPITAL DEvELoPMEnT
high-income countries. Sri Lanka also shows strong performance in the expected number of years of schooling, with an average of 13 years (figure 1.6). This is on par with high-income countries. In addition, the probability of adults surviving to the age of 60 is high, at 87 percent (figure 1.7). This is slightly above the adult survival probability of 86 percent for uMICs. Sri Lanka does less well on learning out-comes and stunting rates. on learning outcomes, Sri Lanka has a score of 400
Australia
Cambodia
Hong KongSAR, China
India
Indonesia
JapanKorea, Rep.
Malaysia
Myanmar
Nepal
Pakistan
Philippines
Singapore
Sri Lanka Thailand
Vietnam
Afghanistan
New Zealand
Lao PDRBangladesh
Poland
Hungary
Czech Republic
Slovak RepublicBulgaria
Romania
Greece
Brazil
China
Chile
Solomon Islands
MexicoArgentina
Trinidad and TobagoGeorgia
Montenegro
Bosniaand
HerzegovinaCosta Rica
Albania
Oman
Mauritius
MongoliaUkraine
UnitedKingdom
UnitedStates
Armenia
Azerbaijan
30
50
70
90
6.0 6.5 7.0 7.5 8.0 8.5 9.0 9.5 10.0 10.5 11.0
HC
I (%
)
Log real GDP per capita (PPP)
Source: World Bank team calculations.Note: GDP = gross domestic product; PPP = purchasing power parity.
FIGURE 1.3
Human Capital Index (HCI), by selected economies, 2016/17
Source: World Bank team calculations.
South Asia
Lower-middle-income
Sri Lanka
Upper-middle-income
East Asia and Pacific
High-income
0 1 2 3
HCI (%)
4 5 6
46
7
74
61
58
58
48
8
FIGURE 1.4
Human Capital Index (HCI), by region and country income group
The Potential of Human Capital | 7
Source: World Bank team calculations.
South Asia
Lower-middle-income
Sri Lanka
Upper-middle-income
East Asia and Pacific
High-income
94.5 95.0 96.095.5 96.5
Probability of survival (%)
97.0 97.5 98.0 98.5
96
96
99.0
99
9961
98
98
99.5
FIGURE 1.5
Child survival rates to age five, by region and country income group
Source: World Bank team calculations.
South Asia
Lower-middle-income
Sri Lanka
Upper-middle-income
East Asia and Pacific
High-income
0 2 4 6
Number of years
8 10 12
13.3
13.0
11.9
11.7
10.6
10.4
14
FIGURE 1.6
Expected years of schooling, by region and country income group
Source: World Bank team calculations.
South Asia
Lower-middle-income
Sri Lanka
Upper-middle-income
East Asia and Pacific
High-income
74 76 78 80 82
Probability of survival (%)
84 908886 92
92
87
87
86
84
81
94
FIGURE 1.7
Adult survival rates ages 15 to 60, by region and country income group
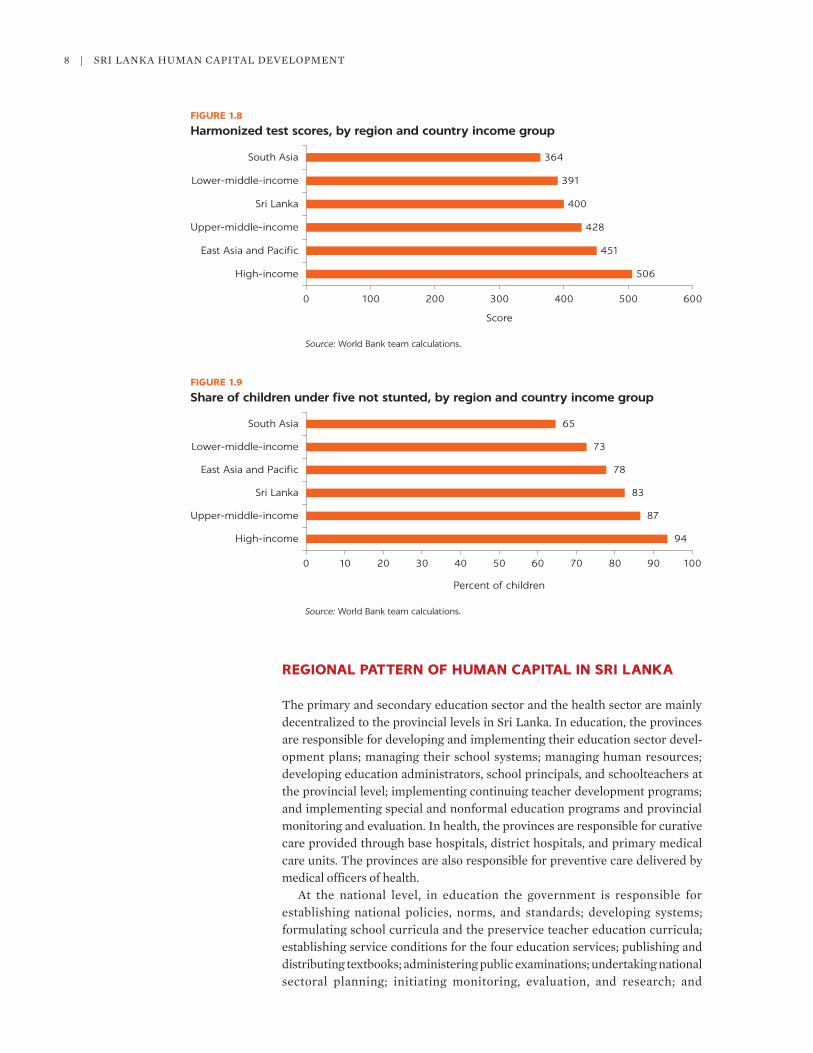
(figure 1.8). This is slightly above the average for LMICs, 391, but less than the average for uMICs, 428, and well below the mean score for East Asia and Pacific, 451. on stunting, 83 percent of Sri Lankans are not stunted (figure 1.9). This is above the percentage for LMICs at 73 percent, but below the percentage for uMICs at 87 percent.
8 | SRI LAnkA HuMAn CAPITAL DEvELoPMEnT
REGIONAL PATTERN OF HUMAN CAPITAL IN SRI LANKA
The primary and secondary education sector and the health sector are mainly decentralized to the provincial levels in Sri Lanka. In education, the provinces are responsible for developing and implementing their education sector devel-opment plans; managing their school systems; managing human resources; developing education administrators, school principals, and schoolteachers at the provincial level; implementing continuing teacher development programs; and implementing special and nonformal education programs and provincial monitoring and evaluation. In health, the provinces are responsible for curative care provided through base hospitals, district hospitals, and primary medical care units. The provinces are also responsible for preventive care delivered by medical officers of health.
At the national level, in education the government is responsible for establishing national policies, norms, and standards; developing systems; formulating school curricula and the preservice teacher education curricula; establishing service conditions for the four education services; publishing and distributing textbooks; administering public examinations; undertaking national sectoral planning; initiating monitoring, evaluation, and research; and
Source: World Bank team calculations.
South Asia
Lower-middle-income
Sri Lanka
Upper-middle-income
East Asia and Pacific
High-income
0 100 200 300 400
Score
500
506
451
428
400
391
364
600
FIGURE 1.8
Harmonized test scores, by region and country income group
Source: World Bank team calculations.
South Asia
Lower-middle-income
East Asia and Pacific
Sri Lanka
Upper-middle-income
High-income
0 10 20 30 40
Percent of children
50 60 70 80 90
94
87
83
78
73
65
100
FIGURE 1.9
Share of children under five not stunted, by region and country income group

The Potential of Human Capital | 9
overseeing overall quality assurance. In health, the government is responsible for curative care provided by central-level hospitals (the national hospital, teaching hospitals, provincial general hospitals, and district general hospitals) and preventive care delivered through vertical programs such as the mater-nal and child health program, tuberculosis control, dengue control, filaria control, and sexually transmitted disease control.
The next section analyzes the regional variations in human capital in view of the importance of the provinces in the delivery of education and health services. The fundamental principle guiding the calculation of provincial HCIs was that the aggregated provincial HCIs must equal the national HCI provided by the global human capital study. The calculation of HCIs from five indicators fol-lowed the same approach employed by the global study (World Bank 2018a). However, estimation of the five indicators was more complex because data from the subnational levels were limited, and, even if available, they were not derived in the same way as the data used for the national-level indicators in the global study. The key challenge was reconciling the aggregated provincial estimates to be consistent with the national estimates while preserving the regional varia-tions provided by subnational data. Subnational data were obtained from the following sources:
• Child survival: Life Tables for Sri Lanka 2011–2013 by District and Sex (Sri Lanka, DCS 2016); Sri Lanka Demographic and Health Survey 2016 (Sri Lanka, DCS 2017)
• Expected years of schooling: Sri Lanka Household Income and Expenditure Survey for 2012/13 and 2016 (Sri Lanka, DCS 2015, 2018)
• Harmonized learning outcomes: “Patterns and Trends in Achievement: TIMSS (national Assessment of Achievement of Students Completing Grade 8 in Year 2016 in Sri Lanka) (nEREC 2017)
• Adult survival: Life Tables for Sri Lanka 2011–2013 by District and Sex (Sri Lanka, DCS 2016)
• Fraction not stunted: Sri Lanka Demographic and Health Survey 2016 (Sri Lanka, DCS 2017)
The methodological details of estimating HCIs at the provincial level are pro-vided in appendix A.
Provincial variations in human capital
The provinces vary considerably in their HCI scores. Southern Province has the highest HCI, 63 percent, followed by Western Province, 62 percent, and north Western and Sabaragamuwa Provinces, 59 percent (map 1.1).2 At the other end of the scale, Eastern Province has the lowest HCI, 51 percent, followed by northern Province, 52 percent, and Central Province, 54 percent.
Western Province, the industrial and commercial hub of the country, has by far the highest per capita income among all provinces (table 1.1). It also contains a high proportion of the most advanced educational and health institutions. The high HCI value in Western Province is mainly associated with its level of eco-nomic and human development. However, Southern Province, which has an HCI slightly above that of Western Province despite being considerably poorer, shows that provinces can develop their human capital ahead of their level of per capita income. The main reason for the better learning levels in Southern Province is the close attention of policy makers to good teacher management

10 | SRI LAnkA HuMAn CAPITAL DEvELoPMEnT
Source: World Bank team calculations.
Males and females
63.3%50.7%
MAP 1.1
Human Capital Index, by province: Sri Lanka, 2016/17
TABLE 1.1 Human Capital Index (HCI), by province: Sri Lanka, 2016/17
PROVINCE HCI SCORE (%) HCI RANKGDP PER CAPITA (SL RS, MILLIONS)
GDP PER CAPITA RANK
POPULATION (THOUSANDS)
SHARE OF TOTAL POPULATION (%)
Western 62 2 783,645 1 6,081 28
Central 54 7 466,518 5 2,722 13
Southern 63 1 463,205 6 2,611 12
North Western 59 3–4 512,520 4 2,508 12
Northern 52 8 449,819 7 1,119 5
Eastern 51 9 416,088 9 1,677 8
North Central 57 5 519,344 2 1,349 6
Uva 55 6 518,388 3 1,349 6
Sabaragamuwa 59 3–4 446,698 8 2,028 9
National 58 n.a. 561,321 n.a. 21,444 100
Source: World Bank team calculations.
The Potential of Human Capital | 11
and development. The province effectively deployed teachers from schools with teacher surpluses to schools with teacher deficits in a way that minimized dis-rupting the family lives of teachers and reduced resistance to teacher transfers. In addition, Southern Province recruited teachers to fill vacancies in remote, estate sector schools, which had suffered from teacher shortages for many years.
Among the regions that perform less well on the HCI, northern and Eastern Provinces were the principal arenas of the 30-year secessionist conflict that ended in 2009, and their economies and education and health sectors are still recovering from the effects of the conflict. uva Province has large estate sectors,3 which are in the remote interior rural regions. The relatively lower HCI values in these provinces can be attributed to their lower levels of economic and human development. overall, the pattern that emerges is that Western Province and the provinces that border it—Southern, north Western, and Sabaragamuwa—have the highest HCI values. The HCI scores decrease the farther provinces are located from the western region.
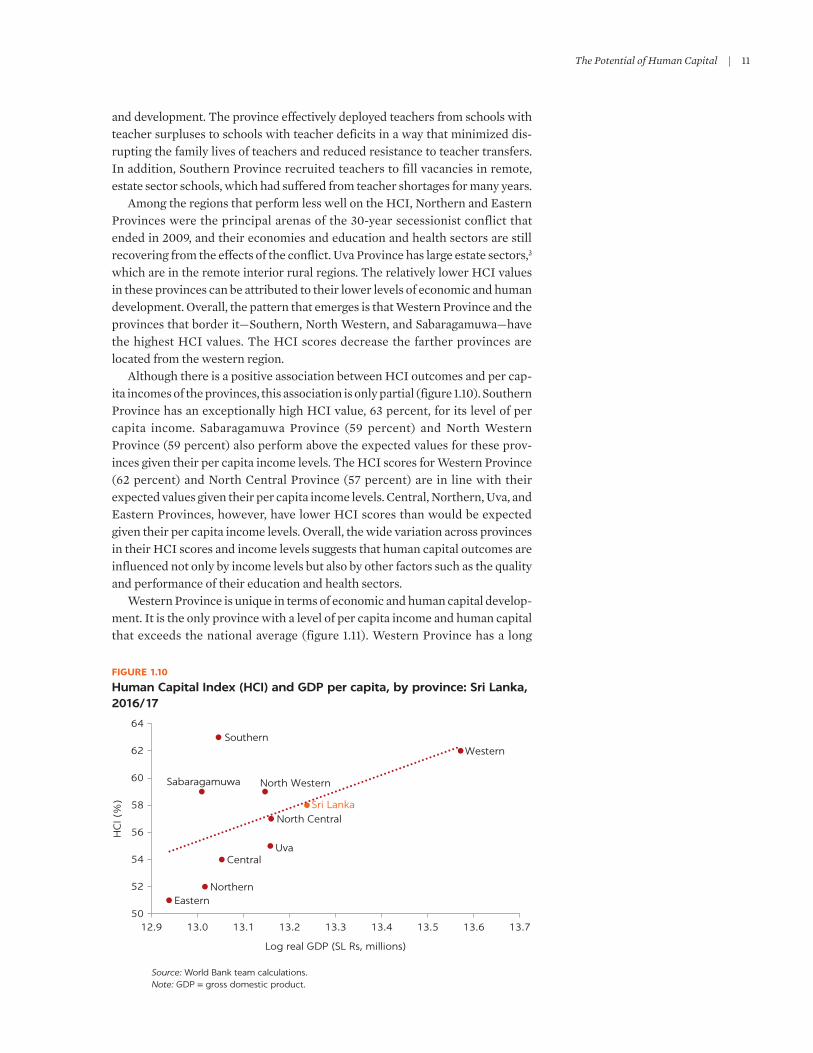
Although there is a positive association between HCI outcomes and per cap-ita incomes of the provinces, this association is only partial (figure 1.10). Southern Province has an exceptionally high HCI value, 63 percent, for its level of per capita income. Sabaragamuwa Province (59 percent) and north Western Province (59 percent) also perform above the expected values for these prov-inces given their per capita income levels. The HCI scores for Western Province (62 percent) and north Central Province (57 percent) are in line with their expected values given their per capita income levels. Central, northern, uva, and Eastern Provinces, however, have lower HCI scores than would be expected given their per capita income levels. overall, the wide variation across provinces in their HCI scores and income levels suggests that human capital outcomes are influenced not only by income levels but also by other factors such as the quality and performance of their education and health sectors.
Western Province is unique in terms of economic and human capital develop-ment. It is the only province with a level of per capita income and human capital that exceeds the national average (figure 1.11). Western Province has a long
Source: World Bank team calculations.Note: GDP = gross domestic product.
WesternSouthern
North Central
Sabaragamuwa North Western
Central
Eastern
Uva
Northern
Sri Lanka
50
52
54
56
58
60
62
64
12.9 13.0 13.1 13.2 13.3 13.4 13.5 13.6 13.7
HC
I (%
)
Log real GDP (SL Rs, millions)
FIGURE 1.10
Human Capital Index (HCI) and GDP per capita, by province: Sri Lanka, 2016/17
12 | SRI LAnkA HuMAn CAPITAL DEvELoPMEnT
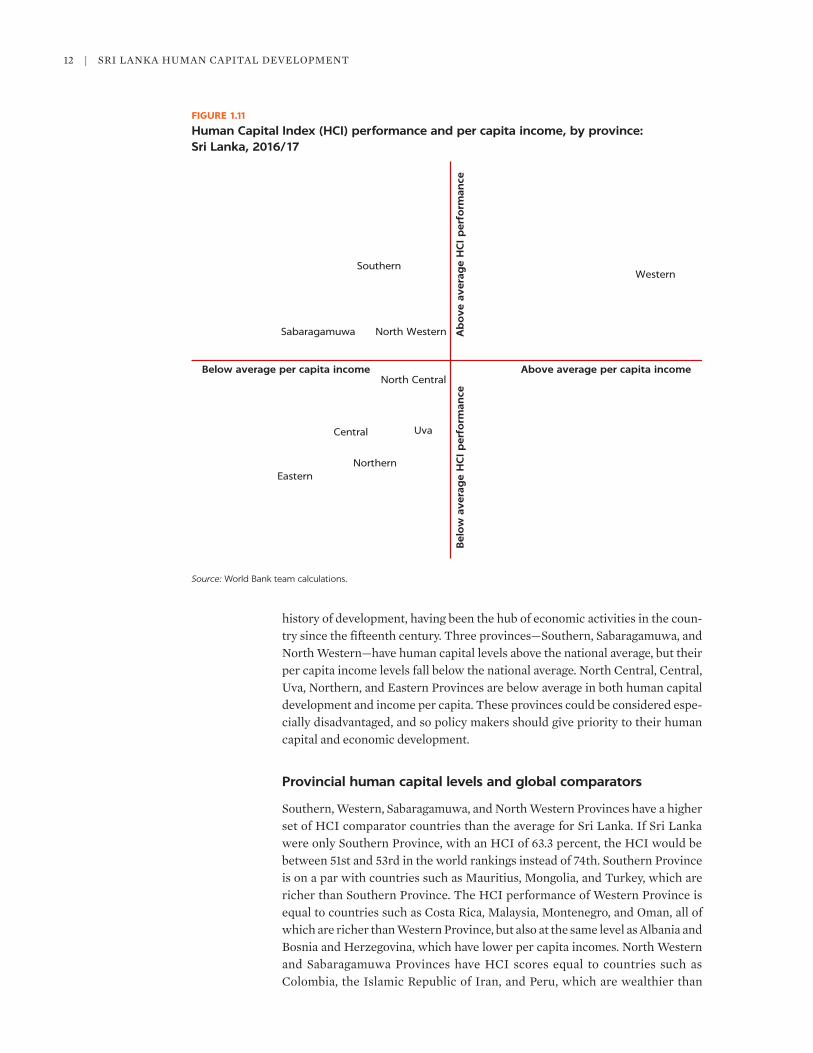
history of development, having been the hub of economic activities in the coun-try since the fifteenth century. Three provinces—Southern, Sabaragamuwa, and north Western—have human capital levels above the national average, but their per capita income levels fall below the national average. north Central, Central, uva, northern, and Eastern Provinces are below average in both human capital development and income per capita. These provinces could be considered espe-cially disadvantaged, and so policy makers should give priority to their human capital and economic development.
Provincial human capital levels and global comparators
Southern, Western, Sabaragamuwa, and north Western Provinces have a higher set of HCI comparator countries than the average for Sri Lanka. If Sri Lanka were only Southern Province, with an HCI of 63.3 percent, the HCI would be between 51st and 53rd in the world rankings instead of 74th. Southern Province is on a par with countries such as Mauritius, Mongolia, and Turkey, which are richer than Southern Province. The HCI performance of Western Province is equal to countries such as Costa Rica, Malaysia, Montenegro, and oman, all of which are richer than Western Province, but also at the same level as Albania and Bosnia and Herzegovina, which have lower per capita incomes. north Western and Sabaragamuwa Provinces have HCI scores equal to countries such as Colombia, the Islamic Republic of Iran, and Peru, which are wealthier than
Source: World Bank team calculations.
Above average per capita incomeBelow average per capita income
Ab
ove
ave
rag
e H
CI p
erfo
rman
ceB
elo
w a
vera
ge
HC
I p
erfo
rman
ce
WesternSouthern
North Central
Sabaragamuwa North Western
Central
Eastern
Uva
Northern
FIGURE 1.11
Human Capital Index (HCI) performance and per capita income, by province: Sri Lanka, 2016/17
The Potential of Human Capital | 13
these provinces. However, even Sri Lanka’s best-performing provinces lag behind East Asian economies such as China; Macao SAR, China; and vietnam; and, of course, the highest performers in the world: Hong kong SAR, China; Japan; korea; and Singapore (table 1.2).
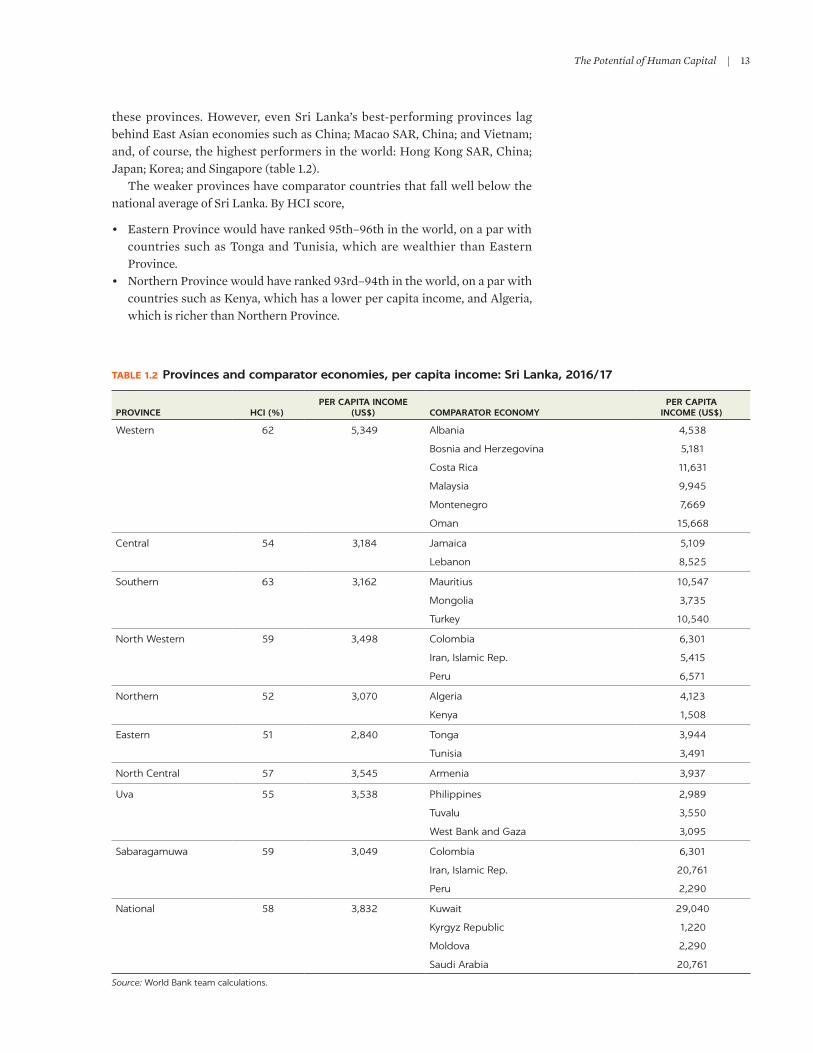
The weaker provinces have comparator countries that fall well below the national average of Sri Lanka. By HCI score,
• Eastern Province would have ranked 95th–96th in the world, on a par with countries such as Tonga and Tunisia, which are wealthier than Eastern Province.
• northern Province would have ranked 93rd–94th in the world, on a par with countries such as kenya, which has a lower per capita income, and Algeria, which is richer than northern Province.
TABLE 1.2 Provinces and comparator economies, per capita income: Sri Lanka, 2016/17
PROVINCE HCI (%)PER CAPITA INCOME
(US$) COMPARATOR ECONOMYPER CAPITA
INCOME (US$)
Western 62 5,349 Albania
Bosnia and Herzegovina
Costa Rica
Malaysia
Montenegro
Oman
4,538
5,181
11,631
9,945
7,669
15,668
Central 54 3,184 Jamaica
Lebanon
5,109
8,525
Southern 63 3,162 Mauritius
Mongolia
Turkey
10,547
3,735
10,540
North Western 59 3,498 Colombia
Iran, Islamic Rep.
Peru
6,301
5,415
6,571
Northern 52 3,070 Algeria
Kenya
4,123
1,508
Eastern 51 2,840 Tonga
Tunisia
3,944
3,491
North Central 57 3,545 Armenia 3,937
Uva 55 3,538 Philippines
Tuvalu
West Bank and Gaza
2,989
3,550
3,095
Sabaragamuwa 59 3,049 Colombia
Iran, Islamic Rep.
Peru
6,301
20,761
2,290
National 58 3,832 Kuwait
Kyrgyz Republic
Moldova
Saudi Arabia
29,040
1,220
2,290
20,761
Source: World Bank team calculations.
14 | SRI LAnkA HuMAn CAPITAL DEvELoPMEnT
• Central Province would have ranked 85th in the world, equal to countries such as Jamaica and Lebanon, both of which are wealthier than Central Province.
• uva Province would have ranked 82nd–84th in the world, on a par with economies such as the Philippines, Tuvalu, and West Bank and Gaza, all of which are poorer than uva Province.
overall, the provinces exhibit wide variation in their HCI scores and ranks. The range of countries with HCI values comparable to the various provinces is large and varied, covering countries in East Asia, Europe, Central and South America, and the Middle East and north Africa (table 1.2). The main drivers of the wide range of HCI values among the provinces appear to be variations in the two dimensions in which Sri Lanka performs less well—stunting and especially learning outcomes.
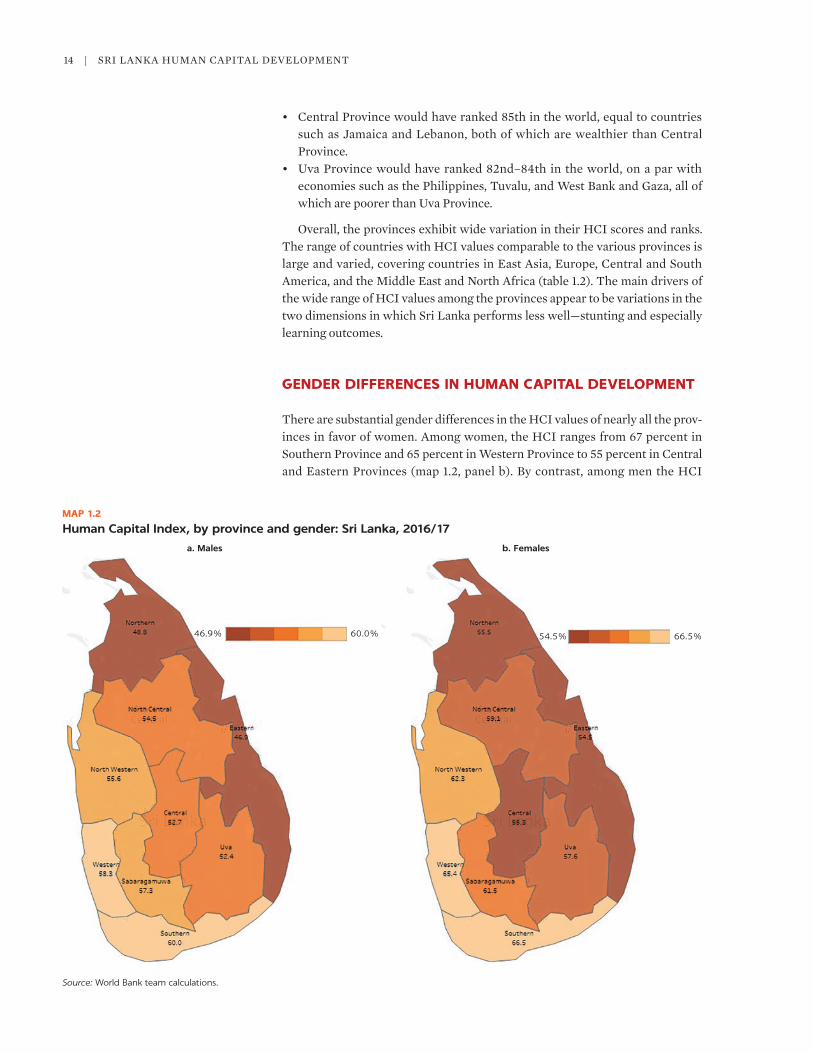
GENDER DIFFERENCES IN HUMAN CAPITAL DEVELOPMENT
There are substantial gender differences in the HCI values of nearly all the prov-inces in favor of women. Among women, the HCI ranges from 67 percent in Southern Province and 65 percent in Western Province to 55 percent in Central and Eastern Provinces (map 1.2, panel b). By contrast, among men the HCI
Source: World Bank team calculations.
a. Males
60.0%46.9%
b. Females
66.5%54.5%
MAP 1.2
Human Capital Index, by province and gender: Sri Lanka, 2016/17

The Potential of Human Capital | 15
ranges from 60 percent in Southern Province and 58 percent in Western Province to 47 percent in Eastern Province and 49 percent in northern Province (map 1.2, panel a). The largest gender gap is in Eastern Province, where the HCI score is 8 percentage points higher for women than for men. This is followed by the gen-der differences in Western, Southern, and northern Provinces, where the HCI scores for women are 7 percentage points higher than those for men. The small-est gender gaps are in Central Province, 2 percentage points in favor of women, followed by north Central Province, with a significant gender difference of 4 percentage points.
TRENDS IN HUMAN CAPITAL DEVELOPMENT
Human capital levels have improved over time in most but not all provinces (see maps 1.2 and 1.3 and figure 1.12). Among women, the HCI scores have improved in Southern, Central, north Central, north Western, uva, and Sabaragamuwa Provinces. The highest increase has been in Southern Province, where the HCI score has risen 5 percentage points, from 62 percent in 2012/13 (map 1.3, panel b) to 67 percent in 2016/17 (map 1.2, panel b). In the other provinces, the increase in the HCI value between 2012/13 and 2016/17 has been in the range of 1–2 percentage points. In three provinces—the Western, northern, and
Source: World Bank team calculations.
a. Males
58.9%50.0%
b. Females
65.7%53.0%
MAP 1.3
Human Capital Index, by province and gender: Sri Lanka, 2012/13

16 | SRI LAnkA HuMAn CAPITAL DEvELoPMEnT
Source: World Bank team calculations.
EasternWestern
North Western
Central
North Central
Southern
Uva
Northern
Sabaragamuwa
a. Males
40
45
50
55
60
65
70
2012/13 2016/17
HC
I (%
)
b. Females
40
45
50
55
60
65
70
2012/13 2016/17
HC
I (%
)
FIGURE 1.12
Human Capital Index (HCI) by gender and province: Sri Lanka, 2012/13 and 2016/17
Eastern—the HCI score declined between 2012/13 and 2016/17. The decrease was only 1 percentage point in Western and northern Provinces. But the decline in Eastern Province was much larger, 5 percentage points, from an HCI value of 60 percent in 2012/13 to 55 percent in 2016/17. Among men, as for women, the HCI score improved in Southern, Central, north Central, north Western, uva, and Sabaragamuwa Provinces. The greatest increase was in Southern and Sabaragamuwa Provinces, where the HCI score rose about 4 percentage points, from 56 percent in 2012/13 to 60 percent in 2016/17 in Southern Province and from 53 percent in 2012/13 to 57 percent in 2016/17 in Sabaragamuwa Province (see maps 1.2 and 1.3, panel a). In three provinces, however—Western, northern, and Eastern—the HCI score fell between 2012/13 and 2016/17. The decline was only 1 percentage point in Western and northern Provinces. However, the fall in Eastern Province was much larger, 5 percentage points, from an HCI value of 52 percent in 2012/13 to 47 percent in 2016/17.
HEALTH AND EDUCATION SPENDING AND HUMAN CAPITAL DEVELOPMENT
In Sri Lanka, public policy is directed toward providing the less developed prov-inces with more resources, including for health and education. The Finance Commission, which recommends what funding levels the government should adopt for the provinces, seeks to promote balanced regional growth by investing more funds in the provinces that need more resources. This policy is illustrated in figures 1.13 and 1.14, which compare the levels of HCI and per capita health spending and per student education spending in each province. Provinces with lower HCIs, such as northern Province, have higher levels of health and educa-tion spending than the more advanced Western, Southern, and north Western Provinces. However, some provinces spend less relative to their HCI levels (that is, below the dotted lines), such as Eastern (health and education), Central (health), and uva (education) Provinces, which potentially indicates gaps in investments in those provinces.

The Potential of Human Capital | 17
CONCLUSIONS
Analysis of human capital using the HCI yields several novel and important find-ings. Sri Lanka performs well on several dimensions of health and education, such as child survival, expected years of schooling, and adult survival. The coun-try exceeds the average levels of achievement in LMICs and even uMICs on these components of human capital. These positive findings show that the policy
Sources: Ministry of Health; World Bank team calculations.
63.3 61.859.4 58.9 56.8 55.0 54.0 52.2 50.7
0
10
20
30
40
50
60
70
Sout
hern
Wes
tern
Saba
raga
muw
a
North
Wes
tern
North
Cen
tral
Uva
Centra
l
North
ern
Easte
rn0
1,000
2,000
3,000
4,000
5,000
6,000
Per
cap
ita
hea
lth
sp
end
ing
(SL
Rs)
HC
I (%
)
HCI (left axis)
Linear (per capita health spending (right axis))
Per capita health spending (right axis)
FIGURE 1.13
Per capita health spending and Human Capital Index (HCI), by province: Sri Lanka, 2018
Sources: Ministry of Education; World Bank team calculations.
63.3 61.859.4 58.9 56.8 55.0 54.0 52.2 50.7
0
10
20
30
40
50
60
70
Sout
hern
Wes
tern
Saba
raga
muw
a
North
Wes
tern
North
Cen
tral
Uva
Centra
l
North
ern
Easte
rn0
500
1,000
Per
stu
den
t ed
uca
tion s
pen
din
g (
SL R
s)1,500
2,000
2,500
HC
I (%
)
HCI (left axis)
Linear (per student education spending (right axis))
Per student education spending (right axis)
FIGURE 1.14
Per student education spending and Human Capital Index (HCI), by province: Sri Lanka, 2018
18 | SRI LAnkA HuMAn CAPITAL DEvELoPMEnT
framework to address the first-generation needs of human capital development has been successful. This outcome could encourage policy makers to prepare bold policy initiatives to meet the second- and third-generation requirements for human capital development.
Sri Lanka faces deep-rooted challenges in stunting, which reflect nutrition levels and learning-adjusted years of schooling. These second-generation chal-lenges will be difficult to address. Yet they are vital for human capital develop-ment and equitable economic growth. Learning outcomes in particular are a major challenge when compared with the performance of uMICs and the potential demonstrated by advanced educational systems in East Asia. A deeper analysis of provincial variations in stunting and learning-adjusted years of schooling is undertaken in the next chapter. Policy options to address these chal-lenges, drawing on lessons from other countries, are discussed in chapters 3 and 4 of this report.
The pattern of provincial variations in human capital reveals some surprising findings. one unexpected finding is that Southern Province has the highest level of human capital, as measured by the HCI, despite the fact that wealthy Western Province is perceived to be the most advanced region. Indeed, Southern Province, despite being considerably poorer than Western Province, has achieved a slightly higher level of human capital. This is an encouraging finding for the other prov-inces because human capital development can be promoted more quickly than economic growth. Eastern Province has the lowest level of human capital—an unexpected finding because northern Province, the main theater of the long secessionist conflict, has been regarded as the least developed region. This is an important finding because it indicates that Eastern Province needs special policy attention.
Human capital varies substantially across the provinces. The global rankings of the provinces range from 51st–53rd for Southern Province to 93rd–94th for Eastern Province. This finding contrasts with the national average, which places Sri Lanka 74th out of 155 economies in the global rankings. The provinces fall into two sets: Southern, Western, north Western, and Sabaragamuwa Provinces perform above the national average of the HCI, and Eastern, northern, Central, uva, and north Central Provinces perform below the average value of the HCI for the country. This important finding reveals the provinces where future policy attention to improving human capital is most urgently needed.
Gender variations in human capital favor girls and women. Women live lon-ger, spend more time in school, and learn better. This is a consistent pattern across all provinces. The gender gap is most significant in Eastern Province, fol-lowed by northern Province, Western Province, and Southern Province. These provinces have the lowest and the highest HCI scores. The gender gap in human capital is significant and suggests that promoting human capital development among boys is particularly important for policy makers.
The recent time trend of human capital development shows an uneven pat-tern among the provinces. In six provinces—Southern, Central, north Central, north Western, uva, and Sabaragamuwa—human capital levels rose for both males and females from 2012/13 to 2016/17. However, in three provinces—Eastern, Western, and northern—human capital levels have declined. A con-certed policy effort is needed to promote human capital development in these provinces. The task is especially important because Eastern and northern Provinces have the lowest HCI values in the country.
A summary of this report’s recommendations appears in table B.1, appendix B.
The Potential of Human Capital | 19
NOTES
1. The HCI differs from the united nations Development Programme’s Human Development Index, which is a composite measure of three key dimensions of human development: adult life expectancy, education, and per capita income. By contrast, the HCI is designed to cap-ture the main dimensions of human capital development as discussed earlier.
2. HCI scores are rounded off in text and tables for ease of reading.3. The term estate sector refers to the large-scale tea and rubber plantations.
REFERENCES
Aturupane, H., A. Deolalikar, and D. Gunewardena. 2011. “Determinants of Child Weight and Height in Sri Lanka: A Quantile Regression Approach.” In Health Inequality and Development, edited by M. Gillivray, I. Dutta, and D. Lawson, 64–88. new York: Springer Publishing.
Barro, R. J., and J. W. Lee. 2013. “A new Data Set of Educational Attainment in the World. 1950–2010.” nBER Working Paper 15902, national Bureau of Economic Research, Cambridge, MA.
Crawford, M. F., A. Hasan, and R. Bentaouet kattan. 2018. Growing Smarter: Learning and Equitable Development in East Asia and Pacific. World Bank East Asia and Pacific Regional Report. Washington, DC: World Bank.
Galasso, E., and A. Wagstaff. 2018. “The Aggregate Income Losses from Childhood Stunting and the Returns to a nutrition Intervention Aimed at Reducing Stunting.” World Bank, Washington, DC.
Glewwe, P., E. Maiga, and H. Zheng. 2014. “The Contribution of Education to Economic Growth: A Review of the Evidence, with Special Attention and an Application to Sub-Saharan Africa.” World Development 59: 379–93.
Guerra, n., k. Modecki, and W. Cunningham. 2014. “Developing Social-Emotional Skills for the Labor Market: The PRACTICE Model.” Policy Research Working Paper 7123, World Bank, Washington, DC.
Hanushek, E. A., and L. Woessmann. 2012. “Do Better Schools Lead to More Growth? Cognitive Skills, Economic outcomes, and Causation.” Journal of Economic Growth 17 (4): 267–321.
Hanushek, E. A., and L. Woessmann. 2015. The Knowledge Capital of Nations: Education and the Economics of Growth. Cambridge, MA: MIT Press.
IHME (Institute for Health Metrics and Evaluation). 2018a. “GBD Compare.” IHME, Seattle, WA. https://vizhub.healthdata.org/gbd-compare/.
IHME (Institute for Health Metrics and Evaluation). 2018b. “Mortality visualization.” IHME, Seattle, WA. https://vizhub.healthdata.org/mortality/.
nEREC (national Education Research and Evaluation Centre). 2017. “Patterns and Trends in Achievement: TIMSS (national Assessment of Achievement of Students Completing Grade 8 in Year 2016 in Sri Lanka).” nEREC, Colombo, Sri Lanka.
Reimers, Fernando M., Rosario Jaramillo, and Cristian Cox. 2005. Education for Citizenship and Democracy in the Americas: An Agenda for Action. Washington, DC: Inter-American Development Bank, Sustainable Development Department, State, Governance and Civil Society Division Education unit.
Sri Lanka, DCS (Department of Census and Statistics). 2015. Sri Lanka Household Income and Expenditure Survey 2012/13. DCS, Battaramulla, Sri Lanka.
Sri Lanka, DCS (Department of Census and Statistics). 2016. Life Tables for Sri Lanka 2011–2013 by District and Sex. DCS, Battaramulla, Sri Lanka.
Sri Lanka, DCS (Department of Census and Statistics). 2017. Sri Lanka Demographic and Health Survey 2016. DCS and Ministry of Health, nutrition and Indigenous Medicine, Battaramulla, Sri Lanka.
Sri Lanka, DCS (Department of Census and Statistics). 2018. Sri Lanka Household Income and Expenditure Survey 2016. DCS, Battaramulla, Sri Lanka.
20 | SRI LAnkA HuMAn CAPITAL DEvELoPMEnT
Weil, D. C. 2014. “Health and Economic Growth.” In Handbook of Economic Growth, edited by P. Aghion and S. n. Durlauf, vol. 2B, 623–82. new York: Elsevier.
World Bank. 2018a. The Human Capital Project. Washington, DC: World Bank.
World Bank. 2018b. World Development Report 2018: Learning to Realize Education’s Promise. Washington, DC: World Bank.
World Bank. 2019. World Development Report 2019: The Changing Nature of Work. Washington, DC: World Bank.
21
INTRODUCTION
In Sri Lanka, promoting geographically equitable education, health, and nutrition outcomes will be of central importance for future human capital development. On both equity and efficiency grounds, improving human capital at the national level will increasingly require the development of human capital in the more disadvantaged provinces. This chapter analyzes regional differences in the key components of the Human Capital Index (HCI). The analysis begins with a dis-cussion of provincial variations in the three measures of educational outcomes: expected years of schooling, internationally comparable learning outcomes (in mathematics and English language), and learning-adjusted years of schooling. A discussion of provincial variations in measures of health and nutrition outcomes—child survival, adult survival, and stunting—follows.
PROVINCIAL VARIATIONS IN HUMAN CAPITAL OUTCOMES: EDUCATION
Years of schooling
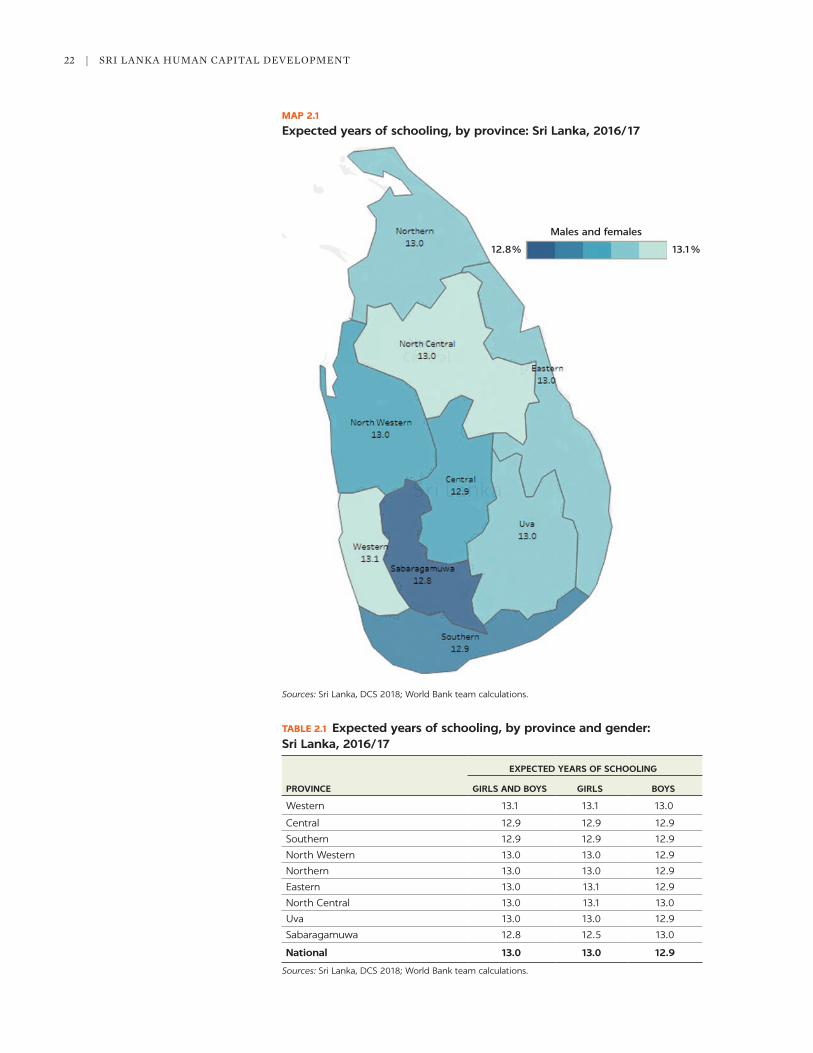
Expected years of schooling are evenly distributed across the provinces. The years range from 12.8 in Sabaragamuwa Province to 13.1 in Western Province (map 2.1). All other provinces cluster within this narrow range, presenting a highly equitable pattern across the provinces. Gender variations in expected years of schooling are also small (table 2.1). The expected years of schooling for girls varies between 12.5 in Sabaragamuwa Province and 13.1 in Western, Eastern, and North Central Provinces. Among boys, expected years of schooling range from 12.9 to 13.0 in all provinces.
This equitable pattern of expected years of schooling across the provinces and between boys and girls can be attributed to public policy, covering both demand- and supply-side measures to enable school attendance implemented over a long period of time. Public policy to provide equitable access to schools for all children has resulted in an island-wide network of schools (Little 2011; Little and Hettige 2013). The distribution of schools across provinces is based on the distribution of
Regional Variations in Human Capital Outcomes in Sri Lanka2
22 | SrI LANkA HumAN CAPITAL DEvELOPmENT
MAP 2.1
Expected years of schooling, by province: Sri Lanka, 2016/17
Sources: Sri Lanka, DCS 2018; World Bank team calculations.
Males and females
12.8% 13.1%
TABLE 2.1 Expected years of schooling, by province and gender: Sri Lanka, 2016/17
PROVINCE
EXPECTED YEARS OF SCHOOLING
GIRLS AND BOYS GIRLS BOYS
Western 13.1 13.1 13.0
Central 12.9 12.9 12.9
Southern 12.9 12.9 12.9
North Western 13.0 13.0 12.9
Northern 13.0 13.0 12.9
Eastern 13.0 13.1 12.9
North Central 13.0 13.1 13.0
Uva 13.0 13.0 12.9
Sabaragamuwa 12.8 12.5 13.0
National 13.0 13.0 12.9
Sources: Sri Lanka, DCS 2018; World Bank team calculations.
Regional Variations in Human Capital Outcomes in Sri Lanka | 23
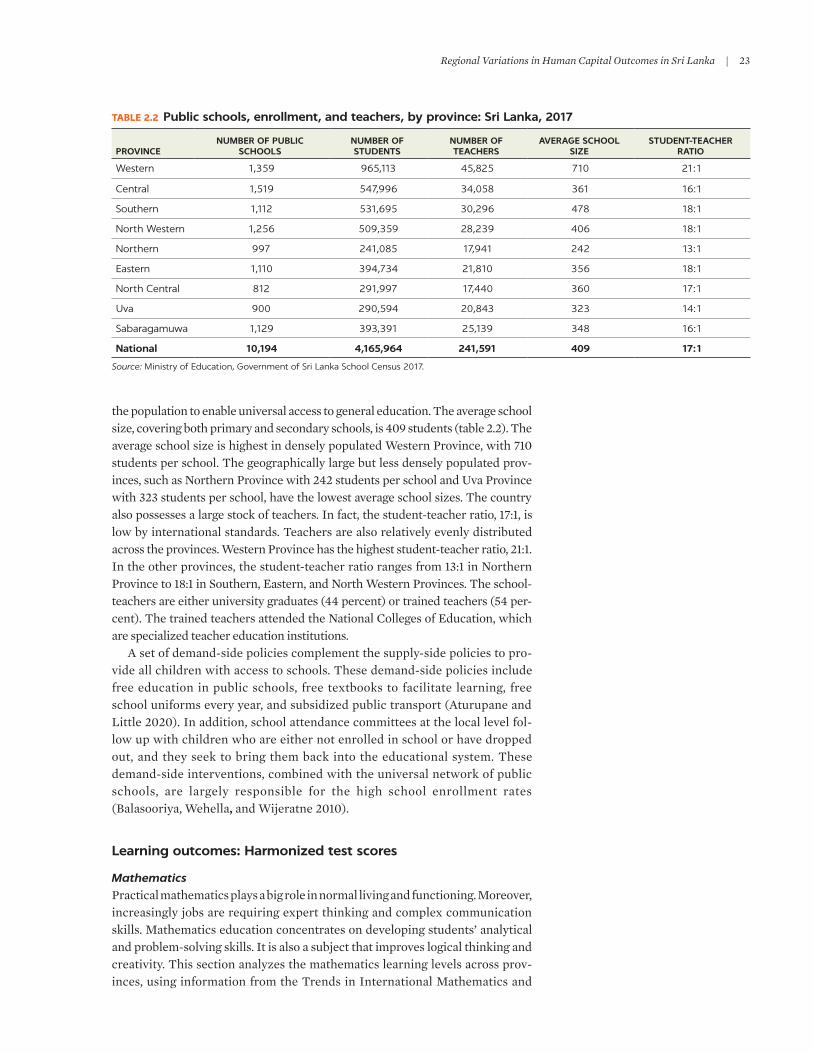
the population to enable universal access to general education. The average school size, covering both primary and secondary schools, is 409 students (table 2.2). The average school size is highest in densely populated Western Province, with 710 students per school. The geographically large but less densely populated prov-inces, such as Northern Province with 242 students per school and uva Province with 323 students per school, have the lowest average school sizes. The country also possesses a large stock of teachers. In fact, the student-teacher ratio, 17:1, is low by international standards. Teachers are also relatively evenly distributed across the provinces. Western Province has the highest student-teacher ratio, 21:1. In the other provinces, the student-teacher ratio ranges from 13:1 in Northern Province to 18:1 in Southern, Eastern, and North Western Provinces. The school-teachers are either university graduates (44 percent) or trained teachers (54 per-cent). The trained teachers attended the National Colleges of Education, which are specialized teacher education institutions.
A set of demand-side policies complement the supply-side policies to pro-vide all children with access to schools. These demand-side policies include free education in public schools, free textbooks to facilitate learning, free school uniforms every year, and subsidized public transport (Aturupane and Little 2020). In addition, school attendance committees at the local level fol-low up with children who are either not enrolled in school or have dropped out, and they seek to bring them back into the educational system. These demand-side interventions, combined with the universal network of public schools, are largely responsible for the high school enrollment rates (Balasooriya, Wehella, and Wijeratne 2010).
Learning outcomes: Harmonized test scores
MathematicsPractical mathematics plays a big role in normal living and functioning. moreover, increasingly jobs are requiring expert thinking and complex communication skills. mathematics education concentrates on developing students’ analytical and problem-solving skills. It is also a subject that improves logical thinking and creativity. This section analyzes the mathematics learning levels across prov-inces, using information from the Trends in International mathematics and
TABLE 2.2 Public schools, enrollment, and teachers, by province: Sri Lanka, 2017
PROVINCENUMBER OF PUBLIC
SCHOOLSNUMBER OF STUDENTS
NUMBER OF TEACHERS
AVERAGE SCHOOL SIZE
STUDENT-TEACHER RATIO
Western 1,359 965,113 45,825 710 21:1
Central 1,519 547,996 34,058 361 16:1
Southern 1,112 531,695 30,296 478 18:1
North Western 1,256 509,359 28,239 406 18:1
Northern 997 241,085 17,941 242 13:1
Eastern 1,110 394,734 21,810 356 18:1
North Central 812 291,997 17,440 360 17:1
Uva 900 290,594 20,843 323 14:1
Sabaragamuwa 1,129 393,391 25,139 348 16:1
National 10,194 4,165,964 241,591 409 17:1
Source: Ministry of Education, Government of Sri Lanka School Census 2017.

24 | SrI LANkA HumAN CAPITAL DEvELOPmENT
Science Study (TImSS) items used as part of the national assessments of learning outcomes in the country (see box 2.1 for details of scores).
Learning outcomes in mathematics vary substantially among the provinces. The mathematics learning scores range from 325 in Eastern Province to 445 in Southern Province (map 2.2). The other lower-performing provinces are Northern Province (349) and uva and Central Provinces (367). The highest-performing provinces after Southern Province are Western Province (426), Sabaragamuwa Province (421), and North Western Province (410). The dif-ferences between the low-performing and high-performing provinces are large.
The gender differences in mathematics learning outcomes are considerable. At the national level, girls have an average score of 416 and boys an average score of 383 (table 2.3). In all provinces, girls outperform boys. The gender gap is larg-est in Eastern Province, where girls score 353 and boys score 295, resulting in a difference of 58 points. The second-largest gender gap is in Western Province, with girls scoring 446 and boys scoring 405, for a difference of 41 points. The gender gap is lowest in Central Province, 7 points, and North Central Province, 10 points. However, in all the other provinces the gender gap is at least 27 points, which is a substantial difference. The superior performance of girls over boys is becoming increasingly recognized in global policy circles (OECD 2015) and in Sri Lanka (Aturupane, Shojo, and Ebenezer 2018).
Language as human and social capitalEnglish is the language of the global knowledge economy and one of the most valuable economic assets of a country. It is the most widely used language in international trade, finance, and commerce. India, Sri Lanka’s large and growing neighbor, has become an economic powerhouse and the back office of the world mainly because of its large number of entrepreneurs, employees, and workers fluent in English. China, the fast-growing economic giant and manufacturing powerhouse of the world, has launched an enormous drive to expand and improve English language teaching and learning, and so hundreds of millions of Chinese are learning English. English, in addition to its economic benefits, is also important for promoting social cohesion across Sri Lanka’s ethno-linguistic
Sources of scores on learning outcomes
The scores for mathematics and English language cited in this overall section are taken from different sources.
Mathematics. The test scores were obtained from the Sri Lankan version of the Trends in International mathematics and Science Study (SL-TImSS) for Grade 8 conducted in 2014 and 2016 (NErEC 2017). In this version, a score can range from 0 to 70. The international TImSS pools test results from dozens of countries for the same year and adjusts the values so that the mean score of all countries becomes 500 with a standard deviation of 100. The global human capital study assumes that the maximum attainable score is 625. Because the outcomes of mathematics
based on tests of cognitive achievement were used to calculate the Human Capital Index, the scores were scaled so that the population-weighted aver-age score of SL-TImSS equaled the national average of 400 in the international TImSS score that was used for the global study. The scaled scores are reported here.
English language. The test scores were obtained from the National Assessment of Achievement of Students Completing Grade 8 in Sri Lanka conducted in 2014 and 2016 (NErEC 2015, 2017). A score can range from 0 to 100. The reported scores were scaled in the same manner as those for mathematics for ease of comparison with mathematics.
BOX 2.1

Regional Variations in Human Capital Outcomes in Sri Lanka | 25
MAP 2.2
Harmonized mathematics test scores, by province: Sri Lanka, 2016/17
Sources: NEREC 2017; World Bank team calculations.
Males and females
325% 445%
TABLE 2.3 Mathematics learning scores, by province and gender: Sri Lanka, 2016/17
PROVINCE
MATHEMATICS LEARNING SCORE
GIRLS AND BOYS GIRLS BOYS
Western 426 446 405
Central 367 370 363
Southern 445 464 424
North Western 410 426 393
Northern 349 364 333
Eastern 325 353 295
North Central 383 388 378
Uva 367 380 354
Sabaragamuwa 421 434 407
National 400 416 383
Sources: NEREC 2017; World Bank team calculations.
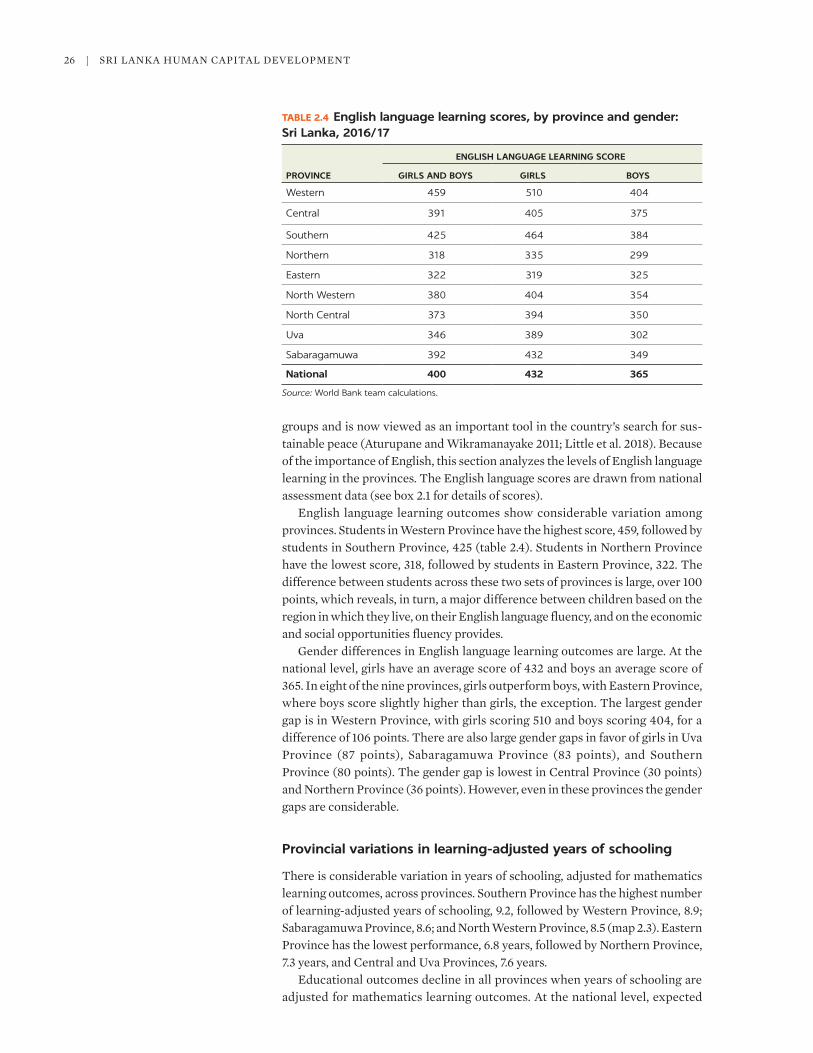
26 | SrI LANkA HumAN CAPITAL DEvELOPmENT
groups and is now viewed as an important tool in the country’s search for sus-tainable peace (Aturupane and Wikramanayake 2011; Little et al. 2018). Because of the importance of English, this section analyzes the levels of English language learning in the provinces. The English language scores are drawn from national assessment data (see box 2.1 for details of scores).
English language learning outcomes show considerable variation among provinces. Students in Western Province have the highest score, 459, followed by students in Southern Province, 425 (table 2.4). Students in Northern Province have the lowest score, 318, followed by students in Eastern Province, 322. The difference between students across these two sets of provinces is large, over 100 points, which reveals, in turn, a major difference between children based on the region in which they live, on their English language fluency, and on the economic and social opportunities fluency provides.
Gender differences in English language learning outcomes are large. At the national level, girls have an average score of 432 and boys an average score of 365. In eight of the nine provinces, girls outperform boys, with Eastern Province, where boys score slightly higher than girls, the exception. The largest gender gap is in Western Province, with girls scoring 510 and boys scoring 404, for a difference of 106 points. There are also large gender gaps in favor of girls in uva Province (87 points), Sabaragamuwa Province (83 points), and Southern Province (80 points). The gender gap is lowest in Central Province (30 points) and Northern Province (36 points). However, even in these provinces the gender gaps are considerable.
Provincial variations in learning-adjusted years of schooling
There is considerable variation in years of schooling, adjusted for mathematics learning outcomes, across provinces. Southern Province has the highest number of learning-adjusted years of schooling, 9.2, followed by Western Province, 8.9; Sabaragamuwa Province, 8.6; and North Western Province, 8.5 (map 2.3). Eastern Province has the lowest performance, 6.8 years, followed by Northern Province, 7.3 years, and Central and uva Provinces, 7.6 years.
Educational outcomes decline in all provinces when years of schooling are adjusted for mathematics learning outcomes. At the national level, expected
TABLE 2.4 English language learning scores, by province and gender: Sri Lanka, 2016/17
PROVINCE
ENGLISH LANGUAGE LEARNING SCORE
GIRLS AND BOYS GIRLS BOYS
Western 459 510 404
Central 391 405 375
Southern 425 464 384
Northern 318 335 299
Eastern 322 319 325
North Western 380 404 354
North Central 373 394 350
Uva 346 389 302
Sabaragamuwa 392 432 349
National 400 432 365
Source: World Bank team calculations.

Regional Variations in Human Capital Outcomes in Sri Lanka | 27
years of schooling fall from 13 years to 8.3 years when adjusted for learning—a substantial decrease. The gap between expected years of schooling and learning-adjusted years of schooling ranges from about six years in Eastern and Northern Provinces to about four years in Western and Southern Provinces.
There are steep gender differences in expected years of schooling adjusted for mathematics learning outcomes. Girls outperform boys in all provinces (table 2.5). The gender gap is highest in Eastern Province, where girls effectively have 1.3 more years of education than boys. Western and Southern Provinces follow, where girls effectively have 1 year and 0.9 more years of education than boys, respectively. The gender gap is lowest in Central Province (0.1 years), Sabaragamuwa Province (0.2 years), and the North Central Province (0.3 years).
Substantial differences in years of schooling, adjusted for English language learning, are found among provinces. Students in Western Province have the highest level of achievement, 9.6 years, followed by students in Southern Province, 8.8 years, and those in Central Province, 8.1 years (table 2.6).
MAP 2.3
Mathematics learning-adjusted years of schooling, by province: Sri Lanka, 2016/17
Males and females
6.8% 9.2%
Source: World Bank team calculations.
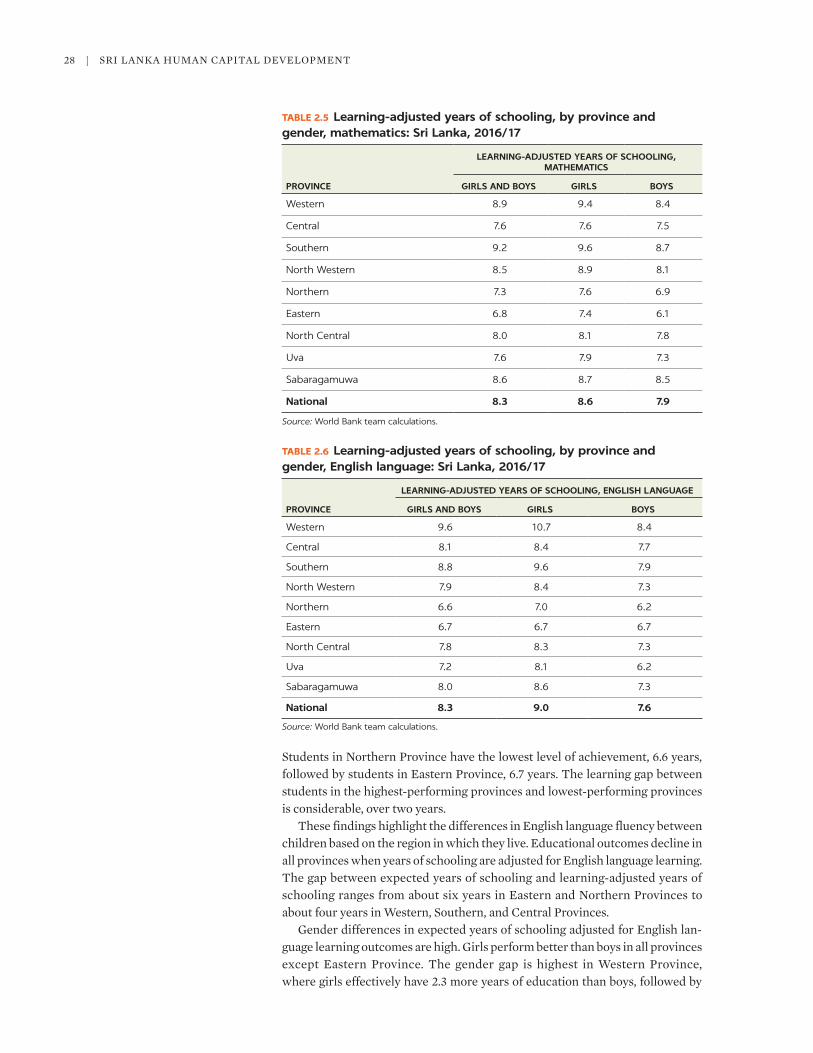
28 | SrI LANkA HumAN CAPITAL DEvELOPmENT
Students in Northern Province have the lowest level of achievement, 6.6 years, followed by students in Eastern Province, 6.7 years. The learning gap between students in the highest-performing provinces and lowest-performing provinces is considerable, over two years.
These findings highlight the differences in English language fluency between children based on the region in which they live. Educational outcomes decline in all provinces when years of schooling are adjusted for English language learning. The gap between expected years of schooling and learning-adjusted years of schooling ranges from about six years in Eastern and Northern Provinces to about four years in Western, Southern, and Central Provinces.
Gender differences in expected years of schooling adjusted for English lan-guage learning outcomes are high. Girls perform better than boys in all provinces except Eastern Province. The gender gap is highest in Western Province, where girls effectively have 2.3 more years of education than boys, followed by
TABLE 2.5 Learning-adjusted years of schooling, by province and gender, mathematics: Sri Lanka, 2016/17
PROVINCE
LEARNING-ADJUSTED YEARS OF SCHOOLING, MATHEMATICS
GIRLS AND BOYS GIRLS BOYS
Western 8.9 9.4 8.4
Central 7.6 7.6 7.5
Southern 9.2 9.6 8.7
North Western 8.5 8.9 8.1
Northern 7.3 7.6 6.9
Eastern 6.8 7.4 6.1
North Central 8.0 8.1 7.8
Uva 7.6 7.9 7.3
Sabaragamuwa 8.6 8.7 8.5
National 8.3 8.6 7.9
Source: World Bank team calculations.
TABLE 2.6 Learning-adjusted years of schooling, by province and gender, English language: Sri Lanka, 2016/17
PROVINCE
LEARNING-ADJUSTED YEARS OF SCHOOLING, ENGLISH LANGUAGE
GIRLS AND BOYS GIRLS BOYS
Western 9.6 10.7 8.4
Central 8.1 8.4 7.7
Southern 8.8 9.6 7.9
North Western 7.9 8.4 7.3
Northern 6.6 7.0 6.2
Eastern 6.7 6.7 6.7
North Central 7.8 8.3 7.3
Uva 7.2 8.1 6.2
Sabaragamuwa 8.0 8.6 7.3
National 8.3 9.0 7.6
Source: World Bank team calculations.
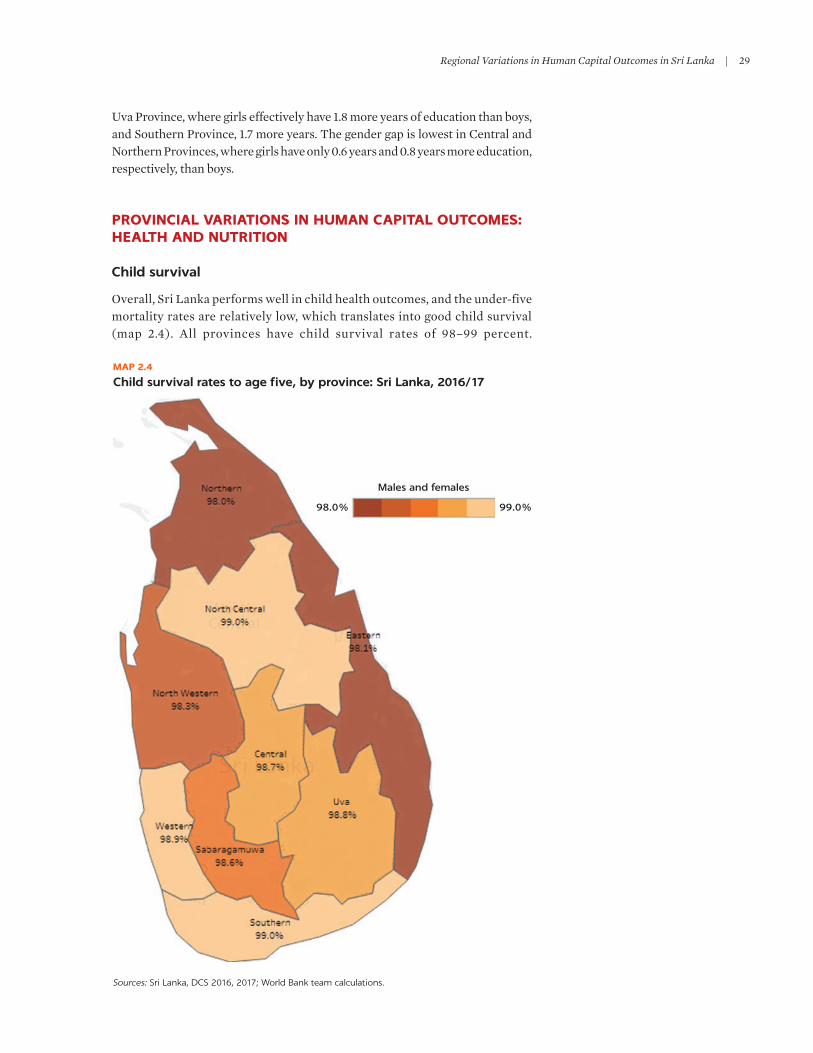
Regional Variations in Human Capital Outcomes in Sri Lanka | 29
uva Province, where girls effectively have 1.8 more years of education than boys, and Southern Province, 1.7 more years. The gender gap is lowest in Central and Northern Provinces, where girls have only 0.6 years and 0.8 years more education, respectively, than boys.
PROVINCIAL VARIATIONS IN HUMAN CAPITAL OUTCOMES: HEALTH AND NUTRITION
Child survival
Overall, Sri Lanka performs well in child health outcomes, and the under-five mortality rates are relatively low, which translates into good child survival (map 2.4). All provinces have child survival rates of 98–99 percent.
MAP 2.4
Child survival rates to age five, by province: Sri Lanka, 2016/17
Sources: Sri Lanka, DCS 2016, 2017; World Bank team calculations.
Males and females
98.0% 99.0%

30 | SrI LANkA HumAN CAPITAL DEvELOPmENT
Northern and Eastern Provinces, which were the main theaters of the civil conflict up to 2009, have the lowest child survival rates, and Southern and North Central Provinces have the highest. The differences between these provinces, however, are small, less than 1 percent. Child survival rates are not worse in Central, uva, and Sabaragamuwa Provinces, despite having large estate sectors.
Girls have a better chance than boys of survival to age five, although the degree of difference varies among provinces (table 2.7). The gap in the survival rate between boys and girls is greatest in Northern Province, with a difference of 1 percentage point, whereas it is almost negligible in Western Province. Nevertheless, all provinces perform reasonably well on the child survival indica-tor, which can largely be attributed to the country’s well-functioning maternal and child health services and the high levels of education among parents, espe-cially mothers.
Adult survival
The probability of adult survival (ages 15–60) is relatively good in all provinces, and yet there are pockets in which further improvements are expected. Northern Province has the lowest adult survival rates, while Southern, Sabaragamuwa, and Western Provinces have the highest (map 2.5). Adult survival rates do not seem to be substantially worse in Central, uva, and Sabaragamuwa Provinces, despite their large estate sectors. Lower adult survival rates seem to be associ-ated more with the previously conflict-affected areas than the estate sector in the provinces.
Females have consistently higher rates of survival than males. Female dom-inance of this indicator is similar to that for child survival, but the degrees of differences are quite substantial for adult survival. Northern Province has the greatest gender gap, as large as 16 percentage points between males and females (table 2.8). Even in Western Province, which has the smallest differ-ence between males and females, the gap is over 10 percentage points.
TABLE 2.7 Child survival rates to age five, by province and gender: Sri Lanka, 2016/17 percent
PROVINCE
PROBABILITY OF SURVIVAL TO AGE FIVE
GIRLS AND BOYS GIRLS BOYS
Western 98.9 99.0 98.9
Central 98.7 98.9 98.5
Southern 99.0 99.2 98.8
North Western 98.3 98.7 97.9
Northern 98.0 98.5 97.5
Eastern 98.1 98.2 98.0
North Central 99.0 99.1 98.8
Uva 98.8 99.1 98.5
Sabaragamuwa 98.6 98.8 98.3
National 98.7 98.9 98.5
Sources: Sri Lanka, DCS 2016, 2017; World Bank team calculations.

Regional Variations in Human Capital Outcomes in Sri Lanka | 31
Stunting
Stunting is biologically associated with undernutrition. A well-nourished child can expect to be a certain height, given other factors such as genes. However, undernutrition in the early years of life can hamper growth and result in stunt-ing. undernutrition leading to stunting can also create health issues later in life, including reducing learning ability at school age. It is therefore a serious prob-lem that needs to be addressed to promote human capital development.
Stunting prevalence is highly correlated with the size of the estate sector. Central, uva, and Sabaragamuwa Provinces—known to have large estate sectors—have the highest incidence of stunting (map 2.6). The proportion of
Males and females
81.1% 88.8%
MAP 2.5
Adult survival rates ages 15 to 60, by province: Sri Lanka, 2016/17
Sources: Sri Lanka, DCS 2016; World Bank team calculations.

32 | SrI LANkA HumAN CAPITAL DEvELOPmENT
TABLE 2.8 Adult survival rates ages 15 to 60, by province and gender: Sri Lanka, 2016/17 percent
PROVINCE
PROBABILITY OF SURVIVAL
MALES AND FEMALES MALES FEMALES
Western 87.9 82.6 92.9
Central 86.4 80.6 91.7
Southern 88.8 83.3 93.9
North Western 86.7 79.6 93.3
Northern 81.1 72.7 88.8
Eastern 85.8 78.2 92.9
North Central 85.5 78.2 92.4
Uva 86.5 80.7 92.1
Sabaragamuwa 88.0 82.7 93.1
National 86.9 80.8 92.6
Sources: Sri Lanka, DCS 2016; World Bank team calculations.
MAP 2.6
Share of children under five not stunted, by province: Sri Lanka, 2016/17
Sources: Sri Lanka, DCS 2017; World Bank team calculations.
Males and females
74.9% 86.2%

Regional Variations in Human Capital Outcomes in Sri Lanka | 33
children not stunted is only about 75 percent in Central Province, which has the largest estate sector (approximately 19 percent of the population). The previ-ously conflict-affected areas also have major issues with stunting, particularly Eastern Province, where the proportion of children not stunted is less than 80 percent. Southern and Western Provinces have the highest proportion of chil-dren not stunted, 86 percent, although that figure indicates that the problem exists even in these provinces.
Stunting is found less among girls than boys, although the difference is not large (table 2.9). The proportion of boys not stunted is lower than the proportion of girls not stunted in six provinces—Western, North Western, Northern, North Central, uva, and Sabaragamuwa. However, in Central, Southern, and Eastern Provinces the proportion of girls not stunted is lower than the proportion of boys not stunted.
CONCLUSIONS
Analysis of provincial variations in human capital provides several interesting and important findings for future policy. There is a high degree of regional equity in two of the five HCI indicators in which Sri Lanka performs well at the global level: child survival and expected years of schooling. The child survival rates vary between 98 and 99 percent in all provinces. Expected years of schooling range from 12.8 years in the lowest-performing province, Sabaragamuwa, to 13.1 years in the highest-performing province, Western. This finding clearly shows that if high and equitable development of human capital is undertaken in all regions, the country will also score well at the inter-national level. For the third HCI outcome in which Sri Lanka performs well in global terms, adult survival, there is a high degree of parity among eight of the nine provinces, where the range is between 86 and 88 percent. However, Northern Province falls behind with an adult survival rate of 81 percent. And yet this is still a high rate, especially given that this province was the main the-ater of the long secessionist conflict.
TABLE 2.9 Share of children under five not stunted, by province and gender: Sri Lanka, 2016/17 percent
PROVINCE
SHARE OF CHILDREN UNDER FIVE NOT STUNTED
GIRLS AND BOYS GIRLS BOYS
Western 86.1 87.3 84.8
Central 74.9 74.1 75.9
Southern 86.2 85.6 86.7
North Western 84.2 84.3 84.0
Northern 83.6 85.8 81.1
Eastern 79.5 78.5 80.5
North Central 84.1 86.6 81.5
Uva 81.8 82.9 80.7
Sabaragamuwa 80.4 84.2 76.4
National 82.9 83.7 82.0
Sources: Sri Lanka, DCS 2017; World Bank team calculations.

34 | SrI LANkA HumAN CAPITAL DEvELOPmENT
In the HCI outcomes in which Sri Lanka performs poorly at the global level—child stunting and learning-adjusted years of schooling—there are major regional disparities. Child stunting rates vary between 75 percent in Central Province (the lowest-performing province) and 86 percent in Southern and Western Provinces (the highest-performing provinces). Learning-adjusted years of schooling range between 6.8 years in the lowest-performing Eastern Province and 9.2 years in the highest-performing Southern Province. These are substan-tial differences. The findings suggest that programs to improve HCI outcomes require a targeted approach, with special attention devoted to the low-performing provinces.
There is a high degree of consistency in the performance of provinces on the components of HCIs. For example, Southern Province, which has the highest overall HCI score, also performs best on mathematics harmonized test scores, mathematics learning-adjusted years of schooling, child survival, stunting, and adult survival rates. Western Province, which has the second-highest HCI score, has the highest number of years of schooling and follows closely behind Southern Province on the other components of the HCI. Provinces that score relatively poorly on the HCI, such as Eastern, Central, Northern, and uva Provinces, show comparatively weak performance on mathematics learning-adjusted years of schooling and stunting.
Human capital outcomes are nearly always higher for girls and women than for boys and men. Child survival rates for girls exceed the survival rates for boys in all provinces. Expected years of schooling are either the same for girls and boys, or greater for girls, in eight of the nine provinces—the exception is Sabaragamuwa Province. Learning-adjusted years of schooling are higher for girls in all prov-inces when education quality is measured by mathematics achievement. Learning-adjusted years of schooling are also higher for girls in eight of the prov-inces, when education quality is measured by English language learning, and equal with boys in Eastern Province. Child stunting rates are lower for girls in seven of the nine provinces— female stunting rates exceed male stunting rates only in Central and Eastern Provinces. Adult survival rates are considerably higher for women than men in all provinces, and by a considerable margin. In four provinces—North Western, North Central, Northern, and Eastern—the gen-der gap is between 14 and 16 percent in favor of women. Overall, these findings suggest that policies to increase human capital also need to target boys and men.
The component of the HCI that shows the highest degree of regional varia-tion is learning outcomes. This applies to harmonized test scores in mathematics and in English language, as well as to learning-adjusted years of schooling in these two subjects. Learning is also the component of the HCI in which the country’s performance is weakest in international comparisons. In addition, the largest gender gap among the components of the HCI is also in learning. It is also notable that learning outcomes do not seem to be correlated with economic sta-tus. Southern Province has the highest HCI score, though its per capita gross domestic product (GDP) is well below the national average (see table 1.1). Sabaragamuwa and North Western Provinces have the lowest per capita GDP of all the provinces, yet their test scores are higher than those of the other more affluent provinces. Furthermore, the HCI rankings of provinces follow exactly those for the learning outcomes (compare tables 1.1 and 2.3). Overall, then, improving learning outcomes is the most important challenge to address for the development of human capital in Sri Lanka.

Regional Variations in Human Capital Outcomes in Sri Lanka | 35
Finally, the component of the HCI that shows the second-highest degree of regional variation is stunting. Stunting is also the component of the HCI in which the country performs weakest in international comparisons after learning. This suggests that levels of undernutrition vary significantly among provinces and should be addressed urgently to improve the overall level of nutrition in future generations.
REFERENCES
Aturupane, H., and Angela Little. 2020. “General Education in Sri Lanka.” In Handbook of Education Systems in South Asia, edited by P. m. Sarangapani and r. Pappu. Singapore: Springer Nature.
Aturupane H., m. Shojo, and r. Ebenezer. 2018. “Gender Dimensions of Educational Access and Achievement in Sri Lanka.” Discussion Paper Series report No. 90, South Asia region, Education Global Practice, World Bank, Washington, DC.
Aturupane, H., and D. Wikramanayake. 2011. “The Promotion of Social Cohesion through Education in Sri Lanka.” Discussion Paper 46, South Asian Human Development Sector, World Bank, Washington, DC.
Balasooriya, B. m. J., m. m. Wehella, and S. u. Wijeratne. 2010. “Sri Lanka.” In International Encyclopedia of Education, vol. 5, 813–25. Amsterdam: Elsevier Science.
Little, A. W. 2011. “Education Policy reform in Sri Lanka: The Double-edged Sword of Political Will.” Journal of Education Policy 26 (4): 499–512.
Little, A. W., and S. T. Hettige. 2013. Globalisation, Employment and Education in Sri Lanka: Opportunity and Division. Abingdon, uk: routledge.
Little, A. W., m. Shojo, S. Sonnadara, and H. Aturupane. 2018. “Teaching English as a Second Language in Sri Lankan Primary Schools: Opportunity and Pedagogy.” Language, Culture and Curriculum. October. doi:10.1080/07908318.2018.1532437.
NErEC (National Education research and Evaluation Centre). 2015. “Patterns and Trends in Achievement: TImSS (National Assessment of Achievement of Students Completing Grade 8 in Year 2014 in Sri Lanka).” Colombo, Sri Lanka.
NErEC (National Education research and Evaluation Centre). 2017. “Patterns and Trends in Achievement: TImSS (National Assessment of Achievement of Students Completing Grade 8 in Year 2016 in Sri Lanka).” Colombo, Sri Lanka.
OECD (Organisation for Economic Co-operation and Development). 2015. The ABC of Gender Equality in Education: Aptitude, Behaviour, Confidence. Paris: OECD Publishing. http://dx .doi.org/10.1787/9789264229.
Sri Lanka, DCS (Department of Census and Statistics). 2016. Life Tables for Sri Lanka 2011–2013 by District and Sex. DCS, Battaramulla, Sri Lanka.
Sri Lanka, DCS (Department of Census and Statistics). 2017. Sri Lanka Demographic and Health Survey 2016. DCS and ministry of Health, Nutrition and Indigenous medicine, Battaramulla, Sri Lanka.
Sri Lanka, DCS (Department of Census and Statistics). 2018. Sri Lanka Household Income and Expenditure Survey 2016. DCS, Battaramulla, Sri Lanka.


37
3 Key Challenges in Human Capital DevelopmentCHILD AND ADULT SURVIVAL AND STUNTING
INTRODUCTION
The critical importance of health and nutrition to human capital development is reflected in the Human Capital Index (HCI). Health is not just a component of human capital; it also contributes to other elements of it. Being unhealthy at any stage of the life cycle hinders productivity and has impacts on human capital. This chapter analyzes the policy framework of Sri Lanka’s health care system in relation to the variables of the HCI: stunting, child survival, and adult survival. Special attention is paid to stunting and the underlying causes of undernutrition, which has been a long-standing issue in Sri Lanka. Based on the analyses, the chapter sets forth a set of recommendations for the country’s future develop-ment of human capital.
Sri Lanka has a track record of providing effective health services that have resulted in relatively strong health care indicators. Life expectancy at birth, which stood at 75 years as of 2016, was higher than the South Asian average of 69 years. In terms of maternal and child health (MCH) indicators, Sri Lanka’s neonatal, infant, and under-five mortality rates in 2018 were 6.5, 9.1, and 10.6 per 1,000 live births, respectively, and the maternal mortality ratio was 39.3 per 100,000 live births in 2017 (Sri Lanka, FHB 2019). Sri Lanka was certified by the World Health Organization (WHO) as having eradicated polio in 2014 and malaria in 2016. Public health care services are provided through a network of 1,118 government institutions operating at three levels. The primary level of com-posed of the primary medical care units and divisional hospitals, the secondary level of district general hospitals and base hospitals, and the tertiary level of national hospitals, teaching hospitals, and provincial general hospitals. Specialized care is provided by secondary- and tertiary-level institutions. A unique feature of the Sri Lankan health care system is that patients can opt to bypass primary-level institutions and obtain services directly from secondary- and tertiary-level institutions.
Although public health care services in Sri Lanka are provided free of charge, a significant portion of health services are provided by the private sector. It accounts for over 50 percent of total health spending (Amarasinghe, Dalpatadu, and Rannan-Eliya 2018). Out-of-pocket (OOP) funding accounts for 87 percent of pri-vate health spending (that is, approximately 45 percent of total health spending).

38 | SRI LAnkA HuMAn CAPITAL DEvELOPMEnT
The contribution of insurance to private funding remains low, 5 percent, although this share has increased from 1 percent in 1990. Although inpatient, preventive, and public health services are primarily provided by the public sector, outpa-tient care, laboratory examination and imaging, and drugs and supplies for outpatients are predominantly financed by the private sector. This holds true regardless of income level, albeit with a notable exception among those in the highest income quintile who spend a sizable portion on inpatient care in private hospitals.
Several factors are associated with the low utilization of public services, despite being provided free of charge. These factors may include lack of essential equipment and drugs, long waiting times, less personalized services, and the inconvenience of opening hours. The private sector has grown substantially over the years in meeting the demands of patients for more convenient services such as shorter waiting times and after-hours services.
Overall, age-related health and nutrition issues, such as geriatric ailments and degenerative diseases, are rising and will become the key challenge in improving the health and nutrition profile of Sri Lanka’s population. As this chapter describes, the country urgently needs to prepare for this challenge to its future human capital development. The chapter closes with possible policy options for reforming the health system to meet the rapidly emerging needs of an aging population.
THE CHALLENGE OF STUNTING AND UNDERNUTRITION IN SRI LANKA
Stunting is a well-established risk marker of poor child development. Early childhood stunting is associated with poor psychological functioning in late adolescence (Walker et al. 2007). Stunting before the age of two predicts poorer cognitive and educational outcomes in later childhood and adolescence, which have significant educational and economic consequences at the individual, household, and community levels (WHO 2014). Economists estimate that stunting can reduce a country’s gross domestic product (GDP) by 7 percent, and thus it is an enormous drain on economic productivity and growth (Galasso and Wagstaff 2018).
The united nations Children’s Fund (unICEF) Conceptual Framework of Malnutrition (unICEF 1990) and the food security concepts issued by the Food and Agriculture Organization (FAO 2003) illustrate the causal pathways of mal-nutrition. The causes of malnutrition are multisectoral—inadequate access to food, inadequate care for mothers and children, inadequate health care services, insufficient health services, and an unhealthy environment. Malnutrition per-vades the whole life cycle, and it has an intergenerational impact on human development and the economy. Emerging evidence on the role of intergenera-tional effects in determining maternal preconceptual nutritional status indicates the need for continued investment in strategies that improve women’s nutrition and health throughout the life cycle, especially during the early years. Intrauterine growth of the fetus is critical, as much of the evidence suggests that a child’s growth pattern is set during this time. A plethora of research has confirmed that the foundation for adult health is formulated in utero and in early childhood, and one of the most prominent risk factors for stunting is low birth weight (LBW). LBW is defined as a birth weight of less than 2,500 grams. undernutrition is

Key Challenges in Human Capital Development | 39
generally expressed as stunted growth, and thinness is a result of intrauterine growth retardation during a mother’s pregnancy, in addition to improper care after birth.
The impact of malnutrition on the transgenerational cycle of human develop-ment needs to be challenged in the context of the life cycle rather than in discrete compartments. Malnutrition should be viewed as one important dimension of a larger development problem that spreads across multiple sectors and health, social, political, economic, and cultural institutions.
Food insecurity is closely linked to malnutrition and is often one of the main underlying causes. According to the most widely used definition of food security, “food security exists when all people at all times have physical, social, and eco-nomic access to sufficient, safe, and nutritious food, which meets their dietary needs and food preferences for an active and healthy life” (FAO 2003). This defi-nition provides the basis of the four pillars of food security widely adopted today: availability at the national level, accessibility and utilization at the household level, and stability at all levels.
Childhood stunting has a lasting effect on health and educational attainment. Stunting is defined as the percentage of children, ages 0–59 months, whose height for age is below –2 standard deviations (moderate and severe stunting) and –3 standard deviations (severe stunting) from the median of the WHO Child Growth Standards. Stunting reflects chronic undernutrition during the most critical periods of growth and development in early life. Linear growth in early life is considered a strong predictor of a healthy life. Impaired linear growth or stunting is associated with childhood risk of infections, childhood mortalities, cognitive and motor development, and school performance. In later life, stunt-ing affects productivity, wages, reproductive health, and nutrition-related chronic diseases such as diabetes and heart disease, and it can have a significant negative impact on an individual’s human capital (Barker 2007; Shekar, Heaver, and Lee 2006). The WHO conceptual framework on childhood stunting ( figure 3.1) builds on the unICEF conceptual framework on the causes of mal-nutrition. Stunted growth and development are central to the WHO framework. It expands the context layer of the community and societal factors of malnutri-tion illustrated in the unICEF framework (unICEF 1990).
Immediate causes of stunting include poor breastfeeding and complemen-tary feeding practices. Some maternal factors with possible transgenerational or direct impacts on offspring growth and development in the first 1,000 days of life include low pre-pregnancy weight, maternal infections, short stature, and short birth spacing. The sectors highlighted in figure 3.1 are embraced by the stakeholders responsible for nutrition-sensitive programs, which also have a critical role to play in reducing stunting. Facilitating positive behavioral change and increased energy and nutrient intake, improving the quality of child caring and rearing practices, identifying the nutritional needs of adoles-cents and the elderly, and making available a clean, safe, supportive, and stim-ulating home environment also contribute to reducing stunting among children.
Current status of stunting at the subprovincial level
Sri Lanka’s stunting prevalence is classified as medium level and is not equally distributed among segments of the population. Data from the latest Demographic and Health Survey (DHS 2016) revealed that 17 percent of Sri Lankan children
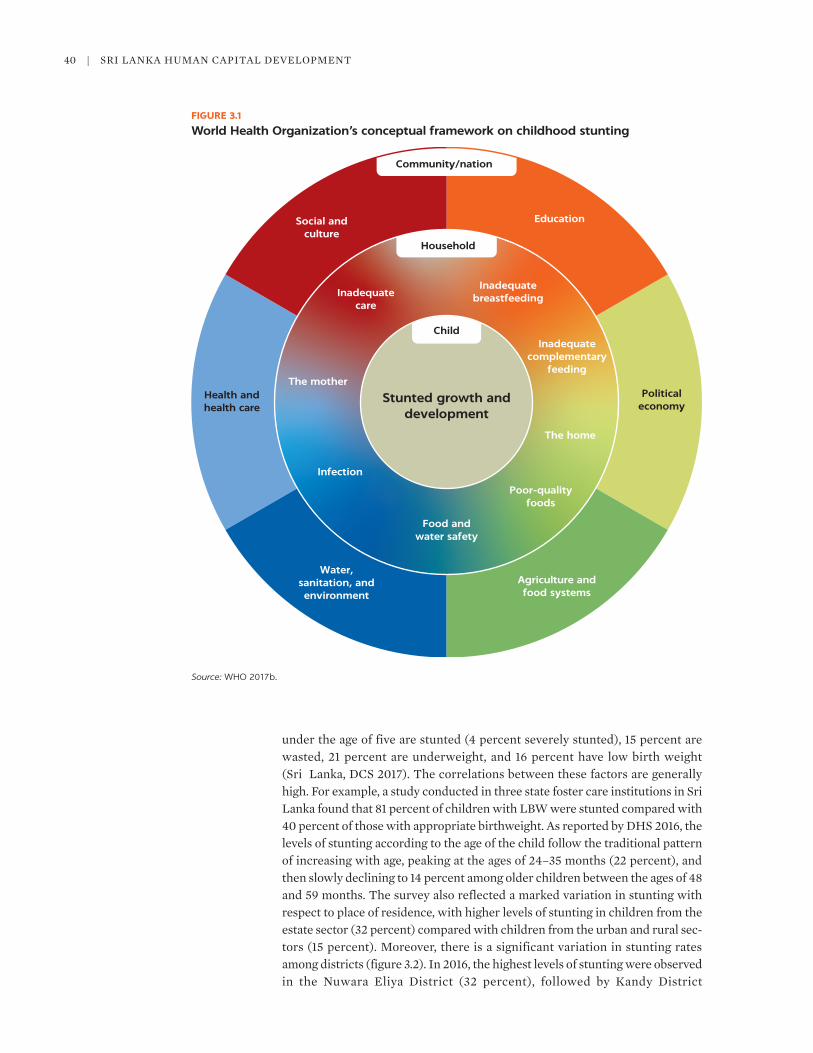
40 | SRI LAnkA HuMAn CAPITAL DEvELOPMEnT
under the age of five are stunted (4 percent severely stunted), 15 percent are wasted, 21 percent are underweight, and 16 percent have low birth weight (Sri Lanka, DCS 2017). The correlations between these factors are generally high. For example, a study conducted in three state foster care institutions in Sri Lanka found that 81 percent of children with LBW were stunted compared with 40 percent of those with appropriate birthweight. As reported by DHS 2016, the levels of stunting according to the age of the child follow the traditional pattern of increasing with age, peaking at the ages of 24–35 months (22 percent), and then slowly declining to 14 percent among older children between the ages of 48 and 59 months. The survey also reflected a marked variation in stunting with respect to place of residence, with higher levels of stunting in children from the estate sector (32 percent) compared with children from the urban and rural sec-tors (15 percent). Moreover, there is a significant variation in stunting rates among districts (figure 3.2). In 2016, the highest levels of stunting were observed in the nuwara Eliya District (32 percent), followed by kandy District
FIGURE 3.1
World Health Organization’s conceptual framework on childhood stunting
Source: WHO 2017b.
Stunted growth anddevelopment
Child
Inadequatecare
The mother
Household
EducationSocial andculture
Community/nation
Inadequatebreastfeeding
Inadequatecomplementary
feeding
The home
Politicaleconomy
Poor-qualityfoods
Food andwater safety
Water,sanitation, andenvironment
Agriculture andfood systems
Infection
Health andhealth care
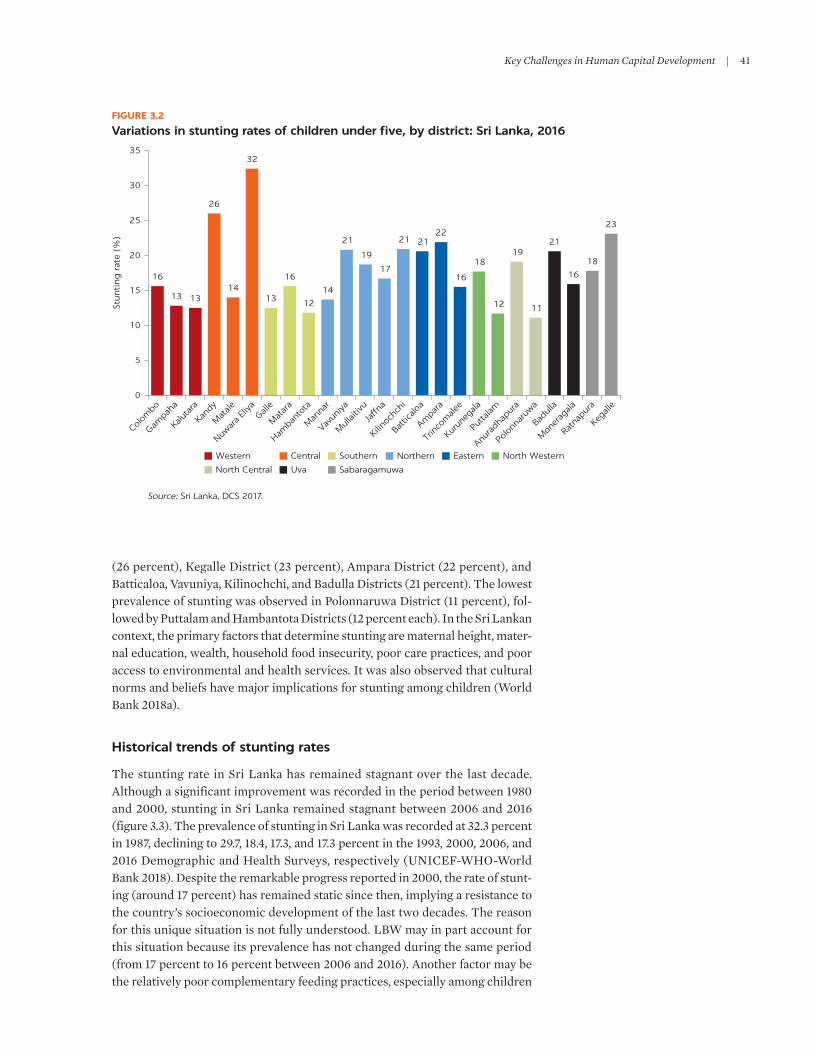
Key Challenges in Human Capital Development | 41
(26 percent), kegalle District (23 percent), Ampara District (22 percent), and Batticaloa, vavuniya, kilinochchi, and Badulla Districts (21 percent). The lowest prevalence of stunting was observed in Polonnaruwa District (11 percent), fol-lowed by Puttalam and Hambantota Districts (12 percent each). In the Sri Lankan context, the primary factors that determine stunting are maternal height, mater-nal education, wealth, household food insecurity, poor care practices, and poor access to environmental and health services. It was also observed that cultural norms and beliefs have major implications for stunting among children (World Bank 2018a).
Historical trends of stunting rates
The stunting rate in Sri Lanka has remained stagnant over the last decade. Although a significant improvement was recorded in the period between 1980 and 2000, stunting in Sri Lanka remained stagnant between 2006 and 2016 (figure 3.3). The prevalence of stunting in Sri Lanka was recorded at 32.3 percent in 1987, declining to 29.7, 18.4, 17.3, and 17.3 percent in the 1993, 2000, 2006, and 2016 Demographic and Health Surveys, respectively (unICEF-WHO-World Bank 2018). Despite the remarkable progress reported in 2000, the rate of stunt-ing (around 17 percent) has remained static since then, implying a resistance to the country’s socioeconomic development of the last two decades. The reason for this unique situation is not fully understood. LBW may in part account for this situation because its prevalence has not changed during the same period (from 17 percent to 16 percent between 2006 and 2016). Another factor may be the relatively poor complementary feeding practices, especially among children
FIGURE 3.2
Variations in stunting rates of children under five, by district: Sri Lanka, 2016
Source: Sri Lanka, DCS 2017.
Western Central Southern Northern Eastern North Western
North Central Uva Sabaragamuwa
16
13 13
26
14
32
13
16
12
14
21
19
17
21 2122
16
18
12
19
11
21
16
18
23
0
5
10
15
20
25
30
35
Colom
bo
Gampah
a
Kaluta
ra
Kand
y
Mat
ale
Nuwar
a Eli
yaGall
e
Mat
ara
Hamba
ntot
a
Man
nar
Vavun
iya
Mullai
tivu
Jaffn
a
Kilin
ochc
hi
Batti
caloa
Ampar
a
Trin
com
alee
Kuru
nega
la
Putta
lam
Anura
dhap
ura
Polonn
aruw
a
Badu
lla
Mon
erag
ala
Ratn
apur
a
Kega
lle
Stunti
ng
rat
e (%
)

42 | SRI LAnkA HuMAn CAPITAL DEvELOPMEnT
from six to eight months of age (45 percent). Because of this situation, however, the country may not be able to reach the national target of a 10.8 percent stunting rate among children under five by 2025.
The significant improvements in the early years of a child’s life may be attributed to multiple initiatives. The marked reduction in stunting experienced between 1980 and 2000 may be the result of many health service interventions, such as antenatal care programs, the expanded program on immunization, breastfeeding promotion at the grassroots level, family planning, and growth monitoring and promotion programs. Direct nutritional interventions such as the Thriposha program and food subsidies may have also contributed to the reduction of stunting rates in the country. Meanwhile, innovative interventions may be required to further reduce stunting because the conventional interven-tions appear to have been exhausted. An earlier study conducted by the European Commission before the release of the DHS 2016 results projected a continued reduction of the childhood stunting rate, with an estimated stunting rate of 13 percent in 2016 (figure 3.4). However, DHS 2016 reported a child stunting rate of 17.3 percent that has not changed since 2006.
Sri Lanka in relation to comparator countries
Even with stagnant improvements in its stunting rate, Sri Lanka continues to perform well in the South Asia region. Regional comparisons set Sri Lanka apart from other countries in South Asia with respect to nutritional indicators, includ-ing rates of stunting. Sri Lanka has the lowest stunting rate in the South Asia region (unICEF-WHO-World Bank 2018). The stunting rate in Afghanistan is 40.9 percent; Bangladesh, 36.2 percent; India, 37.9 percent; and Pakistan, 45.0 percent. In the broader Asia region, Sri Lanka comes third after Thailand and China, where stunting rates were recorded at 10.5 percent and 8.1 percent, respectively. Despite its status as a lower-middle-income country (LMIC), Sri Lanka’s stunting rates are on par with rates in upper-middle-income coun-tries (uMICs) such as Gabon, 17.0 percent; Lebanon, 16.5 percent; and Malaysia, 20.7 percent (unICEF-WHO-World Bank 2018).
FIGURE 3.3
Trends in nutritional status of children under five: Sri Lanka
Source: Demographic Health Survey 2016, excluding Northern Province (Sri Lanka, DCS 2017).
17.3
14.7
21.1
17.315.1
20.5
0
5
10
15
20
25
Stunting Wasting Underweight
Per
cent
2006 2016

Key Challenges in Human Capital Development | 43
A well-established, free health care delivery system, free universal education, and high female literacy rate are cited as the main factors contributing to Sri Lanka’s better nutritional status relative to that of other South Asian countries. To support nutritional services, the Sri Lankan government introduced a national nutrition Policy in 1986, and the policy was updated in 2010 and 2013. With implementation of the policy, the country took a major step toward main-streaming nutritional interventions at all levels. Moreover, with the establish-ment of the national nutrition Secretariat in 2013, the country succeeded in developing the Multi-Sectoral Action Plan for nutrition. The plan is a coordi-nated effort by many sectors—including agriculture, health, education, economy, and nongovernmental organizations—that sets targets and milestones to reduce the prevalence of undernutrition, anemia, and stunting among key population groups, as well as to improve food security and provide households at risk with access to safe water, sanitation, and hygiene (WASH). Despite these efforts, the latest Demographic and Health Surveys have identified several geographical pockets that do not appear to be benefiting from these nutritional interventions.
Sri Lanka is facing a double burden of malnutrition. Both administrative data and surveys highlight its growing problem of overweight and obesity (Sri Lanka, DCS 2017; WHO 2017a; World Bank 2017a). The 2015 noncommu-nicable disease (nCD) risk factor survey found that nearly one-fourth of males (24.6 percent) and one-third of females (34.3 percent) between the ages of 18 and 69 were either overweight or obese (Sri Lanka, MoH and WHO 2017).
FIGURE 3.4
Trends, projections, and targets for stunting of children under five: Sri Lanka, 1987–2025
Source: European Commission 2018.Note: Because no new data are available after 2012, no change could be determined in the rate of stunting reduction. WHA = World Health Assembly.
Projected number of stunted children calculated in 2017 (millions)
Number of stunted children estimated by surveys (millions)
Average annual rate of reduction in stunting estimated in 2017
19830
5
10
Pre
vale
nce
of
stunti
ng
(%
)
15
20
25
30
35
40
1988 1994 1999 2005 2010 2016
Govt. target: 9%stunting by 2020
0.140.15
0.180.26 0.16 WHAtarget by2025
2021 2027
0.310.30
0.45
0.51
0.61
0.35
44 | SRI LAnkA HuMAn CAPITAL DEvELOPMEnT
unhealthy eating practices and poor nutrition in childhood contribute to an early manifestation of heart disease, childhood diabetes, other nCDs, and ill health later in life. Because the maternal body mass index (BMI) is a major determinant of low birth weight (Ramakrishnan 2004), an important finding is that undernutrition also appears among women in the reproductive age group. The Reproductive Health Management Information System (RHMIS) reports that between 2009 and 2015, one-fifth to a quarter of women who registered for antenatal care before 12 weeks had a BMI of less than 18.5 (Sri Lanka, MoH 2018b). Although it has been shown that the quality rather than the quantity of food appears to be correlated with malnutrition, improvements in diet quality have not been high, and micronutrient intakes remain low because of the high cost of nutrition. The poor have found it increasingly difficult to afford a diet rich in vegetables, dairy, and fish.
Anemia has remained a persistent problem related to micronutrient defi-ciencies. These deficiencies are the third pillar of the triple burden of malnutri-tion, alongside undernutrition and overweight and obesity. DHS 2006/07 found an estimated overall prevalence of anemia of 34 percent, with 20.7 percent categorized as mild anemia and 13.3 percent as moderate to severe anemia (Sri Lanka, DCS 2009). Statistics show that the most common causes of anemia include iron deficiency. It is estimated that one in three children and one in four adults in Sri Lanka suffer from iron-deficiency anemia, making it the most crit-ical micronutrient-related deficiency in the country. The nutrition and Food Security Assessment carried out in 2009 found that the prevalence of anemia in children ages 6–59 months was 25.2 percent (MRI 2010). The highest preva-lence was noted in the latter half of the first year (50.4 percent) and was observed to decline with increasing age, the lowest prevalence being 10.2 percent in the 48–59 month age group. The national nutrition and Micronutrient Survey 2012 found a much lower percentage—15.1 percent of children in the same age group were anemic (MRI 2012). Of the anemic children, 12.8 percent had hemoglob-inopathies, 4.3 percent had evidence of acute infections, and 52.3 percent were iron-deficient. These findings highlight the importance of establishing the causes of anemia in this age group.
In developing countries, anemia affects about 40 percent of preschool chil-dren and one in two pregnant women, mainly due to iron deficiency. In Sri Lanka, 35 percent of pregnant women, 33 percent of women of reproductive age, and 26 percent of under-five children are anemic.1 Infants born of mothers with anemia often have low birth weight and face a higher risk of dying in infancy and childhood. Premature births, delayed growth and development, and delayed normal infant activity and movement are also associated with iron-deficiency anemia. According to unICEF (2014), “Children and adults with iron-deficiency anemia have poor memory or poor cognitive skills resulting in poor performance in school, work, and in recreational activities. Lower IQs have been linked to iron deficiency occurring during critical periods of growth.”
Multifaceted strategies to address malnutrition
It is widely acknowledged that a person’s nutritional status is determined by fac-tors that go way beyond the health sector. The unICEF conceptual framework of malnutrition defines two immediate causes of undernutrition—inadequate dietary intake and disease—and three clusters of underlying causes—inadequate health services and an unhealthy environment, household food insecurity, and
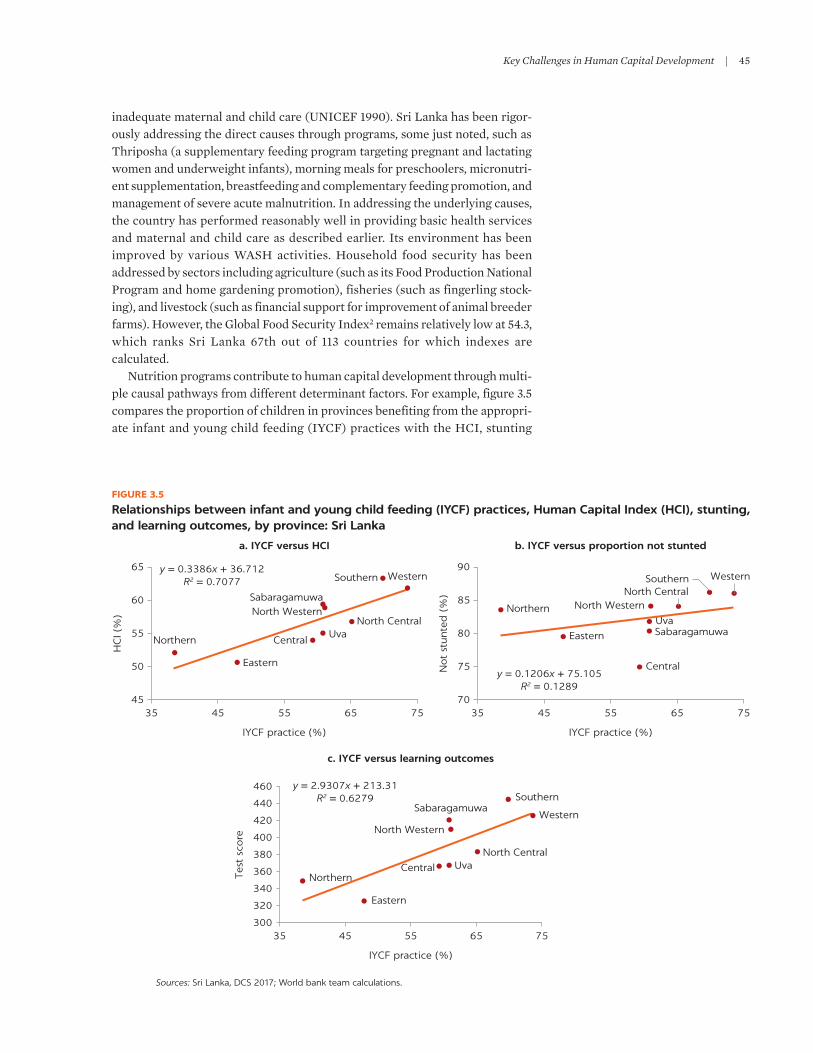
Key Challenges in Human Capital Development | 45
inadequate maternal and child care (unICEF 1990). Sri Lanka has been rigor-ously addressing the direct causes through programs, some just noted, such as Thriposha (a supplementary feeding program targeting pregnant and lactating women and underweight infants), morning meals for preschoolers, micronutri-ent supplementation, breastfeeding and complementary feeding promotion, and management of severe acute malnutrition. In addressing the underlying causes, the country has performed reasonably well in providing basic health services and maternal and child care as described earlier. Its environment has been improved by various WASH activities. Household food security has been addressed by sectors including agriculture (such as its Food Production national Program and home gardening promotion), fisheries (such as fingerling stock-ing), and livestock (such as financial support for improvement of animal breeder farms). However, the Global Food Security Index2 remains relatively low at 54.3, which ranks Sri Lanka 67th out of 113 countries for which indexes are calculated.
nutrition programs contribute to human capital development through multi-ple causal pathways from different determinant factors. For example, figure 3.5 compares the proportion of children in provinces benefiting from the appropri-ate infant and young child feeding (IYCF) practices with the HCI, stunting
FIGURE 3.5
Relationships between infant and young child feeding (IYCF) practices, Human Capital Index (HCI), stunting, and learning outcomes, by province: Sri Lanka
Sources: Sri Lanka, DCS 2017; World bank team calculations.
65
Not
stunte
d (
%)
HC
I (%
)
60
55
50
45
75
80
85
90
7035 45
IYCF practice (%) IYCF practice (%)
55 65 75 35 45 55 65 75
WesternWestern
Central
Central
SouthernSouthern
a. IYCF versus HCI b. IYCF versus proportion not stunted
Northern
Eastern
Northern
y = 0.3386x + 36.712R2 = 0.7077
y = 0.1206x + 75.105R2 = 0.1289
Eastern
North WesternNorth Western
North Central
North Central UvaUva Sabaragamuwa
Sabaragamuwa
c. IYCF versus learning outcomes
Tes
t sc
ore
460
440
420
400
380
360
340
320
300
IYCF practice (%)
35 45 55 65 75
Western
Central
Southern
Northern
y = 2.9307x + 213.31R2 = 0.6279
Eastern
North Western
North CentralUva
Sabaragamuwa

46 | SRI LAnkA HuMAn CAPITAL DEvELOPMEnT
status, and learning outcomes. Contrary to expectations, the relationship between IYCF practice and stunting is weak (R2 = 0.13). This weak relationship may imply that many other factors have major roles in determining nutritional status. On the other hand, the relationship between IYCF and the HCI is rela-tively strong (R2 = 0.71). The IYCF relationship with learning outcomes is also rather strong (R2 = 0.63). These findings may imply that the contribution of IYCF to the HCI is primarily mediated through its positive effect on cognitive devel-opment. nonetheless, the causal pathways of malnutrition and its relationship to human capital development are complex and thus are not possible to conclude from these data alone.
For some nutrition-related programs, global evidence provides a mixed pic-ture. For example, WASH has been widely recognized as an essential element of efforts to improve nutrition. There are six theoretical links between WASH and nutrition: (1) reduction in diarrheal diseases, (2) reduction in enteric infec-tions, (3) reduced exposure to protozoa and helminth infection, (4) reduced anemia, (5) reduction in time spent by caregivers fetching water, and (6) direct links. Among them, reduction in diarrhea seems to be the primary pathway linking WASH to nutritional outcome. Several observational studies have sug-gested positive links between WASH and child growth and disease. A meta-analysis conducted by Freeman et al. (2014) indicated that WASH inter-ventions can reduce diarrheal diseases by 40 percent. However, findings from recent randomized controlled studies in Bangladesh, kenya, and Zimbabwe suggest a different story. In Bangladesh, water, sanitation, and hygiene inter-ventions implemented stand-alone or combined did not produce evidence of improvements in growth, although diarrheal diseases were reduced (Luby et al. 2018). The trial in kenya found limited improvements in growth with WASH interventions at one year postintervention, but no effects at two years and no effects on diarrheal diseases (Stewart et al. 2018). Similarly, the study in Zimbabwe did not demonstrate any effect of WASH on diarrheal diseases or growth (Humphrey et al. 2019). Multiple interpretations of the negative results of the trials are possible. However, one that likely stands out is that the WASH intervention alone was not sufficient to reduce fecal contamination. The strat-egies of interventions warrant further investigations, including household ver-sus community coverage, stand-alone versus combined implementation, and various intensities of interventions. In Sri Lanka, diarrhea accounts for only 1.73 percent of under-five disability-adjusted life years (DALYs) and 0.49 per-cent of under-five deaths, so the reduction in diarrhea may not yield substan-tial gains in nutrition. Such an epidemiological profile is rather unique in the region, and more evidence is needed on nutrition-sensitive programs to iden-tify strategies that cater to the situation in Sri Lanka.
Summary of nutritional status and the way forward
Sri Lanka has made significant progress in improving the health status of its pop-ulation, but reducing malnutrition remains a challenge. Poor nutrition also affects the developmental agenda of the country. Achievements in combating malnutrition over the last few decades have been modest. It is recognized that an unfinished public health agenda will have profound and irreversible conse-quences on child survival and development. Achieving Sustainable Development Goal 2 (SDG 2), “End hunger, achieve food security and improved nutrition, and promote sustainable agriculture,” is of utmost importance for a country to achieve overall sustainable development.
Key Challenges in Human Capital Development | 47
About 15–17 percent of children are wasted or stunted in Sri Lanka, and LBW has remained at 16 percent in recent years. Stunting is a reflection of chronic undernutrition. The effects of stunting last a lifetime and can lead to impaired brain development, lower intelligence quotients (IQs), weakened immune sys-tems, and greater risk of disease later in life. Stunted children have lower produc-tivity, and as adults they earn up to 20 percent less than the average wage. Stunting can also reduce a country’s GDP by as much as 7 percent.
The importance of adequate nutrition and care in the first 1,000 days of life cannot be overly stressed. The first 1,000 days of life—between a woman’s preg-nancy and her child’s second birthday—is a unique period of opportunity when the foundations for optimum health and development across the child’s life span can be established. The appropriate nutrition and care during the 1,000-day window influences a child’s ability to survive, grow, learn, and rise out of poverty. Children can then grow up to contribute to society’s long-term health, stability, and prosperity. The multifaceted nature of food and nutrition insecurity high-lights the need to address this challenge through a comprehensive, multisectoral approach. undernutrition passes from one generation to another as a circle of grim inheritance. It is thus crucial for mothers and babies to receive adequate care and nutrition during the critical 1,000-day period.
Strategies to improve the nutrition of girls and women of reproductive age need to go beyond the conventional approach of providing pregnant women with services through the traditional MCH care programs. This means that greater emphasis should be placed on nutrition-related behavioral changes that can be integrated with other health and nonhealth programs. key strategies for improved nutrition include the following:
• Improve women’s and girls’ nutrition throughout their lifetimes, facilitating positive behavioral change and greater energy and nutrient intake.
• Improve the quality of IYCF programs.• Improve evidence-based food fortification programs.• Improve the integration of health services and programs within the health
sector.• Promote intersectoral collaboration that results in improved food safety and
security.• Improve the quality of care and services provided.• Improve the availability of information with disaggregated outcome data by
gender.• Address the nutritional needs of feeding during illnesses, for adolescents, and
for the elderly.
More knowledge and evidence are critically needed to maximize the impact of various nutrition programs. nutrition requires a multisectoral approach that includes interventions that target the underlying causes of malnutrition such as ineffective agricultural practices, inadequate food safety, and poor water quality and sanitation. nonetheless, their impact on nutrition has not been well evalu-ated and likely requires revisiting strategies and implementation. Sri Lanka needs a sound evidence base for prioritizing resources to be allocated to differ-ent geographies, sectors, and programs. It is therefore critical to examine the effectiveness and efficiency of different nutrition strategies, particularly those that target the underlying causes of undernutrition.
Recognizing the vital and synergistic relationship between health and educa-tion early on, Sri Lanka has been a pioneer in school health programming.
48 | SRI LAnkA HuMAn CAPITAL DEvELOPMEnT
Sri Lanka’s School Health Promotion Program (SHPP) is now recognized as one of the best among its peers, and it has served as a model of best practice for other countries. The main aim of SHPP is to ensure that the school platform is opti-mized to promote the health and well-being of schoolchildren. To this end, SHPP has four main objectives: (1) ensure a safe, healthy environment—both physical and psychosocial—that facilitates learning; (b) provide skills-based health education for schoolchildren; (3) ensure access to health services for schoolchildren; and (4) empower schoolchildren to be change agents to improve the health of their families and communities. These elements of the program have been designed to work together to promote the health, well-being, and learning potential of Sri Lanka’s schoolchildren. In 2018, the government expanded SHPP to include mental health programming. This step was taken in response to a growing urgency to secure the mental health and well-being of schoolchildren, recognizing that mental health has an impact on the physical, socioemotional, and cognitive development of children. Like the broader SHPP, the School Mental Health Program is a pioneering program that attempts to promote mental health in schools through the establishment of school counseling centers and school mental health focal points to support the mental health and well-being of schoolchildren. Meanwhile, over the years SHPP has supported stronger health outcomes for schoolchildren such as reducing the prevalence of worm infection and has also greatly improved the quality of the water and sani-tation facilities in schools.
Although Sri Lanka has many achievements in promoting school health, there is still room for further improvements in its program, particularly as the country, like many of its middle-income counterparts, undergoes a nutrition and epidemiological transition. Poorer parts of the country are still facing the per-sistent challenge of communicable diseases and undernutrition, whereas wealthier parts of the country are facing new challenges in the form of nCDs such as obesity and diabetes.
To respond to these nuanced challenges, SHPP requires a more sophisticated capacity and a more developed information management system. To this end, the government should focus on building greater capacity from the national level to the school level of SHPP. At the national level, further capacity building will allow better data management and analysis, so that the program can be imple-mented in a more targeted manner. At the school level, further capacity building for teachers will enable them to become better advocates for school health, thereby maximizing the program’s capacity to be more responsive to students’ needs and to create healthy changes in behavior. ultimately, greater capacity will allow leaders at all levels, from policy makers and program planners to teachers, to be more responsive to the needs of students and provide more targeted and relevant programming to address specific health challenges.
SHPP would also benefit from a more comprehensive system for data collec-tion and information management to ensure that the health of children is seam-lessly monitored throughout their school years. A more comprehensive system such as this would allow program planners to make more informed decisions on targeted school health programming.
Finally, SHPP could improve on the school meal program to make it a useful tool for educating students and communities on healthy eating and healthy and cooperative living. Many countries have used the school meal program as an opportunity to educate students and through them the wider community on good nutrition practices. Sri Lanka could also make a more intentional effort to

Key Challenges in Human Capital Development | 49
use the school meal program for this purpose. Moreover, countries such as Japan have used the meal program to go beyond just providing a nutritional meal to teaching students other practical life skills such as cooperation and teamwork (in preparing and serving the meal). Sri Lanka may wish to consider exploring such models to maximize the various impacts of SHPP.
UNDER-FIVE MORTALITY IN SRI LANKA
The under-five mortality rate is one of the most widely used health-related indi-cators. Poor health in childhood diminishes the formation of human capital. Evidence supports the notion that much of a person’s physiological and cogni-tive development happens in childhood, and economic theories call for human capital investments to be made early in life. under-five mortality refers to deaths among children from birth to age five. Deaths that occur during the first five years of life are categorized according to the time of death: (1) early neonatal deaths (deaths in first seven days of life), (2) neonatal deaths (deaths in first 28 days of life), (3) postneonatal deaths (deaths between 29 and 364 days), and (4) infant deaths (deaths in the first year of life).
Current status of under-five mortality
The latest Demographic and Health Survey (2016) reports that the under-five mortality rate in Sri Lanka is 11 per 1,000 live births (Sri Lanka, DCS 2017). According to the Family Health Bureau’s 2016 annual report, however, the under-five mortality rate in the country is 9.3 per 1,000 live births (Sri Lanka, MoH 2018a). Most under-five mortalities in the country occur within the first year of life, particularly during the neonatal period. The infant mortality rate is 10 per 1,000 live births, of which seven per 1,000 live births correspond to neonatal mortality (Sri Lanka, MoH 2018b). Some 68 percent of infant mortal-ities occur during the neonatal period. A relatively lower percentage of deaths occur between the ages of one and five, reflecting improvements in external fac-tors such as infections and nutrition that determine child survival. The immedi-ate causes of under-five mortality are categorized according to the infant period and the period between one and four years. In both periods, the primary cause of death is congenital abnormalities (54.5 percent and 35 percent, respectively). Although Sri Lanka has the potential to control many of the external determi-nants of childhood survival, the high percentage of neonatal deaths highlights the need for further improvements in obstetric care and proper management of perinatal and early neonatal complications.
under-five mortality is not equally distributed among geographic areas. Map 3.1 reveals that there is substantial geographic variation in the under-five mortality rate, with the highest rate reported in kilinochchi District, 44 per 1,000 live births, and the lowest in Polonnaruwa District, three per 1,000 live births (Sri Lanka, DCS 2017). DHS 2016 also found high rates in Trincomalee District (26 per 1,000 live births) and Mullaitivu District (22 per 1,000 live births). Similar to stunting, a significant variation in the under-five mortality rate was observed according to the place of residence. Estate dwellers had the highest rates (15 per 1,000 live births), whereas urban populations had lower rates (11 per 1,000 live births).
under-five mortality is not equally distributed among segments of the popu-lation. Of the social determinants of child survival, maternal education and
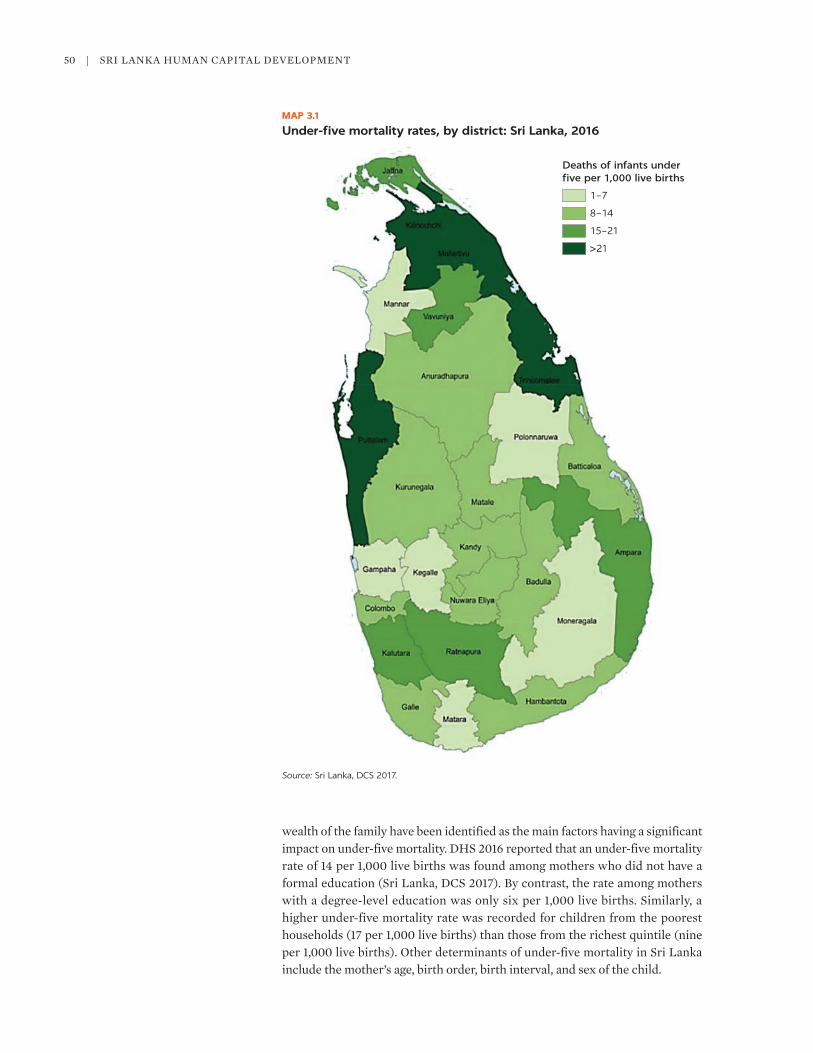
50 | SRI LAnkA HuMAn CAPITAL DEvELOPMEnT
wealth of the family have been identified as the main factors having a significant impact on under-five mortality. DHS 2016 reported that an under-five mortality rate of 14 per 1,000 live births was found among mothers who did not have a formal education (Sri Lanka, DCS 2017). By contrast, the rate among mothers with a degree-level education was only six per 1,000 live births. Similarly, a higher under-five mortality rate was recorded for children from the poorest households (17 per 1,000 live births) than those from the richest quintile (nine per 1,000 live births). Other determinants of under-five mortality in Sri Lanka include the mother’s age, birth order, birth interval, and sex of the child.
MAP 3.1
Under-five mortality rates, by district: Sri Lanka, 2016
Source: Sri Lanka, DCS 2017.
Deaths of infants underfive per 1,000 live births
1–7
8–14
15–21
>21

Key Challenges in Human Capital Development | 51
Historical trends in under-five mortality
Sri Lanka has significantly reduced its under-five mortality rate over the last five decades, allowing the country to achieve its Millennium Development Goal (MDG) targets on under-five mortality. The rate fell over 40 percent during the last 15 years (IGME 2017). The highest reported under-five mortality rate in Sri Lanka was 123.3 per 1,000 live births in 1951. Since then, it has steadily declined: 71.7 (1970), 50.1 (1980), 21.3 (1990), 16.5 (2000), and 11.6 (2010) per 1,000 live births.
Sri Lanka in relation to comparator countries
Sri Lanka has performed well in bringing down under-five mortality in the South Asia region. Indeed, Sri Lanka has made impressive achievements in reducing all types of childhood mortality. The country has the lowest under-five mortality rate in the South Asia region when compared with Afghanistan (68 per 1,000 live births), Bangladesh (32 per 1,000 live births), India (39 per 1,000 live births), and Pakistan (75 per 1,000 live births)—see IGME (2017). Similar to its nutritional indicators, Sri Lanka’s under-five mortality rate is comparable to rates of uMICs in the Asia region such as China (9 per 1,000 live births), Malaysia (8 per 1,000 live births), and Thailand (10 per 1,000 live births). Moreover, Sri Lanka has sur-passed some high-income countries, including Oman (11 per 1,000 live births) and Panama (16 per 1,000 live births). Although many factors have contributed to this success rate, a well-established MCH service delivery model, a high rate of institutional deliveries, a high level of health literacy, and a free health service have been the key drivers behind Sri Lanka’s commendable achievements in reducing childhood mortality.
ADULT MORTALITY IN SRI LANKA
Adult mortality has immediate implications for the country’s economic produc-tivity. Adult mortality refers to the death of those between the ages of 15 and 60. In many countries, this population group comprises the majority of the work-force. Generally, the probability of death of a person is higher right after birth, and then falls until around age 10. Mortality then gradually increases with age in an exponential shape (figure 3.6). Although the probability of death becomes higher after the age of retirement, a sizable portion of the population will die before reaching the age of 60.
As for the effects of adult mortality on economic productivity, Jayachandran and Lleras-Muney (2009) examined the declines in maternal mortality in Sri Lanka and estimated that time in school rises 0.11 per year of additional expected adult life. Therefore, adult mortality has an immediate effect on the economic productivity of a country.
Current status of adult mortality
Adult mortality is dominated by nCDs and injuries. Historically, Sri Lanka has demonstrated a remarkable achievement in bringing down the burden of com-municable diseases and improvements in MCH outcomes. As a result, the popu-lation’s life expectancy has increased (to 75 years in 2016), and Sri Lanka now has one of the fastest-aging populations in the world.

52 | SRI LAnkA HuMAn CAPITAL DEvELOPMEnT
Because of its rapid demographic changes, the country has been facing a major epidemiological transition over the last decades, with an increasing bur-den of nCDs. nCDs—diseases not caused by pathogens—include ischemic heart disease, stroke, diabetes mellitus, chronic kidney disease, cancer, and musculo-skeletal disorders. Figure 3.7 depicts the number of deaths from 22 causes for each adult age group in 2017. During early adulthood, deaths are caused primar-ily by injuries, especially by self-harm and violence. Although the number of deaths is not large compared with that for the elderly population, the lost oppor-tunity for the economy is enormous because of the potential years of productiv-ity lost due to premature deaths. The number of deaths begin to increase from the mid-30s onward where nCDs dominate the causes. Of these, three causes stand out: diabetes mellitus and kidney diseases, cardiovascular diseases, and neoplasms.
Historical trends in adult mortality
Overall, the number of deaths among the working-age population is decreasing, but the share of nCDs as causes of death and morbidity is increasing. The overall number of deaths among the adult population between the ages of 15 and 59 has generally been falling in Sri Lanka, particularly after the war ended in 2009. This is a potentially favorable situation from a productivity perspective because the working-age population is growing. However, the health system faces new chal-lenges from the demographic, epidemiological, and social transitions that the country is experiencing. nCDs accounted for 81 percent of deaths for all ages (IHME 2018a) and 66 percent of adult deaths in 2017, increasing over time (figure 3.8). They are a major contributor to DALYs. Ischemic heart disease and stroke are the leading contributors to DALYs, followed by diabetes mellitus, chronic kidney disease, and various types of cancer (IHME 2018a).
FIGURE 3.6
Probability of dying, by age and gender, global average
Source: IHME 2018b.
0
50
100
150
200
250
300
350
400
1 5 10 15 20 25 30 35 40 45 50 55 60 65 70 75 80
Pro
bab
ility
of
dyi
ng
(p
er 1
,00
0 p
erso
ns)
(%
)
Age
Male Female
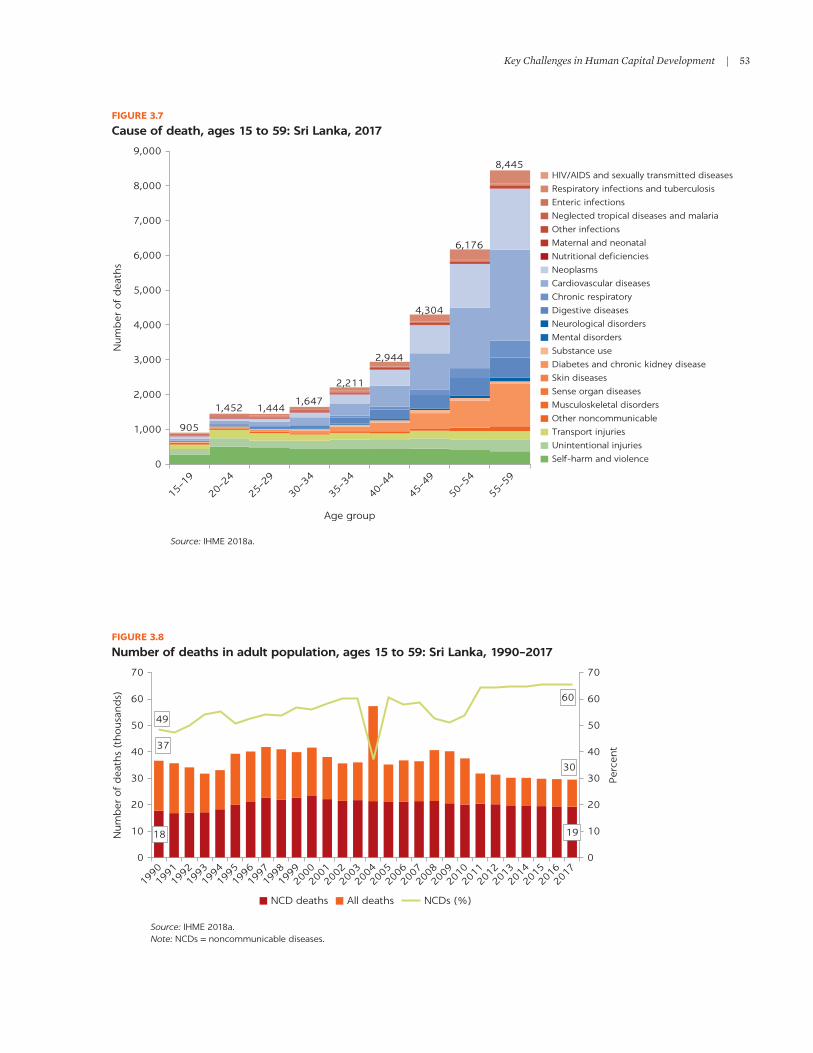
Key Challenges in Human Capital Development | 53
FIGURE 3.7
Cause of death, ages 15 to 59: Sri Lanka, 2017
Source: IHME 2018a.
905
1,452 1,4441,647
2,211
2,944
4,304
6,176
8,445
0
1,000
2,000
3,000
4,000
5,000
6,000
7,000
8,000
9,000
15–1
9
20–2
4
25–2
9
30–3
4
35–3
4
Age group
40–4
4
45–4
9
50–5
4
55–5
9
Num
ber
of
dea
ths
HIV/AIDS and sexually transmitted diseases
Respiratory infections and tuberculosis
Enteric infections
Neglected tropical diseases and malaria
Other infections
Maternal and neonatal
Nutritional deficiencies
Neoplasms
Cardiovascular diseases
Chronic respiratory
Digestive diseases
Neurological disorders
Mental disorders
Substance use
Diabetes and chronic kidney disease
Skin diseases
Sense organ diseases
Musculoskeletal disorders
Other noncommunicable
Transport injuries
Unintentional injuries
Self-harm and violence
FIGURE 3.8
Number of deaths in adult population, ages 15 to 59: Sri Lanka, 1990–2017
Source: IHME 2018a.Note: NCDs = noncommunicable diseases.
18 19
37
49
0
10
20
3030
60
40
50
60
70
0
10
20
30
40
50
60
70
1990
1991
1992
1993
1994
1995
1996
1997
1998
1999
2000
2001
2002
2003
2004
2005
2006
2007
2008
2009
2010
2011
2012
2013
2014
2015
2016
2017
Per
cent
Num
ber
of
dea
ths
(th
ousa
nd
s)
NCD deaths All deaths NCDs (%)
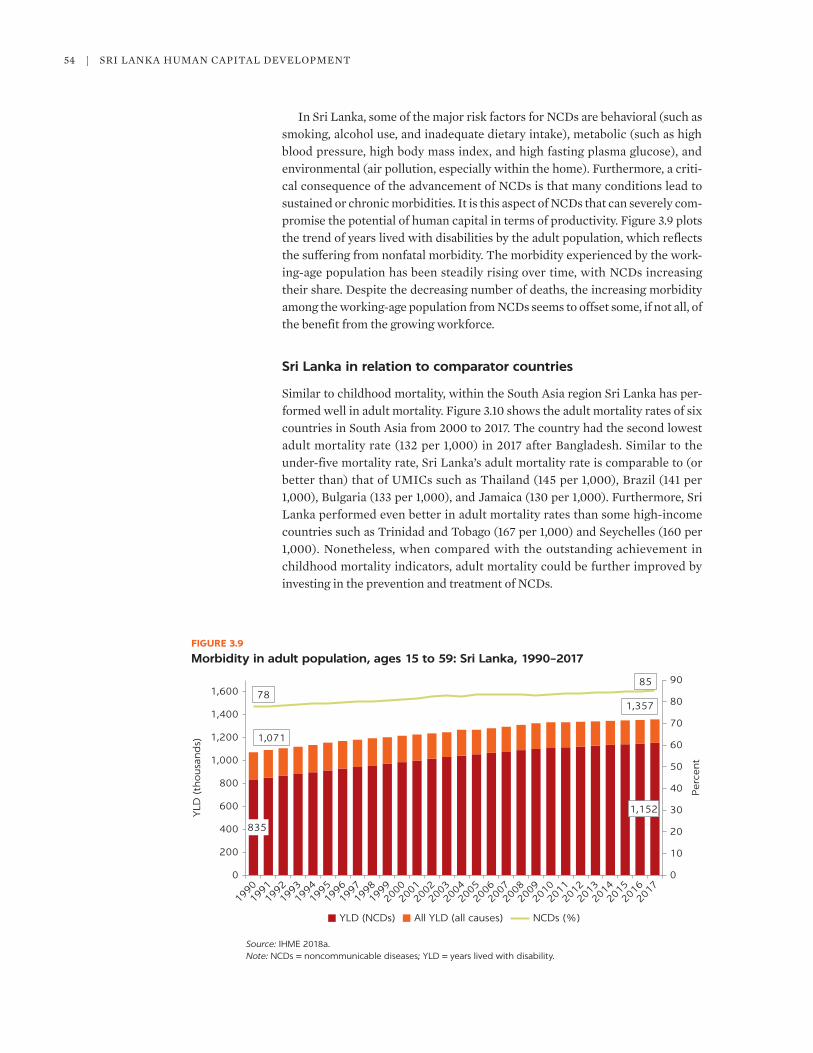
54 | SRI LAnkA HuMAn CAPITAL DEvELOPMEnT
In Sri Lanka, some of the major risk factors for nCDs are behavioral (such as smoking, alcohol use, and inadequate dietary intake), metabolic (such as high blood pressure, high body mass index, and high fasting plasma glucose), and environmental (air pollution, especially within the home). Furthermore, a criti-cal consequence of the advancement of nCDs is that many conditions lead to sustained or chronic morbidities. It is this aspect of nCDs that can severely com-promise the potential of human capital in terms of productivity. Figure 3.9 plots the trend of years lived with disabilities by the adult population, which reflects the suffering from nonfatal morbidity. The morbidity experienced by the work-ing-age population has been steadily rising over time, with nCDs increasing their share. Despite the decreasing number of deaths, the increasing morbidity among the working-age population from nCDs seems to offset some, if not all, of the benefit from the growing workforce.
Sri Lanka in relation to comparator countries
Similar to childhood mortality, within the South Asia region Sri Lanka has per-formed well in adult mortality. Figure 3.10 shows the adult mortality rates of six countries in South Asia from 2000 to 2017. The country had the second lowest adult mortality rate (132 per 1,000) in 2017 after Bangladesh. Similar to the under-five mortality rate, Sri Lanka’s adult mortality rate is comparable to (or better than) that of uMICs such as Thailand (145 per 1,000), Brazil (141 per 1,000), Bulgaria (133 per 1,000), and Jamaica (130 per 1,000). Furthermore, Sri Lanka performed even better in adult mortality rates than some high-income countries such as Trinidad and Tobago (167 per 1,000) and Seychelles (160 per 1,000). nonetheless, when compared with the outstanding achievement in childhood mortality indicators, adult mortality could be further improved by investing in the prevention and treatment of nCDs.
FIGURE 3.9
Morbidity in adult population, ages 15 to 59: Sri Lanka, 1990–2017
Source: IHME 2018a.Note: NCDs = noncommunicable diseases; YLD = years lived with disability.
835
1,152
0
10
20
30
40
50
60
70
80
90
0
200
400
600
800
1,000
1,200
1,400
1,071
1,35778
851,600
199019
9119
9219
9319
9419
9519
9619
9719
9819
9920
0020
0120
0220
0320
0420
0520
0620
0720
0820
0920
1020
1120
1220
1320
1420
1520
1620
17
Per
cent
YLD
(th
ousa
nd
s)
YLD (NCDs) All YLD (all causes) NCDs (%)
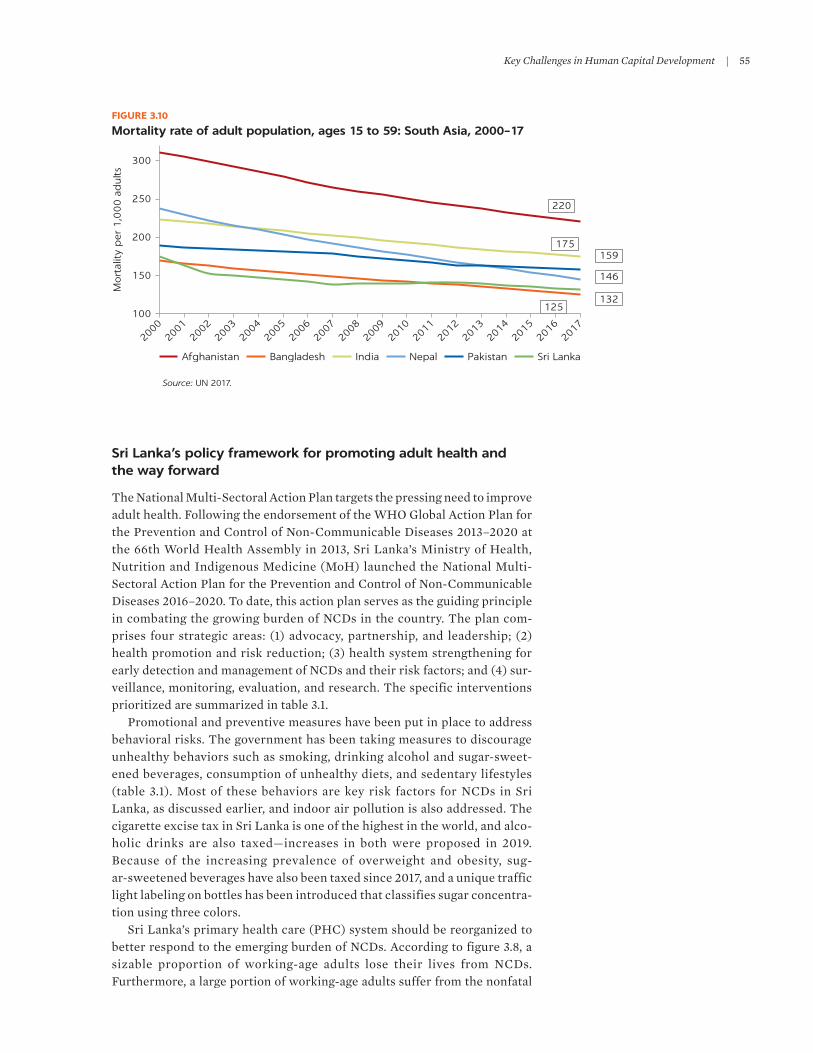
Key Challenges in Human Capital Development | 55
Sri Lanka’s policy framework for promoting adult health and the way forward
The national Multi-Sectoral Action Plan targets the pressing need to improve adult health. Following the endorsement of the WHO Global Action Plan for the Prevention and Control of non-Communicable Diseases 2013–2020 at the 66th World Health Assembly in 2013, Sri Lanka’s Ministry of Health, nutrition and Indigenous Medicine (MoH) launched the national Multi-Sectoral Action Plan for the Prevention and Control of non-Communicable Diseases 2016–2020. To date, this action plan serves as the guiding principle in combating the growing burden of nCDs in the country. The plan com-prises four strategic areas: (1) advocacy, partnership, and leadership; (2) health promotion and risk reduction; (3) health system strengthening for early detection and management of nCDs and their risk factors; and (4) sur-veillance, monitoring, evaluation, and research. The specific interventions prioritized are summarized in table 3.1.
Promotional and preventive measures have been put in place to address behavioral risks. The government has been taking measures to discourage unhealthy behaviors such as smoking, drinking alcohol and sugar-sweet-ened beverages, consumption of unhealthy diets, and sedentary lifestyles (table 3.1). Most of these behaviors are key risk factors for nCDs in Sri Lanka, as discussed earlier, and indoor air pollution is also addressed. The cigarette excise tax in Sri Lanka is one of the highest in the world, and alco-holic drinks are also taxed—increases in both were proposed in 2019. Because of the increasing prevalence of overweight and obesity, sug-ar-sweetened beverages have also been taxed since 2017, and a unique traffic light labeling on bottles has been introduced that classifies sugar concentra-tion using three colors.
Sri Lanka’s primary health care (PHC) system should be reorganized to better respond to the emerging burden of nCDs. According to figure 3.8, a sizable proportion of working-age adults lose their lives from nCDs. Furthermore, a large portion of working-age adults suffer from the nonfatal
FIGURE 3.10
Mortality rate of adult population, ages 15 to 59: South Asia, 2000–17
Source: UN 2017.
220
125
175
146
159
132100
150
200
250
300
2000
2001
2002
2003
2004
2005
2006
2007
2008
2009
2010
2011
2012
2013
2014
2015
2016
2017
Mort
alit
y p
er 1
,00
0 a
dults
Afghanistan Bangladesh India Nepal Pakistan Sri Lanka

56 | SRI LAnkA HuMAn CAPITAL DEvELOPMEnT
burden of nCDs that undermine the productivity of the workforce. It is therefore imperative that the government invest in nCD prevention and treatment to maintain and maximize the potential of human capital in this age group. In addition to promotional and preventive measures, it is also crit-ical to strengthen the health system to enable early detection of risk markers and diseases, followed by adequate therapies and treatments to mitigate the nCD burden.
Table 3.1 lists the strategies to address this issue. Early detection of nCDs and related risk factors has been scaled up since the establishment of healthy lifestyle centers in 2011 (Mallawaarachchi et al. 2016). nCD screening was supported by the Second Health Sector Development Program (SHSDP), through which the adult screening rate for hypertension increased from a baseline of 3 percent to 27 percent in 2017 (World Bank 2019). However, a study conducted in Western Province revealed that among those identified as being hypertensive less than 50 percent were successfully controlled for blood pressure (World Bank 2017b). This finding calls into question the quality of care in managing nCDs among those identified as high-risk. The successor of the SHSDP, the Primary Health Care System Strengthening Project (PSSP), launched in 2018, is focusing on strengthening nCD services at the PHC level. It builds on the government’s
TABLE 3.1 Prioritized specific interventions in multisectoral action plan for noncommunicable diseases (NCDs)
HEALTH PROMOTION AND RISK REDUCTION STRATEGIES
• Reduce tobacco use
o Raise excise tax
o Governance and legal framework (smoking ban and so on)
o Offer smoking cessation services
• Reduce alcohol use
o Strategy to reduce drinking
o Strategy for excise tax
o Update guideline on drinking and driving
• Promote physical activities
o Make facilities available at schools, workplaces, communities, and so on
o Promote a healthy lifestyle to schoolchildren
• Promote healthy diet
o Policies and guidelines to promote healthy diet
o Salt reduction strategy
o Strategy for excise tax
o Apply traffic light (three-color) labeling for unhealthy items
o Subsidize fruits and vegetables
o Adopt strategy to address trans fats
• Promote healthy behaviors
o Implement mass media campaign for NCD risks
o Undertake community-based multisectoral health promotion activities
• Reduce household air pollution
o Improve cookstoves in households
o Subsidize clean fuel for cooking
HEALTH SYSTEM STRENGTHENING FOR EARLY DETECTION AND MANAGEMENT OF NCDs AND RISK FACTORS
• Access to health services
o Review and improve strategies for early detection of NCDs and risk factors (healthy lifestyle centers, and so on)
o Review and improve strategies for management of NCDs (integrate NCD management into primary health care system)
• Health workforce
o Improve knowledge and skills on NCDs and risk factors
o Review and update NCD management guidelines
o Establish quality assurance mechanisms for NCD management
o Develop palliative care protocols for NCDs
o Improve access to drugs and technologies
o Improve information system for NCD management
Source: Sri Lanka, MoH 2016.

Key Challenges in Human Capital Development | 57
position paper on reorganizing the PHC system (Sri Lanka, MoH 2017; World Bank 2018b). Its activities cover most of the strategies listed in the health system strengthening component of table 3.1.
AGING AND ITS IMPLICATIONS FOR HEALTH CARE AND DEVELOPMENT IN SRI LANKA
The challenges of addressing the nCD burden are exacerbated by a rapidly aging population. Sri Lanka is aging at a faster rate than the average for South Asian and other LMICs. Figure 3.11 shows the 2016 population pyramid and figure 3.12 its changing shape over time. Although life expectancy at birth is high in Sri Lanka (75.3, both sexes), the gap of 8.5 years between this and healthy life expec-tancy (66.8 years) indicates that an increasing number of adults are surviving with morbidity and disability. These findings, together with the pressure from social influences and people’s changing expectations, have called for revisiting the current health service delivery model in Sri Lanka.
Trends in population aging
Population aging is a key demographic challenge experienced in the twenty-first century by high-, middle-, and low-income countries. An aging population results from a rapid demographic transition—a process involving decreasing mortality and fertility combined with increasing life expectancy. Population aging has been a central theme in the post-2015 development agenda, and
FIGURE 3.11
Population pyramid: Sri Lanka, 2016
Source: Wikimedia Commons, https://commons.wikimedia.org/wiki/File:Population_pyramid_of _Sri_Lanka_2016.png.
950 950760 760570
Male Female
570380 380190 1900
Population (thousands)
Ag
e g
roup
Population (thousands)
0–45–9
10–1415–1920–2425–2930–3435–3940–4445–4950–5455–5960–6465–6970–7475–7980–8485–8990–9495–99100+
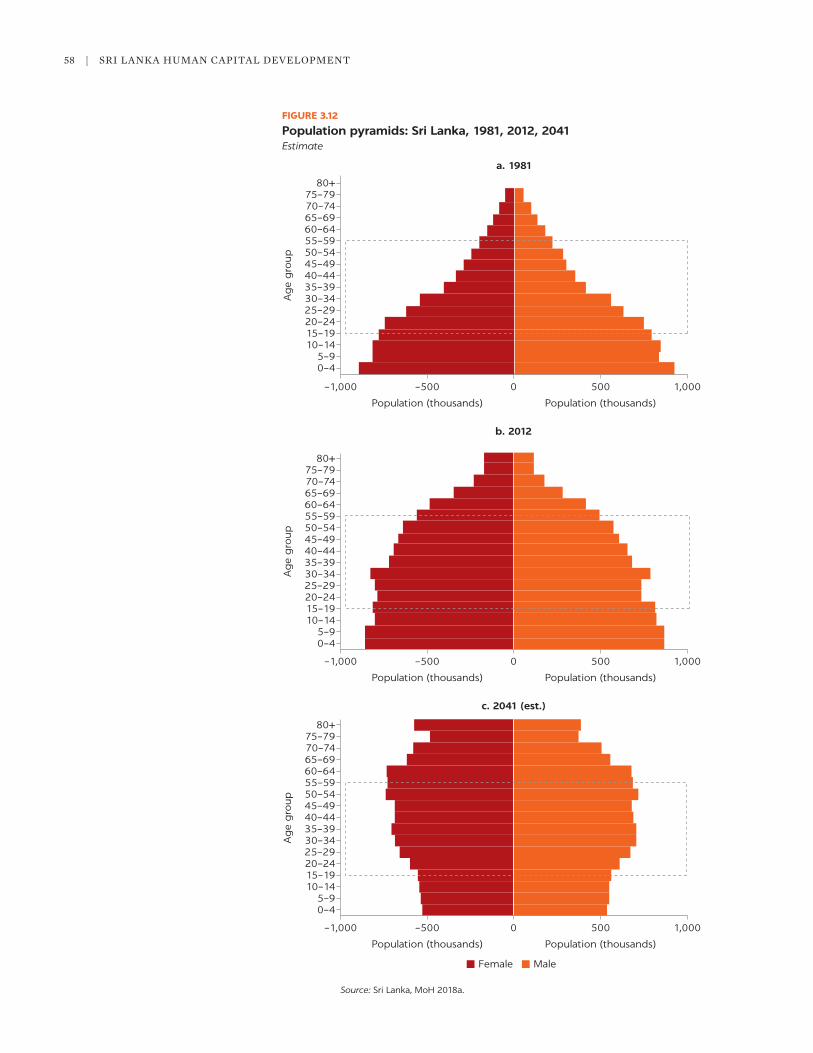
58 | SRI LAnkA HuMAn CAPITAL DEvELOPMEnT
FIGURE 3.12
Population pyramids: Sri Lanka, 1981, 2012, 2041Estimate
Source: Sri Lanka, MoH 2018a.
–1,000 –500
Population (thousands) Population (thousands)
0 500 1,000
80+
70–7475–79
0–45–9
10–1415–1920–2425–2930–3435–3940–4445–4950–5455–5960–6465–69
Female Male
Ag
e g
roup
c. 2041 (est.)
–1,000 –500
Population (thousands) Population (thousands)
0 500 1,000
80+
70–7475–79
0–45–9
10–1415–1920–2425–2930–3435–3940–4445–4950–5455–5960–6465–69
Ag
e g
roup
b. 2012
–1,000 –500
Population (thousands) Population (thousands)
a. 1981
0 500 1,000
80+
70–7475–79
0–45–9
10–1415–1920–2425–2930–3435–3940–4445–4950–5455–5960–6465–69
Ag
e g
roup

Key Challenges in Human Capital Development | 59
countries have begun reforming national policies to promote healthy aging and economic well-being and to create supportive environments for their elderly populations. Globally, the percentage of elderly persons increased from 9.2 per-cent in 1990 to 12.5 percent in 2015. It is expected to reach 21.1 percent by 2050. A large majority of elderly persons live in low- and middle-income countries, and it is projected that by 2050, 8 out of 10 elderly persons will live in those regions.
During the last three decades, Sri Lanka has been experiencing a rapid demographic transition, and population aging has been one of its most signifi-cant consequences. The decline in birth and death rates and the increase in life expectancy have resulted in significant changes in the age structure within the country. Aging in Sri Lanka is accelerating more rapidly than in any other coun-try in South Asia (figures 3.13 and 3.14). Between 1981 and 2012, the proportion of the population above 60 years3 increased from 6.6 percent to 12.4 percent (unFPA 2017).
FIGURE 3.13
Aging population, by country: South Asia, 2012
Source: UNFPA 2017.
0Afghanistan Bangladesh Bhutan India Nepal Pakistan Sri Lanka
2
4
6
8
10
12
14
Perc
ent
4.1
7.38.4 8.5
5.2
6.86.3
12.4
7.6
3.4
1.3
3.7
2.0
0.6
4.2
2.1
0.5
2.6
0.7
4.8
2.8
0.9
4.4
2.2
0.6
2.8
1.10.1
Age 60 and above Age 60–69 Age 70–79 Age 80+
FIGURE 3.14
Aging population: Sri Lanka, 1946–2012
Source: UNFPA 2017.
25
Pop
ula
tion (
mill
ions) 20
15
10
5
01946 1953 1963 1971 1981 2001 2012
Total population Aging population

60 | SRI LAnkA HuMAn CAPITAL DEvELOPMEnT
Rapid aging has had an effect on the dependency ratio of Sri Lanka. From 1981 to 2012, the median age of its population increased from 21.4 years to 31 years, which is the highest median age among South Asian countries (unFPA 2017). In 2012, 25.2 percent of the population was under the age of 15, and working-age persons between the ages of 15 and 59 accounted for 62.4 percent (unFPA 2017). Sri Lanka’s aging index in 2012 was 47—that is, there were 47 elderly persons per 100 children (unFPA 2017). The changes in age structure have affected the dependency ratio in the country. As of 1981, there were 72 dependents—61 chil-dren and 11 elderly—for every 100 working persons. By 2012, the total number of dependents had fallen to 60—40 child dependents and 20 elderly dependents for every 100 working persons (figure 3.15). The decrease in the number of child dependents and the increase in the number of elderly dependents will have major health and social consequences for the country. It is projected that the old-age dependency ratio will continue to increase faster than the child depen-dency ratio and that by the mid-twenty-first century 25 percent of the popula-tion (6.2 million people) will be over the age of 60 (unFPA 2017). This situation is exacerbated by the country’s shrinking support base for elderly people. In 1981, seven people ages 20–59 were available to provide support for one elderly person, but only four were available in 2012.
Socioeconomic implications of population aging
Population aging will have several social and economic implications for Sri Lanka. For one thing, the growing number of older people will have an impact on labor force participation. In certain sectors, employee productivity will begin to deteriorate with age, and a larger number of workers will exit the workforce following compulsory retirement. On a macroeconomic level, the shrinking workforce will affect the country’s national output when compared with that of countries with prime working-age populations. In addition, the state will find that financing social security schemes—in the Sri Lankan context, the Public Sector Pension Scheme for government employees and the Employee Provident Fund for private sector employees—is a major burden. From a human capital standpoint, increasing resources would have to be allocated to care for the
FIGURE 3.15
Trends in the dependency ratio: Sri Lanka, 1946–2012
Source: UNFPA 2017.
Rat
io (
no. o
f d
epen
den
ts p
er 1
00
work
ing
per
sons)
100
90
80
70
60
50
40
30
20
10
01946 1953 1963 1971 1981 2001 2012
Old-age dependency ratio
Total dependency ratio
Child dependency ratio
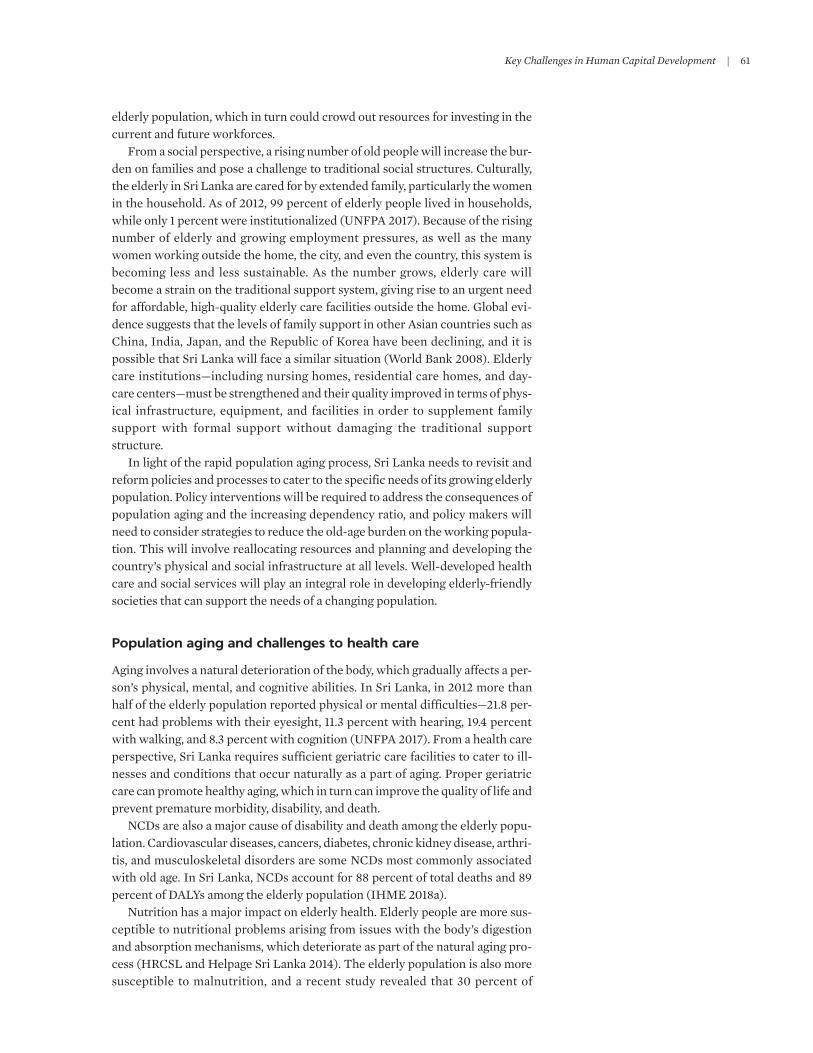
Key Challenges in Human Capital Development | 61
elderly population, which in turn could crowd out resources for investing in the current and future workforces.
From a social perspective, a rising number of old people will increase the bur-den on families and pose a challenge to traditional social structures. Culturally, the elderly in Sri Lanka are cared for by extended family, particularly the women in the household. As of 2012, 99 percent of elderly people lived in households, while only 1 percent were institutionalized (unFPA 2017). Because of the rising number of elderly and growing employment pressures, as well as the many women working outside the home, the city, and even the country, this system is becoming less and less sustainable. As the number grows, elderly care will become a strain on the traditional support system, giving rise to an urgent need for affordable, high-quality elderly care facilities outside the home. Global evi-dence suggests that the levels of family support in other Asian countries such as China, India, Japan, and the Republic of korea have been declining, and it is possible that Sri Lanka will face a similar situation (World Bank 2008). Elderly care institutions—including nursing homes, residential care homes, and day-care centers—must be strengthened and their quality improved in terms of phys-ical infrastructure, equipment, and facilities in order to supplement family support with formal support without damaging the traditional support structure.
In light of the rapid population aging process, Sri Lanka needs to revisit and reform policies and processes to cater to the specific needs of its growing elderly population. Policy interventions will be required to address the consequences of population aging and the increasing dependency ratio, and policy makers will need to consider strategies to reduce the old-age burden on the working popula-tion. This will involve reallocating resources and planning and developing the country’s physical and social infrastructure at all levels. Well-developed health care and social services will play an integral role in developing elderly-friendly societies that can support the needs of a changing population.
Population aging and challenges to health care
Aging involves a natural deterioration of the body, which gradually affects a per-son’s physical, mental, and cognitive abilities. In Sri Lanka, in 2012 more than half of the elderly population reported physical or mental difficulties—21.8 per-cent had problems with their eyesight, 11.3 percent with hearing, 19.4 percent with walking, and 8.3 percent with cognition (unFPA 2017). From a health care perspective, Sri Lanka requires sufficient geriatric care facilities to cater to ill-nesses and conditions that occur naturally as a part of aging. Proper geriatric care can promote healthy aging, which in turn can improve the quality of life and prevent premature morbidity, disability, and death.
nCDs are also a major cause of disability and death among the elderly popu-lation. Cardiovascular diseases, cancers, diabetes, chronic kidney disease, arthri-tis, and musculoskeletal disorders are some nCDs most commonly associated with old age. In Sri Lanka, nCDs account for 88 percent of total deaths and 89 percent of DALYs among the elderly population (IHME 2018a).
nutrition has a major impact on elderly health. Elderly people are more sus-ceptible to nutritional problems arising from issues with the body’s digestion and absorption mechanisms, which deteriorate as part of the natural aging pro-cess (HRCSL and Helpage Sri Lanka 2014). The elderly population is also more susceptible to malnutrition, and a recent study revealed that 30 percent of
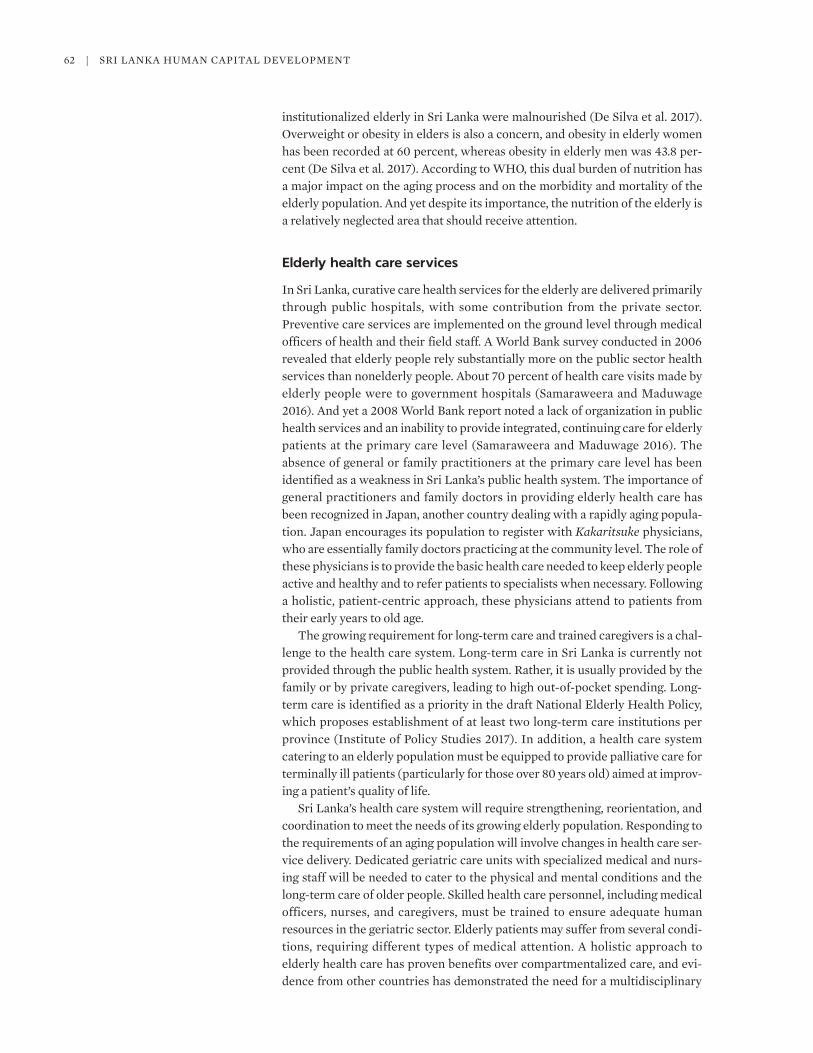
62 | SRI LAnkA HuMAn CAPITAL DEvELOPMEnT
institutionalized elderly in Sri Lanka were malnourished (De Silva et al. 2017). Overweight or obesity in elders is also a concern, and obesity in elderly women has been recorded at 60 percent, whereas obesity in elderly men was 43.8 per-cent (De Silva et al. 2017). According to WHO, this dual burden of nutrition has a major impact on the aging process and on the morbidity and mortality of the elderly population. And yet despite its importance, the nutrition of the elderly is a relatively neglected area that should receive attention.
Elderly health care services
In Sri Lanka, curative care health services for the elderly are delivered primarily through public hospitals, with some contribution from the private sector. Preventive care services are implemented on the ground level through medical officers of health and their field staff. A World Bank survey conducted in 2006 revealed that elderly people rely substantially more on the public sector health services than nonelderly people. About 70 percent of health care visits made by elderly people were to government hospitals (Samaraweera and Maduwage 2016). And yet a 2008 World Bank report noted a lack of organization in public health services and an inability to provide integrated, continuing care for elderly patients at the primary care level (Samaraweera and Maduwage 2016). The absence of general or family practitioners at the primary care level has been identified as a weakness in Sri Lanka’s public health system. The importance of general practitioners and family doctors in providing elderly health care has been recognized in Japan, another country dealing with a rapidly aging popula-tion. Japan encourages its population to register with Kakaritsuke physicians, who are essentially family doctors practicing at the community level. The role of these physicians is to provide the basic health care needed to keep elderly people active and healthy and to refer patients to specialists when necessary. Following a holistic, patient-centric approach, these physicians attend to patients from their early years to old age.
The growing requirement for long-term care and trained caregivers is a chal-lenge to the health care system. Long-term care in Sri Lanka is currently not provided through the public health system. Rather, it is usually provided by the family or by private caregivers, leading to high out-of-pocket spending. Long-term care is identified as a priority in the draft national Elderly Health Policy, which proposes establishment of at least two long-term care institutions per province (Institute of Policy Studies 2017). In addition, a health care system catering to an elderly population must be equipped to provide palliative care for terminally ill patients (particularly for those over 80 years old) aimed at improv-ing a patient’s quality of life.
Sri Lanka’s health care system will require strengthening, reorientation, and coordination to meet the needs of its growing elderly population. Responding to the requirements of an aging population will involve changes in health care ser-vice delivery. Dedicated geriatric care units with specialized medical and nurs-ing staff will be needed to cater to the physical and mental conditions and the long-term care of older people. Skilled health care personnel, including medical officers, nurses, and caregivers, must be trained to ensure adequate human resources in the geriatric sector. Elderly patients may suffer from several condi-tions, requiring different types of medical attention. A holistic approach to elderly health care has proven benefits over compartmentalized care, and evi-dence from other countries has demonstrated the need for a multidisciplinary

Key Challenges in Human Capital Development | 63
service in geriatric wards. Collaboration among members of a primary care team with clear referral pathways is essential for comprehensive geriatric care. Meanwhile, because of their role in supporting elderly care within the commu-nity, it is also important that social workers are included in the multidisciplinary approach to elderly care. The lack of health personnel trained in geriatric care is one of the primary challenges to developing this field.
Several initiatives will soon make Sri Lanka’s public health care system more elderly-friendly. Plans include those for health clinics for the elderly and elderly-friendly wards for district-level hospitals. Stroke units are also being established in many public health institutions (Samaraweera and Maduwage 2016). In terms of preventive care, in 2011 the MoH introduced healthy lifestyle centers to provide screening for nCDs at the community level. A primary aim of these centers is to reduce the risk of nCDs in the 40–65 age group through early detection and specialized care as needed. In terms of infrastructure and equipment, the state-of-the-art tertiary care geriatric hospital under construc-tion will play an integral role in facilitating geriatric medicine programs and increasing the number of trained medical staff (Institute of Policy Studies 2017). The Sri Lanka Association for Geriatric Medicine was established in 2014 with a mission to promote geriatric education within the medical community and the general public.
Developments in policy and practice
The provision of elderly-oriented services in the health care and social care sec-tors is one the biggest concerns for a country dealing with a rapidly aging popu-lation. In the recent past, the government of Sri Lanka undertook several measures to respond to the changing population dynamics, and several policies formulated in the last decade have recognized elderly health care as a national priority. The national Elderly Health Policy currently in draft stage lays out the health care needs of the country’s elderly population and the government’s plan to meet these needs. Enactment of the Protection of the Rights of Elders Act in 2000, establishment of the national Council for Elders in 2000, and introduc-tion of the national Policy for Senior Citizens in 2011 have also helped to pro-mote the rights and needs of elders, and they have set the stage for creating better social networks and elderly care facilities. Sri Lanka has also taken steps to establish its first elderly-friendly city, Wellawaya, in Monaragala District (Sri Lanka, MSS-MoH-uPC-WHO 2014). As a first step in this process, a base-line assessment of PHC facilities was conducted to assess what elderly-friendly design, signage, human resources, tools and technologies, and interventions are available to prevent and control nCDs.
It is often argued that employees’ productivity declines as they age, and firms often refrain from investing in older workers, assuming that such investments will result in few or no returns. According to Mincer (1996), however, better population health and rising life expectancy are associated with a longer invest-ment payback period, which helps to ensure a greater return on investment in people. Aaltio, Salminen, and koponen (2014) find that the assumption that human abilities and skills decline with age has been rejected. The scientific lit-erature notes that human capital development in the context of population aging not only concentrates on older people, but also highlights the potential of young people. Older, less educated workers will be replaced by younger, more educated people.
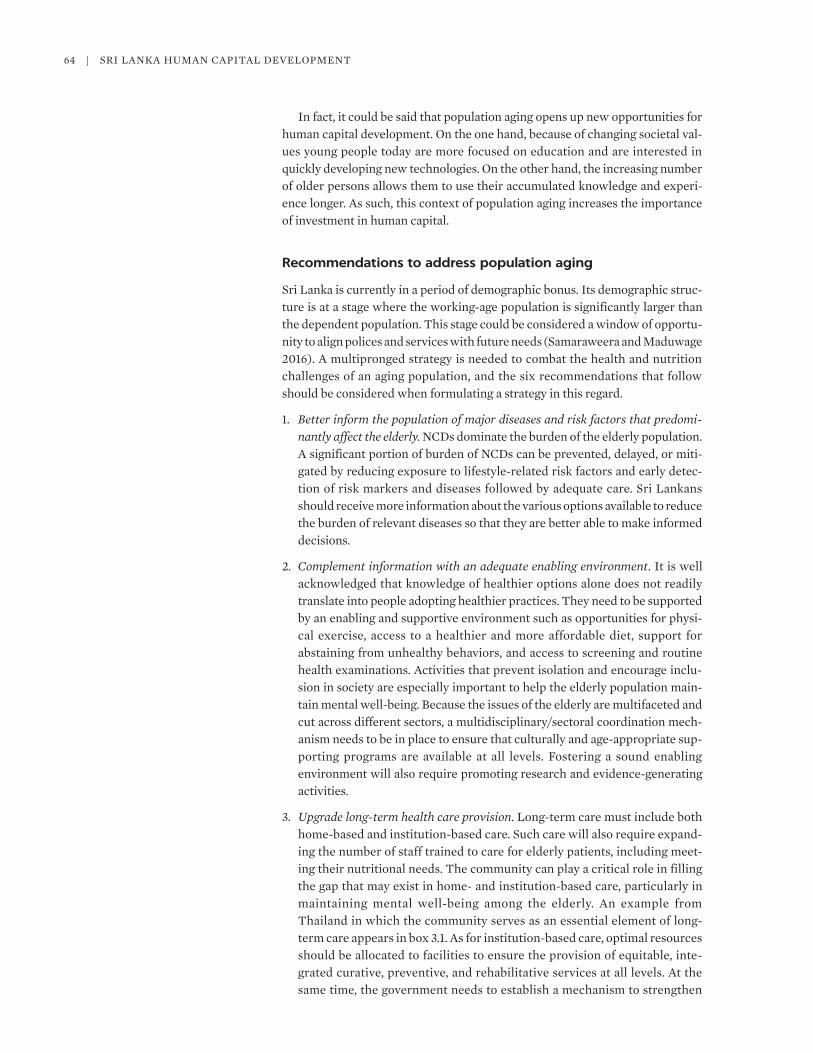
64 | SRI LAnkA HuMAn CAPITAL DEvELOPMEnT
In fact, it could be said that population aging opens up new opportunities for human capital development. On the one hand, because of changing societal val-ues young people today are more focused on education and are interested in quickly developing new technologies. On the other hand, the increasing number of older persons allows them to use their accumulated knowledge and experi-ence longer. As such, this context of population aging increases the importance of investment in human capital.
Recommendations to address population aging
Sri Lanka is currently in a period of demographic bonus. Its demographic struc-ture is at a stage where the working-age population is significantly larger than the dependent population. This stage could be considered a window of opportu-nity to align polices and services with future needs (Samaraweera and Maduwage 2016). A multipronged strategy is needed to combat the health and nutrition challenges of an aging population, and the six recommendations that follow should be considered when formulating a strategy in this regard.
1. Better inform the population of major diseases and risk factors that predomi-nantly affect the elderly. nCDs dominate the burden of the elderly population. A significant portion of burden of nCDs can be prevented, delayed, or miti-gated by reducing exposure to lifestyle-related risk factors and early detec-tion of risk markers and diseases followed by adequate care. Sri Lankans should receive more information about the various options available to reduce the burden of relevant diseases so that they are better able to make informed decisions.
2. Complement information with an adequate enabling environment. It is well acknowledged that knowledge of healthier options alone does not readily translate into people adopting healthier practices. They need to be supported by an enabling and supportive environment such as opportunities for physi-cal exercise, access to a healthier and more affordable diet, support for abstaining from unhealthy behaviors, and access to screening and routine health examinations. Activities that prevent isolation and encourage inclu-sion in society are especially important to help the elderly population main-tain mental well-being. Because the issues of the elderly are multifaceted and cut across different sectors, a multidisciplinary/sectoral coordination mech-anism needs to be in place to ensure that culturally and age-appropriate sup-porting programs are available at all levels. Fostering a sound enabling environment will also require promoting research and evidence-generating activities.
3. Upgrade long-term health care provision. Long-term care must include both home-based and institution-based care. Such care will also require expand-ing the number of staff trained to care for elderly patients, including meet-ing their nutritional needs. The community can play a critical role in filling the gap that may exist in home- and institution-based care, particularly in maintaining mental well-being among the elderly. An example from Thailand in which the community serves as an essential element of long-term care appears in box 3.1. As for institution-based care, optimal resources should be allocated to facilities to ensure the provision of equitable, inte-grated curative, preventive, and rehabilitative services at all levels. At the same time, the government needs to establish a mechanism to strengthen

Key Challenges in Human Capital Development | 65
policy guidelines and service delivery measures for comprehensive health services for the elderly.
4. Strengthen and expand inpatient services. The demand for inpatient care at hospitals will rise as the elderly population grows over time. Apart from investing in the construction of new buildings, it is important to maximize the use of existing hospital capacities. Current bed occupancy is tight in higher-level hospitals, whereas the beds are not fully used to their potential in lower-level hospitals. Building the capacity of first-level hospitals to become more capable of accommodating less severe cases will free up spaces in secondary and tertiary hospitals so that they can care for more severely ill patients, whose numbers are anticipated to increase with the aging popula-tion. The network of hospitals will have to be strengthened to cope with such an increase in demand and usage. The government should establish a mecha-nism to build the capacity of health and other relevant service providers to care of the elderly.
5. Expand human resources in terms of both numbers and specialties. As part of the expansion of long-term and inpatient care, the demand for health care personnel will increase at various levels, including medical specialists and nurses trained in health care related to geriatric diseases and their manage-ment and treatment. Older people usually develop issues that are unique and are a direct result of aging, in addition to having medical conditions such as hypertension and diabetes. These issues can include difficulties in walking and problems with balance, making them vulnerable to falls; special dietary needs; constipation and incontinence; psychological issues such as problems with memory, dementia, loneliness, and bereavement; bone fragility; and chronic debilitating illnesses such as Parkinson’s Disease. Managing the health and wellness of an older person usually means managing varying com-binations of these issues. This requires specialist knowledge, in coordination with other services and systems for care coordination, for the best outcomes.
Meeting the health care needs of an aging population: An example from Thailand
In Thailand, steps have been taken to build a strong social security network and to create conditions for a better quality of life for the elderly. The Thai approach to long-term care for elders is a reliance on a combina-tion of family assistance and supportive health care and social care systems within local communities. Community and local administrative organizations play a central role in implementing and financing this
system. This community-based long-term care system involves several components, including databases on elderly persons, clubs for the elderly, and volunteers to provide home-based care for those who are home- or bed-bound. In 2003, Thailand launched the program Home Care Service volunteers for the Elderly, and, as of 2013, 51,000 volunteers were providing nearly 800,000 elderly people with care.
Source: Knodel et al. 2015.
BOX 3.1
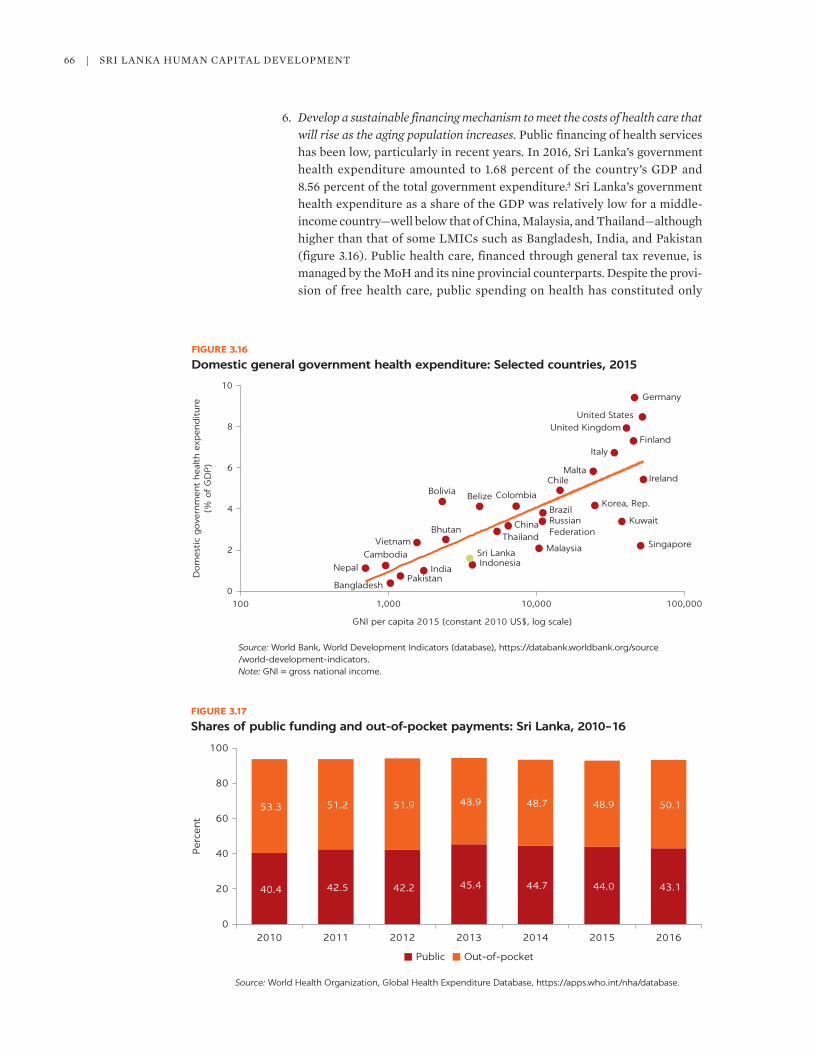
66 | SRI LAnkA HuMAn CAPITAL DEvELOPMEnT
6. Develop a sustainable financing mechanism to meet the costs of health care that will rise as the aging population increases. Public financing of health services has been low, particularly in recent years. In 2016, Sri Lanka’s government health expenditure amounted to 1.68 percent of the country’s GDP and 8.56 percent of the total government expenditure.4 Sri Lanka’s government health expenditure as a share of the GDP was relatively low for a middle- income country—well below that of China, Malaysia, and Thailand—although higher than that of some LMICs such as Bangladesh, India, and Pakistan (figure 3.16). Public health care, financed through general tax revenue, is managed by the MoH and its nine provincial counterparts. Despite the provi-sion of free health care, public spending on health has constituted only
FIGURE 3.16
Domestic general government health expenditure: Selected countries, 2015
Source: World Bank, World Development Indicators (database), https://databank.worldbank.org/source / world-development-indicators.Note: GNI = gross national income.
BangladeshPakistan
IndiaNepalCambodia
IndonesiaSri Lanka Malaysia SingaporeVietnam
BhutanThailand
China KuwaitRussianFederation
Brazil
Belize ColombiaKorea, Rep.
BoliviaChile Ireland
Malta
ItalyFinland
United KingdomUnited States
Germany
0100
2
4
6
8
10
Dom
esti
c g
ove
rnm
ent
hea
lth
exp
end
iture
(% o
f G
DP)
1,000 10,000 100,000
GNI per capita 2015 (constant 2010 US$, log scale)
FIGURE 3.17
Shares of public funding and out-of-pocket payments: Sri Lanka, 2010–16
Source: World Health Organization, Global Health Expenditure Database, https://apps.who.int/nha/database.
40.4 42.5 42.2 45.4 44.7 44.0 43.1
53.3 51.2 51.9 48.9 48.7 48.9 50.1
0
20
40
60
80
100
Per
cent
2010 2011 2012 2013 2014 2015 2016
Public Out-of-pocket
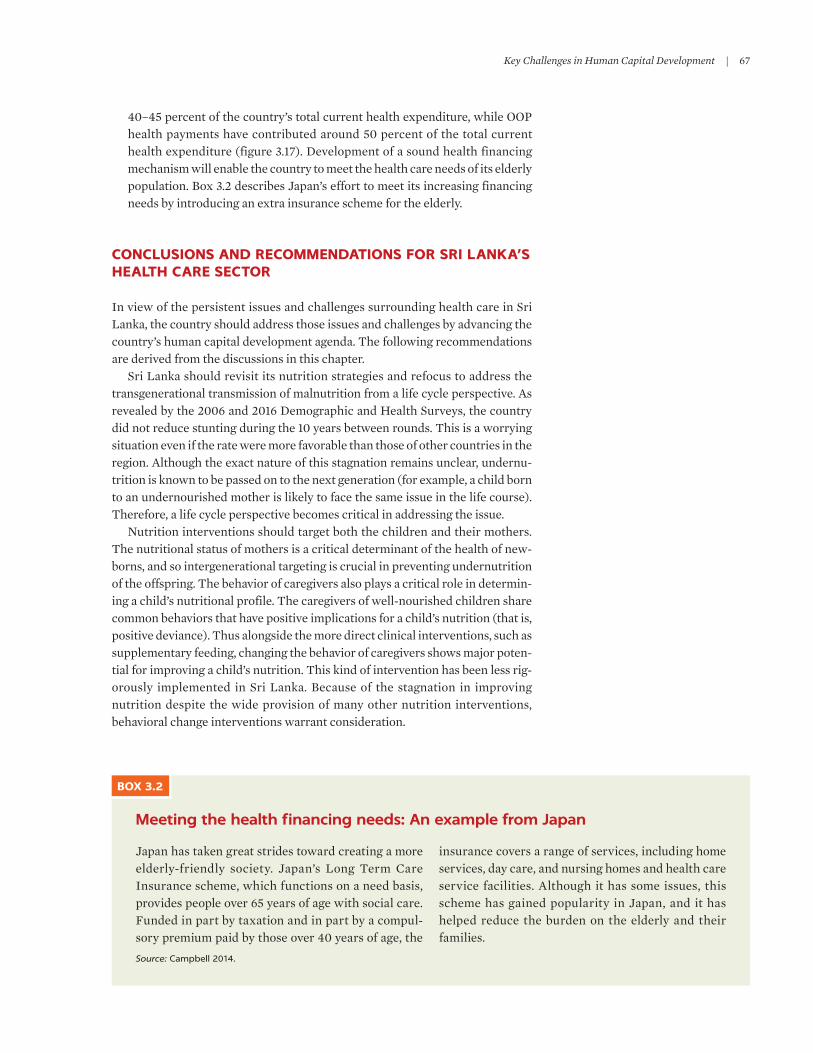
Key Challenges in Human Capital Development | 67
40–45 percent of the country’s total current health expenditure, while OOP health payments have contributed around 50 percent of the total current health expenditure (figure 3.17). Development of a sound health financing mechanism will enable the country to meet the health care needs of its elderly population. Box 3.2 describes Japan’s effort to meet its increasing financing needs by introducing an extra insurance scheme for the elderly.
CONCLUSIONS AND RECOMMENDATIONS FOR SRI LANKA’S HEALTH CARE SECTOR
In view of the persistent issues and challenges surrounding health care in Sri Lanka, the country should address those issues and challenges by advancing the country’s human capital development agenda. The following recommendations are derived from the discussions in this chapter.
Sri Lanka should revisit its nutrition strategies and refocus to address the transgenerational transmission of malnutrition from a life cycle perspective. As revealed by the 2006 and 2016 Demographic and Health Surveys, the country did not reduce stunting during the 10 years between rounds. This is a worrying situation even if the rate were more favorable than those of other countries in the region. Although the exact nature of this stagnation remains unclear, undernu-trition is known to be passed on to the next generation (for example, a child born to an undernourished mother is likely to face the same issue in the life course). Therefore, a life cycle perspective becomes critical in addressing the issue.
nutrition interventions should target both the children and their mothers. The nutritional status of mothers is a critical determinant of the health of new-borns, and so intergenerational targeting is crucial in preventing undernutrition of the offspring. The behavior of caregivers also plays a critical role in determin-ing a child’s nutritional profile. The caregivers of well-nourished children share common behaviors that have positive implications for a child’s nutrition (that is, positive deviance). Thus alongside the more direct clinical interventions, such as supplementary feeding, changing the behavior of caregivers shows major poten-tial for improving a child’s nutrition. This kind of intervention has been less rig-orously implemented in Sri Lanka. Because of the stagnation in improving nutrition despite the wide provision of many other nutrition interventions, behavioral change interventions warrant consideration.
Meeting the health financing needs: An example from Japan
Japan has taken great strides toward creating a more elderly-friendly society. Japan’s Long Term Care Insurance scheme, which functions on a need basis, provides people over 65 years of age with social care. Funded in part by taxation and in part by a compul-sory premium paid by those over 40 years of age, the
insurance covers a range of services, including home services, day care, and nursing homes and health care service facilities. Although it has some issues, this scheme has gained popularity in Japan, and it has helped reduce the burden on the elderly and their families.
Source: Campbell 2014.
BOX 3.2

68 | SRI LAnkA HuMAn CAPITAL DEvELOPMEnT
A multisectoral approach is critical to improving nutrition status, which goes way beyond the health sector. Although the direct causes of undernutrition may be addressed by health care services, the underlying causes may not. Food secu-rity and safety, maternal and child practices, agricultural practices, education, WASH, and other factors have major bearings on nutrition. Although the national nutrition Policy covers a wide spectrum of approaches that span sec-tors, the degree to which those interventions relate to nutrition can vary. Mainstreaming nutrition interventions in the policy of all sectors at all levels would be critical in pushing forward the agenda of multisectoral nutrition strat-egies. Furthermore, the critical knowledge gap in those interventions is a major limitation that can hinder the allocation of adequate resources to those interven-tions. Developing the knowledge base on the effectiveness and efficiency of interventions is highly recommended. Along this line, the information manage-ment of nutrition-related data should be strengthened to foster timely, data-informed decision-making, including data on investment and spending. In 2021, the World Bank was reviewing the past budgets and expenditures on nutri-tion programs that would provide critical intelligence on how effectively resources had been used and how allocation could be improved.
The government should place utmost priority in preventing the growing bur-den of nCDs. Elsewhere, Sri Lanka needs to strengthen and reorganize its health care system and programs to respond to the emerging health challenges such as the nCDs affecting the working-age population and elderly care. A growing demand for health care is anticipated because of the rising burden of nCDs and the rapidly aging population. The immediate priority should include preventive strategies that call for reducing exposure to major risk factors for nCDs such as smoking, alcohol use, an unhealthy diet, and lifestyle. A number of policy-level interventions are under way such as excise taxes, labels on products such as cig-arette packs and sugar-sweetened beverages alerting consumers of the potential harm from consumption and banning sales to minors. Although policies and reg-ulations may be in place, enforcement could be strengthened, alongside further tightening of the regulations. This would require intersectoral initiatives, with adequate resources allocated to the relevant authorities. Another area worthy of investment is facilities related to physical exercise and mental well-being. They should be scaled up to meet the needs of the adult and older populations.
Another area that warrants immediate attention is early detection and manage-ment of risk factors and nCDs. Public health services are mostly offered only from 8 a.m. to 4 p.m. when the working population does not have access, particularly for screening services for nCDs at healthy lifestyle centers. The system should be scaled up, which would involve reorganizing the service delivery mechanisms. One such strategy might include collaboration with the private sector. As dis-cussed previously, the majority of outpatient services are provided by the private sector, which operates after-hours. Leveraging the existing private sector with a public financing mechanism could be considered for various services, including diagnostic investigations and drug provisions. For treatment of nCDs, the staffing and equipment capacity of primary medical care institutions should be expanded so that less severe cases can be confidently managed at this level. Concurrently, a clear referral pathway should be defined to avoid overburdening the higher-level institutions with patients who bypassed the primary level.
Special arrangements are needed to provide the elderly with holistic support. Elderly care requires a multidisciplinary approach in which health care is a crit-ical element. This emerging area should be addressed by multiple efforts.

Key Challenges in Human Capital Development | 69
First, policies and services need to be aligned with future needs by establishing a network of supportive activities provided by different sectors and entities, including the community. The leading ministry may not be the MoH, although it will play the key role in providing geriatric care. Because not all health care providers will have sufficient skills and experience to provide such care, this area will require investments. In some institutions, specialized geriatric care units may be established to cater to the special needs of the elderly. Furthermore, a crucial aspect of elderly care is its long-term nature. Addressing this factor would necessitate organizing a combination of facility-based and home-based care (including community-based care). But these new arrangements would certainly come at a cost. In providing the services for elderly care, Sri Lanka would have to establish sustainable financing mechanisms appropriate for its context. Finally, the opportunities for long-term care for the elderly will likely translate into a healthier population, although they should be balanced with the opportunities for younger generations, who may be equipped with novel tech-nologies and skills.
NOTES
1. World Health Organization, Global Health Observatory, https://www.who.int/data/gho.2. The Economist, Global Food Security Index, https://foodsecurityindex.eiu.com/Downloads.3. The term elderly in Sri Lanka is defined as people over the age of 60 because the age of
retirement in both the public and private sector is between 55 and 60 years.4. World Health Organization, Global Health Expenditure Database, http://apps.who.int
/ nha/database/Select/Indicators/en.
REFERENCES
Aaltio, I., H. Maria Salminen, and S. koponen. 2014. “Ageing Employees and Human Resource Management–Evidence of Gender-Sensitivity?” Equality, Diversity and Inclusion 33 (2): 160–76.
Amarasinghe, C. S. n., k. C. S. Dalpatadu, and R. P. Rannan-Eliya. 2018. “Sri Lanka Health Accounts: national Health Expenditure 1990–2016.” Institute for Health Policy, Colombo, Sri Lanka.
Barker, D. J. 2007. “The Origins of the Developmental Origins Theory.” Journal of Internal Medicine 261 (5): 412–17.
Campbell, J. C. 2014. “Japan’s Long-Term Care Insurance System.” In Eldercare Policies in Japan and Scandinavia, edited by J. C. Campbell, u. Edvardsen, P. Midford, and Y. Saito. new York: Palgrave Macmillan.
De Silva, k., C. Liyanage, C. Wijesinghe, and B. Perera. 2017. “nutritional Status of Elders in Galle District Sri Lanka.” Galle Medical Journal 22: 1. https://gmj.sljol.info/articles /abstract/10.4038/gmj.v22i1.7958/.
European Commission. 2018. “Sri Lanka: Country Profile on nutrition and Child Stunting Trends.” Brussels.
FAO (Food and Agriculture Organization). 2003. Trade Reforms and Food Security. Rome: FAO.
Freeman, M. C., M. E. Stocks, O. Cumming, A. Jeandron, J. P. Higgins, J. Wolf, A. Prüss-ustün, S. Bonjour, P. R. Hunter, L. Fewtrell, and v. Curtis. 2014. “Hygiene and Health: Systematic Review of Handwashing Practices Worldwide and update of Health Effects.” Tropical Medicine and International Health 19 (8): 906–16.
Galasso, E., and A. Wagstaff. 2018. The Aggregate Income Losses from Childhood Stunting and the Returns to a Nutrition Intervention Aimed at Reducing Stunting. Washington, DC: World Bank.

70 | SRI LAnkA HuMAn CAPITAL DEvELOPMEnT
HRCSL (Human Rights Commission of Sri Lanka) and Helpage Sri Lanka. 2014. Growing Old Gracefully. Colombo: HRCSL.
Humphrey, J. H., M. n. Mbuya, R. ntozini, L. H. Moulton, R. J. Stoltzfus, n. v. Tavengwa, k. Mutasa, et al. 2019. “Independent and Combined Effects of Improved Water, Sanitation, and Hygiene, and Improved Complementary Feeding, on Child Stunting and Anaemia in Rural Zimbabwe: A Cluster-Randomised Trial.” Lancet Global Health 7 (1): e132–e147.
IGME (un Inter-Agency Group for Child Mortality Estimation). 2017. “Child Mortality Estimates.” united nations, new York.
IHME (Institute for Health Metrics and Evaluation). 2018a. “GBD Compare.” IHME, Seattle, WA. https://vizhub.healthdata.org/gbd-compare/.
IHME (Institute for Health Metrics and Evaluation). 2018b. “Mortality visualization.” IHME, Seattle, WA.
Institute of Policy Studies. 2017. Responding to the Challenge of an Ageing Population. Colombo: Institute of Policy Studies.
Jayachandran, S., and A. Lleras-Muney. 2009. “Life Expectancy and Human Capital Investments: Evidence from Maternal Mortality Declines.” Quarterly Journal of Economics 124 (1): 349–97.
knodel, J., B. Teerawichitchainan, v. Prachuabmoh, and W. Pothisiri. 2015. The Situation of Thailand’s Older Population. Thailand: Helpage International.
Luby, S. P., M. Rahman, B. F. Arnold, L. unicomb, S. Ashraf, P. J. Winch, and C. P. Stewart. 2018. “Effects of Water Quality, Sanitation, Handwashing, and nutritional Interventions on Diarrhoea and Child Growth in Rural Bangladesh: A Cluster Randomised Controlled Trial.” Lancet Global Health 6 (3): e302–e315.
Mallawaarachchi, D. v., S. C. Wickremasinghe, L. C. Somatunga, v. T. Siriwardena, and n. S. Gunawardena. 2016. “Healthy Lifestyle Centres: A Service for Screening noncommunicable Diseases through Primary Health-care Institutions in Sri Lanka.” WHO South-East Asia Journal of Public Health 5 (2): 89–95.
Mincer, J. 1996. “Economic Development, Growth of Human Capital, and the Dynamics of the Wage Structure.” Journal of Economic Growth 1 (1): 29–48.
Sri Lanka, MoH (Ministry of Health, nutrition and Indigenous Medicine). 2016. National Multisectoral Action Plan for the Prevention and Control of Noncommunicable Diseases 2016–2020. Colombo: MoH.
Sri Lanka, MoH (Ministry of Health, nutrition and Indigenous Medicine). 2017. Reorganising Primary Health Care in Sri Lanka: Preserving Our Progress, Preparing Our Future. Colombo: MoH.
MRI (Medical Research Institute). 2010. Nutrition and Food Security Assessment in Sri Lanka. Colombo: MRI.
MRI (Medical Research Institute). 2012. National Nutrition and Micronutrient Survey 2012. Colombo: MRI.
Ramakrishnan, u. 2004. “nutrition and Low Birth Weight: From Research to Practice.” American Journal of Clinical Nutrition 79 (1): 17–21.
Samaraweera, D., and S. Maduwage. 2016. “Meeting the Current and Future Health-Care needs of Sri Lanka’s Ageing Population.” WHO South-East Asia Journal of Public Health 5 (2): 96–101.
Shekar, M., R. Heaver, and Y.-k. Lee. 2006. Repositioning Nutrition as Central to Development: A Strategy for Large Scale Action. Washington, DC: World Bank.
Sri Lanka, DCS (Department of Census and Statistics). 2009. Sri Lanka Demographic and Health Survey 2006/07. DCS and Ministry of Health, nutrition and Indigenous Medicine, Battaramulla, Sri Lanka.
Sri Lanka, DCS (Department of Census and Statistics). 2016. Life Tables for Sri Lanka 2011–2013 by District and Sex. DCS, Battaramulla, Sri Lanka.
Sri Lanka, DCS (Department of Census and Statistics). 2017. Sri Lanka Demographic and Health Survey 2016. DCS and Ministry of Health, nutrition and Indigenous Medicine, Battaramulla, Sri Lanka.

Key Challenges in Human Capital Development | 71
Sri Lanka, FHB (Family Health Bureau). 2019. “Family Health Bureau national Statistics.” Public Health Department, Colombo, Sri Lanka.
Sri Lanka, MoH (Ministry of Health, nutrition and Indigenous Medicine). 2017. Reorganising Primary Health Care in Sri Lanka: Preserving Our Progress, Preparing Our Future. Colombo: MoH.
Sri Lanka, MoH (Ministry of Health, nutrition and Indigenous Medicine). 2018a. Annual Health Bulletin 2016. Colombo: MoH.
Sri Lanka, MoH (Ministry of Health, nutrition and Indigenous Medicine). 2018b. “Reproductive Health Management Information System.” Family Health Bureau, Colombo, Sri Lanka.
Sri Lanka, MoH (Ministry of Health, nutrition and Indigenous Medicine) and WHO (World Health Organization). 2017. non-Communicable Disease Risk Factor Survey Sri Lanka 2015. Geneva: WHO.
Sri Lanka, MSS-MoH-uPC-WHO (Ministry of Social Services–Ministry of Health, nutrition and Indigenous Medicine–uva Provincial Council–World Health Organization). 2014. “Age Friendly/Disabled Friendly City First Phase: Wellawaya Division, Moneragala District (2013–2018).” Colombo, Badulla, Geneva.
Stewart, C. P., A. J. Pickering, H. n. Dentz, B. F. Arnold, C. D. Arnold, J. Benjamin-Chung, T. Clasen, et al. 2018. “Effects of Water Quality, Sanitation, Handwashing, and nutritional Interventions on Diarrhoea and Child Growth in Rural kenya: A Cluster-Randomised Controlled Trial.” Lancet Global Health 6 (3): e316–e329.
un (united nations). 2017. “World Population Prospects.” un, new York. https://population .un.org/wpp/.
unFPA (united nations Population Fund). 2017. “Ageing Population of Sri Lanka: Emerging Issues, needs and Policy Implications.” unFPA, Colombo, Sri Lanka.
unICEF (united nations Children’s Fund). 1990. Strategy for Improved Nutrition of Children and Women in Developing Countries. new York: unICEF.
unICEF (united nations Children’s Fund). 2014. “news Release: Iron Deficiency a Leading Cause of Anemia.” unICEF, Colombo, Sri Lanka.
unICEF (united nations Children’s Fund)–WHO (World Health Organization)–World Bank. 2018. “unICEF-WHO-World Bank Joint Child Malnutrition Estimates.” new York, Geneva, Washington, DC: unICEF, WHO, World Bank.
Walker, S. P., S. M. Chang, C. A. Powell, E. Simonoff, and S. M. Grantham-McGregor. 2007. “Early Childhood Stunting Is Associated with Poor Psychological Functioning in Late Adolescence and Effects Are Reduced by Psychosocial Stimulation.” Journal of Nutrition 137 (11): 2464–69.
WHO (World Health Organization). 2014. Global Nutrition Targets 2025: Stunting Policy Brief. Geneva: WHO.
WHO (World Health Organization). 2017a. non Communicable Disease Risk Factor Survey, Sri Lanka 2015. WHO, Colombo, Sri Lanka.
WHO (World Health Organization). 2017b. Stunted Growth and Development: Context, Causes and Consequences. Geneva: WHO.
World Bank. 2008. Sri Lanka—Addressing the Needs of an Ageing Population. Washington, DC: World Bank.
World Bank. 2017a. Multisectoral Nutrition Assessment in Sri Lanka’s Estate Sector. Washington, DC: World Bank.
World Bank. 2017b. Non-communicable Disease Burden in the Western Province, Sri Lanka. Washington, DC: World Bank.
World Bank. 2018a. Improving Nutrition Outcomes for Children in Sri Lanka’s Estate Sector: The Positive Deviance Approach. Washington, DC: World Bank.
World Bank. 2018b. Project Appraisal Document: Primary Health Care System Strengthening Project. Washington, DC: World Bank.
World Bank. 2019. Second Health Sector Development Project Implementation Completion and Results Report. Washington, DC: World Bank. http://projects.worldbank.org/P118806 /second-health-sector-development-project?lang=en&tab=overview.

73
4 Key Challenges in Human Capital DevelopmentIMPROVING LEARNING OUTCOMES
INTRODUCTION
The key education challenge within the framework of the Human Capital Project (HCP) is improving learning outcomes. Meeting this challenge is especially import-ant for Sri Lanka as it seeks to develop the human capital required for an interna-tionally competitive upper-middle-income economy. Drawing on the framework presented in the World Bank’s World Development Report 2018: Learning to Realize Education’s Promise, this chapter discusses a set of policies that, given priority, would help Sri Lanka to expand and improve learning (World Bank 2018).
The first policy is in a new area becoming increasingly important for human capital policy—the development of socioemotional skills. These skills play a vital role in successful employee performance in labor markets and in enhancement of learning outcomes in the educational system. Socioemotional skills are also important in the promotion of a peaceful, cohesive society. The second policy is emphasizing the importance of early learning. Children who fail to learn early face a cumulative deficit that makes it extremely difficult for them to catch up later. A high-quality educational system needs to have a sound foundation for learning in the early years. The third policy is the new and changing role of teachers in the learning process. The pedagogical methods that address the learning needs of modern children are evolving rapidly. This evolution is, in turn, transforming teacher development and management. The fourth policy is the use of technology in education. Rapidly evolving technologies are transforming the learning environment. Sri Lanka should position itself to obtain the benefits of technology to promote learning. The fifth policy is the measurement of cogni-tive and socioemotional skills and the use of information in developing programs to increase these skills. The sixth and final policy is dealing with gender differ-ences in learning.
INVESTING IN SOCIOEMOTIONAL SKILLS FOR SUCCESS
Socioemotional skills are now widely acknowledged to be critical for success in today’s workplace, as well as in fostering a stable and prosperous society. These skills are generally defined as “the learned competencies that help us

74 | SRi LAnkA HuMAn CAPiTAL DeveLoPMenT
understand ourselves, help us get along with others, and help us solve important social problems and resolve conflicts” (Guerra 2015). They are important not only for relating in the social and work context but also increasingly for their role in the development and use of cognitive skills (oeCD 2018a). one of the most widely used frameworks for socioemotional skills is the Big Five model described in box 4.1 (oeCD 2015). This model categorizes socioemotional skills into five broad traits: (1) extraversion (engaging with others); (2) agreeableness (collabo-ration); (3) conscientiousness (task performance); (4) emotional stability (emo-tional regulation); and (5) openness to experience (open-mindedness). Grit, also known as persistence or determination, is another widely acknowledged socio-emotional skill that fits neatly into the Big Five categories. Together, these skills form the bedrock of the discussion around socioemotional skills and their value in twenty-first-century life and workplace.
A subset of these socioemotional skills, known as the PRACTiCe skills, are the ones that employers value (Guerra, Modecki, and Cunningham 2014). The eight PRACTiCe skills are Problem-solving, Resilience, Achievement motiva-tions, Control, Teamwork, Initiative, Confidence, and Ethics. The PRACTiCe framework draws on and is consistent with frameworks such as the Big Five model. However, the PRACTiCe framework was specifically designed to pro-vide guidance for labor market–oriented, skill-building policies and programs and to frame the socioemotional skills dialogue in a language that is consistent with intervention programs to promote job-oriented noncognitive skills. Table 4.1 shows how these skills relate to the Big Five personality traits and pres-ents their neurobiological foundations as well.
key markers of neurobiological and psychosocial readiness for the develop-ment of socioemotional skills appear at different stages of childhood and early adulthood (Guerra, Modecki, and Cunningham 2014). PRACTiCe skills are therefore developed at different stages of a person’s lifetime—from early child-hood through adulthood—and any effective investment in socioemotional skills enhancement policies and programs requires a sound understanding of the
The Big Five factors
The Big Five factors is a classification system of personality that distinguishes five basic dimensions:
1. Extraversion—gregariousness, assertiveness, activity, adventurousness, enthusiasm, warmth
2. Agreeableness—trust, straightforwardness, altruism, compliance, modesty, sympathy
3. Conscientiousness—efficiency, organization, duti-fulness, achievement striving, self-discipline, deliberation
4. Emotional stability—anxiety, irritability, depression, self-consciousness, impulsiveness, vulnerability (also known as neuroticism)
5. Openness to experience—curiosity, imagination, aesthetics, actions (wide interests), excitability, unconventionality
extraversion is perhaps the most widely used and most familiar factor. Agreeableness may be characterized by traits such as being caring, modest, and trusting. Conscientiousness denotes dutifulness, striving to achieve, and acting in a goal-directed manner. emotional stability refers to the ability to deal with negative emotional experiences and stressors and is central to managing emotions. Finally, openness refers to the ability to be open to new experiences.
Source: OECD 2015.
BOX 4.1
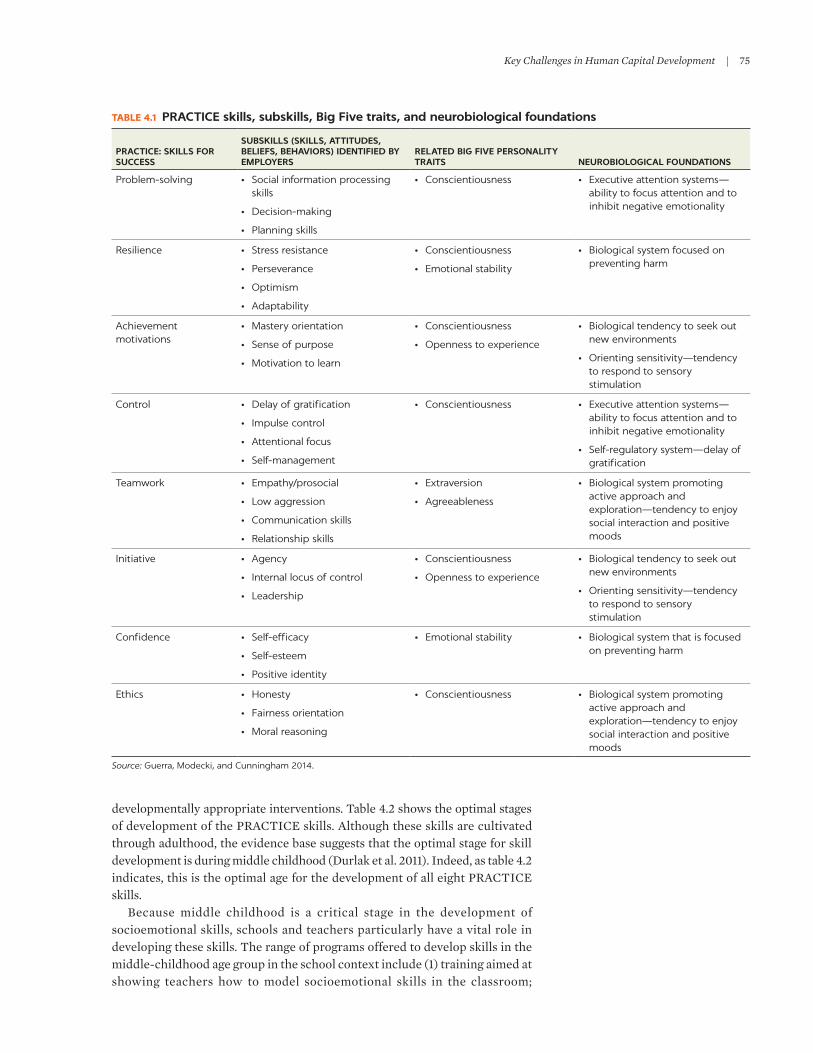
Key Challenges in Human Capital Development | 75
developmentally appropriate interventions. Table 4.2 shows the optimal stages of development of the PRACTiCe skills. Although these skills are cultivated through adulthood, the evidence base suggests that the optimal stage for skill development is during middle childhood (Durlak et al. 2011). indeed, as table 4.2 indicates, this is the optimal age for the development of all eight PRACTiCe skills.
Because middle childhood is a critical stage in the development of socioemotional skills, schools and teachers particularly have a vital role in developing these skills. The range of programs offered to develop skills in the middle-childhood age group in the school context include (1) training aimed at showing teachers how to model socioemotional skills in the classroom;
TABLE 4.1 PRACTICE skills, subskills, Big Five traits, and neurobiological foundations
PRACTICE: SKILLS FOR SUCCESS
SUBSKILLS (SKILLS, ATTITUDES, BELIEFS, BEHAVIORS) IDENTIFIED BY EMPLOYERS
RELATED BIG FIVE PERSONALITY TRAITS NEUROBIOLOGICAL FOUNDATIONS
Problem-solving • Social information processing skills
• Decision-making
• Planning skills
• Conscientiousness • Executive attention systems—ability to focus attention and to inhibit negative emotionality
Resilience • Stress resistance
• Perseverance
• Optimism
• Adaptability
• Conscientiousness
• Emotional stability
• Biological system focused on preventing harm
Achievement motivations
• Mastery orientation
• Sense of purpose
• Motivation to learn
• Conscientiousness
• Openness to experience
• Biological tendency to seek out new environments
• Orienting sensitivity—tendency to respond to sensory stimulation
Control • Delay of gratification
• Impulse control
• Attentional focus
• Self-management
• Conscientiousness • Executive attention systems—ability to focus attention and to inhibit negative emotionality
• Self-regulatory system—delay of gratification
Teamwork • Empathy/prosocial
• Low aggression
• Communication skills
• Relationship skills
• Extraversion
• Agreeableness
• Biological system promoting active approach and exploration—tendency to enjoy social interaction and positive moods
Initiative • Agency
• Internal locus of control
• Leadership
• Conscientiousness
• Openness to experience
• Biological tendency to seek out new environments
• Orienting sensitivity—tendency to respond to sensory stimulation
Confidence • Self-efficacy
• Self-esteem
• Positive identity
• Emotional stability • Biological system that is focused on preventing harm
Ethics • Honesty
• Fairness orientation
• Moral reasoning
• Conscientiousness • Biological system promoting active approach and exploration—tendency to enjoy social interaction and positive moods
Source: Guerra, Modecki, and Cunningham 2014.
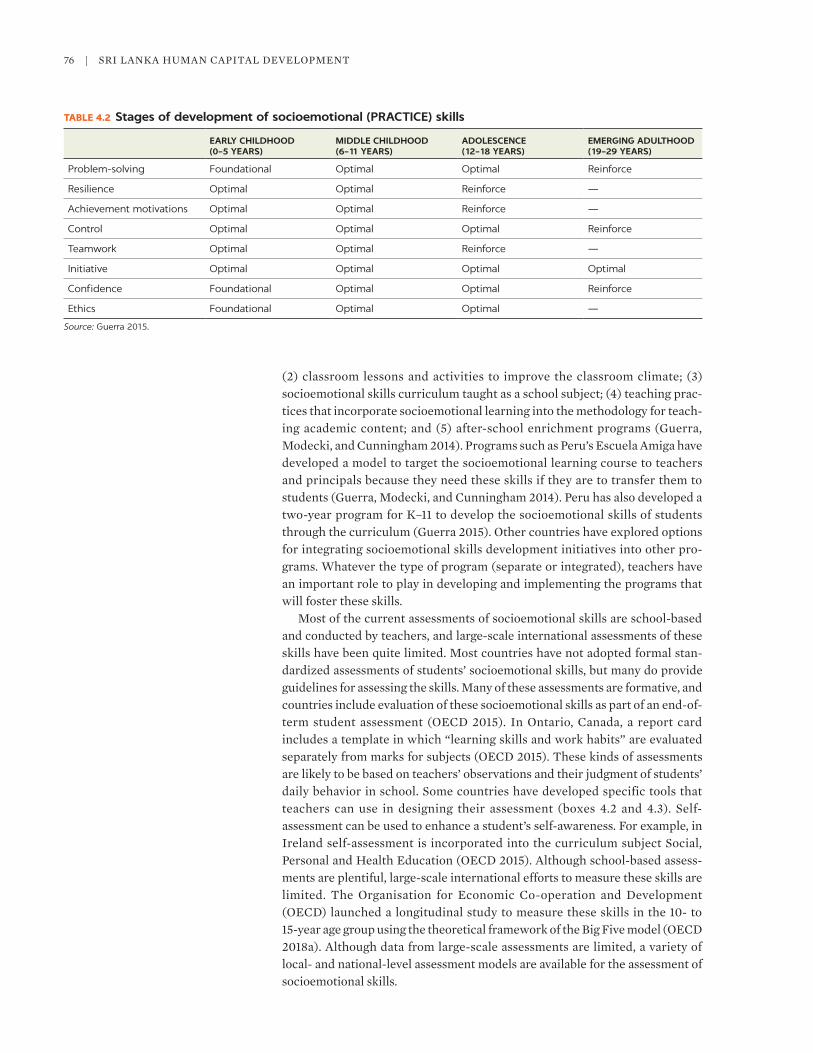
76 | SRi LAnkA HuMAn CAPiTAL DeveLoPMenT
(2) classroom lessons and activities to improve the classroom climate; (3) socioemotional skills curriculum taught as a school subject; (4) teaching prac-tices that incorporate socioemotional learning into the methodology for teach-ing academic content; and (5) after-school enrichment programs (Guerra, Modecki, and Cunningham 2014). Programs such as Peru’s escuela Amiga have developed a model to target the socioemotional learning course to teachers and principals because they need these skills if they are to transfer them to students (Guerra, Modecki, and Cunningham 2014). Peru has also developed a two-year program for k–11 to develop the socioemotional skills of students through the curriculum (Guerra 2015). other countries have explored options for integrating socioemotional skills development initiatives into other pro-grams. Whatever the type of program (separate or integrated), teachers have an important role to play in developing and implementing the programs that will foster these skills.
Most of the current assessments of socioemotional skills are school-based and conducted by teachers, and large-scale international assessments of these skills have been quite limited. Most countries have not adopted formal stan-dardized assessments of students’ socioemotional skills, but many do provide guidelines for assessing the skills. Many of these assessments are formative, and countries include evaluation of these socioemotional skills as part of an end-of-term student assessment (oeCD 2015). in ontario, Canada, a report card includes a template in which “learning skills and work habits” are evaluated separately from marks for subjects (oeCD 2015). These kinds of assessments are likely to be based on teachers’ observations and their judgment of students’ daily behavior in school. Some countries have developed specific tools that teachers can use in designing their assessment (boxes 4.2 and 4.3). Self-assessment can be used to enhance a student’s self-awareness. For example, in ireland self-assessment is incorporated into the curriculum subject Social, Personal and Health education (oeCD 2015). Although school-based assess-ments are plentiful, large-scale international efforts to measure these skills are limited. The organisation for economic Co-operation and Development (oeCD) launched a longitudinal study to measure these skills in the 10- to 15-year age group using the theoretical framework of the Big Five model (oeCD 2018a). Although data from large-scale assessments are limited, a variety of local- and national-level assessment models are available for the assessment of socioemotional skills.
TABLE 4.2 Stages of development of socioemotional (PRACTICE) skills
EARLY CHILDHOOD (0–5 YEARS)
MIDDLE CHILDHOOD (6–11 YEARS)
ADOLESCENCE (12–18 YEARS)
EMERGING ADULTHOOD (19–29 YEARS)
Problem-solving Foundational Optimal Optimal Reinforce
Resilience Optimal Optimal Reinforce —
Achievement motivations Optimal Optimal Reinforce —
Control Optimal Optimal Optimal Reinforce
Teamwork Optimal Optimal Reinforce —
Initiative Optimal Optimal Optimal Optimal
Confidence Foundational Optimal Optimal Reinforce
Ethics Foundational Optimal Optimal —
Source: Guerra 2015.
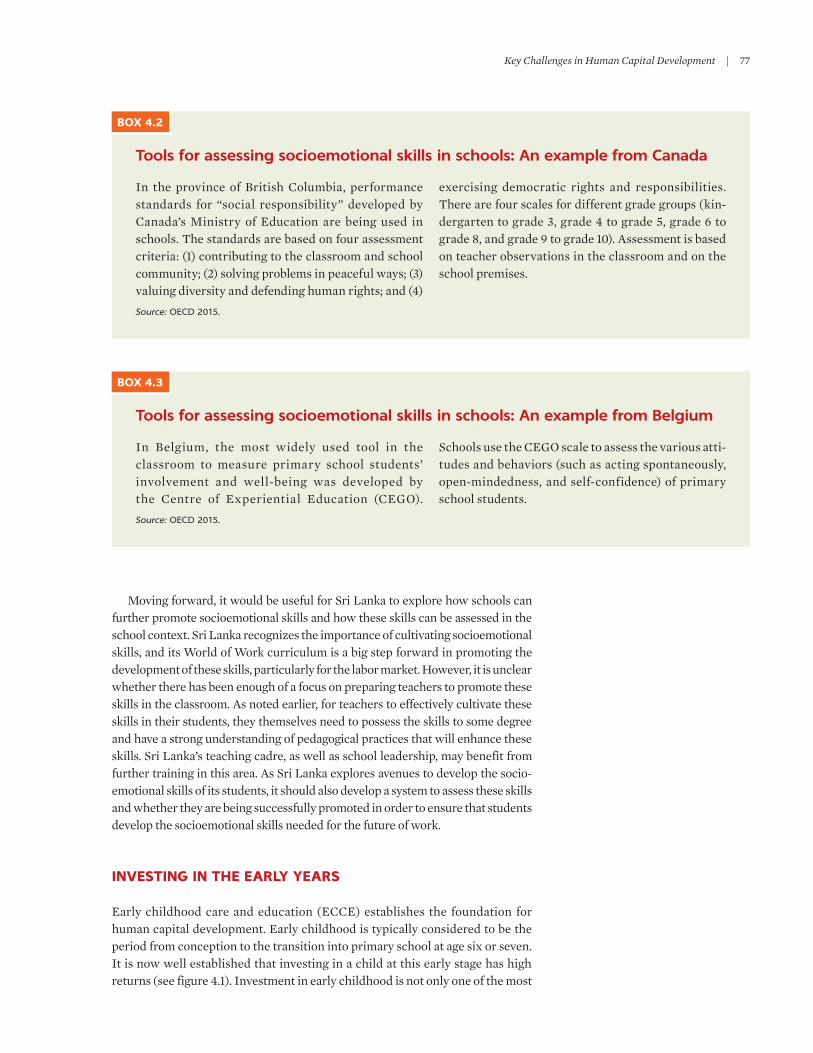
Key Challenges in Human Capital Development | 77
Moving forward, it would be useful for Sri Lanka to explore how schools can further promote socioemotional skills and how these skills can be assessed in the school context. Sri Lanka recognizes the importance of cultivating socioemotional skills, and its World of Work curriculum is a big step forward in promoting the development of these skills, particularly for the labor market. However, it is unclear whether there has been enough of a focus on preparing teachers to promote these skills in the classroom. As noted earlier, for teachers to effectively cultivate these skills in their students, they themselves need to possess the skills to some degree and have a strong understanding of pedagogical practices that will enhance these skills. Sri Lanka’s teaching cadre, as well as school leadership, may benefit from further training in this area. As Sri Lanka explores avenues to develop the socio-emotional skills of its students, it should also develop a system to assess these skills and whether they are being successfully promoted in order to ensure that students develop the socioemotional skills needed for the future of work.
INVESTING IN THE EARLY YEARS
early childhood care and education (eCCe) establishes the foundation for human capital development. early childhood is typically considered to be the period from conception to the transition into primary school at age six or seven. it is now well established that investing in a child at this early stage has high returns (see figure 4.1). investment in early childhood is not only one of the most
Tools for assessing socioemotional skills in schools: An example from Canada
in the province of British Columbia, performance standards for “social responsibility” developed by Canada’s Ministry of education are being used in schools. The standards are based on four assessment criteria: (1) contributing to the classroom and school community; (2) solving problems in peaceful ways; (3) valuing diversity and defending human rights; and (4)
exercising democratic rights and responsibilities. There are four scales for different grade groups (kin-dergarten to grade 3, grade 4 to grade 5, grade 6 to grade 8, and grade 9 to grade 10). Assessment is based on teacher observations in the classroom and on the school premises.
Source: OECD 2015.
BOX 4.2
Tools for assessing socioemotional skills in schools: An example from Belgium
in Belgium, the most widely used tool in the classroom to measure primary school students’ involvement and well-being was developed by the Centre of experiential education (CeGo).
Schools use the CeGo scale to assess the various atti-tudes and behaviors (such as acting spontaneously, open-mindedness, and self-confidence) of primary school students.
Source: OECD 2015.
BOX 4.3
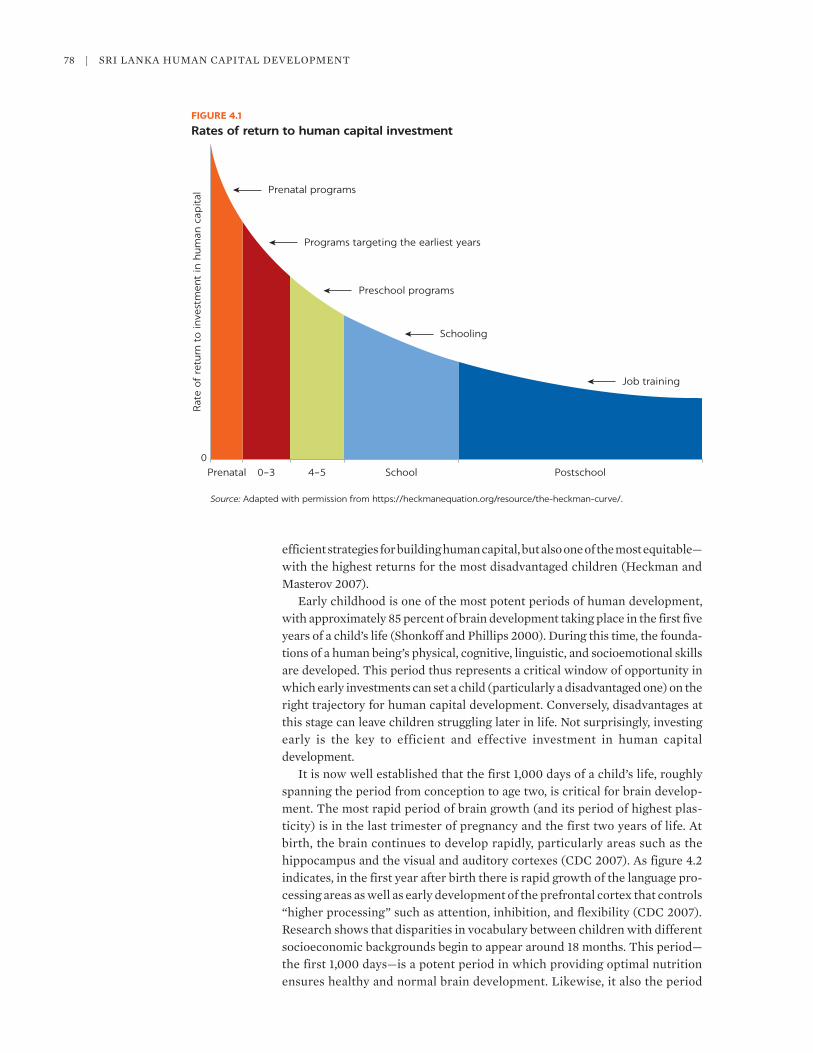
78 | SRi LAnkA HuMAn CAPiTAL DeveLoPMenT
efficient strategies for building human capital, but also one of the most equitable—with the highest returns for the most disadvantaged children (Heckman and Masterov 2007).
early childhood is one of the most potent periods of human development, with approximately 85 percent of brain development taking place in the first five years of a child’s life (Shonkoff and Phillips 2000). During this time, the founda-tions of a human being’s physical, cognitive, linguistic, and socioemotional skills are developed. This period thus represents a critical window of opportunity in which early investments can set a child (particularly a disadvantaged one) on the right trajectory for human capital development. Conversely, disadvantages at this stage can leave children struggling later in life. not surprisingly, investing early is the key to efficient and effective investment in human capital development.
it is now well established that the first 1,000 days of a child’s life, roughly spanning the period from conception to age two, is critical for brain develop-ment. The most rapid period of brain growth (and its period of highest plas-ticity) is in the last trimester of pregnancy and the first two years of life. At birth, the brain continues to develop rapidly, particularly areas such as the hippocampus and the visual and auditory cortexes (CDC 2007). As figure 4.2 indicates, in the first year after birth there is rapid growth of the language pro-cessing areas as well as early development of the prefrontal cortex that controls “higher processing” such as attention, inhibition, and flexibility (CDC 2007). Research shows that disparities in vocabulary between children with different socioeconomic backgrounds begin to appear around 18 months. This period—the first 1,000 days—is a potent period in which providing optimal nutrition ensures healthy and normal brain development. Likewise, it also the period
FIGURE 4.1
Rates of return to human capital investment
Source: Adapted with permission from https://heckmanequation.org/resource/the-heckman-curve/.
Prenatal programs
0
Rat
e of
retu
rn t
o in
vest
men
t in
hum
an c
apit
al
0–3 4–5 School Postschool
Programs targeting the earliest years
Prenatal
Preschool programs
Schooling
Job training
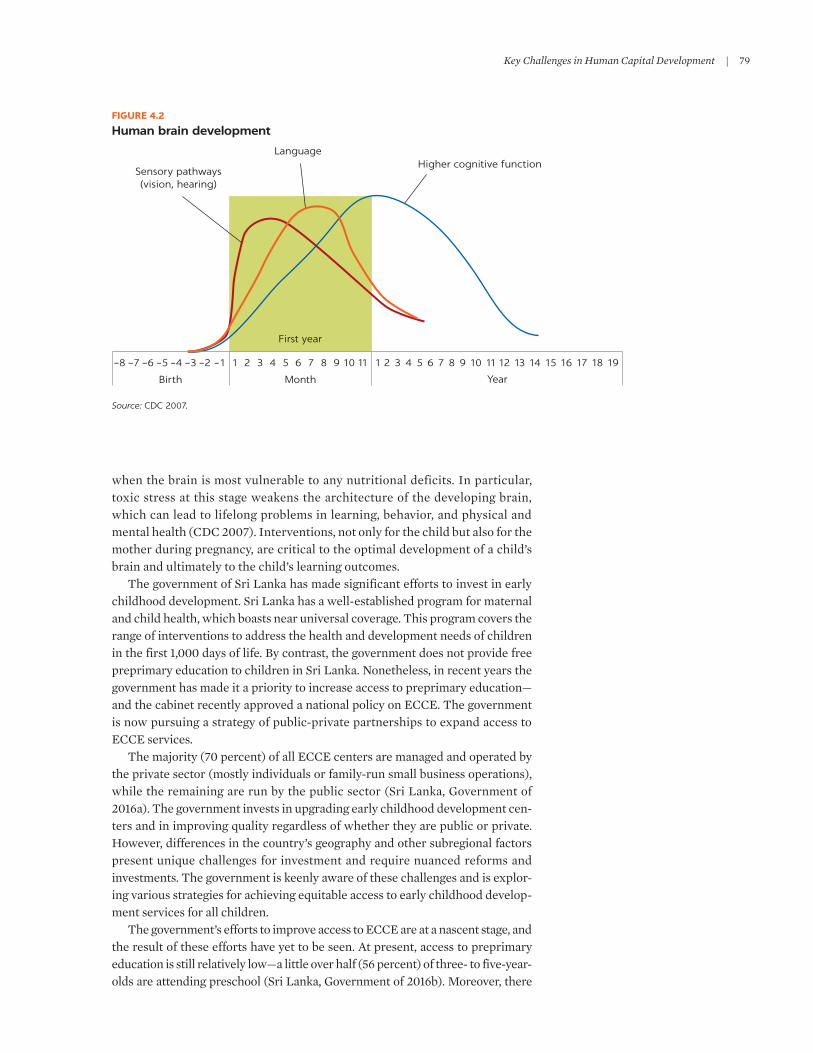
Key Challenges in Human Capital Development | 79
when the brain is most vulnerable to any nutritional deficits. in particular, toxic stress at this stage weakens the architecture of the developing brain, which can lead to lifelong problems in learning, behavior, and physical and mental health (CDC 2007). interventions, not only for the child but also for the mother during pregnancy, are critical to the optimal development of a child’s brain and ultimately to the child’s learning outcomes.
The government of Sri Lanka has made significant efforts to invest in early childhood development. Sri Lanka has a well-established program for maternal and child health, which boasts near universal coverage. This program covers the range of interventions to address the health and development needs of children in the first 1,000 days of life. By contrast, the government does not provide free preprimary education to children in Sri Lanka. nonetheless, in recent years the government has made it a priority to increase access to preprimary education—and the cabinet recently approved a national policy on eCCe. The government is now pursuing a strategy of public-private partnerships to expand access to eCCe services.
The majority (70 percent) of all eCCe centers are managed and operated by the private sector (mostly individuals or family-run small business operations), while the remaining are run by the public sector (Sri Lanka, Government of 2016a). The government invests in upgrading early childhood development cen-ters and in improving quality regardless of whether they are public or private. However, differences in the country’s geography and other subregional factors present unique challenges for investment and require nuanced reforms and investments. The government is keenly aware of these challenges and is explor-ing various strategies for achieving equitable access to early childhood develop-ment services for all children.
The government’s efforts to improve access to eCCe are at a nascent stage, and the result of these efforts have yet to be seen. At present, access to preprimary education is still relatively low—a little over half (56 percent) of three- to five-year-olds are attending preschool (Sri Lanka, Government of 2016b). Moreover, there
FIGURE 4.2
Human brain development
Source: CDC 2007.
First year
Higher cognitive functionLanguage
Sensory pathways(vision, hearing)
Birth
–8 –7 –6 –5 –4 –3 –2 –1 1 2 3 4 5 6 7 8 9 10 11 1 2 3 4 5 6 7 8 9 10 11 12 13 14 15 16 17 18 19
Month Year
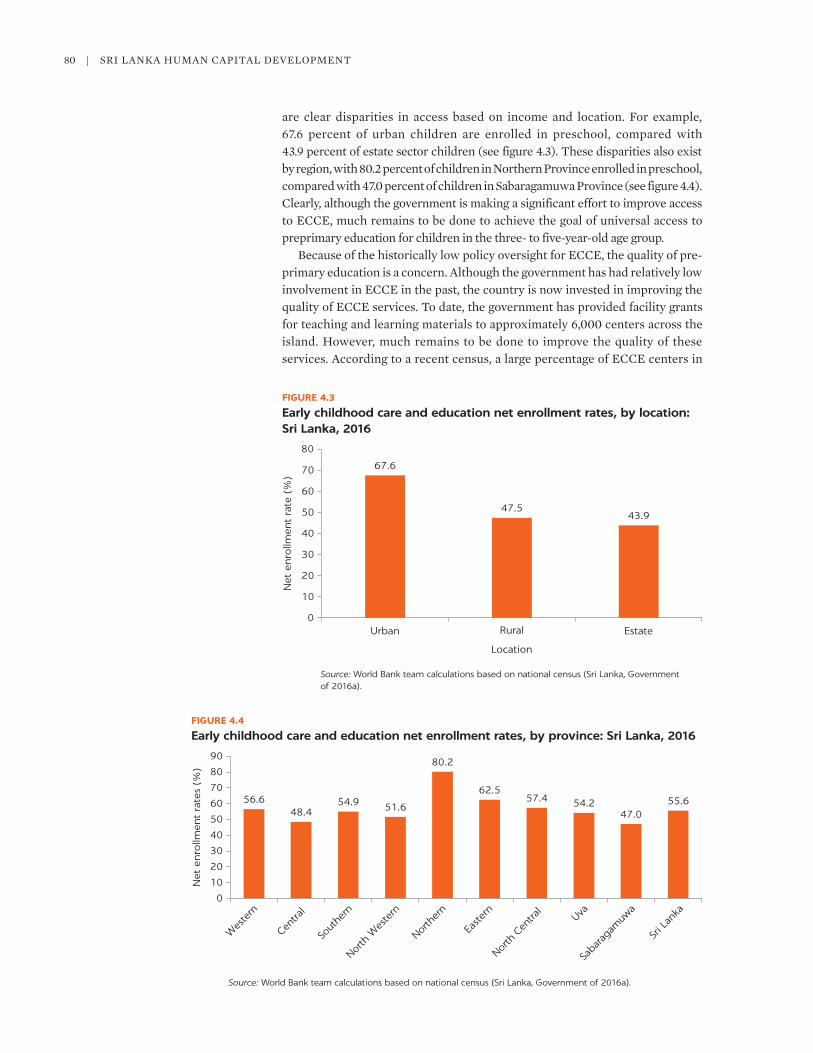
80 | SRi LAnkA HuMAn CAPiTAL DeveLoPMenT
are clear disparities in access based on income and location. For example, 67.6 percent of urban children are enrolled in preschool, compared with 43.9 percent of estate sector children (see figure 4.3). These disparities also exist by region, with 80.2 percent of children in northern Province enrolled in preschool, compared with 47.0 percent of children in Sabaragamuwa Province (see figure 4.4). Clearly, although the government is making a significant effort to improve access to eCCe, much remains to be done to achieve the goal of universal access to preprimary education for children in the three- to five-year-old age group.
Because of the historically low policy oversight for eCCe, the quality of pre-primary education is a concern. Although the government has had relatively low involvement in eCCe in the past, the country is now invested in improving the quality of eCCe services. To date, the government has provided facility grants for teaching and learning materials to approximately 6,000 centers across the island. However, much remains to be done to improve the quality of these services. According to a recent census, a large percentage of eCCe centers in
FIGURE 4.3
Early childhood care and education net enrollment rates, by location: Sri Lanka, 2016
Source: World Bank team calculations based on national census (Sri Lanka, Government of 2016a).
67.6
47.543.9
0
10
20
30
40
50
60
70
80
Urban Rural
Location
Estate
Net
enro
llmen
t ra
te (
%)
FIGURE 4.4
Early childhood care and education net enrollment rates, by province: Sri Lanka, 2016
Source: World Bank team calculations based on national census (Sri Lanka, Government of 2016a).
56.648.4
54.9 51.6
80.2
62.557.4 54.2
47.055.6
0
10
20
30
40
50
60
70
80
90
Wes
tern
Centra
l
Sout
hern
North
Wes
tern
North
ern
Easte
rn
North
Cen
tral
Uva
Saba
raga
muw
a
Sri L
anka
Net
enro
llmen
t ra
tes
(%)
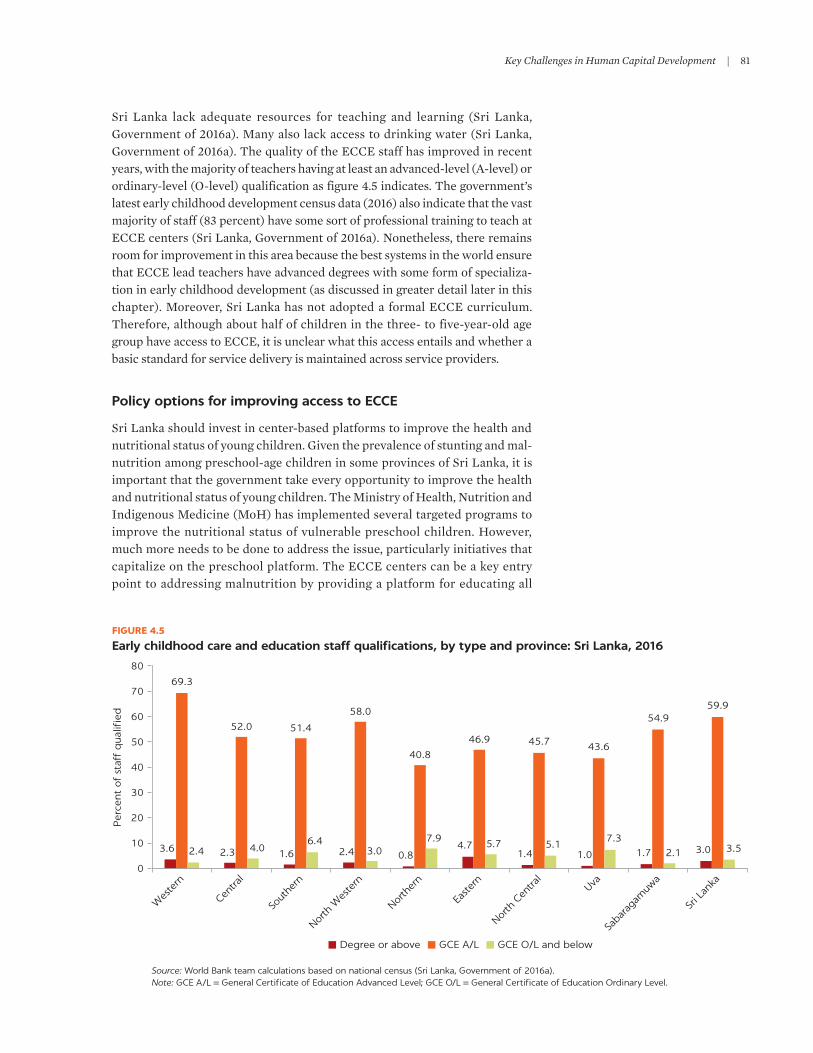
Key Challenges in Human Capital Development | 81
Sri Lanka lack adequate resources for teaching and learning (Sri Lanka, Government of 2016a). Many also lack access to drinking water (Sri Lanka, Government of 2016a). The quality of the eCCe staff has improved in recent years, with the majority of teachers having at least an advanced-level (A-level) or ordinary-level (o-level) qualification as figure 4.5 indicates. The government’s latest early childhood development census data (2016) also indicate that the vast majority of staff (83 percent) have some sort of professional training to teach at eCCe centers (Sri Lanka, Government of 2016a). nonetheless, there remains room for improvement in this area because the best systems in the world ensure that eCCe lead teachers have advanced degrees with some form of specializa-tion in early childhood development (as discussed in greater detail later in this chapter). Moreover, Sri Lanka has not adopted a formal eCCe curriculum. Therefore, although about half of children in the three- to five-year-old age group have access to eCCe, it is unclear what this access entails and whether a basic standard for service delivery is maintained across service providers.
Policy options for improving access to ECCE
Sri Lanka should invest in center-based platforms to improve the health and nutritional status of young children. Given the prevalence of stunting and mal-nutrition among preschool-age children in some provinces of Sri Lanka, it is important that the government take every opportunity to improve the health and nutritional status of young children. The Ministry of Health, nutrition and indigenous Medicine (MoH) has implemented several targeted programs to improve the nutritional status of vulnerable preschool children. However, much more needs to be done to address the issue, particularly initiatives that capitalize on the preschool platform. The eCCe centers can be a key entry point to addressing malnutrition by providing a platform for educating all
FIGURE 4.5
Early childhood care and education staff qualifications, by type and province: Sri Lanka, 2016
Source: World Bank team calculations based on national census (Sri Lanka, Government of 2016a).Note: GCE A/L = General Certificate of Education Advanced Level; GCE O/L = General Certificate of Education Ordinary Level.
3.6 2.3 1.6 2.4 0.84.7
1.4 1.0 1.7 3.0
69.3
52.0 51.4
58.0
40.8
46.9 45.7 43.6
54.959.9
2.4 4.06.4
3.07.9 5.7 5.1
7.32.1 3.5
0
10
20
30
40
50
60
70
80
Wes
tern
Centra
l
Sout
hern
North
Wes
tern
North
ern
Easte
rn
North
Cen
tral
Uva
Saba
raga
muw
a
Sri L
anka
Per
cent
of
staf
f q
ual
ified
Degree or above GCE A/L GCE O/L and below

82 | SRi LAnkA HuMAn CAPiTAL DeveLoPMenT
members of the eCCe community on health and nutrition. Moreover, a modest investment here can help promote significant change in a child’s nutritional status, encourage school attendance, and improve learning among children. To this end, the government may want to explore the possibility of opening kitchen gardens at eCCe centers. Managed by the community (the parent committees), the gardens could provide vegetables, grains, and fruit, among other things, for the meals cooked and served to the children at the eCCe cen-ters. This effort, combined with a nominal contribution from parents toward a revolving nutrition fund (with a declining contribution from the project over the project period) could be a practical, sustainable approach to providing bal-anced cooked meals for children. Moreover, the eCCe centers could also serve as an entry point to educating parents and the community on how to promote the health and nutritional status of young children.
increasing the frequency and quality of stimulation and opportunities for home learning can be a highly cost-effective strategy for improving childhood learning outcomes. The home learning environment and family background have a critical role in children’s development (oeCD 2018c). Research suggests that the home environment has the potential to have a much greater impact on a child’s early learning outcomes than other factors such as parental education and duration of preschool. A study from the united kingdom demonstrates this (see figure 4.6). Moreover, these programs have been shown to have an impact not only on early learning outcomes, but also on longer-term learning outcomes (see figure 4.7). Because center-based programming for children under age three is costly because it requires heavy structural investments such as that needed for lower staff-to-child ratios, programs to build parenting/caregiver capacity may
FIGURE 4.6
Impact of contextual factors on a child’s literacy performance at age five: United Kingdom
Source: Adapted from OECD 2018c.Note: Effect size compares the relative strength of different factors that influence children’s literacy proficiency at age 5. It is expressed in the units of standard deviations where an effect of 0.1 is relatively weak, one of 0.4 is moderately strong, and an effect of 0.7 is strong.
0.6
0.5
0.4
0.3
0.3
0.1
Effe
ct s
ize
0
Qualiy
pre
scho
ol
Gende
r
Birth
weigh
t
Socio
econ
omic
statu
s
Durat
ion
of p
resc
hool
Mot
her’s
edu
catio
n
Home
learn
ing
envir
onm
ent
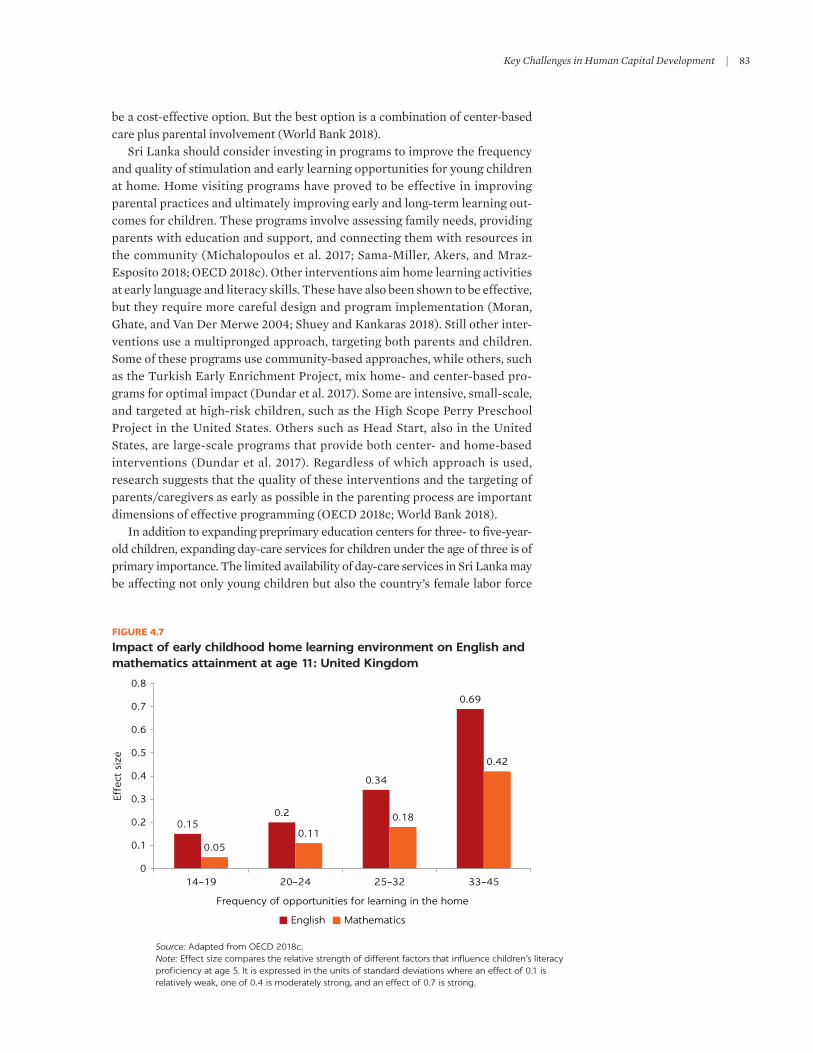
Key Challenges in Human Capital Development | 83
be a cost-effective option. But the best option is a combination of center-based care plus parental involvement (World Bank 2018).
Sri Lanka should consider investing in programs to improve the frequency and quality of stimulation and early learning opportunities for young children at home. Home visiting programs have proved to be effective in improving parental practices and ultimately improving early and long-term learning out-comes for children. These programs involve assessing family needs, providing parents with education and support, and connecting them with resources in the community (Michalopoulos et al. 2017; Sama-Miller, Akers, and Mraz-esposito 2018; oeCD 2018c). other interventions aim home learning activities at early language and literacy skills. These have also been shown to be effective, but they require more careful design and program implementation (Moran, Ghate, and van Der Merwe 2004; Shuey and kankaras 2018). Still other inter-ventions use a multipronged approach, targeting both parents and children. Some of these programs use community-based approaches, while others, such as the Turkish early enrichment Project, mix home- and center-based pro-grams for optimal impact (Dundar et al. 2017). Some are intensive, small-scale, and targeted at high-risk children, such as the High Scope Perry Preschool Project in the united States. others such as Head Start, also in the united States, are large-scale programs that provide both center- and home-based interventions (Dundar et al. 2017). Regardless of which approach is used, research suggests that the quality of these interventions and the targeting of parents/caregivers as early as possible in the parenting process are important dimensions of effective programming (oeCD 2018c; World Bank 2018).
in addition to expanding preprimary education centers for three- to five-year-old children, expanding day-care services for children under the age of three is of primary importance. The limited availability of day-care services in Sri Lanka may be affecting not only young children but also the country’s female labor force
FIGURE 4.7
Impact of early childhood home learning environment on English and mathematics attainment at age 11: United Kingdom
Source: Adapted from OECD 2018c.Note: Effect size compares the relative strength of different factors that influence children’s literacy proficiency at age 5. It is expressed in the units of standard deviations where an effect of 0.1 is relatively weak, one of 0.4 is moderately strong, and an effect of 0.7 is strong.
0.150.2
0.34
0.69
0.050.11
0.18
0.42
0
0.1
0.2
0.3
0.4
0.5
0.6
0.7
0.8
14–19 20–24
Frequency of opportunities for learning in the home
25–32 33–45
English Mathematics
Effe
ct s
ize

84 | SRi LAnkA HuMAn CAPiTAL DeveLoPMenT
participation. Many working mothers find it challenging to continue working once they have children, and so they tend to leave the workforce to stay home and care for their children. This tendency is reflected in the lower female labor force partic-ipation rate (about 36 percent) in Sri Lanka (Solotaroff, Joseph, and kuriakose 2020). The government is keen to increase the female labor force participation rate and has set a target of developing for child day-care centers 10,000 female caregiv-ers who have attained a national vocational Qualifications Level 4 certificate.
in light of the government’s interest in establishing child day-care centers, it will be important for the country to explore the best means of achieving this goal. Many countries have followed an integrated model for eCCe in which both child day-care services (for children under three) and early childhood education (for children between the ages of three and five) are established and managed in an integrated system, often under one government agency or body. Box 4.4 describes
Integrating early childhood day care and early childhood education in Japan
kindergartens and day-care centers emerged as sepa-rate entities in post–World War ii Japan. Demographic changes, coupled with changes in the labor market, shuffled demand between the two, reducing the demand for kindergartens and increasing the demand for day-care centers.
in response to these changes, Japan began taking steps to integrate eCCe, culminating in enactment of the Act on Advancement of Comprehensive Service Related to education, Child Care, etc. of Preschool Children in 2006. This act facilitated the establishment of kodomoen—day care–kindergarten facilities. According to the act, these facilities fell into four main categories: (1) day care–kindergarten collaborations—an authorized kindergarten and an authorized day-care center that collaborate to manage comprehensive operations; (2) kindergarten type—an authorized kin-dergarten with day-care functions; (3) day-care center type—an authorized day-care center with kindergar-ten functions; and (4) local discretion type.
This initial concept of the kodomoen did not yield the expected results. experts reflected on the effort and concluded that
this educational reform has failed to achieve ground-breaking results, and ended up merely adding a third facility to the traditional dual systems despite the enormous efforts that both Ministries had devoted
to the legislation in the Diet session … The reason that the number of this new type of facility shows sluggish growth is that in the end, there is not much support from the government, except for the collab-oration day care–kindergarten type, which receives a small amount of financial aid. There then seems no advantage to changing an existing facility to create a certified kodomoen. Both Ministries are currently making an all-out effort to review the kodomoen system. (Shirakawa 2010)
Further reforms yielded the Act on Child and Childcare Support in 2012, which aimed to resolve some of the issues with the kodomoen system. Further reforms culminated in development of the Comprehensive Support System for Children and Child Rearing, which came into effect in 2015. This system has three primary aims: (1) provide high- quality education and care; (2) eliminate children on waiting lists; and (3) support childcare within the local community.
Today, four main types of facilities provide early childhood services in Japan: kindergartens, day-care centers, eCCe centers, and local childcare facilities. under this system, parents are required to seek approval for the type of facility they would like to use. The eCCe centers provide education and care in the same facility.
Source: Warnasuriya, Sosale, and Dey 2020.
BOX 4.4

Key Challenges in Human Capital Development | 85
the integrated model for childcare and early childhood education developed by Japan. ultimately, Sri Lanka will have to decide whether to expand child day-care services under an integrated model or in a differentiated model.
All eCCe centers should use curricula with common goals and approaches. A strong eCCe curriculum, which cultivates core pre-academic abilities such as emotional security, curiosity, language, and self-regulation, is a core component of effective eCCe programming (World Bank 2018). experts agree that such a curriculum should have a clear purpose, goals, and approaches (Bertrand 2007; oeCD 2013b). A well-defined curriculum can promote better and more consis-tent quality across eCCe centers (oeCD 2013b). Although preschool curricula vary widely, they can be divided into two broad categories. The first, the “global” curriculum, tends to be wider in scope, implementing activities to promote socioemotional, language, literacy, and mathematics skills, as well as subject- specific knowledge of science, the arts, and social studies (Yoshikawa et al. 2013). The other main type, the “developmentally focused” curriculum, aims to focus on a specific content or subject area. This curriculum is based on the assumption that skills can be better fostered if its scope is narrower (Yoshikawa et al. 2013). Although curriculum approaches may vary, experts generally agree that a high-quality curriculum is based on early learning standards that address multi-ple domains of development—academic, socioemotional, and physical. They also emphasize the importance of guided learning opportunities that are lan-guage-rich and hands-on (Wechsler et al. 2016). Moving forward, it is important that Sri Lanka review its eCCe curriculum to ensure that the content and quality are in line with international best practices.
Sri Lanka must also continue to focus on improving the quality of its eCCe workforce. Teacher quality is one of the most vital elements in determining the effectiveness of early education programs. A high-quality curriculum must be well implemented if it is to be effective, and strong implementation requires high-quality teachers. Research suggests that teachers with special knowledge of early childhood development are particularly important to the implementa-tion of successful eCCe programming (Bueno, Darling-Hammond, and Gonzales 2010). Many successful eCCe programs, such as those in the united States, require their lead teachers to have a bachelor’s degree with a specialization in early childhood education (Bueno, Darling-Hammond, and Gonzales 2010; Wechsler et al. 2016). Many studies suggest that a higher level of education is generally associated with higher pedagogic quality in eCCe (oeCD 2012). nonetheless, the relationship between qualification and eCCe outcomes is complex, and it is not entirely clear that a degree or a high level of specialization in early childhood development is a prerequisite for a high-quality eCCe teacher (oeCD 2012). What is clear, however, is that teachers with specialized training are able to provide a more nurturing, interactive environment for children (Bueno, Darling-Hammond, and Gonzales 2010).
The government recognizes the importance of the quality of the eCCe work-force, and to this end it has initiated a range of short-term programs to improve the quality of eCCe teachers. Programs include providing professional training (that is, diploma/certificate training) in estate and nonestate areas, in partner-ship with the open university of Sri Lanka and the national institute of education (nie). However, in the long term the country will have to focus on improving its strategy for recruiting and retaining high-quality teachers, partic-ularly those with degrees or specializations in early childhood development, to raise the bar of eCCe teacher quality in Sri Lanka.
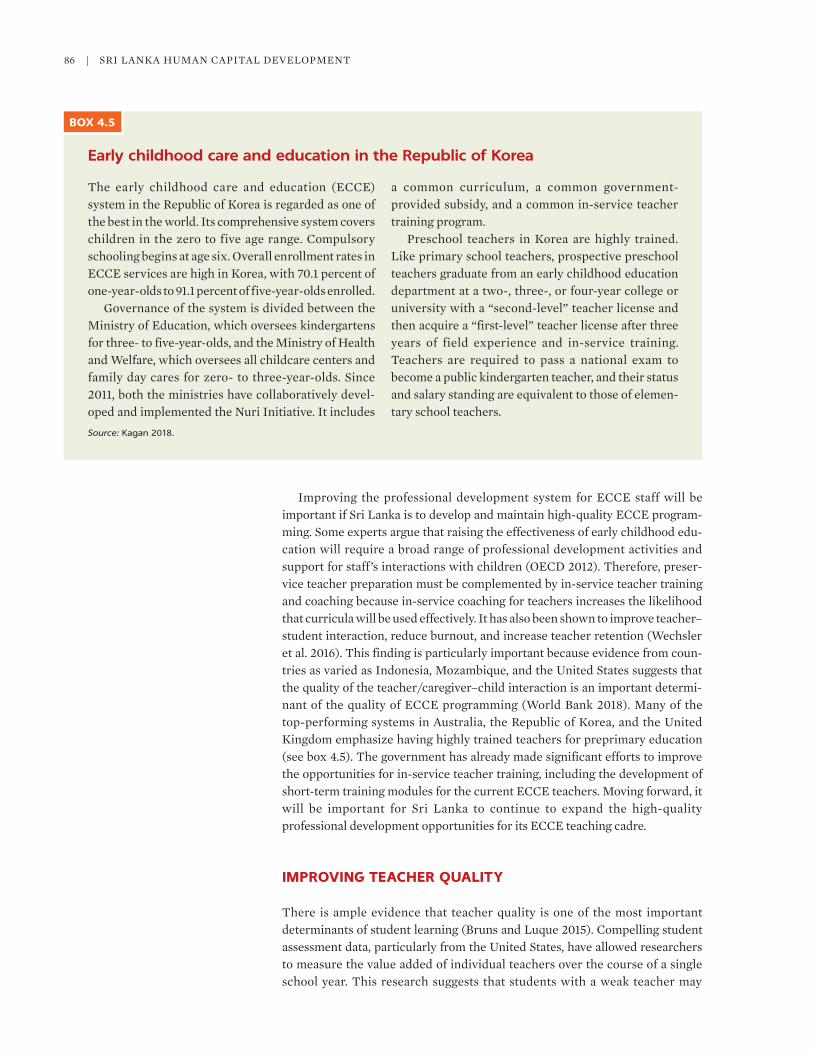
86 | SRi LAnkA HuMAn CAPiTAL DeveLoPMenT
improving the professional development system for eCCe staff will be important if Sri Lanka is to develop and maintain high-quality eCCe program-ming. Some experts argue that raising the effectiveness of early childhood edu-cation will require a broad range of professional development activities and support for staff’s interactions with children (oeCD 2012). Therefore, preser-vice teacher preparation must be complemented by in-service teacher training and coaching because in-service coaching for teachers increases the likelihood that curricula will be used effectively. it has also been shown to improve teacher–student interaction, reduce burnout, and increase teacher retention (Wechsler et al. 2016). This finding is particularly important because evidence from coun-tries as varied as indonesia, Mozambique, and the united States suggests that the quality of the teacher/caregiver–child interaction is an important determi-nant of the quality of eCCe programming (World Bank 2018). Many of the top-performing systems in Australia, the Republic of korea, and the united kingdom emphasize having highly trained teachers for preprimary education (see box 4.5). The government has already made significant efforts to improve the opportunities for in-service teacher training, including the development of short-term training modules for the current eCCe teachers. Moving forward, it will be important for Sri Lanka to continue to expand the high-quality professional development opportunities for its eCCe teaching cadre.
IMPROVING TEACHER QUALITY
There is ample evidence that teacher quality is one of the most important determinants of student learning (Bruns and Luque 2015). Compelling student assessment data, particularly from the united States, have allowed researchers to measure the value added of individual teachers over the course of a single school year. This research suggests that students with a weak teacher may
Early childhood care and education in the Republic of Korea
The early childhood care and education (eCCe) system in the Republic of korea is regarded as one of the best in the world. its comprehensive system covers children in the zero to five age range. Compulsory schooling begins at age six. overall enrollment rates in eCCe services are high in korea, with 70.1 percent of one-year-olds to 91.1 percent of five-year-olds enrolled.
Governance of the system is divided between the Ministry of education, which oversees kindergartens for three- to five-year-olds, and the Ministry of Health and Welfare, which oversees all childcare centers and family day cares for zero- to three-year-olds. Since 2011, both the ministries have collaboratively devel-oped and implemented the nuri initiative. it includes
a common curriculum, a common government- provided subsidy, and a common in-service teacher training program.
Preschool teachers in korea are highly trained. Like primary school teachers, prospective preschool teachers graduate from an early childhood education department at a two-, three-, or four-year college or university with a “second-level” teacher license and then acquire a “first-level” teacher license after three years of field experience and in-service training. Teachers are required to pass a national exam to become a public kindergarten teacher, and their status and salary standing are equivalent to those of elemen-tary school teachers.
Source: Kagan 2018.
BOX 4.5

Key Challenges in Human Capital Development | 87
master about 50 percent or less of the curriculum for that grade, whereas stu-dents with a good teacher gain an average of one grade level, and students with great teachers advance one and a half grade levels or more (Hanushek and Rivkin 2010; Rockoff 2004). other research shows students who are exposed to highly effective teachers who add value to teaching are more likely to attend college and earn a higher income (Chetty, Friedman, and Rockoff 2014). Moreover, replacing a teacher whose value added is in the bottom 5 percent with an average teacher increases the present value of students’ lifetime income by some uS$250,000 per classroom. no other single factor in the education system has such an impact on learning (Bruns and Luque 2015).
The teacher management system has made strides, but challenges that may affect the quality of the country’s teacher cadre remain. About 242,000 teachers are serving in Sri Lanka’s network of government schools (Sri Lanka, Moe 2017). in terms of teacher qualifications, approximately 98 percent of these teachers are either trained teachers or graduates (see table 4.3 for definitions of these qualifications and for a more detailed picture of teacher qualifications across the country’s nine provinces). The Ministry of education (Moe) and the provinces are responsible for recruiting and managing this cadre. The system includes a network of preservice teacher training institutions (national Colleges of education), in-service teacher development programs conducted by the nie of Sri Lanka, and school-based teacher development programs. in terms of teacher compensation, the current pay level for public school teachers appears to be low relative to that of other countries in South and Southeast Asia (Raju 2017). The pay level also appears compressed relative to that of other countries (Aturupane et al. 2011).
The system for teacher deployment is a particular challenge. Although the 2017 school census suggests that government schools in Sri Lanka have an ade-quate number of teachers, many schools do not have the right mix of teachers (Dundar et al. 2017). Rural and estate sector schools, in particular, find it chal-lenging to attract and retain teachers in key subject areas such as english, math-ematics, and science (Aturupane et al. 2011). Moreover, although there is a system
TABLE 4.3 Teacher qualification, by province: Sri Lanka, 2017
PROVINCE GRADUATE TRAINED UNTRAINED TRAINEE OTHER TOTAL
Western 24,263 20,103 261 50 148 45,825
Central 13,548 19,424 690 352 44 34,058
Southern 13,614 16,252 285 113 32 30,296
Northern 7,258 10,482 91 6 104 17,941
Eastern 7,631 13,843 242 50 44 21,810
North Western 12,251 15,345 515 73 55 28,239
North Central 7,597 9,542 186 46 69 17,440
Uva 7,949 11,658 664 478 94 20,843
Sabaragamuwa 11,645 12,989 377 125 3 25,139
National 106,756 129,638 3,311 1, 293 593 241,591
Percent of total 44.20 53.70 1.40 0.54 0.25 100.00
Source: Sri Lanka, MoE 2017. Note: Graduates have an undergraduate or postgraduate degree or a teaching diploma, or they are trained graduates. Trained teachers have received teacher training certificates from the National Colleges of Education or have a two-year diploma in science and mathematics.

88 | SRi LAnkA HuMAn CAPiTAL DeveLoPMenT
in place for recruitment of teachers, the rules guiding this process have been relaxed at various points in time to address either the needs in disadvantaged areas or the need for political expediency. in some cases, this approach has affected the quality of teachers or led to over-recruitment in certain subjects and under-recruitment in others such as science, math, english, and computer liter-acy (Balasooriya 2012; Dundar et al. 2017; Pillay et al. 2015). The country also faces a shortage of english, mathematics, and science teachers with a General Certificate of education Advanced Level (GCe A/L), which is partly due to low teacher salaries. overall, the system for recruiting, developing, compensating, evaluating, and promoting teachers in Sri Lanka does not appear to be as well developed as it is in most high-performing countries. in effect, although Sri Lanka has a system in place for teacher management, there are systemic gaps that may undermine the quality of its teaching cadre.
Policy options for improving teacher quality in Sri Lanka
Investing in high-quality teacher training To improve teacher quality, Sri Lanka should pay closer attention to the quality of preservice teacher training programs. The performance of teachers depends on a variety of factors, beginning with the quality of their preservice training (Little, Aturupane, and Shojo 2013). A three-level model of teacher competen-cies is presented in figure 4.8: (1) preservice teacher education, (2) teacher induction, and (3) professional development. A well-structured preservice teacher training program (TTP) with strong coursework and a strong practical component is vital for developing a high-quality teacher cadre (uneSCo 2018).
experts agree that high-quality TTPs share a set of common objectives, with perhaps the most critical being the development of subject matter knowledge for teachers (Lim et al. 2009). This is important because substantial evidence indi-cates that the subject knowledge of teachers has an impact on student perfor-mance (Bramwell, Anderson, and Mundy 2014; uneSCo 2013). The best preservice programs also emphasize “pedagogical content knowledge,” which deals with the question of “how to organize and present the content in a way that makes it accessible for a diverse group of learners” (uneSCo 2018). Another key feature of strong TTPs is that they effectively connect pedagogical theory and practice. Singapore has created an effective model of collaboration between teacher educational institutions and schools to bridge this gap between theory and practice (see box 4.6). Finally, TTPs increasingly have a role in developing the tools to study teaching (Lim et al. 2009). This finding is particularly salient because many of today’s high-performing systems are aiming to develop a cadre of teachers who view themselves as professionals with agency, reflective capac-ities, and a role to play in shaping educational reform (Schleicher 2011). it will be important for Sri Lanka to review the quality of its preservice TTPs and improve them in line with best practices in preservice teacher development.
ongoing professional development has proved to be an effective tool for improving teacher quality and ultimately student learning. There is a growing body of evidence that in-service teacher training is an effective tool for improving teacher quality. Moreover, there is conclusive evidence that continual in- service professional development programs have a positive impact on student learning as demonstrated by programs in Africa, india, and the united States (Banerjee et al. 2007; Conn 2017; Yoon et al. 2007). The continual professional development of teachers is important. in a rapidly changing world, professional development
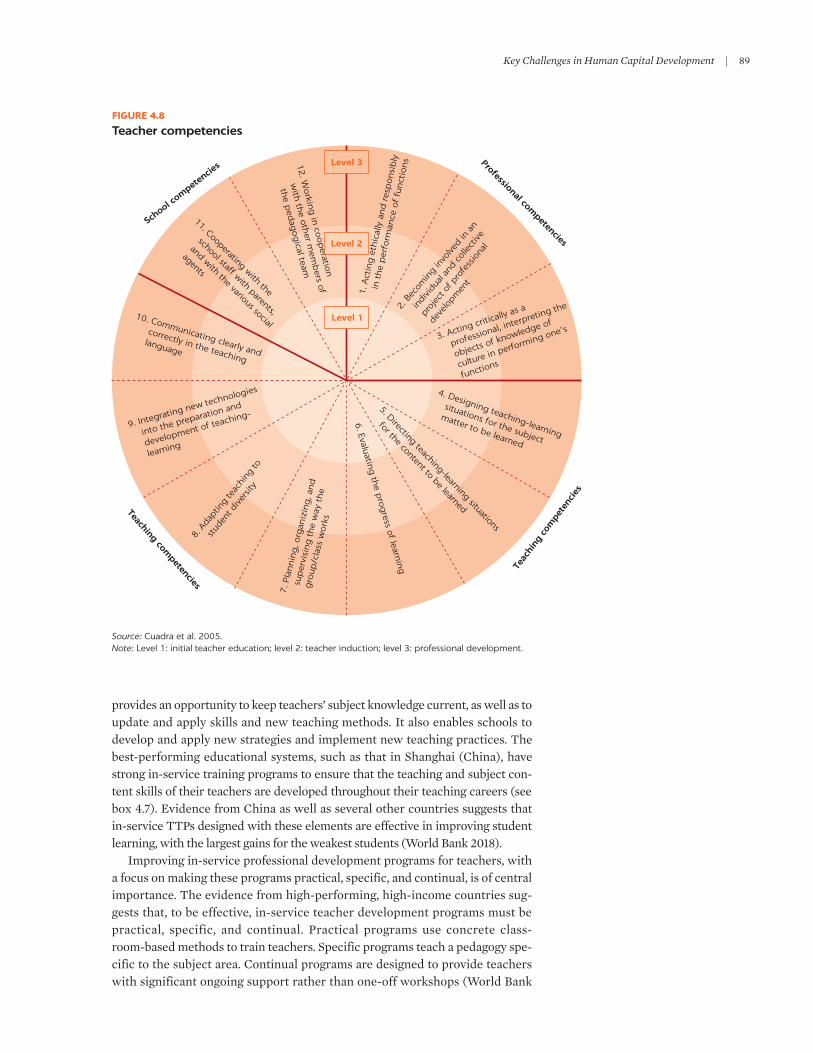
Key Challenges in Human Capital Development | 89
provides an opportunity to keep teachers’ subject knowledge current, as well as to update and apply skills and new teaching methods. it also enables schools to develop and apply new strategies and implement new teaching practices. The best-performing educational systems, such as that in Shanghai (China), have strong in-service training programs to ensure that the teaching and subject con-tent skills of their teachers are developed throughout their teaching careers (see box 4.7). evidence from China as well as several other countries suggests that in-service TTPs designed with these elements are effective in improving student learning, with the largest gains for the weakest students (World Bank 2018).
improving in-service professional development programs for teachers, with a focus on making these programs practical, specific, and continual, is of central importance. The evidence from high-performing, high-income countries sug-gests that, to be effective, in-service teacher development programs must be practical, specific, and continual. Practical programs use concrete class-room-based methods to train teachers. Specific programs teach a pedagogy spe-cific to the subject area. Continual programs are designed to provide teachers with significant ongoing support rather than one-off workshops (World Bank
FIGURE 4.8
Teacher competencies
Source: Cuadra et al. 2005.Note: Level 1: initial teacher education; level 2: teacher induction; level 3: professional development.
School c
ompeten
cies
Teaching competencies
Teac
hing
com
pete
ncie
s
Professional competencies
2. B
ecom
ing
invo
lved
in a
n
in
divid
ual a
nd col
lect
ive
p
roje
ct o
f pro
fess
iona
l
d
evelop
men
t
3. Acting critically as a
professional, interpreting the
objects of knowledge of
culture in performing one’s
functions
4. Designing teaching-learning
situations for the subject
matter to be learned5. Directing teaching-learning situations
for the content to be learned
6. Evaluating
the p
rogress of learning
7. P
lannin
g, o
rgan
izin
g, a
nd
su
per
visi
ng t
he
way
the
gro
up/c
lass
wor
ks
8. A
dapt
ing
teac
hing
to
st
uden
t diver
sity
9. Integrating new technologies
into the preparation and
development of teaching-
learning
10. Communicating clearly and
correctly in the teaching
language
11. Cooperating with the
school staff with parents,
and with the various social
agents
12. W
orking in
cooperation
with
the oth
er mem
bers of
the p
edag
ogical team
Level 1
Level 2
Level 3
1. A
ctin
g e
thic
ally
and
res
ponsi
bly
in
the
per
form
ance
of
funct
ions
90 | SRi LAnkA HuMAn CAPiTAL DeveLoPMenT
2018). effective programs are ones in which trainers can observe teachers in the classroom, provide individual feedback and pedagogical support, and offer ongoing individual mentoring to teachers. in other words, to be effective, in- service teacher training must be individually targeted and repeated, with fol-low-up coaching around specific pedagogical techniques (World Bank 2018). Sri Lanka should evaluate its in-service teacher training to ensure it fulfills these guidelines, thereby improving not only teacher quality but ultimately student learning as well.
Developing platforms to foster professional collaboration can further strengthen continual professional development. in the recent past, Sri Lanka has made progress in improving its in-service teacher development programs, particularly with the introduction of school-based professional teacher devel-opment (SBPTD) across all schools (Aturupane, kellaghan, and Shojo 2013). However, SBPTD in Sri Lanka needs to be further improved, especially teacher collaboration for professional development. The research on teacher collabo-ration is unequivocal. A review of the empirical evidence suggests that well-developed teacher collaboration is positively linked to increased teacher effectiveness and has a positive impact on student achievement (vescio, Ross, and Adams 2008). However, fostering effective teacher collaboration requires proper planning and implementation. Sri Lanka will need to examine the
Singapore’s partnership model of teacher education
Like many of the world’s high-performing providers of teacher education, Singapore’s national institute of education (nie) has embraced a university-based model characterized by classroom-based courses and a school-based practicum. During the practicum, student teachers are mentored and guided by their School Coordinating Mentors, Cooperating Teachers, and nie Supervisors through systematic observa-tions, assistance, and advice. They are given opportu-nities to actively participate in all aspects of the school’s activities. These experiences are designed to help them link theory and practice and to acquire the skills necessary for teaching effectively in a range of classroom situations. The school-based practicum is an example of the partnership that Singapore’s nie shares with Singapore’s Ministry of education (Moe), schools, and all stakeholders, working together to help student teachers make effective transitions from campus learning to classroom teach-ing. The robust partnership among Singapore’s nie, Moe, and schools is a key driver of the country’s
internationally recognized teacher education programs.
To strengthen the relationship along the whole continuum and reinforce the theory–practice nexus, Singapore’s nie has adopted an enhanced Partnership Model. The model provides the necessary collabora-tive framework of shared values and goals in the interest of teacher learning and education research, while recognizing the need for mutual respect for each partner’s roles, beliefs, perspectives, experi-ences, expertise, and knowledge. The nie–schools partnership is particularly important to reinforcing the theory–practice nexus. The gap between theory and practice has been widely acknowledged as one of the main shortcomings of teacher education world-wide. in the enhanced Partnership Model, schools take on a bigger, more active role in the practicum, school attachments, and other in situ collaborative platforms that facilitate professional development and bridge the gap between theoretical learning and real classroom experience.
Source: Singapore National Institute of Education, https://nie.edu.sg/, accessed July 1, 2019.
BOX 4.6

Key Challenges in Human Capital Development | 91
many different avenues to fostering such collaboration and adopt those that best suit it.
Specifically, Sri Lanka may want to consider peer coaching as a means of pro-moting professional collaboration and keeping teachers motivated. Peer coach-ing and mentoring are particularly important for new teachers, and in the first year they give teachers an opportunity to learn how to translate their theoretical education into good classroom practice (Schleicher 2016). Strong evidence sug-gests that induction support for beginning teachers has a positive influence on teacher commitment and retention, as well as on student achievement (ingersoll and Strong 2011; Wei et al. 2009). More important, research indicates that stu-dents taught by teachers who had strong induction support show higher achieve-ment than students taught by teachers who had not received such support (Glazerman et al. 2010; Schleicher 2016). Research also suggests that there is a positive association between teachers’ participation in induction programs and their likelihood of participation in future professional collaboration. Thus teach-ers who have received peer mentoring during their induction phase may be more willing to serve as peer mentors in the future (Schleicher 2016). Sri Lanka may want to focus on expanding its in-service teacher programming to include a peer mentoring induction program for new teachers. Such programming may not only strengthen teacher quality but also could mitigate the challenge of teacher shortages caused by teacher attrition.
The development of intentional, well-designed professional learning com-munities (PLCs) could further enhance SBPTD programs. PLCs are increasingly recognized as an effective means of promoting teacher development and
School-based professional development in China
in China, teachers’ school-based development is a high priority. The Shanghai Municipal education Commission states: “School shall become the basis of teachers’ professional development. Schools shall integrate the employment and use of teachers with the fostering of teachers and make the school a place for common growth of teachers and students and become a learning organization” (Shanghai Municipal education Commission 2007). According to the com-mission, the most important task of a headmaster is building a teaching team. The importance of school-based teacher training is reflected in regulations of the Shanghai Municipal education Commission that stipulate that up to 50 percent of a teacher’s required training hours should come through in-school train-ing. At least three types of school-based professional development groups operate in the school system:
teaching and research groups (TRGs), lesson prepara-tion groups (LPGs), and grade groups (GGs). TRGs are composed of teachers who teach the same or similar subjects. They discuss problems they encounter in teaching a particular subject and share their experi-ences. Schools usually also have GGs. These are groups of teachers of the same grade who gather to communi-cate. TRG activities typically include preparing les-sons, sitting in on and evaluating colleagues’ classes, sharing educational experiences, discussing teaching problems, conducting research, and learning new teaching technologies and skills. each of these groups meet quite regularly—as a survey of junior secondary school principals in Shanghai indicates, school-based professional development activities are organized once a week in 44 percent of schools and twice a week in 52 percent of schools.
Source: Zhang, Ding, and Xu 2016.
BOX 4.7

92 | SRi LAnkA HuMAn CAPiTAL DeveLoPMenT
improving student achievement (Carroll, Fulton, and Doerr 2010; vescio, Ross, and Adams 2008.) PLCs have been defined as schoolwide communities “aimed at continuous improvement of teaching practices by involving staff in in-depth, systematic, collaborative activities of professional development at the school level” (oeCD 2013a). They can be organized by grade level, by specific subject, or around particular interdisciplinary issues (Pirtle and Tobia 2014). The frame-work for PLCs developed by the Australian Council for educational Research (ACeR) identifies five domains characteristic of a strong PLC. The first two domains are “a professional culture” and “leadership.” A strong professional cul-ture with strong school leadership is a necessary condition for developing strong PLCs—PLCs do not necessarily develop organically, and they must be designed and fostered in a culture of professionalism (ACeR 2019). The third domain is “student engagement, learning and well-being.” This means that professional communities give high priority to collecting evidence on student outcomes with a view toward planning effectively to enhance student learning (ACeR 2019). The fourth domain is “improving professional knowledge and practice.” This means that professional communities are focused on building their capacity to teach well. And the fifth domain is “performance and development.” This means that teachers in a professional community are willing to submit to a periodic performance review and engage with the necessary support to improve their practice (ACeR 2019). Sri Lanka may want to consider instituting a framework for PLCs to further enhance its SBPTD.
Preparing teachers for the future of educationTeachers need to be able to adopt pedagogical approaches that are relevant to the future of education. As educational systems adapt to the rapidly changing world, the practice of teaching must also adapt to address the unique needs and opportunities of current and future students. experts agree on two key pedagog-ical approaches that will define education in the future. The first aims to strike the right balance between competency-based learning and knowledge-based learning (Schleicher 2011). in recent years, the education pendulum has swung between these two theoretical approaches. experts increasingly agree that high-quality education of the future will be able to deliver the right balance between competency-based learning and knowledge-based learning (see figure 4.9). Teachers will require robust training in the right pedagogical approach to effectively deliver knowledge while simultaneously fostering the right competencies.
The second pedagogical approach involves “active learning.” Active learning can be defined as any teaching method that involves students actively participat-ing in and interacting with the learning process. There is growing evidence that active learning is associated with higher academic achievement and the devel-opment of higher-order skills (Freeman et al. 2004). education experts expect this approach to become increasingly important in the future, particularly as educational systems seek to foster higher-order thinking skills (oeCD 2018a). Although many educational systems have attempted to foster active learning in their pedagogy, only a few have successfully used it. Sri Lanka should review its teacher preparation programs to ensure that teachers are adequately prepared to use these pedagogical approaches to help students improve their learning.
Finally, Sri Lanka must ensure that its teachers are prepared for the challenge of integrating technology into teaching and learning. As covered in more detail later in this chapter, technology is an inevitable force in the modern world, and
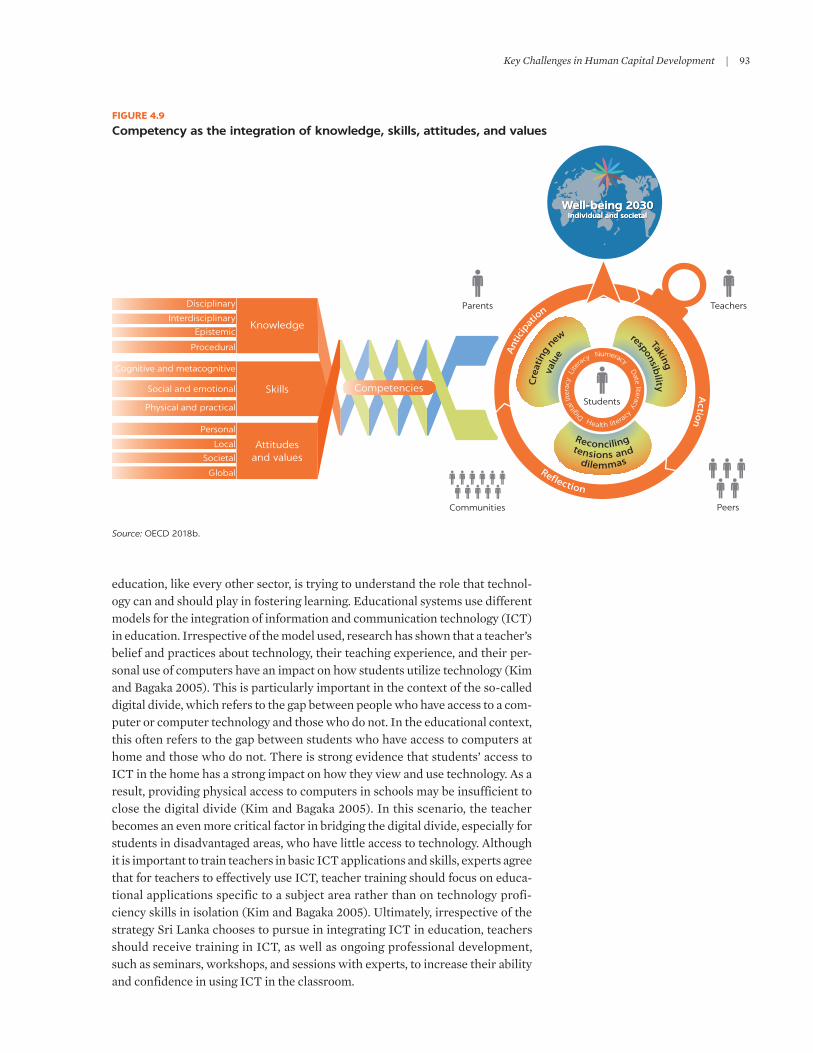
Key Challenges in Human Capital Development | 93
education, like every other sector, is trying to understand the role that technol-ogy can and should play in fostering learning. Educational systems use different models for the integration of information and communication technology (ICT) in education. Irrespective of the model used, research has shown that a teacher’s belief and practices about technology, their teaching experience, and their per-sonal use of computers have an impact on how students utilize technology (Kim and Bagaka 2005). This is particularly important in the context of the so-called digital divide, which refers to the gap between people who have access to a com-puter or computer technology and those who do not. In the educational context, this often refers to the gap between students who have access to computers at home and those who do not. There is strong evidence that students’ access to ICT in the home has a strong impact on how they view and use technology. As a result, providing physical access to computers in schools may be insufficient to close the digital divide (Kim and Bagaka 2005). In this scenario, the teacher becomes an even more critical factor in bridging the digital divide, especially for students in disadvantaged areas, who have little access to technology. Although it is important to train teachers in basic ICT applications and skills, experts agree that for teachers to effectively use ICT, teacher training should focus on educa-tional applications specific to a subject area rather than on technology profi-ciency skills in isolation (Kim and Bagaka 2005). Ultimately, irrespective of the strategy Sri Lanka chooses to pursue in integrating ICT in education, teachers should receive training in ICT, as well as ongoing professional development, such as seminars, workshops, and sessions with experts, to increase their ability and confidence in using ICT in the classroom.
FIGURE 4.9
Competency as the integration of knowledge, skills, attitudes, and values
Source: OECD 2018b.
Disciplinary
Interdisciplinary
Epistemic
Procedural
Cognitive and metacognitive
Social and emotional
Physical and practical
Personal
Local
Societal
Global
Knowledge
Skills
Attitudesand values
Parents Teachers
Communities Peers
CompetenciesStudents
Digita
l lite
racy
Health literac
y
Date literacy
Numeracy
Lite
racy
Ant
icip
ation
A
ction
Well-being 2030Individual and societal
Well-being 2030Individual and societal
Well-being 2030Individual and societal
Reconciling
Taking
responsibilityC
reat
ing
new
valu
e
tensions and dilemmas
Reflection

94 | SRi LAnkA HuMAn CAPiTAL DeveLoPMenT
Training teachers in assessmentin Sri Lanka, teachers must be prepared to use assessments to ensure that all students are learning at high levels—a common feature of today’s top- performing educational systems (Schleicher 2011). effective teachers know how to integrate assessments into teaching so they are teaching at the level of students (World Bank 2018). This approach is especially important when the abilities of students vary. Formative assessments, in particular, can provide teachers with continual feedback on what students are learning, and so can be used in turn to guide the instructional process. To use formative assessments to guide the instructional process, teachers must first be trained in how to develop, interpret, and use the feedback in the instructional process. Top-performing systems include assess-ments (as a subject) in TTPs and provide guidance and monitoring on their use (Crawford, Hasan, and Bentaouet kattan 2018). in Singapore, for example, teacher assessment practices were first carefully studied, and a two-year profes-sional teacher development program was designed to support teachers to use assessments in the instructional process (Ho 2012). Assessments can be a pow-erful diagnostic tool in supporting the teaching and learning processes. However, to use them effectively, teachers in Sri Lanka will need to be trained in developing, integrating, and evaluating the results of these assessments to improve student learning.
Reinforcing the system for teacher managementResearch has repeatedly confirmed that it is not sufficient for teachers to be able to integrate and use assessments (Aaronson, Barrow, and Sander 2007; Duflo et al. 2014; Muralidharan and Sundararaman 2010). effective teachers have tools at their disposal to respond to the needs of individual students and the motiva-tion to do so (World Bank 2018). Formative assessments, as a tool to guide instruction, can be effective only if teachers have the tools to tailor instruction to the needs of individual students or student groups. new technologies, such as computer-assisted learning (CAL) programs, offer students a means to adjust the level of instruction based on initial screening tests, but the evidence on the effi-cacy of these programs is mixed and must be used with caution. Teachers must also be sufficiently motivated to use the available resources to teach to the level of students and to ensure that every student’s learning needs are met. Sri Lanka must ensure that its educational ecosystem will provide teachers with the means and motivation to maximize student learning.
The urban-rural gap in teacher quality will have to be managed effectively so that the educational system is responsive to the needs of all students. Around the world, students in rural and low-income settings face challenges that differ from those faced by their urban or more affluent counterparts. The most acute chal-lenge may be that of access to high-quality teachers in rural areas. Rural areas, as well as the estate sector in Sri Lanka, often find it harder to attract qualified teachers and sometimes those able to teach subjects in high demand. To mitigate this challenge, many schools in rural areas have multigrade teaching, particu-larly at the primary level (Schleicher 2016). The digital divide appears to be another challenge faced by rural schools worldwide, as rural students often have less access to technology and rural areas have less iCT infrastructure to imple-ment technological innovation. At the same time, distance education, through iCT, has the potential to serve rural schools well (Schleicher 2016). Meanwhile, because students in urban schools may have vast exposure to and immersion in technology and the internet, they may require teachers who are more

Key Challenges in Human Capital Development | 95
technologically savvy and able to leverage these conditions to enhance student learning. in either case, Sri Lanka’s teacher management system will have to pay close attention to the unique needs of teachers and students in rural and urban areas. These needs may require more nuanced training or different induction programs for teachers in rural schools and urban schools. They also may require some innovative thinking to fill teacher shortages in certain subjects. For exam-ple, in Sri Lanka where there is a significant shortage of english teachers, teach-ers may have to be recruited from overseas to fill vacancies (Dundar et al. 2017). ultimately, Sri Lanka will have to explore innovative options to ensure that children in rural, urban, and estate schools have equal access to high-quality teachers.
A review of the teacher management system to ensure that it can attract, motivate, and retain high-quality teachers would be useful. Teacher motivation is a critical ingredient of teacher quality, and the best way to improve motivation may be to attract highly capable, motivated people to the teaching profession. in high-performing systems in countries such as Finland, Japan, and Singapore, teaching is a sought-after profession because teachers are highly respected and well paid (Lim et al. 2009). in the long run, improving teacher salaries may be a means of attracting better candidates into the teaching profession, but it is not a short-term solution (World Bank 2018). Accountability mechanisms, such as financial incentives for successful teachers and job termination of low-perform-ing teachers, are other means of motivating teachers. However, given the vast and complex interaction of variables in an educational system, such mechanisms must be deployed with caution. Financial incentives based on student perfor-mance have had mixed results. in india and kenya, financial incentive programs did seem to improve student achievement (Duflo, Hanna, and Ryan 2012; Glewwe, ilias, and kremer 2010), but in several states in the united States financial incentives seemed to have no impact on test scores (Fryer 2013; Glazerman, Mckie, and Carey 2009; Springer et al. 2010). Although there is no single paradigm for recruiting and retaining motivated teachers, the best-per-forming educational systems have a coherent system in place that covers all aspects of a teacher’s career cycle (see table 4.4). This can help ensure that teach-ers are highly motivated because they are well respected, well selected, well compensated, and well supported (World Bank 2018). Sri Lanka should review its teacher management system to ensure that it can attract and retain highly motivated teachers.
ENHANCING LEARNING OUTCOMES THROUGH TECHNOLOGY-BASED INITIATIVES
With the rise of iCT in every corner of twenty-first-century life, governments have scrambled to ensure that iCT is appropriately integrated and utilized to support learning and prepare students for the twenty-first-century workplace. in keeping with these trends, in recent years Sri Lanka has taken steps to inte-grate iCT into the teaching-learning processes. To that end, the government has been gradually upgrading the iCT infrastructure across schools in Sri Lanka.
About 50 percent of Sri Lanka’s schools (approximately 4,500 schools) have received iCT infrastructure (ADB 2017)). The government has also launched initiatives such as Schoolnet, a web portal connecting about 1,500 schools (15 percent of all schools) islandwide (ADB 2017). The Moe recently launched
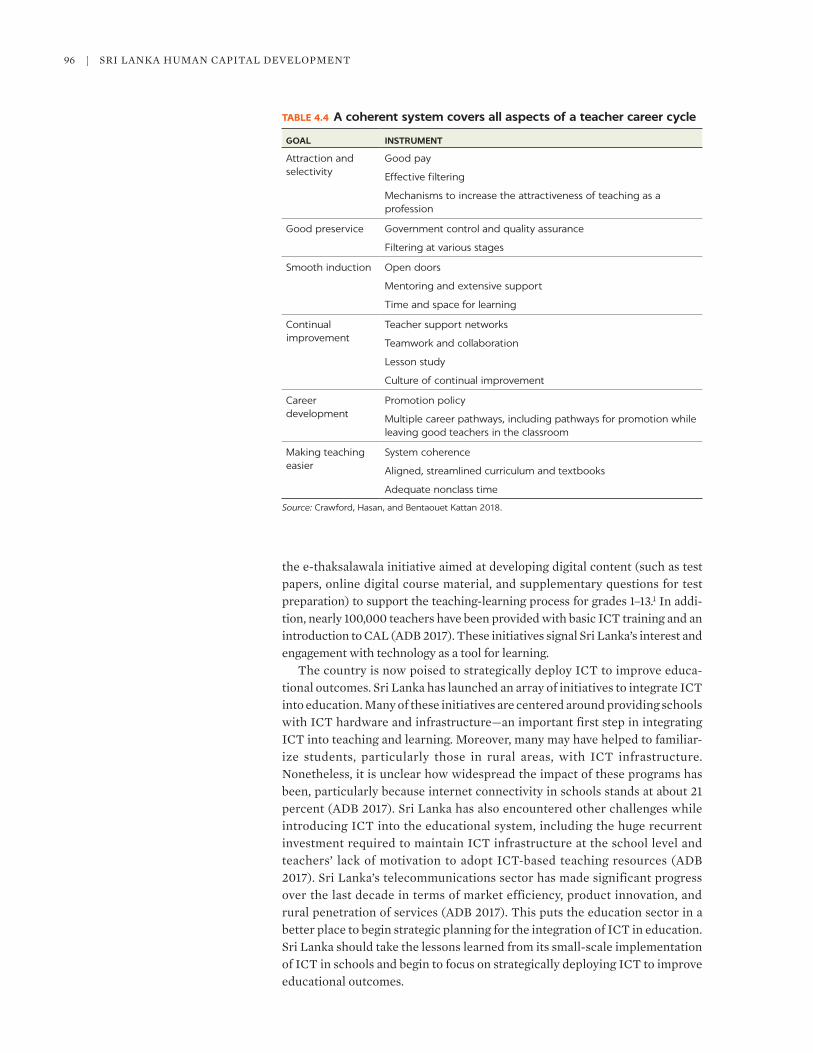
96 | SRi LAnkA HuMAn CAPiTAL DeveLoPMenT
the e-thaksalawala initiative aimed at developing digital content (such as test papers, online digital course material, and supplementary questions for test preparation) to support the teaching-learning process for grades 1–13.1 in addi-tion, nearly 100,000 teachers have been provided with basic iCT training and an introduction to CAL (ADB 2017). These initiatives signal Sri Lanka’s interest and engagement with technology as a tool for learning.
The country is now poised to strategically deploy iCT to improve educa-tional outcomes. Sri Lanka has launched an array of initiatives to integrate iCT into education. Many of these initiatives are centered around providing schools with iCT hardware and infrastructure—an important first step in integrating iCT into teaching and learning. Moreover, many may have helped to familiar-ize students, particularly those in rural areas, with iCT infrastructure. nonetheless, it is unclear how widespread the impact of these programs has been, particularly because internet connectivity in schools stands at about 21 percent (ADB 2017). Sri Lanka has also encountered other challenges while introducing iCT into the educational system, including the huge recurrent investment required to maintain iCT infrastructure at the school level and teachers’ lack of motivation to adopt iCT-based teaching resources (ADB 2017). Sri Lanka’s telecommunications sector has made significant progress over the last decade in terms of market efficiency, product innovation, and rural penetration of services (ADB 2017). This puts the education sector in a better place to begin strategic planning for the integration of iCT in education. Sri Lanka should take the lessons learned from its small-scale implementation of iCT in schools and begin to focus on strategically deploying iCT to improve educational outcomes.
TABLE 4.4 A coherent system covers all aspects of a teacher career cycle
GOAL INSTRUMENT
Attraction and selectivity
Good pay
Effective filtering
Mechanisms to increase the attractiveness of teaching as a profession
Good preservice Government control and quality assurance
Filtering at various stages
Smooth induction Open doors
Mentoring and extensive support
Time and space for learning
Continual improvement
Teacher support networks
Teamwork and collaboration
Lesson study
Culture of continual improvement
Career development
Promotion policy
Multiple career pathways, including pathways for promotion while leaving good teachers in the classroom
Making teaching easier
System coherence
Aligned, streamlined curriculum and textbooks
Adequate nonclass time
Source: Crawford, Hasan, and Bentaouet Kattan 2018.

Key Challenges in Human Capital Development | 97
Policy options for improving the use of ICT in education
iCT, like other educational inputs and processes, needs to be situated within the broader strategic goals of the education sector. effectively integrating iCT in education involves more than providing schools with computers and other tech-nological resources. A wide range of online learning tools and resources are available to support all aspects of the teaching and learning experience, from khan Academy (box 4.8) to Read,Write,Think and edX. other online platforms, such as Google Classroom and Blackboard, are designed to help facilitate an exchange of information and aid communication between teachers and stu-dents. But no matter what tools or platforms are integrated, it is important to keep in mind that to be used effectively in education they must be viewed as tools to support the teaching-learning process (World Bank 2018). it is also important
How Khan Academy is partnering with schools to improve education
khan Academy is a nonprofit educational organiza-tion founded in 2006. it supports one of the most pop-ular education websites in the world, offering more than 5,500 instructional videos—the majority of which are related to math. The site also offers more than 100,000 practice math problems that students can complete at their own pace. khan Academy has introduced as well “coaching” features developed with schools in mind, but they are available to home users for informal instruction. The coaching section includes materials to guide teachers, tutors, parents, and others on how to use khan Academy to meet their students’ learning goals.
in 2011 a group of k–12 schools in California, united States, collaborated with khan Academy to pilot innovative approaches to teaching and learning in classrooms, thereby combining khan Academy with traditional instruction. For the pilot, khan Academy was primarily used as a supplementary tool, not as the core primary curriculum. khan Academy used the pilot to work with the schools to refine and update its learning tools and resources. Students pri-marily used khan Academy problem sets to practice and refine skills individually and with classmates, while getting immediate feedback. The pilot involved a variety of approaches to integrating online learning tools in the schools.
The pilot was implemented in various school set-tings. one particularly interesting setting was a high
school serving a predominantly high-poverty popula-tion. khan Academy was used on a daily basis by two educators: one teaching an algebra readiness class for ninth-graders and a learning lab class and the other teaching a mixed grades 9 and 10 algebra 1 class, a mixed grades 9 and 10 geometry class, and a grade 10 algebra 2 class. Preliminary evidence suggests that the changes made to the school’s math instruction, includ-ing the use of khan Academy, were associated with improved test scores. However, these results cannot be attributed to khan Academy alone because they were integrated into a broader classroom-based instruction.
overall, this pilot project produced a few observa-tions that are useful to consider when integrating such online learning websites into the traditional classroom setting. First, although teachers may appreciate hav-ing a source of extensive, curated digital content, they want to maintain responsibility for leading instruc-tion, as well as controlling students’ use of the content. Second, most students are not accustomed to acting as independent learners, and teachers need to intention-ally orient their students to the types of independent learning practices and habits necessary for success in this learning environment. The most important lesson learned was that the teacher’s role is still central, even in the adoption of new technologies. At their best, new technology tools can enable teachers to help students learn better.
Source: SRI International 2014.
BOX 4.8

98 | SRi LAnkA HuMAn CAPiTAL DeveLoPMenT
to note that the empirical evidence on the impact of iCT on learning outcomes is mixed. Some research suggests that iCT has little to no impact on learning when poorly delivered (Angrist and Lavy 2002; Dynarski 2007). By contrast, other studies, such as a 2016 meta-analysis examining the impact of laptop pro-grams on students’ academic achievement, found significant positive average effect sizes in english, writing, mathematics, and science (Zheng et al. 2016). Moreover, there is evidence that iCT interventions that support the teacher–learner interaction and those that change pedagogical methodology are particu-larly promising (Linden 2008; World Bank 2018). Most advanced educational systems have made efforts to integrate iCT into education. The more successful ones, including those in korea, Malaysia, and Singapore, have developed master plans for these efforts (see box 4.9). Moving forward, it will be important for Sri Lanka to develop a master plan to integrate iCT interventions in the context of the broader strategic goal of improving student learning outcomes.
Malaysian Smart School Initiative
in the late 1990s, Malaysia rolled out a nationwide ini-tiative to introduce the use of information and com-munication technology (iCT) in both primary and secondary schools. The Malaysian Smart School initiative (MSSi) is one of the seven flagship applica-tions of the Multimedia Super Corridor undertaken by the Malaysian government in its effort to become a knowledge-based economy. The MSSi was based on strategic public-private partnerships involving vari-ous stakeholders, including government ministries, industry actors, and local communities. A Malaysian Smart School is defined as “a learning institution that has been systematically reinvented in terms of teach-ing and learning as well as the improvement of the school management process in order to help students cope and leverage on the information Age.” underpinning the program is a comprehensive master plan aimed at (1) providing iCT infrastructure; (2) providing broadband and local area network facili-ties; (3) facilitating training to enhance teachers’ com-petency in integ rat ing iCT in education; (4) establishing a benchmark with the first 88 Smart Schools; (5) incorporating iCT elements into the cur-riculum; (6) introducing iCT programs at the school level; (7) providing various courseware, educational Tv programs, and other resources for teaching and learning; and (8) establishing collaboration programs to expedite the process of making schools smart. The MSSi was launched in four waves:
• Wave 1, Pilot Phase (1999–2002): 88 schools selected nationwide
• Wave 2, Post-Pilot (2002–05): massive comput-erization phase to all 10,000 schools
• Wave 3, Making All Schools Smart (2005–10): leveraging all iCT initiatives
• Wave 4, Consolidate and Stabilize (2010–20): innovative practices using iCT enculturated
The MSSi is in the fourth stage of implementation. After the postpilot phase of the MSSi ended in 2005, the initiative was extended to all schools in Malaysia through the Making All Schools Smart program. The pilot revealed issues and challenges, including infra-structure readiness, connectivity, change manage-ment, parallel iCT initiatives, training of teachers and administrators, technology obsolescence, and poli-cies. To overcome these issues and challenges, and in line with the move to make all schools “smart,” a mon-itoring tool known as the Smart School Qualification Standards (SSQS) was introduced in 2006. The SSQS is designed to monitor, evaluate, and categorize schools in the use and impact of the technologies. These indicators were developed to monitor the types of iCT resources available and changes in teaching and learning practices. The Malaysian experience highlights the need for continual support, monitor-ing, and evaluation as an important part of the imple-mentation process.
Source: Lee and Thah 2016.
BOX 4.9

Key Challenges in Human Capital Development | 99
CAL is promising, but it should be recognized as a tool for supporting teachers, not replacing them. CAL software has become increasingly popular in education. it can enhance communication among teachers, students, and par-ents and help teachers and parents identify and use age-appropriate develop-ment activities to support student learning (World Bank 2018). The CAL programs that have received the most attention and show the most promise serve as a kind of “intelligent tutoring” (escueta et al. 2017). A recent review of 29 studies that evaluated the impact of these intelligent tutoring CAL programs suggests that these programs show great potential to improve learning out-comes, particularly in mathematics (escueta et al. 2017). Many of these programs may be effective in part because they allow students to learn at their own pace and adapt to students’ knowledge (Muralidharan, Singh, and Ganimian 2016). in other words, these programs allow students to personalize their education. in india, a dynamic CAL program for secondary school students increased math and language scores more than any other intervention tested in both india and elsewhere (box 4.10). nonetheless, this intervention was designed as an after-school learning program rather than a substitute for in-class instruction (Muralidharan, Singh, and Ganimian 2016). A gaming program in China showed similar results (box 4.10).
Impacts of CAL on learning: Examples from China and India
Chinain 2011, a cluster-randomized experiment was under-taken in 57 schools in Quinghai, China, to study the impact of a remedial, game-based CAL program on academic and noncognitive outcomes for students in public schools in minority rural areas. The experi-ment found that the segment of the program that focused on teaching Standard Chinese (Mandarin) after school hours improved the standardized Mandarin scores of the students in the treatment schools by 0.14–0.20 standard deviations, compared with those in the control schools. Moreover, CAL had significant spillover effects on students’ standardized math test scores. The CAL intervention had insignifi-cant positive effects on students’ nonacademic out-comes and metacognition and significant positive effects on students’ self-efficacy of learning Mandarin.
IndiaA study in urban india looked at the impact of a CAL program called Mindspark. The sample of 619 students was recruited from public middle schools in Delhi.
A lottery provided winning students with a voucher to cover the program costs associated with using the pro-gram. A key feature of the Mindspark software is its ability to finely benchmark the learning level of every student and dynamically customize the material being delivered to match the level and rate of progress made by each student. A second important feature is its abil-ity to identify patterns of student errors and precisely target content to alleviate conceptual bottlenecks that may be difficult for teachers to diagnose or address at the individual student level in a classroom setting. The results showed that lottery winners (those who used the Mindspark program) scored 0.36 higher in math and 0.22 higher in Hindi relative to lottery losers after just four and half months of access to the program. The study found similar absolute test score gains for all stu-dents, but the relative gain was much greater for aca-demically weaker students because the rate of learning in the control group was close to zero. The results sug-gest that well-designed, technology-aided instruction programs can sharply improve productivity in deliver-ing education.
Sources: Lai et al. 2012; Muralidharan, Singh, and Ganimian 2016.
BOX 4.10

100 | SRi LAnkA HuMAn CAPiTAL DeveLoPMenT
The educational system has an important role to play in improving digital literacy, but again it is important to ensure that the technology is deployed to serve this strategic goal. The other important goal of integrating iCT in educa-tion is to promote digital literacy and skills. Teachers and students will then have the skills they need to use basic word processing, research, and communications applications. Such applications are widely used in today’s workplace, and pres-ent-day jobs increasingly require a basic level of digital literacy. The education sector has an important role to play in providing students with the opportunity to acquire those skills. Since 2005, the one Laptop per Child (oLPC) initiative has been implemented in programs conducted worldwide. The goal of many of these programs is to provide children with personal computers to improve their educational outcomes and digital skills. empirical evidence on the impact of the programs suggests that although they do have positive impacts on students’ iCT skills and usage, their impact on students’ academic achievement is modest to nil (esceuta et al. 2017). To date, many of Sri Lanka’s “iCT in education” initiatives seem to be aimed at improving digital literacy, which is an important goal. Still, moving forward, it will be important for Sri Lanka to clearly identify how to strategically achieve this goal and to ensure that it is aligned with the other objectives of its “iCT in education” policy.
USING INTERNATIONAL AND NATIONAL ASSESSMENTS FOR EDUCATIONAL DEVELOPMENT
A high-quality learning assessment system, including classroom-based, national, and international assessments, is critical for improving the quality of an educa-tional system and ultimately for improving student learning outcomes. There is considerable evidence that specific types of assessment activities, when imple-mented and used correctly, have a positive impact on student learning. For exam-ple, research shows a strong link between high-quality, formative classroom assessment activities and better student learning outcomes, as measured by stu-dent performance on standardized tests of educational achievement (Clarke 2012). A review of high-performing educational systems in countries such as Finland and Singapore found that effective assessment systems share character-istics. They (1) demonstrate the importance of assessment for student learning rather than as a disconnected element of the educational system; (2) provide students, teachers, and policy makers with information on what has been learned; (3) are closely aligned with curriculum expectations, performance cri-teria, and learning outcomes; and (4) engage teachers in the assessment develop-ment process (Darling-Hammond and Wentworth 2010).
Sri Lanka’s learning assessment system has made progress, but there is still room for improvement. The country introduced national assessments in 2003 funded by the Moe and carried out by the national education Research and evaluation Center (neReC) at the university of Colombo. every three years, these national assessments test cognitive skills in the first language (Sinhala and Tamil), english, and mathematics for grade 4 students and english, mathemat-ics, and science for grade 8 students. However, a few changes would make these national assessments more useful for educational development. For one thing, the technical rigor of the national assessments, including test design, sampling, survey management, analysis of results, and dissemination and publication, should be strengthened (Dundar et al. 2017). Moreover, these assessments miss

Key Challenges in Human Capital Development | 101
out on the opportunity to collect data on schools, students, teachers, and parents, which could be beneficial to policy makers for educational planning. This type of data was collected in one assessment cycle but was discontinued because of bud-getary constraints. in recent years, an effort has been made to improve under-standing of the purpose and use of national assessments among policy makers, but there is still room for improvement in this area. Likewise, the utilization of national assessments for policy development should be strengthened. The Moe introduced a Trends in international Mathematics and Science Study (TiMSS) module in its national assessments. However, to date the country has not partic-ipated in any of the international assessments such as TiMSS or the Program for international Student Assessment (PiSA).
Policy options for improving the learning assessment system
Sri Lanka should improve its use of national assessments for education policy and planning. national assessments are designed to provide evidence of a coun-try’s educational performance and can be used to measure student learning at one point in time or over time (Dundar et al. 2017). The data from national assessments can also be used as the basis for reviewing the educational system, designing and revising curricula, improving textbooks and learning material, strengthening teacher education and training, and guiding resource allocation (Greaney and kellaghan 2008). using national assessments for educational development begins with an understanding of the role and purpose of national assessments. it is particularly important that policy makers understand that national assessments play a distinct role and differ from public examinations (table 4.5).
Sri Lanka should improve its institutional capacity and conditions for using national assessments for educational development. According to kellaghan, Greaney, and Murray (2009), a country must meet conditions to make optimal use of the findings of a national assessment. First, there must be sufficient polit-ical will to consider any reforms and changes that may be needed in response to the findings of a national assessment. Second, policy and decision-makers in the Moe should have the knowledge and skills to interpret and use the information from a national assessment—and if such capacity is lacking, substantial invest-ments may have to be made to build it. Third, national assessments must be inte-grated into existing structures, policy-making and decision-making processes, and resource allocation channels. Fourth, a clear dissemination strategy is needed to communicate the findings of a national assessment. And, finally, the government must ensure that a high-level team is responsible for undertaking and interpreting the results of the national assessments and that staff turnover is minimized because those factors can seriously affect the quality of the process (kellaghan, Greaney, and Murray 2009). Going forward, it will be important for Sri Lanka to cultivate an ecosystem to effectively use national assessments for educational planning.
international assessments share many similarities with national assessments but offer the added benefit of providing information on the quality of an educa-tional system in relation to other systems. An international assessment is in many ways similar to a national assessment. Like a national assessment, it is designed to provide evidence of student achievements and learning outcomes at a particular stage of education and in identified curriculum areas and to track progress over time. Both types of assessments also have a similar approach and
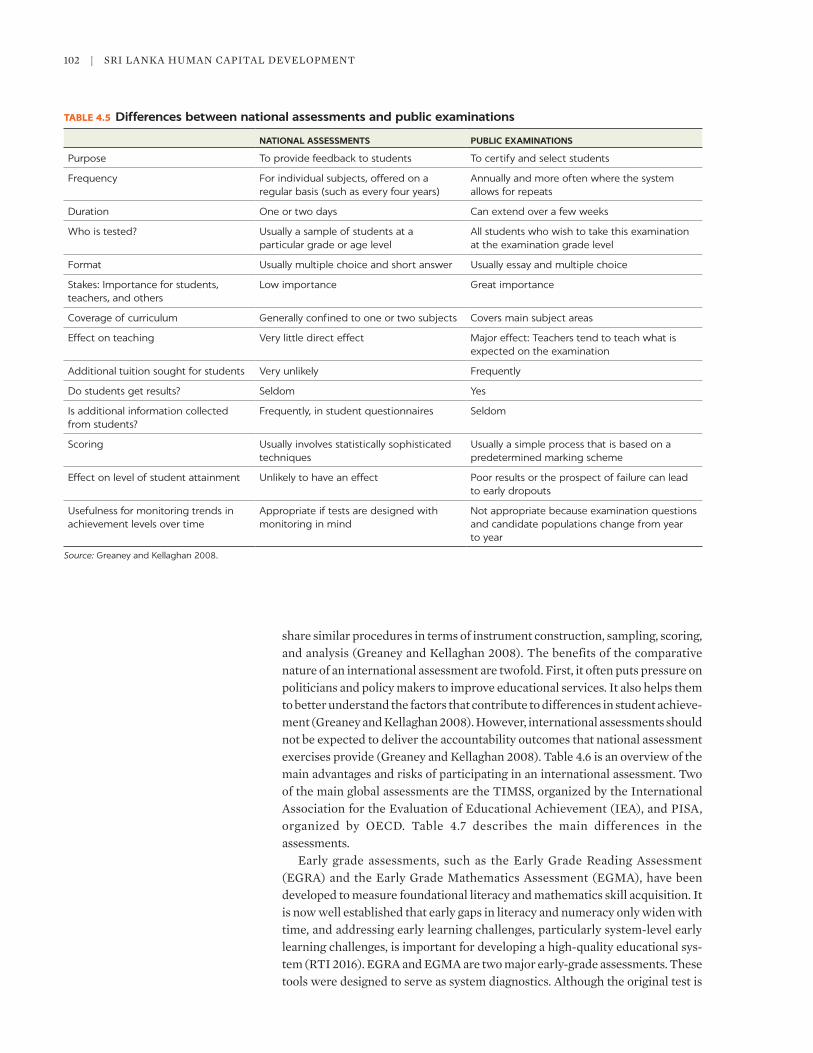
102 | SRi LAnkA HuMAn CAPiTAL DeveLoPMenT
share similar procedures in terms of instrument construction, sampling, scoring, and analysis (Greaney and kellaghan 2008). The benefits of the comparative nature of an international assessment are twofold. First, it often puts pressure on politicians and policy makers to improve educational services. it also helps them to better understand the factors that contribute to differences in student achieve-ment (Greaney and kellaghan 2008). However, international assessments should not be expected to deliver the accountability outcomes that national assessment exercises provide (Greaney and kellaghan 2008). Table 4.6 is an overview of the main advantages and risks of participating in an international assessment. Two of the main global assessments are the TiMSS, organized by the international Association for the evaluation of educational Achievement (ieA), and PiSA, organized by oeCD. Table 4.7 describes the main differences in the assessments.
early grade assessments, such as the early Grade Reading Assessment (eGRA) and the early Grade Mathematics Assessment (eGMA), have been developed to measure foundational literacy and mathematics skill acquisition. it is now well established that early gaps in literacy and numeracy only widen with time, and addressing early learning challenges, particularly system-level early learning challenges, is important for developing a high-quality educational sys-tem (RTi 2016). eGRA and eGMA are two major early-grade assessments. These tools were designed to serve as system diagnostics. Although the original test is
TABLE 4.5 Differences between national assessments and public examinations
NATIONAL ASSESSMENTS PUBLIC EXAMINATIONS
Purpose To provide feedback to students To certify and select students
Frequency For individual subjects, offered on a regular basis (such as every four years)
Annually and more often where the system allows for repeats
Duration One or two days Can extend over a few weeks
Who is tested? Usually a sample of students at a particular grade or age level
All students who wish to take this examination at the examination grade level
Format Usually multiple choice and short answer Usually essay and multiple choice
Stakes: Importance for students, teachers, and others
Low importance Great importance
Coverage of curriculum Generally confined to one or two subjects Covers main subject areas
Effect on teaching Very little direct effect Major effect: Teachers tend to teach what is expected on the examination
Additional tuition sought for students Very unlikely Frequently
Do students get results? Seldom Yes
Is additional information collected from students?
Frequently, in student questionnaires Seldom
Scoring Usually involves statistically sophisticated techniques
Usually a simple process that is based on a predetermined marking scheme
Effect on level of student attainment Unlikely to have an effect Poor results or the prospect of failure can lead to early dropouts
Usefulness for monitoring trends in achievement levels over time
Appropriate if tests are designed with monitoring in mind
Not appropriate because examination questions and candidate populations change from year to year
Source: Greaney and Kellaghan 2008.

Key Challenges in Human Capital Development | 103
not a means of screening individual students, modified versions of the test can be used as a screening tool to identify individual students with needs (RTi 2016). Like national and international assessments, these assessments are designed to provide policy makers with information on the quality of early-grade instruc-tion, with a view toward addressing system needs. eGRA tests for letter recogni-tion, phonemic awareness, reading simple words, and listening comprehension, whereas eGMA tests number recognition, comparisons, and ordering sets of objects. eGRA has been used in about 70 countries to provide national- or sys-tem-level diagnostic information about children’s early learning, as well as to support classroom-based assessment and program evaluations (uk DFiD 2009).
Sri Lanka would benefit from participating in international assessments. Most high- and upper-middle-income countries participate in a range of inter-national assessments, such as the Progress in international Reading Literacy Study (PiRLS), TiMSS, and PiSA. Developing countries are also stepping up efforts to participate in these tests because they help policy makers benchmark learning outcomes against international standards. Many countries have used international assessments to accelerate educational reforms and ultimately improve educational outcomes. For example, TiMSS results in Japan spurred parliamentary discussions about planned changes in education policy. in new Zealand, a task force on mathematics and science was established in response to the TiMSS results. in Canada, the results led to the development of instructional materials based on an analysis of the common misconceptions and errors of stu-dents in their response to TiMSS tasks. in Canada and Singapore, participation accelerated changes in the revision of curricula (Greaney and kellaghan 2008). Box 4.11 also provides the example of Poland, a country that successfully utilized PiSA to evaluate the efficacy of educational reforms over time. Sri Lanka would benefit from participation in international assessments, particularly as it under-takes reforms to improve the quality of its educational system. Sri Lanka’s partic-ipation would help place its students’ achievement in the global context and may also prompt the reforms needed to spur further improvements in learning outcomes.
TABLE 4.6 Advantages and risks of participating in an international assessment
ADVANTAGE RISK
Adherence to high technical standards of assessment design, instrumentation, sampling, administration, analysis, and reporting
Criticism of the cost of participation, particularly in view of the need to commit to successive rounds if the initial investment is to be worthwhile
Development of indigenous capacity to meet international standards of assessment practice
Disaffection with the international exercise if its assessment framework is of limited relevance
High degree of transparency in dissemination of the results and political gains if performance is found to be relatively good compared with that of peers
Unfavorable comparison of the results of neighbors and peers—with the attendant political consequences
Positive effects of driving up performance from diagnostic application of results, exposing the educational system to external scrutiny, and tracking the impact of certain interventions and reforms over time
Unreasonable expectation that international assessment exercises will deliver the accountability outcomes that national census assessment exercises provide
Opportunity to adapt (“version”) survey instruments that meet international standards to the national language and context
Failure to fully adapt survey instruments to the national context. “Versioning” goes beyond translation to ensure that literacy texts (in particular) are suited to children’s educational experience and sociolinguistic background
Source: UK DFID 2009.
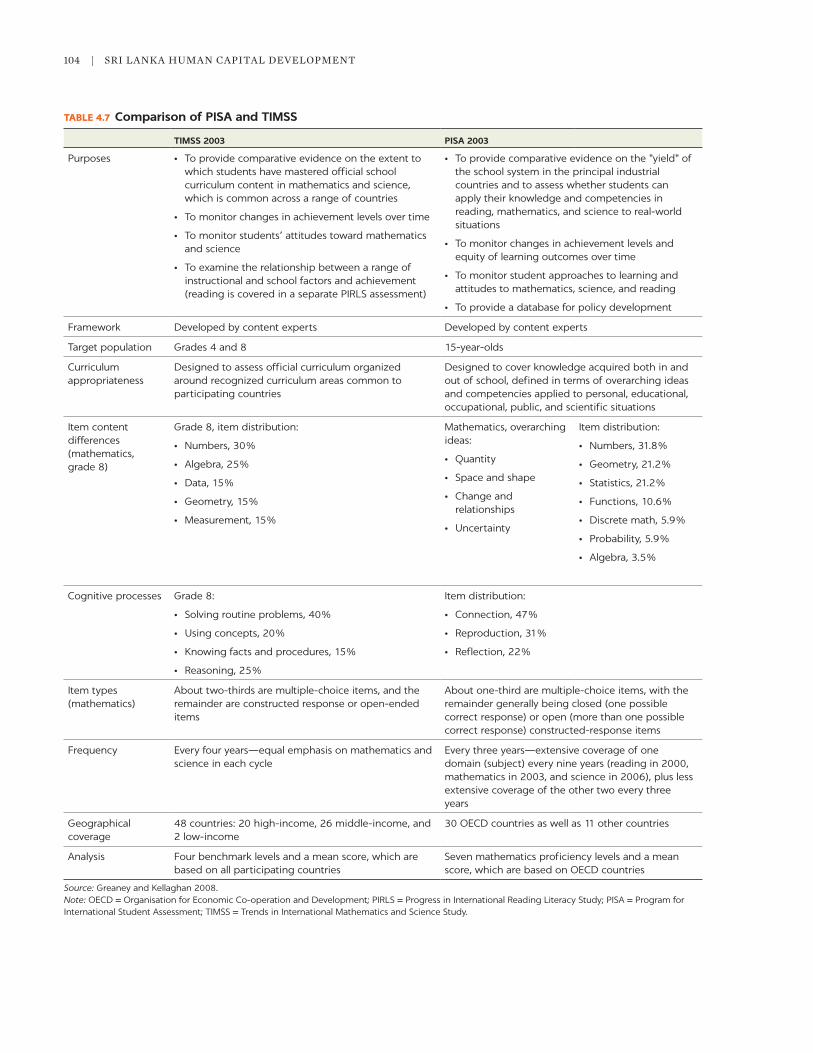
104 | SRi LAnkA HuMAn CAPiTAL DeveLoPMenT
TABLE 4.7 Comparison of PISA and TIMSS
TIMSS 2003 PISA 2003
Purposes • To provide comparative evidence on the extent to which students have mastered official school curriculum content in mathematics and science, which is common across a range of countries
• To monitor changes in achievement levels over time
• To monitor students’ attitudes toward mathematics and science
• To examine the relationship between a range of instructional and school factors and achievement (reading is covered in a separate PIRLS assessment)
• To provide comparative evidence on the "yield" of the school system in the principal industrial countries and to assess whether students can apply their knowledge and competencies in reading, mathematics, and science to real-world situations
• To monitor changes in achievement levels and equity of learning outcomes over time
• To monitor student approaches to learning and attitudes to mathematics, science, and reading
• To provide a database for policy development
Framework Developed by content experts Developed by content experts
Target population Grades 4 and 8 15-year-olds
Curriculum appropriateness
Designed to assess official curriculum organized around recognized curriculum areas common to participating countries
Designed to cover knowledge acquired both in and out of school, defined in terms of overarching ideas and competencies applied to personal, educational, occupational, public, and scientific situations
Item content differences (mathematics, grade 8)
Grade 8, item distribution:
• Numbers, 30%
• Algebra, 25%
• Data, 15%
• Geometry, 15%
• Measurement, 15%
Mathematics, overarching ideas:
• Quantity
• Space and shape
• Change and relationships
• Uncertainty
Item distribution:
• Numbers, 31.8%
• Geometry, 21.2%
• Statistics, 21.2%
• Functions, 10.6%
• Discrete math, 5.9%
• Probability, 5.9%
• Algebra, 3.5%
Cognitive processes Grade 8:
• Solving routine problems, 40%
• Using concepts, 20%
• Knowing facts and procedures, 15%
• Reasoning, 25%
Item distribution:
• Connection, 47%
• Reproduction, 31%
• Reflection, 22%
Item types (mathematics)
About two-thirds are multiple-choice items, and the remainder are constructed response or open-ended items
About one-third are multiple-choice items, with the remainder generally being closed (one possible correct response) or open (more than one possible correct response) constructed-response items
Frequency Every four years—equal emphasis on mathematics and science in each cycle
Every three years—extensive coverage of one domain (subject) every nine years (reading in 2000, mathematics in 2003, and science in 2006), plus less extensive coverage of the other two every three years
Geographical coverage
48 countries: 20 high-income, 26 middle-income, and 2 low-income
30 OECD countries as well as 11 other countries
Analysis Four benchmark levels and a mean score, which are based on all participating countries
Seven mathematics proficiency levels and a mean score, which are based on OECD countries
Source: Greaney and Kellaghan 2008.Note: OECD = Organisation for Economic Co-operation and Development; PIRLS = Progress in International Reading Literacy Study; PISA = Program for International Student Assessment; TIMSS = Trends in International Mathematics and Science Study.

Key Challenges in Human Capital Development | 105
The government understands that mobilizing families and households is an important part of any effort to improve learning outcomes. To this end, the coun-try has established a program of school-based management, the enhanced Program for School improvement (ePSi). ePSi builds on the earlier Program for School improvement, which helped to improve the learning outcomes of pri-mary schoolchildren (Aturupane et al. 2014). ePSi was designed to bring about a change in the culture of schools, with the ultimate aim of improving the quality of student learning. Recognizing the importance of empowering parents and the wider community, School Development Committees (SDCs) established under ePSi were designed to include parents and other members of the broader school community (school alumni and other well-wishers). The role of the SDCs is to prepare, assist, and monitor the results of school development plans. The SDCs give parents and the community an opportunity to play an integral role in shap-ing the quality of their school. Moreover, the SDCs provide a platform to engage the parents and the wider school community in any activities that contribute to improvement of their school, such as raising additional resources for school activities. ultimately, through the SDC mechanism, the ePSi empowers parents and the community to improve the quality of their local school and the quality of student outcomes in their local area.
Student learning outcomes are captured in a variety of assessments at the school, national, and international levels. ePSi can further empower the school community to improve student learning outcomes by giving parents and the wider school community a better understanding of (1) what these assessments are designed to do, (2) what kind of information the assessment results provide, and (3) the potential implications of the assessment results for planning inter-ventions at the school level. For example, if the national assessments indicate that a province or district has performed particularly poorly in a certain subject such as english, the SDCs may want to consider using school development grants to develop more activities to improve english language learning in their school. They may even consider working with a group of schools in the area to improve outcomes in this subject. empowering all members of the school
International assessment and educational reform: An example from Poland
Poland has made marked improvements in its stu-dent performance over the last decade. According to the organisation for economic Co-operation and Development (oeCD) Program for international Student Assessment (PiSA) results, Poland exceeded the oeCD average and is now close to top-perform-ing countries. This progress is the result of a series of Polish educational system reforms introduced in 1999. The most important change of the 1999 reforms was extension of comprehensive education by one year. A public examination system and
expansion of preschool were other key aspects of the reforms.
Although policy makers did not pay close attention to the evaluation of these reforms, they undertook participation in PiSA in 2000. Polish students were tested in 2000, 2009, and 2012, which coincided with the series of reforms that began in 1999. Taking part in successive rounds of PiSA allowed policy makers to evaluate the effects of the various reforms. Consequently, PiSA has served as a tool for evaluating the reforms of 1999.
Source: Jakubowski 2015.
BOX 4.11
106 | SRi LAnkA HuMAn CAPiTAL DeveLoPMenT
community with better information on the various aspects of student learning, such as student assessment, can ultimately help improve the quality of learning outcomes.
IMPROVING GENDER EQUITY IN LEARNING OUTCOMES
Like many middle- and high-income countries, Sri Lanka must confront a new challenge for gender equity: boys lagging behind in access at the higher levels of the educational system and underperforming in terms of learning achievement. An analysis of educational participation and achievement data for Sri Lanka clearly shows that girls outperform boys at every level of the educational system, especially at higher levels (Aturupane, Shojo, and ebenezer 2018). This is a rela-tively new challenge for most countries, and the policies to address this chal-lenge are less tested. nonetheless, for Sri Lanka to improve its learning outcomes overall, it must address this issue, and if it is successful it may be a pioneer in this emerging challenge to gender equity. it should also note that despite high educa-tional achievements, the employment outcomes of women have been less satis-factory over a long period of time (Aturupane 1996).
Research on boys’ underperformance in Sri Lanka suggests several key fac-tors, including societal and cultural influences, curriculum and learning styles, peer group pressures, and attitudes to education that are likely having an impact on boys’ educational performance. The results of a 2018 study to better under-stand the reasons for boys’ underperformance in Sri Lanka found that a set of social and cultural influences may be having an impact on boys’ performance. These include cultural perceptions of the relative importance of education for boys versus girls, gender stereotypes about the innate academic ability of boys and girls, and differences in parental oversight of boys and girls (Aturupane, Shojo, and ebenezer 2018). The same study suggests that classroom-level vari-ables such as curriculum and assessment methodology, the structure of the school day and the academic workload, and the lack of male teachers in the sys-tem may be having an impact on boys’ performance as well. Finally, interviews and focus group discussions indicate that student behavior and attitudes such as a lack of professional ambition among boys and the absence of positive role mod-els are also important factors affecting boys’ educational performance in Sri Lanka.
Policy options to improve boys’ learning achievement in Sri Lanka
Sri Lanka should consider special training for principals and school leadership to sensitize them to gender-based stereotypes that may influence the perfor-mance of both male and female students. Cultural and societal norms and stereo-types are deeply entrenched, and identifying effective strategies to address them is a challenge. Moreover, researchers have emphasized that gender stereotypes form early, and therefore it is important to address them as early in the school cycle as possible, even at the preschool level (Aina and Cameron 2011). Strong school leadership may be particularly important to this endeavor as a compari-son of an experimental program in a school in Australia and in Jamaica suggests. Both of these programs attempted to alter gender stereotypes. in Jamaica, the program experimented with interventions such as counseling and adopting
Key Challenges in Human Capital Development | 107
transparent approaches to engagement between teachers and students, with the specific goal of dismantling gender stereotypes about school. The Australian program attempted to transform the school environment—without specifically trying to change boys’ stereotypes of masculinity. in the end, the Jamaican pro-gram was not as successful in transforming the gender-based stereotypes as the Australian program. Researchers hypothesize that this may have been in part due to the difference in school leadership. in the Australian school, the princi-pal’s vision of creating an open, transparent, and engaging learning space for all students may have been a more powerful factor in changing students’ percep-tions of learning (Jha and kelleher 2006). This program underscored the impor-tance of school leadership in shaping the culture and environment of a school. ultimately, training for principals and school leadership should include sensiti-zation to gender-based stereotypes, and this may have a powerful influence on the performance of both male and female students.
Sri Lanka may also want to consider undertaking an institutional review of aspects of the traditional school structure, curriculum, and assessment method-ology, all of which may have an adverse impact on boys’ performance. The liter-ature points to a variety of strategies to improve pedagogical practices as a means of engaging boys and improving their academic performance. These include highly structured lesson plans, frequently changing classroom activities, positive reinforcement of achieved outcomes, personal interviews for the purposes of target-setting, and various modes of hands-on learning (Cuttance and Thompson 2008). As the 2018 study on boys’ underperformance in education in Sri Lanka suggests, aspects of the Sri Lankan curriculum, school schedule, and structure may need to be reexamined to address underperforming boys. These include the timing of the grade 5 scholarship exam, the current assessment methodology, the tightly packed school schedules, and the amount of outdoor activity built into children’s daily schedules (Aturupane, Shojo, and ebenezer 2018). it will be important for a set of Sri Lanka’s educational stakeholders and experts to review various aspects of the educational system to assess how they can be reformed in ways that are beneficial to the performance of all students, boys and girls.
NOTE
1. Sri Lanka Ministry of education, https://www.e-thaksalawa.moe.gov.lk/web/en/e-thaksalawa /about-e-thaksalawa.html.
REFERENCES
Aaronson, D., L. Barrow, and W. Sander. 2007. “Teachers and Student Achievement in the Chicago Public High Schools.” Journal of Labor Economics 25 (1): 95–135.
ACeR (Australian Council for educational Research). 2019. “The ACeR Professional Learning Community Framework. The Australian Council for educational Research.” https://www .acer.org/files/ACeR-PLCF-information-Pack.pdf.
ADB (Asian Development Bank). 2017. “innovative Strategies for Accelerated Human Resource Development in South Asia information and Communication Technology for education; Special Focus on Bangladesh, nepal, and Sri-Lanka.” Asian Development Bank, Manila, the Philippines. https://www.adb.org/sites/default/files/publication/385526/ict-education-sa.pdf.
Aina, o. e., and P. A. Cameron. 2011. “Why Does Gender Matter? Counteracting Stereotypes with Young Children.” Dimensions of Early Childhood 39 (3): 11–20.
108 | SRi LAnkA HuMAn CAPiTAL DeveLoPMenT
Angrist, J. D., and v. Lavy. 2002. “new evidence on Classroom Computers and Pupils’ Learning.” Economic Journal 112: 735–65.
Aturupane, H. 1996. “unemployment among educated Women in Sri Lanka.” Department of national Planning, Colombo, Sri Lanka.
Aturupane, H., P. Glewwe, R. Ravina, u. Sonnadara, and S. Wisniewski. 2014. “An Assessment of the impacts of Sri Lanka’s Programme for School improvement and School Report Card Programme on Student’s Academic Progress.” Journal of Development Studies 50 (12): 1647–69.
Aturupane, H., T. kellaghan, and M. Shojo. 2013. “School-Based education improvement initiatives: The experience and options for Sri Lanka.” South Asia Human Development Sector Report no. 58, World Bank, Washington, DC.
Aturupane, H., D. Sankar, H. Saeki, M. Shojo, P. Glewwe, and A. Deolalikar. 2011. “Transforming School education in Sri Lanka: From Cut Stones to Polished Jewels.” World Bank, Washington DC.
Aturupane, H., M. Shojo, and R. ebenezer. 2018. “Gender Dimensions of educational Access and Achievement in Sri Lanka.” Discussion Paper Series Report no. 90, South Asia Region, education Global Practice, World Bank, Washington, DC.
Balasooriya, B. M. J. 2012. “Teacher Recruitment and Teacher Mobility in Sri Lanka.” in Commonwealth Education Partnerships 2012/13 by Commonwealth Secretariat. Cambridge, uk: nexus Strategic Partnerships.
Banerjee, A. v., S. Cole, e. Duflo, and L. Linden. 2007. “Remedying education: evidence from Two Randomized experiments in india.” Quarterly Journal of Economics 122 (3): 1235–64.
Bertrand, J. 2007. “Preschool Programs: effective Curriculum. Comments on kagan and kauerz and on Schweinhart.” in Encyclopedia on Early Childhood Development. Montreal: Centre of excellence for early Childhood Development and Strategic knowledge Cluster on early Child Development.
Bramwell, D., S. Anderson, and k. Mundy. 2014. Teachers and Teacher Development: A Rapid Review of the Literature. Toronto: ontario institute for Studies in education.
Bruns, B., and J. Luque. 2015. “Great Teachers: How to Raise Student Learning in Latin America and the Caribbean.” World Bank, Washington, DC. https://openknowledge.worldbank.org /handle/10986/20488.
Bueno, M., L. Darling-Hammond, and D. Gonzales. 2010. “A Matter of Degrees: Preparing Teaches for the Pre-k Classroom.” education Reform Series, Pew Center on the States, Washington, DC.
Carroll, T., k. Fulton, and H. Doerr. 2010. Team Up for 21st Century Teaching and Learning: What Research and Practice Reveal about Professional Learning. Washington, DC: national Commission on Teaching and America’s Future.
CDC (Center on the Developing Child). 2007. “The Science of early Childhood Development (in Brief ).” Harvard university, Cambridge, MA.
Chetty, R., J. Friedman, and J. Rockoff. 2014. “Measuring the impacts of Teachers ii: Teacher value-Added and Student outcomes in Adulthood.” American Economic Review 104 (9): 2633–79.
Clarke, Marguerite. 2012. “What Matters for Student Assessment Systems: A Framework Paper.” World Bank, Washington, DC.
Conn, katharine M. 2017. “identifying effective education interventions in Sub-Saharan Africa: A Meta-Analysis of impact evaluations.” Review of Educational Research (May).
Crawford, M. F., A. Hasan, and Raja Bentaouet kattan. 2018. Growing Smarter: Learning and Equitable Development in East Asia and Pacific. World Bank east Asia and Pacific Regional Reports. Washington, DC: World Bank.
Cuadra, e., ed., J. M. Moreno, ed., L. Crouch, ed., Y. Wang, D. Abu-Ghaida, S. Sosale, T. Welsh, et al. 2005. Expanding Opportunities and Building Competencies for Young People: A New Agenda for Secondary Education. Washington, DC: World Bank.
Cuttance, P., and J. Thompson. 2008. “Literature Review of Boys education.” victoria university of Wellington, Wellington, new Zealand.
Key Challenges in Human Capital Development | 109
Darling-Hammond, L., and L. Wentworth. 2010. “Benchmarking Learning Systems: Student Performance Assessment in international Context.” Stanford Center for opportunity Policy in education, Stanford university, Stanford, CA. http://ncee.org/wp-content /uploads/2010/11/BenchmarkingLearningSystemHAMMonD.pdf.
Duflo, e., J. Berry, S. Mukerji, and M. Shotland. 2014. A Wide Angle View of Learning: Evaluation of the CCE and LEP Programmes in Haryana. 3ie Grantee Final Report. new Delhi: international initiative for impact evaluation.
Duflo, esther, Rema Hanna, and Stephen P. Ryan. 2012. “incentives Work: Getting Teachers to Come to School.” American Economic Review 102 (4): 1241–78.
Dundar, H., B. Millot, M. Riboud, M. Shojo, H. Aturupane, S. Goyal, and D. Raju. 2017. Sri Lanka Education Sector Assessment: Achievements, Challenges and Policy Options. Directions in Development Series, Human Development. Washington, DC: World Bank.
Durlak, J., R. Weissberg, A. Dymnicki, R. Taylor, and k. Schellinger. 2011. “The impact of enhancing Students’ Social and emotional Learning: A Meta-Analysis of School-Based universal interventions.” Child Development 82: 405–32.
Dynarski, M. 2007. Effectiveness of Reading and Mathematics Software Products Findings from the First Student Cohort: Report. Darby, PA: Diane Publishing.
escueta, M., v. Quan, A. J. nickow, and P. oreopoulos. 2017. “education Technology: An evidence-Based Review.” nBeR Working Paper 23744, national Bureau of economic Research, Cambridge, MA.
Freeman, S., S. eddy, M. McDonough, M. k. Smith, n. okoroafor, H. Jordt, and M. Wenderoth. 2004. “Active Learning increases Student Performance in Science, engineering, and Mathematics.” Proceedings of the National Academy of Sciences of the United States of America 111 (23): 8410–15.
Fryer, R. G., Jr. 2013. “Teacher incentives and Student Achievement: evidence from new York City Public Schools.” Journal of Labor Economics 31 (2): 373–407.
Glazerman, S., e. isenberg, S. Dolfin, M. Bleeker, A. Johnson, M. Grider, and M. Jacobus, 2010. “impacts of Comprehensive Teacher induction: Final Results from a Randomized Controlled Study.” nCee 2010-4027, national Center for education evaluation and Regional Assistance, institute of education Sciences, uS Department of education, Washington, DC.
Glazerman, Steven, Allison Mckie, and nancy Carey. 2009. “An evaluation of the Teacher Advancement Program (TAP) in Chicago: Year one impact Report, Final Report.” Mathematica Policy Research, Princeton, nJ.
Glewwe, P. W., n. ilias, and M. R. kremer. 2010. “Teacher incentives.” American Economic Journal: Applied Economics 2 (3): 205–27.
Greaney, v., and T. kellaghan. 2008. “Assessing national Achievement Levels in education.” World Bank, Washington DC.
Guerra, n. 2015. “Social and emotional Skills: What Leaders need to know.” unpublished paper, World Bank, Washington, DC.
Guerra, n., k. Modecki, and W. Cunningham. 2014. “Developing Social-emotional Skills for the Labor Market: The PRACTiCe Model.” Policy Research Working Paper 7123, World Bank, Washington, DC.
Guerra, n., k. Modecki, and W. Cunningham. 2015. “Socio-emotional Skills: What Leaders need to know.” Presentation to World Bank Group by nancy Guerra, Washington, DC.
Hanushek, e. A., and S. G. Rivkin. 2010. “Generalizations about using value-Added Measures of Teacher Quality.” American Economic Review 100 (2): 267–71.
Heckman, J. J., and D. v. Masterov. 2007. “The Productivity Argument for investing in Young Children.” Review of Agricultural Economics 29 (3): 446–93.
Ho, e. 2012. “Student Learning Assessment.” uneSCo, Paris.
ingersoll, R., and M. Strong. 2011. “The impact of induction and Mentoring Programs for Beginning Teachers: A Critical Review of the Research. Review of education Research.” 81 (2): 201–33. doi:10.3102/0034654311403323.
Jakubowski, Maciej. 2015. “opening up opportunities for Reform in Poland: An iBS Policy Paper.” evidence institute, university of Warsaw, Poland.

110 | SRi LAnkA HuMAn CAPiTAL DeveLoPMenT
Jha, J., and F. kelleher. 2006. “Boys’ underachievement in education: An exploration in Selected Commonwealth Countries.” Commonwealth Secretariat, London.
kagan, S., ed. 2018. “The early Advantage: Rapid Change in early Childhood education and Care around the World.” national Center on education and the economy (nCee), Washington, DC.
kellaghan, T., v. Greaney, and T. S. Murray. 2009. “using the Results of a national Assessment of educational Achievement.” in National Assessments of Educational Achievement, vol. 5. Washington, DC: World Bank. https://openknowledge.worldbank.org/handle/10986/2667.
kim, S. H., and J. Bagaka. 2005. “The Digital Divide in Students’ usage of Technology Tools: A Multilevel Analysis of the Role of Teacher Practices and Classroom Characteristics.” Contemporary Issues in Technology and Teacher Education [online serial], 5 (3/4). https://site.aace.org/pubs/cite/.
Lai, F., L. Q. Zhang, X. Hu, S. Yaojiang, M. Boswell, and S. Rozelle. 2012. “Does Computer-Assisted Learning improve Learning outcomes? evidence from a Randomized experiment in Public Schools in Rural Minority Areas in Qinghai, China.” Working paper, Rural education Program, Stanford university, Stanford, CA.
Lee, M. n., and S. S. Thah. 2016. “Building and Sustaining national iCT/education Agencies: Lessons from Malaysia.” SABeR-iCT Technical Paper Series, World Bank, Washington, DC.
Lim, C., k. Cock, G. Lock, and C. Brock. 2009. Innovative Practices in Pre-Service Teacher Education: An Asia-Pacific Perspective. Rotterdam: Sense Publishers.
Linden, Leigh L. 2008. “Complement or Substitute? The effect of Technology on Student Achievement in india.” infoDev Working Paper 17, World Bank, Washington, DC.
Little, A. W., H. Aturupane, and M. Shojo. 2013. “Transforming Primary education in Sri Lanka: From a ‘Subject’ of education to a ‘Stage’ of education.” South Asia Human Development Sector Discussion Paper no. 61, World Bank, Washington, DC.
Michalopoulos, C., k. Faucetta, A. Warren, and R. Mitchell. 2017. Evidence on the Long-Term Effects of Home Visiting Programs: Laying the Groundwork for Long-Term Follow-Up in the Mother and Infant Home Visiting Program Evaluation (MIHOPE). oPRe Report 2017-73. Washington, DC: office of Planning, Research and evaluation, Administration for Children and Families, uS Department of Health and Human Services.
Moran, P., D. Ghate, and A. van Der Merwe. 2004. “What Works in Parenting Support? A Review of the international evidence.” Department for education and Skills, London.
Muralidharan, k., A. Singh, and A. Ganimian. 2016. “Disrupting education? experimental evidence on Technology-Aided instruction in india.” nBeR Working Paper 22923, national Bureau of economic Research, Cambridge, MA.
Muralidharan, k., and v. Sundararaman. 2010. “The impact of Diagnostic Feedback to Teachers on Student Learning: experimental evidence from india.” Economic Journal 120 (546): F187–F203.
oeCD (organisation for economic Co-operation and Development). 2012. “encouraging Quality in early Childhood education and Care (eCeC).” Research Brief: Qualifications, education and Professional Development Matter. oeCD, Paris.
oeCD (organisation for economic Co-operation and Development). 2013a. “Fostering Learning Communities among Teachers.” Teaching in Focus, oeCD, Paris. https://www .oecd.org/education/school/TiF%20(2013)--n%C2%B04%20(eng)--v2.pdf.
oeCD (organisation for economic Co-operation and Development). 2013b. “Quality Matters in early Childhood education and Care: Sweden.” oeCD, Paris.
oeCD (organisation for economic Co-operation and Development). 2015. “Skills for Social Progress: The Power of Social and emotional Skills.” oeCD Skills Studies, oeCD, Paris.
oeCD (organisation for economic Co-operation and Development). 2018a. “Social and emotional Skills for Student Success and Well-Being: Conceptual Framework for the oeCD Study on Social and emotional Skills.” oeCD education Working Paper no. 173, oeCD, Paris.
oeCD (organisation for economic Co-operation and Development). 2018b. Teaching for the Future: Effective Classroom Practices to Transform Education. Paris: oeCD Publishing.

Key Challenges in Human Capital Development | 111
oeCD (organisation for economic Cooperation and Development). 2018c. “The Power and Promise of early Learning.” oeCD education Working Paper no. 186, oeCD, Paris.
Pillay, H., L. A. Muttaqi, Y. Pant, and n. Herath. 2015. “Teacher Professional Development.TA-6637 ReG: Development Partnership Program for South Asia: Subproject 11: innovative Strategies for Accelerated Human Resources Development in South Asia.” Asian Development Bank, Manila, Philippines.
Pirtle, S. S., and e. Tobia. 2014. “implementing effective Professional Learning Communities.” SEDL Insights 2 (3).
Raju, D. 2017. “Public School Teacher Management in Sri Lanka: issues and options.” South Asia Economic Journal 18 (1): 39–63.
Rockoff, Jonah e. 2004. “The impact of individual Teachers on Student Achievement: evidence from Panel Data.” American Economic Review 94 (2): 247–52.
RTi international. 2016. “early Grade Reading Assessment Toolkit.” RTi, Durham, nC.
Sama-Miller, e., L. Akers, and A. Mraz-esposito. 2018. Home Visiting Evidence of Effectiveness Review: Executive Summary. Washington, DC: office of Planning, Research and evaluation, Administration for Children and Families, uS Department of Health and Human Services.
Schleicher, A. 2011. Building a High-Quality Teaching Profession: Lessons from around the World. international Summit on the Teaching Profession. Paris: oeCD Publishing.
Schleicher, A. 2016. Teaching Excellence through Professional Learning and Policy Reform: Lessons from around the World. International Summit on the Teaching Profession. Paris: oeCD Publishing.
Shanghai Municipal education Commission. 2007. “notice on issuing the Eleventh Ten Year Program for Building a Teaching Team for Shanghai’s Basic education.” http://www .chinalawedu.com/falvfagui/ fg22598/252105.shtml.
Shirakawa, Y. 2010. “Japan’s early education and Childcare Departing from Their Foundations.” Child Research net. http://www.childresearch.net/projects/ecec/2010_01.html.
Shonkoff, J. P., and D. A. Phillips, eds. 2000. From Neurons to Neighborhoods: The Science of Early Childhood Development. Washington, DC: national Academies Press.
Solotaroff, Jennifer L., George Joseph, and Anne T. kuriakose. 2020. Getting to Work: Unlocking Women’s Potential in Sri Lanka’s Labor Force. Directions in Development. Washington, DC: World Bank.
Springer, M. G., D. Ballou, L. Hamilton, v. Le, J. R. Lockwood, D. F. McCaffrey, and M. Pepper. 2010. “Teacher Pay for Performance: experimental evidence from the Project on incentives in Teaching.” national Center on Performance incentives, vanderbilt university, nashville, Tn.
SRi international. 2014. “Research on the use of khan Academy in Schools.” Research brief, SRi international, Menlo Park, CA.
Sri Lanka, Government of. 2016a. GoSL eCD national Census 2016. Colombo.
Sri Lanka, Government of. 2016b. Household income and expenditure Survey (HieS). http://repo.statistics.gov.lk/bitstream/handle/1/784/HieS2016_FinalReport.pdf?sequence =1&isAllowed=y.
Sri Lanka, Moe (Ministry of education). 2017. School Census Report 2017. https://moe.gov.lk/wp -content/uploads/2020/06/School-Census-Report-2017.pdf.
uk DFiD (united kingdom Department for international Development). 2009. “national and international Assessments of Student Achievement: A Guidance note.” DFiD, London.
uneSCo (united nations educational, Scientific and Cultural organization). 2013. Education for All 2013–2014: Teaching and Learning: Achieving Quality for All. Paris: uneSCo.
uneSCo (united nations educational, Scientific and Cultural organization). 2018. “Pre-service Teacher Preparation.” uneSCo Learning Portal: Brief 4, iieP uneSCo, Paris.
vescio, v., D. Ross, and A. Adams. 2008. “A Review of Research on the impact of Professional Learning Communities on Teaching Practice and Student Learning.” Teaching and Teacher Education 24 (1): 80–91.

112 | SRi LAnkA HuMAn CAPiTAL DeveLoPMenT
Warnasuriya, R., S. Sosale, and S. Dey. 2020. Integrating Early Childhood Care and Education in Sri Lanka: From Global Evidence to National Action. international Development in Focus. Washington, DC: World Bank.
Wechsler, M., H. Melnick, A. Maier, and J. Bishop. 2016. “The Building Blocks of High-Quality early Childhood education Programs.” Policy brief, Learning Policy institute, Palo Alto, CA.
Wei, R. C., L. Darling-Hammond, A. Andree, n. Richardson, and S. orphanos. 2009. Professional Learning in the Learning Profession: A Status Report on Teacher Development in the United States and Abroad. Dallas, TX: national Staff Development Council.
World Bank. 2018. World Development Report 2018: Learning to Realize Education’s Promise. Washington, DC: World Bank.
Yoon, k. S., T. Duncan, S. Wen-Yu Lee, B. Scarloss, and k. L. Shapley. 2007. “Reviewing the evidence on How Teacher Professional Development Affects Student Achievement.” issues and Answers Report ReL 2007–033, Regional educational Laboratory, Southwest, national Center for education Statistics, institute of education Sciences, uS Department of education, Washington, DC.
Yoshikawa, H., C. Weiland, J. Brooks-Gunn, M. R. Burchinal, L. espinosa, W. T. Gormley, L. Ludwig, et al. 2013. “investing in our Future: The evidence Base on Preschool education.” Society for Research in early Childhood Development and the Foundation for Child Development.
Zhang, M., X. Ding, and J. Xu. 2016. Developing Shanghai’s Teachers. Washington, DC: national Center on education and the economy.
Zheng, B., M. Warschauer, C.-H. Lin, and C. Chang. 2016. “Learning in one-to-one Laptop environments: A Meta-Analysis and Research Synthesis.” Review of Educational Research 86 (4): 1052–108.

113
INTRODUCTION
Higher education is increasingly important for development in the modern, technologically advanced, knowledge-intensive global economy. The economic benefits of investment in higher education have been steadily increasing over the last 30 years (Psacharapoulos and Patrinos 2018). However, participation in higher education in Sri Lanka is low by international standards (Aturupane 2017; Gunatilleke 2015). Higher education enrollment is considerably below that in East Asian middle-income countries such as China, Indonesia, Malaysia, Mongolia, the Philippines, and Thailand, as well as India in South Asia (figure 5.1). However, the demand for higher education is increasing in Sri Lanka because the number of students who are completing secondary education is large and rising (Dundar et al. 2017). Furthermore, the demand for higher education is income elastic; as the per capita income of the country increases and the aspira-tions of young people grow, the demand for higher education will rise. In addi-tion, employers in the private sector are seeking graduates with high-quality knowledge, skills, and expertise for their firms and industries.
The low level of higher education participation in Sri Lanka is also reflected at the provincial level. The higher education enrollment rate is below 20 percent in all provinces (figure 5.2). The highest enrollment rates are in Western and Central Provinces (18 percent), followed by Southern Province (17 percent) and North Western and Sabaragamuwa Provinces (16 percent). North Central Province, with an enrollment rate of 8 percent, has the lowest participation rate, followed by Uva Province (11 percent) and Eastern and Northern Provinces (13 percent). The pattern of educational outcomes across provinces as measured by learning levels in schools appears to be replicated by higher education as well. The provinces that have the highest learning outcomes in general education also have the largest higher education enrollment rates.
The government has a multipronged strategy to develop the higher education system. The key components of this strategy are (1) to increase enrollment in degree programs important for economic development; (2) to improve the quality of uni-versity education, especially the labor market relevance of degree programs; and (3) to enhance research and innovation. These are vitally important development
Human Capital DevelopmentTRANSFORMING HIGHER EDUCATION5

114 | SrI LANkA HUMAN CAPITAL DEvELoPMENT
Source: World Bank, Education Statistics (EdStats), https://datatopics.worldbank.org/education/.Note: GDP = gross domestic product; GER = gross enrollment ratio.
Afghanistan
Algeria
Argentina
Armenia
Bangladesh
Bulgaria
Chile
China
Czech Republic
Egypt, Arab Rep.
El Salvador
Hungary
India
Indonesia
Jamaica
Japan
Jordan
Korea, Rep.
Malaysia
Maldives
Mexico
Mongolia
Nepal Pakistan
Peru
Philippines
Romania
Singapore
Sri Lanka
ThailandUnited Kingdom
Poland
Slovak RepublicEcuador
United States
Russian Federation
Canada
0
10
20
30
40
50
60
70
80
90
100
6.2 7.2 8.2 9.2 10.2 11.2
Hig
her
ed
uca
tion G
ER
Real log GDP per capita
FIGURE 5.1
Higher education enrollment in international perspective: Selected countries, 2014–16
Source: World Bank team calculations based on Sri Lanka Household Income and Expenditure Survey 2016 (Sri Lanka, DCS 2017). Note: GER = gross enrollment rate.
18 1817
13 13
8
11
16
0
2
4
6
8
10
12
14
16
18
20
Wes
tern
Centra
l
Sout
hern
North
ern
Easte
rn
16
North
Wes
tern
North
Cen
tral
Uva
Saba
raga
muw
a
Hig
her
ed
uca
tion G
ER
FIGURE 5.2
Higher education enrollment, by province: Sri Lanka, 2016

Human Capital Development | 115
initiatives. Sri Lanka’s higher education enrollment (about 18 percent) is well below the average for lower-middle-income countries (24 percent) and upper-mid-dle-income countries (52 percent). Increasing enrollment is, therefore, necessary. Improving the labor market relevance of degree programs is required to meet the needs of an evolving economy that is seeking to develop through private sector–led and export-oriented growth. research and innovation are underdeveloped in Sri Lanka because all universities are mainly teaching institutions. Sri Lanka performs relatively poorly across a variety of research and innovation rankings, such as the number of citable documents per million population and the number of patent applications submitted (Dundar et al. 2017).
HIGHER EDUCATION AND PROVINCIAL DEVELOPMENT
Higher education can contribute directly to development of Sri Lanka’s prov-inces. The location of large higher education institutions such as universities in provincial towns has the potential to stimulate regional economic development through multiple channels. The presence of thousands of students and hundreds of staff members generates demand for a wide array of commodities, including food, clothing, housing, education and cultural activities, recreation, and trans-port. Substantial inflows of investment in response to these demands can trans-form a regional economy (Harrison and Turok 2017). For example, small towns can become large towns when universities spring up in their neighborhood. The production of graduates can also supply regional economies with educated human resources for managerial, professional, and technical jobs.
Sri Lanka has a network of universities across all the provinces: six in Western Province, two in Eastern Province, and one university in each of the other prov-inces (figure 5.3). The large number of universities in Western Province reflects
Source: World Bank team calculations from Sri Lanka, University Grants Commission (2017).
Western, 6.4%
Central, 1.6%
Southern,1.6%
North Western,1.7%
Northern, 2.1%
Eastern, 1.7%
North Central, 1.7%
Uva, 1.7%
Sabaragamuwa, 1.7%
FIGURE 5.3
Share of universities, by province: Sri Lanka, 2016/17

116 | SrI LANkA HUMAN CAPITAL DEvELoPMENT
its high population density and the historical evolution of the university system in the mid-twentieth century. The existence of at least one university in every province, however, is the result of a government policy from the 1990s (Aturupane 1993) to the early twenty-first century (Aturupane et al. 2009). During this period, the government deliberately opened a university in all the provinces lacking one, mainly to promote regional economic growth.
The largest university enrollments—61,000 undergraduate students and 20,000 postgraduate students—are in universities in Western Province (tables 5.1 and 5.2), accounting for 57 percent of all undergraduate students (figure 5.4) and 85 percent of all postgraduate students (figure 5.5). The main reason for the prominence of Western Province is that universities in the region are older and so have had a longer period over which to develop than nearly all the universities in the other provinces. only the University of Peradeniya in Central Province is comparable in age to the University of Colombo in Western Province. As noted, the universities in North Central, North Western, Sabaragamuwa, Eastern, and Uva Provinces were established only in the mid-1990s and the early 2000s to enable each province to have at least one university, thereby promoting regional development and geograph-ical equity.
The next stage of higher education development could draw on three global factors affecting higher education: mission differentiation, development of private education, and internationalization. These three factors affecting the global experience first emerged in advanced higher education systems such as those in the United States and Western Europe, but they are now spreading to upper- middle-income countries (UMICs). They could also complement the development of regions through higher education. Described in the next section, mission differentiation, for example, could be used to strategically develop pro-vincial universities and regional economies, emphasizing variously teaching and learning, community services and regional development, or research and inno-vation. Meanwhile, promotion of private universities could help provinces attract investment and stimulate their economies. Finally, internationalization could enable provincial universities to reach out to global flows of knowledge and ideas and accelerate their development.
MISSION DIFFERENTIATION OF UNIVERSITIES
In Sri Lanka, mission differentiation would be the logical next stage in develop-ing the country’s higher education system. one set of universities, mainly drawn from the newer higher education institutions in the provinces, could be desig-nated as predominantly teaching universities, focusing on excellence in teaching and learning. The financing of these universities, and their internal governance systems, could reflect this mission. A second set of universities could emphasize, along with their teaching functions, community services and regional development. And a third set of universities, mainly drawn from among the older, more developed higher education institutions, could have, in addition to their teaching role, an important mandate to pursue research and innovation and the commercialization of innovations.
The division between predominantly teaching universities and universities with a stronger research mandate should be linked to the quantity and quality of academic staff. The older and more established universities, such as Peradeniya,
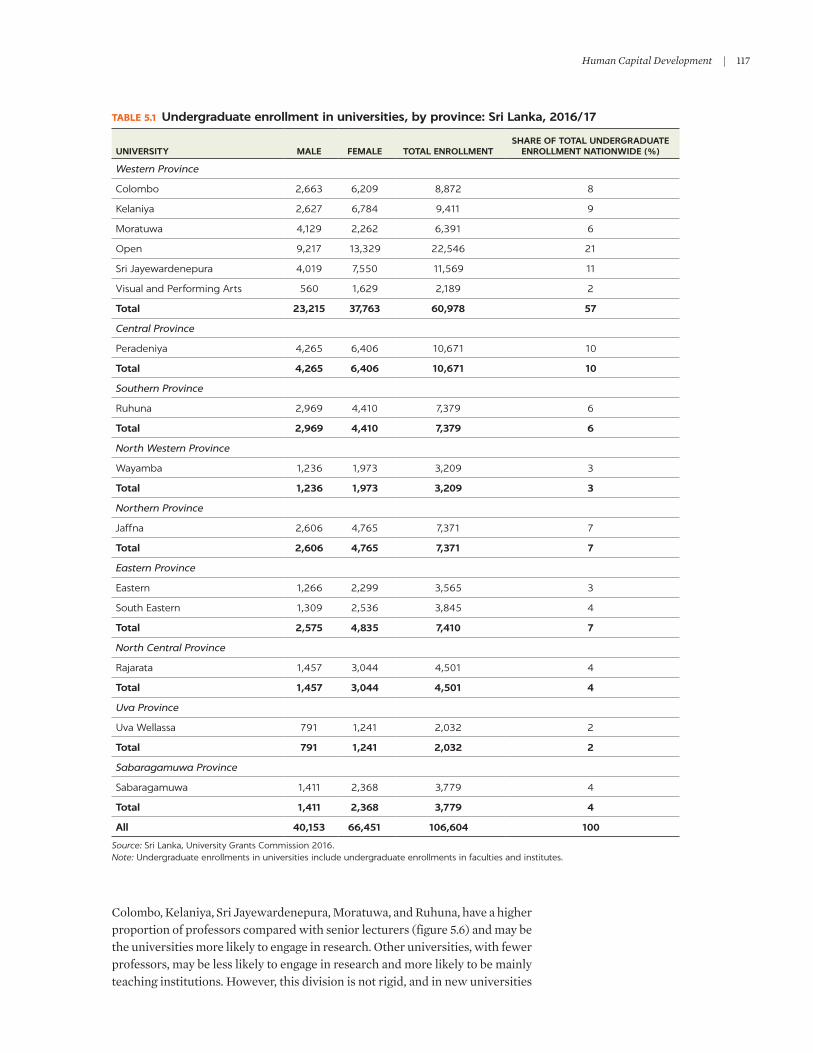
Human Capital Development | 117
Colombo, kelaniya, Sri Jayewardenepura, Moratuwa, and ruhuna, have a higher proportion of professors compared with senior lecturers (figure 5.6) and may be the universities more likely to engage in research. other universities, with fewer professors, may be less likely to engage in research and more likely to be mainly teaching institutions. However, this division is not rigid, and in new universities
TABLE 5.1 Undergraduate enrollment in universities, by province: Sri Lanka, 2016/17
UNIVERSITY MALE FEMALE TOTAL ENROLLMENTSHARE OF TOTAL UNDERGRADUATE
ENROLLMENT NATIONWIDE (%)
Western Province
Colombo 2,663 6,209 8,872 8
Kelaniya 2,627 6,784 9,411 9
Moratuwa 4,129 2,262 6,391 6
Open 9,217 13,329 22,546 21
Sri Jayewardenepura 4,019 7,550 11,569 11
Visual and Performing Arts 560 1,629 2,189 2
Total 23,215 37,763 60,978 57
Central Province
Peradeniya 4,265 6,406 10,671 10
Total 4,265 6,406 10,671 10
Southern Province
Ruhuna 2,969 4,410 7,379 6
Total 2,969 4,410 7,379 6
North Western Province
Wayamba 1,236 1,973 3,209 3
Total 1,236 1,973 3,209 3
Northern Province
Jaffna 2,606 4,765 7,371 7
Total 2,606 4,765 7,371 7
Eastern Province
Eastern 1,266 2,299 3,565 3
South Eastern 1,309 2,536 3,845 4
Total 2,575 4,835 7,410 7
North Central Province
Rajarata 1,457 3,044 4,501 4
Total 1,457 3,044 4,501 4
Uva Province
Uva Wellassa 791 1,241 2,032 2
Total 791 1,241 2,032 2
Sabaragamuwa Province
Sabaragamuwa 1,411 2,368 3,779 4
Total 1,411 2,368 3,779 4
All 40,153 66,451 106,604 100
Source: Sri Lanka, University Grants Commission 2016. Note: Undergraduate enrollments in universities include undergraduate enrollments in faculties and institutes.
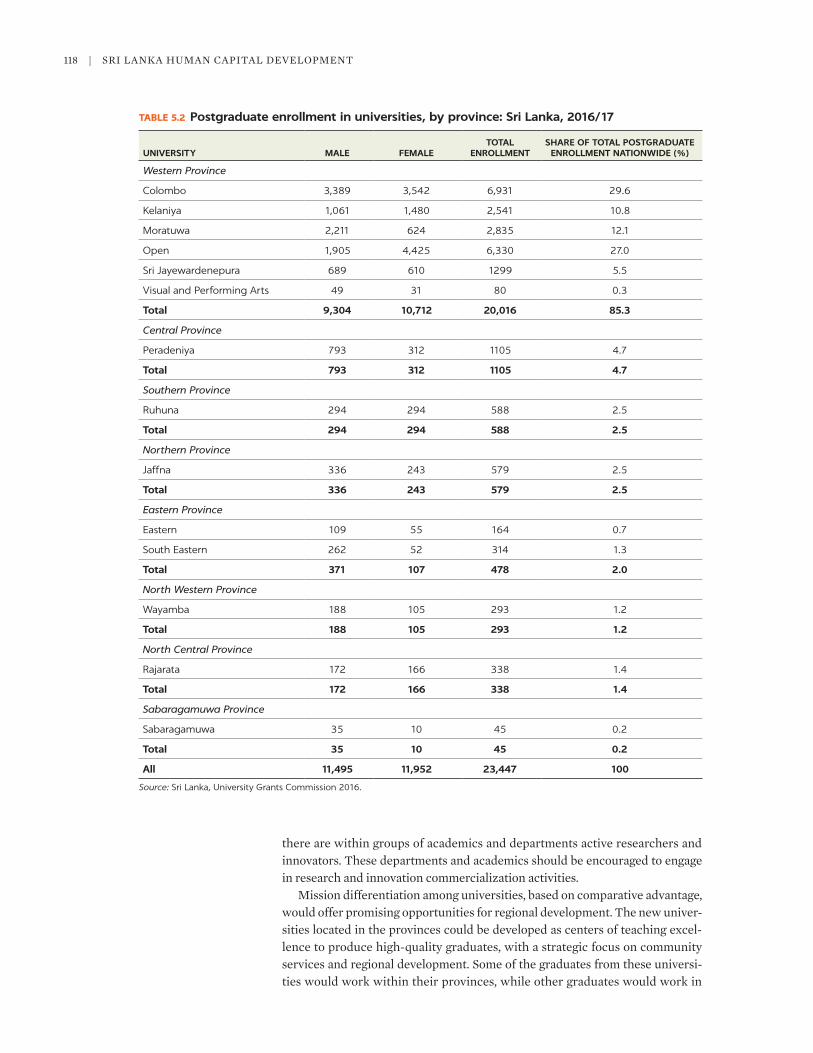
118 | SrI LANkA HUMAN CAPITAL DEvELoPMENT
there are within groups of academics and departments active researchers and innovators. These departments and academics should be encouraged to engage in research and innovation commercialization activities.
Mission differentiation among universities, based on comparative advantage, would offer promising opportunities for regional development. The new univer-sities located in the provinces could be developed as centers of teaching excel-lence to produce high-quality graduates, with a strategic focus on community services and regional development. Some of the graduates from these universi-ties would work within their provinces, while other graduates would work in
TABLE 5.2 Postgraduate enrollment in universities, by province: Sri Lanka, 2016/17
UNIVERSITY MALE FEMALETOTAL
ENROLLMENTSHARE OF TOTAL POSTGRADUATE ENROLLMENT NATIONWIDE (%)
Western Province
Colombo 3,389 3,542 6,931 29.6
Kelaniya 1,061 1,480 2,541 10.8
Moratuwa 2,211 624 2,835 12.1
Open 1,905 4,425 6,330 27.0
Sri Jayewardenepura 689 610 1299 5.5
Visual and Performing Arts 49 31 80 0.3
Total 9,304 10,712 20,016 85.3
Central Province
Peradeniya 793 312 1105 4.7
Total 793 312 1105 4.7
Southern Province
Ruhuna 294 294 588 2.5
Total 294 294 588 2.5
Northern Province
Jaffna 336 243 579 2.5
Total 336 243 579 2.5
Eastern Province
Eastern 109 55 164 0.7
South Eastern 262 52 314 1.3
Total 371 107 478 2.0
North Western Province
Wayamba 188 105 293 1.2
Total 188 105 293 1.2
North Central Province
Rajarata 172 166 338 1.4
Total 172 166 338 1.4
Sabaragamuwa Province
Sabaragamuwa 35 10 45 0.2
Total 35 10 45 0.2
All 11,495 11,952 23,447 100
Source: Sri Lanka, University Grants Commission 2016.

Human Capital Development | 119
other regions of the country or overseas. In keeping with their regional develop-ment mandates, universities could create degree programs seeking to cater in part to their provincial labor market needs. For example, universities located in areas with a strong potential for tourism—such as Eastern and Northern Provinces with their coastlines and beaches and North Central Province with its ancient cities—could seek to produce the human resources required for rapid
Source: World Bank team calculations based on Sri Lanka, University Grants Commission (2017).
Western, 57%
Central, 10%
Southern, 6%
North Western,7%
Northern, 7%
Eastern, 3%
North Central, 4%Uva, 2%
Sabaragamuwa, 4%
FIGURE 5.4
Share of undergraduate university enrollment, by province: Sri Lanka, 2016/17
Source: World Bank team calculations based on Sri Lanka, University Grants Commission (2017).
Western, 85%
Central, 5%
Southern, 3%
Northern, 3%
Eastern,2%
North Western, 1%
North Central, 1%Sabaragamuwa, 0%
FIGURE 5.5
Share of postgraduate university enrollment, by province: Sri Lanka, 2016/17
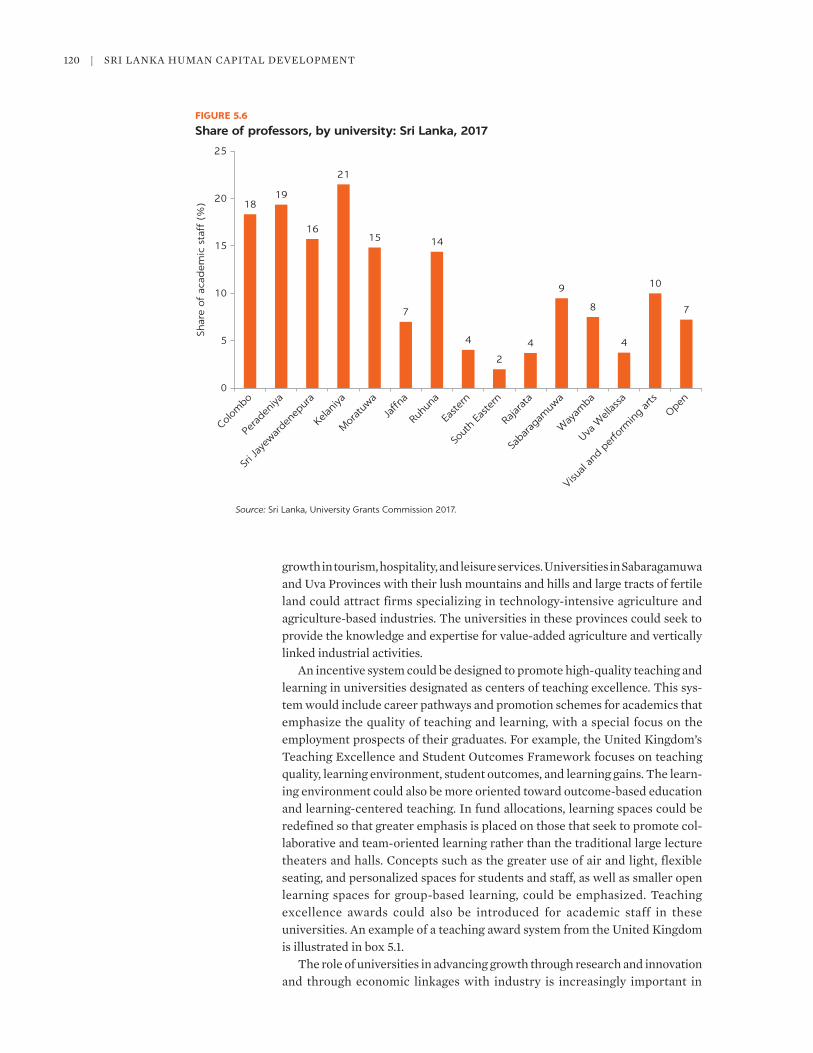
120 | SrI LANkA HUMAN CAPITAL DEvELoPMENT
growth in tourism, hospitality, and leisure services. Universities in Sabaragamuwa and Uva Provinces with their lush mountains and hills and large tracts of fertile land could attract firms specializing in technology-intensive agriculture and agriculture-based industries. The universities in these provinces could seek to provide the knowledge and expertise for value-added agriculture and vertically linked industrial activities.
An incentive system could be designed to promote high-quality teaching and learning in universities designated as centers of teaching excellence. This sys-tem would include career pathways and promotion schemes for academics that emphasize the quality of teaching and learning, with a special focus on the employment prospects of their graduates. For example, the United kingdom’s Teaching Excellence and Student outcomes Framework focuses on teaching quality, learning environment, student outcomes, and learning gains. The learn-ing environment could also be more oriented toward outcome-based education and learning-centered teaching. In fund allocations, learning spaces could be redefined so that greater emphasis is placed on those that seek to promote col-laborative and team-oriented learning rather than the traditional large lecture theaters and halls. Concepts such as the greater use of air and light, flexible seating, and personalized spaces for students and staff, as well as smaller open learning spaces for group-based learning, could be emphasized. Teaching excellence awards could also be introduced for academic staff in these universities. An example of a teaching award system from the United kingdom is illustrated in box 5.1.
The role of universities in advancing growth through research and innovation and through economic linkages with industry is increasingly important in
Source: Sri Lanka, University Grants Commission 2017.
1819
16
21
15
7
14
4
2
4
9
8
4
10
7
0
5
10
15
20
25
Colom
bo
Pera
deni
ya
Sri J
ayew
arde
nepur
a
Kelan
iya
Mor
atuw
a
Jaffn
a
Ruhu
na
Easte
rn
Sout
h Ea
stern
Rajar
ata
Saba
raga
muw
a
Way
amba
Uva W
ellas
sa
Visual
and
perfo
rmin
g ar
ts
Open
Shar
e of
acad
emic
sta
ff (
%)
FIGURE 5.6
Share of professors, by university: Sri Lanka, 2017

Human Capital Development | 121
upper-middle-income and high-income economies (Altbach 2013). Sri Lanka’s innovation policy acknowledges the value of universities in promoting innovation-led growth. The older, established universities, such as the more research-oriented universities, could place a greater emphasis on research, leading to innovations and the commercialization of innovations. The funding mechanisms, the incentive framework for academic staff, and the governance systems of these universities could explicitly recognize their roles as develop-mental universities. Science, technology, engineering, and mathematics (STEM) academics could be encouraged to undertake research and innovation, leading to intellectual property such as patents and industrial designs. Social science and humanities academics could be encouraged to engage in policy-oriented research, which is useful for economic growth and social and cultural develop-ment. The latter could also result in intellectual property such as copyrights and trademarks.
Policy initiatives can promote stronger linkages between the developmental universities and industry (Guimon 2013). To this end, University-Business Linkage (UBL) Cells were recently established in universities. They can provide support services to match firms and universities for research and development activities. The UBL Cells can also engage in outreach activities to promote net-working and create awareness of the benefits of collaboration between academ-ics and industry. In addition, the UBL Cells can develop technology transfer offices and business incubators in universities. research commercialization activities can be supported through innovation grants to universities and firms for collaborative research and development projects.
A framework for promoting university-industry collaboration in the context of a mission-differentiated higher education system in which some institutions emphasize teaching excellence and other universities emphasize research and innovation is presented in table 5.3. Teaching universities in less developed prov-inces could seek to improve the labor market relevance of degree programs for
National Teaching Fellowship Scheme awards: United Kingdom
The United kingdom’s National Teaching Fellowship Scheme (NTFS) awards celebrated outstanding teach-ing and learning in higher education. Academics from England, Scotland, Ireland, and Wales were eligible to apply. Each higher education institution could nomi-nate up to three academics.
The awards could be used by the winners for pro-fessional development in teaching and learning. In fact, the awards opened new opportunities for career development and progression. Award-winning indi-viduals received recognition within the United kingdom and overseas because the selection process was highly competitive. Award winners also became
part of a community of professionals who were pas-sionate about higher education teaching.
Higher education institutions also benefited. According to the NTFS, its awards were “increasingly used as a model to develop and extend university-wide schemes, aiming to raise the status of teaching and instill pride in the profession and student learning” and “enable staff to cross boundaries, collaborating with colleagues in other disciplines and forging links with universities abroad.”
During its more than 19 years of existence, the NTFS offered awards to about 860 NTFS fellows from over 40 academic disciplines.
Source: The Higher Education Academy, England and Wales.
BOX 5.1
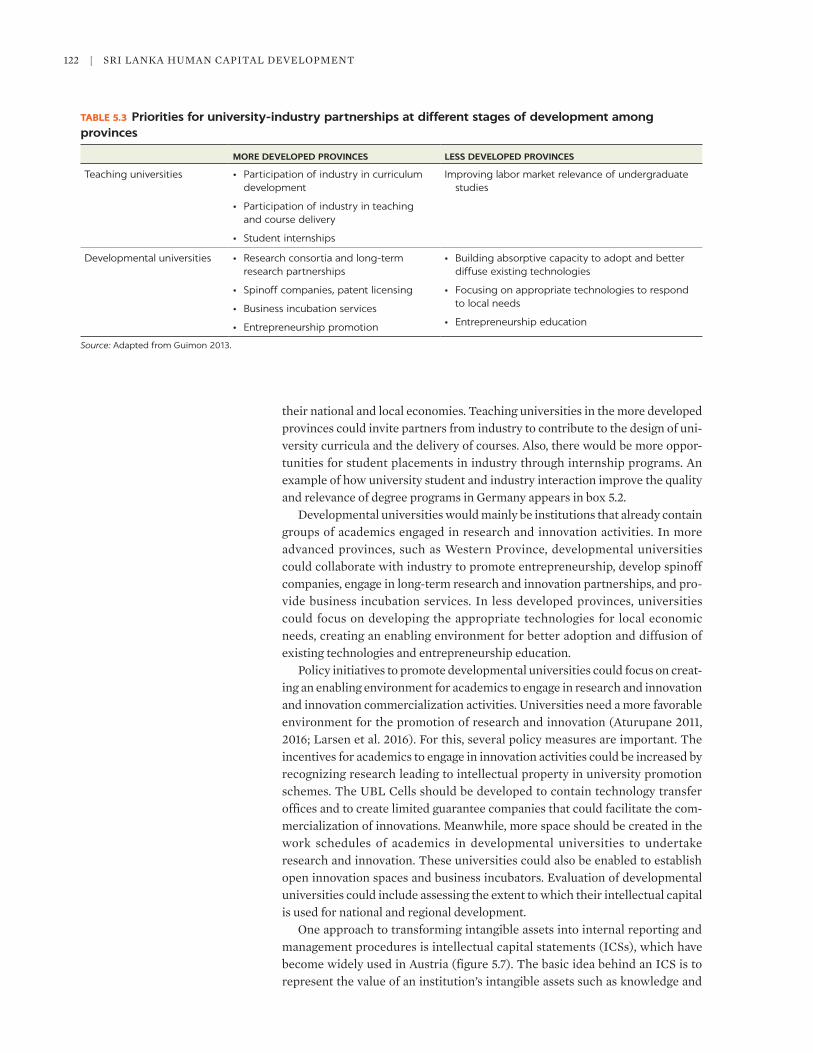
122 | SrI LANkA HUMAN CAPITAL DEvELoPMENT
their national and local economies. Teaching universities in the more developed provinces could invite partners from industry to contribute to the design of uni-versity curricula and the delivery of courses. Also, there would be more oppor-tunities for student placements in industry through internship programs. An example of how university student and industry interaction improve the quality and relevance of degree programs in Germany appears in box 5.2.
Developmental universities would mainly be institutions that already contain groups of academics engaged in research and innovation activities. In more advanced provinces, such as Western Province, developmental universities could collaborate with industry to promote entrepreneurship, develop spinoff companies, engage in long-term research and innovation partnerships, and pro-vide business incubation services. In less developed provinces, universities could focus on developing the appropriate technologies for local economic needs, creating an enabling environment for better adoption and diffusion of existing technologies and entrepreneurship education.
Policy initiatives to promote developmental universities could focus on creat-ing an enabling environment for academics to engage in research and innovation and innovation commercialization activities. Universities need a more favorable environment for the promotion of research and innovation (Aturupane 2011, 2016; Larsen et al. 2016). For this, several policy measures are important. The incentives for academics to engage in innovation activities could be increased by recognizing research leading to intellectual property in university promotion schemes. The UBL Cells should be developed to contain technology transfer offices and to create limited guarantee companies that could facilitate the com-mercialization of innovations. Meanwhile, more space should be created in the work schedules of academics in developmental universities to undertake research and innovation. These universities could also be enabled to establish open innovation spaces and business incubators. Evaluation of developmental universities could include assessing the extent to which their intellectual capital is used for national and regional development.
one approach to transforming intangible assets into internal reporting and management procedures is intellectual capital statements (ICSs), which have become widely used in Austria (figure 5.7). The basic idea behind an ICS is to represent the value of an institution’s intangible assets such as knowledge and
TABLE 5.3 Priorities for university-industry partnerships at different stages of development among provinces
MORE DEVELOPED PROVINCES LESS DEVELOPED PROVINCES
Teaching universities • Participation of industry in curriculum development
• Participation of industry in teaching and course delivery
• Student internships
Improving labor market relevance of undergraduate studies
Developmental universities • Research consortia and long-term research partnerships
• Spinoff companies, patent licensing
• Business incubation services
• Entrepreneurship promotion
• Building absorptive capacity to adopt and better diffuse existing technologies
• Focusing on appropriate technologies to respond to local needs
• Entrepreneurship education
Source: Adapted from Guimon 2013.

Human Capital Development | 123
competences, thereby complementing financial reporting procedures. In the model of an ICS developed by the Austrian research Center, intellectual capital is captured through quantitative and qualitative measures and a narrative sec-tion within the ICS. Taking the institution’s overarching vision as a starting point, knowledge objectives and related measures (covering intellectual capital,
Involvement of external stakeholders in program development and improvement at Mittelhessen University of Applied Sciences, Glessen, Germany
The possible scope of external stakeholder involve-ment in the development and implementation of higher education programs is exemplified by work-integrated programs in Germany such as the ones offered by Mittelhessen University of Applied Sciences (UAS). To align its programs more closely with the demands of employers in the region, Mittelhessen UAS developed work-integrated pro-grams characterized by a combination of phases of study at Mittelhessen UAS and phases of work at the companies participating in the programs. Mittelhessen UAS and the employers work together on different levels for the development, implementation, and improvement of these programs.
The basic structure of all programs was developed jointly, including the regional chambers. To implement
the programs, a special center established at Mittelhessen UAS receives advice from a board staffed with representatives of Mittelhessen UAS and the com-panies participating in the work- integrated programs. The involvement of both parties in this board ensures a connection between the theoretical and practical parts of the programs as well as up-to-date study con-tent in line with the employers’ requirements. This connection is reinforced by boards at lower levels responsible for certain program fields. They deal with, among other things, the continual development of programs, quality assurance processes, and knowl-edge transfer activities. There is an additional connection between employers and programs in that practitioners from the companies are directly involved in teaching activities.
Source: Arnhold et al. 2018.
BOX 5.2
Source: Arnhold et al. 2018.
Core processesValue creationpotential
Vision
Corporategoals
Knowledgegoals
Human capital
Structuralcapital
Relationalcapital
Projects
Programs
Results
FinancialResults
Nonfinancialresults
FIGURE 5.7
Structure of an intellectual capital statement: Austria
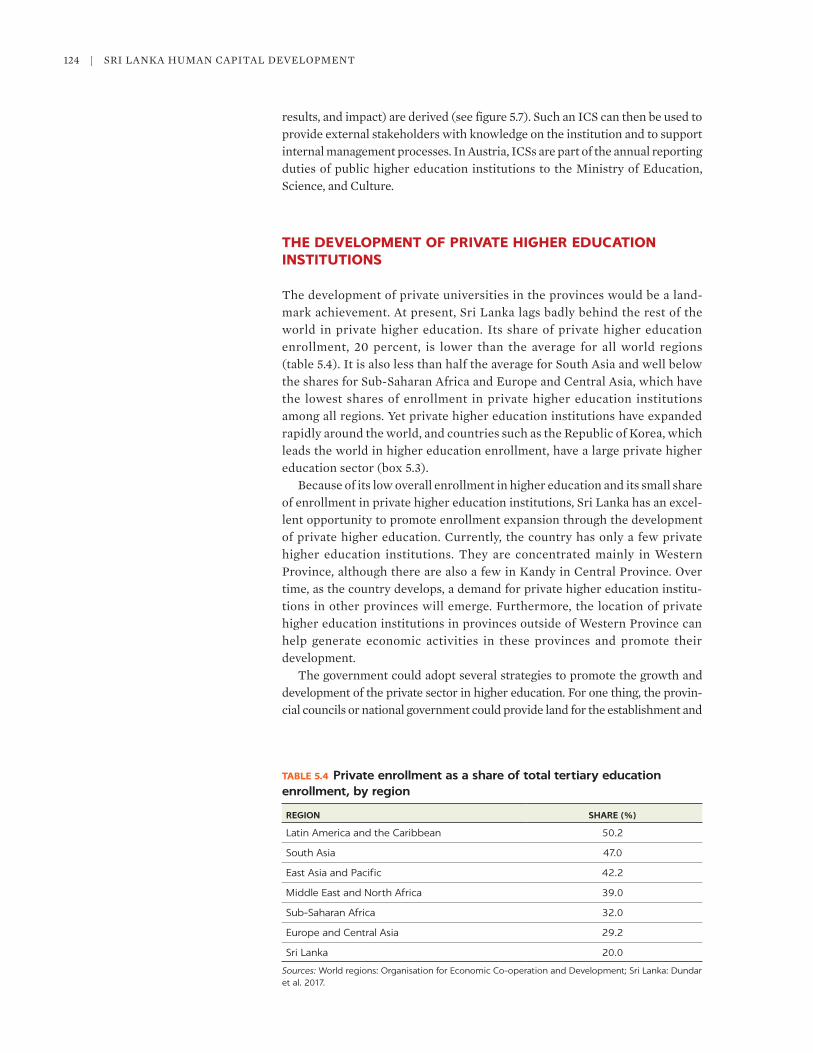
124 | SrI LANkA HUMAN CAPITAL DEvELoPMENT
results, and impact) are derived (see figure 5.7). Such an ICS can then be used to provide external stakeholders with knowledge on the institution and to support internal management processes. In Austria, ICSs are part of the annual reporting duties of public higher education institutions to the Ministry of Education, Science, and Culture.
THE DEVELOPMENT OF PRIVATE HIGHER EDUCATION INSTITUTIONS
The development of private universities in the provinces would be a land-mark achievement. At present, Sri Lanka lags badly behind the rest of the world in private higher education. Its share of private higher education enrollment, 20 percent, is lower than the average for all world regions (table 5.4). It is also less than half the average for South Asia and well below the shares for Sub-Saharan Africa and Europe and Central Asia, which have the lowest shares of enrollment in private higher education institutions among all regions. Yet private higher education institutions have expanded rapidly around the world, and countries such as the republic of korea, which leads the world in higher education enrollment, have a large private higher education sector (box 5.3).
Because of its low overall enrollment in higher education and its small share of enrollment in private higher education institutions, Sri Lanka has an excel-lent opportunity to promote enrollment expansion through the development of private higher education. Currently, the country has only a few private higher education institutions. They are concentrated mainly in Western Province, although there are also a few in kandy in Central Province. over time, as the country develops, a demand for private higher education institu-tions in other provinces will emerge. Furthermore, the location of private higher education institutions in provinces outside of Western Province can help generate economic activities in these provinces and promote their development.
The government could adopt several strategies to promote the growth and development of the private sector in higher education. For one thing, the provin-cial councils or national government could provide land for the establishment and
TABLE 5.4 Private enrollment as a share of total tertiary education enrollment, by region
REGION SHARE (%)
Latin America and the Caribbean 50.2
South Asia 47.0
East Asia and Pacific 42.2
Middle East and North Africa 39.0
Sub-Saharan Africa 32.0
Europe and Central Asia 29.2
Sri Lanka 20.0
Sources: World regions: Organisation for Economic Co-operation and Development; Sri Lanka: Dundar et al. 2017.

Human Capital Development | 125
development of private higher education institutions. A well-known strategy, it could be very useful for nonstate higher education institutions because land is one of the largest expenses in setting up or expanding campuses. This strategy would be particularly useful for Northern, Eastern, North Central, and Uva Provinces, which are sparsely populated and have large areas of open land. However, it would be important to select the sites offered carefully because staff and students would need easy access to the educational and health facilities as well as to the cultural and recreational opportunities available in towns.
Financial grants to meet the capital costs of buildings and equipment would be especially useful for nonstate higher education institutions that offer study programs requiring expensive equipment, such as engineering, technology, and the sciences. The heavy setup costs of such degree programs are often a deterrent for private higher education institutions. A grant that subsidizes the cost of purchasing equipment and constructing facilities could be an attractive incentive to crowd-in private sector investment in higher education.
Subsidizing the costs of students enrolled in private higher education institu-tions is yet another strategy. The government has already begun to implement such a policy through a student loan scheme for nonstate higher education institutions. The policy has been successful, with considerable demand for these student loans. Further scaling up of this program with a focus on the provinces could be useful for development of the private higher education sector and for regional development. This could be done, for example, by encouraging higher education institutions to offer study programs relevant to the regional econo-mies and increasing the number of student loans available for such degree programs in the relevant universities.
Nonstate higher education institutions could be established in provinces in conjunction with other activities. For example, information technology firms may wish to establish in the same geographical area institutions awarding computer science and information technology degrees. This model has been successful elsewhere and could be encouraged in Sri Lanka.
Private higher education enrollment in the Republic of Korea
The republic of korea has one of the higher education enrollment rates, 94 percent, in the world. The coun-try has approximately 3.3 million students enrolled in higher education and 359 higher education institu-tions. It also has 222 four-year colleges of which 180 are private, as well as 149 two-year and three-year junior colleges of which 140 are private. overall, about 85 percent of total higher education enrollments are in private institutions.
Private higher education institutions are held in high regard in korea, as in the United States.
The Ministry of Science, ICT, and Future Planning is responsible for the quality assurance and accreditation of korea’s higher education institutions. The establish-ment of institutions and academic departments, cur-riculum and degree requirements, and student quotas are all regulated by the ministry. It identifies seven types of higher education institutions: (1) colleges and universities, (2) industrial universities, (3) universities of education, (4) junior colleges, (5) broadcast and cor-respondence universities, (6) technical colleges, and (7) other miscellaneous institutions.
Source: Ministry of Education and Ministry of Science, ICT, and Future Planning, Republic of Korea.Note: ICT = information and communication technology.
BOX 5.3

126 | SrI LANkA HUMAN CAPITAL DEvELoPMENT
Finally, it should be noted that these policy options and strategies are not mutually exclusive. Multiple policy initiatives could be combined and implemented.
INTERNATIONALIZATION AND THE DEVELOPMENT OF HIGHER EDUCATION
The internationalization of higher education offers excellent prospects for the accelerated development of provincial universities. Internationalization, with cross-border movements of students, staff, and institutions, is one of the most significant recent developments in the global higher education landscape (Altbach 2013, 2015). one of the key features of internationalization is the inte-gration of university teaching and learning across national and regional bound-aries. This integration gives universities in the less advanced provinces opportunities to rapidly develop their teaching and learning activities through connections with overseas universities.
The internationalization of higher education also is an opportunity for prov-inces to attract foreign students and contribute to regional economic growth. Creating an enabling environment for private higher education institutions that cater to both domestic and foreign students could be extremely useful. High-quality private higher education institutions may be able to attract students from other developing countries, including neighbors from South Asia. Such a strat-egy, if successful, would be an important source of income for the province as well as the country.
Initiatives the national government and provincial councils could implement to promote Sri Lanka as a hub for international students include the following:
• Commissioning market research among potential students on the image of the country compared with that of competitor countries
• Identifying the most promising overseas markets• Devising strategies for the recruitment of full-time undergraduate and post-
graduate students• Producing promotional and public relations material to stimulate interest
overseas• Developing partnerships with overseas recruitment agents• Promoting the country as a major destination for international academic
conferences• Conducting research into pricing, competitive behavior, and student
satisfaction
The government also needs to work with institutions such as the Board of Investment to implement policies that attract foreign higher education provid-ers, recognizing that such projects can have long lead times to break even (Fielden et al. 2011). An example of how Malaysia is seeking to become a hub for international students is presented in box 5.4.
The private higher education sector can play a central role in promoting Sri Lanka as an international hub for foreign students. The internationalization of higher education provides an excellent opportunity for Sri Lanka to broaden and stimulate higher education development by attracting foreign students. An inflow of foreign students will increase the revenues of domestic higher educa-tion institutions. The presence of foreign students on university campuses will

Human Capital Development | 127
also benefit Sri Lankan students because it would expose them to other cultures and be educationally enriching.
The demand for a university education in Sri Lanka greatly exceeds the supply, and providing foreign students with places in public universities, beyond a small percentage, will be contentious and difficult to justify in the current context. Nonstate higher education institutions do not face such constraints. Developing an enabling environment for nonstate higher education institutions to deliver services to both domestic and foreign students is feasible. Good-quality nonstate higher education institutions would be able to attract students from other low- and middle-income countries, including South Asia neighbors. This is already happening on a small scale, with students from Maldives, for example, traveling to Sri Lanka for higher education. Expanding the inflow of foreign students would be important for the future development of higher education. It would also be a lucrative source of income for the country.
TECHNOLOGY AND HIGHER EDUCATION
Access to digital resources and the growing use of the internet can enhance the quality of teaching and learning in the university system. Internationally, even
An international hub for students: Malaysia
Malaysia has an innovative and effective long-term strategy to attract foreign students. The country began its journey to become a center for overseas uni-versities by entering into twinning arrangements with local universities in the mid-1990s. Later, it undertook credit transfer programs with foreign universities. over time, Malaysia has become a center for branch campuses of overseas universities. The number of international students in Malaysia increased from about 70,000 in 2008 to about 150,000 in 2014. Currently, Malaysia facilitates the entry of foreign stu-dents for higher education through the Malaysian Education Promotion Council. This nonstop center provides information on the Malaysian educational system and other relevant details. The council offers assistance in a range of areas, including information on government-approved universities and colleges, entry requirements for various programs, applications for entrance into universities, admission timetables, financial aid and scholarships, guidance on admission tests and applications for visas, health requirements and procedures, and predeparture information.
Educity in Iskandar Malaysia is a new multidimen-sional economic free trade zone near Singapore. The objective of Educity is to provide high-quality education and to produce a highly skilled workforce for foreign companies in the commercial zone of Iskandar. The University of Southampton, Newcastle University, Netherlands Maritime Institute of Technology, and University of reading have opened branch campuses there. They support a range of intel-lectual service industries such as tourism and leisure, health care and wellness, and the creative arts.
kuala Lumpur Education City is another innova-tive educational project combining commercial and residential operations with branch campuses of foreign universities and local higher education institutions. The government of Malaysia is seeking greater penetration of large regional markets for higher education such as China, India, and Indonesia. The objective is to establish Malaysia as a regional center of excellence and the central hub for a network of international higher education institutions, compa-nies, and services.
Source: Fielden et al. 2011.
BOX 5.4

128 | SrI LANkA HUMAN CAPITAL DEvELoPMENT
the distinction between campus-based learning and e-learning is becoming less relevant and superseded by “blended” learning, in which information and com-munication technology (ICT) and the internet are integrated into curriculum development, course management, and content delivery for on-campus study programs. At the global level are groundbreaking innovations such as khan Academy, open Courseware (MIT), and open Learning Initiatives (Carnegie-Mellon). In addition, campus teaching and learning may incorporate online video lectures, access to e-journals, and searches conducted using Google Scholar, Bing, and WikiPedia. In addition, technologies such as group videocon-ferencing could bring rare expertise from overseas or more developed universi-ties to entire classes of students.
ICT can be used to enhance and support teaching and learning, especially in the less developed provincial universities, thereby bringing them closer to the levels of teaching performance in the more developed metropolitan universities. Some of the following trends in ICT and higher education could facilitate this process:
• Personalized learning and open courseware. A vast quantity of higher educa-tional resources is available on the internet. As a consequence, academics are increasingly providing links to video lectures and texts through which stu-dents can follow studies tailored to their personal interests. For example, the algebra lessons provided by khan Academy are intended to fill gaps in the learning of more disadvantaged students and enable them to attain parity with their peers.
• Teacher-generated open content. Higher education systems offered by the organisation for Economic Co-operation and Development are increasingly empowering academics to identify and create learning resources with the greatest learning impact. Some online textbooks allow teachers to edit, add to, and customize material, and they enable students to prepare a copy precisely tailored to the style and pace of the degree program. These ICT-enabled activities are often supported through nontraditional forms of intellectual property and copyright, such as open Courseware and Creative Commons Licenses.
• Teacher managers or mentors. The role of academic staff members in the lecture halls is being transformed from a “fount of knowledge” to an instruc-tional manager whose role is to assist students through individualized learn-ing pathways, identify applicable learning resources, create collaborative learning opportunities, and provide academic insight and learning support during formal class time and beyond the designated lecture period.
REFERENCES
Altbach, P. 2013. “Advancing the National and Global knowledge Economy: The role of research Universities in Developing Countries.” Studies in Higher Education 38 (3).
Altbach, P. 2015. “Massification and the Global knowledge Economy.” International Higher Education 80: 4–5.
Arnhold, N., E. Pekkola, v. Püttmann, and A. Sursock. 2018. World Bank Support to Higher Education in Latvia. vol. 3, Academic Careers. Washington, DC: World Bank.

Human Capital Development | 129
Aturupane, H. 1993. “Is Education Beneficial? A Macroeconomic Analysis of the Impact of Education on Economic Welfare in a Developing Country.” PhD diss., Cambridge University, Cambridge, Uk.
Aturupane, H. 2011. “Transforming Universities into Centers of research Excellence: Challenges and opportunities.” Parliamentary Research Journal 1 (1): 47–50.
Aturupane, H. 2016. “Enriching and Accelerating Higher Education Development in Sri Lanka.” Gamani Corea Memorial Lecture (2015/16). Gamani Corea Foundation, Colombo, Sri Lanka.
Aturupane, H. 2017. “The Evolving Landscape of University Education in Sri Lanka.” Sri Lanka Journal of Economic Research 5 (2): 3–20.
Aturupane, Harsha, Benoit Millot, John Fielden, and Sam Mikhail. 2009. The Towers of Learning: Performance, Peril and Promise of Higher Education in Sri Lanka. Washington, DC, and Colombo, Sri Lanka: World Bank.
Dundar, H., B. Millot, M. riboud, M. Shojo, H. Aturupane, S. Goyal, and D. raju. 2017. Sri Lanka Education Sector Assessment: Achievements, Challenges and Policy Options. Directions in Development Series, Human Development. Washington DC: World Bank.
Fielden, J., Jane knight, H. Aturupane, and B. Millot. 2011. “Sri Lanka as an Education Hub for International Students.” SASHD Discussion Paper Series 50, South Asia Human Development Unit, World Bank, Washington, DC.
Guimon, J. 2013. “Promoting University-Industry Collaboration in Developing Countries.” Policy Brief, The Innovation Policy Platform. World Bank, Washington, DC.
Gunatilleke, Godfrey. 2015. “A vision for Sri Lanka 2025 and 2035: Pre-requisites for very High Human Development.” Paper presented at Gamani Corea Foundation–Marga Lecture Series, Colombo, Sri Lanka.
Harrison, J., and Turok, I. 2017. “Universities, knowledge and regional Development.” Regional Studies 51 (7): 977–81.
Larsen, k., D. Bandara, M. Esham, and r. Unantenne. 2016. “Promoting University-Industry Collaboration in Sri Lanka: Status, Studies and Policy options.” World Bank, Washington, DC, and Colombo, Sri Lanka.
Psacharapoulos, George, and Harry Patrinos. 2018. “returns to Investment in Education: A Decennial review of the Global Literature.” Education Economics 26 (5): 445–58.
Sri Lanka, DCS (Department of Census and Statistics). 2017. Household Income and Expenditure Survey–2016. DCS and Ministry of National Policies and Economic Affairs, Battaramulla, Sri Lanka.
Sri Lanka, University Grants Commission. 2016. “Sri Lanka University Statistics 2016.” University Grants Commission, Government of Sri Lanka. https://www.ugc.ac.lk/index .php?option =com_content&view=article&id=2029%3Asri-lanka-university-statistics -2017&catid =%3Astatistics&Itemid=70&lang=en.
Sri Lanka, University Grants Commission. 2017. “Sri Lanka University Statistics 2017.” University Grants Commission, Government of Sri Lanka. https://www.ugc.ac.lk/index.php?option =com_content&view=article&id=2029%3Asri-lanka-university-statistics-2017&catid =%3Astatistics&Itemid=70&lang=en.


131
6 A Public Consensus on and Stakeholder Commitment to Human Capital Development
Development of human capital will be of immense benefit and value to Sri Lanka. It will also be a complex and challenging process requiring visionary leadership, ownership, and a long-term commitment from political authorities and policy makers.
The human capital development system has served Sri Lanka well in some areas, but it has performed weakly in others. On the positive side, the human capital development system has brought child survival rates and adult life expectancy up to levels seen in high-income countries. In addition, the number of years of schooling is equal to the levels observed in upper-middle-income and high-income countries. On the negative side, stunting is a persistent challenge, and learning outcomes need substantial improvement. There are also sharp regional differences in stunting and learning outcomes. The development of human capital should be encouraged, relying on the positive achievements of the past and rising to address the challenges through ambitious policy reforms and development initiatives.
The strategic initiatives for human capital development should be prioritized and sequenced. Human capital development is a lively topic of debate in Sri Lanka, and the government has stated that development of the education and health sectors is a high policy priority. The discussion and the menu of development options presented in this report are extensive and far-reaching. The government should select a set of strategic policy initiatives that can be implemented efficiently and equitably. Some of the initiatives presented can be implemented in parallel; others may have to be implemented sequentially, and yet others could be implemented cumulatively.
The human capital development strategy should be broadly communicated among the general public and widespread ownership generated. Reducing stunting and promoting learning are long-term challenges that require sustained commitment to development initiatives from politicians, policy makers, techno-crats, and administrators. In addition, academics, researchers, teachers, princi-pals, doctors, nurses, and health workers are of central importance to the delivery of quality human capital services. Therefore, the ownership and commitment of these key stakeholders are a necessary condition for a successful human capital development strategy. Meanwhile, the political authorities and policy makers need to communicate to these stakeholders the scope, objectives, and rationale

132 | SRI Lanka HuMan CapITaL DeveLOpMenT
for the human capital development program. The choice of strategies to implement, and their ordering and sequencing, must be accomplished with the participation, ownership, and commitment of the education and health communities.
Change and development of the education and health sectors can be controversial and have opponents. These can include stakeholders who feel that their interests are not represented in the development initiatives proposed, parties that are ideologically opposed to the changes, and groups with vested interests. The leaders of change need to build bridges with any stakeholders who may have concerns about the strategy and ensure that these concerns are heard and genuine issues are addressed. The leaders will also need to manage compet-ing ideologies in a way that enables the best options selected for the strategy to be implemented for the overall benefit of the country.
Human capital development in lagging regions, such as the northern, eastern, and other outlying provinces, needs special attention. The human capital development strategy should be differentiated according to the level of performance and need across the different regions. The more advanced provinces, such as Western, Southern, north Western, and Sabaragamuwa provinces, are at a more advanced stage of development. as a result, they can undertake more ambitious development initiatives. By contrast, northern, eastern, uva, north Central, and other distant provinces are relatively underde-veloped and need greater policy attention and assistance.
The media should be allies in the process of implementation of the human capital development strategy. The popular media play a vital role in providing information and shaping the perceptions of the general public. It is important that the achievements of the education and health systems, their future challenges, and the strategies adopted to address these challenges are communicated to and understood by the media. This, in turn, will enable the leaders of change and development to communicate to the general public their vision of the future of the education and health systems and their strategy to achieve that vision. The support and understanding of the public will be of great importance to generate long-term political interest and commitment to the human capital development strategy.
133
APPENDIX A
Methods for Estimating Human Capital Index at the Provincial Level
INTRODUCTION
The Human Capital Index (HCI) is calculated on the basis of five indicators: (1) child survival to age five; (2) expected years of schooling; (3) harmonized learning outcome; (4) adult survival (ages 15–60); and (5) share of under-five children who are not stunted. These indicators were selected because they reflect the key factors that determine the stock of human capital, and they are based on the availability of data across countries and years. Therefore, national data on these indicators are largely available from global data repositories. Subnational data, however, are not commonly available for many countries and years, and so data availability is the major challenge in calculating subnational HCIs. Because of the lack of subna-tional data, some assumptions and extrapolations had to be made in calculating the provincial HCIs for Sri Lanka. Both national and provincial data were used to derive consistent sets of estimates between provinces and the national level. This appendix describes the methods used to estimate the provincial indicators employed in this exercise.
ESTIMATING THE PROBABILITIES OF CHILD AND ADULTHOOD SURVIVAL FOR EACH PROVINCE
In the global Human Capital Project (HCP) study (World Bank 2018), two data sources were used to obtain the probabilities of child and adulthood survival: data on under-five mortality rates1 from the United Nations Inter-agency Group for Child Mortality Estimation (IGME 2017) and data on adult mortality rates from the United Nations Population Division’s World Population Prospects (WPP) (UN 2017). However, because neither of these databases provided subna-tional estimates, the study team referred to the national and district-specific life tables for 2011–13 constructed by Sri Lanka’s Department of Census and Statistics (Sri Lanka, DCS 2016). The life tables used mortality data from the civil registra-tion system between 2011 and 20132 and the population data from the 2012 cen-sus. The issue was that the mortality rates used in the DCS life tables and those from the IGME and WPP were estimated in isolation of one another, and thus the mortality rates from the life tables were not the same as those of the IGME/WPP. To reconcile the district-specific mortality rates and the estimates from the IGME/WPP, the team made some adjustments in the DCS life tables.
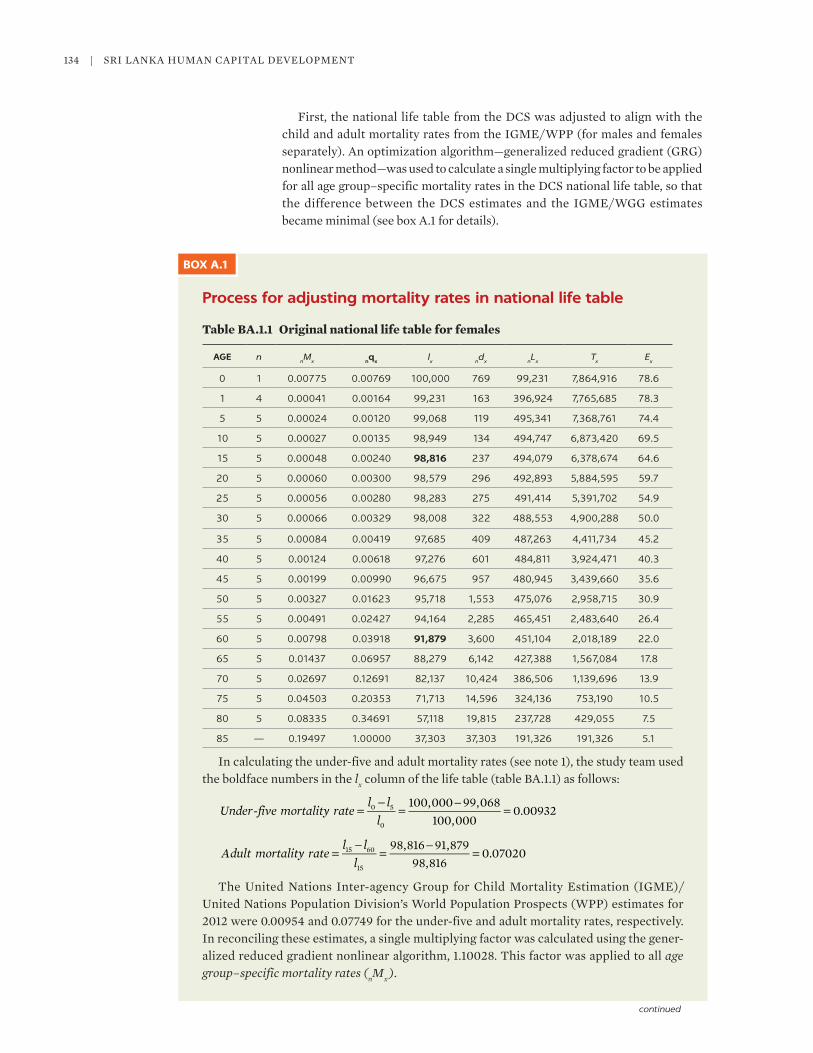
134 | SrI LaNka HUMaN CaPITaL DEvELoPMENT
First, the national life table from the DCS was adjusted to align with the child and adult mortality rates from the IGME/WPP (for males and females separately). an optimization algorithm—generalized reduced gradient (GrG) nonlinear method—was used to calculate a single multiplying factor to be applied for all age group–specific mortality rates in the DCS national life table, so that the difference between the DCS estimates and the IGME/WGG estimates became minimal (see box a.1 for details).
Process for adjusting mortality rates in national life table
Table BA.1.1 Original national life table for females
AGE nnM
x nqx lx n
dx n
Lx
Tx
Ex
0 1 0.00775 0.00769 100,000 769 99,231 7,864,916 78.6
1 4 0.00041 0.00164 99,231 163 396,924 7,765,685 78.3
5 5 0.00024 0.00120 99,068 119 495,341 7,368,761 74.4
10 5 0.00027 0.00135 98,949 134 494,747 6,873,420 69.5
15 5 0.00048 0.00240 98,816 237 494,079 6,378,674 64.6
20 5 0.00060 0.00300 98,579 296 492,893 5,884,595 59.7
25 5 0.00056 0.00280 98,283 275 491,414 5,391,702 54.9
30 5 0.00066 0.00329 98,008 322 488,553 4,900,288 50.0
35 5 0.00084 0.00419 97,685 409 487,263 4,411,734 45.2
40 5 0.00124 0.00618 97,276 601 484,811 3,924,471 40.3
45 5 0.00199 0.00990 96,675 957 480,945 3,439,660 35.6
50 5 0.00327 0.01623 95,718 1,553 475,076 2,958,715 30.9
55 5 0.00491 0.02427 94,164 2,285 465,451 2,483,640 26.4
60 5 0.00798 0.03918 91,879 3,600 451,104 2,018,189 22.0
65 5 0.01437 0.06957 88,279 6,142 427,388 1,567,084 17.8
70 5 0.02697 0.12691 82,137 10,424 386,506 1,139,696 13.9
75 5 0.04503 0.20353 71,713 14,596 324,136 753,190 10.5
80 5 0.08335 0.34691 57,118 19,815 237,728 429,055 7.5
85 — 0.19497 1.00000 37,303 37,303 191,326 191,326 5.1
In calculating the under-five and adult mortality rates (see note 1), the study team used the boldface numbers in the lx column of the life table (table Ba.1.1) as follows:
Under five mortality ratel l
l-
100,000 99,068100,000
0.009320 5
0
=−
=−
=
Adult mortality ratel l
l
98,816 91,87998,816
0.0702015 60
15
=−
=−
=
The United Nations Inter-agency Group for Child Mortality Estimation (IGME)/United Nations Population Division’s World Population Prospects (WPP) estimates for 2012 were 0.00954 and 0.07749 for the under-five and adult mortality rates, respectively. In reconciling these estimates, a single multiplying factor was calculated using the gener-alized reduced gradient nonlinear algorithm, 1.10028. This factor was applied to all age group–specific mortality rates (nMx ).
BOX A.1
continued
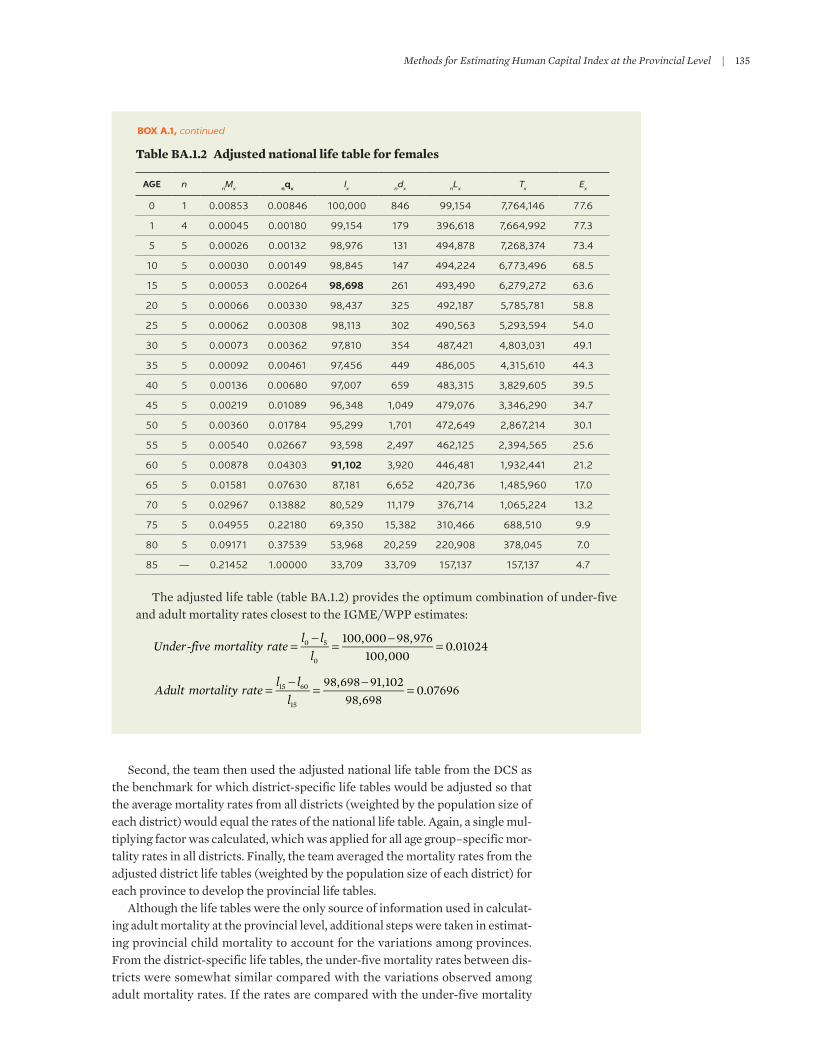
Methods for Estimating Human Capital Index at the Provincial Level | 135
Table BA.1.2 Adjusted national life table for females
AGE nnM
x nqx lx n
dx n
Lx
Tx
Ex
0 1 0.00853 0.00846 100,000 846 99,154 7,764,146 77.6
1 4 0.00045 0.00180 99,154 179 396,618 7,664,992 77.3
5 5 0.00026 0.00132 98,976 131 494,878 7,268,374 73.4
10 5 0.00030 0.00149 98,845 147 494,224 6,773,496 68.5
15 5 0.00053 0.00264 98,698 261 493,490 6,279,272 63.6
20 5 0.00066 0.00330 98,437 325 492,187 5,785,781 58.8
25 5 0.00062 0.00308 98,113 302 490,563 5,293,594 54.0
30 5 0.00073 0.00362 97,810 354 487,421 4,803,031 49.1
35 5 0.00092 0.00461 97,456 449 486,005 4,315,610 44.3
40 5 0.00136 0.00680 97,007 659 483,315 3,829,605 39.5
45 5 0.00219 0.01089 96,348 1,049 479,076 3,346,290 34.7
50 5 0.00360 0.01784 95,299 1,701 472,649 2,867,214 30.1
55 5 0.00540 0.02667 93,598 2,497 462,125 2,394,565 25.6
60 5 0.00878 0.04303 91,102 3,920 446,481 1,932,441 21.2
65 5 0.01581 0.07630 87,181 6,652 420,736 1,485,960 17.0
70 5 0.02967 0.13882 80,529 11,179 376,714 1,065,224 13.2
75 5 0.04955 0.22180 69,350 15,382 310,466 688,510 9.9
80 5 0.09171 0.37539 53,968 20,259 220,908 378,045 7.0
85 — 0.21452 1.00000 33,709 33,709 157,137 157,137 4.7
The adjusted life table (table Ba.1.2) provides the optimum combination of under-five and adult mortality rates closest to the IGME/WPP estimates:
Under five mortality ratel l
l-
100,000 98,976100,000
0.010240 5
0
=−
=−
=
Adult mortality ratel l
l
98,698 91,10298,698
0.0769615 60
15
=−
=−
=
BOX A.1, continued
Second, the team then used the adjusted national life table from the DCS as the benchmark for which district-specific life tables would be adjusted so that the average mortality rates from all districts (weighted by the population size of each district) would equal the rates of the national life table. again, a single mul-tiplying factor was calculated, which was applied for all age group–specific mor-tality rates in all districts. Finally, the team averaged the mortality rates from the adjusted district life tables (weighted by the population size of each district) for each province to develop the provincial life tables.
although the life tables were the only source of information used in calculat-ing adult mortality at the provincial level, additional steps were taken in estimat-ing provincial child mortality to account for the variations among provinces. From the district-specific life tables, the under-five mortality rates between dis-tricts were somewhat similar compared with the variations observed among adult mortality rates. If the rates are compared with the under-five mortality
136 | SrI LaNka HUMaN CaPITaL DEvELoPMENT
rates of each district from DHS 2016, the latter have greater variations (Sri Lanka, DCS 2017). Therefore, the team informed the district life tables with findings from 2016 Demographic and Health Survey (Sri Lanka, DHS 2017) to account for the geographical variations more accurately without affecting the national mor-tality rates when aggregated. The under-five mortality rates of the district life tables were replaced with the results from DHS 2016 as base values, which were then proportionally adjusted by the single multiplying factor to equal the national under-five mortality rates when aggregated. This adjustment had only a negligi-ble effect on the mortality rates for those age five and above. Finally, the under-five mortality rates and adult mortality rates (ages 15–60) were subtracted from unity to derive the child and adult survival rates.
ESTIMATING THE LEARNING-ADJUSTED YEARS OF SCHOOLING FOR EACH PROVINCE
The education component of the HCI is a composite of two indicators: expected years of schooling and harmonized learning outcome. In the global HCI study (World Bank 2018), expected years of schooling were calculated from the total net enrollment rates3 (TNErs) and gross enrollment rates4 (GErs) provided by the UNESCo Institute of Statistics (UIS) database (UIS 2018). For preprimary education, GErs were used as the base of calculation, and TNErs were used for primary, lower secondary, and upper secondary schools. Because the global study assumed that all countries offer at least 14 years of education, the duration of each level of school in Sri Lanka was defined as follows:
• Preprimary: one year (although preprimary can be up to three years)• Primary: five years• Lower secondary: six years• Upper secondary: two years
The provincial estimates of enrollment were estimated using data from the Household Income and Expenditure Survey (HIES) 2012/13 and 2016 (DCS 2015, 2018). Calculating the GEr for the preprimary level proved difficult. It was challenging to reconcile the numerator and denominator because, although chil-dren between the ages of three and five are able to attend preprimary school, attendance was highly concentrated among children age five, and the attendance of children between the ages of three and four was low.
Calculating the GEr will provide very small enrollment rates because the numerator is largely limited to children age five, but the denominator includes the total number of children ages three to five. Conversely, if the denominator is lim-ited to age five, the numerator will become larger than the denominator because quite a number of children are enrolled at ages three and four, or even above age five. Because one year was assumed for preprimary, the team opted for calculating TNErs for preschool by limiting both the numerator and denominator to children age five. after calculating the TNErs for four levels of school in each province, the team adjusted the TNErs with repetition rates for each level, assuming the same rates across all provinces that were used in the global study (estimates from UIS). Finally, the expected years of schooling for each province were calculated as
Expected years of schooling TNER Duration of schooling i
i i1
4
∑= ×=
Methods for Estimating Human Capital Index at the Provincial Level | 137
where i denotes the four levels of schooling. Similar to the mortality indicators, the team scaled the expected years of schooling for each province by a single multiplying factor so that the population-weighted average will equal the national estimate from the global study.
The harmonized learning outcomes for the nine provinces were calculated using data from the Sri Lankan version of the Trends in International Mathematics and Science Study (SL-TIMSS) for grade 8 conducted in 2014 and 2016 (NErEC 2017). The SL-TIMSS is composed of selected questions from the original TIMSS, with scores ranging between 0 and 70 (scaled to a maximum of 100 for reporting). The conversion to a harmonized learning outcome was conducted by inflating the provincial mean scores for males and females by a single multiply-ing factor, so that the population-weighted average score of TIMSS 2016 equaled 400, which was used for the global HCI study (World Bank 2018). The team used the same multiplying factor to derive the harmonized learning outcomes for 2014. although individual-level data were available for the 2016 study, only aggregated data for each province with both genders combined were available for 2014. In disaggregating scores to males and females at the provincial level for 2014, the team assumed the same proportional deviations of males and females from the scores of both genders combined for each province in 2016.
ESTIMATING THE PROPORTION OF UNDER-FIVE WHO ARE NOT STUNTED FOR EACH PROVINCE
Data on stunting were obtained from DHS 2016. Because the national-level stunt-ing rate remained the same over the two rounds of the DHS (2006/07 and 2016), it was assumed that stunting status in the provinces remained unchanged over the last decade (DCS 2009, 2017). Therefore, the team calculated the stunting preva-lence for 2016 and applied the same for other years. The proportion of under-five children not stunted was derived by subtracting the stunting rates from unity.
ESTIMATING THE PROVINCIAL HUMAN CAPITAL INDEXES FOR 2012/13 AND 2016/17
The five indicators estimated as described earlier were then converted to the HCI for each province for two time points. Because data for different indicators are from different years, the team extra/interpolated data for 2012/13 and 2016/17 where possible or assumed data from neighboring years (that is, plus or minus one year) as approximating those years. The approach to calculating the provincial HCIs was the same as that devised for the global study (World Bank 2018). These three components were calculated using the following equations:
Survival = Child Survival rate
School eExpected years of schooling
Harmonized test score
625
14=
φ × −
Health e Adult survival rate Not stunted rate 1 1 /2ASR Stunting= γ γ( ) ( )× − + × −
HCI = Survival × School × Health
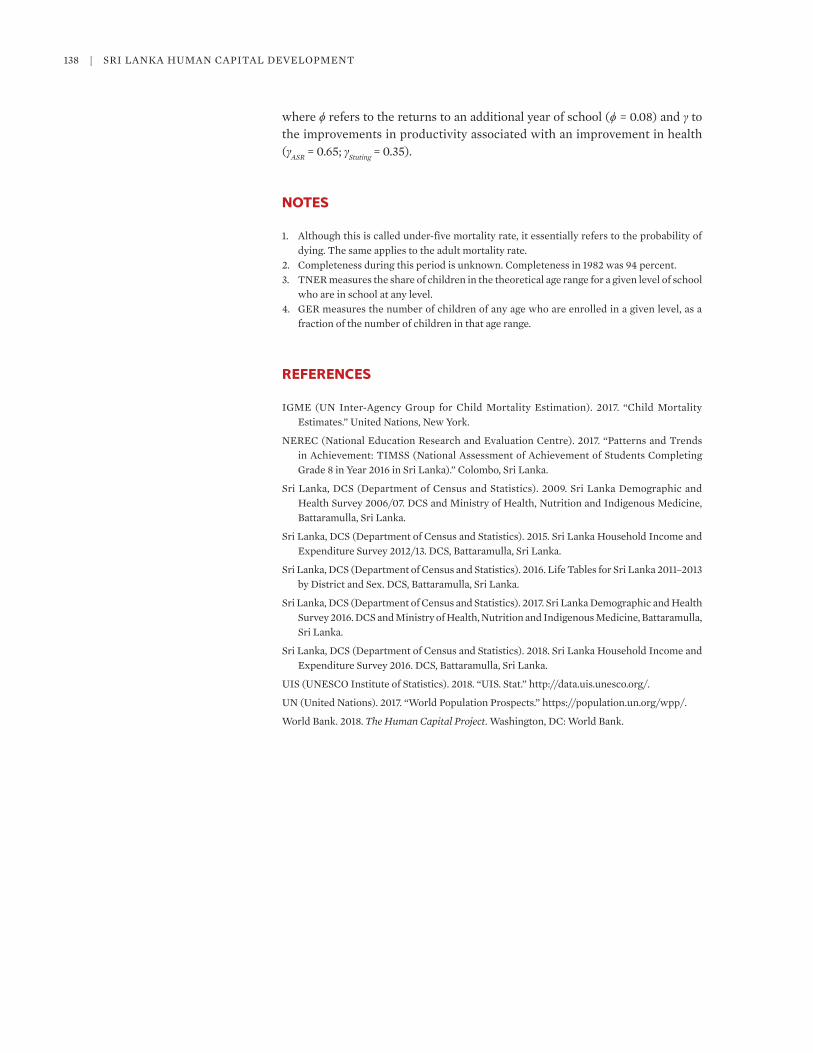
138 | SrI LaNka HUMaN CaPITaL DEvELoPMENT
where ϕ refers to the returns to an additional year of school (ϕ = 0.08) and γ to the improvements in productivity associated with an improvement in health (γASR = 0.65; γStuting = 0.35).
NOTES
1. although this is called under-five mortality rate, it essentially refers to the probability of dying. The same applies to the adult mortality rate.
2. Completeness during this period is unknown. Completeness in 1982 was 94 percent.3. TNEr measures the share of children in the theoretical age range for a given level of school
who are in school at any level.4. GEr measures the number of children of any age who are enrolled in a given level, as a
fraction of the number of children in that age range.
REFERENCES
IGME (UN Inter-agency Group for Child Mortality Estimation). 2017. “Child Mortality Estimates.” United Nations, New York.
NErEC (National Education research and Evaluation Centre). 2017. “Patterns and Trends in achievement: TIMSS (National assessment of achievement of Students Completing Grade 8 in Year 2016 in Sri Lanka).” Colombo, Sri Lanka.
Sri Lanka, DCS (Department of Census and Statistics). 2009. Sri Lanka Demographic and Health Survey 2006/07. DCS and Ministry of Health, Nutrition and Indigenous Medicine, Battaramulla, Sri Lanka.
Sri Lanka, DCS (Department of Census and Statistics). 2015. Sri Lanka Household Income and Expenditure Survey 2012/13. DCS, Battaramulla, Sri Lanka.
Sri Lanka, DCS (Department of Census and Statistics). 2016. Life Tables for Sri Lanka 2011–2013 by District and Sex. DCS, Battaramulla, Sri Lanka.
Sri Lanka, DCS (Department of Census and Statistics). 2017. Sri Lanka Demographic and Health Survey 2016. DCS and Ministry of Health, Nutrition and Indigenous Medicine, Battaramulla, Sri Lanka.
Sri Lanka, DCS (Department of Census and Statistics). 2018. Sri Lanka Household Income and Expenditure Survey 2016. DCS, Battaramulla, Sri Lanka.
UIS (UNESCo Institute of Statistics). 2018. “UIS. Stat.” http://data.uis.unesco.org/.
UN (United Nations). 2017. “World Population Prospects.” https://population.un.org/wpp/.
World Bank. 2018. The Human Capital Project. Washington, DC: World Bank.

139
APPENDIX B
Main Issues, Strategic Directions, and Policy Initiatives
TABLE B.1 Short- and medium-term initiatives to address policy objectives, by thematic area
AREA OBJECTIVE SHORT-TERM INITIATIVES MEDIUM-TERM INITIATIVES
Chapter 1 The potential of human capital
Human capital development in Sri Lanka
To understand the national and regional trends in human capital development in Sri Lanka
• Develop a strategy to address the large provincial disparities in human capital development, with a particular focus on Northern, Eastern, and Western Provinces.
• Develop a strategy to address the lagging human capital outcomes for boys.
Policy makers begin to prepare a strategy incorporating bold policy initiatives to combat second- and third-generation requirements for human capital development.
Chapter 2 Regional variations in human capital outcomes in Sri Lanka
Regional disparities in child survival and expected years of schooling and adult survival
To ensure equitable human capital development across Sri Lanka
Investigate causes for lower adult survival rates in Northern Province and develop a strategy to address lagging adult survival rates in Northern Province.
Develop a strategy to ensure equitable progress in Human Capital Index (HCI) outcomes.
Regional disparities in stunting and learning-adjusted years of schooling
To ensure equitable human capital development across Sri Lanka
Conduct a situation analysis of child survival and learning-adjusted years of schooling in the lagging provinces and develop a strategy of targeted interventions to address these HCI outcomes in those provinces.
Develop a strategy to ensure equitable progress in HCI outcomes.
continued

140 | Sri Lanka Human CapitaL DeveLopment
TABLE B.1, continued
AREA OBJECTIVE SHORT-TERM INITIATIVES MEDIUM-TERM INITIATIVES
Chapter 3 Key challenges in human capital development: Child and adult survival and stunting
Child health and undernutrition To reduce stunting by breaking the transgenerational transmission of undernutrition from a life-cycle perspective
• Develop more comprehensive nutrition-related behavioral change activities targeting the life cycle of women, girls, newborns, and children, focusing on the first 1,000 days.
• Improve quality of care in maternal, newborn, and child health programs to ensure that babies and children survive and thrive to reach their full growth potential.
• Improve the quality of young child feeding programs, focusing on quality and quantity of the minimum acceptable diet, including the feeding during illness.
• Promote health-based interventions such as infection prevention, family planning, and longer birth spacing.
• Design programs for caregivers that provide information and activities related to child nutrition and early childhood development—the positive deviance approach.
• Scale up food security (improve affordability and accessibility of food) and safety projects targeting the household level.
• Strengthen information management on nutrition-related data, including disaggregation of data (such as by gender), quality improvement, and real-time analysis of data and management.
• Develop the knowledge and evidence base of nutrition-related interventions to enable efficient allocation of resources to different programs, geographical areas, and population segments.
• Mainstream nutritional interventions in policies at all levels and sectors.
• Revisit existing policies and practices and develop multisectoral strategies for all sectors, including urban (and its slums), rural, and estate to address the underlying sociocultural determinants of behaviors connected to women’s nutrition at all stages of their life cycle.
• Promote evidence-based food fortification programs to address micronutrient deficiencies.
continued
Main Issues, Strategic Directions, and Policy Initiatives | 141
TABLE B.1, continued
AREA OBJECTIVE SHORT-TERM INITIATIVES MEDIUM-TERM INITIATIVES
Adult health and elderly care To strengthen and reorganize health systems and programs to respond to the growing demands for health care from the working-age and older population
• Strengthen the policy environment and law enforcement mechanism on reducing the major risk factors of noncommunicable diseases (NCDs), such as tobacco use, unhealthy diet, and the harmful use of alcohol.
• Promote screening and management of NCDs, with a special focus on capturing the male population.
• Strengthen the program strategies based on a holistic approach for elderly health care with multidisciplinary services.
• Invest in facilities for lifestyle changes, such as healthy lifestyle centers, including opportunities for physical exercise and improving the mental well-being of the adult and older population.
• Strengthen collaboration among stakeholders in a primary care team with clear referral pathways to address the emerging health burden of NCDs and geriatric care
• Align policies and services with future needs in establishing a network of supportive services for people with chronic diseases and of elderly care within the community. Organize both home-based care and institutional care for the elderly population.
• Ensure that a sustainable health financing mechanism meets the growing demand for health care by the aging population and the growing burden of NCDs.
• Invest in specialized geriatric care units with skilled medical and nursing staff for the long-term care of older people.
• Train health personnel to ensure adequate skilled human resources in geriatric care services.
• Develop mechanisms to involve the private sector in critical service deliveries that can be financed by public sources.
• Support and promote employment of older workers in the labor market.
Chapter 4 Key challenges in human capital development: Learning outcomes
Investing in socioemotional skills for success
To help students develop the socioemotional and behavioral skills required to successfully contribute to the twenty-first-century workplace and to a cohesive and stable society
• Train teachers in socioemotional skills that they can model in the classroom.
• Develop classroom lessons and activities to improve the classroom climate.
• Develop a socioemotional skills curriculum that can be taught as a school subject.
• Develop teaching practices that incorporate socioemotional learning into the methodology for teaching academic content.
• Develop after-school enrichment programs.
Assess the school context and develop appropriate tools to assess the development of socioemotional skills in school students.
continued

142 | Sri Lanka Human CapitaL DeveLopment
TABLE B.1, continued
AREA OBJECTIVE SHORT-TERM INITIATIVES MEDIUM-TERM INITIATIVES
Investing in the early years To ensure universal access to high-quality early childhood care and education (ECCE) programming for children between the ages of three and five
• Invest in center-based platforms to improve the health and nutritional status of young children by activities such as cultivating kitchen gardens in ECCE centers and providing balanced nutritious meals for young children in center-based care.
• Review ECCE curricula to ensure that all ECCE centers use a curriculum with common goals and approaches.
• Review and upgrade the quality of in-service professional development opportunities for ECCE teachers.
• Build parental/caregiver capacity by developing training programs aimed at improving that capacity for providing early learning and early stimulation activities for children at home.
• Expand the number of child day-care centers (in addition to ECCE centers).
• Review and implement a strategy for recruiting and retaining high-quality ECCE lead teachers.
Teacher development To develop a high-quality teaching cadre
• Review the quality of preservice teacher training programs (TTPs)
• Evaluate (and upgrade) in-service TTPs to ensure they are practical, specific, and continual.
• Expand in-service teacher programming to include a peer mentoring induction program for new teachers.
• Prepare teachers to integrate information and communication technology (ICT) into teaching and learning by integrating ICT modules into preservice TTPs and in-service programs.
• Improve the quality of assessment-related pre- and in-service teacher training modules on student assessment so that teachers are adequately trained in developing, integrating, and evaluating the results of student assessments to improve student learning.
• Review in-service TTPs to ensure that information is available to help teachers prepare for teaching in an urban or rural setting (depending on where they are located).
• Upgrade the quality of preservice TTPs in line with international best practices.
• Develop and implement an appropriate system to foster professional teacher collaboration in Sri Lanka.
• Develop and implement a framework for professional learning communities (PLCs) in Sri Lanka.
• Review pre- and in-service teacher preparation programs to ensure that teachers are adequately prepared to use the most relevant and effective pedagogical approaches to help students improve their learning.
• Review the educational ecosystem to ensure that the educational system can provide teachers with the means (the right tools) and motivation (teacher incentives) to maximize student learning.
• Review the teacher deployment system and strategies to ensure that there are high-quality teachers in both urban and rural areas.
• Review the teacher management system to ensure that the educational system can attract, retain, and motivate high-quality teachers.
continued

Main Issues, Strategic Directions, and Policy Initiatives | 143
TABLE B.1, continued
AREA OBJECTIVE SHORT-TERM INITIATIVES MEDIUM-TERM INITIATIVES
Enhancing learning outcomes through technology-based initiatives
To ensure that ICT is effectively utilized to improve student learning
Review the "ICT in education" strategy to ensure that ICT inputs and activities are aligned with the broader goals of the education sector.
Evaluate options for integrating computer-assisted learning (CAL) tools in classrooms to complement teacher instruction.
Using national and international assessments to improve educational development
To ensure that national and international assessments are used effectively to improve the educational system and ultimately improve student learning outcomes
• Review the institutional capacity and conditions for utilizing national assessments.
• Accelerate efforts to participate in one of the large-scale international assessments such as the Program for International Student Assessment (PISA) or Trends in International Mathematics and Science Study (TIMSS).
Develop the institutional capacity and conditions to use national assessments for educational development.
Chapter 5 Human capital development: Transforming higher education
Mission differentiation of universities
To improve the quality of higher education in Sri Lanka
Designate universities according to a mission differentiation system.
• Design an incentive system to promote high-quality teaching and learning in universities designated as centers of teaching excellence.
• Develop policy initiatives to promote stronger links between universities and industry.
Technology and higher education
To improve teaching, learning, and research through effective use of ICT
Develop initiatives aimed at promoting the use of ICT in the higher education sector.
Expand access to high-quality ICT for teaching, learning, and research.
Development of private higher education
To develop private higher education institutions in Sri Lanka
• Prioritize the development of private higher education institutions in Sri Lanka.
• Identify strategies to promote the growth and development of the private sector in higher education.
• Provincial councils or national government consider providing land for the establishment and development of private higher education institutions.
• Consider providing financial grants to meet the capital costs of buildings and equipment for private higher education institutions.
• Subsidize the costs of students enrolled in private higher education institutions.
• Help nonstate higher education institutions establish campuses in the provinces in combination with other activities (such as private sector firms that might have an interest in the area).
Internationalization and higher education development
To accelerate the development of Sri Lanka’s higher education system through internationalization
Develop a strategy to promote Sri Lanka as a hub for international students.
• Implement longer-term initiatives to promote Sri Lanka as a hub for international students.
• The government works with institutions such as the Board of Investment to implement policies that attract foreign higher education providers.

ECO-AUDIT
Environmental Benefits Statement
The World Bank Group is committed to reducing its environmental footprint. In support of this commitment, we leverage electronic publishing options and print-on-demand technology, which is located in regional hubs worldwide. Together, these initiatives enable print runs to be lowered and shipping distances decreased, resulting in reduced paper consumption, chemical use, greenhouse gas emissions, and waste.
We follow the recommended standards for paper use set by the Green Press Initiative. The majority of our books are printed on Forest Stewardship Council (FSC)–certified paper, with nearly all containing 50–100 percent recycled content. The recycled fiber in our book paper is either unbleached or bleached using totally chlorine-free (TCF), processed chlorine–free (PCF), or enhanced elemental chlorine–free (EECF) processes.
More information about the Bank’s environmental philosophy can be found at http://www.worldbank.org/corporateresponsibility.
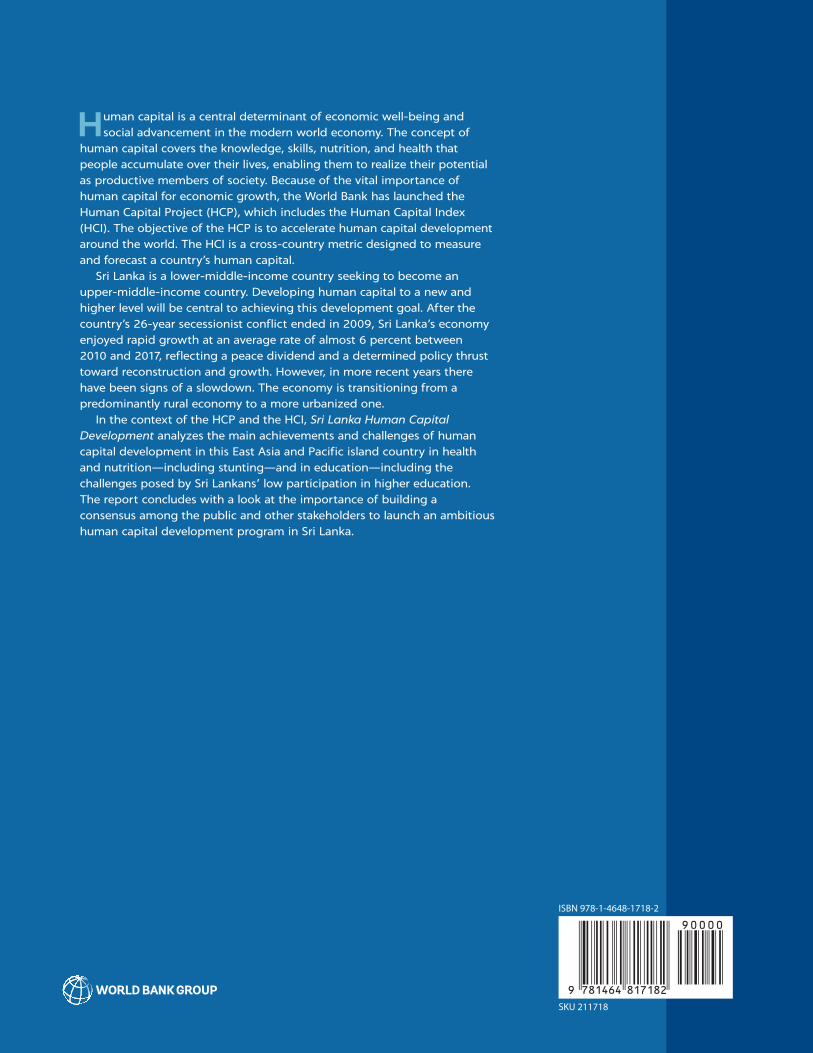
Human capital is a central determinant of economic well-being and social advancement in the modern world economy. The concept of
human capital covers the knowledge, skills, nutrition, and health that people accumulate over their lives, enabling them to realize their potential as productive members of society. Because of the vital importance of human capital for economic growth, the World Bank has launched the Human Capital Project (HCP), which includes the Human Capital Index (HCI). The objective of the HCP is to accelerate human capital development around the world. The HCI is a cross-country metric designed to measure and forecast a country’s human capital.
Sri Lanka is a lower-middle-income country seeking to become an upper-middle-income country. Developing human capital to a new and higher level will be central to achieving this development goal. After the country’s 26-year secessionist conflict ended in 2009, Sri Lanka’s economy enjoyed rapid growth at an average rate of almost 6 percent between 2010 and 2017, reflecting a peace dividend and a determined policy thrust toward reconstruction and growth. However, in more recent years there have been signs of a slowdown. The economy is transitioning from a predominantly rural economy to a more urbanized one.
In the context of the HCP and the HCI, Sri Lanka Human Capital Development analyzes the main achievements and challenges of human capital development in this East Asia and Pacific island country in health and nutrition—including stunting—and in education—including the challenges posed by Sri Lankans’ low participation in higher education. The report concludes with a look at the importance of building a consensus among the public and other stakeholders to launch an ambitious human capital development program in Sri Lanka.
ISBN 978-1-4648-1718-2
SKU 211718
Related Documents