Welcome message from author
This document is posted to help you gain knowledge. Please leave a comment to let me know what you think about it! Share it to your friends and learn new things together.
Transcript

Cereals
HANDBOOK OF PLANT BREEDING
Editors-in-Chief:
JAIME PROHENS, Universidad Politecnica de Valencia, Valencia, SpainFERNANDO NUEZ, Universidad Politecnica de Valencia, Valencia, SpainMARCELO J. CARENA, North Dakota State University, Fargo, ND, USA
Volume 1
Vegetables I: Asteraceae, Brassicaceae, Chenopodicaceae, and Cucurbitaceae
Edited by Jaime Prohens and Fernando Nuez
Volume 2
Vegetables II: Fabaceae, Liliaceae, Solanaceae and Umbelliferae
Edited by Jaime Prohens and Fernando Nuez
Volume 3
CerealsEdited by Marcelo J. Carena
Marcelo J. CarenaEditor
Cereals
Editor
Prof. Dr. Marcelo J. CarenaNorth Dakota State UniversityCorn Breeding & GeneticsDept. of Plant SciencesDept #7670374D Loftsgard HallFargo ND 58108‐[email protected]
ISBN 978-0-387-72294-8 e-ISBN 978-0-387-72297-9DOI: 10.1007/978-0-387-72297-9
Library of Congress Control Number: PCN Applied for
# Springer Science + Business Media, LLC 2009
This work is subject to copyright. All rights are reserved, whether the whole or part of the material is
concerned, specifically the rights of translation, reprinting, reuse of illustrations, recitation, broadcasting,
reproduction on microfilm or in any other way, and storage in data banks. Duplication of this publication
or parts thereof is permitted only under the provisions of the German Copyright Law of September 9,
1965, in its current version, and permissions for use must always be obtained from Springer-Verlag.
Violations are liable for prosecution under the German Copyright Law.
The use of general descriptive names, registered names, trademarks, etc. in this publication does not
imply, even in the absence of a specific statement, that such names are exempt from the relevant
protective laws and regulations and therefore free for general use.
Printed on acid-free paper.
9 8 7 6 5 4 3 2 1
springer.com
Preface
Plant breeding is a discipline that has evolved with the development of human
societies. Similar to the rapid changes in other disciplines during the twentieth
century, plant breeding has changed from selection based on the phenotype of
individuals to selection based on the information derived at the deoxyribonucleic
acid (DNA) level in molecular genetic laboratories and data from replicated field
experiments. The initial beginnings of plant breeding occurred when humans made
the transition from a nomadic hunter–gatherer lifestyle to the development of
communities, colonies, tribes, and civilizations. The more sedentary lifestyle re-
quired that adequate food supplies (both plant and animal) were available within the
immediate surrounding areas. The plants available within the immediate areas
became very important to sustain the food, fuel, fiber, and feed needs of the local
settlements. Hence, the greater the grain and forage yields of the native plants, the
greater the sustainability of the needs of the local settlements. They recognized the
relative importance of some plant species that could meet the needs of the settle-
ments and practiced selection of individual plants that had greater grain and/or
forage yields. Seed was saved from desirable plants to perpetuate the plants in the
next growing season. By present-day standards, the methods of selection would
seem simplistic because selection was based only on the phenotype of individual
plants. But the selection methods were effective to develop landrace cultivars that
provided substance for the local settlements to prosper and expand into regional
civilizations. The landrace cultivars also were the germplasm resources for future
generations of plant breeding. The original plant breeders, therefore, provided the
plant resources for the development of human societies and the germplasm
resources to sustain modern human societies. The major contributions of the early
plant breeders were to develop domesticated crop species, dependent on humans (in
some instances for survival) from their wild progenitors.
Domestication of our major crop species from their wild progenitors occurred
over broad areas and time frames. The extent and rapidity of the distribution of the
different domesticated crops depended on human movements within and among
different areas of the world. It is estimated, for example, that maize (Zea mays L.)was domesticated 7,000–10,000 years ago in southern Mexico and Guatemala.
Maize, however, was unknown outside the Western Hemisphere until Columbus
v
(1493) brought maize seed upon his return to Europe. The potential of maize was
recognized and spread rapidly throughout the world. Similar patterns occurred for
the other domesticated crop species. Because of the different needs of the different
societies and the different environments inhabited, the next stage of plant breeding
occurred. The selection techniques of the domesticators were used to develop
cultivars adapted to their specific environments. Within the domesticated crop
species, different landraces were developed that had the desired traits for the
local needs and customs and environmental conditions. By 1900, it was reported,
for example, that more than 800 distinctive open-pollinated cultivars were available
in the United States. Until 1900, the plant breeding selection methods emphasized
selection of individual phenotypes, but modifications were being made to improve
selection effectiveness, such as the progeny test suggested by Vilmorin in 1858.
Although the early plant breeders did not have a knowledge of Mendelian genetics
(and his predecessors, they did observe that progeny tended to resemble their
parents) and scientific methods to separate genetic and environmental effects (i.e.,
heritability) in trait expression, the early plant breeders were effective in domesti-
cation of wild, weedy plants for human use and the development of improved
strains and cultivars that provided the germplasm resources for twentieth century
plant breeders.
Plant breeding is often described as the art and science of developing superior
cultivars. Art is defined as the skill in performance acquired by experience, study, or
observation, which were certainly strong traits of the early plant breeders, whereas
science is defined as the knowledge attained through study or practice. The distinc-
tions between art and science are not always clear because even with experimental
field and molecular data, subjective decisions are often necessary in choices of
parents, progenies to consider for further testing, choices of testers, stage of testing,
etc. But the relative importance of the art and science of plant breeding was
reversed during the nineteenth and twentieth centuries with the emphasis on science
(data driven) replacing emphasis on art (phenotypic appearance). The scientific
basis of plant breeding was enhanced in the early part of the twentieth century by
several developments, including the rediscovery of Mendel’s laws of inheritance; a
greater understanding of Darwin’s theory of evolution based on Mendelian genet-
ics; development of field experimental methods (randomization, replication, and
repetition) to make valid comparisons among cultivars; theoretical basis for the
inheritance of complex traits designated as quantitative traits; integration of the
concepts of evolution, Mendelian genetics, and quantitative genetics to provide a
basis to understand (and predict) response to selection; the importance of recycling
of germplasm (both via pedigree selection within crosses of related lines and
genetically broad-based populations) to enhance consistent genetic advance; and
the advances made during the latter part of the twentieth century in molecular
genetics on qualitative trait loci. Each of the developments impacted plant breeding
methods in different ways, but collectively, all have been important to provide a
firm and valid genetic basis for developing superior cultivars for the producers.
Each of the advances was made to give greater emphasis to selection based on
genotypic differences. During the past 100 years, plant breeding has changed from
vi Preface
selection based on individual phenotypes to selection at the DNA level for selection
for primarily genetic differences. This trend will continue in the future with greater
emphasis at the DNA, gene, and phenotypic levels.
This volume is a summary and an update on the breeding methods that have
evolved for our major cereal crop species, especially those based on breeding
experience, often not presented in books. Similar to other research disciplines,
rapid changes occur annually for the scientific basis of plant breeding. Although
the basic genetic information and techniques of plant breeding continue to evolve,
the basic concepts of plant breeding to develop superior cultivars remain the same;
integrate all the available information to enhance the effectiveness and efficiency of
our choice of parental materials, genetic enhancement of germplasm resources,
estimate breeding values of progenies with greater levels of precision, and develop
genetically diverse cultivars with greater tolerances to pest and environmental
stresses as well as greater quality for a healthier diet. There is documented evidence
that significant genetic improvements for greater yields have been made in
cultivated crop species during the twentieth century. Similar genetic improvements
are needed to meet human needs (e.g., biofuels) during the twenty-first century.
Genetic information at the DNA level will continue to provide basic scientific
information and will, hopefully, have a greater role in the future. Similar to other
scientific disciplines, the science of plant breeding will continue to evolve for
development of superior cultivars with the necessary traits to continue to provide
adequate nutritional food supplies to sustain continued population expansions in a
world of finite dimensions. Plant breeders have and will continue to develop
cultivars. Plant breeding has and will continue to have important roles to ensure
the future health of the world’s human societies.
Fargo, ND Marcelo J. Carena
Ames, IA Arnel R. Hallauer
Preface vii
Contents
Section I Cereal Crop Breeding
Maize Breeding . . . . . . . . . . . . . . . . . . . . . . . . . . . . . . . . . . . . . . . . . . . . . . . . . . . . . . . . . . . . . . . . . . . 3
Arnel R. Hallauer and Marcelo J. Carena
Rice Breeding . . . . . . . . . . . . . . . . . . . . . . . . . . . . . . . . . . . . . . . . . . . . . . . . . . . . . . . . . . . . . . . . . . . . 99
Elcio P. Guimaraes
Spring Wheat Breeding . . . . . . . . . . . . . . . . . . . . . . . . . . . . . . . . . . . . . . . . . . . . . . . . . . . . . . . 127
M. Mergoum, P.K. Singh, J.A. Anderson, R. J. Pena, R.P. Singh,
S.S. Xu, and J.K. Ransom
Rye Breeding . . . . . . . . . . . . . . . . . . . . . . . . . . . . . . . . . . . . . . . . . . . . . . . . . . . . . . . . . . . . . . . . . . 157
H.H. Geiger and T. Miedaner
Grain Sorghum Breeding . . . . . . . . . . . . . . . . . . . . . . . . . . . . . . . . . . . . . . . . . . . . . . . . . . . . 183
Robert G. Henzell and David R. Jordan
Durum Wheat Breeding . . . . . . . . . . . . . . . . . . . . . . . . . . . . . . . . . . . . . . . . . . . . . . . . . . . . . . 199
Conxita Royo, Elias M. Elias, and Frank A. Manthey
Barley . . . . . . . . . . . . . . . . . . . . . . . . . . . . . . . . . . . . . . . . . . . . . . . . . . . . . . . . . . . . . . . . . . . . . . . . . . 227
R.D. Horsley, J.D. Franckowiak, and P.B. Schwarz
Winter and Specialty Wheat . . . . . . . . . . . . . . . . . . . . . . . . . . . . . . . . . . . . . . . . . . . . . . . . . 251
P. Baenziger, R. Graybosch, D. Van Sanford, and W. Berzonsky
Triticale: A ‘‘New’’ Crop with Old Challenges . . . . . . . . . . . . . . . . . . . . . . . . . . . . 267
M. Mergoum, P.K. Singh, R.J. Pena, A.J. Lozano-del Rıo,
K.V. Cooper, D.F. Salmon, and H. Gomez Macpherson
ix
Section II Adding Value to Breeding
Statistical Analyses of Genotype by Environment Data . . . . . . . . . . . . . . . . . . . 291
Ignacio Romagosa, Fred A. van Eeuwijk, and William T.B. Thomas
Breeding for Quality Traits in Cereals: A Revised Outlook
on Old and New Tools for Integrated Breeding . . . . . . . . . . . . . . . . . . . . . . . . . . . . 333
Lars Munck
Breeding for Silage Quality Traits in Cereals . . . . . . . . . . . . . . . . . . . . . . . . . . . . . . 367
Y. Barriere, S. Guillaumie, M. Pichon, and J.C. Emile
Participatory Plant Breeding in Cereals . . . . . . . . . . . . . . . . . . . . . . . . . . . . . . . . . . . . 395
S. Ceccarelli and S. Grando
Index . . . . . . . . . . . . . . . . . . . . . . . . . . . . . . . . . . . . . . . . . . . . . . . . . . . . . . . . . . . . . . . . . . . . . . . . . . . 415
x Contents
Contributors
J.A. Anderson
Department of Agronomy and Plant Genetics, University of Minnesota, St. Paul,
MN 55108, USA
S. Baezinger
Department of Agronomy and Horticulture, University of Nebraska-Lincoln,
Lincoln, NE 68588, USA
Y. Barriere
Unite de Genetique et d’Amelioration des Plantes Fourrageres, INRA, Route de
Saintes, BP6, F-86600 Lusignan, France
W. Berzonsky
North Dakota State University, Department of Plant Sciences, NDSU Dept. 7670,
Po Box 6050, Fougo, ND 58108-6050
M.J. Carena
North Dakota State University, Department of Plant Sciences, NDSU Dept. 7670,
Po Box 6050, Fougo, ND 58108-6050
S. Ceccarelli
The International Center for Agricultural Research in the Dry Areas (ICARDA),
Aleppo, Syria
K.V. Cooper
P.O. Box 689, Stirling, SA 5152, Australia
F.A. van Eeuwijk
Wageningen University, Applied Statistics, 6700 ACWageningen, the Netherlands
E. Elias
North Dakota State University, Department of Plant Sciences, NDSU Dept. 7670,
Po Box 6050, Fougo, ND 58108-6050
xi
J.C. Emile
Unite Experimentale Fourrages et Environnement, INRA, Les Verrines, F-86600
Lusignan, France
J. Franckowiak
Department of Primary Industries and Fisheries, Hermitage Research Station,
Warwick, Queensland, Australia
H.H. Geiger
University of Hohenheim, Institute of Plant Breeding, Seed Science, and Population
Genetics, D-70593 Stuttgart, Germany
S. Grando
The International Center for Agricultural Research in the Dry Areas (ICARDA),
Aleppo, Syria
R. Graybosch
USDA-ARS and Department of Agronomy and Horticulture, University of
Nebraska-Lincoln, Lincoln, NE 68588, USA
S. Guillaumie
Unite de Genetique et d’Amelioration des Plantes Fourrageres, INRA, Route de
Saintes, BP6, F-86600 Lusignan, France
E.P. Guimaraes
Food and Agriculture Organization of the United Nations (FAO), Viale delle Termi
di Caracalla, Crop and Grassland Service (AGPC), 00153 Rome, Italy
A.R. Hallauer
Department of Agronomy, Iowa State University, Ames, IA 50011, USA
R.G. Henzell
Department of Primary Industries, University of Queensland, Queensland,
Australia
R. Horsley
North Dakota State University, Department of Plant Sciences, NDSU Dept. 7670,
Po Box 6050, Fougo, ND 58108-6050
D.R. Jordan
Department of Primary Industries, University of Queensland, Queensland,
Australia
H. Gomez Macpherson
Instituto de Agricultura Sostenible, CSIC, 14071 Cordoba, Spain
xii Contributors
F.A. Manthey
North Dakota State University, Department of Plant Sciences, NDSU Dept. 7670,
Po Box 6050, Fougo, ND 58108-6050
T. Medianer
University of Hobenbeim, State Plant Breeding Institute, D-70593 Stuttgalt,
Germany
M. Mergoum
North Dakota State University, Department of Plant Sciences, NDSU Dept. 7670,
Po Box 6050, Fougo, ND 58108-6050
L. Munck
Department of Food Science, Quality and Technology, Spectroscopy and
Chemometrics Group, University of Copenhagen, Frederiksberg, Denmark
R.J. Pena
Wheat Program, International Maize and Wheat Improvement Center (CIMMYT),
Mexico DF 06600, Mexico
M. Pichon
UMR5546, Pole de Biotechnologie Vegetale, 24 chemin de Borde Rouge, BP17,
F-31326 Castanet-Tolosan, France
J.K. Ransom
North Dakota State University, Department of Plant Sciences, NDSU Dept. 7670,
Po Box 6050, Fougo, ND 58108-6050
A.J. Lozano del Rio
UAAAN, Dept. de Fitomejoramiento, Buenavista, Saltillo, Coahuila, Mexico, CP
25315
I. Romagosa
Centre UdL-IRTA, University of Lleida, Lleida, Spain
C. Royo
Institute for Food and Agricultural Research and Technology, Generalitat de
Catalunya, Cereal Breeding, Lleida, Spain
D.F. Salmon
Field Crop Development Centre, Alberta Agriculture and Food, 5030-50th Street,
Lacombe, AB, T4L 1W9, Canada
D. van Sanford
Department of Plant and Soils Sciences, University of Kentucky, Lexington,
KY 40546, USA
Contributors xiii
P.B. Schwarz
North Dakota State University, Department of Plant Sciences, NDSU Dept. 7670,
Po Box 6050, Fougo, ND 58108-6050
P.K. Singh
North Dakota State University, Department of Plant Sciences, NDSU Dept. 7670,
Po Box 6050, Fougo, ND 58108-6050
R.P. Singh
Wheat Program, International Maize and Wheat Improvement Center (CIMMYT),
Mexico DF 06600, Mexico
W.T.B. Thomas
Scottish Crops Research Institute, Invergowrie, Dundee, UK
S.S. Xu
USDA-ARS, Northern Crop Science Laboratory, Fargo, ND 58108‐6050, USA
xiv Contributors
Maize Breeding
Arnel R. Hallauer and Marcelo J. Carena
Abstract Maize (Zea mays L.) originated from teosinte (Zea mays L. spp Mex-
icana) in the Western Hemisphere about 7,000 to 10,000 years ago. Maize was
widely grown by Native Americans (e.g. it was the first crop in North Dakota) in the
U.S. during the 1600s and 1700s. The practical value of hybrid vigor or heterosis
traces back to the controlled hybridization of U.S. southern Dents and northern
Flints by farmers in the 1800s. Inbreeding and hybridization studies in the public
sector dramatically change maize breeding. The Long Island (led by Shull) and
Connecticut (led by East) public research groups created the inbred-hybrid concept
(hybrid maize) which allowed industry to exploit the practical and economical
value of heterosis. The hybrid maize technology was rapidly adopted by U.S.
farmers and generated genetic gains for grain yield at a rate of 1.81 kg ha�1
year�1. However, emphasis on the exploiting the inbred-hybrid concept detracted
from further improvements on open-pollinated cultivars and their cultivar crosses.
Maize breeding is the art and science of compromise. Multi-trait selection,
multi-stage testing, and multi-progeny evaluation are common for discarding
thousands of lines and hybrids. Maize breeding has unique features that are
different from any extensively cultivated self-pollinated crop. Breeding techniques
from both self and cross-pollinated crops are utilized in maize. The fundamentals of
maize breeding remain the same: germplasm improvement (e.g. recurrent selec-
tion), development of pure-lines by self-pollination, production of crosses between
derived lines, identification of hybrids having consistent and reliable performance
across an extensive number of environments, and production of the best hybrid for
use by the farmer. Each successful hybrid has its own unique combination of
genetic effects and allelic frequencies often limiting sample sizes for QTL experi-
ments relative to classical quantitative genetic studies. The main limitation of
traditional methods of maize breeding is to determine the genetic worth of lines
in hybrid combinations. Most of the economically important traits in maize breed-
ing are inherited quantitatively. Their importance is recognized by molecular
geneticists through their emphasis in QTL experiments, molecular markers, mark-
M.J. Carena(*)
North Dakota State University, Department of Plant Sciences, NDSU Dept. 7670, PO Box 6050,
Fargo, ND 58108–6050, e-mail: [email protected]
M.J. Carena (ed.), Cereals,DOI: 10.1007/978-0-387-72297-9, # Springer Science + Business Media, LLC 2009 3
er-assisted selection to predict early and late generation combining abilities, and/or
ultimately gene-assisted selection through specific genome selection (e.g. metaQTL
analyses) and/or association mapping. Information in maize genetics has signifi-
cantly expanded in the past 50 years until the unraveling of the genome sequence in
2008. However, the limiting factor for genetic improvement remains the same:
good choice of germplasm. The most sophisticated breeding methods and/or tech-
nologies carrying all of the genetic information available will have limited success
if poor choices of germplasm are made. Biotechnology continues to be an important
addition to the breeding process for single-gene traits while conventional breeding
continues to be the key for improving economically important traits of quantitative
inheritance. This chapter starts with a general introduction followed by pre-breed-
ing and the incorporation of exotic germplasm, currently led by the USDA-GEM
network. The integration of recurrent selection methods with inbred line develop-
ment programs follows with the classical example of B73, the public line derived
from BSSS that generated billions of dollars to the hybrid industry. The chapter
continues with the inheritance of quantitative traits, and methods of line develop-
ment and hybrids. Finally, the concepts of heterotic groups, heterotic patterns, and
inbred line recycling are detailed for exploiting heterosis and hybrid stability
including multi-trait selection utilizing indices. A summary is included at the end
of the chapter.
1 Introduction
The evolution of maize (Zea mays L.) breeding methods is similar to other major
cultivated crop species. Plant breeding started when humans made the transition
from hunter–gatherers to living in more concentrated and organized societies. To
meet the needs of the concentrated societies, the human needs for food, feed, fiber,
and fuel, the plants within the surrounding native vegetation were observed and
selected to meet their needs. The plants were highly adapted to the particular
settlements and survived without human intervention. The choice of the plant
species selected depended on the prevalence of the available plants and the needs
of the settlements. The choice of plants selected was different in different areas of
the world where the original settlements were being established.
Maize is one of the few major cultivated crop species that originated in the
Western Hemisphere. Information suggests that maize arose in the highlands of
southern Mexico and Guatemala about 7,000 to 10,000 years ago. Similar to other
crop species, maize arose from a wild, weedy species native to the area. Collective
information during the past 60 years suggests that teosinte (Zea mays L.: ssp.
Mexicana) was the putative parent of modern-day maize (Wilkes, 2004). From
the initial settlements to the highly developed societies of the native populations,
selection of the more productive plants was conducted to meet the needs of the
societies. Hence, maize arose from the wild, weedy type teosintes to produce types
that became dependent on humans for survival. By the time European explorers
arrived in the Western Hemisphere, maize was an important component of the
4 A.R. Hallauer, M.J. Carena
societies throughout the Western Hemisphere. Columbus brought maize seeds to
Europe after his first voyage in 1492, and maize became widely distributed upon its
introduction to Europe (Mangelsdorf, 1974). Cortes, when he invaded Mexico in
1618, and DeSota, when he explored the area that is present-day southeastern
United States in 1636, both found maize widely grown by the native populations
throughout the respective areas (Marks, 1993; Hudson, 1994). Maize also was an
important crop for the early European settlements established in the seventeenth
and eighteenth centuries. Selection procedures similar to the methods of the native
populations were used by the Europeans to further the development of more
productive strains of maize; that is, phenotypic selection of individual plants and
ear traits that were desired for their culture needs and environments. Galinat (1988),
Goodman and Brown (1988), and Wilkes (2004) have summarized the information
on the origin and on development of maize in the Western Hemisphere.
Although the transition from a wild species to a modern cultivated species was
similar to other crops in many aspects, maize, however, has had some different
properties, other than its origin in theWestern Hemisphere.Maize is a cross-pollinated
specieswith unique and separatemale (tassel) and female (ear) organs.Maize breeding
has unique features that are different from the other extensively cultivated
grain species, such as rice (Oryza sativa L.), wheat (Triticum vulgare L.), soybeans(Glycine max Merr.), oats (Avena sativa L.), and barley (Hordeum vulgare L.),
which are primarily self pollinated. Techniques from both self- and cross-pollinated
crops are utilized in maize. To ensure control of parentage, hand pollinations are
necessary where pollen (male gametes) collected from the tassel are either applied to
the silks (female gametes) of the same plant (self-pollination) or to silks of different
plants (cross-pollination). Controlled pollinations in maize breeding are conducted
daily when plants are shedding pollen and have receptive silks. Techniques, howev-
er, have been developed that are used by nearly all maize breeders to produce good
seed set by hand pollinations (Russell and Hallauer, 1980; Hallauer, 1994).
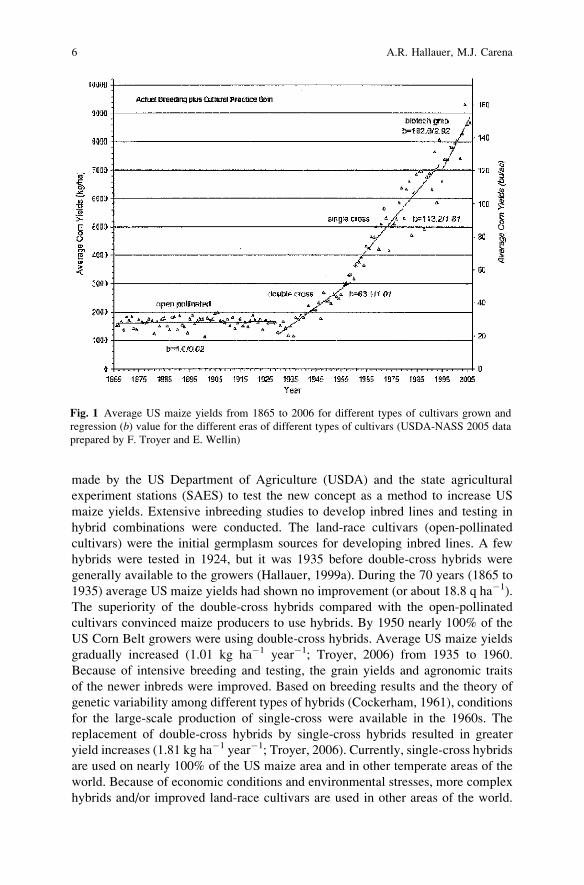
Because maize had become a very important source of feed for livestock, there
was an interest in developing greater yielding maize cultivars. Data on US average
maize yields had not changed significantly from 1865 to 1935 (Fig. 1). Beal (1880)
reported on controlled crosses of open-pollinated cultivars and their potential for
increasing maize yields. Other studies on cultivar crosses were reported, but varietal
crosses were not extensively used. Parental control may have been a factor for the
inconsistent results. Richey (1922) summarized data for 244 cultivar crosses and
reported that the superiority of the cultivar crosses over the greatest yielding parent
cultivarwas not great enough to attract growers to the use of cultivar crosses. However,
the economic potential of population hybrids through the population–hybrid concept
utilizing extensively improved populations needs further consideration (East and
Hayes, 1911; Hayes, 1956; Darrah and Penny, 1975; Carena, 2005a). Inbreeding and
hybridization studies by Shamel (1905), East (1908), Shull (1908, 1909, 1910), and
Jones (1918) dramatically changed maize breeding. The suggestions of Shull (1910)
and Jones (1918) stimulated greater interest in the possibilities of hybrids produced
from pure lines. The suggestions of the inbred–hybrid concept created greater interests
that the public concept could impactmaize yields. In 1922, a comprehensive effort was
Maize Breeding 5
made by the US Department of Agriculture (USDA) and the state agricultural
experiment stations (SAES) to test the new concept as a method to increase US
maize yields. Extensive inbreeding studies to develop inbred lines and testing in
hybrid combinations were conducted. The land-race cultivars (open-pollinated
cultivars) were the initial germplasm sources for developing inbred lines. A few
hybrids were tested in 1924, but it was 1935 before double-cross hybrids were
generally available to the growers (Hallauer, 1999a). During the 70 years (1865 to
1935) average US maize yields had shown no improvement (or about 18.8 q ha�1).
The superiority of the double-cross hybrids compared with the open-pollinated
cultivars convinced maize producers to use hybrids. By 1950 nearly 100% of the
US Corn Belt growers were using double-cross hybrids. Average US maize yields
gradually increased (1.01 kg ha�1 year�1; Troyer, 2006) from 1935 to 1960.
Because of intensive breeding and testing, the grain yields and agronomic traits
of the newer inbreds were improved. Based on breeding results and the theory of
genetic variability among different types of hybrids (Cockerham, 1961), conditions
for the large-scale production of single-cross were available in the 1960s. The
replacement of double-cross hybrids by single-cross hybrids resulted in greater
yield increases (1.81 kg ha�1 year�1; Troyer, 2006). Currently, single-cross hybrids
are used on nearly 100% of the US maize area and in other temperate areas of the
world. Because of economic conditions and environmental stresses, more complex
hybrids and/or improved land-race cultivars are used in other areas of the world.
Fig. 1 Average US maize yields from 1865 to 2006 for different types of cultivars grown and
regression (b) value for the different eras of different types of cultivars (USDA-NASS 2005 data
prepared by F. Troyer and E. Wellin)
6 A.R. Hallauer, M.J. Carena
Where possible, however, the newer technologies to identify superior hybrids are
emphasized for all major world maize producing areas. In lesser developed areas,
mass selection methods are used to improve the currently grown land-race cultivars,
sometimes referred to as farmer breeders (Dowswell et al., 1996).
2 General
The basic feature of all plant improvement programs is to increase the frequency of
favorable allelic combinations. In maize breeding, this feature is common to all
aspects related to maize improvement: introduction and adaptation of exotic
germplasm, improvement of germplasm resources, pedigree selection to develop
improved inbred lines, backcrossing to incorporate alleles and/or allelic combina-
tions into otherwise desirable inbred lines, and conversion programs to improve
and/or change the chemical composition of either the grain or the stover. The
principles of recycling in maize breeding has been used since the Native Americans
selected within teosinte to develop modern maize to the present-time when maize
breeders make good-by-good crosses of inbred lines to initiate pedigree selection
for developing inbred lines (Gepts, 2004). The inbred lines derived from the F2generation from crosses of inbred lines are usually referred to as recycled lines
because they would include germplasm from the parental lines.
A common theme throughout the history of maize breeding has been selection of
the superior individuals in a population, intermating the superior individuals, and
selection of the superior individuals in the reconstituted population; this repetition
of selection and intermating is continued during the lifetime of the breeding
program. Until the development of inbred–hybrid concept in the twentieth century,
phenotypic (or mass) selection of the superior individuals within the open-
pollinated cultivars was the more common form of selection. Mass selection was
effective in developing cultivars adapted to specific environments, cultivars with
distinctive plant and ear traits, and cultivars with different maturities. The Native
Americans developed distinctive cultivars distributed throughout the Western
Hemisphere before the arrival of the European explorers. Similar methods were
used by the European colonists on the cultivars developed by the natives. Sturtevant
(1899) reported that there were nearly 800 unique open-pollinated cultivars in the
United States. Although the mass selection methods were effective in developing
identifiable open-pollinated cultivars, the methods were not effective in developing
greater yielding cultivars (Fig. 1). Lack of parental control (poor isolation) and low
heritability of the complex trait yield probably were the primary factors that limited
the effect of mass selection for this particular trait. Better methods were needed to
determine the genetic difference among phenotypes.
Rediscovery of Mendelism in 1900 stimulated research in the genetics and breed-
ing of maize. Inbreeding studies by Shamel (1905), East (1908), and Shull (1908), the
use of pure lines by Shull (1909, 1910) and Jones (1918), and the exploitation of the
inbred–hybrid concept by the seed industry subsequently changed the landscape of
maize breeding during the twentieth century. The open-pollinated cultivars developed
Maize Breeding 7
by the Native Americans and the European colonists main role was as sources of
germplasm to initiate development of inbred lines for use in hybrids.
There are several distinct phases in comprehensive maize breeding pro-
grams: prebreeding to evaluate and develop germplasm resources; genetic
improvement of germplasm; and development and testing of inbred lines for
use in hybrids. In most instances, equal weights are not given to each phase in
individual breeding programs. Each phase does not directly contribute to
developing inbred lines, but each phase can either directly or indirectly con-
tribute to inbred line development.
3 PreBreeding
Prebreeding includes the introduction, adaptation, evaluation, and improvement of
germplasm resources for use in breeding programs. Prebreeding usually does not
provide directly new cultivars for the growers. It rather develops germplasm
resources that are either directly or indirectly used to develop new cultivars.
Prebreeding is not a recent concept and has been an important component in the
development of present-day single-cross hybrids. Several stages of prebreeding
have preceded the inbred–hybrid concept of maize breeding and continue today.
The transition from a wild, weedy species to a species dependent on humans for its
survival was the initial stage of prebreeding for modern maize, followed by the
selection of open-pollinated cultivars adapted to environmental niches in nearly all
maize growing regions of the world. The methods used to develop the open-
pollinated cultivars were not systematic but the open-pollinated cultivars provided
the germplasm for developing the first-cycle inbred lines that were the parents of
the double-cross hybrids grown in the 1930s and 1940s. The development of the
open-pollinated cultivars provided a wealth of germplasm for the twentieth century
maize breeders.
Further development of germplasm resources was very limited during the period
of 1910–1950 because extensive effort was given to developing breeding methods
for effective and efficient development of inbred lines as parents of hybrids.
Although Brown (1953) and Wellhausen (1956) emphasized that ~98% of the
world’s maize germplasm was being ignored, prebreeding efforts were either
very limited or ignored. Prebreeding requires long-term goals which are not popular
in either, the public or the private sector breeding programs and/or granting
agencies. Immediate, short-term results are often difficult to measure and/or do
not lead to development of commercial products or unique research. In most
instances, researchers in both sectors need to provide evidence that progress is
being attained, which may be difficult in the short term. Hence, prebreeding is not a
popular research topic for young scientists who are under pressure for promotion
and tenure in the public sector and to develop products that generate income in the
private and/or public sectors. Funding has been a restraint, either being absent or
inadequate, to support the long-term goals of prebreeding usually concentrating
8 A.R. Hallauer, M.J. Carena
scientist efforts on research based on funding as opposed to research based on
needs.
Prebreeding during the past 50 years has been more of an effort by individuals
who appreciate the possible contributions that exotic germplasm can contribute to
modern-day maize breeding programs. It has only been recently that a consortium
of public and private individuals and organizations was formed to identify,
improve, and develop a broad array of germplasm for present-day maize breeding
programs (Pollak, 2003).
The development of the open-pollinated cultivars was an important contribution
to the ultimate success of the inbred–hybrid concept. Although the open-pollinated
cultivars were developed before the rediscovery of Mendelism in 1900, different
individuals had different objectives in mind for the different geographical areas and
anticipated uses. Consequently, the different open-pollinated cultivars often had
distinctive plant and ear traits. Allele frequencies for different traits would differ
among cultivars either because of intentional selection by humans or because of the
environmental effects. The methods and materials also varied. DeKruif (1928),
Wallace and Brown (1988), and Troyer (2001, 2006), for example, described the
methods and materials used to develop landraces Leaming, Reid Yellow Dent,
Lancaster Sure Crop, Krug, Minnesota 13, etc., all of which contributed useful
inbred parents of the early double-cross hybrids. The only common theme used in
developing these cultivars was that the originators desired to develop cultivars that,
in their judgments, met the needs of the growers for their specific environments. For
the more widely used cultivars (e.g., Reid Yellow Dent and Lancaster Sure Crop),
additional strains were developed, such as Troyer Reid, Black’s Reid Yellow Dent,
Iodent, McCullock’s Reid Yellow Dent, Osterland’s Reid Yellow Dent, Richey
Lancaster, etc. The wealth of available open-pollinated cultivars provided maize
breeders choices for use in early breeding programs. Some cultivars were more
useful sources of individual lines than others. The geographic areas of developing
the open-pollinated cultivars (e.g., Lancaster Sure Crop in southeast Pennsylvania
and Reid Yellow Dent in Delaven County, Illinois) led to the widely acclaimed
heterotic groups of Reid Yellow Dent and Lancaster Sure Crop, which was to have a
significant role in developing greater yielding hybrids in the US Corn Belt. Crosses
between known genotypes (heterotic groups) that express a higher level of heterosis
caused heterotic patterns to become established (Carena and Hallauer, 2001b). The
development of the open-pollinated cultivars was an important prebreeding activity.
Maize breeders (1920–1950) extensively sampled the better open-pollinated
cultivars to develop inbred lines that were used extensively until 1950; for example,
WF9, L317, I205, C103, 38-11, Hy, 187-2, Tr, 461, etc. (Crabb, 1947). After the
initial samplings of the open-pollinated cultivars, further samplings were not
successful in developing inbred lines that were superior to the initial sampling,
which would be expected if the original samplings were adequate. Emphasis on
developing the inbred–hybrid concept detracted from further improvements of the
open-pollinated cultivars. Prebreeding essentially ceased in the early 1900s within
the open-pollinated cultivars. Performance of crosses between open-pollinated
cultivars were first reported by Beal (1880) and continued until about 1920.
Maize Breeding 9
Because of experimental methods and perhaps some relationships among cultivars
(choice of germplasm), superiority of cultivar crosses was not consistent, and
interest in cultivar crosses was not widespread (Richey, 1922). Greater interest
and emphasis given to the potentials of the inbred–hybrid concept created less
interest in further selection within the open-pollinated cultivars.
Interest in prebreeding was revived on a limited scale with concerns of the
limited sources of germplasm included in US maize breeding programs during
the 1950s and 1960s (Brown, 1953, 1975; Wellhausen, 1956, 1965). Greater
impetus to this concern occurred with the southern corn leaf blight (Bipolarismaydis [Nisik.] Shoem.) epidemic in 1970 (Tatum, 1971). Although the southern
corn leaf blight epidemic of 1970 occurred because of the extensive use of the
Texas male-sterile cytoplasm source in production of the hybrid seed, concerns also
were expressed of the genetic vulnerability of the major cultivated crop species
(Anonymous, 1972). In most instances, the pedigrees of the germplasm used to
develop the more important cultivars could be traced to a very limited number of
ancestors. Isolated studies were conducted by interested individuals on the possible
uses of germplasm that was normally not an important component of US breeding
programs. Griffing and Lindstrom (1954), Kramer and Ullstrup (1959), Goodman
(1965), Thompson (1968), Nelson (1972), and Moll et al. (1962, 1965) are exam-
ples where specific objectives were tested, but, in all instances, no major compre-
hensive long-term research programs were developed to follow up on the issues
addressed. Griffing and Lindstrom (1954) crossed nine inbred lines (three adapted,
three exotic, and three with 25–50% exotic germplasm) in diallel crosses. They
found that inbred lines with 25–50% non-Corn Belt germplasm had combining
abilities for grain yield greater than the 100% Corn Belt inbred lines; Goodman
(1965) reported greater genetic variability in an exotic population compared with an
adapted population; Thompson (1968) found that exotic germplasm had greater
tonnage, but a lower quality silage, compared with adapted germplasm; and Moll
et al. (1962, 1965) found there was a limit to genetic divergence and the expression
of heterosis in crosses between adapted and exotic cultivars. In most instances,
exotic germplasm infers the germplasm was acquired from some geographical area
and was not adapted to the area for intended use. A more general usage of exotic
germplasm includes all germplasm (adapted and nonadapted) that has not had
selection and evaluation for direct use in applied breeding programs (Lonnquist,
1974). The specific studies did not resolve concerns about the limited genetic
diversity in applied breeding programs but useful information was gleaned from
the research for possible future use.
Interest in the potential of exotic germplasm in maize breeding was researched
for different goals and interests. Because of sites of origin of maize in tropical and
subtropical areas, it seemed that accessions from these areas would possess greater
resistance and/or tolerance to major pests of maize because of year around exposure
to the major pests of maize. Evidence suggests exotic germplasm does possess
greater resistance to some of the major pests of maize. Kim et al. (1988) evaluated
nine inbred lines, including six of tropical and subtropical origin, in a diallel mating
design for resistance to feeding by the second generation European corn borer
10 A.R. Hallauer, M.J. Carena
(Ostrinia nubilalis, Hubner). They reported the exotic inbred lines had greater
resistance to second generation European corn borers and would be good sources
of resistance if photoperiod sensitivity does not impede inbred line development.
Holley et al. (1989) reported that tropical hybrids crossed with US Corn Belt testers
had better resistance to kernel ear rot (Fusarium moniliforme). Tropical populationscrossed with US Corn Belt populations suggested that the tropical populations
possessed unique alleles for resistance to common rust (Puccinia sorghi Schw.),gray leaf spot (Cercospera zea-maydis Tehon and Daniels), and southern corn leaf
blight (Helminthosporium maydis Nisik. and Miyake) that were not present in a
widely used hybrid (Kraja et al., 2000). Holley and Goodman (1988a) also reported
a greater level of resistance to southern corn leaf blight among 100% tropical inbred
lines. Temperate adapted, 100% tropical inbred lines, evaluated per se and in
hybrids exhibited greater resistance to Diplodia maydis (Berk.) Sacc., than did
indigenous inbred lines (Holley and Goodman, 1988b). In addition to pest resis-
tance, exotic sources of germplasm have been screened to determine if unique
alleles can be identified that affect kernel quality traits. Campbell et al. (1995a)
reported highly significant genetic variation for starch properties among 26 exotic
inbred lines and suggested that screening for desirable starch property values would
be useful. Evaluation of two heterozygous populations containing 50% exotic
germplasm, but homozygous for the sugary (su2) locus, had increased genetic
variation for starch thermal properties compared with inbred lines fixed at the su2
locus, suggesting the presence of modifiers that could be used to modify normal su2
starch (Campbell et al., 1995b).
Studies have been conducted evaluating the potential of exotic populations and
their crosses and crosses between exotic and adapted population to determine their
relative performance for grain yield and other important agronomic traits that are
essential in modern maize production. The diallel mating design and testcrosses of
exotic materials and adapted testers have been the more common methods for
evaluating exotic sources. Evaluations have been made in both tropical and tem-
perate regions. Crossa et al. (1990) evaluated diallel crosses of 25 recognized
Mexican races at three elevations in Mexico and reported heterosis was expressed
in several race crosses. In a 10-parent population diallel evaluated in the US Corn
Belt, Mongoma and Pollak (1988) reported that BSSS(R)C10, an adapted popula-
tion of primarily Reid Yellow Dent germplasm, had the best general combining
ability (GCA), particularly with a Mexican dent population. Crossa et al. (1987)
reported that populations with lower estimates of variety heterosis were among the
better populations for mean cross performance, based on a 13-parent diallel of
maize populations. They suggested that the relations between populations and their
heterotic patterns would be needed for the correct choice of populations to include
in reciprocal recurrent selection (RRS) programs. Diallel crosses between seven
exotic populations and two US Corn Belt populations had greater grain yields
among adapted by exotic crosses (50% adapted germplasm) compared with crosses
having 100% adapted germplasm (Michelini and Hallauer, 1993). Echandi and
Hallauer (1996) evaluated a diallel of eight populations including four 100%
tropical populations, previously adapted to Iowa, and four US Corn Belt popula-
Maize Breeding 11
tions and the populations themselves for grain yield and seven agronomic traits in
Iowa. The two greatest yielding crosses were BSSS(R)C12 � BSCB1(R)C12 (12
cycles of RRS in Iowa completed) and BS10(FR)C10 (10 cycles of RRS in Iowa
completed) � BS29 (an adapted strain of Suwan-1), suggesting BS29 has potential
in the Lancaster Sure Crop heterotic group (Menz and Hallauer, 1997).
Evaluation of exotic or exotic derived germplasm has been accomplished via use
of testcrosses with either adapted single crosses or elite representatives of US Corn
Belt heterotic groups rather than use of diallel crosses. Lonnquist (1974) compared
both methods and reported the use of one or two elite testers from each heterotic
group permitted more consistent assignment of exotic populations into the US Corn
Belt heterotic groups. Mishra (1977) and Stuber (1978) reported good agreement
between diallel and testcross information, but Christensen (1984) reported poor
agreement between the two methods. Stuber (1978) crossed 285 exotic collections
to three adapted single-cross testers that were evaluated in North Carolina. The best
testcrosses were further evaluated 2 years in regional trials and the best four
testcrosses had yields greater than 90% as much as the best commercial hybrids.
Gutierrez-Gaitan et al. (1986) testcrossed 24 Mexican populations, developed
primarily by CIMMYT, to two populations representing the primary heterotic
group of the US Corn Belt; BS13(S)C3, a representative of Reid Yellow Dent
and BS26, a representative of Lancaster Sure Crop. Testcrosses, testers, and
populations themselves were evaluated in Mexico and the US Corn Belt. Grain
yields of testcrosses did not differ significantly from the adapted tester populations
in the US Corn Belt, and the US Corn Belt materials performed better than expected
when evaluated in the Mexican environments.
Tallury and Goodman (1999) included all possible single, three-way, and dou-
ble-cross hybrids among three primarily temperate and three adapted inbred lines in
yield trials. Single-cross hybrids with 50–60% adapted germplasm produced grain
yields equal to the commercial checks. Elite inbred lines (B73 and Mo17) repre-
senting Iowa Stiff Stalk Synthetic (BSSS) and non-BSSS heterotic groups were
crossed to seven tropical populations and hybrids were evaluated for gray leaf spot,
southern corn leaf blight, and common rust (Kraja et al., 2000). The exotic sources
had favorable dominant alleles for each of the leaf diseases. Kraja et al. (2000)
recommended that testcrosses to a series of tropical populations be made using the
same inbred tester(s).
Holley and Goodman (1988b) evaluated the yield potential of tropical maize
derivatives derived from diallel crosses of nine tropical hybrids. Selection was
initiated within each cross during eight generations of inbreeding for acceptable
maturity and other desirable agronomic traits. After eight generations of inbreeding
and selection, 34 inbred lines were crossed to two US Corn Belt maturity testers
with the testcrosses evaluated for 2 years at three North Carolina locations. They
derived inbred lines from 100% tropical germplasm that had testcrosses that were
adapted for agronomic traits to the southern United States, matured 1 week later
than B73, had plant heights and grain moisture levels of testcrosses within the range
of commercial hybrids used in the area, and about 25% of the testcrosses had grain
yields similar to the commercial checks. Holley and Goodman (1988b) also found
12 A.R. Hallauer, M.J. Carena
that the derived inbred lines were relatively insensitive to photoperiod effects,
which has been a major concern with attempting to integrate tropical germplasm
into temperate area breeding programs. They credited the insensitivity to photope-
riod as a result of integrating complementary genetic systems from different
tropical germplasm sources.
The use of tropical germplasm to broaden the genetic base of temperate area as
sources of abiotic and biotic sources of pest resistance and for new traits is not
without difficulty. Lack of adaptation is the primary limitation to determine which
sources may have greatest potential to contribute useful genes and combinations of
genes for temperate areas. Judicious selection of germplasm and careful selection,
however, can overcome the handicaps of photoperiod effects (Holley and
Goodman, 1988b). Lack of adaptation and lower mean yields of tropical materials
compared with adapted temperate materials are, however, major difficulties for
their immediate use, necessitating in most instances, longer-term breeding pro-
grams. Lack of adaptation is the primary reason two to three backcrosses are
recommended when integrating germplasm from tropical sources into temperate
materials. Holland and Goodman (1995) were able to develop photoperiod insensi-
tive versions of the 40 original exotic accessions by a combination of crossing four
plants of each exotic accession to an adapted inbred line and then intermating the
earliest plants among the four full-sib families. This method was used for two
additional generations to produce the photoperiod insensitive versions of the
original exotic accessions. Hainzelin (1998) used a combination of mass selection
and backcrossing of exotic materials to adapted germplasm to reduce the effects of
photoperiod, which is similar to the method used by Holland and Goodman (1995).
Photoperiod effects can also be reduced by crossing to a very early source followed
by selection for adaptation (Gerrish, 1983; Holley and Goodman, 1988b) or by
crossing improved unadapted sources followed by selection or by identifying
photoperiod insensitive exotic sources (Oyervides-Garcia et al., 1985).
Another approach to adapt tropical materials to temperate areas includes selec-
tion for earlier maturity and desirable plant types during inbreeding in segregating
populations. These populations included primarily backcross populations derived
either from biparental crosses or 100% tropical hybrids. Eagles and Hardacre
(1990) derived S1 progenies from the backcross of an elite US Corn Belt population
to a Mexican highland population to develop materials for the cool, temperate
climate of New Zealand. S2 progenies were derived from the S1 progenies and S2testcrosses were evaluated. Grain yields of the selected S2 testcrosses were similar
to the S2 testcrosses of the US Corn Belt recurrent parent, the S2 testcrosses from the
backcrosses had greater root lodging, but acceptable grain moisture levels. Caton
(1999) for subtropical materials and Whitehead (2002) for tropical materials eval-
uated backcrosses derived from crosses between US Corn Belt and CIMMYT
populations. Heterotic alignments of the respective areas were used in producing
the population crosses: BSSS populations were crossed to primarily Tuxpeno
sources and non-BSSS populations crossed to primarily non-Tuxpeno materials.
All populations used in the crosses were derived from recurrent selection programs
in Iowa and at CIMMYT. The crosses and backcrosses were produced in Mexico
Maize Breeding 13
with the evaluations of backcross progenies and testcrosses of selected backcross
progenies conducted in Iowa (Whitehead et al., 2006). There were 684 subtropical
and 891 tropical backcross progenies evaluated 1 year at Ames, IA. Based on data
for maturity, grain yield, root and stalk strength, and ear droppage, 142 subtropical
and 181 tropical backcrosses were crossed to elite US Corn Belt testers and
evaluated at five and seven US Corn Belt locations. Evaluation of backcrosses to
temperate recurrent parents (25% tropical) and testcrosses of superior backcrosses
(12.5% tropical) with elite temperate testers had flowering dates and harvest
moisture levels that were, in most instances, not significantly greater than the
recurrent parents and adapted checks. The objective of the research was to integrate
elite exotic materials into elite temperate materials to combine favorable alleles for
grain yield and other agronomic traits into germplasm pools that were adapted to
temperate environments. The two-stage selection and testing program with multi-
ple-trait selection was used to identify the superior backcrosses progenies that were
intermated to form four germplasm pools (BS35, BS36, BS37, and BS38). Results
suggested 25% elite exotic germplasm can be incorporated in the important US
heterotic groups without disrupting the combining ability for grain yield expressed
in the BSSS and non-BSSS crosses.
One concern when attempting to adapt exotic materials to temperate areas is the
optimum proportion of exotic germplasm needed to include in adapted materials
before initiating selection. Crossa and Gardner (1987) stated that the primary
disadvantage regarding selection within populations backcrossed to adapted popu-
lations was that useful alleles present at a lower frequency in the nonrecurrent
exotic population would have a greater chance of being lost with backcrossing to
the adapted parent. Conversely, alleles from the adapted parent would have less
chance of being lost in backcross populations than in populations with only 50%
adapted germplasm. Albrecht and Dudley (1987) assessed the relative breeding
value of four populations with different proportions of exotic germplasm. Random
sets of 80–100 S1 families were evaluated from populations that included 0, 25, 50,
and 100% exotic germplasm. The set of S1 progenies derived from the backcross
population with 75% adapted germplasm had the greatest predicted genetic gain for
grain yield itself and would be the more favorable population to initiate selection.
Hameed et al. (1994) included 18 exotic inbred lines and their F2 and backcross
populations that were evaluated in testcrosses to B73 and Mo17. Grain yield
increased in the backcross population versus the F2 populations suggesting that
backcrossing to the superior parent was the better method. Majaya and Lambert
(1992) crossed five diverse Brazilian inbreds to two Lancaster Sure Crop inbred
lines and then backcrossed to the two adapted lines. Selected backcross families
were backcrossed again to the adapted lines to form the second backcrosses.
Selection of the backcross families was based on multiple leaf and stalk rot
pathogens, earlier maturity, and phenotypes similar to the recurrent parents. The
best 26 backcross families from either the first or second backcrosses were eval-
uated as FRB73 testcrosses in Illinois. Generally, the families from the first
backcross had better testcross grain yields than the check hybrids. Hofbeck et al.
(1995) investigated the effects of backcrossing and intermating in an adapted �
14 A.R. Hallauer, M.J. Carena
adapted tropical population by evaluating 100 unselected lines derived for each
combination of three generations (50%, 75%, and 87.5%) of backcrossing and three
cycles (0, 3, and 5) of intermating. Backcrossing shifted the means, reduced genetic
variation, and developed earlier maturity levels, whereas intermating had no signif-
icant effects on the population. Hofbeck et al. (1995) concluded that backcrossing
was more useful for the incorporating of exotic germplasm into temperate germ-
plasm than intermating.
Mass selection (phenotypic recurrent selection) methods have been used effec-
tively to adapt 100% tropical and tropical� US Corn Belt populations to temperate
environments. Also, stratified mass selection has been successfully utilized to adapt
late maturing temperate populations into the US north central region (Carena et al.,
2008). Genter (1976) suggested that any system of cyclical selection that improves
adaptation would decrease the frequency of the less desirable individuals and
increase grain production. He conducted ten cycles of mass selection within 25
Mexican populations for erect, disease free plants with mature grain at harvest time.
The selections from the 25 Mexican populations were intermated to form a single
population having increased grain yield, fewer days to flowering, drier grain at
harvest, greater stalk lodging, and no changes for root lodging. Six cycles of mass
selection for earlier flowering within seven late flowering synthetic populations
were completed in Minnesota at 65,000–87,000 plants per hectare (Troyer and
Brown, 1976). The mass selection procedure included intermating the earliest 5%
for flowering via use of bulk pollen. Cycle comparisons showed significant linear
associations between cycle number and number of days to flowering, pollen shed-
silking interval, grain moisture, and plant and ear heights. Troyer and Brown (1976)
concluded that mass selection for earlier flowering at greater plant densities was
effective for adapting later flowering synthetic population crosses for earlier matu-
rity zones. Carena et al. (2008) and Eno (in press) showed similar results of
successful adaptation of BS11(FR)C13 and BSK(HI)C11 improved populations
after three cycles of stratified mass selection utilizing 22,500 seeds and selecting
the 400 plants with earliest silk emergence and evaluation across nine environments
in 2005, 2006, and 2007.
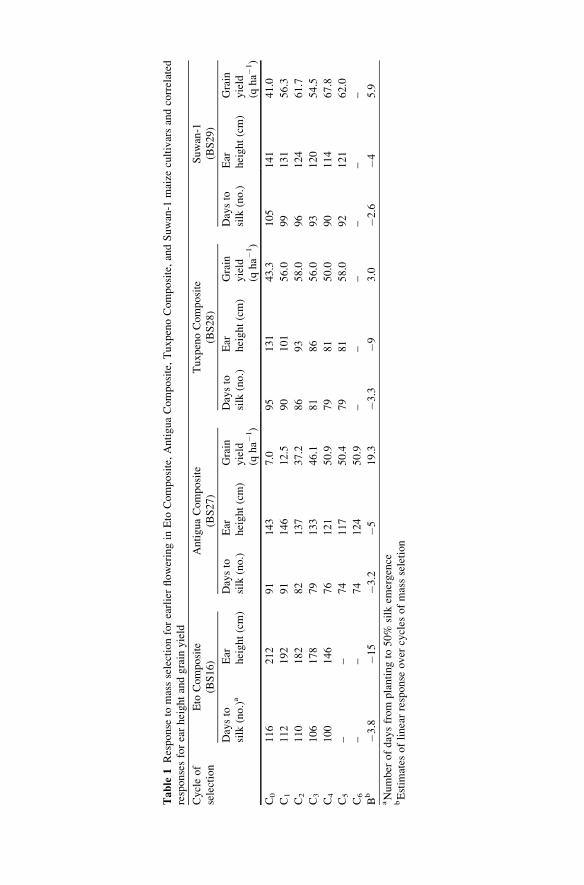
Hallauer (1999b) summarized the results of mass selection for earlier flowering
in four tropical cultivars to reduce to photoperiod effects for possible use as
germplasm sources for US Corn Belt breeding programs. For each cycle of mass
selection, 10,000–15,000 seeds were planted in an isolated field and the 250 earliest
flowering plants were marked for selection. Selection was based on silk emergence
with no selection for pollen shed. Response to selection was similar for each
tropical cultivar (Table 1). Average linear response for earlier flowering was
�3.3 days cycle�1 of selection. Correlated responses to selection for earlier flower-
ing included reduced ear height and increased grain yield. Grain yields increased
because of greater adaptation to temperate environments. Other correlated
responses included reduced tassel size, reduced root and stalk lodging, reduced
plant height, reduced infection by Ustilago maydis (DC.) Cda. Narro (1990)
evaluated Compuesto Selection Precoz after 15 cycles of half-sib recurrent
selection for earliness. Compuesto Selection Precoz was formed by intermating
Maize Breeding 15
Table
1Response
tomassselectionforearlierfloweringin
Eto
Composite,AntiguaComposite,TuxpenoComposite,andSuwan-1
maize
cultivarsandcorrelated
responsesforearheightandgrain
yield
Cycleof
selection
Eto
Composite
(BS16)
AntiguaComposite
(BS27)
TuxpenoComposite
(BS28)
Suwan-1
(BS29)
Daysto
silk
(no.)a
Ear
height(cm)
Daysto
silk
(no.)
Ear
height(cm)
Grain
yield
(qha�
1)
Daysto
silk
(no.)
Ear
height(cm)
Grain
yield
(qha�
1)
Daysto
silk
(no.)
Ear
height(cm)
Grain
yield
(qha�
1)
C0
116
212
91
143
7.0
95
131
43.3
105
141
41.0
C1
112
192
91
146
12.5
90
101
56.0
99
131
56.3
C2
110
182
82
137
37.2
86
93
58.0
96
124
61.7
C3
106
178
79
133
46.1
81
86
56.0
93
120
54.5
C4
100
146
76
121
50.9
79
81
50.0
90
114
67.8
C5
––
74
117
50.4
79
81
58.0
92
121
62.0
C6
––
74
124
50.9
––
––
––
Bb
�3.8
�15
�3.2
�519.3
�3.3
�93.0
�2.6
�45.9
aNumber
ofdaysfrom
plantingto
50%
silk
emergence
bEstim
ates
oflinearresponse
over
cycles
ofmassseletion
15 high-yielding tropical materials. The goal of the selection program was to
develop an earlier flowering, high yield cultivar for use in tropical areas. Selection
was practiced at two locations in Mexico. After 15 cycles of selection for earliness,
evaluations were conducted at 12 locations (nine tropical and three temperate) to
determine responses (direct and indirect) to selection for earlier flowering. Time
from planting to flowering decreased 0.46 days cycle�1 (b = �10.46), which was
less than that reported by Troyer and Brown (1972, 1976) and Hallauer (1999b). For
the one temperate location (Ames, IA), direct response was �1.30 day cycle�1,
which was similar to the data reported by Troyer and Brown (1972, 1976). Indirect
response included reductions in grain yield, grain moisture, plant and ear heights,
and leaf area. Mass selection is a very cost effective method for adapting exotic
sources to temperate environment, but the adapted exotic sources require greater
breeding efforts within breeding programs. This is because mass selection does not
include any intentional inbreeding to reduce the genetic load of deleterious reces-
sive alleles and no testcrossing with adapted materials is involved to determine the
combining ability of exotic materials with adapted materials. For the tropical
cultivars that Hallauer (1999b) adapted to temperate environments, the adapted
tropical cultivars, however, had good performance when compared as cultivars
themselves and in crosses with previously selected Corn Belt synthetic cultivars
(Hallauer, 2003). Suwan-1 (BS29) performance itself and in crosses was similar to
US Corn Belt synthetic cultivars that had undergone 10 or more cycles of RRS.
Suwan-1 (BS29) and Tuxpeno Composite (BS28) are currently undergoing recip-
rocal half-sib recurrent selection and have flowering dates and harvest grain
moisture levels similar to US Corn Belt populations (Menz and Hallauer, 1997;
Hallauer, 2002).
Tropical cultivars grown in temperate environments are characterized as having
tall stature, larger leaves, larger tassels, longer growing season because of photope-
riodism, greater susceptibility to Ustilago maydis, lower grain yield, and conse-
quently, a poor grain-to-stover ratio (<0.40). Thompson (1968) reported, for
example, that the tropical cultivars provided greater tonnage for silage but had
lower quality silage because of reduced grain production. Hallauer (1999b) found
that grain yields increased with selection for earlier flowering in Antigua Composite,
Tuxpeno Composite, and Suwan-1. On the average, days from planting to flowering
decreased3.3 days cycle�1 of selection and grain yields increased 9.4 q ha�1 cycle�1
because the tropical cultivars became more adapted to the temperate environments.
Carena et al. (2008) and Eno (2008) found, on average across populations, that
planting to flowering decreased 2.1 days year�1 of selection and grain yields
increased 3.5 q ha�1 year�1 when adapting temperate materials to North Dakota.
The effects of photoperiod have been the major constraint in evaluating the
relative potential of tropical materials for temperate areas (Goodman, 1985). It does
not seem, however, that the use of tropical materials in temperate area breeding
programs is limited by photoperiodism. Research by Gerrish (1983), Holley and
Goodman (1988b), Holland and Goodman (1995), and Hallauer (1999b) suggests
there is genetic variation for photoperiodism within tropical materials and that
selection is effective for reducing the effects of photoperiodism. It seems a few
Maize Breeding 17
major genes control photoperiodism. Mass selection by Troyer and Brown (1972,
1976) and Hallauer (1999b) was effective in developing earlier flowering strains of
tropical cultivars that had grain yields similar to adapted US Corn Belt cultivars.
Just because tropical materials are adapted to temperate environments, it does not
infer that they are of immediate use to modern corn breeding programs. Similar to
other germplasm sources considered for breeding programs, the adapted tropical
materials need to meet the current standards for grain yield, root and stalk strength,
pest tolerance, and maturity that are present in adapted materials used in current
breeding programs. Additional selection will be needed. Hallauer (1999b), for
example, initiated reciprocal half-sib recurrent selection (RRS) with BS28 (adapted
strain of Tuxpeno Composite) and BS29 (adapted strain of Suwan-1) to improve
grain yield and other agronomic traits. Days-to-flowering and harvest grain mois-
ture of the BS28 and BS29 half-sib families are similar to those for BSSS(R) and
BSCB1, two adapted populations that have been under half-sib RRS since 1949 in
Iowa (Keeratinijakal and Lamkey, 1993).
Photoperiodism limits making direct comparisons between tropical and adapted
cultivars in temperate environments. Hence, crosses of tropical cultivars with earlier
maturity materials, backcrosses to adapted recurrent parents, and testcrosses of
tropical cultivars to adapted testers often have been used to determine the relative
potential of tropical cultivars in temperate area breeding programs. The proportion
of the tropical germplasm in the materials evaluated can range from 12.5% to 50%
with 25% to 50% the more common ranges for the central US Corn Belt. The lesser
the amount of tropical germplasm included in the evaluation trials, the greater the
opportunity that useful germplasm from the tropical cultivars may be eliminated.
This, of course, would detract from the original goals of introducing tropical
materials to increase genetic diversity and introduce useful alleles from the tropical
materials in temperate area breeding goals. Dudley (1984a, b) suggested a method
where a series of crosses are made between adapted and exotic materials to identify
which exotic sources would contribute useful alleles that not currently present in the
adapted sources. Crossa (1989) has discussed theoretically the choice of selecting
the appropriate populations and the ideal percentages of exotic germplasm to
integrate the more useful alleles of the two sources. The suggestions of Dudley
(1984a, b) and Crossa (1989) have had limited empirical testing but the concepts
could have greater application in studies in marker-assisted selection (MAS) and/or
gene assisted selection (GAS) if adequate molecular markers or, ideally genes,
become available in the tropical materials. It seems more likely that MAS will
have greater applications in transferring desirable chromosome segments from
elite tropical lines into elite adapted lines, in addition to aiding backcrossing on
GMO single-gene traits.
Long-term programs for the introduction, evaluation, and adaptation of tropical
materials for temperate environments are limited. The program at North Carolina
State University led by M. M. Goodman has had the greatest impact in the United
States (Goodman, 1999a, b). His approach has been to introduce and evaluate
tropical inbred lines and hybrids. Crosses, backcrosses, and testcrosses have been
used to identify selections whose performances have, in some instances, been either
18 A.R. Hallauer, M.J. Carena
equal to or similar to the adapted hybrid checks (Goodman, 1999a, b; Holley
and Goodman, 1988b; Uhr and Goodman, 1995; Holland and Goodman, 1995;
Hawbaker et al., 1997). In some instances, inbred lines included 100% tropical
germplasm. The program has used conventional maize breeding methods of
inbreeding and testcross evaluation to identify inbred lines that have been released.
In addition to grain yield and other agronomic traits, lines during development were
also screened for most of the leaf diseases common to southeastern United States,
but also present in the US Corn Belt. Goodman has also been an active leader and
contributor of the Latin American Maize Program (LAMP) and the Germplasm
Enhancement of Maize (GEM) program. The North Dakota State University
(NDSU) maize breeding program used a similar approach for adaptation of released
GEM lines to the northern US Corn Belt. Since the year 1999, early maturing (<95
RM) GEM derived lines have become available to increase the on-farm genetic
diversity of early maturing maize. It is the first effort to incorporate tropical and late
temperate genetically diverse early maturing (<100RM) materials in North Ameri-
ca. Carena (2008) the Iowa State University maize breeding program used a
different approach. This program used mass selection to adapt tropical cultivars
that are important in tropical areas around the world for Iowa (Hallauer, 1999b).
The tropical cultivars subjected to mass selection included Eto Composite from
Colombia (during 1960s), Antigua Composite from Antigua (during 1970s), Tux-
peno Composite from Mexico (during 1980s), Suwan-1 from Thailand (during
1980s), and Tuson Composite from Cuba (during 1990s). Tuxpeno Composite
was formed from different strains of Tuxpeno developed by Elmer Johnson at
CIMMYT (Johnson et al., 1986), whereas Tuson Composite was formed by inter-
mating five strains of Tuson provided by M. M. Goodman. It required 6 to 8 cycles
(years) of mass selection to adapt most tropical cultivars to central Iowa. The
adapted strains, designated as BS16 (Eto Composite), BS27 (Antigua Composite),
BS28 (Tuxpeno Composite), and BS29 (Suwan-1) have flowering dates, harvest
grain moisture levels, and plant and ear heights similar to the Iowa populations
included in long-term recurrent selection programs. Tuson Composite has not been
evaluated, but after 10 cycles of mass selection flowering dates and plant and ear
heights are similar to adapted populations. No inbreeding and testcrosses of lines
have been developed from any of the adapted tropical populations. Three cycles of
S1–S2 recurrent selection have been completed in BS16 for grain yield, agronomic
traits, resistance to first-generation European corn borer, and one cycle for tolerance
to viruses. Three cycles of half-sib RRS have been completed for BS28 and BS29
(Hallauer, 2002). No inbred lines have been developed and released from any of the
adapted tropical cultivars. Further improvements are needed for general agronomic
performance, particularly greater root strength. From 1995 to 2005, a conversion
program involving populations derived from long-term recurrent selection pro-
grams in Iowa and at CIMMYT was conducted. Crosses and backcrosses were
produced in Mexico. Alignments of heterotic groups for the respective areas were
retained; that is, BSSS populations crossed to primarily Tuxpeno materials, and
non-BSSS populations crossed to non-Tuxpeno materials (Whitehead et al., 2006).
Backcross progenies were evaluated for grain yield and moisture, root and stalk
Maize Breeding 19
strength, and days to flower; superior backcross progenies crossed to adapted testers
(LH185 for BSSS and LH198 for non-BSSS) and evaluated at 5 to 7 Iowa locations.
Remnant seed of the superior backcross progenies per se and in testcrosses was
intermated to form BS35 and BS36 (subtropical) and BS37 and BS38 (tropical) and
released. These four populations include 25% subtropical and tropical germplasm.
No inbred lines have been developed from the backcrosses.
Two other long-term programs for evaluating germplasm have a greater scope
than those previously discussed; one, CIMMYT, has an international mandate to
evaluate and develop materials for tropical areas worldwide and the other, GEM,
primarily emphasizes the introduction and evaluation of exotic germplasm within
the United States. The comprehensive program conducted by CIMMYT includes
different stages for the development and evaluation of germplasm pools and
populations for the subtropical, tropical, and tropical highland areas of the world
(Vasal et al., 1982). The original goal was to provide improved cultivars for the
smaller, subsistent farmers, but emphasis also has been given to developing inbred
lines and hybrids during the past 20 years. Initially, 27 gene pools were formed that
had specified adaptation, maturity, grain color, and texture. The gene pools repre-
sented broad reservoirs of genes formed by intermating diverse cultivars, cultivar
crosses, and hybrids that possessed the specified traits of the 27 pools. It seems at
this time no attention was given to heterotic groups. Major emphasis was given to
pool and population development rather than hybrids. The emphasis for develop-
ment of hybrids occurred later, and then greater concern was given to heterotic
groups in tropical areas (Vasal et al., 1999). Modified ear-to-row selection was used
to select for desirable progenies and plants within each pool. If other promising
materials were identified that could enhance the pools, the new introductions were
integrated into the respective pools. The more promising families and selections
from the pools are entered in the advanced unit for more extensive testing, includ-
ing international trials. Within the 27 populations included in the advanced unit,
full-sib family selection is practiced. Based on extensive testing and selection,
selected families are entered in elite experimental variety trials that are conducted
by all interested national programs. Data from the international trials identified
superior cultivars that were seed increased and distributed where requested. The
comprehensive program met the goal of providing improved seeds to subsistent
farmers, and germplasm from the CIMMYT program has become widely
distributed and used in the lesser developed areas of the world (Dowswell et al.,
1996). Although the use of hybrids has increased in the areas emphasized by
CIMMYT’s population improvement program, the products of the selection within
the pools and advanced units provided the germplasm for the development of inbred
lines and hybrids. The formation and selection within the genetic pools and
advanced units provided the germplasm for developing inbred lines similar to the
selected open-pollinated cultivars for the US maize breeding programs.
The GEM project in the United States is based on the information derived from
LAMP. The goals of LAMP were to characterize and regenerate the maize acces-
sions held in the Latin American germplasm banks. There were 12,113 accessions
evaluated, and after five stages of evaluation and selection 268 elite accessions were
20 A.R. Hallauer, M.J. Carena
identified (Salhuana et al., 1997). After the completion of LAMP, it was realized
that additional selection was needed if the accessions were to contribute useful
germplasm to present-day breeding programs. It was also realized that the task was
too great for any one research unit to conduct the comprehensive program needed to
genetically improve the accessions because of limited funding and staffing. An
enhancement proposal was prepared and the US Congress appropriated $500,000
annual funding for the GEM project. The ultimate objective of GEM is to improve
and broaden the germplasm base of hybrids grown by American farmers (Pollak,
2003). The GEM project is a cooperative effort including personnel and facilities of
the USDA-ARS, universities, private industry, international, and non-governmental
organizations to collaboratively broaden the maize germplasm base by improving
germplasm from exotic sources. During 2007, GEM cooperators included 24
private companies, 20 public institutions, one nongovernment agency, and 11
international cooperators. The GEM breeding protocol is a modified pedigree
method originating from crosses with adapted proprietary inbred lines provided
by GEM cooperator companies. Early generation testing starts at the S2 generation
(first-year trials) followed by further testing at the S3 generation (second-year
trials). The testers in all stages are elite proprietary inbred lines. In the US Corn
Belt, the focus is breeding of 25% tropical breeding crosses and 25% and 50%
temperate breeding crosses, whereas at Raleigh, NC emphasizes 50% breeding
crosses; that is, an additional backcross is used in the US Corn Belt to evaluate
the exotic accession. GEM is an active, mature breeding program adequately
funded to sustain the breeding efforts for the long term. GEM inbred lines that
seem to offer useful genes for maize breeding programs are made available for
public use. Materials from GEM will broaden the genetic base of US breeding
programs. Pollak and Salhuana (1999) used restriction fragment length polymorph-
isms to determine relations among six Caribbean LAMP accessions and the adapted
US inbred lines B73 and Mo17. They found that the LAMP accessions were
different from B73 and Mo17 and that the Caribbean accessions also were very
diverse among themselves. The limited sample studied by Pollak and Salhuana
(1999) suggests even greater diversity can be expected from the broadly based
exotic accessions being studied by GEM. GEM materials have been incorporated
into US public programs to develop new sources of pest resistance (University of
Illinois, University of Delaware, Texas AM University, and Cornell University)),
grain quality (Truman State University, North Dakota State University, and Iowa
State University), early maturity and moving GEM germplasm northward (North
Dakota State University), drought tolerance (North Dakota State University and
Texas AM University), and silage products (University of Wisconsin).
Suggestions of the potential of exotic germplasm to contribute useful alleles to
temperate area breeding programs have been made for 50 years. It is estimated that
temperate area breeding programs have used less than 5% of the available maize
germplasm. Although specific research studies have been reported during the past
50 years, sustained long-term programs involving exotic germplasm were not
continued because they were either not financially supported and discontinued or
supported at levels not conducive for making significant contributions to applied
Maize Breeding 21
breeding programs. The GEM program may be able to overcome past failures and
provide useful germplasm with exotic components in the future. Incorporating
exotic germplasm into adapted germplasm will require the same evolutionary
methods that occurred in the formation of new races; that is, the US Corn Belt
Dent race developed by merging the favorable alleles from the Northern Dents and
Southern Dents followed by selection. The goal is difficult because intense selec-
tion during the past 100 years has developed an elite pool of genotypes that have
favorable combinations of alleles. Any interruption of the favorable gene com-
plexes by the introduction of exotic germplasm will cause changes in performance
that may not be desirable. At present, the contributions of exotic germplasm to
current inbred line development are limited but promising. Goodman (1999b)
reported that exotic germplasm included in the inbred parents of US hybrids had
increased from 1% in 1984 to 3% in 1996. And the largest proportion (1.99%) came
from use of exotic temperate germplasm 41.2504B, a selection fromMaize Amargo
used to develop B64 and B68. Mikel and Dudley (2006) summarized information of
the proprietary lines included to produce US single-cross hybrids. They found that
the majority of current germplasm used in developing inbred lines originated from
seven lines and that 63% of the lines had germplasm that traced to BSSS. BSSS was
developed in the 1930s by intermating 16 inbred lines that had primarily Reid
Yellow Dent germplasm at the Iowa State University corn breeding program. It is
difficult to visualize how with the limited germplasm base of BSSS that BSSS
germplasm could still have such an important role in current US hybrids. The
recycling methods used in BSSS itself and in line development since 1939 have
created a finely-tuned, unique complexes of genes (e.g., epistatic combinations) to
produce inbred lines that in hybrids have consistently high levels of performance. If
exotic germplasm was introduced in BSSS, the exotic germplasm would need to be
carefully integrated to not disrupt the gene complexes developed during the past 60
years of selection and intermating. This will be a challenge where there has been a
long history of selection within adapted germplasm.
4 Recurrent Selection
Systematic genetic improvement of maize populations and inbred lines requires the
use of some type of cyclical continuous selection. Cyclical selection (phenotypic)
was used to make the transition from a wild, weedy species to a cultivated species
and in developing the different races, cultivars, and strains of the open-pollinated
varieties. The originators of the popular open-pollinated cultivars Leaming, Reid
Yellow Dent, and Lancaster Sure Crop used cyclical selection (mainly phenotypic)
methods to develop cultivars that conformed to their concepts for developing
superior cultivars for their environments. In some instances, germplasm from
other sources were introduced to modify certain traits that they wanted to enhance.
This process was continued by other individuals to develop substrains of the more
popular open-pollinated cultivars to develop Osterland Reid, Black’s Reid, Iodent,
22 A.R. Hallauer, M.J. Carena
Krug, Richey Lancaster, etc. This process did not use structured selection methods,
rather the ideotypes selected depended on the individual concepts to develop better
performing cultivars and, in earlier years, how the selected ears conformed to
specified score card standards. Success depended on the patience and perseverance
of the interested seedsmen. Interest in open-pollinated cultivars decreased with the
suggestions of Shull (1910) and Jones (1918) for developing hybrids and the
industry exploitation of the inbred–hybrid concept. Public efforts were comple-
mented by the private sector being responsible for the practical success of hybrid
maize (Carena and Wicks III, 2006). Simple selection methods were used effec-
tively to develop unique open-pollinated cultivars (Sturtevant, 1899). However,
average US maize grain yields did not improve from 1865 to 1935 (Troyer, 2006;
Fig. 1). Failure to improve grain yields of the open-pollinated cultivars with the
recycling methods used probably was because selection was based on individual
plants (low heritability), selection on plant and ear traits that did not impact grain
yield (low correlations), inadequate control of male gametes (poor or no isolation),
and poor plot techniques (poor control of local environmental effects). Modifica-
tions for reducing some of the limitations for effectiveness of mass selection were
proposed by Gardner (1961) and the extensive use of population improvement
schemes and choice of elite maize germplasm were good suggestions but too late
to influence the seedsmen in the 1800s and early 1900s.
The inbred–hybrid concept of Shull (1910) and Jones (1918) dominated US
maize breeding and research from 1922 to 1950. Emphasis was given to developing
inbred lines, testing of hybrids, and developing breeding methods to enhance the
effectiveness of identifying inbred lines and their hybrids. The more popular open-
pollinated cultivars were the primary source germplasm for developing inbred
lines. Recycling methods for germplasm improvement and inbred lines were
minimal. During the 1950s, there was greater interest in recycling to enhance
genetically broad-based populations and improve the vigor and productiveness of
inbred lines. Although average US maize yields increased 63.1 kg ha�1 from 1935
to 1965, it seemed that grain yields of double-cross hybrids had a plateau. Hence,
there was a reexamination of breeding methods, germplasm sources, and inbred
lines to determine how further progress can be attained.
The primary germplasm sources for developing the first-cycle inbred lines used
in double-cross hybrids were the open-pollinated cultivars and no attention had
been given to improve the original germplasm sources. Resampling of the open-
pollinated cultivars had not been fruitful, which would be expected if the initial
samplings had been adequate to capture the genetic variation within the open-
pollinated cultivars. Heterosis had been exploited in developing the double-cross
hybrids, but determining the genetic basis of heterosis has been elusive. Because the
use of hybrids had become established and demanded by the producers, the
suggestions of procedures to enhance genetically broad-based populations were
influenced by the genetic effects considered of greatest importance in the expres-
sion of heterosis in hybrids. Hence, selection methods were suggested that empha-
sized selection for genetic effects that the originators considered of greater
importance in the expression of heterosis in hybrids.
Maize Breeding 23
The selection schemes suggested for the genetic improvement of populations are
designated as recurrent selection. Although recurrent selection is usually associated
with population improvement and has methods of selection with different objec-
tives when compared to pedigree selection, the concepts of recurrent selection also
are applicable to pedigree selection methods for recycling of inbred lines (Hallauer,
1985). Effective recurrent selection methods contribute selections that can be used
in pedigree selection (Hallauer and Miranda, 1988). In all instances the goal of
recurrent selection schemes is to increase the frequency of the favorable alleles for
the trait(s) under selection. The traits considered in recurrent selection are complex
traits that are not amenable to Mendelian analyses, designated as quantitatively
inherited traits. To genetically improve the quantitative traits, recycling methods, or
recurrent selection methods are used to incrementally increase the frequency of the
favorable alleles. Gradual genetic improvements are the norm for traits under
recurrent selection. To accomplish the goals of recurrent selection, the following
breeding procedures are used after the choice of populations to include in recurrent
selection has been determined: develop progenies (or families) that adequately
sample the genetic variation of the population; evaluate the progenies in replicated
trials to determine their relative breeding values within the target environment(s);
intermate the progenies with the superior breeding values to form a population for
the next cycle of selection; and repeat the three stages for continued selection. The
more important questions asked for each stage is: how many? How many progenies
should be developed for evaluation? How many replications of data are needed to
differentiate breeding values among the progenies? And, how many progenies
should be intermated to form the next cycle population for continued selection?
Specific answers to each question depend on trait under selection, relative herita-
bility (h2) of the trait under selection, types of progenies being evaluated, environ-
mental effects and experimental techniques in determining the precision of the
breeding values of the progenies, methods and facilities to use for intermating, and
funds, facilities (e.g., winter nurseries), and personnel available to complete each of
the three phases. Specific guides cannot be offered, but empirical data from the
recurrent selection programs do provide some general guides. It seems 100 to 200
families should be sampled, based on empirical data reported by Marquez-Sanchez
and Hallauer (1970a, b) for the standard errors of the additive genetic and the
nonadditive genetic components of variance. The number of replications depends
on the types of progenies (relative h2s) evaluated, the environmental variation
(G � E) within target environments, and the expected experimental precision of
the evaluation trials (LSD’s). In Iowa, the h2s for grain yield can vary from 0.45 for
half-sib family selection to 0.90 for S2 progeny selection when tested at four
locations with two replications per location with similar error mean squares. In
North Dakota, the h2s for grain yield can range from 0.39 to 0.87 for the same
methods when tested at three locations with two replications per location with
similar error mean squares. In addition, reciprocal full-sib recurrent selection
showed h2s for grain yield at 0.78 when tested at six locations with two replicationsper location in North Dakota. Depending on differences among locations and the
frequency of severe storms (locations lost), choices can be made for the distribu-
24 A.R. Hallauer, M.J. Carena
tions of replications (more or fewer) among locations; one replication at eight
locations (more expensive) or eight replications at one location (less expensive
but greater risk). The combination of replications and locations one uses is based on
previous experiences. Except for mass selection, the number of progenies intermated
to generate genetic variability for future cycles of selection has usually ranged from10
to 20 selected progenies. Initially, n = 10 was the more common number intermated
primarily because the diallel mating design (45 crosses) was used for intermating. If
a greater number of progenies is included for intermating by the diallel mating
design, the number of crosses increases rapidly (if n = 20, 190 crosses). Harrison
(1967) introduced the incomplete diallel mating scheme which rapidly reduces the
space requirements for intermating when n is large. If n = 20, 380 nursery rows are
needed for diallel mating design, but only 40 nursery rows are needed with the
Harrison mating design (Hallauer, 1985). Rawlings (1970), based on certain con-
ditions, suggested that the number of parents intermating should be 16 to permit
both short- and long-term response to recurrent selection. The number of progenies
sampled, evaluated, and intermating ultimately has to be determined by the re-
searcher based on goals of recurrent selection, trait(s) considered in selection
resources available, and past experiences of the breeding program. Johnson
(1982) developed some guidelines for conducting recurrent selection for GCA
based on a two-locus theory. His theoretical studies suggested that the linkage
disequilibrium in the initial population used to initiate recurrent selection has a
permanent effect upon future selection response; that one or more generations of
intermating before each cycle would reduce the effects of linkage disequilibrium in
future cycles of selection; and that additional intermating the population(s) before
recurrent selection is initiated would be more efficient in reducing the effects of
linkage disequilibrium than intermating between cycles of selection. Hanson (1959)
determined that 3 to 5 generations of intermating would be adequate to break up
initial linkage blocks. Hence, if linkage disequilibrium is a concern in the popula-
tion(s) considered for a long-term recurrent selection program, it would be prudent
to include at least two to three generations of intermating before selection is
initiated. One would not want to restrict future progress if linkages are a concern.
Concerns for linkage disequilibrium would be greater in populations formed by
intermating a restricted set of inbred lines, such as developing synthetic cultivars
for base populations. It seems more positive long-term response would be realized
by conducting more cycles of selection than more intermating between cycles of
selection (i.e., keep years small as possible). An extensive review of the responses
attained in long-term selection studies and how genetic effects and population sizes
affect responses to selection were given by Janick (2004).
Maize breeders have several options available as to the recurrent selection
method they consider appropriate for their situations. Because sufficient quantities
of seed for evaluation can be produced for evaluation trials by either self- or cross-
pollination, maize breeders have more options than for most other crop species.
Most options include the original suggestions of Jenkins (1940), Hull (1945),
Comstock et al. (1949), and Gardner (1961) and modifications thereof. Jenkins
(1940) judged that additive genetic effects were more important in grain yield of
Maize Breeding 25
maize populations and that selection for additive effects should be emphasized.
Jenkins (1940) main interest was to increase the frequency of favorable alleles in
cultivars that may be more suitable for use in stress environments rather than
double-cross hybrids. The selection method proposed by Jenkins (1940) was desig-
nated as selection for GCA (Sprague and Tatum, 1942). Hull (1945), however, was
of the opinion that nonadditive effects (dominance and/or epistasis) were of greater
importance for the expression of heterosis and that selection should be emphasized
for specific combining ability (SCA) (Sprague and Tatum, 1942). Hull (1945)
suggested that experiments should be conducted within the same populations that
included inbred (S1 or S2) progeny selection and half-sib family selection with use
of either an inbred line or single-cross as the tester. He believed that the responses
from the parallel selection studies would provide definitive evidence of the relative
importance of additive versus nonadditive genetic effects in maize. Tanner and
Smith (1987) and Horner et al. (1989) reported data for the study suggested by Hull
(1945). In both studies, inbred progeny selection was initially superior to half-sib
family selection, but in later cycles the responses to half-sib family selection was
greater than for inbred progeny selection. Horner et al. (1989) attributed the greater
response via half-sib family selection was because of the overdominant genetic
effects expressed in the half-sib family selection program, but Tanner and Smith
(1987) interpreted their results were mainly due to additive genetic effects. Com-
stock et al. (1949) proposed RRS because they showed theoretically that RRS would
be equally effective to selection programs that emphasized selection for either GCA
(additive genetic effects) or SCA (nonadditive genetic effects). If both additive and
nonadditive effects were important in trait expression, then RRS would be more
effective than the methods suggested by Jenkins (1940) and Hull (1945). Gardner
(1961) suggested modifications to increase the effectiveness of mass selection. He
imposed a grid system within isolated fields to reduce the effects of the microenvir-
onments within the isolation field. Most of the modifications suggested were varia-
tions of the basic methods proposed by Jenkins (1940), Hull (1945), and Comstock
et al. (1949) to improve effectiveness of selection, adapt to conditions for specific
areas, and to make changes based on information from previous studies.
The choice of recurrent selection method to use is an important decision.
Incremental genetic improvements of quantitative traits usually require long-term
commitments to realize significant genetic improvements. Each stage of recurrent
selection requires making good decisions for the populations included for selection
including sample sizes and the extent of data required to differentiate the breeding
values of the tested progenies. Changes and adoption of newer technology that
enhances efficiency and effectiveness of selection can be made during the course of
recurrent selection programs. But the critical component is the choice of population
(s) that one believes can contribute useful germplasm to breeding programs for
developing inbred lines and hybrids.
Recurrent selection programs should not be considered separate aspects of applied
breeding programs. The usefulness of recurrent selection methods can only be fully
realized if they are integrated with the applied breeding programs to develop superior
cultivars (Hallauer, 1985). There are no time limits of recurrent selection programs
26 A.R. Hallauer, M.J. Carena
unless it seems the genetic variability has been exhausted or the goals of selection
(selection limits) have been attained. Effectiveness of recurrent selection is similar
to other breeding methods. They are effective screens to determine genetic differ-
ences (breeding values) among progenies. For most pests of maize, effective
screens have been developed to ensure uniform presence of pests to reduce the
incidence of escapes. Laboratory techniques are available to rapidly discriminate
among progenies for kernel and plant chemical compositions. For grain yield,
evaluation trials may be adjusted with different allocations of replications and
locations, use of more efficient experimental field designs to reduce experimental
errors, and use of statistical analyses that exploit the information available in the
field data; that is to improve techniques to permit us to identify the superior
progenies.
The choice of recurrent selection methods depends on the traits considered in
selection, genetic variability of the trait, preferred breeding method, and facilities
available. The choices vary from the relatively simple method of mass selection to
the relatively more complex RRS methods with modifications made for particular
situations or to increase effectiveness of selection (Table 2). The parameters listed
in Table 2 for each selection method affect genetic response to selection. If accurate
estimates of genetic variability are available for the population(s) considered in
selection, genetic responses (DG) to selection can be determined for which method
will have the greatest response to selection as a prediction. Eberhart (1970) devel-
oped a general formula that can be used to compare the relative genetic responses
expected for each selection method. Eberhart (1970) suggested that
DG ¼ ðck s2g0 Þ=ðy sPÞ be used to include the parameters that affect selection: c is
the parental control, where c = 1 if the same materials evaluated are also used to
intermate the selected progenies; k is a function of the intensity of selection (Table
6.1, Hallauer and Miranda, 1988); s2g0 is the genetic variability among progenies
or families; y is the number of years required to complete each cycle of selection;
and sP is the square root of the phenotypic variance. The expectations of c, y, and
ðs2g0 Þ are listed in Table 2 for each of the listed methods for both intrapopulation and
interpopulation selection methods. An example of the relative DG for intrapopula-
tion selection is listed in Table 3, based on the estimates of the genetic variability
for BSSS maize population (Silva and Hallauer, 1975). Genetic gain estimates are
ultimately expressed on a per year basis, where per year gain expresses the gain
comparable to the selection methods that require 1 year for completion. There are
greater DG for selection methods that require more years because parental control
and relative heritability are greater than for the more simple methods where one
cycle can often be completed annually. The estimates of DG included in Table 3 are
conservative. Unlike most other maize populations, the estimates of s2A (169) and s2D(193) are similar and smaller than for other maize populations (Table 5.2, Hallauer
and Miranda, 1988). Summaries of estimates of s2A and s2D by Hallauer and Miranda
(1988) showed that estimates of s2Awere 2 to 4 times greater than the estimates of
s2Dof other maize populations (Table 5.1, Hallauer and Miranda, 1988). Options
for recurrent selection does include whether intrapopulation or interpopulation
Maize Breeding 27
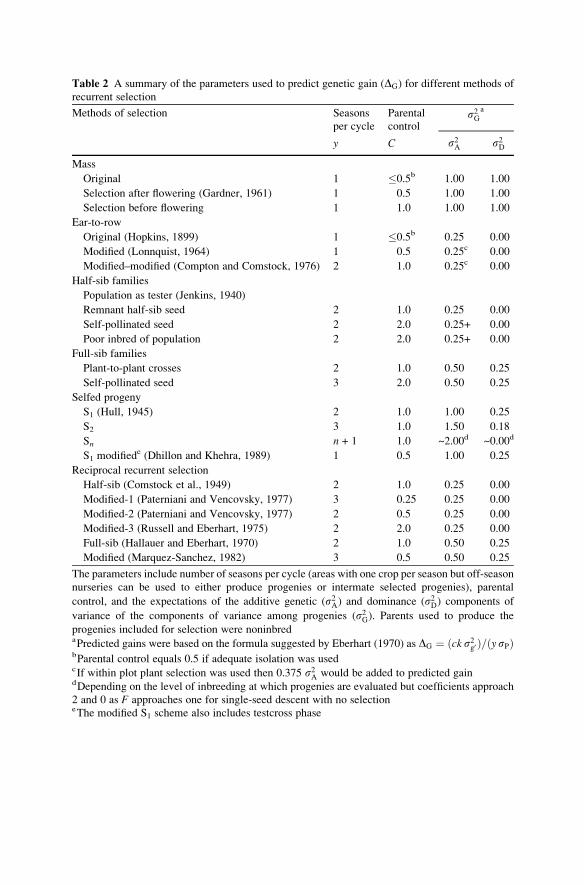
Table 2 A summary of the parameters used to predict genetic gain (DG) for different methods of
recurrent selection
Methods of selection Seasons
per cycle
Parental
controls2G
a
s2A s2Dy C
Mass
Original 1 �0.5b 1.00 1.00
Selection after flowering (Gardner, 1961) 1 0.5 1.00 1.00
Selection before flowering 1 1.0 1.00 1.00
Ear-to-row
Original (Hopkins, 1899) 1 �0.5b 0.25 0.00
Modified (Lonnquist, 1964) 1 0.5 0.25c 0.00
Modified–modified (Compton and Comstock, 1976) 2 1.0 0.25c 0.00
Half-sib families
Population as tester (Jenkins, 1940)
Remnant half-sib seed 2 1.0 0.25 0.00
Self-pollinated seed 2 2.0 0.25+ 0.00
Poor inbred of population 2 2.0 0.25+ 0.00
Full-sib families
Plant-to-plant crosses 2 1.0 0.50 0.25
Self-pollinated seed 3 2.0 0.50 0.25
Selfed progeny
S1 (Hull, 1945) 2 1.0 1.00 0.25
S2 3 1.0 1.50 0.18
Sn n + 1 1.0 ~2.00d ~0.00d
S1 modifiede (Dhillon and Khehra, 1989) 1 0.5 1.00 0.25
Reciprocal recurrent selection
Half-sib (Comstock et al., 1949) 2 1.0 0.25 0.00
Modified-1 (Paterniani and Vencovsky, 1977) 3 0.25 0.25 0.00
Modified-2 (Paterniani and Vencovsky, 1977) 2 0.5 0.25 0.00
Modified-3 (Russell and Eberhart, 1975) 2 2.0 0.25 0.00
Full-sib (Hallauer and Eberhart, 1970) 2 1.0 0.50 0.25
Modified (Marquez-Sanchez, 1982) 3 0.5 0.50 0.25
The parameters include number of seasons per cycle (areas with one crop per season but off-season
nurseries can be used to either produce progenies or intermate selected progenies), parental
control, and the expectations of the additive genetic (s2A) and dominance (s2D) components of
variance of the components of variance among progenies (s2G). Parents used to produce the
progenies included for selection were noninbredaPredicted gains were based on the formula suggested by Eberhart (1970) as DG ¼ ðck s2g0 Þ=ðysPÞbParental control equals 0.5 if adequate isolation was usedcIf within plot plant selection was used then 0.375 s2A would be added to predicted gaindDepending on the level of inbreeding at which progenies are evaluated but coefficients approach
2 and 0 as F approaches one for single-seed descent with no selectioneThe modified S1 scheme also includes testcross phase
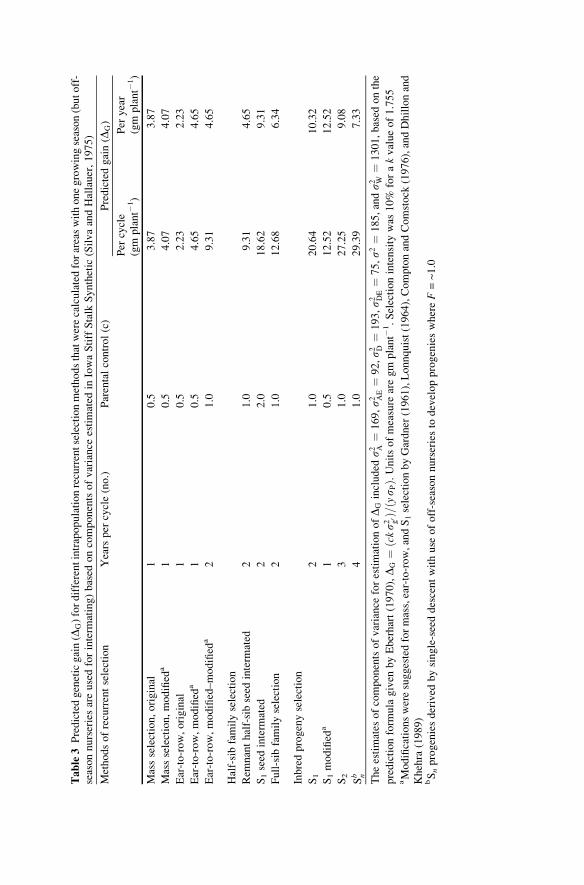
Table3
Predictedgeneticgain(D
G)fordifferentintrapopulationrecurrentselectionmethodsthatwerecalculatedforareaswithonegrowingseason(butoff-
seasonnurseriesareusedforinterm
ating)based
oncomponentsofvariance
estimated
inIowaStiffStalk
Synthetic
(SilvaandHallauer,1975)
Methodsofrecurrentselection
Years
per
cycle(no.)
Parentalcontrol(c)
Predictedgain(D
G)
Per
cycle
(gm
plant�
1)
Per
year
(gm
plant�
1)
Massselection,original
10.5
3.87
3.87
Massselection,modified
a1
0.5
4.07
4.07
Ear-to-row,original
10.5
2.23
2.23
Ear-to-row,modified
a1
0.5
4.65
4.65
Ear-to-row,modified–modified
a2
1.0
9.31
4.65
Half-sibfamilyselection
Rem
nanthalf-sibseed
interm
ated
21.0
9.31
4.65
S1seed
interm
ated
22.0
18.62
9.31
Full-sib
familyselection
21.0
12.68
6.34
Inbredprogenyselection
S1
21.0
20.64
10.32
S1modified
a1
0.5
12.52
12.52
S2
31.0
27.25
9.08
Sb n
41.0
29.39
7.33
Theestimates
ofcomponentsofvariance
forestimationofDGincluded
s2 A¼
169,s2 A
E¼
92,s2 D
¼193,s2 D
E¼
75,s2
¼185,ands2 W
¼1301,based
onthe
predictionform
ula
given
byEberhart(1970),DG¼
ðcks2 g
0Þ=ðy
s PÞ.Unitsofmeasure
aregm
plant�
1.Selectionintensity
was
10%
forakvalueof1.755
aModificationsweresuggestedformass,ear-to-row,andS1selectionbyGardner
(1961),Lonnquist(1964),ComptonandComstock
(1976),andDhillonand
Khehra
(1989)
bSnprogeniesderived
bysingle-seeddescentwithuse
ofoff-seasonnurseriesto
developprogenieswhereF=~1.0
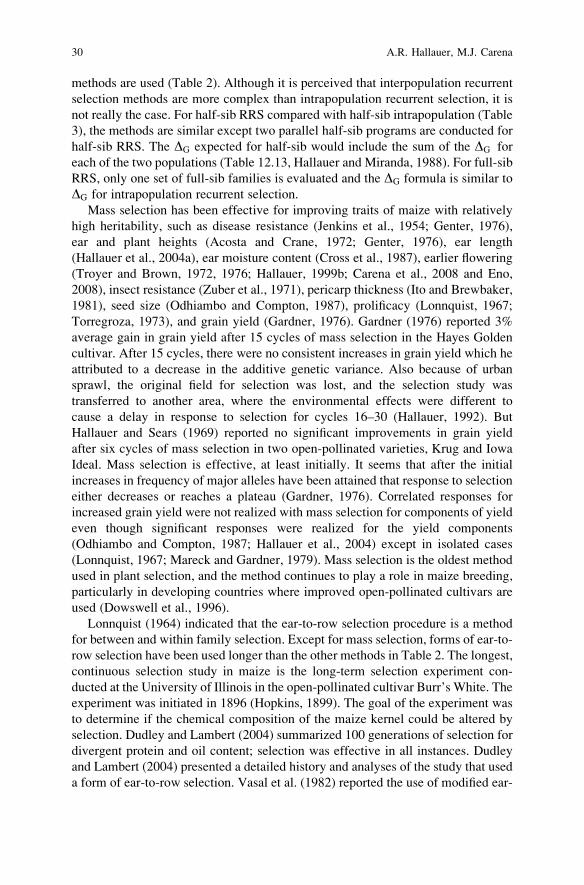
methods are used (Table 2). Although it is perceived that interpopulation recurrent
selection methods are more complex than intrapopulation recurrent selection, it is
not really the case. For half-sib RRS compared with half-sib intrapopulation (Table
3), the methods are similar except two parallel half-sib programs are conducted for
half-sib RRS. The DG expected for half-sib would include the sum of the DG for
each of the two populations (Table 12.13, Hallauer and Miranda, 1988). For full-sib
RRS, only one set of full-sib families is evaluated and the DG formula is similar to
DG for intrapopulation recurrent selection.
Mass selection has been effective for improving traits of maize with relatively
high heritability, such as disease resistance (Jenkins et al., 1954; Genter, 1976),
ear and plant heights (Acosta and Crane, 1972; Genter, 1976), ear length
(Hallauer et al., 2004a), ear moisture content (Cross et al., 1987), earlier flowering
(Troyer and Brown, 1972, 1976; Hallauer, 1999b; Carena et al., 2008 and Eno,
2008), insect resistance (Zuber et al., 1971), pericarp thickness (Ito and Brewbaker,
1981), seed size (Odhiambo and Compton, 1987), prolificacy (Lonnquist, 1967;
Torregroza, 1973), and grain yield (Gardner, 1976). Gardner (1976) reported 3%
average gain in grain yield after 15 cycles of mass selection in the Hayes Golden
cultivar. After 15 cycles, there were no consistent increases in grain yield which he
attributed to a decrease in the additive genetic variance. Also because of urban
sprawl, the original field for selection was lost, and the selection study was
transferred to another area, where the environmental effects were different to
cause a delay in response to selection for cycles 16–30 (Hallauer, 1992). But
Hallauer and Sears (1969) reported no significant improvements in grain yield
after six cycles of mass selection in two open-pollinated varieties, Krug and Iowa
Ideal. Mass selection is effective, at least initially. It seems that after the initial
increases in frequency of major alleles have been attained that response to selection
either decreases or reaches a plateau (Gardner, 1976). Correlated responses for
increased grain yield were not realized with mass selection for components of yield
even though significant responses were realized for the yield components
(Odhiambo and Compton, 1987; Hallauer et al., 2004) except in isolated cases
(Lonnquist, 1967; Mareck and Gardner, 1979). Mass selection is the oldest method
used in plant selection, and the method continues to play a role in maize breeding,
particularly in developing countries where improved open-pollinated cultivars are
used (Dowswell et al., 1996).
Lonnquist (1964) indicated that the ear-to-row selection procedure is a method
for between and within family selection. Except for mass selection, forms of ear-to-
row selection have been used longer than the other methods in Table 2. The longest,
continuous selection study in maize is the long-term selection experiment con-
ducted at the University of Illinois in the open-pollinated cultivar Burr’s White. The
experiment was initiated in 1896 (Hopkins, 1899). The goal of the experiment was
to determine if the chemical composition of the maize kernel could be altered by
selection. Dudley and Lambert (2004) summarized 100 generations of selection for
divergent protein and oil content; selection was effective in all instances. Dudley
and Lambert (2004) presented a detailed history and analyses of the study that used
a form of ear-to-row selection. Vasal et al. (1982) reported the use of modified ear-
30 A.R. Hallauer, M.J. Carena
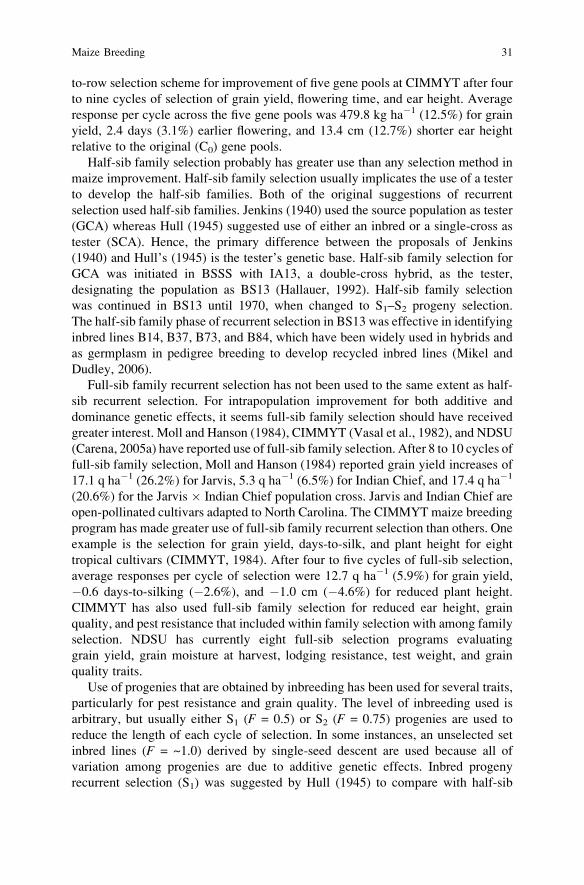
to-row selection scheme for improvement of five gene pools at CIMMYT after four
to nine cycles of selection of grain yield, flowering time, and ear height. Average
response per cycle across the five gene pools was 479.8 kg ha�1 (12.5%) for grain
yield, 2.4 days (3.1%) earlier flowering, and 13.4 cm (12.7%) shorter ear height
relative to the original (C0) gene pools.
Half-sib family selection probably has greater use than any selection method in
maize improvement. Half-sib family selection usually implicates the use of a tester
to develop the half-sib families. Both of the original suggestions of recurrent
selection used half-sib families. Jenkins (1940) used the source population as tester
(GCA) whereas Hull (1945) suggested use of either an inbred or a single-cross as
tester (SCA). Hence, the primary difference between the proposals of Jenkins
(1940) and Hull’s (1945) is the tester’s genetic base. Half-sib family selection for
GCA was initiated in BSSS with IA13, a double-cross hybrid, as the tester,
designating the population as BS13 (Hallauer, 1992). Half-sib family selection
was continued in BS13 until 1970, when changed to S1–S2 progeny selection.
The half-sib family phase of recurrent selection in BS13 was effective in identifying
inbred lines B14, B37, B73, and B84, which have been widely used in hybrids and
as germplasm in pedigree breeding to develop recycled inbred lines (Mikel and
Dudley, 2006).
Full-sib family recurrent selection has not been used to the same extent as half-
sib recurrent selection. For intrapopulation improvement for both additive and
dominance genetic effects, it seems full-sib family selection should have received
greater interest. Moll and Hanson (1984), CIMMYT (Vasal et al., 1982), and NDSU
(Carena, 2005a) have reported use of full-sib family selection. After 8 to 10 cycles of
full-sib family selection, Moll and Hanson (1984) reported grain yield increases of
17.1 q ha�1 (26.2%) for Jarvis, 5.3 q ha�1 (6.5%) for Indian Chief, and 17.4 q ha�1
(20.6%) for the Jarvis � Indian Chief population cross. Jarvis and Indian Chief are
open-pollinated cultivars adapted to North Carolina. The CIMMYTmaize breeding
program has made greater use of full-sib family recurrent selection than others. One
example is the selection for grain yield, days-to-silk, and plant height for eight
tropical cultivars (CIMMYT, 1984). After four to five cycles of full-sib selection,
average responses per cycle of selection were 12.7 q ha�1 (5.9%) for grain yield,
�0.6 days-to-silking (�2.6%), and �1.0 cm (�4.6%) for reduced plant height.
CIMMYT has also used full-sib family selection for reduced ear height, grain
quality, and pest resistance that included within family selection with among family
selection. NDSU has currently eight full-sib selection programs evaluating
grain yield, grain moisture at harvest, lodging resistance, test weight, and grain
quality traits.
Use of progenies that are obtained by inbreeding has been used for several traits,
particularly for pest resistance and grain quality. The level of inbreeding used is
arbitrary, but usually either S1 (F = 0.5) or S2 (F = 0.75) progenies are used to
reduce the length of each cycle of selection. In some instances, an unselected set
inbred lines (F = ~1.0) derived by single-seed descent are used because all of
variation among progenies are due to additive genetic effects. Inbred progeny
recurrent selection (S1) was suggested by Hull (1945) to compare with half-sib
Maize Breeding 31
recurrent selection. Multiple inbred generations (say S1 and S2) have been used to
reduce the higher costs associated with grain yield trials. S1 progenies are devel-
oped by self-pollination of hundreds of plants within the population. The S1progenies may be screened in single replicate plots for diseases and insects common
to the area. Progenies are discarded based on pest ratings and a less number of
progenies retained for testing for grain yield and agronomic traits in replicated yield
trials. One can usually expect significant response to inbred progeny recurrent
selection for traits considered in selection. The additive genetic variance among
inbred progenies are usually two to four times greater than among noninbred
progenies (Table 2), which increases the h2 of the traits if effective screens are
used to measure genetic differences among progenies. Concern has been expressed
that the experimental errors would be greater (e.g., grain yield) with inbred progeny
field trials compared with noninbred trials but larger experimental errors are not
necessarily linked with inbred progeny trials. Some have compared the coefficients
of variation (CV ¼ s=X � 100), which are generally larger for inbred progeny trials
because the mean (X) of inbred progenies are 40–70% (depending on level of
inbreeding) less than grain yield of noninbred progenies.
Inbred progeny selection for grain yield, however, has not been sustained for the
long term (Tanner and Smith, 1987; Hallauer and Miranda, 1988; Horner et al.,
1989). It seems there is a rapid fixation of the major alleles contributing to grain
yield after two to four cycles of inbred progeny selection. Significant improvements
for grain yield are realized from inbred progeny selection for the first two to four
cycles of selection and level off in later cycles. Inbred progeny selection also was
not effective in BS13(HI)C7 after seven cycles of half-sib family recurrent selec-
tion. It seems maize populations are more responsive in the long term if crosses
(half-sib or full-sib families) are made and evaluated. Maize is nearly 100% cross
pollinated and does not seem amenable to inbred-progeny selection for the long
term. Comparison of S1 progeny and half-sib family selection have been conducted
to verify the suggestion of Hull (1945) of the types of genetic effects of greater
importance that affect response for grain yield. Tanner and Smith (1987) evaluated
the response to S1–S2 progeny and half-sib family selection after eight cycles of
recurrent selection in a substrain (BSKC0) of the Krug open-pollinated cultivar.
Response to inbred progeny selection was greater at the C4 compared with the C4 of
half-sib family selection. At the C8, they found greater response to selection via
half-sib family selection; greatest grain yield was attained by the C4 via inbred
progeny selection with no further gains with four additional cycles of selection.
Crosses were made between populations developed from the two methods of
recurrent selection with 7.1% midparent heterosis for the C4 � C4 cross and
14.1% for the C8 � C8 cross, suggesting different alleles were selected by the
two methods. Inbreeding depression (ID) estimates showed 7.9% less ID in the C8
population from inbred-progeny selection versus the C8 population from half-sib
family selection. Horner et al. (1989) reported similar results comparing inbred-
progeny and half-sib family recurrent selection in the Fla.767 maize population.
They interpreted the different responses to selection to overdominant effects which
were expressed in the half-sib families when crossed with the inbred tester, F6,
32 A.R. Hallauer, M.J. Carena
which verified Hull’s (1945) original suggestion that such comparisons of the two
recurrent selection methods would provide evidence of the relative importance of
the types of genetic effects important in maize crosses.
The combination of S1 or S2 selection on a progeny basis and evaluation of S1 or
S2 testcross is a common feature of applied maize breeding programs. Inbred
progenies that have superior GCA and SCA are retained in the breeding nursery
for further inbreeding and selection and additional evaluation in crosses. Elite
inbred lines can be used in pedigree breeding to develop recycled lines. This
protocol is continued to enhance the combination of alleles important in hybrids.
Hence, testing identifies superior inbred lines that can be recurrently selected to
develop better inbred lines (see Fig. 3, Troyer, 1999). Although selecting among
inbred progenies, based on testcrossing, has been extremely effective in developing
genetically improved hybrids, formal recurrent selection experiments to compare
relative effectiveness of inbred-progeny versus half-sib selection are limited to
those reported by Tanner and Smith (1987) and Horner et al. (1989).
Interpopulation recurrent selection (RRS) studies have not been used as fre-
quently as intrapopulation selection. Interpopulation recurrent selection is consid-
ered for those crop species that develop hybrids for the producers. Grain yield is the
trait that has been subjected to most interpopulation selection studies. Comstock
et al. (1949) showed that RRS is equally effective selecting for additive (GCA) and
nonadditive (SCA) genetic effects. Interpopulation selection includes two initial
populations, and direct response to selection is measured in the population cross.
Responses in the two parent populations themselves would be indirect responses to
selection, which is contrary to intrapopulation selection where direct response
would be either in the population itself or testcrosses. Falconer (1960) showed
that the expression of heterosis (H) can be formulated as H = Sy2d, where y is
difference(s) in allele frequencies, d is the level of dominance, and summed over
loci. If d = 0, there is no expression of heterosis, and y will determine the magnitude
of heterosis when d is greater than zero. With RRS we desire to increase y (i.e.,
increase the difference in allele frequencies), which would increase the rate of
direct response in the cross.
A summary of RRS studies reported in the literature is given in Table 4. Average
direct response for the 20 published programs was 4.8% cycle�1, ranging from a
low of 0.8% (Moll and Robinson, 1966) to 7.5% (Eyherabide and Hallauer, 1991).
For specific RRS programs conducted for greater number of cycles, the average
direct responses were generally greater and more consistent, which it would be
expected to smooth out the variations of responses among cycles. If RRS is
effective in selection of complementary alleles that affect heterosis (i.e., increase y,the difference in allele frequencies), the expression of heterosis would be expected
to increase from crosses (C0� C0) of the original populations (C0) to crosses (Cn�Cn) of the advanced selected populations (Cn). Extensive data are not available, but
information from five RRS programs suggests RRS is effective in selection of
complementary sets of alleles (or combinations of alleles) that enhance heterosis
(Table 5). Average midparent heterosis increased from 7.3% for the C0 � C0
crosses to 37.4% for the Cn � Cn crosses, a 5.1-fold increase. Average direct
Maize Breeding 33
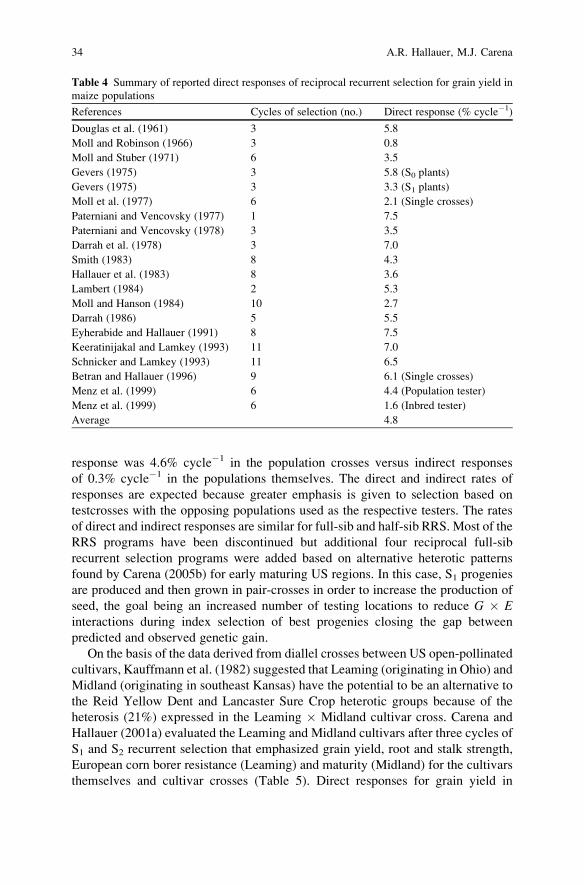
response was 4.6% cycle�1 in the population crosses versus indirect responses
of 0.3% cycle�1 in the populations themselves. The direct and indirect rates of
responses are expected because greater emphasis is given to selection based on
testcrosses with the opposing populations used as the respective testers. The rates
of direct and indirect responses are similar for full-sib and half-sib RRS. Most of the
RRS programs have been discontinued but additional four reciprocal full-sib
recurrent selection programs were added based on alternative heterotic patterns
found by Carena (2005b) for early maturing US regions. In this case, S1 progenies
are produced and then grown in pair-crosses in order to increase the production of
seed, the goal being an increased number of testing locations to reduce G � Einteractions during index selection of best progenies closing the gap between
predicted and observed genetic gain.
On the basis of the data derived from diallel crosses between US open-pollinated
cultivars, Kauffmann et al. (1982) suggested that Leaming (originating in Ohio) and
Midland (originating in southeast Kansas) have the potential to be an alternative to
the Reid Yellow Dent and Lancaster Sure Crop heterotic groups because of the
heterosis (21%) expressed in the Leaming � Midland cultivar cross. Carena and
Hallauer (2001a) evaluated the Leaming and Midland cultivars after three cycles of
S1 and S2 recurrent selection that emphasized grain yield, root and stalk strength,
European corn borer resistance (Leaming) and maturity (Midland) for the cultivars
themselves and cultivar crosses (Table 5). Direct responses for grain yield in
Table 4 Summary of reported direct responses of reciprocal recurrent selection for grain yield in
maize populations
References Cycles of selection (no.) Direct response (% cycle�1)
Douglas et al. (1961) 3 5.8
Moll and Robinson (1966) 3 0.8
Moll and Stuber (1971) 6 3.5
Gevers (1975) 3 5.8 (S0 plants)
Gevers (1975) 3 3.3 (S1 plants)
Moll et al. (1977) 6 2.1 (Single crosses)
Paterniani and Vencovsky (1977) 1 7.5
Paterniani and Vencovsky (1978) 3 3.5
Darrah et al. (1978) 3 7.0
Smith (1983) 8 4.3
Hallauer et al. (1983) 8 3.6
Lambert (1984) 2 5.3
Moll and Hanson (1984) 10 2.7
Darrah (1986) 5 5.5
Eyherabide and Hallauer (1991) 8 7.5
Keeratinijakal and Lamkey (1993) 11 7.0
Schnicker and Lamkey (1993) 11 6.5
Betran and Hallauer (1996) 9 6.1 (Single crosses)
Menz et al. (1999) 6 4.4 (Population tester)
Menz et al. (1999) 6 1.6 (Inbred tester)
Average 4.8
34 A.R. Hallauer, M.J. Carena
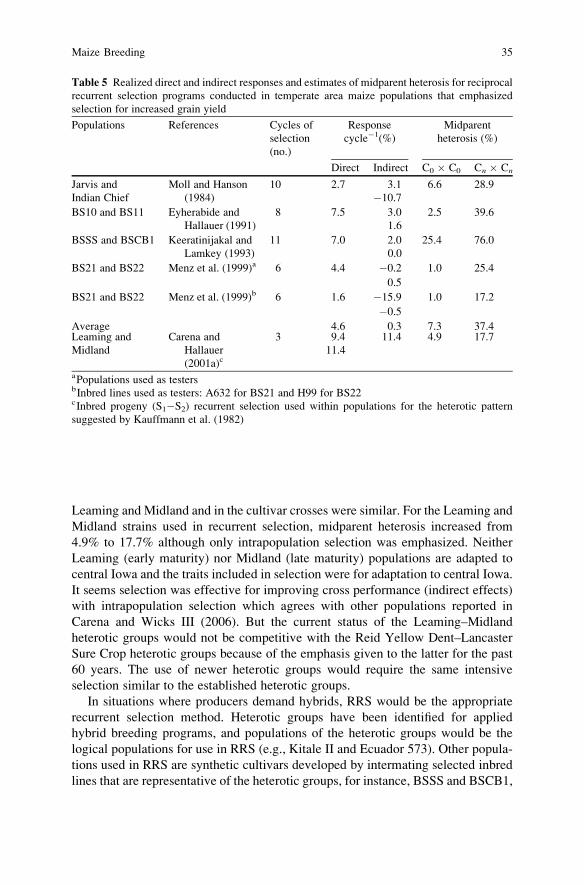
Leaming and Midland and in the cultivar crosses were similar. For the Leaming and
Midland strains used in recurrent selection, midparent heterosis increased from
4.9% to 17.7% although only intrapopulation selection was emphasized. Neither
Leaming (early maturity) nor Midland (late maturity) populations are adapted to
central Iowa and the traits included in selection were for adaptation to central Iowa.
It seems selection was effective for improving cross performance (indirect effects)
with intrapopulation selection which agrees with other populations reported in
Carena and Wicks III (2006). But the current status of the Leaming–Midland
heterotic groups would not be competitive with the Reid Yellow Dent–Lancaster
Sure Crop heterotic groups because of the emphasis given to the latter for the past
60 years. The use of newer heterotic groups would require the same intensive
selection similar to the established heterotic groups.
In situations where producers demand hybrids, RRS would be the appropriate
recurrent selection method. Heterotic groups have been identified for applied
hybrid breeding programs, and populations of the heterotic groups would be the
logical populations for use in RRS (e.g., Kitale II and Ecuador 573). Other popula-
tions used in RRS are synthetic cultivars developed by intermating selected inbred
lines that are representative of the heterotic groups, for instance, BSSS and BSCB1,
Table 5 Realized direct and indirect responses and estimates of midparent heterosis for reciprocal
recurrent selection programs conducted in temperate area maize populations that emphasized
selection for increased grain yield
Populations References Cycles of
selection
(no.)
Response
cycle�1(%)
Midparent
heterosis (%)
Direct Indirect C0 � C0 Cn � Cn
Jarvis and
Indian Chief
Moll and Hanson
(1984)
10 2.7 3.1
�10.7
6.6 28.9
BS10 and BS11 Eyherabide and
Hallauer (1991)
8 7.5 3.0
1.6
2.5 39.6
BSSS and BSCB1 Keeratinijakal and
Lamkey (1993)
11 7.0 2.0
0.0
25.4 76.0
BS21 and BS22 Menz et al. (1999)a 6 4.4 �0.2 1.0 25.4
0.5
BS21 and BS22 Menz et al. (1999)b 6 1.6 �15.9 1.0 17.2
�0.5
Average 4.6 0.3 7.3 37.4Leaming and
Midland
Carena and
Hallauer
(2001a)c
3 9.4
11.4
11.4 4.9 17.7
aPopulations used as testersbInbred lines used as testers: A632 for BS21 and H99 for BS22cInbred progeny (S1�S2) recurrent selection used within populations for the heterotic pattern
suggested by Kauffmann et al. (1982)
Maize Breeding 35
BS21 and BS22, Leaming and BS22, BS21 and CGSS, BS21 and CGL, and
NDSAB and BS21 (Keeratinijakal and Lamkey, 1993; Menz and Hallauer, 1997;
Carena, 2005a; Melani and Carena, 2005; Carena and Wicks III, 2006; Jumbo and
Carena, 2007). Inbred lines developed from RRS would represent the heterotic
groups in testing and producing single-cross hybrids. In areas where hybrids are not
an option, intrapopulation recurrent selection seems the better choice to improve
cultivars themselves. However, the population–hybrid concept might be an alterna-
tive (Carena, 2005a).
Responses to direct and indirect recurrent selection programs are determined
either by including the same checks in each of the cycles of evaluation trials as a
base of reference or by conducting replicated trials of the different cycle
populations and/or cycle population crosses and testcrosses where appropriate to
determine direct response to selection. Both methods have been used. Better
information can be obtained if all cycle populations and/or cycle population crosses
are included in replicated trials to permit direct comparisons with the same error
terms. For long-term selection studies, the inclusion of all cycles for evaluation
usually requires seed reproduction to ensure all entries have the same seed quality.
Because we are evaluating populations and/or their crosses, adequate plant and seed
samples are needed to adequately represent the genetic variation and means of the
populations. Sample sizes similar to those used to develop progenies (n = 100 to
200) seem appropriate. Hence, adequate size populations and/or population crosses
are reproduced (usually by hand pollinations in breeding nurseries) by pollinating
all plants, harvest all pollinated ears, and form balanced bulks (equal number seeds
from each ear) to be used in evaluations to determine responses to selection. After
preliminary analyses to estimate means of cycle populations and/or population
crosses from the replicated evaluation trials, estimates of response to selection
can be determined (Table 6). Often, the difference between the advance cycle
population (Cn) and the original population (C0) divided by number (n) of cycleshas been used as measure of selection responses per cycle. If it is desired to present
on a per year (y) basis, the difference can be divided by y, if more than 1 year
cycle�1 has been utilized or, (Cn�1 C0)/C0� 100 = total percentage gain, divide by
n = percentage gain per cycle, and finally divide percentage gain per cycle by years
= percentage gain per year. All forms have been used. Both the linear regression
coefficient and Smith’s (1983) model to estimate response to selection have been
used more frequently. For the three methods, the estimates of responses tend to be
greater with use of (Cn � C0)/n than with the linear regression and the Smith model
estimates. Estimates of responses of selection are similar for linear regression and
the Smith model, but the R2 values were greater with use of Smith model. The
interpretations of the data and the conclusions would not change regardless of
which method was used to estimate response to selection. It seems the (Cn � C0)/
n estimates would tend to be biased upward and the Smith model provides a better
fit to model because of consistently greater R2 values and its inclusion of inbreeding
and genetic drift effects.
More extensive reviews of the selection methods available and experimental
data are given by Hallauer et al. (1988), Hallauer and Miranda (1988), Hallauer
36 A.R. Hallauer, M.J. Carena
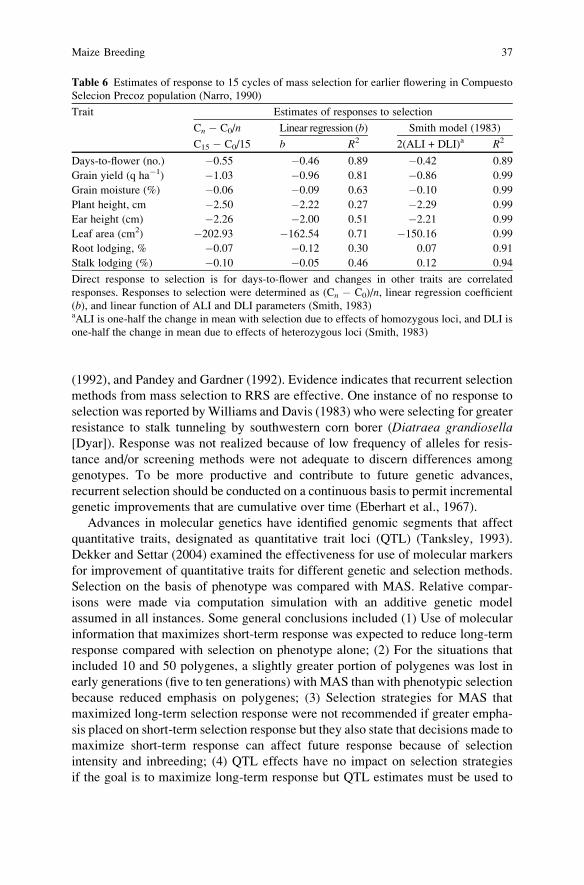
(1992), and Pandey and Gardner (1992). Evidence indicates that recurrent selection
methods from mass selection to RRS are effective. One instance of no response to
selection was reported byWilliams and Davis (1983) who were selecting for greater
resistance to stalk tunneling by southwestern corn borer (Diatraea grandiosella[Dyar]). Response was not realized because of low frequency of alleles for resis-
tance and/or screening methods were not adequate to discern differences among
genotypes. To be more productive and contribute to future genetic advances,
recurrent selection should be conducted on a continuous basis to permit incremental
genetic improvements that are cumulative over time (Eberhart et al., 1967).
Advances in molecular genetics have identified genomic segments that affect
quantitative traits, designated as quantitative trait loci (QTL) (Tanksley, 1993).
Dekker and Settar (2004) examined the effectiveness for use of molecular markers
for improvement of quantitative traits for different genetic and selection methods.
Selection on the basis of phenotype was compared with MAS. Relative compar-
isons were made via computation simulation with an additive genetic model
assumed in all instances. Some general conclusions included (1) Use of molecular
information that maximizes short-term response was expected to reduce long-term
response compared with selection on phenotype alone; (2) For the situations that
included 10 and 50 polygenes, a slightly greater portion of polygenes was lost in
early generations (five to ten generations) with MAS than with phenotypic selection
because reduced emphasis on polygenes; (3) Selection strategies for MAS that
maximized long-term selection response were not recommended if greater empha-
sis placed on short-term selection response but they also state that decisions made to
maximize short-term response can affect future response because of selection
intensity and inbreeding; (4) QTL effects have no impact on selection strategies
if the goal is to maximize long-term response but QTL estimates must be used to
Table 6 Estimates of response to 15 cycles of mass selection for earlier flowering in Compuesto
Selecion Precoz population (Narro, 1990)
Trait Estimates of responses to selection
Cn � C0/n Linear regression (b) Smith model (1983)
C15 � C0/15 b R2 2(ALI + DLI)a R2
Days-to-flower (no.) �0.55 �0.46 0.89 �0.42 0.89
Grain yield (q ha�1) �1.03 �0.96 0.81 �0.86 0.99
Grain moisture (%) �0.06 �0.09 0.63 �0.10 0.99
Plant height, cm �2.50 �2.22 0.27 �2.29 0.99
Ear height (cm) �2.26 �2.00 0.51 �2.21 0.99
Leaf area (cm2) �202.93 �162.54 0.71 �150.16 0.99
Root lodging, % �0.07 �0.12 0.30 0.07 0.91
Stalk lodging (%) �0.10 �0.05 0.46 0.12 0.94
Direct response to selection is for days-to-flower and changes in other traits are correlated
responses. Responses to selection were determined as (Cn � C0)/n, linear regression coefficient
(b), and linear function of ALI and DLI parameters (Smith, 1983)aALI is one-half the change in mean with selection due to effects of homozygous loci, and DLI is
one-half the change in mean due to effects of heterozygous loci (Smith, 1983)
Maize Breeding 37
maximize short-term selection response; (5) Dominance effects were not expected
to affect selection strategies for optimal MAS that maximize long-term response.
For most comparisons made by Dekker and Settar (2004), the selection responses
for long-term recurrent selection programs were similar for MAS and phenotypic
selection. In genetically broad-based maize populations, different schemes of
recurrent selection can be used to improve grain yield. Additive genetic effects
usually are of greatest importance but nonadditive effects (dominance, overdomi-
nance, and epistasis) become important in long-term recurrent selection to enhance
the heterotic groups for inbred line and hybrid development. Even within commer-
cial breeding programs, long-term goals are used with continued selection within
specific groups of inbred lines (Troyer, 1999; Duvick, 2004). Recycling, or recur-
rent selection, is long-term if continued incremental genetic gains are desired for
the future, which was more than 60 years for the example presented by Troyer (see
Fig. 3, Troyer, 1999). It seems an optimal balance has to be used with MAS (for
greater short-term response) and what is expected 100 years in future, long-term
response. Maize breeders emphasize breeding and selection strategies to improve
current materials, which have been developed by previous long-term selection to
enhance genetic complexes that have been identified in elite hybrids. Use of half-sib
and full-sib family RRS methods would require molecular markers for two popula-
tions and every selection cycle, and how they would combine with the opposing
population. The maize genome sequence is scheduled to be unraveled in 2008.
Once we know the genes (not the markers) and, unlike the prediction of Bernardo
(2001), selection efficiency of phenotypes could be complemented with gene
information in order to enhance selection for quantitative traits in crops (Hammond
and Carena, 2008). Genotypic information is not the bottleneck anymore compared
to accurate phenotyping. Private–public interactions, especially between molecular
biologists and breeders, should be able to solve the current limitations to signifi-
cantly increase genetic gains in the future with wise use of technology (e.g.
association mapping, metaQTL, and classical quantitative genetics on large sam-
ples until genes are known) and most efficient conventional breeding techniques.
5 Inheritance of Quantitative Traits
Maize breeders emphasize selection for a matrix of traits that are not amenable to
Mendelian analyses. Effectiveness of selection for the different traits depends on
developing effective screens for the traits individually and collectively. Although
we assume the traits are quantitatively inherited, more consistent differences in
maturities (less complex trait) are more easily measured than determining the
relative consistent differences for grain yield (more complex trait). There are
some traits that are usually considered to be quantitative but for which a major
gene(s) has been found to significantly affect their expression. Jenkins et al. (1954)
used recurrent selection to increase the frequency of alleles for resistance to
northern corn leaf blight (Helminthosporium turcicum Pass.). Three major genes
38 A.R. Hallauer, M.J. Carena
that contributed to resistance to northern corn leaf blight were found that reduced
losses from the leaf disease (Smith and White, 1988). The long-term selection
experiment conducted at Illinois used the ear-to-row method to modify protein and
oil content of the maize kernel (Dudley and Lambert, 2004), but Mertz et al. (1964)
reported that the opaque mutant gene (o2) drastically changes grain protein compo-
sition and increased lysine content of the maize endosperm. Coors and Lauer (2001)
reported that the brown midrib (bm) mutant alleles, the leafy allele (Lfy), and
mutant waxy (wx) allele had been studied to increase silage quality. Although the
individual genes had a direct impact for silage quality traits, they individually did
not have long-term impact for the trait modifications. For the o2 gene, there were
nearly 30 years of dedicated research to integrate the correct combination of
modifier alleles to develop cultivars that had acceptable levels of kernel and plant
traits for use by the projected clientele (Vasal, 2001). The resistance conferred by
the genes for northern corn leaf blight were soon overcome by mutant forms of the
causal fungus and the resistant genes became an integral part of the package to
select for general horizontal resistance. Coors and Lauer (2001) indicated that the
genes projected to improve silage quality where not as successful as originally
projected because effects of the alleles on other plant and ear traits were undesir-
able, similar to the effects of the o2 allele. One major gene used effectively was the
fertility restoring gene (Rf1) that was used to restore fertility in Texas type cyto-
plasmic male sterility (cms-T), used in the production of hybrid seed. However, the
cms-T genetic system was used effectively to produce hybrid seed corn until 1970
when the cms-T system was found to be highly susceptible to a strain of southern
corn leaf blight [Bipolaris maydis (Nisik.) Shoem.]. Until 1970, nearly 90% of
hybrid seed was produced using the cms-T system but by 1972, nearly all the seed
production reverted to use of normal cytoplasm. Except for conversion of inbred
lines to strains of cms-T (female) and Rf1 (males) to use as parents in seed
production, the genetic system was not used in breeding programs in an effort to
improve quality and quantity of specific plant and ear traits (e.g., bm2 or o2).The impacts of single major genes have been minor (e.g. except for business
targeted GMO traits) compared with the overall usage of maize for food, feed, fuel
(ethanol), and fiber, but the individual mutant alleles have contributed to the
development of specialty crops that are used for specialized products (Hallauer,
2001, 2004). In each instance, however, the values of the mutant alleles were
enhanced by modifier alleles and extensive breeding efforts to develop cultivars
that had acceptable levels for agronomic traits to enable production of the specialty
corns (Hallauer, 2001). The major factor that affected their use was that the mutant
alleles tended to reduce yields 10–20%. All of the agronomic traits that were
needed to develop useful cultivars also were quantitatively inherited.
Extensive theoretical and empirical studies have been conducted in maize
(Hallauer and Miranda, 1988). Maize received greater attention earlier because
the inbred–hybrid concept of Shull (1910) had become a reality by 1940. Hybrid
maize was rapidly accepted by the US Corn Belt producers and was essentially
grown on 100% of the US Corn Belt hectarage by 1950. The inbred–hybrid concept
was developed empirically. The expression of heterosis in crosses of inbred lines
Maize Breeding 39
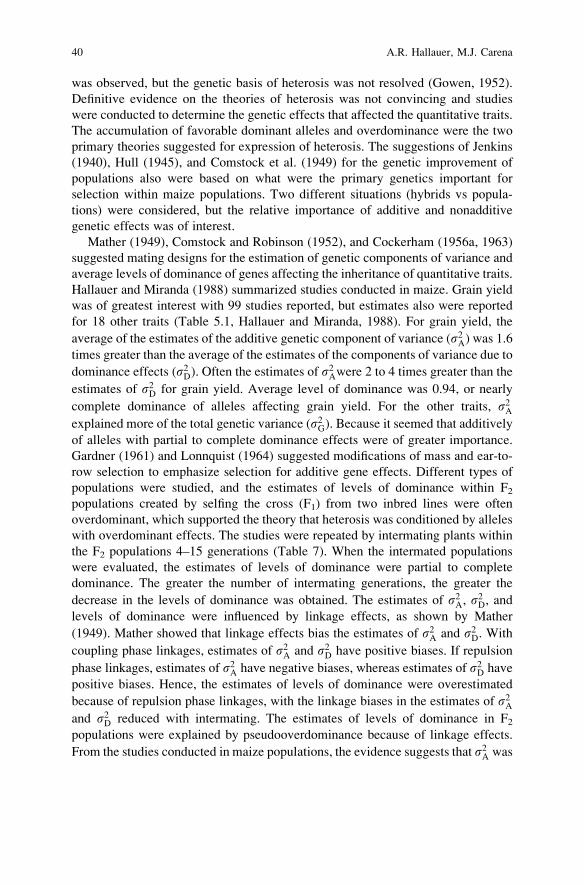
was observed, but the genetic basis of heterosis was not resolved (Gowen, 1952).
Definitive evidence on the theories of heterosis was not convincing and studies
were conducted to determine the genetic effects that affected the quantitative traits.
The accumulation of favorable dominant alleles and overdominance were the two
primary theories suggested for expression of heterosis. The suggestions of Jenkins
(1940), Hull (1945), and Comstock et al. (1949) for the genetic improvement of
populations also were based on what were the primary genetics important for
selection within maize populations. Two different situations (hybrids vs popula-
tions) were considered, but the relative importance of additive and nonadditive
genetic effects was of interest.
Mather (1949), Comstock and Robinson (1952), and Cockerham (1956a, 1963)
suggested mating designs for the estimation of genetic components of variance and
average levels of dominance of genes affecting the inheritance of quantitative traits.
Hallauer and Miranda (1988) summarized studies conducted in maize. Grain yield
was of greatest interest with 99 studies reported, but estimates also were reported
for 18 other traits (Table 5.1, Hallauer and Miranda, 1988). For grain yield, the
average of the estimates of the additive genetic component of variance (s2A) was 1.6times greater than the average of the estimates of the components of variance due to
dominance effects (s2D). Often the estimates of s2Awere 2 to 4 times greater than the
estimates of s2D for grain yield. Average level of dominance was 0.94, or nearly
complete dominance of alleles affecting grain yield. For the other traits, s2Aexplained more of the total genetic variance (s2G). Because it seemed that additively
of alleles with partial to complete dominance effects were of greater importance.
Gardner (1961) and Lonnquist (1964) suggested modifications of mass and ear-to-
row selection to emphasize selection for additive gene effects. Different types of
populations were studied, and the estimates of levels of dominance within F2populations created by selfing the cross (F1) from two inbred lines were often
overdominant, which supported the theory that heterosis was conditioned by alleles
with overdominant effects. The studies were repeated by intermating plants within
the F2 populations 4–15 generations (Table 7). When the intermated populations
were evaluated, the estimates of levels of dominance were partial to complete
dominance. The greater the number of intermating generations, the greater the
decrease in the levels of dominance was obtained. The estimates of s2A, s2D, and
levels of dominance were influenced by linkage effects, as shown by Mather
(1949). Mather showed that linkage effects bias the estimates of s2A and s2D. With
coupling phase linkages, estimates of s2A and s2D have positive biases. If repulsion
phase linkages, estimates of s2A have negative biases, whereas estimates of s2D have
positive biases. Hence, the estimates of levels of dominance were overestimated
because of repulsion phase linkages, with the linkage biases in the estimates of s2Aand s2D reduced with intermating. The estimates of levels of dominance in F2populations were explained by pseudooverdominance because of linkage effects.
From the studies conducted in maize populations, the evidence suggests that s2A was
40 A.R. Hallauer, M.J. Carena
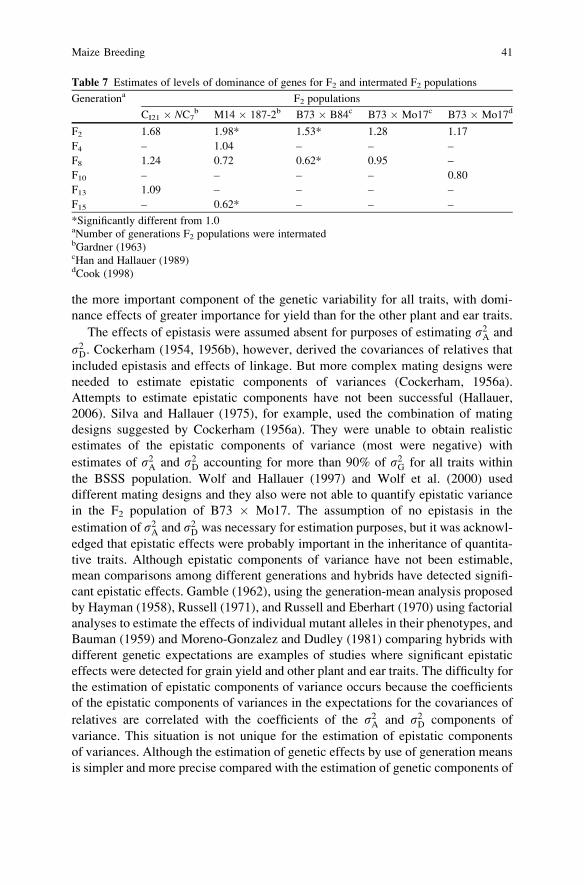
the more important component of the genetic variability for all traits, with domi-
nance effects of greater importance for yield than for the other plant and ear traits.
The effects of epistasis were assumed absent for purposes of estimating s2A and
s2D. Cockerham (1954, 1956b), however, derived the covariances of relatives that
included epistasis and effects of linkage. But more complex mating designs were
needed to estimate epistatic components of variances (Cockerham, 1956a).
Attempts to estimate epistatic components have not been successful (Hallauer,
2006). Silva and Hallauer (1975), for example, used the combination of mating
designs suggested by Cockerham (1956a). They were unable to obtain realistic
estimates of the epistatic components of variance (most were negative) with
estimates of s2A and s2D accounting for more than 90% of s2G for all traits within
the BSSS population. Wolf and Hallauer (1997) and Wolf et al. (2000) used
different mating designs and they also were not able to quantify epistatic variance
in the F2 population of B73 � Mo17. The assumption of no epistasis in the
estimation of s2A and s2D was necessary for estimation purposes, but it was acknowl-
edged that epistatic effects were probably important in the inheritance of quantita-
tive traits. Although epistatic components of variance have not been estimable,
mean comparisons among different generations and hybrids have detected signifi-
cant epistatic effects. Gamble (1962), using the generation-mean analysis proposed
by Hayman (1958), Russell (1971), and Russell and Eberhart (1970) using factorial
analyses to estimate the effects of individual mutant alleles in their phenotypes, and
Bauman (1959) and Moreno-Gonzalez and Dudley (1981) comparing hybrids with
different genetic expectations are examples of studies where significant epistatic
effects were detected for grain yield and other plant and ear traits. The difficulty for
the estimation of epistatic components of variance occurs because the coefficients
of the epistatic components of variances in the expectations for the covariances of
relatives are correlated with the coefficients of the s2A and s2D components of
variance. This situation is not unique for the estimation of epistatic components
of variances. Although the estimation of genetic effects by use of generation means
is simpler and more precise compared with the estimation of genetic components of
Table 7 Estimates of levels of dominance of genes for F2 and intermated F2 populations
Generationa F2 populations
CI21 � NC7b M14 � 187-2b B73 � B84c B73 � Mo17c B73 � Mo17d
F2 1.68 1.98* 1.53* 1.28 1.17
F4 – 1.04 – – –
F8 1.24 0.72 0.62* 0.95 –
F10 – – – – 0.80
F13 1.09 – – – –
F15 – 0.62* – – –
*Significantly different from 1.0aNumber of generations F2 populations were intermatedbGardner (1963)cHan and Hallauer (1989)dCook (1998)
Maize Breeding 41
variance, Hayman (1960) emphasized that similar problems for estimation of
epistatic effects do occur. If only additive and dominance effects are significant,
they are unique estimates. But if significant epistatic effects are detected then the
estimates of additive and dominance effects are not unique. For the estimation of
components of genetic variances, the genetic components of s2A and s2D are initially
estimated. If epistatic components of variance are sequentially estimated after s2Aand s2D, the estimates change dramatically for s2A and s2D and estimates of the
epistatic components of variance often are negative and exceed their standard errors
(Silva and Hallauer, 1975).
The informationderived from thequantitative analysesof the relative importanceof
different genetic effects within maize populations did not advance our knowledge of
the genetic effects important in the expression of heterosis. Generation mean analyses
detected significant additive, dominance, and epistatic variation; estimates of compo-
nents ofs2A and s2D for F2 populations suggested that levels of dominance were in the
overdominant range, but these estimates were reduced to partial-to-complete dom-
inance after intermating; estimates of components of s2A and s2D within genetically
broad based populations suggested greater portion of s2G was due to s2A; and
estimation of epistatic components of variance was generally futile. A vast body
of information on the inheritance of quantitative traits in maize has been reported
(Hallauer and Miranda, 1988). Estimates of components of variance within maize
populations suggest that s2A accounts for the greatest portion of s2G, which seems
reasonable because positive responses to selection within and between populations
have been realized in all instances. The different types of generation mean analyses
include the crosses and their derivatives produced from inbred lines. Significant
estimates of additive, dominant, and epistatic effects were detected in all instances.
The expression of heterosis in maize hybrids is determined by the complimentary
interactions of alleles at each locus (dominance) and the interactions of alleles
between loci (epistasis) of the two inbred parents. Hence, the estimates of genetic
effects via generation mean analyses seem valid. Trying to make translations from
estimates of components of variance within populations to the genetic effects
operative in specific crosses of inbred lines does not seem reasonable. Estimates
are specific for the specific materials used in analyses. The estimates of s2A, s2D, and
s2G for populations were determined from a representative sample of genotypes
(F2s) for the population, whereas the estimates of genetic effects via generation
mean analyses are for the complex of alleles in one F1 formed by crossing inbred
lines. If components of epistatic variances were estimable this would assist in
determining with greater precision the genetic effects within populations.
Dudley and Moll (1969), Moll and Stuber (1974), and Dudley (1997) have
discussed how the information on the inheritance of quantitative traits can be
applied in planning selection and breeding strategies for cultivar development.
The estimates of the genetic components of variance did not contribute directly
to the explaining of the genetic basis of heterosis, but the estimates did pro-
vide information on the relative heritabilities (h2) of plant and ear traits and
relations (rs) between traits. The estimates of h2 were useful in planning selection
42 A.R. Hallauer, M.J. Carena
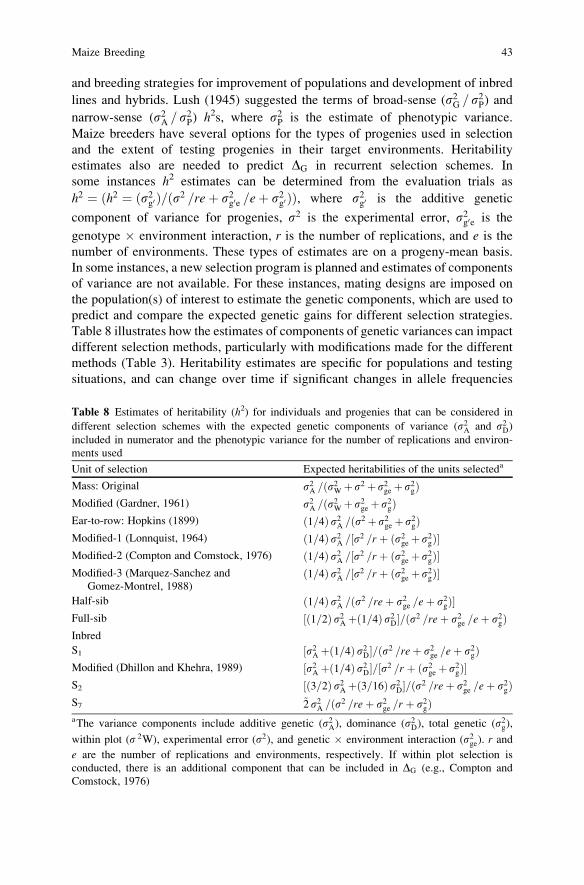
and breeding strategies for improvement of populations and development of inbred
lines and hybrids. Lush (1945) suggested the terms of broad-sense (s2G = s2P) andnarrow-sense (s2A = s2P) h2s, where s2P is the estimate of phenotypic variance.
Maize breeders have several options for the types of progenies used in selection
and the extent of testing progenies in their target environments. Heritability
estimates also are needed to predict DG in recurrent selection schemes. In
some instances h2 estimates can be determined from the evaluation trials as
h2 ¼ ðh2 ¼ ðs2g0 Þ=ðs2 =reþ s2g0e =eþ s2g0 ÞÞ, where s2g0 is the additive genetic
component of variance for progenies, s2 is the experimental error, s2g0e is the
genotype � environment interaction, r is the number of replications, and e is the
number of environments. These types of estimates are on a progeny-mean basis.
In some instances, a new selection program is planned and estimates of components
of variance are not available. For these instances, mating designs are imposed on
the population(s) of interest to estimate the genetic components, which are used to
predict and compare the expected genetic gains for different selection strategies.
Table 8 illustrates how the estimates of components of genetic variances can impact
different selection methods, particularly with modifications made for the different
methods (Table 3). Heritability estimates are specific for populations and testing
situations, and can change over time if significant changes in allele frequencies
Table 8 Estimates of heritability (h2) for individuals and progenies that can be considered in
different selection schemes with the expected genetic components of variance (s2A and s2D)included in numerator and the phenotypic variance for the number of replications and environ-
ments used
Unit of selection Expected heritabilities of the units selecteda
Mass: Original s2A =ðs2W þ s2 þ s2ge þ s2gÞModified (Gardner, 1961) s2A =ðs2W þ s2ge þ s2gÞEar-to-row: Hopkins (1899) ð1=4Þs2A =ðs2 þ s2ge þ s2gÞModified-1 (Lonnquist, 1964) ð1=4Þs2A =½s2 =r þ ðs2ge þ s2gÞ�Modified-2 (Compton and Comstock, 1976) ð1=4Þs2A =½s2 =r þ ðs2ge þ s2gÞ�Modified-3 (Marquez-Sanchez and
Gomez-Montrel, 1988)ð1=4Þs2A =½s2 =r þ ðs2ge þ s2gÞ�
Half-sib ð1=4Þs2A =ðs2 =reþ s2ge =eþ s2gÞ�Full-sib ½ð1=2Þ s2A þð1=4Þs2D�=ðs2 =reþ s2ge =eþ s2gÞInbred
S1 ½s2A þð1=4Þs2D�=ðs2 =reþ s2ge =eþ s2gÞModified (Dhillon and Khehra, 1989) ½s2A þð1=4Þs2D�=½s2 =r þ ðs2ge þ s2gÞ�S2 ½ð3=2Þ s2A þð3=16Þs2D�=ðs2 =reþ s2ge =eþ s2gÞS7 ~2 s2A =ðs2 =reþ s2ge =r þ s2gÞaThe variance components include additive genetic (s2A), dominance (s2D), total genetic (s2g),within plot (s 2W), experimental error (s2), and genetic � environment interaction (s2ge). r ande are the number of replications and environments, respectively. If within plot selection is
conducted, there is an additional component that can be included in DG (e.g., Compton and
Comstock, 1976)
Maize Breeding 43
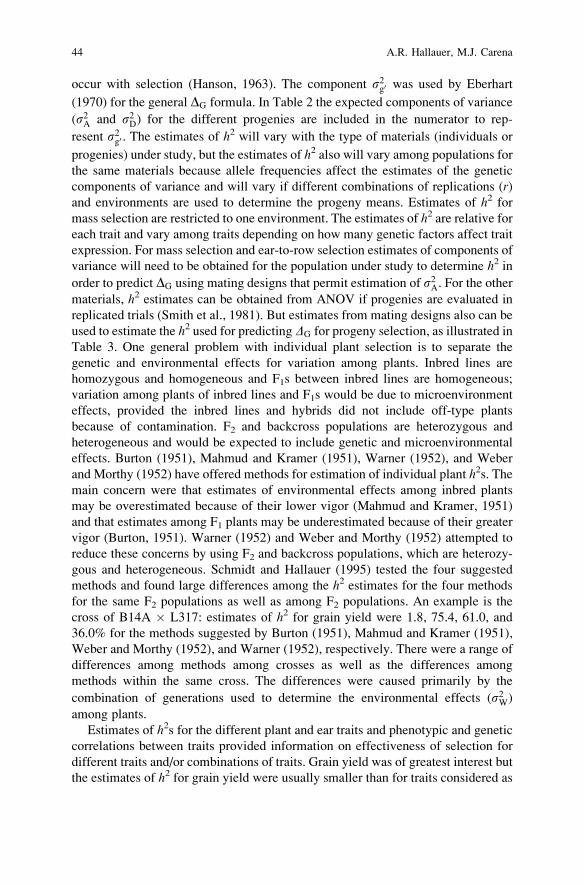
occur with selection (Hanson, 1963). The component s2g0 was used by Eberhart
(1970) for the general DG formula. In Table 2 the expected components of variance
(s2A and s2D) for the different progenies are included in the numerator to rep-
resent s2g0 . The estimates of h2 will vary with the type of materials (individuals or
progenies) under study, but the estimates of h2 also will vary among populations for
the same materials because allele frequencies affect the estimates of the genetic
components of variance and will vary if different combinations of replications (r)and environments are used to determine the progeny means. Estimates of h2 for
mass selection are restricted to one environment. The estimates of h2 are relative foreach trait and vary among traits depending on how many genetic factors affect trait
expression. For mass selection and ear-to-row selection estimates of components of
variance will need to be obtained for the population under study to determine h2 in
order to predict DG using mating designs that permit estimation of s2A. For the othermaterials, h2 estimates can be obtained from ANOV if progenies are evaluated in
replicated trials (Smith et al., 1981). But estimates from mating designs also can be
used to estimate the h2 used for predicting DG for progeny selection, as illustrated in
Table 3. One general problem with individual plant selection is to separate the
genetic and environmental effects for variation among plants. Inbred lines are
homozygous and homogeneous and F1s between inbred lines are homogeneous;
variation among plants of inbred lines and F1s would be due to microenvironment
effects, provided the inbred lines and hybrids did not include off-type plants
because of contamination. F2 and backcross populations are heterozygous and
heterogeneous and would be expected to include genetic and microenvironmental
effects. Burton (1951), Mahmud and Kramer (1951), Warner (1952), and Weber
and Morthy (1952) have offered methods for estimation of individual plant h2s. Themain concern were that estimates of environmental effects among inbred plants
may be overestimated because of their lower vigor (Mahmud and Kramer, 1951)
and that estimates among F1 plants may be underestimated because of their greater
vigor (Burton, 1951). Warner (1952) and Weber and Morthy (1952) attempted to
reduce these concerns by using F2 and backcross populations, which are heterozy-
gous and heterogeneous. Schmidt and Hallauer (1995) tested the four suggested
methods and found large differences among the h2 estimates for the four methods
for the same F2 populations as well as among F2 populations. An example is the
cross of B14A � L317: estimates of h2 for grain yield were 1.8, 75.4, 61.0, and
36.0% for the methods suggested by Burton (1951), Mahmud and Kramer (1951),
Weber and Morthy (1952), and Warner (1952), respectively. There were a range of
differences among methods among crosses as well as the differences among
methods within the same cross. The differences were caused primarily by the
combination of generations used to determine the environmental effects (s2W)among plants.
Estimates of h2s for the different plant and ear traits and phenotypic and geneticcorrelations between traits provided information on effectiveness of selection for
different traits and/or combinations of traits. Grain yield was of greatest interest but
the estimates of h2 for grain yield were usually smaller than for traits considered as
44 A.R. Hallauer, M.J. Carena
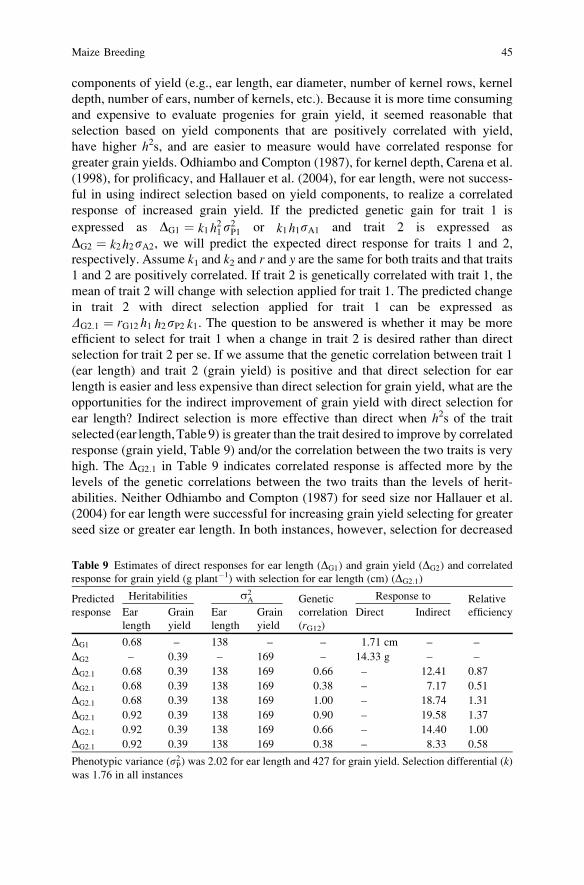
components of yield (e.g., ear length, ear diameter, number of kernel rows, kernel
depth, number of ears, number of kernels, etc.). Because it is more time consuming
and expensive to evaluate progenies for grain yield, it seemed reasonable that
selection based on yield components that are positively correlated with yield,
have higher h2s, and are easier to measure would have correlated response for
greater grain yields. Odhiambo and Compton (1987), for kernel depth, Carena et al.
(1998), for prolificacy, and Hallauer et al. (2004), for ear length, were not success-
ful in using indirect selection based on yield components, to realize a correlated
response of increased grain yield. If the predicted genetic gain for trait 1 is
expressed as DG1 ¼ k1h21s
2P1 or k1h1sA1 and trait 2 is expressed as
DG2 ¼ k2h2sA2, we will predict the expected direct response for traits 1 and 2,
respectively. Assume k1 and k2 and r and y are the same for both traits and that traits
1 and 2 are positively correlated. If trait 2 is genetically correlated with trait 1, the
mean of trait 2 will change with selection applied for trait 1. The predicted change
in trait 2 with direct selection applied for trait 1 can be expressed as
DG2:1 ¼ rG12 h1 h2sP2 k1. The question to be answered is whether it may be more
efficient to select for trait 1 when a change in trait 2 is desired rather than direct
selection for trait 2 per se. If we assume that the genetic correlation between trait 1
(ear length) and trait 2 (grain yield) is positive and that direct selection for ear
length is easier and less expensive than direct selection for grain yield, what are the
opportunities for the indirect improvement of grain yield with direct selection for
ear length? Indirect selection is more effective than direct when h2s of the trait
selected (ear length,Table9) is greater than the trait desired to improve by correlated
response (grain yield, Table 9) and/or the correlation between the two traits is very
high. The DG2:1 in Table 9 indicates correlated response is affected more by the
levels of the genetic correlations between the two traits than the levels of herit-
abilities. Neither Odhiambo and Compton (1987) for seed size nor Hallauer et al.
(2004) for ear length were successful for increasing grain yield selecting for greater
seed size or greater ear length. In both instances, however, selection for decreased
Table 9 Estimates of direct responses for ear length (DG1) and grain yield (DG2) and correlated
response for grain yield (g plant�1) with selection for ear length (cm) (DG2:1)
Predicted Heritabilities s2A Genetic Response to Relative
response Ear
length
Grain
yield
Ear
length
Grain
yield
correlation
(rG12)Direct Indirect efficiency
DG1 0.68 – 138 – – 1.71 cm – –
DG2 – 0.39 – 169 – 14.33 g – –
DG2:1 0.68 0.39 138 169 0.66 – 12.41 0.87
DG2:1 0.68 0.39 138 169 0.38 – 7.17 0.51
DG2:1 0.68 0.39 138 169 1.00 – 18.74 1.31
DG2:1 0.92 0.39 138 169 0.90 – 19.58 1.37
DG2:1 0.92 0.39 138 169 0.66 – 14.40 1.00
DG2:1 0.92 0.39 138 169 0.38 – 8.33 0.58
Phenotypic variance (s2P) was 2.02 for ear length and 427 for grain yield. Selection differential (k)was 1.76 in all instances
Maize Breeding 45
seed size and shorter ear length decreased grain yield. Past selection for grain yield
seemingly had increased the proper combinations of alleles for the various compo-
nents of yield and the heritabilities and genetic correlations were not large enough
to affect grain yield improvement based only on one component of yield.
Theoretical, computer simulation, and empirical studies on the inheritance of
quantitative traits of maize have provided information that has impacted all phases
of maize breeding. The studies did not directly impact selection and breeding
methods for cultivar development, but the information provided a genetic basis
for developing and implementing breeding strategies. Cockerham (1961) examined
theoretically the genetic differences among single-cross, three-way cross, and
double-cross hybrids. He found that if only additive genetic effects were operative
in hybrid performance, that selection among single-cross hybrids would be twice as
effective as selection among double-cross hybrids; the advantage would be even
greater if dominance and epistatic effects were important. Indirect evidence sug-
gests that interaction effects are important in hybrids and have probably become
more important in the recycling of elite inbred lines. Use of single-cross hybrids is
common practice in most concentrated maize production areas of the world. In the
United States, average maize yields have increased 110.4 kg ha�1 since the
introduction of single-cross hybrids, the greatest sustained rate of gain since 1965
(Fig. 1, Troyer, 1999). The empirical breeding methods supported the theoretical
study. Eberhart (1970) developed a very useful method for comparing rates of
predicted genetic gains for different selection methods because the variables in-
cluded were needed to make direct comparisons among methods. Eberhart (1964)
and Smith (1979, 1988) developed models for evaluating response to recurrent
selection. Smith’s (1983) model included parameters that provided information on
the contributions of additive and dominance effects to the response to selection and
provided estimates of the effects of genetic drift because of small population sizes.
The methods suggested by Eberhart (1964) and Smith (1979, 1983) have become
standard procedures in determining the rates of response to selection and the genetic
basis for the rates of response. Cress (1967), Jones et al. (1971), and Peiris and
Hallauer (2005) studied RRS methods algebraically and via computer simulation to
determine the most effective methods. Cress (1967) concluded the two initial
populations should be intermated before initiating selection. The intermated popu-
lation would include the alleles of both original populations. RRS would be
imposed on the intermated population to develop two subpopulations with comple-
mentary alleles. Jones et al. (1971) compared half-sib and full-sib RRS. They
concluded that full-sib RRS was superior to half-sib RRS at less intense selection
and when environmental effects were large relative to the genetic variance. Using
empirical estimates of variation among half-sib and full-sib families, Jones et al.
(1971) suggested that the selection differential should be 1.2 times greater for full-
sib RRS than for half-sib RRS to give similar response. Peiris and Hallauer (2005)
concluded simulation studies comparing 20 cycles of half-sib and full-sib RRS for
genetic models that included epistasis. There were 22 genetic models considered.
Genetic response to selection of full-sib RRS was similar to half-sib RRS for 21 of
the 22 initial genetic models with S1 progenies used as the recombination units
46 A.R. Hallauer, M.J. Carena
intermated for each selection cycle. The linear response of half-sib RRS was 1.7
times greater than full-sib RRS for the genetic model that included complete
dominance and dominance � dominance epistasis with S1 progenies used for
intermating. There were no significant differences between half-sib and full-sib
RRS with S2 progenies used for intermating, but use of S2 progenies increased
selection response for both half-sib and full-sib RRS. Compared with half-sib RRS,
full-sib RRS requires 50% fewer testcrosses, and full-sib RRS has the same
selection responses for 21 of 22 genetic models examined. Empirical data for
full-sib RRS with BS10 and BS11 and half-sib RRS with BSSS and BSCB1
indicate the two types of families evaluated are equally effective for improvement
of the population crosses (Table 5).
Rawlings and Thompson (1962), Smith (1986), and Bernardo (1991, 1992)
examined two important aspects of maize breeding: the more effective tester for
discriminating differences among new lines for their relative combining abilities
and the appropriate generation of inbreeding for evaluating the combining ability of
new lines. Derived theory and computer simulations were used in the studies.
Jenkins (1935), Sprague (1946a), Jensen et al. (1983), Rodriguez and Hallauer
(1991), Lile and Hallauer (1994), and Castellanos et al. (1998) reported empirical
data that early testing was effective in identifying new lines that had above average
combining ability. Rawlings and Thompson (1962) examined models that included
different allele frequencies in testers for different levels of dominance. Genetic
variation among testcrosses was greatest with testers that had a low frequency of
favorable alleles at all levels of dominance. Smith (1986) reported similar results
for relative value of testers and there was a poor relation between inbred line and
testcross performance. Bernardo (1991, 1992) determined that the relation between
early and later generation testcrosses was good (most rs greater than 0.9) and foundthat effective early generation testing was limited primarily by nongenetic effects
(i.e., low h2s of testcrosses). The theoretical information supported the contention
of Jenkins (1935) and Sprague (1946a) that the combining ability of lines was
determined in the early generations of inbreeding and does not change significantly
with continued inbreeding.
6 Inbred Line Development
Development of superior inbred lines is the goal of every maize breeder. Compared
with other major cultivated crop species, the development of inbred lines (or pure
lines) is not the ultimate cultivar for the producers, which is the case for obligate
self-pollinating crop species. Development of inbred lines is only the first stage in
maize breeding. The breeding system, designated as pedigree selection, is the
method used in maize breeding, as well as the one used in other crop species.
Pedigree selection method includes keeping accurate records to maintain genetic
identity of progenies (pedigrees) during inbreeding, selection, and evaluation.
Pedigree selection (record keeping) is used any time inbreeding and selection are
Maize Breeding 47
initiated within any type of population (open-pollinated, synthetic, and composite
cultivars and F2 and backcross populations), but pedigree selection usually is
associated with inbreeding and selection within F2 populations developed from
crosses of homozygous elite parents. Pedigree selection, however, can be initiated
within any type of population where accurate records are maintained to trace the
genetic history (genealogy) of lines developed via inbreeding and selection among
progenies and individuals within progenies. With the use of improved germplasm
sources, the development of inbred lines is a relatively easy task; the major task is
determining the combination of inbred lines that can be used as parents of superior
hybrids. Initially, when the inbred–hybrid concept was proposed, the germplasm
sources for developing inbred lines were (what was considered at the time) the more
productive open-pollinated cultivars (Jenkins, 1936). The first-cycle inbreds were
the parents of the first double-cross hybrids. Because of the poor vigor and poor grain
yields of the inbred lines, these were the factors that prompted use of double-cross
hybrids because the more productive single-cross hybrids were used as the parents.
One of the main factors that permitted use of single-cross hybrids was the more
vigorous and more productive inbred lines developed by recycling of better inbred
lines (e.g., Idt, Troyer, 1999) and from improved genetically broad-based popula-
tions with recurrent selection (e.g., B14, B37, B73, B84, B104 from BSSS). Discus-
sions on the logic and experimental basis of maize breeding during the double-cross
era were given by Jenkins (1936), Sprague (1946b, 1955), and Richey (1950).
Selection was effective for developing distinct open-pollinated cultivars for the
different environments within the United States, but the selection methods had no
effect on average grain yields (Fig. 1). Because of the increasing needs for the
rapidly expanding livestock industry in the US Midwest, different methods were
needed to improve grain yields. Decisions were made to test the suggestions of
Shull (1910) and Jones (1918) to determine if the use of hybrids was an effective
method to increase maize grain yields. In 1922, the USDA and the state experiment
stations initiated programs to develop inbred lines to form hybrids. The locally
adapted open-pollinated cultivars were the source germplasm for inbreeding plans
to develop inbred lines. Depending on the location and source germplasm, some
locations were more effective than others for developing inbred lines that were used
extensively in double-cross hybrids (Hallauer, 1990). The group of first cycle
inbred lines was developed from numerous sources (Jenkins, 1936). Thousands of
inbred lines were developed by only a few had major roles as parents in the
production of single crosses. US13 (WF9 � 38-11)(Hy � L317) was a widely
grown double-cross hybrid and the parental inbreds were developed by breeders
located in different states (Crabb, 1947). Ia939 (Os420 � Os426)(L289 � I205)
was another widely grown double-cross hybrid, and the four parental inbred lines
were developed by M. T. Jenkins from his initial 1922 breeding nursery. Lindstrom
(1939) estimated that of the 27,641 lines that had been self-pollinated one to three
generations only 2.4% were presumably useful inbred lines. Although most of the
first cycle inbred lines developed primarily from open-pollinated cultivars were not
used directly as parents of hybrids, germplasms of some first-cycle inbreds have
been very persistent in pedigrees of the next cycle(s) inbred lines: for example,
48 A.R. Hallauer, M.J. Carena
C103, I205 (Idt), Oh43, Oh07, 187-2, B164, etc. (Troyer, 1999). Other inbred lines
developed initially did not have great impact on production of double-cross hybrids,
but they were to have important roles in future breeding programs, such as Mt.42
and ND203 (Rinke and Sentz, 1962). The open-pollinated cultivars provided the
germplasm for the initial cycle of inbreds, which provided the germplasm for future
inbred line development by pedigree selection and the formation of synthetic
cultivars such as BSSS and BSCB1. The use of open-pollinated cultivars as sources
of breeding germplasm essentially ceased after 1940: greater emphasis was given to
recycling the elite inbred lines. Bauman (1981) reported that the use of open-
pollinated, synthetic, and composite cultivars had essentially been replaced with
use of elite line crosses as the major germplasm sources for initiating line develop-
ment. Historical perspectives on the initial maize breeding programs for source
germplasm for line development, individuals involved in the early breeding programs,
and pedigrees and descriptions of the first-cycle inbreds were provided by Jenkins
(1936), Crabb (1947), Gerdes et al. (1994), and Troyer (1999, 2004a, b, 2006). Mikel
and Dudley (2006) presented information on the breeding history of inbred lines
developed in recent years that also emphasizes the limited use of genetically broad-
based germplasm for line development in modern, commercial breeding programs.
Lines developed from different cycles of recurrent selection in BSSS, however, was a
major contributor (63%) of germplasm of the newer inbred lines.
Judicious choice of germplasm is the key element in successful breeding pro-
grams. If unfortunate choices are made and the frequency of favorable alleles or
allelic combinations are low, or absent, the breeder will have limited success even
with the best technology or tool available. In modern breeding programs, elite
inbred lines are used that enhanced the favorable complexes of genes that have been
selected in past cycles of breeding and intermating, and the genetic variation is
similar to other types of populations (Fountain and Hallauer, 1996). Consistent
incremental genetic gains are realized in the hybrids with each cycle of selection
(Fig. 1; Troyer, 2006; Mikel, 2006; Mikel and Dudley, 2006).
Development of maize inbred lines is easier within recycled germplasm sources.
Compared with the first-cycle inbred lines developed from open-pollinated cultivars,
modern inbred lines are more vigorous, more productive, have better agronomic
traits and consequently easier to maintain. Because maize has separate male (tassel)
and female (ear shoots) inflorescences, maize is essentially 100% cross pollinated.
To produce pure self-pollinated seed, it is essential to cover the tassels and ear shoots
before pollen shed and manually transfer pollen (male gametes) from the tassel and
distribute on the silks (female gametes) of the ear shoots. Effectively techniques of
makingpollinations inmaizehaveevolvedandrelatively little training is requiredtohave
capable pollinators (Russell andHallauer, 1980; Hallauer, 1987, 1994). Self-pollination
is the usual process used to develop inbred lines. Some, however, believed that self-
pollination was too severe because of rapid fixation of alleles, which would reduce
effective selection among plants and progenies during inbreeding. Collins (1909) and
Stringfield (1974) suggested the broad-line development of lines by sib matings of
plants rather than by self-pollination. Because maize is essentially cross-pollinated,
inbreeding depression (ID) occurs when inbreeding occurs. Falconer (1960) has
Maize Breeding 49
shown that ID can be expressed as S2pqdF, where p and q are allele frequencies, dis level of dominance, F is level of inbreeding, and summed over loci. Genetic
expectation per 1% increase in F can be expressed as mean of noninbred (X0) minus
mean of inbred (XF) divided by F: that is, (X0 � XF)/F = 2pqd. Hence, ID is
determined by three factors and can be different for different populations and
different traits because of allele frequencies and levels of dominance. Good and
Hallauer (1977) compared rates of inbreeding for two groups of inbred derived by
single-seed descent from BSSS: that is, 247 lines derived by selfing 250 S0 plants,
and 243 lines derived by sib mating. Rates of IDper 1% increase inFwere�10.4653q
ha�1 by self pollination and �0.4511 q ha�1 by full-sib matings. Although the rate
of fixation of alleles was slower by sib mating than self-pollination, the rates of ID
were similar. Average grain yields at 50% homozygosity were 45.2 q ha�1 by
selfing one generation versus 45.9 q ha�1 by three generations of sib mating and
30.3 q ha�1 after three generations of selfing versus 31.2 q ha�1 after nine genera-
tions of sib mating. At similar levels of inbreeding, the differences between means
were not significantly different, which is expected. Stringfield (1974) hypothesized
that further selection could be effective but the broad-line concept has not been
widely used. Hallauer and Miranda (1988) presented summaries of the reported
estimates of ID for different traits within different populations. Generally, there was
a decrease for the mean of traits with increased levels of inbreeding with grain yield
tending to have the greatest rate. The only trait that had positive increases with
increased levels of inbreeding was days-to-flower, which indicates the lines had
delayed flowering with increased levels of inbreeding. The differences between
grain yield (�ID) versus days-to-flower (+ID) reflect the estimates of dominance:
dominant favorable alleles for grain yield and dominance effects for earlier days-to-
flower.
Allele frequencies also affect ID. Rodriguez and Hallauer (1991) estimated
percentages of ID in populations that have been under recurrent selection
(Table 10). Estimates of ID for grain yield decreased in all populations except for
BSCB1(R)C10. For BSSSC0 the average yield of the S1 generation was 36% lower
than the noninbred C0 population. After ten cycles of half-sib RRS, average yield of
the S1 generation was 15% lower than the noninbred C0 population. BS13(S)C4
also was developed from the same BSSSC0 population as BSSS(R)C10; average
grain yield of the S1 generation of BS13(S)C4 was 14% greater than the noninbred
C0 population. The comparison of the two strains of BSKC0 also showed less ID
with use of inbred progeny selection recurrent selection versus half-sib recurrent
selection. The advanced cycles of BSCB1C0 per se have also shown decreased
grain yield and vigor (Keeratinijakal and Lamkey, 1993). It seems random effects
of genetic drift and/or inbreeding have affected BSCB1(R)C0 grain yield but this
does not seem to explain the increase in ID. Dominance effects seem to have greater
importance in BSSS (tester population for BSCB1) and perhaps the effects of RRS
have selected complementary alleles in BSCB1 that tend to be recessive. Indirect
evidence from the lines used for intermating between recent cycles of selection
support the data of Table 10; most lines tend to be more vigorous and have better
grain yields and agronomic traits compared with earlier cycles. ID varies among
traits, but the estimates of ID indicate that for populations we can expect 40%, 10%,
50 A.R. Hallauer, M.J. Carena
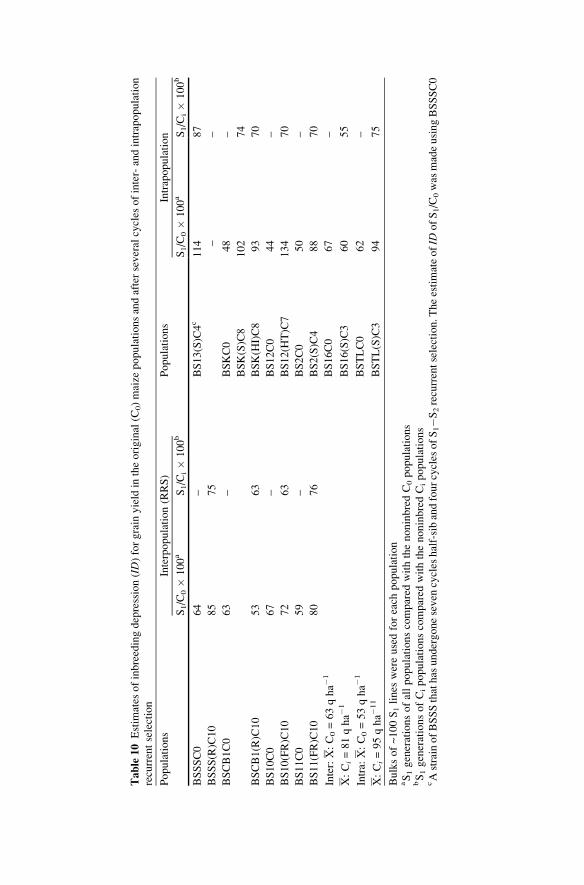
Table10
Estim
ates
ofinbreedingdepression(ID)forgrain
yield
intheoriginal(C
0)maize
populationsandafterseveralcycles
ofinter-andintrapopulation
recurrentselection
Populations
Interpopulation(RRS)
Populations
Intrapopulation
S1/C
0�
100a
S1/C
i�
100b
S1/C
0�
100a
S1/C
i�
100b
BSSSC0
64
–BS13(S)C4c
114
87
BSSS(R)C10
85
75
––
BSCB1C0
63
–BSKC0
48
–
BSK(S)C8
102
74
BSCB1(R)C10
53
63
BSK(H
I)C8
93
70
BS10C0
67
–BS12C0
44
–
BS10(FR)C10
72
63
BS12(H
T)C7
134
70
BS11C0
59
–BS2C0
50
–
BS11(FR)C10
80
76
BS2(S)C4
88
70
Inter:X:C0=63qha�
1BS16C0
67
–
X:Ci=81qha�
1BS16(S)C3
60
55
Intra:
X:C0=53qha�
1BSTLC0
62
–
X:Ci=95qha�
11
BSTL(S)C3
94
75
Bulksof~100S1lines
wereusedforeach
population
aS1generationsofallpopulationscompared
withthenoninbredC0populations
bS1generationsofCipopulationscompared
withthenoninbredCipopulations
cAstrainofBSSSthathas
undergoneseven
cycles
half-sibandfourcycles
ofS1�S
2recurrentselection.T
heestimateofID
ofS1/C
0was
madeusingBSSSC0
10% decreases in grain yield, plant height, and ear length, respectively, after one
generation of self-pollination. After seven generations of self pollination, the
expected decreases are 70%, 25%, and 25% for grain yield, plant height, and ear
length, respectively.
Greatest emphasis is given to the F2 populations of either hybrids or planned
crosses of elite lines as sources for inbred line development (Bauman, 1981). Bailey
and Comstock (1976) and Bailey (1977) conducted computer simulation studies
for different linkage and heritability levels and different frequencies of favorable
alleles in the parents of the F1 crosses to determine the frequency of the favorable
alleles in progenies derived from the F2 populations. The foundation population
(F2) was formed from the cross of two homozygous lines and the F2 obtained
by selfing the F1. Some of their conclusions included: probability of homozygosity
of favorable alleles was higher for selected 10% of lines versus unselected lines;
higher with higher heritabilities; and higher with fewer number of loci included in
selection. The frequencies of favorable alleles in complete coupling were higher
than in absence of linkage in 30 of 32 possible comparisons, and effects were
greater for tighter linkages, higher heritabilities, and with selection. With repulsion
linkages, the favorable allele frequencies were lower compared with independent
assortment (no linkage) in 31 of 32 possible comparisons. The results seem
reasonable because with favorable alleles in coupling phase linkages in the F1they would tend to be together during meiosis and favorable alleles would be
more frequent than with no linkage. Bailey (1977) discussed the situations
where the genetic value of the parents used to produce the F1 has either equal or
unequal genetic values. With parents having equal genetic values one could be
confident of recovering a line from the F2 population superior to either of the
parent lines. But if one parent has 70% of the favorable alleles, there will be
more coupling linkages and the probability of getting a line as good as or
better than the better parent was about 7%. These estimates assumed h2 value of
0.5. If heritability was less than 0.5 and with limited selection, the probabilities of
obtaining genotypes superior to the parents is reduced. Bailey (1977) also con-
cluded that if 60 loci affect the trait of interest that whatever the genetic value of the
parents there is virtually no chance of recovering a genotype containing the
favorable allele for the 60 loci. The simulation studies of Bailey and Comstock
(1976) support the experiences of maize breeders having success with selection in
F2 populations of elite line crosses. There are an unknown number of loci affecting
grain yield, but continued incremental gains by recycling crosses of elite lines
certainly provides complexes of favorable alleles that can be gradually improved.
The poor � elite line crosses are not an option because the favorable gene
combinations of the elite line are diluted by the, perhaps, rare recombinations
that occur during meiosis. However, they seem to be valuable crosses for increasing
the basic knowledge of chromosome segments controlling quantitative or mostly
qualitative traits (e.g., QTL experiments). Examples are available for the
crosses that insert a mutant allele (e.g., o2, bm, fl2, etc.) into widely used elite
line in the desire to have, say, an opaque-2 version of the elite line. It seldom, if
ever, happens. Within F2 populations, maximum linkage disequilibrium would
52 A.R. Hallauer, M.J. Carena
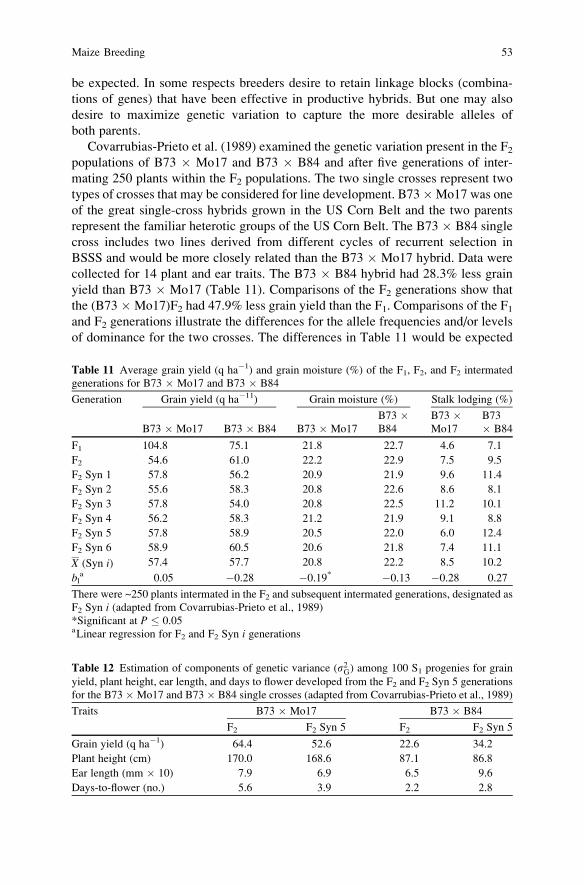
be expected. In some respects breeders desire to retain linkage blocks (combina-
tions of genes) that have been effective in productive hybrids. But one may also
desire to maximize genetic variation to capture the more desirable alleles of
both parents.
Covarrubias-Prieto et al. (1989) examined the genetic variation present in the F2populations of B73 � Mo17 and B73 � B84 and after five generations of inter-
mating 250 plants within the F2 populations. The two single crosses represent two
types of crosses that may be considered for line development. B73�Mo17 was one
of the great single-cross hybrids grown in the US Corn Belt and the two parents
represent the familiar heterotic groups of the US Corn Belt. The B73 � B84 single
cross includes two lines derived from different cycles of recurrent selection in
BSSS and would be more closely related than the B73 � Mo17 hybrid. Data were
collected for 14 plant and ear traits. The B73 � B84 hybrid had 28.3% less grain
yield than B73 � Mo17 (Table 11). Comparisons of the F2 generations show that
the (B73 �Mo17)F2 had 47.9% less grain yield than the F1. Comparisons of the F1and F2 generations illustrate the differences for the allele frequencies and/or levels
of dominance for the two crosses. The differences in Table 11 would be expected
Table 11 Average grain yield (q ha�1) and grain moisture (%) of the F1, F2, and F2 intermated
generations for B73 � Mo17 and B73 � B84
Generation Grain yield (q ha�11) Grain moisture (%) Stalk lodging (%)
B73 � Mo17 B73 � B84 B73 � Mo17
B73 �B84
B73 �Mo17
B73
� B84
F1 104.8 75.1 21.8 22.7 4.6 7.1
F2 54.6 61.0 22.2 22.9 7.5 9.5
F2 Syn 1 57.8 56.2 20.9 21.9 9.6 11.4
F2 Syn 2 55.6 58.3 20.8 22.6 8.6 8.1
F2 Syn 3 57.8 54.0 20.8 22.5 11.2 10.1
F2 Syn 4 56.2 58.3 21.2 21.9 9.1 8.8
F2 Syn 5 57.8 58.9 20.5 22.0 6.0 12.4
F2 Syn 6 58.9 60.5 20.6 21.8 7.4 11.1
X (Syn i) 57.4 57.7 20.8 22.2 8.5 10.2
bla 0.05 �0.28 �0.19* �0.13 �0.28 0.27
There were ~250 plants intermated in the F2 and subsequent intermated generations, designated as
F2 Syn i (adapted from Covarrubias-Prieto et al., 1989)
*Significant at P � 0.05aLinear regression for F2 and F2 Syn i generations
Table 12 Estimation of components of genetic variance (s2G) among 100 S1 progenies for grain
yield, plant height, ear length, and days to flower developed from the F2 and F2 Syn 5 generations
for the B73 �Mo17 and B73 � B84 single crosses (adapted from Covarrubias-Prieto et al., 1989)
Traits B73 � Mo17 B73 � B84
F2 F2 Syn 5 F2 F2 Syn 5
Grain yield (q ha�1) 64.4 52.6 22.6 34.2
Plant height (cm) 170.0 168.6 87.1 86.8
Ear length (mm � 10) 7.9 6.9 6.5 9.6
Days-to-flower (no.) 5.6 3.9 2.2 2.8
Maize Breeding 53
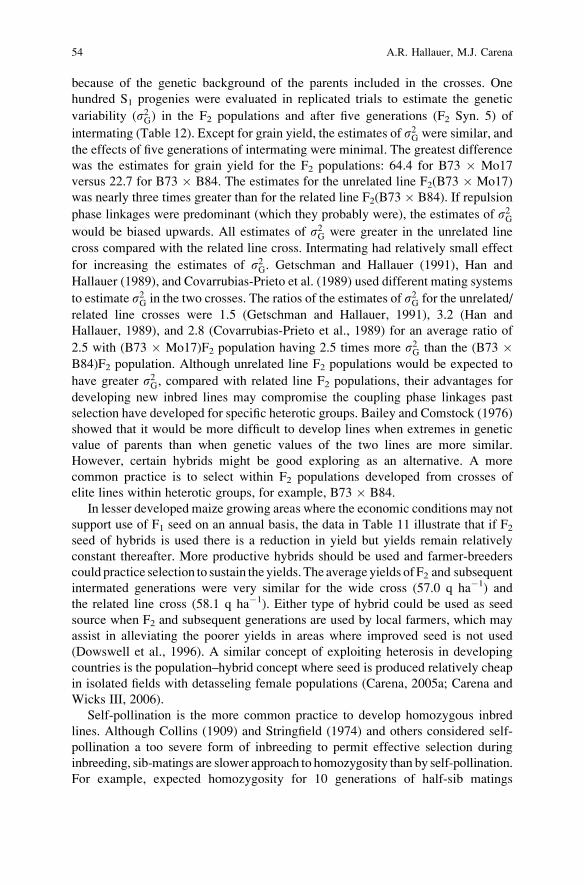
because of the genetic background of the parents included in the crosses. One
hundred S1 progenies were evaluated in replicated trials to estimate the genetic
variability (s2G) in the F2 populations and after five generations (F2 Syn. 5) of
intermating (Table 12). Except for grain yield, the estimates of s2G were similar, and
the effects of five generations of intermating were minimal. The greatest difference
was the estimates for grain yield for the F2 populations: 64.4 for B73 � Mo17
versus 22.7 for B73 � B84. The estimates for the unrelated line F2(B73 � Mo17)
was nearly three times greater than for the related line F2(B73 � B84). If repulsion
phase linkages were predominant (which they probably were), the estimates of s2Gwould be biased upwards. All estimates of s2G were greater in the unrelated line
cross compared with the related line cross. Intermating had relatively small effect
for increasing the estimates of s2G. Getschman and Hallauer (1991), Han and
Hallauer (1989), and Covarrubias-Prieto et al. (1989) used different mating systems
to estimate s2G in the two crosses. The ratios of the estimates of s2G for the unrelated/
related line crosses were 1.5 (Getschman and Hallauer, 1991), 3.2 (Han and
Hallauer, 1989), and 2.8 (Covarrubias-Prieto et al., 1989) for an average ratio of
2.5 with (B73 � Mo17)F2 population having 2.5 times more s2G than the (B73 �B84)F2 population. Although unrelated line F2 populations would be expected to
have greater s2G, compared with related line F2 populations, their advantages for
developing new inbred lines may compromise the coupling phase linkages past
selection have developed for specific heterotic groups. Bailey and Comstock (1976)
showed that it would be more difficult to develop lines when extremes in genetic
value of parents than when genetic values of the two lines are more similar.
However, certain hybrids might be good exploring as an alternative. A more
common practice is to select within F2 populations developed from crosses of
elite lines within heterotic groups, for example, B73 � B84.
In lesser developed maize growing areas where the economic conditions may not
support use of F1 seed on an annual basis, the data in Table 11 illustrate that if F2seed of hybrids is used there is a reduction in yield but yields remain relatively
constant thereafter. More productive hybrids should be used and farmer-breeders
could practice selection to sustain the yields. The average yields of F2 and subsequent
intermated generations were very similar for the wide cross (57.0 q ha�1) and
the related line cross (58.1 q ha�1). Either type of hybrid could be used as seed
source when F2 and subsequent generations are used by local farmers, which may
assist in alleviating the poorer yields in areas where improved seed is not used
(Dowswell et al., 1996). A similar concept of exploiting heterosis in developing
countries is the population–hybrid concept where seed is produced relatively cheap
in isolated fields with detasseling female populations (Carena, 2005a; Carena and
Wicks III, 2006).
Self-pollination is the more common practice to develop homozygous inbred
lines. Although Collins (1909) and Stringfield (1974) and others considered self-
pollination a too severe form of inbreeding to permit effective selection during
inbreeding, sib-matings are slower approach to homozygosity than by self-pollination.
For example, expected homozygosity for 10 generations of half-sib matings
54 A.R. Hallauer, M.J. Carena
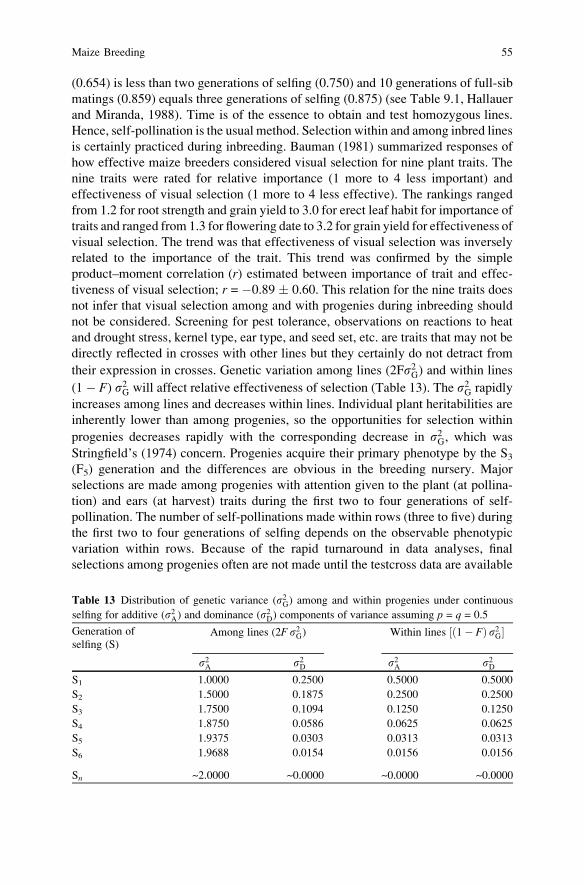
(0.654) is less than two generations of selfing (0.750) and 10 generations of full-sib
matings (0.859) equals three generations of selfing (0.875) (see Table 9.1, Hallauer
and Miranda, 1988). Time is of the essence to obtain and test homozygous lines.
Hence, self-pollination is the usual method. Selection within and among inbred lines
is certainly practiced during inbreeding. Bauman (1981) summarized responses of
how effective maize breeders considered visual selection for nine plant traits. The
nine traits were rated for relative importance (1 more to 4 less important) and
effectiveness of visual selection (1 more to 4 less effective). The rankings ranged
from 1.2 for root strength and grain yield to 3.0 for erect leaf habit for importance of
traits and ranged from 1.3 for flowering date to 3.2 for grain yield for effectiveness of
visual selection. The trend was that effectiveness of visual selection was inversely
related to the importance of the trait. This trend was confirmed by the simple
product–moment correlation (r) estimated between importance of trait and effec-
tiveness of visual selection; r = �0.89 � 0.60. This relation for the nine traits does
not infer that visual selection among and with progenies during inbreeding should
not be considered. Screening for pest tolerance, observations on reactions to heat
and drought stress, kernel type, ear type, and seed set, etc. are traits that may not be
directly reflected in crosses with other lines but they certainly do not detract from
their expression in crosses. Genetic variation among lines (2Fs2G) and within lines
(1 � F) s2G will affect relative effectiveness of selection (Table 13). The s2G rapidly
increases among lines and decreases within lines. Individual plant heritabilities are
inherently lower than among progenies, so the opportunities for selection within
progenies decreases rapidly with the corresponding decrease in s2G, which was
Stringfield’s (1974) concern. Progenies acquire their primary phenotype by the S3(F5) generation and the differences are obvious in the breeding nursery. Major
selections are made among progenies with attention given to the plant (at pollina-
tion) and ears (at harvest) traits during the first two to four generations of self-
pollination. The number of self-pollinations made within rows (three to five) during
the first two to four generations of selfing depends on the observable phenotypic
variation within rows. Because of the rapid turnaround in data analyses, final
selections among progenies often are not made until the testcross data are available
Table 13 Distribution of genetic variance (s2G) among and within progenies under continuous
selfing for additive (s2A) and dominance (s2D) components of variance assuming p = q = 0.5
Generation of
selfing (S)Among lines (2F s2G) Within lines ½ð1� FÞ s2G�
s2A s2D s2A s2DS1 1.0000 0.2500 0.5000 0.5000
S2 1.5000 0.1875 0.2500 0.2500
S3 1.7500 0.1094 0.1250 0.1250
S4 1.8750 0.0586 0.0625 0.0625
S5 1.9375 0.0303 0.0313 0.0313
S6 1.9688 0.0154 0.0156 0.0156
Sn ~2.0000 ~0.0000 ~0.0000 ~0.0000
Maize Breeding 55
to determine which progenies have better combining abilities, which ultimately
determines the genetic worth of new lines.
The tendency for plant tissue culture for generating genetic variation has been
reported. Larkin and Scowcroft (1981) suggested that the use of tissue culture as a
model source to generate genetic variation could be useful in plant breeding
programs. Lee et al. (1988) evaluated the relationship between culture age and
somaclonal variation for several agronomic traits from a maize single cross.
Lee et al. (1988) evaluated 305 tissue culture-derived lines and 48 control lines as
lines per se and in a testcross in six trials. Tissue culture-derived lines and their
testcrosses generally had lower grain yield and moisture than the control lines.
Although the tissue culture-derived lines were generally inferior, the greatest
yielding line per se in three of six trials and the best line in five of six trials were
derived from tissue culture. However, the odds of identifying the best line would
favor tissue culture-derived methods because 257 more tissue culture-derived lines
were included. They also calculated the phenotypic correlations between S2 and
testcross performance for grain yield and moisture and stalk lodging. Grain yield of
S2 lines was not significantly correlated with grain yield of their testcrosses in any
trial, which is similar to previous correlations reported for the traditional methods
of developing lines (e.g., Jensen et al., 1983). S2-testcross correlations for grain
moisture and stalk lodging were significantly positive in most trials but their
magnitude was generally low. Lee et al. (1988) concluded that tissue culture may
generate variation for agronomic traits. Because of the tendency to generate a large
proportion of inferior lines via tissue culture, the method may require screening
larger populations of lines to identify superior lines. Genetic variation from use of
tissue culture did not seem promising for increasing grain yield, but the trend
towards earlier maturity could be useful.
Genetic variation in maize breeding has not been a limiting factor in maize
breeding. Maize breeders can make elite line � elite line crosses to create the
genetic variation they desire. The regeneration of plants via tissue culture may be a
limiting factor for many elite lines. Except for some specific traits that are more
simply inherited than grain yield and most traits considered important for modern
inbred lines, it seems tissue culture-derived genetic variation has limited use. The
genetic variation within elite line crosses may be less than genetic variation
generated by mutation breeding and tissue culture breeding, but the genetic varia-
tion is often useful and permits effective selection.
It was previously stated that the ultimate success of a breeding program depends
on the proper choices of parents to form segregating populations to initiate line
development. In most instances, the choices of parents may be dictated by the
relative importance of lines in producing commercial hybrids, and the desire is to
continually improve the workhorse lines (e.g., see Fig. 3, Troyer, 1999). The
inventory of inbred lines within an organization can be searched to identify other
elite lines within the same heterotic group that would be logical choices in making
crosses. The inbred lines selected may be very important as parents of hybrids in
different areas (better pest resistance) or different maturity zones. B14 (BSSS) and
Oh43 (W8 � Oh40B), for example, were very important parents of hybrids grown
56 A.R. Hallauer, M.J. Carena
in the central US Corn Belt. B14 (crossed with earlier maturity lines Mt42 and
ND203) and Oh43 (crossed with earlier maturity line A171) were crossed, back-
crossed, and selected to have earlier maturity strains (A632, A641, and A619) of
B14 and Oh43 to produce hybrids adaptable to earlier maturity zones (Rinke and
Sentz, 1962). In some instances, obvious choices of parents to use in crosses with
elite lines may not be available. Dudley (1982, 1984a, b) developed a method that
identifies a parent(s) that have a class of alleles that are not present in the parents of
a superior hybrid. The goal is to identify a parent that has alleles not present in
either parent and can be incorporated in at least one parent to improve the parent(s)
of an otherwise superior hybrid. The goal was to determine which one of the
original inbred lines used in the hybrid could be improved to improve the perfor-
mance of the hybrid. Dudley (1982) identified eight classes (A through G) of loci
that have the favorable alleles (plus alleles) either in one of the original parents (P1and P2) and another parent (PW) that may be used to improve either P1 or P2. The G
class of loci included favorable alleles that were present in PW but not present in P1or P2. Dudley (1982, 1984a, b) derived a series of equations that represented the
genotypic values of parents (P1, P2, and PW) and crosses of the parents (P1 � P2, P1� PW, and P2 � PW). He derived a series of equations that permitted solutions for
six classes of alleles (classes A and H were deleted because P1, P3, and PW either
had all plus or all minus alleles). Two examples were discussed. The hybrid C103
(P1) � B37 (P2) was tested by crossing each line to B73, N28, Mo17, and Oh43
(PWs). The nine hybrids and parents were evaluated and estimates of G were
determined for B73 (12.2), N28 (24.0), Mo17 (�4.5), and Oh43 (6.5). The greatest
improvement would be contributions of favorable alleles from N28 to improve B37.
Based on the genetic backgrounds of each PW, this would be the logical choice. N28
also derived from BSSS but more distantly related than B37 and B73. The hybrid
B73 � Mo17 was considered and each parent crossed to B37, N28, C103, and
Oh43. For this hybrid none of the PW lines would contribute favorable alleles to
improve the line because m G estimates for B37 (�5.0), N28 (�7.0), C103 (�22.8),
and Oh43 (�18.5) indicated they would not contribute favorable alleles to improve
B73 �Mo17. This result also seems logical because B73 �Mo17 was an excellent
hybrid and the PW lines were older lines. The method proposed by Dudley (1982,
1984) is relatively easy to conduct and relatively precise because means are used to
estimate the parameters. The main problem, or concern, in the evaluation trials is
evaluating the parents and hybrids in the same trials because of vigor differences.
Field plot techniques could be modified to either use larger plots to reduce compe-
tition effects, split-plot designs with parents and hybrids in whole plots, or separate
experiments which may have different experimental errors. Inbred trials tend to
have greater error mean squares, but adjustments can be made for making compar-
isons among the inbred and hybrid entries. Modifications of the original method
suggested by Dudley (1982, 1984a, b) have been made by Dudley (1987), Gerloff
and Smith (1988), and Bernardo (1990).
Maize breeders use all the information available to assist them in the selection of
genotypes with superior breeding values. Johnson (2004) discussed the use of
molecular markers to assist the breeders in identifying lines that had superior
Maize Breeding 57
breeding values. He used the method commonly used in maize breeding by crossing
two elite inbred lines and deriving the F2 population in which to initiate selection.
Johnson (2004) used F2 populations because linkage disequilibrium is at a maxi-
mum and they are considered ideal for the application of molecular markers in
maize breeding. The goal of the study was to determine the relative combining
abilities of S1 and S3 direct descendants in testcrosses. The testers were homozy-
gous inbred lines and the genetic variation among testcrosses would conform to an
additive genetic model. Each of the S1 and S3 lines was genotyped with RFLP
markers covering the genome that were spaced 20 cM apart. Two field experiments
were conducted to determine the efficiency of marker assisted selection for mea-
suring the combining abilities of lines derived from F2 populations. The results
from both experiments clearly indicated that marker scores were heritable and
significantly contributed to the prediction of advanced generation combining ability.
The results of Johnson’s (2004) study agreed with those of Eathington et al.
(1997) who also concluded that molecular markers increased the accuracy of
determining the relative combining abilities of superior advanced generation
lines. Data generated from genotyping have reduced their limitations with SSR
markers and lately with SNP markers at a point in which currently the limiting
factor is accurate phenotyping.
One of the common decisions maize breeders frequently have to make is how
many S0 plants of an F2 population is an adequate sample. Breeders desire to have
an adequate sample that represents the s2G of the F2 population. Bauman (1981)
asked the question from a survey of 130 US corn breeders of how many S0 plants
are sampled from F2 populations to initiate inbred line development. A broad range
of responses were obtained, but the modal response was about 500 S0 plants per F2population. It is the breeders’ judgment based on previous experience, potency of
parental lines used in the crosses, nursery space available, and the specific goals of
line development for each cross relative sample size. There is no specific answer for
each breeder. But samples of 500 S0 plants per F2 population seem large. If 10,000
nursery rows are available, the breeders could sample 500, 200, or 100 individual S0plants from 20, 50, and 100 F2 populations, respectively. Based on indirect,
empirical data from quantitative genetic studies conducted to estimate components
of genetic variance and selection responses from recurrent selection studies, it
seems sample sizes of 150 to 200 should be adequate (Hallauer and Miranda,
1988). Marquez-Sanchez and Hallauer (1970a, b) estimated standard errors of s2Aand s2D estimates, and the point where further decreases in standard errors of the
estimates of components of s2A and s2D was attained was at sample sizes of 160 to
180 individuals. Breeders would need to make judgments whether crosses are
between inbred lines that have different origins or pedigrees or crosses are between
more closely related inbred lines; pedigree and molecular marker information
would indicate genetic divergence of the two parent inbred lines of the F2 popula-
tions (Williams and Hallauer, 2000). If more s2G expected, larger S0 plant samples
may be desirable to include the range of s2G in the F2 population, whereas s2G would
be less in more closely related lines (e.g., Table 12). Experience by maize breeders
58 A.R. Hallauer, M.J. Carena
who have had a long career in recycling elite inbred lines in crosses with other elite
lines for a specific target environment will have good judgment of the appropriate
sample sizes needed to develop inbred lines that are superior to the parental inbred
lines, whether 50, 100, 200, or 500 individuals. Because significant genetic
improvements in inbred lines and hybrids have been realized during the past 50
years with a relatively few elite inbred lines, greater precision will be needed to
determine the genetic worth of newer inbred lines because s2G may be reduced
(Hallauer, 2002). More precise information will be needed, such as use of molec-
ular markers to assist in choice of parents to cross and in selection among
progenies derived from the cross (Knapp, 1998; Johnson, 2004). Mathematical
models could also help in the probability of finding better parents once genes are
known from the maize genome sequence (Hammond and Carena, 2008).
7 Doubled Haploids
The potential use of doubled haploids has intrigued maize breeders because it
enables breeders to develop homozygous genotypes from heterozygous parents in
a single generation. It requires seven generations of self-pollination to develop
inbred lines from a heterogeneous F2 population with an expected inbreeding
coefficient of 0.992. Depending on resources available, such as off-season nur-
series, it may require 3–6 years to develop S7 lines with an inbreeding coefficient of
0.992. For mature, long-term breeding programs, the time-frame for developing
inbred lines is usually not a limiting factor. Selections within 50–100 F2 generations
are initiated each season, providing lines at different generations of inbreeding each
season. Effective selection for pest tolerance, heat and drought stress, maturity, ear
and plant type, grain yield, etc. can be accomplished during inbreeding. The more
general problem with the traditional methods of maize breeding is to determine the
genetic worth of the derived lines in hybrids. For new breeding programs, where
time is an important factor, haploid breeding methods are a possible alternative to
jump-start the program.
Chase (1949) reported the frequencies of haploids in a double-cross hybrid, its
two parental single-cross hybrids, and the four parental inbreds of the two single-
cross hybrids. The tester stocks carried the dominant allele for purple plumule (Pu),
whereas all the seed parents carried the recessive allele for this gene. The purple
marker was used to identify the haploids, which occurred spontaneously. Chase
(1949) classified 38,684 seedlings and 43 haploids were identified, an average
frequency across the seven seed parents of about 1:900 or 0.1%. Chase (1952)
continued his studies and suggested the use of haploid breeding as an alternative
method for developing maize inbred lines. Thompson (1954) compared the relative
combining abilities of lines developed from doubled haploids with lines developed
by the traditional methods of self-pollination. Both sets of lines were derived from
the same source (BSSS). The doubled haploid lines were a random sample of lines
with respect to combining ability. There were no differences between the means for
the two sets of testcrosses and the frequency distributions were similar. B67 and
Maize Breeding 59
B69 were inbred lines derived from haploids that were released for public use, but it
seems neither inbred line was used in hybrids. Goodsell (1961) and Kermicle
(1969) also suggested methods that identified haploids. Goodsell’s (1961) method
identified paternal haploids. Kermicle (1969) reported on use of the indeterminate
gametophyte (ig) factor that produced unusual effects in the embryo sack. The
method devised by Kermicle (1969) was more attractive because of a greater
frequency of haploids. Spitko et al. (2006) conducted extensive studies to determine
the aptitude of different source materials and methods to induce the frequency and
regeneration of haploids to develop new doubled haploid lines. From their studies,
they suggested that haploid regeneration was primarily an inherited trait in their
materials with a heterosis effect in the F1 progeny. Chase (1949) also reported that
the incidence of haploidy in a single-cross hybrid could be predicted by the
behavior of its component inbred lines, which also suggests that haploidy is a
heritable trait.
Snape (1989) discussed the possibilities of use of doubled haploids in plant
breeding. He indicated the technology has developed to the point that doubled
haploid lines can be produced in sufficient numbers to contribute directly to
breeding programs. Snape (1989) suggested the greatest advantage of the dou-
bled haploid systems is increasing the efficiency of selection for quantitative
traits. The efficiency of selection among doubled haploids occurs because the
additive genetic variance (s2A) among lines homozygous lines is twice the s2Aamong F2 plants, that is, 2s2A (Table 13). Snape (1989) also suggested that doubled
haploids can contribute to the efficiency of recurrent selection schemes used in
maize breeding. The doubled haploids would increase genetic variability among
progenies because additive genetic variance is twice the additive genetic variance
of the random mating population, and nonadditive genetic effects would not be a
hindrance in selection. But in maize breeding, nonadditive effects are important if
the germplasm resources are to contribute lines for use in hybrids (Table 5). For
those programs that are developing genetically broad-based populations themselves
for use by the producers the method may not have merit. Snape (1989) does
concede that a generation of haploidization and chromosome doubling between
cycles of selection would increase time for each cycle, which would reduce genetic
gain per season (Tables 2 and 3). Doubled haploid breeding does have one great
advantage over traditional methods of self-pollination of lines to homozygosity:
homozygous lines could be developed in one generation if the technology for
identifying haploids and doubling chromosome number permits having an adequate
number of inbred lines for evaluation in hybrids. The same methods would be
necessary in each heterotic group. The decision to conduct doubled haploid breed-
ing would be difficult for each breeding program. Similar to the comments for
genetic variation generated from use of tissue culture, the development of inbred
lines by the traditional methods of self-pollination is usually not a limiting factor.
The time spent in developing inbred lines by self-pollination is not wasted effort.
Selection among and within lines for traits, other than grain yield and root and stalk
strength, can be effective for more highly heritable traits that are required in modern
hybrids. As Thompson (1954) has shown, the doubled haploid lines are a random
60 A.R. Hallauer, M.J. Carena
sample for combining ability. The use of molecular markers might assist the
breeder in identifying doubled haploids that are superior for quantitative traits.
Otherwise, the doubled haploids would undergo initial testcross evaluation as
homozygous lines.
8 Hybrids
The only reason maize breeders isolate inbred lines is to develop parental inbred
lines for the production of hybrids. Inbred lines have been developed by single-seed
descent for genetic studies, but the genetic studies were related to obtaining
estimates of ID (Hallauer and Sears, 1973; Good and Hallauer, 1977), estimation
of genetic variability (Obilana and Hallauer, 1974), and what are designated as
recombinant inbred lines (RIs) for molecular genetic studies (Lee, 1995). It soon
became obvious to the maize breeders that it was easier to develop inbred lines than
to determine their relative worth in hybrids. Initially, breeders self-pollinated S0plants of open-pollinated cultivars and continued selfing with selection until lines
approximated homozygosity. At this time, crosses between inbred lines were made
and evaluated as double-cross hybrids. The main problem was that the possible
number of double-cross hybrids among a group of inbred lines became extremely
large. The number of possible double-cross hybrids among n lines is [n(n� 1)(n� 2)
(n � 3)]/8. If n = 10, there are 630 possible double-cross hybrids. It was found that
the inbred lines required testing in hybrids because the relations between inbred
lines and the hybrids were too poor to be of predictive value, both for the first-cycle
inbred lines (Jenkins, 1928) and for inbred lines derived from improved sources
(Gama and Hallauer, 1977). Jenkins and Brunson (1932) suggested use of the
testcross method to make an initial screening of inbred lines for their relative
combining with use of a common tester(s). Testcrosses were evaluated and
the inbred lines with above average combining ability were then tested as double
crosses. But the number of remaining inbred lines was often too great for testing as
double crosses. Jenkins (1934) tested a scheme where single-cross and testcross
data could be used to predict the better performing double crosses. Because of the
number of possible lines developed in breeding nurseries and the resources required
to self-pollinate until relative homozygous, Jenkins (1935) and Sprague (1946a)
proposed testing the lines in earlier generations of inbreeding to eliminate lines that
seem to have poorer combining ability. Jenkins (1935) concluded that the combin-
ing ability of a line was established early in the inbreeding process and remained
relatively stable in succeeding generations of inbreeding. Sprague and Tatum
(1942) partitioned the combining ability of inbred lines into general (GCA) and
specific (SCA) combining effects, with GCA as the average performance of lines,
due primarily additive genetic effects, and SCA the performance of specific crosses,
primarily due to nonadditive genetic effects. There were, however, some who
questioned the effectiveness of early testing (e.g., Richey, 1944). Because of the
genetic variability among and within lines during successive generations of
Maize Breeding 61
inbreeding, it was considered that early testing may eliminate lines that may have
different and better combining abilities as homozygous lines. This could happen.
But Jenkins (1935) and Sprague (1946a) never stated that a perfect correlation
between testcrosses made at earlier and more advanced inbreeding levels would
exist; they proposed only selection of those lines that exhibited above average
combining ability. Subsequent empirical data have supported the feasibility of early
testing. Recurrent selection methods use early testing in all instances (usually at the
S0 or S1 generation), and positive responses have been realized in all instances for
improvement of populations.
Protocols for the development of inbred lines and double-cross hybrids were
essentially standardized by 1945. There were two issues, however, that generated
vigorous debates among maize breeders: (1) efficiency of early testing to determine
the relative combining ability of lines; and (2) the best tester(s) to use for evaluation
of the combining ability of new lines. Two issues relative to early testing were
that the effects of selection during inbreeding may be negated and the large
number of experimental field plots that would be required to evaluate the early
inbred-generation lines. Selection during inbreeding process could be continued but
only among those lines that had above average combining ability. Breeders can
continue to practice visual selection among and within lines for desired plant types,
seed set, maturity, etc. that have relatively higher heritabilities. However, Bau-
man’s (1981) survey indicated that visual selection was inversely related to the
relative importance of traits, so that visual selection should not affect those lines
that had above average combining ability. Plot numbers required to evaluate a large
number of early generation testcrosses is a major concern. Bauman’s (1981) survey
showed the following results for testing at the different generations of inbreeding:
S1 (0%), S2 (18%), S3 (33%), S4 (27%), S5 (9%), and other (13%). Only 18% of the
maize breeders surveyed tested new lines earlier than S3 generations, 22% tested at
the S5 or later generations, and 60% tested new lines at the S3 and S5 inbreeding
generations, a compromise between early and later generation testing. Bauman
(1981) also reported there was at least a 50% discard of new lines from the S1 to S2,
S2 to S3, and S3 to S4 inbreeding generations. Maize breeders were obviously
practicing intense selection among the early inbreeding generations before
testcrossing (a 92% discard from S1 to S4 from Bauman’s survey). Bauman’s
(1981) survey of 130 maize breeders was conducted before refinements were
made in developing equipment to plant and harvest experimental field trials.
Rapid progress was made in developing data recorders on harvesters that could
be downloaded for rapid turn around of data analyses. Plots could be harvested and
data recorded in 25 seconds or less versus 10–15 min for hand-harvested plots.
Modern plot equipment has significantly reduced the concerns of plot numbers and
has favored early generation testing.
Theoretical and applied studies have been conducted to determine the relations
between inbred lines per se and their testcrosses and between inbred lines tested in
earlier inbreeding generations and their derived lines tested after further inbreeding.
A summary of studies that compared relation between inbred lines and their crosses
indicated that the average correlation for grain yield was 0.22 (Table 8.9, Hallauer
62 A.R. Hallauer, M.J. Carena
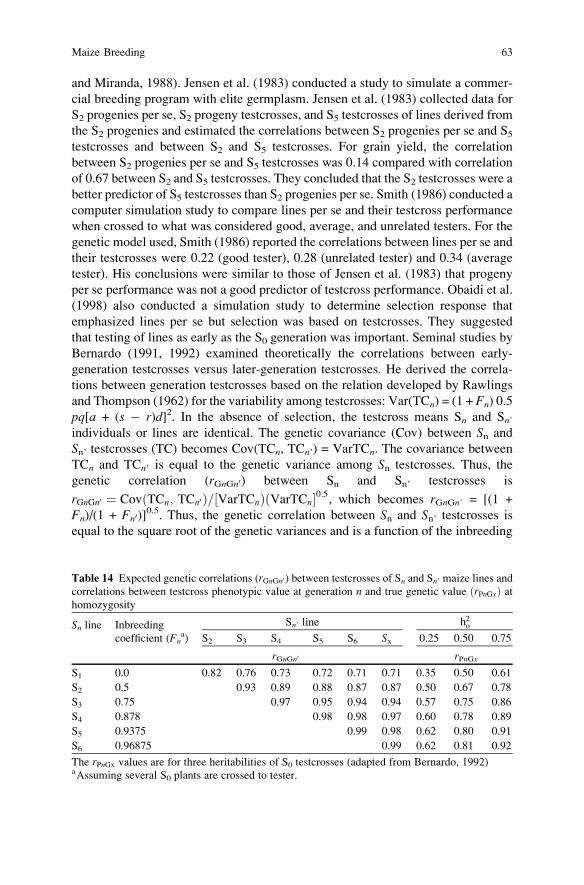
and Miranda, 1988). Jensen et al. (1983) conducted a study to simulate a commer-
cial breeding program with elite germplasm. Jensen et al. (1983) collected data for
S2 progenies per se, S2 progeny testcrosses, and S5 testcrosses of lines derived from
the S2 progenies and estimated the correlations between S2 progenies per se and S5testcrosses and between S2 and S5 testcrosses. For grain yield, the correlation
between S2 progenies per se and S5 testcrosses was 0.14 compared with correlation
of 0.67 between S2 and S5 testcrosses. They concluded that the S2 testcrosses were a
better predictor of S5 testcrosses than S2 progenies per se. Smith (1986) conducted a
computer simulation study to compare lines per se and their testcross performance
when crossed to what was considered good, average, and unrelated testers. For the
genetic model used, Smith (1986) reported the correlations between lines per se and
their testcrosses were 0.22 (good tester), 0.28 (unrelated tester) and 0.34 (average
tester). His conclusions were similar to those of Jensen et al. (1983) that progeny
per se performance was not a good predictor of testcross performance. Obaidi et al.
(1998) also conducted a simulation study to determine selection response that
emphasized lines per se but selection was based on testcrosses. They suggested
that testing of lines as early as the S0 generation was important. Seminal studies by
Bernardo (1991, 1992) examined theoretically the correlations between early-
generation testcrosses versus later-generation testcrosses. He derived the correla-
tions between generation testcrosses based on the relation developed by Rawlings
and Thompson (1962) for the variability among testcrosses: Var(TCn) = (1 + Fn) 0.5
pq[a + (s � r)d]2. In the absence of selection, the testcross means Sn and Sn’individuals or lines are identical. The genetic covariance (Cov) between Sn and
Sn’ testcrosses (TC) becomes Cov(TCn, TCn’) = VarTCn. The covariance between
TCn and TCn’ is equal to the genetic variance among Sn testcrosses. Thus, the
genetic correlation (rGnGn0) between Sn and Sn’ testcrosses is
rGnGn0 ¼ CovðTCn; TCn0 Þ=½VarTCnÞðVarTCn�0:5, which becomes rGnGn’ = [(1 +
Fn)/(1 + Fn0)]0.5. Thus, the genetic correlation between Sn and Sn’ testcrosses is
equal to the square root of the genetic variances and is a function of the inbreeding
Table 14 Expected genetic correlations (rGnGn0 ) between testcrosses of Sn and Sn’ maize lines and
correlations between testcross phenotypic value at generation n and true genetic value ðrPnGxÞ athomozygosity
Sn line Inbreeding Sn’ line h2o
coefficient (Fna) S2 S3 S4 S5 S6 Sx 0.25 0.50 0.75
rGnGn0 rPnGx
S1 0.0 0.82 0.76 0.73 0.72 0.71 0.71 0.35 0.50 0.61
S2 0.5 0.93 0.89 0.88 0.87 0.87 0.50 0.67 0.78
S3 0.75 0.97 0.95 0.94 0.94 0.57 0.75 0.86
S4 0.878 0.98 0.98 0.97 0.60 0.78 0.89
S5 0.9375 0.99 0.98 0.62 0.80 0.91
S6 0.96875 0.99 0.62 0.81 0.92
The rPnGx values are for three heritabilities of S0 testcrosses (adapted from Bernardo, 1992)aAssuming several S0 plants are crossed to tester.
Maize Breeding 63
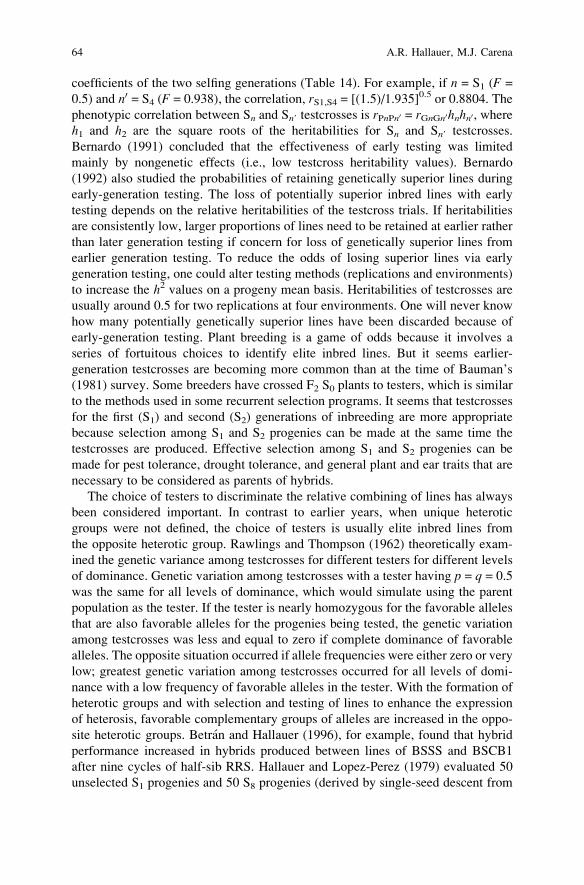
coefficients of the two selfing generations (Table 14). For example, if n = S1 (F =
0.5) and n0 = S4 (F = 0.938), the correlation, rS1,S4 = [(1.5)/1.935]0.5 or 0.8804. The
phenotypic correlation between Sn and Sn’ testcrosses is rPnPn0 = rGnGn0hnhn0, whereh1 and h2 are the square roots of the heritabilities for Sn and Sn’ testcrosses.
Bernardo (1991) concluded that the effectiveness of early testing was limited
mainly by nongenetic effects (i.e., low testcross heritability values). Bernardo
(1992) also studied the probabilities of retaining genetically superior lines during
early-generation testing. The loss of potentially superior inbred lines with early
testing depends on the relative heritabilities of the testcross trials. If heritabilities
are consistently low, larger proportions of lines need to be retained at earlier rather
than later generation testing if concern for loss of genetically superior lines from
earlier generation testing. To reduce the odds of losing superior lines via early
generation testing, one could alter testing methods (replications and environments)
to increase the h2 values on a progeny mean basis. Heritabilities of testcrosses are
usually around 0.5 for two replications at four environments. One will never know
how many potentially genetically superior lines have been discarded because of
early-generation testing. Plant breeding is a game of odds because it involves a
series of fortuitous choices to identify elite inbred lines. But it seems earlier-
generation testcrosses are becoming more common than at the time of Bauman’s
(1981) survey. Some breeders have crossed F2 S0 plants to testers, which is similar
to the methods used in some recurrent selection programs. It seems that testcrosses
for the first (S1) and second (S2) generations of inbreeding are more appropriate
because selection among S1 and S2 progenies can be made at the same time the
testcrosses are produced. Effective selection among S1 and S2 progenies can be
made for pest tolerance, drought tolerance, and general plant and ear traits that are
necessary to be considered as parents of hybrids.
The choice of testers to discriminate the relative combining of lines has always
been considered important. In contrast to earlier years, when unique heterotic
groups were not defined, the choice of testers is usually elite inbred lines from
the opposite heterotic group. Rawlings and Thompson (1962) theoretically exam-
ined the genetic variance among testcrosses for different testers for different levels
of dominance. Genetic variation among testcrosses with a tester having p = q = 0.5
was the same for all levels of dominance, which would simulate using the parent
population as the tester. If the tester is nearly homozygous for the favorable alleles
that are also favorable alleles for the progenies being tested, the genetic variation
among testcrosses was less and equal to zero if complete dominance of favorable
alleles. The opposite situation occurred if allele frequencies were either zero or very
low; greatest genetic variation among testcrosses occurred for all levels of domi-
nance with a low frequency of favorable alleles in the tester. With the formation of
heterotic groups and with selection and testing of lines to enhance the expression
of heterosis, favorable complementary groups of alleles are increased in the oppo-
site heterotic groups. Betran and Hallauer (1996), for example, found that hybrid
performance increased in hybrids produced between lines of BSSS and BSCB1
after nine cycles of half-sib RRS. Hallauer and Lopez-Perez (1979) evaluated 50
unselected S1 progenies and 50 S8 progenies (derived by single-seed descent from
64 A.R. Hallauer, M.J. Carena
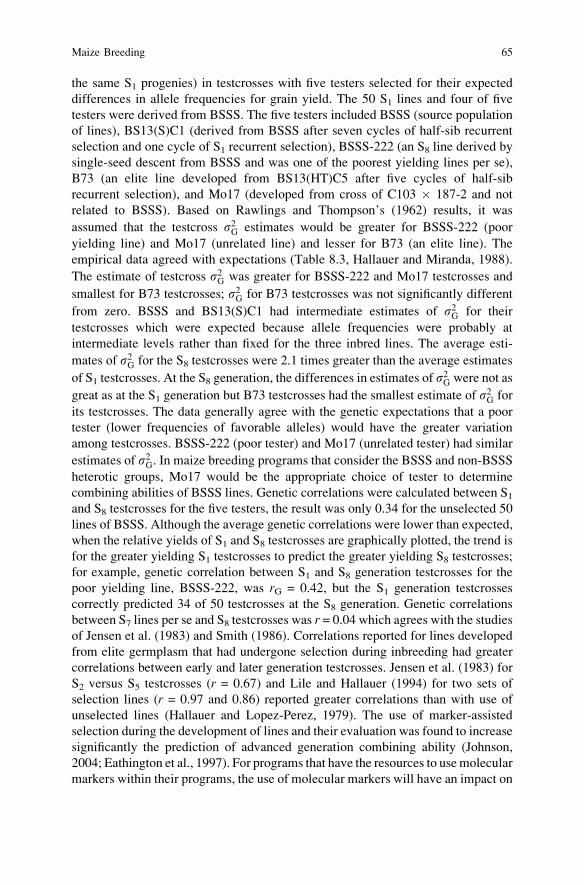
the same S1 progenies) in testcrosses with five testers selected for their expected
differences in allele frequencies for grain yield. The 50 S1 lines and four of five
testers were derived from BSSS. The five testers included BSSS (source population
of lines), BS13(S)C1 (derived from BSSS after seven cycles of half-sib recurrent
selection and one cycle of S1 recurrent selection), BSSS-222 (an S8 line derived by
single-seed descent from BSSS and was one of the poorest yielding lines per se),
B73 (an elite line developed from BS13(HT)C5 after five cycles of half-sib
recurrent selection), and Mo17 (developed from cross of C103 � 187-2 and not
related to BSSS). Based on Rawlings and Thompson’s (1962) results, it was
assumed that the testcross s2G estimates would be greater for BSSS-222 (poor
yielding line) and Mo17 (unrelated line) and lesser for B73 (an elite line). The
empirical data agreed with expectations (Table 8.3, Hallauer and Miranda, 1988).
The estimate of testcross s2G was greater for BSSS-222 and Mo17 testcrosses and
smallest for B73 testcrosses; s2G for B73 testcrosses was not significantly different
from zero. BSSS and BS13(S)C1 had intermediate estimates of s2G for their
testcrosses which were expected because allele frequencies were probably at
intermediate levels rather than fixed for the three inbred lines. The average esti-
mates of s2G for the S8 testcrosses were 2.1 times greater than the average estimates
of S1 testcrosses. At the S8 generation, the differences in estimates of s2G were not as
great as at the S1 generation but B73 testcrosses had the smallest estimate of s2G for
its testcrosses. The data generally agree with the genetic expectations that a poor
tester (lower frequencies of favorable alleles) would have the greater variation
among testcrosses. BSSS-222 (poor tester) and Mo17 (unrelated tester) had similar
estimates of s2G. In maize breeding programs that consider the BSSS and non-BSSS
heterotic groups, Mo17 would be the appropriate choice of tester to determine
combining abilities of BSSS lines. Genetic correlations were calculated between S1and S8 testcrosses for the five testers, the result was only 0.34 for the unselected 50
lines of BSSS. Although the average genetic correlations were lower than expected,
when the relative yields of S1 and S8 testcrosses are graphically plotted, the trend is
for the greater yielding S1 testcrosses to predict the greater yielding S8 testcrosses;
for example, genetic correlation between S1 and S8 generation testcrosses for the
poor yielding line, BSSS-222, was rG = 0.42, but the S1 generation testcrosses
correctly predicted 34 of 50 testcrosses at the S8 generation. Genetic correlations
between S7 lines per se and S8 testcrosses was r = 0.04 which agrees with the studies
of Jensen et al. (1983) and Smith (1986). Correlations reported for lines developed
from elite germplasm that had undergone selection during inbreeding had greater
correlations between early and later generation testcrosses. Jensen et al. (1983) for
S2 versus S5 testcrosses (r = 0.67) and Lile and Hallauer (1994) for two sets of
selection lines (r = 0.97 and 0.86) reported greater correlations than with use of
unselected lines (Hallauer and Lopez-Perez, 1979). The use of marker-assisted
selection during the development of lines and their evaluation was found to increase
significantly the prediction of advanced generation combining ability (Johnson,
2004; Eathington et al., 1997). For programs that have the resources to usemolecular
markers within their programs, the use of molecular markers will have an impact on
Maize Breeding 65
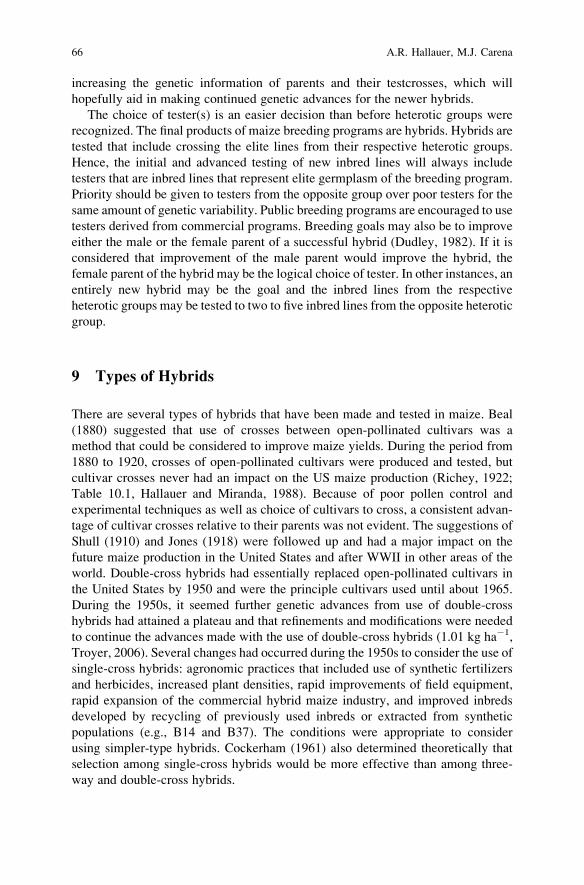
increasing the genetic information of parents and their testcrosses, which will
hopefully aid in making continued genetic advances for the newer hybrids.
The choice of tester(s) is an easier decision than before heterotic groups were
recognized. The final products of maize breeding programs are hybrids. Hybrids are
tested that include crossing the elite lines from their respective heterotic groups.
Hence, the initial and advanced testing of new inbred lines will always include
testers that are inbred lines that represent elite germplasm of the breeding program.
Priority should be given to testers from the opposite group over poor testers for the
same amount of genetic variability. Public breeding programs are encouraged to use
testers derived from commercial programs. Breeding goals may also be to improve
either the male or the female parent of a successful hybrid (Dudley, 1982). If it is
considered that improvement of the male parent would improve the hybrid, the
female parent of the hybrid may be the logical choice of tester. In other instances, an
entirely new hybrid may be the goal and the inbred lines from the respective
heterotic groups may be tested to two to five inbred lines from the opposite heterotic
group.
9 Types of Hybrids
There are several types of hybrids that have been made and tested in maize. Beal
(1880) suggested that use of crosses between open-pollinated cultivars was a
method that could be considered to improve maize yields. During the period from
1880 to 1920, crosses of open-pollinated cultivars were produced and tested, but
cultivar crosses never had an impact on the US maize production (Richey, 1922;
Table 10.1, Hallauer and Miranda, 1988). Because of poor pollen control and
experimental techniques as well as choice of cultivars to cross, a consistent advan-
tage of cultivar crosses relative to their parents was not evident. The suggestions of
Shull (1910) and Jones (1918) were followed up and had a major impact on the
future maize production in the United States and after WWII in other areas of the
world. Double-cross hybrids had essentially replaced open-pollinated cultivars in
the United States by 1950 and were the principle cultivars used until about 1965.
During the 1950s, it seemed further genetic advances from use of double-cross
hybrids had attained a plateau and that refinements and modifications were needed
to continue the advances made with the use of double-cross hybrids (1.01 kg ha�1,
Troyer, 2006). Several changes had occurred during the 1950s to consider the use of
single-cross hybrids: agronomic practices that included use of synthetic fertilizers
and herbicides, increased plant densities, rapid improvements of field equipment,
rapid expansion of the commercial hybrid maize industry, and improved inbreds
developed by recycling of previously used inbreds or extracted from synthetic
populations (e.g., B14 and B37). The conditions were appropriate to consider
using simpler-type hybrids. Cockerham (1961) also determined theoretically that
selection among single-cross hybrids would be more effective than among three-
way and double-cross hybrids.
66 A.R. Hallauer, M.J. Carena
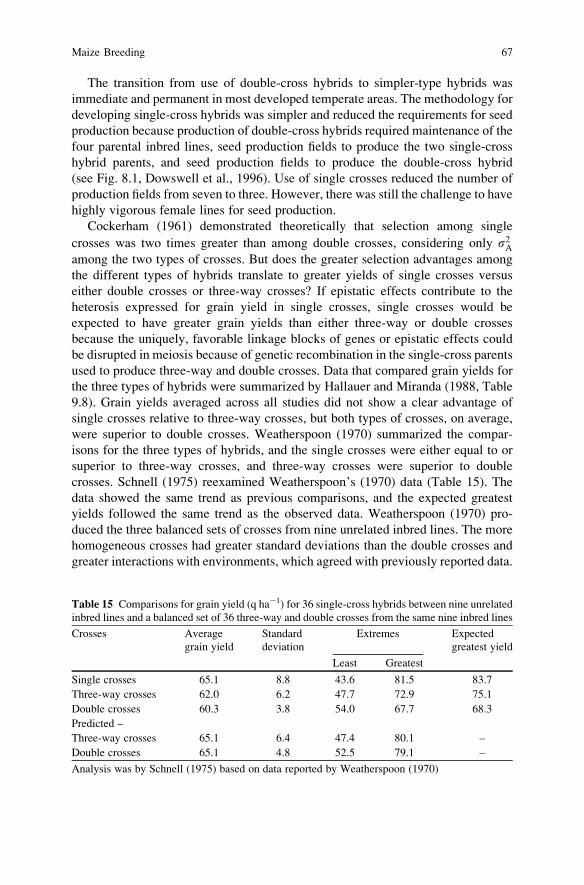
The transition from use of double-cross hybrids to simpler-type hybrids was
immediate and permanent in most developed temperate areas. The methodology for
developing single-cross hybrids was simpler and reduced the requirements for seed
production because production of double-cross hybrids required maintenance of the
four parental inbred lines, seed production fields to produce the two single-cross
hybrid parents, and seed production fields to produce the double-cross hybrid
(see Fig. 8.1, Dowswell et al., 1996). Use of single crosses reduced the number of
production fields from seven to three. However, there was still the challenge to have
highly vigorous female lines for seed production.
Cockerham (1961) demonstrated theoretically that selection among single
crosses was two times greater than among double crosses, considering only s2Aamong the two types of crosses. But does the greater selection advantages among
the different types of hybrids translate to greater yields of single crosses versus
either double crosses or three-way crosses? If epistatic effects contribute to the
heterosis expressed for grain yield in single crosses, single crosses would be
expected to have greater grain yields than either three-way or double crosses
because the uniquely, favorable linkage blocks of genes or epistatic effects could
be disrupted in meiosis because of genetic recombination in the single-cross parents
used to produce three-way and double crosses. Data that compared grain yields for
the three types of hybrids were summarized by Hallauer and Miranda (1988, Table
9.8). Grain yields averaged across all studies did not show a clear advantage of
single crosses relative to three-way crosses, but both types of crosses, on average,
were superior to double crosses. Weatherspoon (1970) summarized the compar-
isons for the three types of hybrids, and the single crosses were either equal to or
superior to three-way crosses, and three-way crosses were superior to double
crosses. Schnell (1975) reexamined Weatherspoon’s (1970) data (Table 15). The
data showed the same trend as previous comparisons, and the expected greatest
yields followed the same trend as the observed data. Weatherspoon (1970) pro-
duced the three balanced sets of crosses from nine unrelated inbred lines. The more
homogeneous crosses had greater standard deviations than the double crosses and
greater interactions with environments, which agreed with previously reported data.
Table 15 Comparisons for grain yield (q ha�1) for 36 single-cross hybrids between nine unrelated
inbred lines and a balanced set of 36 three-way and double crosses from the same nine inbred lines
Crosses Average
grain yield
Standard
deviation
Extremes Expected
greatest yield
Least Greatest
Single crosses 65.1 8.8 43.6 81.5 83.7
Three-way crosses 62.0 6.2 47.7 72.9 75.1
Double crosses 60.3 3.8 54.0 67.7 68.3
Predicted –
Three-way crosses 65.1 6.4 47.4 80.1 –
Double crosses 65.1 4.8 52.5 79.1 –
Analysis was by Schnell (1975) based on data reported by Weatherspoon (1970)
Maize Breeding 67
Although the single-cross hybrids tended to have greater interactions across envir-
onments, the stability of some single-cross hybrids was as good as the more
heterogeneous hybrids. Weatherspoon (1970) concluded that stability was under
genetic control and that more extensive testing would be required to identify those
single-cross hybrids that have good, stable performance across environments.
Average observed yields were 65.1, 62.0, and 60.3 for single, three-way, and double
crosses, respectively (Table 15). Based on estimates of standard deviations and
range for each cross, Schnell (1975) determined that the greatest expected
yield were 83.7 q ha�1 for a single cross, 75.1 q ha�1 for a three-way cross, and
68.3 q ha�1 for a double cross. His data clearly suggested that one could expect to
identify single crosses that had greater yields than double crosses. Weatherspoon
(1970) and Schnell (1975) suggested that the greater yield of single-cross and three-
way hybrids was because of greater use of dominance and epistatic effects. Al-
though costs of seed production for single-cross hybrids may be three to five times
(or more) greater than production of double-cross hybrids, seed costs have not
restricted the rapid acceptance and use of single-cross hybrids in major temperate
maize producing areas. Greater uniformity, improved standability, and improved
yields of single-cross hybrids negated the extra seed costs (Fig. 1). In other maize
growing areas of the world, seed costs are a concern and hybrids that can be
produced at lower costs are more popular (Table 8.2, Dowswell et al., 1996; Carena
and Wicks III, 2006).
10 Heterotic Groups
The recognition of heterotic groups simplified decisions relative to choices of
testers and crosses to test between newer inbred lines. The concept of heterotic
groups is different from the one for heterotic patterns. Heterotic patterns are crosses
between known genotypes that express a high level of heterosis (Carena and
Hallauer, 2001b). They became established by relating the heterosis of crosses
with the origin of the parents included in the crosses (Hallauer et al., 1988).
Heterotic groups were determined empirically; they were not identified by either
theoretical or computer simulation studies. Heterotic groups include germplasm
sources that when crossed with each other produce consistently better crosses than
when crosses are made within heterotic groups. How did the heterotic groups
evolve? There is no specific answer because each heterotic group evolved over
time from the parental germplasm in its formation, selection goals for introduction
of new germplasm, and, finally, how productive was the germplasm within hetero-
tic groups. Presently, the heterotic groups of BSSS and non-BSSS are frequently
used as a base of reference (Mikel and Dudley, 2006). But BSSS was not developed
initially as a heterotic group from non-BSSS materials, but to develop source
materials with greater stalk strength (Hallauer et al., 1983). The frequently cited
heterotic groups of the US Corn Belt include Reid Yellow Dent and Lancaster Sure
Crop. Reid Yellow Dent was developed in central Illinois whereas Lancaster Sure
68 A.R. Hallauer, M.J. Carena
Crop was developed in southeastern Pennsylvania (Wallace and Brown, 1988).
Both were open-pollinated cultivars that were synthesized from different germ-
plasm, the originators had different goals in developing them, environments were
different where they originated, and both became widely known cultivars. Because
of their origins, differences in frequencies of alleles for many loci would be
expected. Falconer (1960) demonstrated that the expression of heterosis was
dependent on nonadditive genetic effects, and that the magnitude of heterosis was
dependent on the differences in allele frequencies. Hence, it seems reasonable to
expect greater differences in allele frequencies between Lancaster Sure Crop and
Reid Yellow Dent than differences between local cultivars in their respective areas.
The same comments are equally valid to other proposed heterotic patterns, such as
Leaming � Midland (Kauffmann et al., 1982; Carena and Hallauer, 2001b) as well
as BS21 � CGSS, BS21 � CGL, BS21 � NDSAB, and BS22 � Leaming (Carena,
2005a, b; Melani and Carena, 2005). Geographical isolation developed cultivars
with different allele frequencies. In addition, selection has caused cultivars to differ
in allelic frequencies as well at a point where intra-population recurrent selection
methods have increased heterosis in as much as RRS programs.
Extensive testing of inbred lines from different source populations showed
trends how inbred lines from different populations reacted in crosses. G. F. Sprague
observed the Reid Yellow Dent and Lancaster Sure Crop heterotic pattern while
preparing the 1939 and 1940 annual reports, based on data from A. A. Bryan
(p. 537, Troyer, 2006). Double-cross hybrids that were produced from single
crosses whose parents were from the same source tended to have better yields.
Eckhardt and Bryan (1940) reported that the greatest yielding double crosses where
two parental sources (A and B) were involved were those in which the two lines
from cultivar A was used as one parent in the double-cross hybrid and two lines
from cultivar B used as the second parent; that is, (A � A) � (B � B) was greater
yielding than (A� B)� (A� B). They also found that if early (E) and late (L) lines
were used as parents that (E � E) � (L � L) double crosses were more uniform for
traits associated with maturity than (E � L) � (E � L) double crosses.
The concept of heterotic groups for breeding purposes was recognized by the 9th
Corn Improvement Conference of the North Central Region of the United States.
Stringfield (1947) suggested that grouping of inbred lines should be emphasized for
the improvement of lines (i.e., recycling of lines) within lines of the same heterotic
group. Initially, the inbred lines were more or less assigned randomly to the two
breeding groups. Later, assignment of inbred lines to the breeding groups was based
on the origin of the lines, probably because of the data collected by A. A. Bryan and
the report of Eckhardt and Bryan (1940). The grouping of inbred lines was
primarily based on whether they were of Reid Yellow Dent origin and non-Reid
Yellow Dent origin. Subsequent breeding plans emphasized recycling of inbred
lines within the two heterotic groups. Heterotic groups are common features within
breeding programs for genetic improvement of elite lines because breeders desire to
maintain favorable genetic combinations that enhance heterosis. Intensive breeding
efforts have continued, but the US Corn Belt heterotic groups have evolved to be
designated as Iowa Stiff Stalk Synthetic (primarily Reid Yellow Dent in origin) and
Maize Breeding 69
non-Iowa Stiff Stalk Synthestic (Mikel and Dudley, 2006). Assignment or classifi-
cation of inbred lines to heterotic groups has been based primarily on the pedigrees
of the inbred lines. Molecular marker data also have proven to be very effective for
determining the genotypes of inbred lines and their relative relations to other lines
within heterotic groups (e.g., Smith, 1988; Smith et al., 1985; Smith and Smith,
1991; Melchinger et al., 1991; Gethi et al., 2002; and many others). The use of
molecular markers also can differentiate the genetic distances among inbred lines
within heterotic groups more precisely than pedigree information, which is useful
for making planned crosses for breeding purposes. Attemps for predicting hybrid
performance with molecular marker, testcross, and diallel data are still under way
(Barata and Carena, 2006). However, more research is needed across genotypes and
environments.
Heterotic groups were identified and developed by maize breeders (Hallauer
et al., 1988). There are heterotic groups broadly defined, but more specific heterotic
groups (e.g. subgroups) are available within large breeding programs for specific
families of inbred lines. They would be more narrowly defined genetically, but they
involve inbred lines that have been very important as parental inbred lines of
successful, widely grown hybrids. More extensive discussion of heterotic groups
was given by Hallauer et al. (1988) and Coors and Pandey (1999) for temperate
regions, and Dowswell et al. (1996) and Goodman (1985) for tropical and subtropi-
cal regions and in developing countries.
11 Heterosis
The term heterosis is more widely associated with maize than any other important
crop species. Because of the success in implementing the concepts of Shull (1910)
and Jones (1918) developed in the public sector, hybrid maize has been recognized
worldwide. The genetic basis of heterosis has remained elusive with theories
advanced to explain the phenomenon, including interaction of dominant favorable
alleles, intra-allelic interactions (overdominance), inter-allelic interactions (epista-
sis), complementary action of linked genes (pseudo-overdominance), and the
nongenetic physiologic stimulation (Hallauer and Miranda, 1988; Richey, 1950).
The significance of heterosis and its genetic basis have received extensive discus-
sion at two symposia (Gowen, 1952; Coors and Pandey, 1999). The expression of
heterosis in crosses has been observed for more than 200 years, but the early
hybridizers were interested how parental traits were expressed in crosses and if
the traits were recovered in the offspring of the crosses (Goldman, 1999). Their
interests were more scientific and not to develop cultivars that exploited heterosis
for commercial use. When the techniques and technology to produce adequate seed
of double-cross hybrids for use by the producers were available, hybrid maize
became a reality and was considered one of the greatest plant breeding achieve-
ments of the twentieth century. Heterosis was exploited to the fullest extent and a
very competitive commercial hybrid seed industry developed to meet the demand.
70 A.R. Hallauer, M.J. Carena
The success of hybrid maize encouraged research in other fields as well as other
horticultural, and forestry crops (Coors and Pandey, 1999).
Heterosis has been exploited to the fullest extent possible, but definitive evi-
dence for the genetic basis of heterosis has been elusive. It is agreed that allelic
interactions are operative; intra-allelic, inter-allelic, and probably both are equally
important. The first heterosis conference emphasized maize with the main topic of
dominance of favorable alleles versus overdominance (Gowen, 1952). The second
heterosis conference of the 1990s was more extensive and discussed a greater array
of topics, including the heterosis observed in different crop species, molecular
techniques to study expression of heterosis, and the possible importance of epista-
sis. Duvick (1999) presented a summary of data for maize hybrids grown from 1930
to 1980. He concluded that heterosis has an important role in maize hybrid yields,
heterosis has increased in absolute amounts but percentage of heterosis decreased
because inbred line yields have increased (results of recycling inbred lines), and
that heterosis will increase in smaller increments in the future because of greater
rates of improvement for inbred lines. The experimental data confirms field obser-
vations. First cycle inbred lines are difficult to maintain because of poor seed yields
relative to twenty-first century inbred lines (Notes: In 2004, a few inbred lines
yielded more than 62.5 q ha�1 in a replicated trial at Ames, IA; in 2005, the top two
NDSU lines yielded 65.0 and 62.0 q ha�1 in a replicated trial at Fargo and
Casselton, ND with an average yield of 33.0 q ha�1 for the whole experiment
including five commercial lines that were lower yielding than these NDSU lines).
The trends will continue. Inbred lines will continue to be improved for biotic
and abiotic stresses by both traditional breeding methods and information from
molecular genetics.
An explicit genetic basis of the expression of heterosis for each hybrid is
probably not realistic. Each single-cross hybrid is a unique cross between two
elite inbred lines, and the cross represents the additive genetic effects of each
parent, additive � additive epistatic effects of each parent, interaction effects of
the alleles of both parents as well as the epistatic effects that include dominance,
which suggests a very complex genetic system. And the relative importance of each
type of genetic effects also will be different for each hybrid. Widely grown single-
cross hybrids, such as WF9 � C103, A632 � A619, and B73 � Mo17, included
different parental inbreds that were derived from different source germplasm by
different breeding methods. Each of the parental inbreds was also a progenitor of
recycled lines, suggesting that each line contributed important additive genetic
effects to their derived progenies. Each of the three single crosses had one parent
from the Reid Yellow Dent heterotic group and one parent primarily from the
Lancaster Sure Crop heterotic group. Hence, in addition to the genetic effects, the
gene frequencies of favorable alleles would be different to magnify the expression
of heterosis. The level of expression is not predictable because of allele interac-
tions, similar to the estimates of SCA. Extensive testing is conducted to identify
those crosses that have the unique combination of genetic effects and allele
frequencies. Molecular markers have been effective to profile inbred lines and
often but not always assign to appropriate heterotic groups, but, at this time,
Maize Breeding 71
molecular genetics is not able to predict the final hybrid. The ultimate selections
depend on replicated field trials to determine which cross has the combination of
genetic effects that have consistent, high performance under the environmental
effects where tested. Discussions on topics related to heterosis were given by
Hallauer and Miranda (1988), Hallauer et al. (1988), Coors and Pandey (1999),
and Troyer (1999, 2006).
12 Stability of Cultivars
Consistent and reliable performance across locations and years (environments) is
highly desirable for an organization that releases, recommends, and promotes the
sale of cultivars for use by the producers. The survival of an organization that relies
on seed sales needs to have a satisfied clientele. Genotype by environment interac-
tions are common occurrences in plant breeding. At some point, plant breeders will
need to evaluate inbred lines to determine their breeding values; that is, determine
the relative proportion of the measured phenotypic (P) expression that is due to
genetic (G) and environmental (E) effects. If the genetic (G) and environmental (E)
effects are additive (P = G + E) we can separate the two sources of variability that
affect the phenotypic expression of traits. Cultivars are usually developed for
specified target environments, which may be either narrowly defined geographi-
cally (e.g., State of Iowa or State of North Dakota), by soil type (Clarion-Webster
soil association or Fargo Vertic-Haplaquolls), by maturity (e.g., 700–800 maturity
group or 100–300 maturity group), by latitude (e.g., 37–41� north latitude or 45–49�
north latitude), or more broadly defined environments such as the northern US Corn
Belt, central US Corn Belt, southeastern United States, tropical areas with acid
soils, etc. A common occurrence is that the phenotypic measurements of the same
cultivars vary among environments either in rank or relative magnitude; that is, they
interact among environments (GE) such that P = G + E + (GE). If GE is serious,
breeders need to investigate causes to determine possible factors that cause GE. It
could be because of different soil types, variation within experimental areas,
rainfall patterns, irrigated versus nonirrigated, etc. Choices or changes in experi-
mental designs and analyses may be appropriate when large number of entries is
included and breeders desire to make head-to-head comparisons. With correct
experimental designs and analyses, the variation among the measured phenotypes
(s2P) can be partitioned as s2P ¼ s2G þ s2E þ s2GE. This additive expression can be
used to estimate either heritability (h2) or repeatability (r2) of cultivars on a progeny
mean as h2 ðor r2Þ ¼ s2G =½s2 =reþ s2GE =eþ s2G�. The h2 or r2 depends on the
source of the cultivars being tested. Usually, a group of selected testcrosses or
hybrids are evaluated and r2 would be the appropriate parameter. For a recurrent
selection program where all the progenies are an unselected sample of a specific
population, estimates of h2 would be appropriate. If theG� E tests significant in the
ANOVA, the cultivars interacted with environments, but the significance of G � Edoes not indicate which cultivar interacted or the relative size of the interactions
72 A.R. Hallauer, M.J. Carena
among cultivars. It is of interest to determine cultivar stability across environments,
or how individual cultivars perform across environments without knowing the
specific environmental effects causing G � E. Methods have been suggested to
estimate parameters for individual cultivar response to a series of environments.
Stability of genotypes was examined relative to heterozygosity and heterogene-
ity of genotypes in terms of homeostasis and magnitude of interactions with
environments (Adams and Shank, 1959; Shank and Adams, 1960). Generally, it
was found that the more heterozygous and/or heterogeneous genotypes had greater
homeostasis and less interactions with environments (Sprague and Federer, 1951).
Plaisted and Peterson (1959) partitioned the G� E source of variation to provide an
estimate of G � E for each genotype. The genotype with the lowest value was
considered to have the best stability. They considered environments random effects
and cultivars as fixed effects so relative estimates of G � E were for the specific set
of cultivars (Model I). For this method there were n(n �1)/2 ANOVAs and an
estimate of s2GE for each cultivar.
Findlay and Wilkinson (1963) developed an analysis to determine the relative
adaptation of a group of cultivars to include in plant breeding programs. The
analysis was based on a regression of cultivars (dependent variable) on environment
means (independent variable), where the environment means were determined by
the mean of all cultivars grown at each environment. Environments were arranged
from the poorest to the best for the regression analysis. The estimated regression
value (b) of each cultivar on the environment means was used as a measure of
stability. A regression value of b = 0 indicates that cultivar had stable performance
over the series of environments the cultivars were tested. A stable cultivar with
b = 0 would have consistent, say yield, across all environments, but the cultivars
could have either a low mean or high mean across environments. The cultivar with
the highest mean and b = 0 would be desirable. Eberhart and Russell (1966)
independently developed a similar regression analysis to determine the stability
in performance of cultivars across a series of environments. The regression model
was the same as the one used by Findlay and Wilkinson (1963), but they extended
their model to include estimates of deviations from regression (s2d) for each cultivaras well as estimates of regression coefficients. With calculations of the deviations
about regression for each cultivar, Eberhart and Russell (1966) used the following
interpretations of the two estimated parameters for each cultivar: b is a measure of
response of cultivars to changes (poorest to the best) in environments; and s2d is a
measure of stability of cultivars across environments. With Eberhart and Russell
(1966) analysis, three parameters are available to characterize each cultivar: mean
(X) across environments, response to changes in environment (b), and s2d a measure
of stability.
Freeman and Perkins (1971) had some questions relative to the validity of the
regression analyses suggested by Findlay and Wilkinson (1963) and Eberhart and
Russell (1966). The concern was because cultivar means regressed on environments
were correlated with the environmental index (independent variable); that is, the
cultivar mean was included in the environmental index with the cultivar regressed
Maize Breeding 73
on environmental index. They suggested the cultivar mean should be excluded from
the environmental index before conducting regression analysis for the cultivar. An
alternative was to include a set of check cultivars in each environment and use the
check means to construct the environmental index. Practical considerations would
need to be considered. Would the inclusion of 10 checks provide better estimates of
environment means than the 100 cultivars being tested? In maize breeding 50–100
(and more) cultivars are commonly included in experiments. Use of an adequate
number of checks to estimate environment means would reduce the number of
cultivars included. Compromises would be needed. It seems that if 50–100 experi-
mental cultivars are included, that the environmental means would be estimated
with greater precision and the mean of each cultivar will have minimum impact on
the overall environment means. Greater number of environments probably is more
important to determine responses of each cultivar for different environments.
Wricke (1962) suggested the ecovalence analysis to determine stability of geno-
types, which is similar to the method suggested by Weatherspoon (1970) where
Xij � Xi + Xj + X estimated for each cultivar (Xij) which would be an effect from the
marginal means for cultivars (Xi) and environments (Xj). Wricke (1962) squared the
effects, whereas Weatherspoon (1970) did not. Weatherspoon concluded that culti-
var and heterogeneity contributed to stability of performance. Although there are
acknowledged statistical deficiencies of the regression analyses, the Eberhart and
Russell (1966) analysis has been found useful because of its simplicity and inter-
pretations of the regression coefficients and deviations from regression parameters.
13 Selection Indices
New cultivars have been screened with multistage and multitrait selection of
economically important traits under certain breeding goals across numerous envir-
onments. Plant breeding always includes selection for multiple traits either during
inbreeding and selection or during evaluation trials. The art of plant breeding for
traits that are highly heritable can be successful but usually there are multiple traits
that need attention. The mental matrix may not be consistent from day-to-day or
year-to-year to give proper weights to different traits. Objective selection becomes
more difficult as the number of traits increases and/or the traits have a more
complex inheritance. Maize breeders need more objective means to be more
consistent for evaluating differences among cultivars. Objective analyses also
reduce possible biases individuals may inadvertently use for selecting among
different groups of materials. Different selection indices have been suggested to
assist maize breeders for the simultaneous consideration of all traits that were
considered important in developing cultivars. Smith (1936) proposed use of selec-
tion indices in plant breeding, and several modifications and alternative types of
selection indices have been proposed since the original suggestion by Smith (1936).
The basic feature of all selection indices is a linear function of phenotypic values
for the different traits. Observed values for each trait are weighted in some manner
74 A.R. Hallauer, M.J. Carena
to provide a composite evaluation of the genotypic values for a series of cultivars.
The genotypic value of a particular cultivar is the average value when the cultivar is
tested in a large number of environments. The general features of a selection index
(I) can be described as I = b1P1 + b2P2 + . . . bnPn, where P1 is the observed
phenotypic value of the ith trait, and bi is the weight assigned to the ith trait.
Construction of the Smith (1936) and similar indices is rather complex because
estimates of variances and covariances and economic weights are required. It is not
feasible in many instances to determine the variances and covariances of traits if
several populations are under selection and different populations are under selec-
tion in succeeding generations. Also, because estimates of variances and covar-
iances are dependent on allele frequencies, estimates for one population may not be
appropriate for other populations and not appropriate if selection significantly
changes allele frequencies within the same population. Baker (1986) has provided
a comprehensive discussion on the theory, the purpose, construction of different
selection indices, and their relative efficiencies.
Selection indices provide an objective method for determining the relative
merits of a series of cultivars. To be practical, but yet useful, maize breeders need
simpler selection indices that use data acquired from their evaluation trials to assist
them when a large number of cultivars are evaluated. Independent culling levels can
be used, but if 7–17 traits are measured and considered important for the success of
a cultivar, then other methods are considered. Simplicity is useful provided the
indices can provide an objective basis for differentiating among the cultivars being
tested.
Elston (1963) proposed the multiplicative index. The multiplicative index is
sometimes referred to as a weight-free index because it does not require the use of
index weights or economic weights. General form of the multiplicative index is
I ¼ ðX1 � K1ÞðX2 � K2Þ . . . ðXn � KnÞ, where the Ki is the minimum specified
value of the ith trait. The Ki values are chosen by the breeder and could vary
among experiments depending on the quality of data and the relative importance of
traits for different types of cultivars under test. In addition to being weight-free
index, the multiplicative index does not require estimates of genetic and phenotypic
variances and covariances. Because the multiplicative index is a curvilinear index,
it is not available to predict genetic gains. Baker (1974), however, reported that the
multiplicative index can be approximated for use as a linear index, where the
weights are the reciprocals of the phenotypic standard deviations (sP) of the traitsincluded in the index. The choice of the Ki values will depend on the emphasis the
breeder gives to each trait. If greater emphasis is to be given to yield, the K value
may be set to two standard errors above the mean for all cultivars, where K values
for the other traits may be the overall mean. K values can be adjusted after initial
cycles of selection if changes in trait expression occur because of past selection
(later maturity, reduced stalk lodging, disease pressure, etc.)
Mulamba and Mock (1978) suggested the use of the rank-summation index to
make selections among cultivars. The rank-summation index basically involves
ranking each of the cultivars (1 to n) for each of the traits and calculating the index
Maize Breeding 75
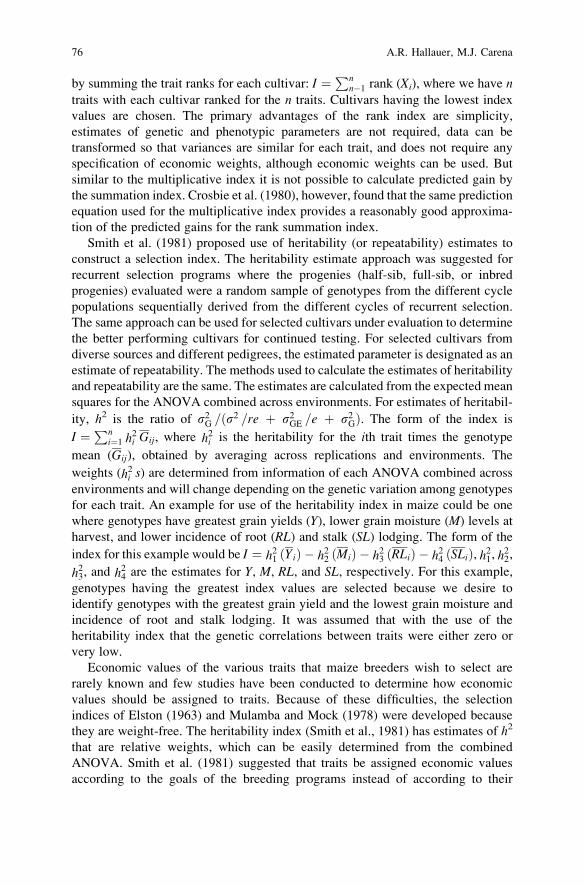
by summing the trait ranks for each cultivar: I ¼ Pnn�1 rank (Xi), where we have n
traits with each cultivar ranked for the n traits. Cultivars having the lowest index
values are chosen. The primary advantages of the rank index are simplicity,
estimates of genetic and phenotypic parameters are not required, data can be
transformed so that variances are similar for each trait, and does not require any
specification of economic weights, although economic weights can be used. But
similar to the multiplicative index it is not possible to calculate predicted gain by
the summation index. Crosbie et al. (1980), however, found that the same prediction
equation used for the multiplicative index provides a reasonably good approxima-
tion of the predicted gains for the rank summation index.
Smith et al. (1981) proposed use of heritability (or repeatability) estimates to
construct a selection index. The heritability estimate approach was suggested for
recurrent selection programs where the progenies (half-sib, full-sib, or inbred
progenies) evaluated were a random sample of genotypes from the different cycle
populations sequentially derived from the different cycles of recurrent selection.
The same approach can be used for selected cultivars under evaluation to determine
the better performing cultivars for continued testing. For selected cultivars from
diverse sources and different pedigrees, the estimated parameter is designated as an
estimate of repeatability. The methods used to calculate the estimates of heritability
and repeatability are the same. The estimates are calculated from the expected mean
squares for the ANOVA combined across environments. For estimates of heritabil-
ity, h2 is the ratio of s2G =ðs2 =re þ s2GE =e þ s2GÞ. The form of the index is
I ¼ Pni¼1 h
2i Gij, where h2i is the heritability for the ith trait times the genotype
mean (Gij), obtained by averaging across replications and environments. The
weights (h2i s) are determined from information of each ANOVA combined across
environments and will change depending on the genetic variation among genotypes
for each trait. An example for use of the heritability index in maize could be one
where genotypes have greatest grain yields (Y), lower grain moisture (M) levels at
harvest, and lower incidence of root (RL) and stalk (SL) lodging. The form of the
index for this example would be I ¼ h21 ðYiÞ � h22 ðMiÞ � h23 ðRLiÞ � h24 ðSLiÞ, h21, h22,h23, and h24 are the estimates for Y, M, RL, and SL, respectively. For this example,
genotypes having the greatest index values are selected because we desire to
identify genotypes with the greatest grain yield and the lowest grain moisture and
incidence of root and stalk lodging. It was assumed that with the use of the
heritability index that the genetic correlations between traits were either zero or
very low.
Economic values of the various traits that maize breeders wish to select are
rarely known and few studies have been conducted to determine how economic
values should be assigned to traits. Because of these difficulties, the selection
indices of Elston (1963) and Mulamba and Mock (1978) were developed because
they are weight-free. The heritability index (Smith et al., 1981) has estimates of h2
that are relative weights, which can be easily determined from the combined
ANOVA. Smith et al. (1981) suggested that traits be assigned economic values
according to the goals of the breeding programs instead of according to their
76 A.R. Hallauer, M.J. Carena
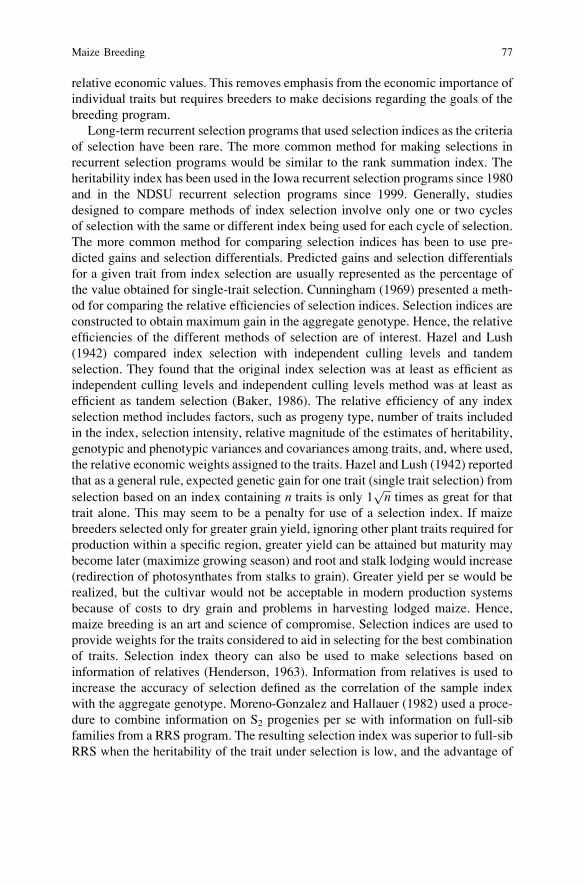
relative economic values. This removes emphasis from the economic importance of
individual traits but requires breeders to make decisions regarding the goals of the
breeding program.
Long-term recurrent selection programs that used selection indices as the criteria
of selection have been rare. The more common method for making selections in
recurrent selection programs would be similar to the rank summation index. The
heritability index has been used in the Iowa recurrent selection programs since 1980
and in the NDSU recurrent selection programs since 1999. Generally, studies
designed to compare methods of index selection involve only one or two cycles
of selection with the same or different index being used for each cycle of selection.
The more common method for comparing selection indices has been to use pre-
dicted gains and selection differentials. Predicted gains and selection differentials
for a given trait from index selection are usually represented as the percentage of
the value obtained for single-trait selection. Cunningham (1969) presented a meth-
od for comparing the relative efficiencies of selection indices. Selection indices are
constructed to obtain maximum gain in the aggregate genotype. Hence, the relative
efficiencies of the different methods of selection are of interest. Hazel and Lush
(1942) compared index selection with independent culling levels and tandem
selection. They found that the original index selection was at least as efficient as
independent culling levels and independent culling levels method was at least as
efficient as tandem selection (Baker, 1986). The relative efficiency of any index
selection method includes factors, such as progeny type, number of traits included
in the index, selection intensity, relative magnitude of the estimates of heritability,
genotypic and phenotypic variances and covariances among traits, and, where used,
the relative economic weights assigned to the traits. Hazel and Lush (1942) reported
that as a general rule, expected genetic gain for one trait (single trait selection) from
selection based on an index containing n traits is only 1ffiffiffin
ptimes as great for that
trait alone. This may seem to be a penalty for use of a selection index. If maize
breeders selected only for greater grain yield, ignoring other plant traits required for
production within a specific region, greater yield can be attained but maturity may
become later (maximize growing season) and root and stalk lodging would increase
(redirection of photosynthates from stalks to grain). Greater yield per se would be
realized, but the cultivar would not be acceptable in modern production systems
because of costs to dry grain and problems in harvesting lodged maize. Hence,
maize breeding is an art and science of compromise. Selection indices are used to
provide weights for the traits considered to aid in selecting for the best combination
of traits. Selection index theory can also be used to make selections based on
information of relatives (Henderson, 1963). Information from relatives is used to
increase the accuracy of selection defined as the correlation of the sample index
with the aggregate genotype. Moreno-Gonzalez and Hallauer (1982) used a proce-
dure to combine information on S2 progenies per se with information on full-sib
families from a RRS program. The resulting selection index was superior to full-sib
RRS when the heritability of the trait under selection is low, and the advantage of
Maize Breeding 77
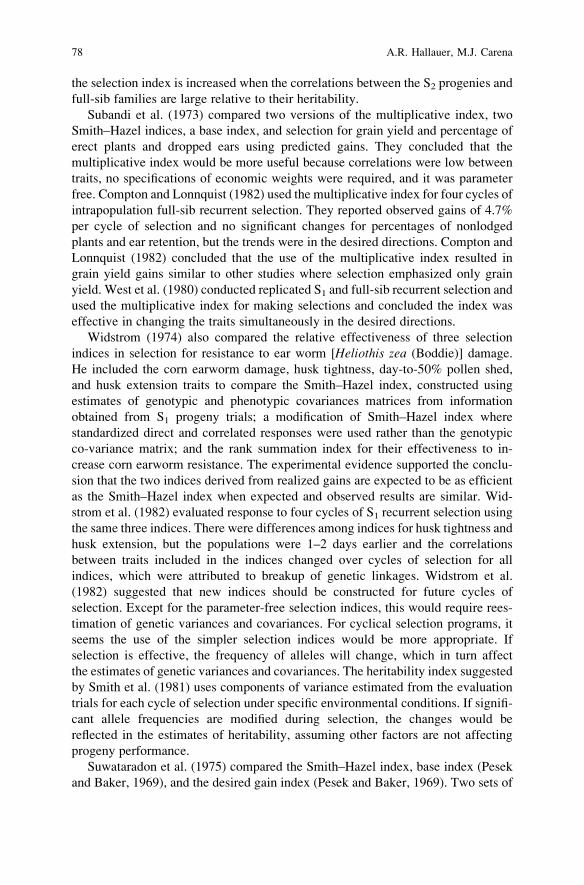
the selection index is increased when the correlations between the S2 progenies and
full-sib families are large relative to their heritability.
Subandi et al. (1973) compared two versions of the multiplicative index, two
Smith–Hazel indices, a base index, and selection for grain yield and percentage of
erect plants and dropped ears using predicted gains. They concluded that the
multiplicative index would be more useful because correlations were low between
traits, no specifications of economic weights were required, and it was parameter
free. Compton and Lonnquist (1982) used the multiplicative index for four cycles of
intrapopulation full-sib recurrent selection. They reported observed gains of 4.7%
per cycle of selection and no significant changes for percentages of nonlodged
plants and ear retention, but the trends were in the desired directions. Compton and
Lonnquist (1982) concluded that the use of the multiplicative index resulted in
grain yield gains similar to other studies where selection emphasized only grain
yield. West et al. (1980) conducted replicated S1 and full-sib recurrent selection and
used the multiplicative index for making selections and concluded the index was
effective in changing the traits simultaneously in the desired directions.
Widstrom (1974) also compared the relative effectiveness of three selection
indices in selection for resistance to ear worm [Heliothis zea (Boddie)] damage.
He included the corn earworm damage, husk tightness, day-to-50% pollen shed,
and husk extension traits to compare the Smith–Hazel index, constructed using
estimates of genotypic and phenotypic covariances matrices from information
obtained from S1 progeny trials; a modification of Smith–Hazel index where
standardized direct and correlated responses were used rather than the genotypic
co-variance matrix; and the rank summation index for their effectiveness to in-
crease corn earworm resistance. The experimental evidence supported the conclu-
sion that the two indices derived from realized gains are expected to be as efficient
as the Smith–Hazel index when expected and observed results are similar. Wid-
strom et al. (1982) evaluated response to four cycles of S1 recurrent selection using
the same three indices. There were differences among indices for husk tightness and
husk extension, but the populations were 1–2 days earlier and the correlations
between traits included in the indices changed over cycles of selection for all
indices, which were attributed to breakup of genetic linkages. Widstrom et al.
(1982) suggested that new indices should be constructed for future cycles of
selection. Except for the parameter-free selection indices, this would require rees-
timation of genetic variances and covariances. For cyclical selection programs, it
seems the use of the simpler selection indices would be more appropriate. If
selection is effective, the frequency of alleles will change, which in turn affect
the estimates of genetic variances and covariances. The heritability index suggested
by Smith et al. (1981) uses components of variance estimated from the evaluation
trials for each cycle of selection under specific environmental conditions. If signifi-
cant allele frequencies are modified during selection, the changes would be
reflected in the estimates of heritability, assuming other factors are not affecting
progeny performance.
Suwataradon et al. (1975) compared the Smith–Hazel index, base index (Pesek
and Baker, 1969), and the desired gain index (Pesek and Baker, 1969). Two sets of
78 A.R. Hallauer, M.J. Carena
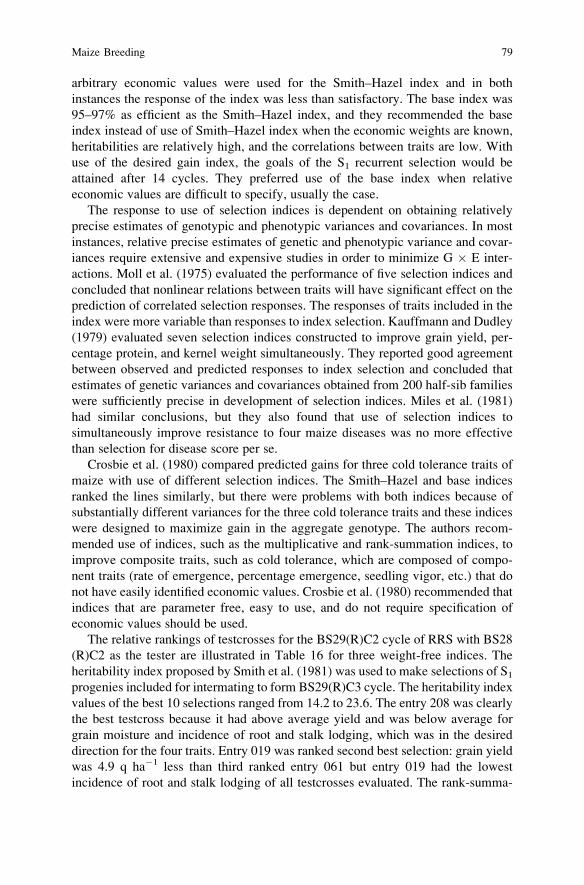
arbitrary economic values were used for the Smith–Hazel index and in both
instances the response of the index was less than satisfactory. The base index was
95–97% as efficient as the Smith–Hazel index, and they recommended the base
index instead of use of Smith–Hazel index when the economic weights are known,
heritabilities are relatively high, and the correlations between traits are low. With
use of the desired gain index, the goals of the S1 recurrent selection would be
attained after 14 cycles. They preferred use of the base index when relative
economic values are difficult to specify, usually the case.
The response to use of selection indices is dependent on obtaining relatively
precise estimates of genotypic and phenotypic variances and covariances. In most
instances, relative precise estimates of genetic and phenotypic variance and covar-
iances require extensive and expensive studies in order to minimize G � E inter-
actions. Moll et al. (1975) evaluated the performance of five selection indices and
concluded that nonlinear relations between traits will have significant effect on the
prediction of correlated selection responses. The responses of traits included in the
index were more variable than responses to index selection. Kauffmann and Dudley
(1979) evaluated seven selection indices constructed to improve grain yield, per-
centage protein, and kernel weight simultaneously. They reported good agreement
between observed and predicted responses to index selection and concluded that
estimates of genetic variances and covariances obtained from 200 half-sib families
were sufficiently precise in development of selection indices. Miles et al. (1981)
had similar conclusions, but they also found that use of selection indices to
simultaneously improve resistance to four maize diseases was no more effective
than selection for disease score per se.
Crosbie et al. (1980) compared predicted gains for three cold tolerance traits of
maize with use of different selection indices. The Smith–Hazel and base indices
ranked the lines similarly, but there were problems with both indices because of
substantially different variances for the three cold tolerance traits and these indices
were designed to maximize gain in the aggregate genotype. The authors recom-
mended use of indices, such as the multiplicative and rank-summation indices, to
improve composite traits, such as cold tolerance, which are composed of compo-
nent traits (rate of emergence, percentage emergence, seedling vigor, etc.) that do
not have easily identified economic values. Crosbie et al. (1980) recommended that
indices that are parameter free, easy to use, and do not require specification of
economic values should be used.
The relative rankings of testcrosses for the BS29(R)C2 cycle of RRS with BS28
(R)C2 as the tester are illustrated in Table 16 for three weight-free indices. The
heritability index proposed by Smith et al. (1981) was used to make selections of S1progenies included for intermating to form BS29(R)C3 cycle. The heritability index
values of the best 10 selections ranged from 14.2 to 23.6. The entry 208 was clearly
the best testcross because it had above average yield and was below average for
grain moisture and incidence of root and stalk lodging, which was in the desired
direction for the four traits. Entry 019 was ranked second best selection: grain yield
was 4.9 q ha�1 less than third ranked entry 061 but entry 019 had the lowest
incidence of root and stalk lodging of all testcrosses evaluated. The rank-summa-
Maize Breeding 79
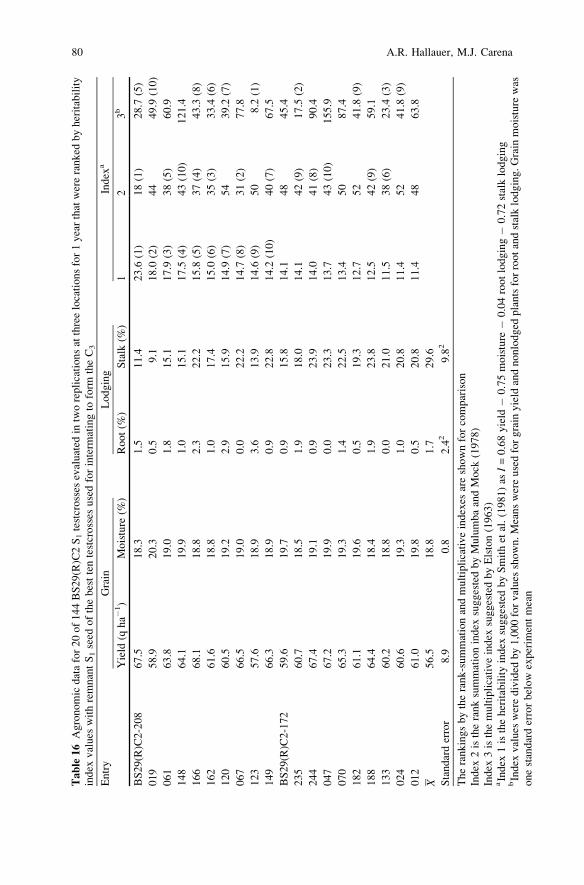
Table16Agronomicdatafor20of144BS29(R)C2S1testcrosses
evaluated
intworeplicationsatthreelocationsfor1yearthatwereranked
byheritability
index
values
withremnantS1seed
ofthebesttentestcrosses
usedforinterm
atingto
form
theC3
Entry
Grain
Lodging
Index
a
Yield
(qha�
1)
Moisture
(%)
Root(%
)Stalk
(%)
12
3b
BS29(R)C2-208
67.5
18.3
1.5
11.4
23.6
(1)
18(1)
28.7
(5)
019
58.9
20.3
0.5
9.1
18.0
(2)
44
49.9
(10)
061
63.8
19.0
1.8
15.1
17.9
(3)
38(5)
60.9
148
64.1
19.9
1.0
15.1
17.5
(4)
43(10)
121.4
166
68.1
18.8
2.3
22.2
15.8
(5)
37(4)
43.3
(8)
162
61.6
18.8
1.0
17.4
15.0
(6)
35(3)
33.4
(6)
120
60.5
19.2
2.9
15.9
14.9
(7)
54
39.2
(7)
067
66.5
19.0
0.0
22.2
14.7
(8)
31(2)
77.8
123
57.6
18.9
3.6
13.9
14.6
(9)
50
8.2
(1)
149
66.3
18.9
0.9
22.8
14.2
(10)
40(7)
67.5
BS29(R)C2-172
59.6
19.7
0.9
15.8
14.1
48
45.4
235
60.7
18.5
1.9
18.0
14.1
42(9)
17.5
(2)
244
67.4
19.1
0.9
23.9
14.0
41(8)
90.4
047
67.2
19.9
0.0
23.3
13.7
43(10)
155.9
070
65.3
19.3
1.4
22.5
13.4
50
87.4
182
61.1
19.6
0.5
19.3
12.7
52
41.8
(9)
188
64.4
18.4
1.9
23.8
12.5
42(9)
59.1
133
60.2
18.8
0.0
21.0
11.5
38(6)
23.4
(3)
024
60.6
19.3
1.0
20.8
11.4
52
41.8
(9)
012
61.0
19.8
0.5
20.8
11.4
48
63.8
X56.5
18.8
1.7
29.6
Standarderror
8.9
0.8
2.4
29.8
2
Therankingsbytherank-summationandmultiplicativeindexes
areshownforcomparison
Index
2istheranksummationindex
suggestedbyMulumbaandMock
(1978)
Index
3isthemultiplicativeindex
suggestedbyElston(1963)
aIndex
1istheheritabilityindex
suggestedbySmithet
al.(1981)as
I=0.68yield
�0.75moisture
�0.04rootlodging�
0.72stalklodging
bIndex
values
weredivided
by1,000forvalues
shown.Meanswereusedforgrain
yield
andnonlodged
plantsforrootandstalklodging.Grain
moisture
was
onestandarderrorbelow
experim
entmean
80 A.R. Hallauer, M.J. Carena
tion index included seven and the multiplicative index included six of the top ten
selections of ten entries identified by the heritability index. Although there were
differences in the rankings of the top ten testcrosses among the three selection
indices, each index would have included selections among the 20 selections with
the greater index values with the heritability index. Each index was effective for
identifying the above average testcrosses. Each of the three indexes is relatively
easy to use and seem to be equally effective in identifying the better selections.
The choice of index depends on the data available and the emphasis given to each
trait during selection.
Multitrait selection, multistage testing, and multiprogeny tests are common in
maize breeding. In each instances, maize breeders will need to develop selection
indices that facilitate selection to identify elite cultivars. Most of the empirical
research conducted in maize involving comparisons of selection indices have
generally preferred use of indices that are parameter free and do not require
specification of relative economic values. Maize breeding rapidly evolves over
time and the same parameters and economic values used to develop certain indices
may not be appropriate for the next cross or the next year. Successful application of
selection indices in maize improvement will depend on the goals of the breeding
programs, genetic materials under selection, traits considered in selection, and the
definition of the aggregate genotype. Selection indices are used on a regular basis in
maize breeding. It becomes the breeders’ choice to either choose or develop an
index appropriate for their situations. The empirical evidence in the literature
suggests that it is not possible to make general statements for what may be
considered the best selection index.
14 Summary
The fundamentals of maize breeding were described by Shull (1910) as the devel-
opment of pure lines by self-pollination, production of crosses between the derived
inbred lines, evaluation of crosses to determine the greatest yielding cross, and
production of the greatest yielding cross for use by the farmer. The goals of maize
breeding were stated by Hartley (1908): ‘‘The wise maize breeder will consider all
visible characters, that is, those variations that are apparent to the eye, as secondary to
the inherent ability of the individual to produce heavily and to transmit its high
yielding character to its offspring. . . . The most variable characters can be deter-
mined only by actual field tests, and it is imperative for purpose of just comparison
that these performance testers be ascertained under like normal conditions. . . . We
must resist the tendency to breed toward artificial standards andmust breedmaize for
the purpose for which maize is grown, namely, profit. . . . It is the accumulation and
perpetuation of desirable variations, such as high-yielding power, early maturity,
proper form, etc. coupled with better cultural methods that has made possible the
growing of millions of bushels of maize where 25 years ago it was considered
impossible to grow maize.’’ The fundamental methods of maize breeding (Shull,
Maize Breeding 81
1910) and the goals of breeding (Hartley, 1908) have essentially remained the same
for nearly 100 years. But the advances made in the methods of maize breeding to
achieve the goals of maize breeding have exceeded those of Shull (1910) and
Hartley (1908). Hartley (1908) emphasized that methods should developed to
achieve the objective of 62.5 q ha�1; average US maize yield was 16.8 q ha�1 in
1908 and average US maize yield of 62.5 q ha�1 was attained in 1978, 70 years
later. Continued genetic improvements of hybrids since 1978 have increased to
where farmers presently often produce yields that exceed 125.0 q ha�1. Only with
applied maize breeding as a leading force of biotechnology and molecular genetics
will maize grain yields exceed 187.5 q ha�1 within the next 20–30 years as
predicted with the use of molecular markers.
Similar to other scientific disciplines, rapid advances in technology have im-
pacted either directly or indirectly the genetic improvements realized from maize
breeding. Technological advances in mechanization for conducting research, de-
velopment of statistical methods and computer hardware and software for better
analysis of experimental data, and improvement of husbandry practices in maize
production, for example, have had significant impacts on the advancements made
for increased grain yields (Hallauer, 2006). Since the acceptance of double-cross
hybrids by the producers during the 1930s and 1940s, research has been conducted
for the potential of mutation breeding, the study of the inheritance of quantitative
traits, the use of recessive mutants for specific traits, the study of the physiological
functions within maize plants and developing models of ideotypes for maximum
yield, function and importance of transposable elements within the maize genome,
and the rapid developments of molecular genetics to further our knowledge of the
maize genome, recently sequenced. Some have had greater impacts than others.
Gardner (1961) compared response to mass selection within the same population
that was either irradiated or nonirradiated; response to selection was not enhanced
by irradiation. Mutation breeding has not been an important component of maize
breeding because persistent genetic variation has prevailed to provide continued
genetic improvements. The predominant maize breeding method continues to
include crossing elite by elite to generate genetic variability and selfing to derive
inbred lines. Transposable elements seem pervasive in the maize genome and may
have some impact on generating genetic variation, but the importance of transpo-
sable elements on maize improvement are difficult to quantify (Peterson, 1986,
1987). Breeding methods for the successful development of double-cross hybrids
were determined empirically. The consistent expression of heterosis in maize
crosses was the basis for the interest in hybrids, but the genetic basis of heterosis,
however, has proven to be elusive (Gowen, 1952; Coors and Pandey, 1999).
Because of the interest in determining the genetic basis of heterosis, extensive
quantitative genetic studies were conducted to determine the types of genetic
effects important in the expression of quantitative traits, particularly for grain
yield. Estimates of additive genetic and dominance variances for different types
of maize populations suggested that additive genetic effects were of greater impor-
tance, and that selection should be effective (Hallauer and Miranda, 1988). Studies
to quantify the relative importance of epistatic effects have not been successful.
82 A.R. Hallauer, M.J. Carena
Significant estimates of epistatic effects from comparisons of means for different
generations and types of hybrids were generally found in all instances for different
plant and ear traits. Although the estimates of additive genetic effects generally
seemed of greater importance than the dominance and epistatic effects, within
populations, the expression of heterosis depends on the presence and relative
magnitude of nonadditive genetic effects. The specific combinations of dominance
and epistatic effects are most certainly different for each hybrid. Similar to specific
combining ability estimates, the heterotic effects will be unique for each hybrid. To
enhance the expression of heterosis, heterotic groups have been identified, and
inbred lines are developed within heterotic groups with the hybrids produced and
tested that involve lines for each of the heterotic groups. Quantitative genetic
studies do not develop inbred lines directly, but the theoretical and empirical
information derived from quantitative genetic studies have provided guidelines in
developing selection and breeding strategies, including selection methods, testing
methods, inbred line development, estimation of heritability, and genetic effects
important in heterosis (Hallauer, 2006). Most of the economically important traits
considered in maize breeding are inherited quantitatively. Their importance is
recognized by molecular geneticists with emphasis given to identifying QTL and
use of molecular markers to assist in the improvement of quantitatively inherited
traits. The use of molecular markers transfers emphasis of selection based on
phenotype to greater emphasis at the DNA level. Lamkey and Lee (1993), Eathing-
ton et al. (1997), Johnson (2004), Bernardo and Charcosset (2006), and others have
discussed how molecular markers can complement other breeding methods.
Numerous mutants of maize were identified in the early genetic studies (Neuffer
et al., 1968). Mutants were important in genetic studies to determine the expression
and functions of specific loci for different plant and ear traits. Except for specific
uses of maize, most recessive mutants have not had a major impact on breeding
strategies for improvement of quality and quantity of maize. During the 1960s and
1970s, suggestions for use of dwarf (dwi) genes to reduce plant size, terminal ear
(te) and tassel seed (tsi) to increase number of kernels, brown midrib (bmi) mutants
to improve silage quality, leafy gene (Lfy) to increase light interception, liguleless
mutanats (lgi) to change leaf orientation, waxy (wx) allele to modify starch, and
opaque-2 (o2) and floury (fl2) mutants to improve kernel quality are some examples
of mutants that have been studied. Initially, there was considerable interest in their
potential, but interest waned when the recessive mutants were incorporated into
elite inbred lines. In nearly all instances, a 5–15% grain yield loss was a common
experience. Maize starch is generally considered low quality if an important
component of the human diet but has recently increased its interest due to the
corn–ethanol relationship. Mertz et al. (1964) reported that the o2 gene improved
grain quality. Interest in changing the quality of maize kernel was to insert the o2allele in widely used inbred lines. The results were generally not satisfactory
because of the correlated effects of grain yield loss, higher moisture retention in
the grain, greater harvest losses due to soft kernels, and greater susceptibility to
common ear pests. Interest decreased and most programs were terminated. It was
not until breeding methods included selection for modifiers to improve kernel
Maize Breeding 83
texture, accompanied by laboratory analyses at all stages of breeding, that accept-
able inbred lines and hybrids were developed (Vasal, 2001). It required ~30 years of
breeding and selection to attain acceptable agronomic and quality standards. In
areas where maize is consumed directly, quality protein maize (QPM) has an
important place in maize production. Coors and Lauer (2001) were not as success-
ful in developing superior silage quality with use of brown midrib mutant. Similar
efforts were not given to most of the other mutants. Sweet corn and popcorn are two
types of maize that are successfully used as special niche crops for human con-
sumption. Sweet corn breeders have relied on mutant alleles (su2 and sh2, etc.) toenhance the taste of sweet corn. The recessive waxy (wx) allele was used effectivelyto modify the starch to produce only amylopectin, which has important properties
for uses in foods and textiles.
Maize physiologists have studied maize for methods of increasing rates of
photosynthesis and deposition of sugars in the kernels and uptake of applied
nutrients to enhance grain production. Because maize has separate, distinct male
and female inflorescences, interest also was given to the relative importance of
source – sink relations, biomass, harvest index, the fate of CO2 from photosyn-
thesis and respiration, leaf area indices, and the hormones in plant development
(Westgate et al., 2004). Mock and Pearce (1975) proposed an ideotype as the
prototype maize plant to maximize yield; their ideotype included traits, such as
smaller tassel size, upright leaf orientation above top ear and flatter orientation
below top ear, prolificacy, darker green plant color, simultaneous silking and pollen
shedding, greater efficiency of CO2 production and use, and more kernels per ear.
Information from the physiology studies has indirectly impacted maize breeding.
Maize breeders recognized the importance of the different plant and ear traits
physiologically. Greatest emphasis is usually for greater grain yield. The greater
yielding cultivars incorporate many of the suggestions made in the ideotype
because newer cultivars have smaller tassels, more upright leaf orientation, greater
tendency for prolificacy, etc.
The latest technology to impact maize breeding is molecular genetics. Molecular
genetics has already contributed to maize improvement with use of transgenes to
reduce losses due to pests and weeds. Molecular genetics has been used to identify
ownership of genotypes, to monitor seed purity, to determine the essential deriva-
tion of lines from the original lines, to fingerprint inbred line and hybrid genotypes,
to monitor changes with selection, to precisely follow gene transfer in backcrossing
programs, and to classify inbred lines in appropriate heterotic groups. One can
speculate that the greatest use of molecular genetics will be the development of
adequate set of molecular markers and/or ideally genes to effectively develop and
use marker and/or gene assisted selection schemes for the genetic improvement of
quantitative traits, such as grain yield. However, the use of molecular markers
seems would be more important on simple inherited traits that are still difficult to
accurately phenotype. The potential of molecular genetics in maize breeding can
only be visualized. As the technology develops and techniques become more cost
effective, molecular genetics should have even more practical impact in maize
breeding programs. The information derived from molecular genetics increases
84 A.R. Hallauer, M.J. Carena
daily with the complete sequence of the maize genome just finished. The major task
will be to incorporate the molecular biology information to complement the selec-
tion and testing methods at the phenotypic level. Kaeppler (2004) has summarized
the potential of molecular genetics in maize breeding.
Information in maize genetics has expanded exponentially during the past 50
years. The major factor for enhanced grain yields remains the same – germplasm.
The most sophisticated breeding methods that encompass all of the genetic
information currently available will have limited success if poor choices of source
germplasm are made in initiating inbred line and hybrid development programs.
Because of past selection an elite pool of germplasm has been developed. The
current methods of inbreeding, selection, and testing of progenies derived from elite
line crosses have been successful (Russell, 1991; Duvick, 1992, 2004; Fig. 1).
Bauman (1981) reported that genetically broad-based populations (e.g., open-pol-
linated, composite, and synthetic cultivars) received limited attention as sources of
breeding germplasm, and they are even less at the present time. The probabilities of
developing a new, unique inbred line are low (Lindstrom, 1939; Hallauer and
Miranda, 1988; Hadi, 2004). Development of improved inbred lines via recycling
of elite inbred lines is the normal mode of present-day maize breeding. Although
Hadi (2004) emphasized that the development of useful inbred lines from geneti-
cally broad-based population is extremely limited, I205, C103, Oh43, B14, B37,
B73, and B84 have been very useful foundation materials in recycling of newer
inbreds. Many inbred lines trace their origin to important first-cycle lines that have
provided useful gene complexes to the recycled lines (Mikel and Dudley, 2006). It
seems, therefore, that although the odds are very limited, that germplasm enhance-
ment with use of recurrent selection procedures should be continued especially for
creating useful genetic diversity and preventing genetic vulnerability. The GEM
program, for example, may identify lines that can contribute useful genes to elite
inbred lines included in line recycling and the program has already expanded to the
central and northern US Corn Belt, eastern US, and Europe. The main concern is
that the introduced DNA will not disrupt the finely tuned linkage combinations that
were gradually accumulated during recycling. Despite the obvious limitations of
recycling within adapted populations or populations with introduced exotic germ-
plasm, it seems necessary that prebreeding and recurrent selection of advanced
populations be continued to provide backup germplasm for possible future needs.
The odds are not good for developing a truly superior inbred line, but it takes only
one (e.g., B73 developed from an improved version of a genetically broad-based
synthetic variety) to make a significant impact. Good choices of germplasm are a
constant component of successful maize breeding programs. Different breeding
methods, different testing procedures, advances in technology, and greater genetic
information can vary among individuals and programs, but the ultimate success
depends on the germplasm used.
Maize Breeding 85
References
Acosta, A.E. and P.L. Crane. 1972. Further selection for lower ear height in maize. Crop Sci.
12:165–167.
Adams, M.W. and D.B. Shank. 1959. The relation of heterozygosity to homeostasis in maize
hybrids. Genetics 44:777–786.
Albrecht, B. and J.W. Dudley. 1987. Evaluation of four maize populations containing different
proportions of exotic germplasm. Crop Sci. 27:480–486.
Anonymous. 1972. Genetic vulnerability of major crops. NRC-NAS, Washington, DC.
Bailey, T.B., Jr. 1977. Selection limits in self-fertilizing populations following the cross of
homozygous lines. pp. 399–412. In E. Pollak, O. Kempthorne, and T.B. Bailey, (eds.) Proceed-
ings of the International Conference on Quantitative Genetics. Iowa State University Press,
Ames, IA.
Bailey, T.B., Jr. and R.E. Comstock. 1976. Linkage and the synthesis of better genotypes in self-
fertilizing species. Crop Sci. 16:363–370.
Baker, R.J. 1986. Selection Indices in Plant Breeding. CRC Press, Boca Raton, FL.
Baker, R.J. 1974. Selection indices without economic weights for animal breeding. Can. J. Anal.
Sci. 54:1–8.
Barata, C. and M.J. Carena. 2006. Classification of North Dakota maize inbred lines into heterotic
groups based on molecular and testcross data. Euphytica 151:339–349.
Bauman, L.F. 1959. Evidence of non-allelic gene interaction in determining yield, ear height, and
kernel row number in corn. Agron. J. 51:531–534.
Bauman, L.F. 1981. Review of methods used by breeders to develop superior corn inbreds. Proc.
Annu. Corn Sorghum Ind. Res. Conf. 36:199–208.
Beal, W.J. 1880. Indian corn. pp. 279–289. Rep. Michigan Board Agric.
Bernardo, R. 1990. Identifying populations useful for improving parents of a single cross based on
net transfer of alleles. Theor. Appl. Genet. 80:349–352.
Bernardo, R. 1991. Correlation between testcross performance of lines at early and late selfing
generations. Theor. Appl. Genet. 82:17–21.
Bernardo, R. 1992. Retention of genetically superior lines during early-generation of testcrossing
in maize. Crop Sci. 32:933–937.
Bernardo, R. 2001. What if we knew all the genes for a quantitative trait in hybrid crops? Crop Sci.
41:1–4.
Bernardo, R. and A. Charcosset. 2006. Usefulness of gene information in marker-assisted recur-
rent selection: A simulation appraisal. Crop Sci. 46:614–621.
Betra’n, F.J. and A.R. Hallauer. 1996. Hybrid improvement after reciprocal recurrent selection in
BSSS and BSCB1 maize populations. Maydica 41:25–33.
Brown,W.L. 1953. Sources of germplasm for hybrid corn. Proc. Annu. Corn Ind. Res. Conf. 8:11–16.
Brown, W.L. 1975. A broader germplasm base in corn and sorghum. Proc. Annu. Corn Sorghum
Ind. Res. Conf. 30:81–89.
Burton, G.W. 1951. Quantitative inheritance in pearl millet (Pennisetum glaucum). Agron.
J. 43:409–417.
Campbell, M.R., L.M. Pollak, and P.J. White. 1995a. Genetic variation for starch thermal and
functional properties among nonmutant maize inbreds. Cereal Chem. 77:281–286.
Campbell, M.R., P.J. White, and L.M. Pollak. 1995b. Properties of sugary-2 maize starch:
Influence of exotic background. Cereal Chem. 72:389–392.
Carena, M.J. 2005a. Maize commercial hybrids compared to improved population hybrids for
grain yield and agronomic performance. Euphytica 141:201–208.
Carena, M.J. 2005b. Registration of NDSAB(MER-FS)C13maize Germplasm. Crop Sci. 45:1670–
1671.
86 A.R. Hallauer, M.J. Carena
Carena, M.J. 2008. Increasing the genetic diversity of northern U.S. maize hybrids: Integrating pre-
breeding with cultivar development. In Conventional and molecular breeding of field and
vegetable crops. Nov. 24-28. Novi Sad, Serbia.
Carena, M.J., C. Eno, and D.W. Wanner. 2008. Registration of NDBS11(FR-M)C3, NDBS1011,
and NDBSK(HI-M)C3 maize germplasms. J. Plant Reg. 2:132–136.
Carena, M.J. and A.R. Hallauer. 2001a. Response to inbred progeny selection in Leaming and
Midland Yellow Dent maize populations. Maydica 46:1–10.
Carena, M.J. and A.R. Hallauer. 2001b. Expression of heterosis in Leaming and Midland Corn
Belt dent populations. J. Iowa Acad. Sci. 108:73–78.
Carena, M.J. and Z.W. Wicks III. 2006. Maize early maturing hybrids: An exploitation of U.S.
temperate public genetic diversity in reserve. Maydica 51:201–208.
Carena, M.J., I. Santiago, and A. Ordas. 1998. Direct and correlated response to recurrent selection
for prolificacy in maize at two planting densities. Maydica 43:95–102.
Castellanos, J.S., A.R. Hallauer, and H.S. Cordova. 1998. Relative performance of testers to
identify elite lines of corn (Zea mays L.). Maydica 43:217–226.
Caton,H.G. 1999.Conversionof elite subtropicalmaize germplasm to temperate environments. Ph.D.
Diss. Iowa State University, Ames, IA (Diss. Abstr. DAI-B 60/8, p. 3629, February 2000).
Chase, S.S. 1949. Monoploid frequencies in a commercial double cross hybrid maize, and its
component single cross hybrids and inbred lines. Genetics 34:328–332.
Chase, S.S. 1952. Production of homozygous diploids of maize from monoploids. Agron.
J. 44:263–267.
Christensen, D.W. 1984. Utility of zein-isoelectric focusing for predicting heterosis in maize. Ph.
D. Diss. University Minnesota, St. Paul, MN (Diss. Abstr. DAI-B 45/05, p. 1374, November
1984).
CIMMYT. 1984. CIMMYT research highlights 1984. CIMMYT, El Batan, Mexico.
Cockerham, C.C. 1954. An extension of the concept of partitioning hereditary variance for
analysis of covariance among relatives when epistasis is present. Genetics 39:859–882.
Cockerham, C.C. 1956a. Analysis of quantitative gene action. Brookhaven Symp. Biol. 9:53–68.
Cockerham, C.C. 1956b. Effects of linkage on the covariances between relatives. Genetics
41:138–141.
Cockerham, C.C. 1961. Implications of genetic variances in a hybrid breeding program. Crop Sci.
1:47–52.
Cockerham, C.C. 1963. Estimation of genetic variances. pp. 53–94. InW.D. Hanson and
H.F. Robinson (eds.) Statistical Genetics and Plant Breeding. NAS-NRC Publication 982.
Collins, G.N. 1909. The importance of broad breeding in corn. USDA Bureau Plant Ind. Bull. 141.
Part 4:33–42.
Compton, W.A. and R.E. Comstock. 1976. More on modified ear-to-row selection. Crop Sci.
16:122.
Compton, W.A. and J.H. Lonnquist. 1982. A multiplicative selection index applied to four cycles
of full-sib recurrent selection in maize. Crop Sci. 22:981–983.
Comstock, R.E. and H.F. Robinson. 1952. Estimation of average dominance of genes. pp. 496–
516. In J.W. Gowen (ed.) Heterosis. Iowa State University Press, Ames, IA.
Comstock, R.E., H.F. Robinson, and P.H. Harvey. 1949. A breeding procedure designed to make
maximum use of both general and specific combining ability. Agron. J. 41:360–367.
Cook, K.A. 1998. Linkage disequilibrium in maize F2 populations. Ph.D. Diss. Iowa State
University, Ames, IA.
Coors, J.G. and J.G. Lauer. 2001. Silage corn. pp. 347–392. In A.R. Hallauer (ed.) Special Corns,
2nd ed. CRC Press, Boca Raton, FL.
Coors, J.G. and S. Pandey (eds.). 1999. Genetics and Exploitation of Heterosis in Crops. ASA,
CSSA, SSSA, Madison, WI.
Covarrubias-Prieto, J., A.R. Hallauer, and K.R. Lamkey. 1989. Intermating F2 populations of
maize. Genetika 21:111–126.
Crabb, A.R. 1947. The Hybrid Corn Makers. Rutgers University Press, New Brunswick, NJ.
Maize Breeding 87
Cress, C.E. 1967. Reciprocal recurrent selection and modifications in simulated populations. Crop
Sci. 7:561–567.
Crosbie, T.M., J.J. Mock, and O.S. Smith. 1980. Comparison of gains predicted by several
selection methods for cold tolerance traits of two maize populations. Crop Sci. 20:649–655.
Cross, H.Z., J.R. Chyle, Jr., and J.J. Hammond. 1987. Divergent selection for ear moisture in early
maize. Crop Sci. 27:914–918.
Crossa, J. 1989. Theoretical considerations for the introgression of exotic germplasm into adapted
maize populations. Maydica 34:53–62.
Crossa, J. and C.O. Gardner. 1987. Introgression of an exotic germplasm for improving an adapted
maize population. Crop Sci. 27:187–190.
Crossa, J., C.O. Gardner, and R.F. Mumm. 1987. Heterosis among populations of maize (Zea maysL.) with different levels of exotic germplasm. Theor. Appl. Genet. 73:445–450.
Crossa, J., S. Taba, and E.J. Wellhausen. 1990. Heterotic patterns among Mexican races of maize.
Crop Sci. 30:1182–1190.
Cunningham, E.P. 1969. The relative efficiencies of selection indexes. Acta. Agric. Scandinavica
19:45–48.
Darrah, L.L. 1986. Evaluation of population improvement in the Kenya maize breeding methods
study. pp. 160–175. In B. Gelaw (ed.) To Feed Ourselves. Proc. First Eastern, Central, and
Southern Africa Regional Maize Workshop, Lusaka, Zambia. March 10–17, 1985. CIMMYT,
Mexico, D.F.
Darrah, L.L. and L.H. Penny 1975. Inbred line extraction from improved breeding populations.
E. Afr. Agric. For. J. 41:1–8.
Darrah, L.L., S.A. Eberhart, and L.H. Penny. 1978. Six years of maize selection in Kitale Synthetic
II, Ecuador 573, and Kitale Composite A using methods of the comprehensive breeding
systems. Euphytica 27:191–204.
Dekker, J.C.M. and P. Settar. 2004. Long-term selection with known quantitative trait loci. pp.
311–335. In J. Janick (ed.) Long-term Selection: Maize. Part 1. Plant Breed. Rev. Vol. 24. John
Wiley & Sons, Inc., Hoboken, NJ.
DeKruif, P. 1928. Maize. pp. 165–259. In Hunger Fighters. Harcourt, Brace, and World, Inc., New
York. NY.
Dhillon, B.S. and A.S. Khehra. 1989. Modified S1 recurrent selection in maize improvement. Crop
Sci. 29:226–228.
Douglas, A.G., J.W. Collier, M.F. El-Ebrasly, and J.S. Rogers. 1961. An evaluation of three cycles
of reciprocal recurrent selection in a corn improvement program. Crop Sci. 1:157–161.
Dowswell, C.R., R.L. Paliwal, and R.P. Cantrell. 1996. Maize in the Third World. Westview Press,
Boulder, CO.
Dudley, J.W. 1982. Theory for transfer of genes. Crop Sci. 22:631–637.
Dudley, J.W. 1984a. Theory for the identification and use of exotic germplasm maize breeding
programs. Maydica 29:391–407.
Dudley, J.W. 1984b. A method of identifying lines for use in improving parents of a single cross.
Crop Sci. 24:355–357.
Dudley, J.W. 1987. Modification of methods for identifying inbred lines useful for improving
parents of elite single crosses. Crop Sci. 27:940–943.
Dudley, J.W. 1997. Quantitative genetics and plant breeding. Adv. Agron. 59:1–23.
Dudley, J.W. and R.J. Lambert. 2004. 100 generations of selection for oil and protein in corn. pp.
79–100. In J. Janick (ed.) Plant Breed. Rev. 24, Part 1. John Wiley & Sons, Inc., Hoboken, NJ.
Dudley, J.W. and R.H. Moll. 1969. Interpretations and uses of estimates of heritability and genetic
variances in plant breeding. Crop Sci. 9:257–262.
Duvick, D.N. 1992. Genetic contributions to advances in yield of U.S. maize. Maydica 37:69–79.
Duvick, D.N. 1999. Heterosis: Feeding people and protecting natural resources. pp. 19–29. InJ.G. Coors and S. Pandey (eds.) Genetics and Exploitation of Heterosis in Crops. ASA, CSSA,
SSSA, Madison, WI.
88 A.R. Hallauer, M.J. Carena
Duvick, D.N. 2004. Long-term selection in a commercial hybrid maize breeding program. pp.
109–151. In J. Janick (eds.) Plant Breed. Rev. 24, Part 2. John Wiley & Sons, Inc.,
Hoboken, NJ.
Duvick, D.N., J.S.C. Smith, and M. Cooper. 2004. Changes in performance, parentage, and genetic
diversity of successful corn hybrids, 1930–2000. pp. 65–97. In C.W. Smith, J. Betra’n, and
E.C.A. Runge (eds.) Corn: Origin, History, and Production. John Wiley & Sons, Hoboden, NJ.
Eagles, H.A. and A.K. Hardacre. 1990. Genetic changes from introgression of highland Mexican
germplasm into a Corn Belt dent population of maize. Theor. Appl. Genet. 79:543–549.
East, E.M. 1908. Inbreeding in corn. pp. 419–428. In Connecticut Agricultural Experiments
Station Report 1907.
East, E.M. and H.K. Hayes. 1911. Inheritance in corn. Conn. Agr. Exp. Stn. Bull. 167:1–41.
Eathington, S.R., J.W. Dudley, and G.F. Rufener II. 1997. Usefulness of marker-QTL associations
in early generation selection. Crop Sci. 37:1686–1693.
Eberhart, S.A. 1964. Least squares method for comparing progress among recurrent selection
methods. Crop Sci. 4:230–231.
Eberhart, S.A. 1970. Factors affecting efficiencies of breeding methods. African Soils 15:669–680.
Eberhart, S.A. and W.A. Russell. 1966. Stability parameters for comparing varieties. Crop Sci.
6:36–40.
Eberhart, S.A., M.N. Harrison, and F. Ogada. 1967. A comprehensive breeding system. Zuchter
37:169–174.
Echandi, C.R. and A.R. Hallauer. 1996. Evaluation of U.S. Corn Belt and adapted maize cultivars
and their diallel crosses. Maydica 41:317–324.
Eckhardt, R.C. and A.A. Bryan. 1940. Effect of method of combining the four inbred lines of a
double-cross of maize upon the yield and variability of the resulting double crosses. J. Am. Soc.
Agron. 32:347–353.
Elston, R.C. 1963. A weight free index for the purpose of ranking or selection with respect to
several traits at a time. Biometrics 19:85–97.
Eyhe’rabide, G.H. and A.R. Hallauer. 1991. Reciprocal full-sib selection in maize. I. Direct and
indirect responses. Crop Sci. 31:952–959.
Falconer, D.S. 1960. Introduction to Quantitative Genetics. Ronald Press, New York. NY.
Findlay, K.W. and G.N.Wilkinson. 1963. The analysis of adaptation in a plant-breeding programme.
Australian J. Agric. Res. 14:742–754.
Fountain, M.O. and A.R. Hallauer. 1996. Genetic variation within maize breeding populations.
Crop Sci. 36:26–32.
Freeman, G.H. and J.M. Perkins. 1971. Environmental and genotype-environmental components
of variability. VIII. Relation between genotypes grown in different environments and measures
of these environments. Heredity 27:15–23.
Galinat, W.C. 1988. The origin of corn. pp. 1–31. InG.F. Sprague and J.W. Dudley (eds.) Corn and
Corn Improvement. 3rd ed. ASA, CSSA, SSSA, Madison, WI.
Gama, E.E.G. and A.R. Hallauer. 1977. Relation between inbred and hybrid traits in maize. Crop
Sci. 17:703–706.
Gamble, E.E. 1962. Gene effects in corn (Zea mays L.). I. Selection and relative importance of
gene effects for yield. Can. J. Plant Sci. 42:339–348.
Gardner, C.O. 1961. An evaluation of effects of mass selection and seed irradiation with thermal
neutrons on yields of corn. Crop Sci. 1:241–245.
Gardner, C.O. 1963. Estimates of genetic parameters in cross-fertilizing plants and their implica-
tions in plant breeding. pp. 225–248. In W.D. Hanson and H.F. Robinson (eds.) Statistical
Genetics and Plant Breeding. NAS-NRC Publication 982. Washington, DC.
Gardner, C.O. 1976. Quantitative genetic studies and population improvement in maize and
sorghum. pp. 475–489. In E. Pollak, O. Kempthorne, and T.B. Bailey (eds.) Proceedings of
the Conference on Quantitative Genetics. Iowa State University Press, Ames, IA.
Genter, C.F. 1976. Mass selection in a composite of intercrosses of Mexican races of maize. Crop
Sci. 16:556–558.
Maize Breeding 89
Gepts, P. 2004. Crop domestication as a long-term selection experiment. pp. 1–44. In J. Janick
(ed.) Long-term Selection: Crops, Animals, and Bacteria. Plant Breed. Rev. Part 2, Vol. 24.
John Wiley & Sons, Inc., Hoboken, NJ.
Gerdes, J.T., C.F. Behr, J.G. Coors, and W.F. Tracy. 1994. Compilation of North American Maize
Breeding Germplasm. CSSA, Madison, WI.
Gerloff, J.E. and O.S. Smith. 1988. Choice of method for identifying germplasm with superior
alleles. Theor. Appl. Genet. 76:209–216.
Gerrish, E.E. 1983. Indications from a diallel study for interracial maize hybridization in the Corn
Belt. Crop Sci. 23:1082–1084.
Gethi, J.G., J.A. Labate, K.R. Lamkey, M.E. Smith, and S. Kresovich. 2002. SSR variation in
important U.S. inbred lines. Crop Sci. 42:951–957.
Getschman, R.J. and A.R. Hallauer. 1991. Genetic variation among and within S1 progenies of
maize. J. Iowa Acad. Sci. 98:127–133.
Gevers, H.O. 1975. Three cycles of reciprocal recurrent selection in maize under two systems of
plant selection. Agroplante 7:107–108.
Goldman, I.L. 1999. Inbreeding and outbreeding in the development of a modern heterosis
concept. pp. 7–18. In J.G. Coors and S. Pandey (eds.) Genetics and Explortation of Heterosis
in Crops. ASA, CSSA, and SSSA, Madison, WI.
Good, R.L. and A.R. Hallauer. 1977. Inbreeding depression in maize by selfing and full-sibbing.
Crop Sci. 17:735–740.
Goodman, M.M. 1965. Estimates of genetic variance in adapted and exotic populations of maize.
Crop Sci. 5:87–90.
Goodman, M.M. 1985. Exotic maize germplasm: Status, prospects, and remedies. Iowa State J.
Res. 59:497–527.
Goodman, M.M. 1999a. Developing temperate inbreds from tropical germplasm: Rationale,
results, and conclusions. Illinois Corn Breeders’ School 35:1–19.
Goodman, M.M. 1999b. Broadening the genetic diversity in maize breeding by use of exotic
germplasm. pp. 139–148. In J.G. Coors and S. Pandey (eds.) Genetics and Exploitation of
Heterosis in Crops. ASA, CSSA, and SSSA, Madison, WI.
Goodman, M.M. and W.L. Brown. 1988. Races of corn. pp. 33–79. In G.F. Sprague and
J.W. Dudley (eds.) Corn and Corn Improvement. 3rd ed. ASA, CSSA, SSSA, Madison, WI.
Goodsell, S. 1961. Male sterility in corn by androgenesis. Crop Sci. 1:227–228.
Gowen, J.W. (ed.). 1952. Heterosis. Iowa State University Press, Ames, IA.
Griffing, B. and E.W. Lindstrom. 1954. A study of combining abilities of corn inbreds having
varying proportions of Corn Belt and non-Corn Belt germplasm. Agron. J. 46:845–852.
Gutierrez-Gaitan, M.A., H. Cortez-Mendoza, E.N. Wathika, C.O. Gardner, M. Oyervides-Garacia,
A.R. Hallauer, and L.L. Darrah. 1986. Testcross evaluations of Mexican maize populations.
Crop Sci. 26:99–104.
Hadi, G. 2004. Improvement of commercial maize lines through the integration of genes and gene
combinations from elite lines. Acta Agron. Hungarica 52:69–74.
Hainzelin, E. 1998. Exotic introgression incidence on two elite tropical maize populations.
Maydica 43:19–26.
Hallauer, A.R. 1985. Compendium of recurrent selection methods and their application. Critical
Rev. Plant Sci. 3(1):1–33.
Hallauer, A.R. 1987. Maize. pp. 249–294. InW.R. Fehr (ed.) Principles of Cultivar Development.
Vol. 2. Macmillan Publishing Co., New York.
Hallauer, A.R. 1990. Methods used in developing maize inbreds. Maydica 55:1–16.
Hallauer, A.R. 1992. Recurrent selection in maize. Plant Breed. Rev. 9:115–179.
Hallauer, A.R. 1994. Corn genetics and breeding. Encycl. Agric. Sci. 1:455–467. Academic Press,
Inc., New York. NY.
Hallauer, A.R. 1999a. Temperate maize and heterosis. pp. 353–36. In J.G. Coors and S. Pandey
(eds.) The Genetics and Exploitation of Heterosis in Crops. ASA, CSSA, SSSA, Madison, WI.
90 A.R. Hallauer, M.J. Carena
Hallauer, A.R. 1999b. Conversion of tropical germplasm for temperate area use. Illinois Corn
Breeders’ School 35:20–36.
Hallauer, A.R. (ed.). 2001. Specialty Corns. 2nd ed. CRC Press LLC, Boca Raton, FL.
Hallauer, A.R. 2002. Integration of germplasm improvement with corn breeding. Illinois Corn
Breeders’ School 38:11–41.
Hallauer, A.R. 2003. Conversion of tropical germplasm for temperate area. Proc. Annual Corn
Sorghum Ind. Res. Conf. 58:187–200.
Hallauer, A.R. 2004. Specialty corns. pp. 897–933. In C.W. Smith, J. Betra’n, and E.C.A. Runge
(eds.) Corn: Origin, History, Technology, and Production. John Wiley & Sons, Inc.,
Hoboken, NJ.
Hallauer, A.R. 2006. Defining and achieving plant-breeding goals. pp. 73–89. InK.R. Lamkey and
M. Lee (eds.) Plant Breeding: The Arnel R. Hallauer International Symposium. Blackwell
Publishing, Oxford, UK.
Hallauer, A.R. 2006. History, contribution and future of quantitative genetics in plant breeding:
Lessons from maize. In R. Bernardo (ed.) International Plant Breeding Symposium. August
20–26, 2006, Mexico City.
Hallauer, A.R. and S.A. Eberhart. 1970. Reciprocal full-sib selection. Crop Sci. 10:315–316.
Hallauer, A.R. and E. Lopez-Perez. 1979. Comparisons among testers for evaluating lines of corn.
Proc. Annu. Corn Sorghum Ind. Res. Conf. 34:57–75.
Hallauer, A.R. and J.B. Miranda, 1988. Quantitative Genetics in Maize Breeding. 2nd ed. Iowa
State University Press. Ames, IA.
Hallauer, A.R. and J.H. Sears. 1969. Mass selection for yield in two varieties of maize. Crop Sci.
9:47–50.
Hallauer, A.R. and J.H. Sears. 1973. Changes in quantitative traits associated with inbreeding in a
synthetic variety of maize. Crop Sci. 13:327–330.
Hallauer, A.R., W.A. Russell, and O.S. Smith. 1983. Quantitative analysis of Iowa Stiff Stalk
Synthtic. pp. 105–118. In J.P. Gustafson (ed.) 15th Stadler Genetics Symposium. Columbia,
MO.
Hallauer, A.R., W.A. Russell, and K.R. Lamkey. 1988. Corn breeding. pp. 463–564. InG.F. Sprague and J.W. Dudley (eds.) Corn and Corn Improvement. 3rd ed. CSSA,Madison,WI.
Hallauer, A.R., A.J. Ross, and M. Lee. 2004. Long-term divergent selection for ear length in
maize. pp. 153–168. In J. Janick (ed.) Plant Breed. Rev. Vol. 24, Part 2. John Wiley & Sons,
Inc., Hoboken, NJ.
Hameed, A., L.M. Pollak, and P.N. Hinz. 1994. Evaluation of Cateto maize accessions for grain
yield and other agronomic traits in temperate and tropical environments. Crop Sci. 34:270–
275.
Hammond, J.J. and M.J. Carena. 2008. A breeding plan with molecular markers. In Agronomy
Abstracts [CD-ROM computer file]. ASA, Madison, WI.
Han, G. and A.R. Hallauer. 1989. Estimates of genetic variability in F2 maize populations. J. Iowa
Acad. Sci. 96:277–313.
Hanson, W.D. 1959. The breakup of initial linkage blocks under selected mating systems. Genetics
44:857–868.
Hanson, W.D. 1963. Heritability. pp. 125–140. In W.D. Hanson and H.F. Robinson (eds.)
Statistical Genetics and Plant Breeding. NAS-NCR Publication 982.
Harrison, M.N. 1967. Selection of source material and methods of formation of composites for
maize breeding. Paper presented at Eastern African Cereals Research Conference.
Hartley, C.P. 1908. Utilization of Corn Variations. pp. 13–27. Ohio Crop Imp. Association Annual
Report.
Hawbaker, M.S., W.H. Hill, and M.M. Goodman. 1997. Application of recurrent selection for low
moisture content in tropical maize (Zea mays L.). I. Testcross yield trials. Crop Sci. 37:1650–
1655.
Hayes, H.K. 1956. I Saw Hybrid Corn Develop. Proc. Annu. Corn Sorghum Ind. Res. Conf. 11:48–
55.
Maize Breeding 91
Hayman, B.I. 1958. The separation of epistatic from additive and dominance in generation means.
Heredity 12:371–390.
Hayman, B.I. 1960. The separation of espistatic from additive and dominance variation in
generation means. II. Genetica 31:133–146.
Hazel, L.N. and J.L. Lush. 1942. The efficiency of three methods of selection. J. Hered. 33:393–
399.
Henderson, C.R. 1963. Selection index and expected genetic advances. pp. 141–163. InW.D. Hanson and H.F. Robinson (eds.) Statistical Genetics and Plant Breeding. NAS-NRC
Publication 982.
Hofbeck, M.D., S.J. Openshaw, J.L. Geadelmann, R.H. Peterson, and D.D. Stuthman. 1995.
Backcrossing and intermating in an exotic adapted cross of maize. Crop Sci. 35:1359–1364.
Holland, J.B. and M.M. Goodman. 1995. Combining ability of tropical maize accessions with U.S.
germplasm. Crop Sci. 35:767–773.
Holley, R.N. and M.M. Goodman. 1988a. Stalk quality and stalk rot resistance of tropical hybrid
maize derivatives. Plant Dis. 72:321–324.
Holley, R.N. and M.M. Goodman. 1988b. Yield potential of tropical maize derivatives. Crop Sci.
28:213–218.
Holley, R.N., P.B. Hamilton, and M.M. Goodman. 1989. Evaluation of tropical germplasm for
resistance to kernel colonization by Fusarium moniliforme. Plant Dis. 73:578–580.Hopkins, C.G. 1899. Improvement in the chemical composition of the corn kernel. Bull. Ill. Agric.
Exp. Stn. 55:205–240.
Horner, E.S., E. Magloire, and J.A. Morera. 1989. Comparison of selection for S2 progeny vs.
testcross performance for population improvement in maize. Crop Sci. 29:868–874.
Hudson, J.C. 1994. Making the Corn Belt. Indiana University Press, Bloomington & Indianapolis,
IN.
Hull, F.H. 1945. Recurrent selection and specific combining ability in corn. J. Am. Soc. Agron.
37:134–145.
Ito, G.M. and J. Brewbaker. 1981. Genetic advance through mass selection for tenderness in corn.
J. Am. Soc. Hort. Sci. 106:496–499.
Janick, J. (ed.). 2004. Long-term selection: Maize. Plant Breed. Rev. Vol. 24, Part 1. John Wiley &
Sons, Inc., Hoboken, NJ.
Jenkins, M.T. 1928. Correlation studies with inbred and crossbred strains of maize. J. Agric. Res.
39:677–721.
Jenkins, M.T. 1934. Methods of estimating the performance of double crosses in corn. J. Am. Soc.
Agron. 26:199–204.
Jenkins, M.T. 1935. The effect of inbreeding and of selection within inbred lines of maize upon
hybrids made after successive generations of selfing. Iowa State Coll. J. Sci. 9:429–450.
Jenkins, M.T. 1936. Corn improvement. pp. 455–522. In Yearbook of Agriculture, 1936. U.S.
Gov. Print. Office, Washington, DC.
Jenkins, M.T. 1940. The segregation of genes affecting yield of grain in maize. J. Am. Soc. Agron.
32:55–63.
Jenkins, M.T. and A.M. Brunson. 1932. Methods of testing inbred lines of maize in crossbred
combinations. J. Am. Soc. Agron. 24:523–530.
Jenkins, M.T., A.L. Robert, and W.F. Findley, Jr. 1954. Recurrent selection as a method for
concentrating genes for resistance to Helminthosporium turcicum leaf blight in corn. Agron.
J. 46:89–94.
Jensen, S.D., W.E. Kuhn, and R.L. McConnell. 1983. Combining ability in elite U.S. maize
germplasm. Proc. Annu. Corn Sorghum Ind. Res. Conf. 38:87–96.
Johnson, G.R. 1982. Two-locus theory in recurrent selection for general combining ability in
maize. Theor. Appl. Genet. 61:279–283.
Johnson, G.R. 2004. Marker-assisted selection. pp. 293–309. In J. Janick (ed.) Plant Breed. Rev.
24, Part 1. John Wiley & Sons, Inc., Hoboken, NJ.
92 A.R. Hallauer, M.J. Carena
Johnson, E.C., K.S. Fisher, G.O. Edmeades, and A.F.E. Palmer. 1986. Recurrent selection for
reduced plant height in lowland tropical maize. Crop Sci. 26:253–260.
Jones, D.F. 1918. The effects of inbreeding and cross breeding upon development. Connecticut
Agric. Exp. Stn. Bull. 207:5–100.
Jones, L.P., W.A. Compton, and C.O. Gardner. 1971. Comparison of full-sib and half-sib recurrent
selection. Theor. Appl. Genet. 41:36–39.
Jumbo, M.B., and M.J. Carena. 2007. Combining ability, maternal, and reciprocal effects of elite
early-maturing maize population hybrids [online]. Euphytica. Available at http://springerlink.
com/content/x4455x4657455803.
Kaeppler, S. 2004. Biotechnology: New horizons. pp. 399–425. In C.W. Smith, J. Betra’n, and
E.C.A. Runge (eds.) Corn: Origin, History, and Production. John Wiley & Sons, Hoboken, NJ.
Kauffmann, K.D. and J.W. Dudley. 1979. Selection indices for corn grain yield, percent protein
and kernel weight. Crop Sci. 19:583–588.
Kauffmann, K.D., C.W. Crum, and M.F. Lindsey. 1982. Exotic germplasm in a corn breeding
program. Illinois Corn Breeders’ School 18:6–39.
Keeratinijakal, V. and K.R. Lamkey. 1993. Responses to reciprocal recurrent selection in BSSS
and BSCB1 maize populations. Crop Sci. 33:73–77.
Kermicle, J.L. 1969. Androgenesis conditioned by a mutation in maize. Science 166:1422–1424.
Kim, S.K., J.L. Brewbaker, and A.R. Hallauer. 1988. Insect and disease resistance from tropical
maize for use in temperate zone hybrids. Proc.Annu.CornSorghum Ind. Res. Conf. 43:194–226.
Knapp, S.J. 1998. Marker-assisted selection as a strategy for increasing the probability of selecting
superior genotypes. Crop Sci. 38:1164–1174.
Kraja, A., J.W. Dudley, and D.G. White. 2000. Identification of tropical and temperate maize
populations having favorable alleles for disease resistance. Crop Sci. 40:948–954.
Kramer, H.H. and A.J. Ullstrup. 1959. Preliminary evaluations of exotic maize germplasm.
Agron. J. 51:687–689.
Lambert, R.J. 1984. Reciprocal recurrent selection of maize in a high-yield environment. Maydica
29:419–430.
Lamkey, K.R. and M. Lee. 1993. Quantitative genetics, molecular markers, and plant improve-
ment. pp. 104–115. In B.C. Imire and J.B. Hacker (eds.) Focused Plant Improvement; Towards
Responsible and Sustainable Agriculture. Proceedings of the 10th Australian Plant Breeding
Conference. April 18–23, 1993. Gold Coast, Canberra.
Larkin, P.J. and W.R. Scowcroft. 1981. Somaclonal variation – A novel source of variability from
cell cultures for plant improvement. Theor. Appl. Genet. 60:197–214.
Lee, M. 1995. DNA markers and plant breeding programs. Adv. Agron. 55:265–344.
Lee, M., J.L. Geadelmann, and R.L. Phillips. 1988. Agronomic evaluation of inbred lines derived
from tissue cultures of maize. Theor. Appl. Genet. 75:841–849.
Lee, E.A., A. Singh, M.J. Ash, and B. Good. 2006. Use of sister lines and the performance of
modified single-cross maize hybrids. Crop Sci. 46:312–320.
Lile, S.M. and A.R. Hallauer. 1994. Relation between S2 and later generation testcrosses of two
corn populations. J. Iowa Acad. Sci. 101:19–23.
Lindstrom, E.W. 1939. Analysis of modern maize breeding principles and methods. Proc. 7th Intl.
Genet. Congress 7:191–196.
Lonnquist, J.H. 1964. A modification of the ear-to-row procedure for the improvement of maize
populations. Crop Sci. 4:227–228.
Lonnquist, J.H. 1967. Mass selection for prolificacy in maize. Zuchter 37:185–188.
Lonnquist, J.H. 1974. Consideration and experiences with recombinations of exotic and Corn Belt
maize germplasm. Proc. Annu. Corn Sorghum Ind. Res. Conf. 29:102–117.
Lush, J.L. 1945. Animal Breeding Plans. Iowa State University Press, Ames, IA.
Mahmud, I. and H.H. Kramer. 1951. Segregation for yield, height, and maturity following a
soybean cross. Agron. J. 43:605–609.
Majaya, M.J. and R.J. Lambert. 1992. Improving performance of adapted corn hybrid using exotic
inbred. Indonesian J. Crop Sci. 7:55–62.
Maize Breeding 93
Mareck, J.H. and C.O. Gardner. 1979. Responses to mass selection in maize (Zea Mays L.)
cultivars Hays Golden and Nebraska-5010. Crop Sci. 19:779–783.
Mangelsdorf, P.C. 1974. Corn: Its Origin, Evolution, and Improvement. Harvard University Press,
Cambridge, MA.
Marks, R.E. 1993. Cortes: The Great Adventurer and the Fate of Aztec Mexico. A.A. Knopf. New
York. NY.
Marquez-Sanchez, F. 1982. Modifications to cyclic hybridization in maize with single-eared
plants. Crop Sci. 22:314–319.
Marquez-Sanchez, F. and N. Gomez-Montrel. 1988. Seed increase of half-sib families in the
modified ear-to-row method of selection in maize with additional genetic gain. Maydica
33:223–226.
Marquez-Sanchez, F. and A.R. Hallauer. 1970a. Influence of sample size on the estimation of
genetic variances in a synthetic variety of maize. I. Grain yield. Crop Sci. 10:357–361.
Marquez-Sanchez, F. and A.R. Hallauer. 1970b. Influence of sample size on the estimation of
genetic variances in a synthetic variety of maize. II. Plant and ear characters. Iowa State J. Sci.
44:423–436.
Mather, K. 1949. Biometrical Genetics. Methuen, London.
Melani, M.D. and M.J. Carena. 2005. Alternative maize heterotic patterns for the Northern Corn
Belt. Crop Sci. 45:2186–2194.
Melchinger, A.E., M.M. Messmer, M. Lee, W.L. Woodman, and K.R. Lamkey. 1991. Diversity
and relationships among U.S. maize inbreds revealed by restriction fragment length poly-
morphisms. Crop Sci. 31:669–678.
Menz, M.A. and A.R. Hallauer. 1997. Reciprocal recurrent selection of two tropical corn popula-
tions adapted to Iowa. Maydica 42:239–246.
Menz, M.A., A.R. Hallauer, and W.A. Russell. 1999. Comparative response to selection of two
reciprocal recurrent selection procedures in BS21 and BS22 maize populations. Crop Sci.
39:89–97.
Mertz, E.T., L.S. Bates, and O.E. Nelson. 1964. Mutant gene that changes protein composition and
increases lysine content of maize endosperm. Science 145:279–280.
Michelini, L.A. and A.R. Hallauer. 1993. Evaluation of exotic and adapted maize (Zea mays L.)germplasm crosses. Maydica 38:275–282.
Mikel, M.A. 2006. Availability and analysis of proprietary dent corn inbred lines with expired U.S.
Plant Variety Protection. Crop Sci. 46:2555–2560.
Mikel, M.A. and J.W. Dudley. 2006. Evolution of North American dent corn from public to
proprietary germplasm. Crop Sci. 46:1193–1206.
Miles, J.W., J.W. Dudley, D.G. White, and R.J. Lambert. 1981. Response to selection for
resistance to four diseases in two corn populations. Crop Sci. 21:980–983.
Mishra, T.N. 1977. Classification of maize populations into heterotic groups. M. Ag. University
Minnesota., St. Paul, MN.
Mock, J.J. and R.B. Pearce. 1975. An ideotype of maize. Euphytica 24:613–623.
Moll, R.H. and W.D. Hanson. 1984. Comparisons of effects of intrapopulation vs. interpopulation
selection in maize. Crop Sci. 24:1047–1052.
Moll, R.H. and H.F. Robinson. 1966. Observed and expected response in four selection experi-
ments in maize. Crop Sci. 319–324.
Moll, R.H. and C.W. Stuber. 1971. Comparisons of response to alternative selection procedures
initiated with two populations of maize. Crop Sci. 11:706–711.
Moll, R.H. and C.W. Stuber. 1974. Quantitative genetics. Empirical results relative to plant
breeding. Adv. Agron. 26:277–313.
Moll, R.H., W.S. Salhuana, and H.F. Robinson. 1962. Heterosis and genetic diversity in variety
crosses of maize. Crop Sci. 2:197–198.
Moll, R.H., J.H. Lonnquist, J.V. Fortuno, and E.J. Johnson. 1965. The relationship of heterosis and
genetic divergence in maize. Genetics 42:139–144.
94 A.R. Hallauer, M.J. Carena
Moll, R.H., C.W. Stuber, and W.D. Hanson. 1975. Correlated responses and responses to index
selection involving yield and ear height of maize. Crop Sci. 15:243–248.
Moll, R.H., A. Bari, and C.W. Stuber. 1977. Frequency distribution of maize yield before and after
reciprocal selection. Crop Sci. 17:794–796.
Mongoma, C. and L.M. Pollak. 1988. Heterotic patterns among 10 Corn Belt and exotic maize
populations. Crop Sci. 28:500–504.
Moreno-Gonzalez, J. and J.W. Dudley. 1981. Epistasis in related and unrelated maize hybrids
determined by three methods. Crop Sci. 21:644–651.
Moreno-Gonzalez, J. and A.R. Hallauer. 1982. Combined S2 and crossbred family selection in
full-sib reciprocal recurrent selection. Theor. Appl. Genet. 61:353–358.
Mulamba, N.N. and J.J. Mock. 1978. Improvement of yield potential of the Eto Blanco maize (Zeamays L.) population by breeding for plant traits. Egypt. J. Genet. Cytol. 7:40–51.
Narro, L.N. 1990. Direct and correlated response for earliness in a tropical maize population. Ph.D.
Diss. Iowa State University, Ames, IA (Diss. Abstr. DAI-B 51/07, p. 3196, January 1991).
Nelson, H.G. 1972. The use of exotic germplasm in practical corn breeding programs. Proc. Annu.
Corn Sorghum Ind. Res. Conf. 27:115–118.
Neuffer, M.G., L. Jones, and M.S. Zuber. 1968. Mutants of Maize. CSSA, Madison, WI.
Obaidi, M., B.B. Johnson, L.D. Van Vleck, S.D. Kachman, and O.S. Smith. 1998. Family per se
response in selfing and selection in maize based on testcross performance: A simulation study.
Crop Sci. 38:367–371.
Obilana, A.T. and A.R. Hallauer. 1974. Estimation of variability of quantitative traits in BSSS by
using unselected maize inbred lines. Crop Sci. 14:99–103.
Odhiambo, M.O. and W.A. Compton. 1987. Twenty cycles of divergent mass selection for seed
size in corn. Crop Sci. 27:113–116.
Oyervides-Garcia, M., A.R. Hallauer, and H. Cortez-Mendoza. 1985. Evaluation of improved
maize populations in Mexico and U.S. Corn Belt. Crop Sci. 25:115–120.
Pandey, S. and C.O. Gardner. 1992. Recurrent selection for population, variety, and hybrid
improvement in tropical maize. Adv. Agron. 48:1–87.
Paterniani, E. and R. Vencovsky. 1977. Reciprocal recurrent selection (Zea mays L.) based on
testcrosses of half-sib families. Maydica 22:141–152.
Paterniani, E. and R. Vencovsky. 1978. Reciprocal recurrent selection based on half-sib progenies
and prolific plants in maize (Zea mays L.). Maydica 23:209–219.
Peiris, B.L. and A.R. Hallauer. 2005. Comparison of half-sib and full-sib reciprocal recurrent
selection and their modifications in simulated populations. Maydica 50:1–13.
Pesek, J. and R.J. Baker. 1969. Desired improvement in relation to selection indices. Can. J. Plant
Sci. 49:803–804.
Peterson, P.A. 1986. Mobile elements in maize: A force in evolutionary and plant breeding
processes. pp. 47–78. In J.P. Gustafson, G.L. Stebbens, and F.J. Ayala (eds.) Genetics,
Development, and Evolution: 17th Stadler Genet. Sym. Plenum Press, New York. NY.
Peterson, P.A. 1987. Mobile elements in plants. CRC Crit. Rev. Plant Sci. 6(2):105–208.
Plaisted, R.L. and L.C. Peterson. 1959. A technique for evaluating the ability of selections to yield
consistently in different locations or seasons. Potato J. 36:381–385.
Pollak, L.M. 2003. The history and success of the public-private project on germplasm enhance-
ment of maize (GEM). Adv. Agron. 78:45–87.
Pollak, L.M. and W. Salhuana. 1999. Lines for improved yield and value-added traits – Results
from GEM. Proc. Annu. Corn Sorghum Ind. Res. Conf. 53:143–158.
Rawlings, J.O. 1970. Present status of research on long and short term recurrent selection in finite
populations – Choice of population size. pp. 1–15. In Proc. 2nd Meet. Work Group Quant.
Genet., Sec. 22. IUFRO, Raleigh, NC.
Rawlings, J.C. and D.L. Thompson. 1962. Performance level as criterion for the choice of maize
testers. Crop Sci. 2:217–220.
Richey, F.D. 1922. The experimental basis for the present status of corn breeding. J. Am. Soc.
Agron. 14:1–17.
Maize Breeding 95
Richey, F.D. 1944. The shattered dreams of a corn breeder. Agron. J. 44:267–268.
Rinke, E.H. and J.C. Sentz. 1962. Moving Corn Belt Dent germplasm northward. Proc. Hybrid
Corn Ind. Res. Conf. 16:53–56.
Richey, F.D. 1950. Corn breeding. Adv. Genet. 3:159–192.
Rodriguez, O.A. and A.R. Hallauer. 1991. Variation among full-sib families of corn in different
generations of inbreeding. Crop Sci. 31:43–47.
Russell, W.A. 1971. Types of gene action at three gene loci in sublines of a maize inbred line. Can.
J. Genet. Cytol. 13:322–334.
Russell, W.A. 1991. Genetic improvements in maize yields. Adv. Agron. 46:245–298.
Russell, W.A. and S.A. Eberhart. 1970. Effects of three gene loci in the inheritance of quantitative
characters in maize. Crop Sci. 10:165–169.
Russell, W.A. and S.A. Eberhart. 1975. Hybrid performance of selected maize lines from recipro-
cal recurrent and testcross selection programs. Crop Sci. 15:1–4.
Russell, W.A. and A.R. Hallauer. 1980. Corn. pp. 299–312. In W.R. Fehr and H.H. Hadley (eds.)
Hybridization of Crop Plants. ASA and CSSA, Madison, WI.
Salhuana, W., R. Sevilla, and S.A. Eberhart. 1997. Latin American Maize Project (LAMP) Final
Report. Pioneer Hi-Bred International Spec. Publ.
Schmidt, D.H. and A.R. Hallauer. 1995. Inheritance and number of genes affecting quantitative
traits within F2 maize populations. J. Iowa Acad. Sci. 102:32–40.
Schnell, F.W. 1975. Type of variety and average performance in hybrid maize. Z. Pflanzenzuchtg
74:177–188.
Schnicker, B.J. and K.R. Lamkey. 1993. Interpopulation genetic variance after reciprocal recurrent
selection in BSSS and BSCB1 maize populations. Crop Sci. 33:90–95.
Shamel, A.D. 1905. The effect of inbreeding in plants. pp. 377–392. U.S. Dep. Agric. Yearbook.
Shank, D.B. and M.W. Adams. 1960. Environmental variability within inbred lines and single
crosses of maize. J. Genet. 57:119–126.
Shull, G.H. 1908. The composition of a field of maize. Am. Breeders’ Assoc. Rep. 4:296–301.
Shull, G.H. 1909. A pure-line method of corn breeding. Am. Breeders’ Assoc. Rep. 5:51–59.
Shull, G.H. 1910. Hybridization methods in corn breeding. Am. Breeders’ Mag. 1:98–107.
Silva, J.C. and A.R. Hallauer. 1975. Estimation of epistatic variance in Iowa Stiff Stalk Synthetic
maize. J. Heredity 66:290–296.
Smith, H.F. 1936. A discrimnant function for plant selection. Annu. Eugen. 7:240–250.
Smith, O.S. 1979. A model for evaluating progress from recurrent selection. Crop Sci. 19:223–
226.
Smith, O.S. 1983. Evaluation of recurrent selection in BSSS, BSCB1, and BS13 maize popula-
tions. Crop Sci. 13:35–40.
Smith, O.S. 1986. Covariance between line per se and testcross performance. Crop Sci. 26:540–
543.
Smith, J.S.C. 1988. Diversity of United States hybrid maize germplasm; isozymic and chro-
matographic evidence. Crop Sci. 28:63–69.
Smith, J.S.C. and O.S. Smith. 1991. Restriction fragment length polymorphisms can differentiate
among U.S. maize hybrids. Crop Sci. 31:893–899.
Smith, D.R. and D.G. White. 1988. Diseases of corn. pp. 687–766. In G.F. Sprague and J.W.
Dudley (eds.) Corn and Corn Improvement. 3rd ed. ASA, CSSA, and SSSA, Madison, WI.
Smith, O.S., A.R. Hallauer, and W.A. Russell. 1981. Use of index selection in recurrent selection
programs in maize. Euphytica 30:611–618.
Smith, J.S.C., M.M. Goodman, and C.W. Stuber. 1985. Genetic variability within U.S. maize
germplasm. II. Widely-used inbred lines 1970 to 1979. Crop Sci. 25:681–685.
Snape, J.W. 1989. Doubled haploid breeding: Theoretical basis and practical applications. pp.
19–30. In A. Mujeeb-Kazi and L.A. Sitch (eds.) Rev. Adv. in Plant Biotech., 1985–1988. 2nd
Int’l. Sym. Genet. Manipulation in Crops. CIMMYT Mexico and IRRS, Philippines.
Spitko, T., L. Sagi, J. Printer, L.C. Marton, and B. Barnabas. 2006. Haploid regeneration aptitude
of maize (Zea mays L.) lines of various origin and of their hybrids. Maydica 34:537–542.
96 A.R. Hallauer, M.J. Carena
Sprague, G.F. 1946a. Early testing of inbred lines. J. Am. Soc. Agron. 38:108–117.
Sprague, G.F. 1946b. The experimental basis for hybrid maize. Biol. Rev. 21:101–120.
Sprague, G.F. 1955. Corn breeding. pp. 221–292. In G.F. Sprague (ed.) Corn and Corn Improve-
ment. Academic Press, New York. NY.
Sprague, G.F. and W.T. Federer. 1951. A comparison of variance components in corn yield trials.
II. Error, year� variety, location �variety, and variety components. Agron. J. 43:535–541.
Sprague, G.F. and L.A. Tatum. 1942. General vs. specific combining ability in single crosses of
corn. J. Am. Soc. Agron. 34:923–932.
Stringfield, G.H. 1947. Grouping of inbred lines for breeding purposes. p. 25. In Rep. 9th Corn
Impr. Conf. North Central Region. Cincinnati, OH. November 16, 1947.
Stringfield, G.H. 1974. Developing heterozygous parent stocks for hybrids. DeKalb AgResearch,
DeKalb, IL.
Stuber, C.W. 1978. Exotic sources for broadening genetic diversity in corn breeding programs.
Proc. Annu. Corn Sorghum Ind. Res. Conf. 33:35–47.
Sturtevant, E.L. 1899. Varieties of corn. USDA Off. Exp. Stn. Bull. 57:1–108.
Subandi, W.A. Compton, and L.T. Empig. 1973. Comparison of the efficiencies of selection
indices for three traits in two variety crosses of corn. Crop Sci. 13:184–186.
Suwataradon, K., S.A. Eberhart, J.J. Mock, J.C. Owens, and W.D. Guthrie. 1975. Index selection
for several agronomic traits in the BSSS2 maize population. Crop Sci. 15:827–833.
Tallury, S.P. and M.M. Goodman. 1999. Experimental evaluation of the potential of tropical
germplasm for temperate maize improvement. Theor. Appl. Genet. 98:54–61.
Tanksley, S.D. 1993. Mapping polygenes. Annu. Rev. Genet. 27:205–233. Palo Alto, CA.
Tanner, A.H. and O.S. Smith. 1987. Comparison of half-sib and S1 recurrent selection in Krug
Yellow Dent maize populations. Crop Sci. 27:509–513.
Tatum, L.A. 1971. The southern corn leaf blight epidemic. Science 171:1113–1116.
Thompson, D.L. 1954. Combining ability of homozygous diploids of corn relative to lines derived
by inbreeding. Agron. J. 46:133–136.
Thompson, D.L. 1968. Silage yield of exotic corn. Agron. J. 60:579–581.
Torregroza, M. 1973. Response of a highland maize synthetic to eleven cycles of divergent mass
selection for ears per plant. p. 16. Agron. Abstr., ASA, Madison, WI.
Troyer, A.F. 1999. Background of U.S. hybrid corn. Crop Sci. 39:601–626.
Troyer, A.F. 2001. Temperate corn – Background, behavior, and breeding. pp. 393–466. In A.R.
Hallauer (ed.) Specialty Corns. 2nd ed. CRC Press, Boca Raton, FL.
Troyer, A.F. 2004a. Background of U.S. hybrid corn. II: Breeding, climate and food. Crop Sci.
44:370–380.
Troyer, A.F. 2004b. Persistent and popular germplasm in seventy centuries of corn evolution. pp.
133–231. In C.W. Smith, J. Betra’n, and E.C.A. Runge (eds.) Corn: Origin, History, and
Production. John Wiley & Sons, Hoboken, NJ.
Troyer, A.F. 2006. Adaptedness and heterosis in corn and mule hybrids. Crop Sci. 46:528–543.
Troyer, A.F. and W.L. Brown. 1972. Selection for early flowering in corn. Crop Sci. 12:301–304.
Troyer, A.F. and W.F. Brown. 1976. Selection for early flowering in corn: Seven late synthetics.
Crop Sci. 16:767–772.
Uhr, D.V. and M.M. Goodman. 1995. Temperate maize inbreds from tropical germplasm.
I. Testcross yield trials. Crop Sci. 35:779–784.
Vasal, S.K., A. Ortega, and S. Pandey. 1982. CIMMYT’s maize germplasm management,
improvement, and utilization program. CIMMYT, El Batan, Mexico.
Vasal, S.K., H. Cordova, S. Pandey, and G. Srinivasan. 1999. Tropical maize and heterosis. pp.
363–373. In J.G. Coors and S. Pandey (eds.) Genetics and Exploitation of Heterosis in Crops.
ASA, CSSA, and SSSA, Madison, WI.
Vasal, S.K. 2001. High quality protein corn. pp. 85–129. In A.R. Hallauer (Ed.) Specialty corns.
2nd Ed., CRC Press LLC, Boca raton, FL.
Wallace, W.A. and W.L. Brown. 1988. Corn and Its Early Fathers. Iowa State University Press
(Rev. ed.), Ames, IA.
Maize Breeding 97
Warner, J.N. 1952. A method for estimating heritability. Agron. J. 44:427–430.
Weatherspoon, J.H. 1970. Comparative yields of single, three-way and double crosses of maize.
Crop Sci. 10:157–159.
Weber, C.R. and B.R. Morthy. 1952. Heritable on nonheritable relationships and variability of oil
content and agronomic characters in the F2 generation of soybean crosses. Agron. J. 44:204–209.
Wellhausen, E.J. 1956. Improving American corn with exotic germplasm. Proc. Annu. Corn
Sorghum Ind. Res. Conf. 11:85–96.
Wellhausen, E.J. 1965. Exotic germplasm for improvement of Corn Belt maize. Proc. Annu. Corn
Sorghum Ind. Res. Conf. 20:31–45.
West, D.R., W.A. Compton, and M.A. Thomas. 1980. A comparison of replicated S1 per se vs.
reciprocal full-sib selection in corn. I. Indirect response to population densities. Crop Sci.
20:35–42.
Westgate, M.E., M.E. Otegui, and F.H. Andrade. 2004. Physiology of the corn plant. pp. 235–303.
In C.W. Smith, J. Betra’n, and E.C.A. Runge (eds.) Corn: Origin, History, and Produciton. John
Wiley & Sons, Hoboken, NJ.
Weyhrich, R.A., K.A. Lamkey, and A.R. Hallauer. 1998. Responses to seven methods of recurrent
selection in the BS11 maize population. Crop Sci. 38:308–321.
Whitehead, F.C. 2002. Backcross introgression and two-stage testing for conversion of improved
tropical germplasm to temperate environments. Ph.D. Diss. Iowa State University, Ames, IA
(Diss. Abstr. DAI-B 63/04, p. 1617, Oct. 2002).
Whitehead, F.C., H.G. Caton, A.R. Hallauer, S. Vasal, and H. Cordova. 2006. Incorporation of
elite subtropical and tropical maize germplasm into elite temperate germplasm. Maydica
51:43–56.
Widstrom, N.W. 1974. Selection indices for resistance to corn earworm based on realized gains in
corn. Crop Sci. 14:673–675.
Widstrom, N.W., B.R. Wiseman, andW.W.McMillan. 1982. Response to index selection in maize
resistant to ear damage by corn earworm. Crop Sci. 22:843–846.
Wilkes, G. 2004. Corn, strange, and marvelous: But is a definitive origin known? pp. 3–63. InC.W. Smith, J. Betra’n, and E.C.A. Runge (eds.) Corn: Origin, History, Technology, and
Production. Wiley & Sons, Inc., Hoboken, NJ.
Williams, W.P. and F.M. Davis. 1983. Recurrent selection for resistance in corn to tunneling by
the second-brood southwestern corn borer. Crop Sci. 23:169–171.
Williams, T.R. and A.R. Hallauer. 2000. Genetic diversity among maize hybrids. Maydica
45:163–171.
Wolf, D.P. and A.R. Hallauer. 1997. Triple testcross analysis to detect epistasis in maize. Crop Sci.
37:763–770.
Wolf, D.P., L.A. Peternelli, and A.R. Hallauer. 2000. Estimates of genetic variance in an F2population. J. Hered. 91:384–391.
Wricke, W. 1962. Uber eine method zurerlassung der kologischen kologischen streubreite in
felduersuchen. Z. Pflazurcht 47:92–96.
Zuber, M.S., M.L. Fairchild, A.J. Keaster, V.L. Fergason, G.F. Krause, E. Hildebrant, and P.J.
Loesch, Jr. 1971. Evaluation of 10 generations of mass selection for corn earworm resistance.
Crop Sci. 11:16–18.
98 A.R. Hallauer, M.J. Carena
Rice Breeding
Elcio P. Guimaraes
Abstract This chapter deals with breeding aspects of one of the most important
crops for food security in the world. Initially it shows how diverse rice is with 22
species, different levels of ploidy and six diversity groups. The choice of parents
for crossing, when having such wide genetic diversity available, requires careful
characterization and evaluation of the germplasm as well as good knowledge and
breeding skills to make the right decisions. Rice breeders have been very successful
in improving the crop. Some milestones are: the contribution to the green revolution
with the semi-dwarf varieties, the new rice plant type, hybrid rice, and the NERICA
rice. Even though there was a series of breakthroughs the main breeding goals in
most national programs remain similar since a long time ago: increasing grain yield
potential, resistance to blast disease, grain quality, and drought tolerance. The main
breeding method used to improve rice is the pedigree, but development of hybrids
and population improvement were added to the breeder’s portfolio. Breeders have
been taking advantage of biotechnology tools to enhance their breeding capacity;
however, many national programs are still struggling on how to integrate them into
the breeding programs and how to balance the allocation of resources between
conventional and modern tools. The chapter closes with information on the rice
breeding capacity around the world, showing that rice breeders are widely
distributed across all regions and the existing capacity, using the above mentioned
information, will still be able to cope with the challenge of making genetic progress
for one of the most important food security crops.
1 Introduction
Rice is the world’s most important food crop with a total production around 600
million ton occupying 11% of the world’s total arable land; it supplies 2,808
calories/person/day, which represents 21% of the total calorie supply. It is source
E.P. Guimaraes
Food and Agriculture Organization of the United Nations (FAO), Viale delle Termi di Caracalla,
Crop and Grassland Service (AGPC) – Room C-778, 00153 Rome, Italy,
e-mail: [email protected]
M.J. Carena (ed.), Cereals,The Banks and the Italian EconomyDOI: 10.1007/978-0-387-72297-9, # Springer Science + Business Media, LLC 2009 99
of income for more than 100 million householders around the world (IRRI, 2002). It
is one of the crops responsible for the so-called green revolution that happened in
the 1960s and 1970s. In addition of having strong breeding programs in all different
regions around the world, this crop has three Consultative Groups on International
Agricultural Research (CGIAR) centers with the mandate to work with rice: the
International Rice Research Institute (IRRI), with global mandate; the West Africa
Rice Development Association (WARDA), with mandate to work in West Africa;
and the International Centre for Tropical Agriculture (CIAT), with the regional
mandate for Latin America.
International centers made a tremendous effort to educate and train rice breeders at
the time of the green revolution. Today, 25–35 years later most of the rice breeders
working in national programs around theworld represent that period. The international
germplasm evaluation nurseries [International Rice Testing Program (IRTP) and
International Network for the Genetic Evaluation of Rice (INGER)] were excellent
tools to provide new breeders with improved breeding lines as well as additional
opportunities for training, including hands-on exercises on breeding techniques.
This chapter aims at proving general information on the following matters: the
sources of genetic diversity available to breeders; criteria to be considered when
selecting parental material to generate genetic variability for variety development;
the most relevant breeding achievements; rice breeding methods used around the
world, how biotechnology has been integrated into breeding programs, genetic seed
production strategy; and elements related to the world’s capacity to carry out rice
breeding programs.
2 Genetic Diversity
The success of the breeding strategies relies heavily on the genetic diversity of the
crop. Rice gene banks around the world exhibit a very large amount of genetic
diversity present in farmers’ cultivars, landraces, as well as in the genetic make up
of the 22 Oryza species. At the IRRI, in Manila, Philippines, there are more than
108,000 accessions conserved (Jackson and Lettington, 2003); in addition, there are
hundreds of rice accessions held in trust in other CGIAR centers; WARDA; CIAT;
and International Institute for Tropical Agriculture (IITA). Almost as many acces-
sions are preserved in genebanks in other Asian countries such as China, India,
Indonesia, Philippines, and Thailand (Jackson et al., 1997). Furthermore, consider-
ing that the International Rice Genome Sequencing Project has identified more than
80,000 genes in the rice genome and that each gene has an unknown number of
alleles, the conclusion is that breeders will continue to have useful genetic diversity
to draw on for many generations to come as long as there is a good choice
germplasm.
Rice belongs to the genus Oryza and the various attempts to classify it no
agreement was obtained regarding the number and the names of the species
belonging to this genus. In 1994, Vaughan (1994) published a handbook indicating
100 E.P. Guimaraes
that the genus has 22 species. However, only O. sativa and O. glaberrima are
cultivated. The number of chromosomes of the cultivated rice and its related species
varies from 24 to 48, with the ‘‘n’’ number equal to 12. According to Morishima
(1984), based on the chromosome paring in the meiosis, rice has the following
genomes: AA, BB, CC, EE, and FF for the diploid species and BBCC and CCDD
for the tetraploid species.
The two cultivated species, which are diploid (2n = 24), were domesticated
under different environmental conditions. O. sativa was domesticated in South and
Southeast Asia and has the species O. rufipogon and O. nivara as its direct
ancestors. O. glaberrima comes from tropical West Africa and has O. barthii asprogenitor. The former is cultivated throughout all the rice growing environments
around the world. However, cultivation of the African species is confined to its
region of origin.
Morishima and Oka (1981) divided the cultivated species in two groups called
indica and japonica based on principal component analyses of 11 variety charac-
teristics. Their study indicated that there was no specific characteristic that clearly
distinguished the two groups; however, the existence of the two groups can be
proved by combining two or more characteristics. Khush et al. (1984), using
trisomics, observed a complete correspondence between japonica and indica link-
age blocks; meaning, there was not a single case where genes located in one
japonica chromosome were found in a different indica chromosome. Harushima
et al. (2002) believe that the domestication process caused the differences between
the two groups including their reproductive barriers. The evolutionary process gave
these two groups their distinct characteristics such as tolerance to low temperatures
and drought stress, responsiveness to fertilizers, ability to compete with neighbor-
ing plants, and photosynthetic capacity, among other things.
Based on geographical distribution, Morinaga (1954) described three morphologi-
cal groups called japonica, javanica, and indica. Oka (1958) indicated that japonicaand javanica groups can be considered as tropical and temperate japonicas, respec-tively. The former has tall varieties with heavy panicles (Glaszmann and Arrau-
deau, 1986). The ideal plant type designed by Khush (1994), which can help boost
the rice yields by up to 30%, capitalizes on the genetic variability of this group.
A breakthrough related to rice genetic diversity groups was made by Glaszmann
(1987) who analyzed 1,688 Asian traditional varieties using isozymes and identified
six genetically distinct groups, which were called groups I–VI. Group I encom-
passes the varieties of the tropical regions classified by Oka (1958) as the ‘‘indicas’’.At the other extreme is group VI where there are the varieties adapted to temperate
climates called ‘‘japonicas’’ by Oka (1958). The latter group includes most of the
upland rice varieties.
As rice is cultivated all over the world, its diversity is also due to the wide range
of ecosystems the crop is adapted to. According to IRRI (2002) one way of
categorizing it is to distribute the ecosystems in four broad categories: irrigated,
lowland, upland, and flood-prone. A combination of these ecosystems with differ-
ent agro-ecological zones gives a very complex matrix in which rice genetic
diversity has become available adapting naturally to meet farmers’ demands.
Rice Breeding 101
Even though rice is a rich crop in terms of its genetic diversity, there are several
reports in the literature indicating that the varieties released by the breeding
programs in different parts of the world have a narrow genetic diversity basis.
Cuevas-Perez et al. (1992) and Montalban et al. (1998) presented results on
irrigated and upland rice in Latin America, respectively, indicating that commercial
varieties released for both systems had a narrow genetic base. Guimaraes (2002)
dissected the Brazilian rice varieties and arrived at the same conclusion. Mishra
(2002), considering the breeding approaches used in India and the varieties released
in the last 30 years, concluded: ‘‘the genetic base is narrowing and this is a matter of
concern’’. Evidence was added by Rai (2003) when analyzing the 29 varieties
released in the Indian Kerala State. He also pointed out that in Nigeria there is
genetic uniformity within the upland rice varieties. Dilday (1990) showed similar
results when analyzing the genetic diversity of the rice varieties released in the USA
as well as Kaneda (1985) in Japan. However, as indicated before, these results do
not suggest that this is true when looking at the rice species. For example, Sun et al.
(2001) analyzed O. rufipogon and O. sativa using molecular markers and concluded
that they still have a wide genetic variability with regards of number of alleles,
number of genotypes, heterozygosity, and diversity among genes. In the cultivated
species, they found only 4 exclusive alleles but in the wild species there were 78 of
these alleles. These results indicate the wide genetic variability still present in the
species, mainly in the wild relatives.
Second (1982) found large differences in allelic frequency between the indicaand japonica species. Oka (1964) concluded that the genetic diversity is maintained
within groups independent of whether there are crosses and recombination in the
segregating generations. Junjian et al. (2002) used simple sequence repeat (SSR)
markers and studied the genetic diversity between indica and japonica. They foundsimilar average numbers of alleles: 4.4 and 4.3, respectively. However, the average
genetic distance was greater for the indicas, which suggested a higher level
of genetic variation for this group in relation to the japonica. The two wild species
included in the study (O. rufipogon and O. nivara) fall outside of the range
of cultivated species, suggesting the presence of unique alleles still to be
used by breeders to exploit the between species variability. This knowledge
has been exploited to increase the yield potential of commercial varieties
(Xiao, Li, Grandillo, Ahn, Yuan, Tanksley, and McCouch 1998; Moncada,
Martınez, Borrero, Gauch, Guimaraes, Tohme, and McCouch 2001; Brondani,
Rangel, Brondani, and Ferreira 2002).
The importance of having genetic diversity available is the possibility of making
it useful to develop products that will have an impact at farmers’ field level. Rice
breeders have been exploiting this potential in many different and creative ways.
There are a few examples where exploitation of wild relatives has produced
significant results. The first opportunity to take advantage of the wild relatives’
unique characteristics was through exploiting the existence of genes for disease and
insect resistance. Khush (1977) used O. nivara as a source of resistance to grass
stunt virus resistance and introduced it into IR28, IR29, and IR30 cultivars; also,
from O. rufipogon the resistance to the viral disease called ‘‘tungro’’ was obtained.
102 E.P. Guimaraes
Rice bacterial blight resistance was obtained from O. longistaminata and intro-
duced in the commercial variety IR24 (Khush et al., 1990).
The first hybrid rice was developed based on a genetic cytoplasm male sterility
system identified in the O. sativa L. f. spontanea in China (Shih-Cheng and Loung
Ping, 1980). Khush (1994) combined different genetic groups (tropical japonicas,temperate indicas, and japonicas) in order to create a new rice type expected to
increase the grain yield of commercial varieties by ~30%.
Rice is rich in genetic diversity and breeders have a wide choice when looking
for parental materials.
3 Choice of Germplasm
One of the most difficult tasks in carrying out a successful breeding program is the
choice of germplasm. To be able to develop a variety with a set of desirable
characteristics rice breeders need to be sure that the source germplasm has desirable
genetic variability. After the parents are chosen and the crosses are made there are
almost no chances of new alleles appearing in the segregating populations.
To make the right choice of parental material to be used in a breeding program,
breeders must clearly know the type of product to be developed; the characteristics
of the species to be bred; the combining ability of the parents in case of hybrid
cultivars; the environmental conditions of the target area; the social and economic
aspects of the farmers and markets; and the different breeding approaches available
to achieve the proposed goals. Today, an additional element to be considered is the
legal aspect in relation to the materials to be used as parents.
In general, rice breeding programs have two major different end products. The
first and the most common one is a pure line, which will be evaluated and released
as a commercial variety. The second one is an inbred line that will be the parent of a
commercial hybrid. An intermediate product may be a population with certain
desirable characteristics that could be used for further improvement, for cultivars
per se, or for line extraction.
If the target of breeders is to develop pure lines it is important to know the ability
of the progenitor to transfer its characteristics to the segregating populations. An
interesting example is the rice variety ‘‘Ceysvoni’’ from Surinam; it has a high level
of resistance to blast and a good plant type as well as excellent grain type to
Brazilian standards. However, when used in crosses with other upland and irrigated
varieties, the different combinations do not produce high quality breeding lines. In
general, all segregating populations are discarded before reaching homozygosis. It
seems that some materials when used in crosses produce undesirable changes in the
genetic composition of the resulting population. Another example is the cultivar
BG90–2, a high-yielding irrigated rice variety. Every time this genotype was used
in crosses, the resulting segregating populations did not seem to retain its yield
potential and they were discarded before producing homozygous lines. Brondani
et al. (2002) proposed combining this cultivar with wild species to identify yield-
Rice Breeding 103
related quantitative trait loci (QTLs). More information on combining ability of the
progenitors is desirable to achieve the proposed goal.
Ingeneral, ricebreeders, aswell asbreeders for other crops, tend to recycle andcross
high-performing parents (e.g., elite� elite) among themselves and conduct maximum
inbreeding when aiming at developing new commercial varieties. This strategy is
based on the concept that self-pollinated crops have a large part of their genetic
variance as additive variance. In addition, high-performing parents with reduced
genetic variance present a higher probability of generating superior genotypes.
Another important aspect to consider is the genealogy of the parental material. In
general, breeders avoid crossing parents with similar genetic make-up, because
their combination will not produce a broad genetic variability limiting the possibi-
lities of obtaining desirable gene combinations (desired genotype). If the final
product is a hybrid, knowledge about the genealogy of the parents is crucial,
since heterosis relies on genetic differences. Hybrid rice is produced based on
cytoplasmic-genetic male sterility. It requires three types of breeding lines: a
cytoplasmic-genetic male sterile line (A line), a maintainer line (B line), and a
restore line (R line). Therefore, if the objective is to produce hybrid rice, knowledge
of the general and the specific combining ability of lines becomes essential.
Heterosis is based on genetic differences (among other factors), thus information
on the genetic distance between A and R lines is fundamental to produce high-
performing hybrids. Therefore, knowledge about the genealogy of the parental
material is crucial.
To facilitate the development of economically high-yielding hybrids with all of
the desirable agronomic traits it is also important to consider other characteristics
when selecting the parental material such as aspects related to difference in grain
type and shape, plant height, resistance to biotic and abiotic stresses. Hybrid rice
seed production depends on a series of factors, including the coincidence in the
flowering period of the male and female lines. It is important to have parents that
complement each other well, with good specific and general combining abilities.
This terminology was introduced by Sprague and Tatum (1941) to differentiate
between the mean performance of a parent in crosses (general combining ability)
and the deviations of individual combinations from the mean (specific combining
ability). Knowledge of this behavior is more important when the non-additive
effects are predominant.
To create a rice population, it is important to choose parental materials with high
levels of genetic differences for the traits under selection. However, it is desirable to
have also a low genetic divergence for the traits the breeder wants to keep in the
population. An example of the use of such information in deciding between rice
parents with tolerance to iron toxicity was presented by Khatiwada et al. (1996).
‘‘Azucena’’, IRAT 104, and ‘‘Moroberekan’’ were the cultivars with the best general
combining ability for iron toxicity tolerance and were the recommended ones for
elite � elite crosses.
The choice of parental material depends on the breeders’ objectives, the desired
type of product, the existing genetic diversity, and the information available, as well
as the combining ability of the parents.
104 E.P. Guimaraes
4 Major Breeding Achievements
4.1 The Rice Green Revolution
In the 1960s, scientists quickly realized that most tall traditional rice varieties
lodged easily when nitrogen fertilization was applied, which was the major limita-
tion to grain yield (Khush et al., 2001). The semi-dwarf (sd1) IR8 was the first high-yielding rice variety developed from a combination between the Indonesian variety
‘‘Peta’’ and ‘‘Dee Geo Woo Gen’’ from Taiwan. The key factor responsible for the
increase in yield potential was the improvement of the harvest index. However,
even though IR8 had a major drawback regarding its poor grain quality, it still
became the symbol of the green revolution in rice. Within a few years, many
countries around the world were replacing their traditional cultivars with the
modern high-yielding varieties.
The icon of the rice green revolution, when compared to traditional varieties,
exhibits certain distinct characteristics; it has shorter stature, a shorter growth cycle,
higher tillering ability, higher photosynthetic capacity, responsiveness to fertilizers
(mainly nitrogen), and consequently much higher yield potential to high-input
environments.
In the following decades IRRI developed IR36, which became the most widely
planted variety in the 1980s and IR64 was the most used in the 1990s (Peng and
Khush, 2003). In addition to these varieties, IRRI released a large series of IR-
coded varieties. However, while these newer materials were characterized by their
resistance to disease and insects, they did not contribute significantly to genetic
gains for grain yield. Scientists then believed that a new breakthrough in yield
potential had to come through a new plant type.
4.2 The New Plant Type
Donald (1968) was one the pioneers in the discussion of breeding for ideotype
plants. Yang et al. (1996) suggested that in order to develop super high-yielding rice
varieties it was essential to increase the biological yield. Searching for a second
green revolution IRRI had been working on a new rice ideotype or new plant type
(NPT) with a harvest index of 0.6 (60% grain: 40% straw weight) and with an
increased ability for photosynthesis to increase total biological yield. Peng et al.
(2005) considered the following components on this NPT: low tillering capacity,
few unproductive tillers, from 200 to 250 grains per panicle, from 90 to 100 cm of
plant height, thick and strong stems, vigorous root system, and from 100 to 130 days
of growth cycle. These traits would allow the rice plant to transform more energy
into grain production, increasing the yield potential by about 20% but with more
input and cost.
Rice Breeding 105
Even before IRRI, Japan was the first country to pursue research on the NPT
idea. In 1981, Japan launched a project aiming at combining varieties from indicaand japonica groups to develop a super high-yielding rice cultivar (Wenfu et al.,
2001). Dingkuhn et al. (1991) carried out physiological studies to understand the
yield potential limitations of the indica varieties. They observed that under direct-
seeded systems rice plants produced an excessive leaf area, which caused mutual
shading and reduction in the canopy photosynthesis and sink size. In addition, they
developed a large number of unproductive tillers.
The development of this NPT was based on tropical japonica germplasm derived
from Indonesia, being the source of low tillering, large panicles, thick stems,
vigorous root system, and short stature. According to Peng et al. (2005) the process
of developing the NPT was more complicated than originally thought. The first
generation of breeding lines with the above mentioned traits did not perform as
expected. New crosses were made combining the tropical japonicas with elite
indica breeding lines. The expectation was that lines coming out of these crosses
would increase the yield potential of irrigated lowland rice by about 10%.
The development of super high-yielding rice varieties following the concepts
proposed by Khush and Peng (1996) have encountered various technical difficul-
ties. However, the basic principles remain the same. Horie (2001), Sheehy et al.
(2001), and Murchie et al. (2001) looked at several of these physiological limita-
tions and made technical arguments aimed at addressing them. Even though the
results of these strategies are not yet producing an impact at the farmers’ field level,
it is important to highlight how rice breeders have been combining knowledge in
creative ways on genetic diversity, plant physiology, and rice breeding methods to
address these challenges.
4.3 Hybrid Rice
The hybrid rice technology concept dates back to 1964 in China. However, only in
1970, when a wild abortive pollen plant was identified in Southern China, did the
idea begin to materialize. In 1980, Shih-Cheng and Loung Ping (1980) published
one of the first articles indicating the potential of hybrid rice. The proposed strategy
then relied on the male sterility produced by the abortive pollen system identified in
the wild species O. sativa L. f. spontanea. Hybrid rice would then be produced
through a so-called three-line system, where one line would have the genetic–
cytoplasmic male sterility; the second line would be responsible for maintaining the
sterility, and a third one would be used as the matching parent for the hybrid with
the responsibility of restoring the fertility.
The first set of genetic–cytoplasmic male sterile lines was produced in 1970,
while the first hybrid rice was released in 1974, with the hybrids outyielding, on
average, the conventional rice varieties by 20%. In 1999, the area planted to hybrids
was about 15.5 million ha, representing 50% of the total rice area and 60% of the
total Chinese rice production (Guohui and Longping, 2003). Since 1994, hybrids
106 E.P. Guimaraes
have been released in India, Philippines, Vietnam, Bangladesh, and Indonesia. The
yield gains of the released hybrids in relation to the conventional varieties vary
from 20% in Philippines to 30.2% in Vietnam (Virmani, 2003). India has released
six hybrids since 1989, however, the pace of adoption by farmers has been slower
than expected and only 200,000 ha are cultivated (Mishra et al., 2003). Among the
above mentioned countries, Vietnam was the first to begin releasing hybrids,
initially in 1979. By 2001, it had around 480,000 ha planted to hybrids (Hoan and
Nghia, 2003). Indonesia began its hybrid production in 1998 and has released two
public and five private hybrids. The projection is for more than 500,000 ha to be
planted in the years to come (Suwarno et al., 2003). Bangladesh followed in close
collaboration with IRRI, and released two IRRI hybrids. While the area planted is
not significant yet, the government has put in place a hybrid rice master plan to
boost its adoption (Julfiquar et al., 2003).
To simplify the hybrid rice production system, the concept of environmental
genetic male sterility (EGMS) was introduced. The two environmental factors
considered were the photoperiod (PGMS) and the temperature (TGMS) sensitiv-
ities, which are controlled by recessive nuclear genes. This technology allows,
according to Mou et al. (2003), the use of any genotype with good traits as male
parent, to obtain japonica hybrids (e.g., it is difficult to identify restorers for this
group), and to develop inter-group hybrids such as indica/japonica (e.g., there is norestriction regarding the restorer–maintainer relationship). The first two-line hybrid
was released in China. It represented 17.2% of the total hybrid rice area in the
country in 2001, some 2.67 million ha (Guohui and Longping, 2003).
4.4 NERICA Rice
Upland and lowland dry land environments are the two most important rice
production ecosystems in Africa, where it is staple food for the sub-Saharan
population. Certain challenging problems and environmental conditions as well
as production practices common to these ecosystems limit rice production, such as
weeds, diseases, and insect pressure, soil fertility decline, soil acidity, and drought
stress. WARDA began a program to combine the two cultivated rice species
O. sativa and O. glaberrima in 1991. Their genetic dissimilarity needed the use
of a different breeding approach. Embryo rescue technique was employed to obtain
viable segregating populations (Jones et al., 1997). The newly developed materials
were called ‘‘new rice for Africa’’ and were popularized as NERICA varieties.
There are not many technical publications about the development of these varieties.
Information is gathered in the form of press releases, on the WARDA web page
(www.warda.cgiar.org/) and in articles such as that of Jones and Wopereis-Pura
(2001). The main features of these new varieties, when compared to the traditional
O. glaberrima, cultivated by farmers, are their improved ability to compete with
weeds, their larger panicles with around 400 grains and a higher yield potential. In
addition, shattering is reduced, stems are stronger thus preventing lodging, maturity
Rice Breeding 107
occurs around 30 days earlier than other conventional cultivars, and they have
greater resistance to the most common biotic and abiotic stresses, as well as
improved adaptability to the poor African rice growing soils. The success story of
the NERICA varieties includes a strong participation of the farmers in the
process of evaluation of the breeding lines aswell as in the development of thematerials
(e.g., farmer–breeder inititatives, participatory plant breeding, see Chapter 14). Infor-
mation on the impact of this technology can be found at WARDA (2003).
5 Current Breeding Goals
An increase in productivity is always one of the main goals of any crop breeding
program including rice. However, a long list of goals can be identified for this crop
varying in importance from region to region, country to country, and even within a
given country. A few examples of current breeding goals are described in the
sequence.
Increase grain yield potential is the major goal of almost all rice breeders
programs around the world. The major impacts, listed elsewhere in this chapter,
are related to the development of new strategies to increase the genetic grain yield
potential of the varieties. Nonetheless, there are still regions in the world where rice
leaves and straws play a major role in farmers’ livelihoods.
Resistance to blast disease has been among one of the most researched rice
breeders’ goals for decades. This disease is the most widespread pest of rice. It is
present in almost all countries and agro-ecological zones where rice is grown. It
causes leaf and panicle damages. Improvement strategies have to rely either on
gene pyramiding or multiple long-term resistance and/or tolerance because the
fungus has a complex set of races and single gene resistance is frequently overcome
in a very short time by the pathogen.
Grain quality characteristics vary from region to region and market requirements.
Very often varieties are discarded by farmers because they do not meet their required
quality standards. One example of the importance of the trait in determining the
success of a breeding program is upland rice in Brazil. Until the 1980s, the most
wanted grain type in the Brazilian mid-west region was the upland type (medium to
long bold grains). However, due to the market pressure made by the industry from
the Brazilian south (irrigated rice grain type – long and slender grain type) the
upland grain type lost market. The upland rice program had to quickly shift its grain
type objective and only when upland varieties with long and slender grains were
released, only then upland rice became popular again. Specialty grain quality rice
types are also an objective of many breeding programs around the world today.
Drought tolerance is another trait highly researched in rice. The increase trend inglobal water scarcity, the gradual seriousness of water shortage around the world
due to climate change, and the high water demand of rice varieties make this a
highly important objective of rice breeding programs. In addition, due to the
urbanization and pressure from other more important cash crops rice cultivation
108 E.P. Guimaraes
has been pushed to less favorable areas with larger water availability problems. The
complexity of the trait and the difficulties in developing a reliable and simple
screening system make the development of tolerant varieties an important chal-
lenge. The use of biotechnology tools is making a significant contribution to
identify genes and strategies to incorporate them in new varieties. However, the
progress is still below the required level to produce significant impact in rice
production due to the genetic complexity of the trait.
An important point to make is that breeders have a tremendous challenge to cope
with farmers and markets demands. Other challenging goals include resistance to
bacterial and sheath blight, and several viruses; resistance to insects such as brown
plant hopper, green leafhopper (vector of tungro viruses) and gall midge; and
tolerance to salinity, iron toxicity, and low temperatures.
6 Breeding Methods and Techniques
6.1 Conventional Rice Breeding Methods
If one makes a global literature review on the breeding methods commonly used to
develop rice varieties around the world pedigree selection is always at the top. More
than 85% of the released rice varieties published in Crop Science Society of
America have been developed through pedigree selection. When there are possibi-
lities to carry out more than one generation per year (e.g., winter nurseries) the
method is combined with modified bulk or even single-seed descent to speed up the
process of having pure lines for agronomic evaluation.
This chapter will focus on methods that are more unique or that can bring new
elements into the attention of the readers.
6.2 Population Improvement Through Recurrent Selection
This section will not try to dissect rice population improvement through recurrent
selection but it will highlight the experiences of using such methods in Latin
America where the method has been employed for more than 15 years. There are
breeding programs with different capacities run by international organizations such
as the CIAT, the ‘‘Centre de cooperation internationale en recherche agronomique
pour le developpement’’ (Cirad), and several national programs such as the Brazi-
lian Agricultural Research Corporation (Embrapa), and the ‘‘Fundacion para la
Investigacion Agricola’’ (Danac), among others.
A question one could ask is why population improvement strategies including
genetically broad-based populations should be considered for a self-pollinated crop
such as rice. The answer to this question is simple: several reports indicate that the
genetic gains obtained by different breeding programs around the world and
Rice Breeding 109
particularly in Latin America (Santos et al., 1997; Muralidharan et al., 2002) are
stagnating or even decreasing. In addition, other reports indicate that the genetic
base of the rice varieties is narrowing (Dilday, 1990; Cuevas-Perez et al., 1992;
Rangel et al., 1996).
Population improvement through recurrent selection is a traditional breeding
method that has been used in maize for over 50 years (Hull, 1945; Dudley and
Lambert, 2004). However, it has not been a common breeding methodology choice
in self-pollinated crops. Fujimaki (1979) suggested its application in rice using
male sterility. In soybean, Werner and Wilcox (2004) reported the results of male
sterility facilitated population improvement for yield characteristics. Wang et al.
(1996) used the Tai Gu gene to induce sterility and apply recurrent selection in
wheat. These are other successful examples of the utilization of population im-
provement facilitated by the existence of male sterile genes. However, fewer cases
are shown in the literature in which male sterility was induced by the application of
chemical products (Picard et al., 2004).
Hand crossing in rice is a laborious task as described by Guimaraes (1999).
Some of the requirements when using recurrent selection methods are to produce
progenies (sometimes crossing when using full or half-sib families) and recombine
the selected ones after replicated experiment trials across environments. Therefore,
the utilization of population improvement methods in rice only became feasible
after the discovery of the male sterile gene obtained by Singh and Ikehashi (1981)
through induced mutation of the rice variety ‘‘IR36’’. The recessive male sterile
gene was employed in 1984 by Embrapa and Cirad to create populations with broad
genetic bases (Taillebois and Guimaraes, 1989; Rangel and Neves, 1997). More-
over, the simplification of the crossing method developed by Taillebois and Castro
(1986) and described by Sarkarung (1991) made a significant contribution to
promoting the use of breeding methods that require a large number of crosses
each year.
Population improvement through recurrent selection in rice is a methodology
widely used in Latin America; however, it is not as popular elsewhere. In rice, as
probably happens in almost all self-pollinated crops, breeders tend to use pedigree
selection which is a complement to recurrent selection if well managed. The genetic
improvement process is cyclical, aiming at taking advantage of the progress made
in the previous years. In general, each year breeders select the best breeding lines to
make new elite crosses between them and/or with new germplasm. Guimaraes et al.
(1996), analyzing the upland rice breeding program at CIAT, which is based on
pedigree and modified bulk selection, found that ‘‘even though CIAT did not follow
the recurrent selection method, a modified approach, similar to the proposed
methodology, was used’’ during the period 1984–1993. The aim of having such
cycles is to capitalize on the genetic gains made in previous years; however,
through pedigree selection this is done in a non-systematic way.
The main feature of recurrent selection is to increase the frequencies of the
favorable alleles, as was pointed out by Hull (1945) when describing the process of
recurrent selection. Thus, by applying the recurrent selection method in rice,
110 E.P. Guimaraes
breeders are following the same principle but in a systematic and long-term way.
Therefore, recurrent selection allows defined and shorter breeding cycles, the
possibility of a more precise follow-up of genetic gains, and opportunities to
develop breeding lines with a wide genetic make-up.
Population genetic improvement through recurrent selection in Latin America is,
unlike maize, recent and dates back to 1996. This is due in part to the support of the
Organization of American States (OSA), Embrapa, Cirad, and CIAT who offered
the first training course to introduce the subject to breeders in the region. As the next
step, broad genetic base populations were made available to them by Embrapa and
CIAT. In addition, a close follow-up was provided by more experienced breeders
from both institutions. Moreover, Chatel and Guimaraes (1997) prepared a hand-
book providing guidance to rice population development and improvement. Gui-
maraes (1997) was the first to report the progress made by the different breeding
programs in the region. Similar reports were produced in 2000 (Guimaraes, 2000)
and 2004 (Guimaraes, 2005). During the last 15 years these programs have made
significant progress. There are currently more than 50 genetically broad base rice
populations developed in the region (GRUMEGA Grupo de Mejoramiento Genet-
ico Avanzado en Arroz, 2006a). In Argentina, breeding programs developed indicapopulations PARG-1 and PARG-2 (Marassi et al., 2000) and PARG-3 (Marassi
et al., 2004) aiming at improving cold tolerance. For the same trait, breeding
programs in Chile developed japonica populations PQUI-1 and PQUI-2 (Hernaiz-
L et al., 2004). Graterol (2000) described how PFD-1 and PFD-2 populations
were produced in Venezuela to adapt to two different environmental conditions
(winter and summer growing seasons). In Cuba, the national program developed the
populations IACuba-1 and IACuba-2 searching for a genetically diverse population
adapted to local challenges (Perez-Polanco et al., 2000). The cultivar CG-91 with
resistance to rice blast for upland conditions was developed by Guimaraes and
Correa-Victoria (2000). Similar research has been conducted by Courtois et al.
(1997) for upland rice.
Breeders in Latin America highlighted the following advantages of using popu-
lation genetic improvement through recurrent selection: (a) the possibility of
creating and managing their own segregating populations without incurring any
additional expenses necessary to evaluate potential parents every year; having a
structured crossing program; keeping detailed information on lines and parents; (b)
the possibility of having improved and diverse breeding lines available at the end of
every recurrent cycle as well as continuing to make progress in increasing the
frequency of favorable genes in the population; (c) the national programs can have
more than one population improvement program with minimal additional
resources, avoiding the duplication of similar activities in a given year (instead of
having to evaluate hundreds of line of two populations in one year, the program can
be organized in such a way that in a given year one population is in the recombina-
tion phase and the other in line evaluation phase); and (d) as in (b) varietal
development process can be integrated with the population improvement program
and become a unique and more powerful project.
Rice Breeding 111
An extra advantage that is worth highlighting is the possibility of integrating
different rice breeding programs within countries. In Brazil the evaluation phase of
the different populations being managed for the irrigated and the upland ecosystems
are shared among state organizations, Embrapa units, and universities. Each partner
carries out the evaluation of progenies at fewer locations than in evaluations carried
out by single breeding programs. All locations are pooled and a combined analysis
is performed. Selection of the best families for the recombination phase is done
through discussion of the results in a joint meeting. The best lines at each location
are kept by the local breeding program for further selection and line development.
A similar strategy was adopted in Venezuela through the ‘‘Fundacion Danac’’,
who developed populations PFD-1 and PFD-2 and evaluates families through the
national program, universities, and the private sector.
Many rice programs in Latin America did not have a fully operational breeding
project. In general, they were dependent on ad hoc introductions of pure lines from
other stronger national programs or international organizations. Today, these pro-
grams are releasing improved varieties obtained from segregating lines used for
recombination and development of new recurrent cycles. A good example of this
progress can be seen in Bolivia, which recently released the variety ‘‘Esperanza’’
(GRUMEGA, 2006b). Chile has collaborated closely with CIAT for a long time and
has always had a strong breeding program. In 1990 the country decided to add to
its portfolio of breeding methods recurrent selection for genetic improvement
(Alvarado-A, 1997), and in 2007 it has released R-Quila 23 (GRUMEGA,
2006c). In the region, countries are carrying out their population improvement
programs using different recurrent selection strategies for genetic improvement.
Most countries utilize the S1–S2 recurrent selection procedure, evaluating and
selecting S0 plants, advancing to the S0:1 generation outside the normal growing
season, and evaluating and selecting S0:2 families for recombination. In temperate
countries, where two growing seasons per year are not feasible unless using winter
nurseries, scientists evaluate and select S0:1 and S1:2 families. Very seldom do
scientists in these countries use a different selection scheme, therefore, non-additive
effects are not considered in genetic improvement. In almost all cases there have
been reported genetic gains for the target traits when comparing more advanced
generations with the original populations or less advanced recurrent cycles. Brazil
has a very strong rice breeding program and has been one of the promoters of this
methodology. The first variety derived from a genetically broad-based population
under recurrent selection was released in 2002 (GRUMEGA, 2006d). The breeding
programs are currently managing five populations for irrigated conditions (Rangel
et al., 2000) and eight for upland ecosystems (Castro et al., 2000). Evaluation
studies were carried out in different populations in order to assess the efficacy of
the method in rice. Rangel et al. (2005) reported 6.65% genetic gain after evaluating
two cycles of recurrent selection in the irrigated rice population CNA-IRAT 4.
Badan et al (2005) reported 6.2% gains after selecting for rice blast resistance when
comparing cycles 1 and 2 of the upland rice population CNA-7. Moreover, evalua-
tion of three cycles of recurrent selection for grain yield and neck blat in CG-3
112 E.P. Guimaraes
upland rice population showed 3.6% and 3.4% genetic gain per year, respectively
(Morais et al., 2008).
6.3 Hybrid Rice
To cope with future demand for rice production, yield per unit area has to be
increased rapidly in the major rice producing countries. As stated before, hybrid
rice was first released in China in 1974 with the promise of increasing yield
potential beyond the level of the traditional varieties through the exploitation of
heterosis. The initial breeding strategy to produce hybrids relied on three breeding
lines known as A line (the male sterile line), B line (responsible to maintain the
genetic male sterility of the A line), and R line (used to restore the fertility of the A
line and to produce the hybrid seed). The technique evolved to a two-line process
using environmental genetic male sterility (EGMS) counting on photoperiod
(PGMS) and temperature (TGMS) sensitivity to induce sterility. The ideal system
for these and other cross-pollinated crops would be the one-line method utilizing
the apomixis system that allows preserving the right cultivar.
According to Virmani et al. (1997) the development of a hybrid breeding
program has to go through the following stages of identification and development
of the A, B, and R breeding lines: identification and evaluation of male-sterile lines
and their restorers; testcross phase to select heterotic combinations and to initiate
conversion of maintainer lines into male-sterile lines; backcrosses to transfer the
cytoplasmic male-sterility to elite maintainer lines; trials to study the combining
ability (general and specific) of the parental lines; and foundation seed production
of all three lines. Production of breeding lines for the three- or two-line methods is
still a difficult task for most of the breeding programs outside of China. One of the
bottle necks for spreading the technology worldwide is the seed production process.
In general, the production system relies on planting a few rows of the male line (R
line) and rows of the female (A line) in such way that the maximum hybrid seed
production per unit area occurs in the A line. Few ratios of female to male line seed
production have been used (e.g., the 6:2, 8:2, and/or the 10:2 ratios). Mao (2001)
reported that the average hybrid seed production in rice lines is between 2.5 and 3.0
t ha�1, however, outside of China it is much lower (1.0–1.5 t ha�1, according to
Virmani et al., 2001). In Argentina, RiceTec is producing hybrid rice for southern
South America. The company is using three- and two-line systems. Their
seed production varies tremendously from year to year with an average around
1.2 t ha�1.
In addition to the seed production of the female parent, the success of a hybrid is
dependent on the level of heterosis it can express after crossing their parental
varieties. The combination between different varieties is the first step to obtain
heterosis, but its expression improves as combinations between varieties belonging
to different groups (indica and japonica) are explored. An alternative to develop
hybrids with higher potential might be the use of yield enhancing genes from other
Rice Breeding 113
species (Yuan, 2003). Molecular markers are trying to identify restorer genes in
japonica background (Tan et al., 1998) and thermo-sensitive genetic male sterility
genes (Yamaguchi et al., 1997; Latha et al., 2004). In addition, marker-assisted
selection (MAS) has been reported to assist in the development of hybrids with
disease and insect resistance in China (He et al., 2004).
6.4 Mutation Breeding
The use of different sources derived from induced mutations was a popular choice
to generate genetic diversity for specific traits in rice in the 1980s. Today the
technique became part of the tools kit breeders have to enhance specific rice
characteristics in well-adapted varieties. The intention of this section is not to
discuss all aspects related to the use of mutation breeding, but to highlight a few
successes and flag the importance of mutations to rice improvement.
According to Wang (1992) during the period 1966–1990, there were 78 varieties
released in China originated from mutation breeding. More recently, from 1991 to
2004, there was a similar number (77) of new releases coming from application of
mutation (Chen et al., 2006). The most popular mutagen is still the gamma rays and
the mutated characteristics are the ones responsible for the expression of agronomic
(e.g., resistance to pests) and grain quality phenotypes.
In Indonesia the first mutant variety (Atomita 1) was released in 1982 and up to
today there are 14 officially released varieties, 13 of them were improved for biotic
stresses such as resistance to brown plant hopper; in all cases the mutagen agent was
the gamma rays (Ismachin and Sobrizal, 2006).
Vietnam is one of the most important rice producing country in the world.
Reports from Tran et al. (2006) indicated that during the period 1990 and 2002
the Agricultural Genetic Institute developed and released 10 varieties, most of them
have better grain quality, in addition to other agronomic traits; once more the
gamma rays were the most common mutagen agent used.
Maluszynski et al. (1998) summarized the number officially released mutant
varieties and came up with ‘‘cereals’’ as the group with the largest numbers
followed by legumes and industrial crops. Among cereals rice presented the highest
number with barley in second. In rice the main improved traits were early maturity,
plant height, and disease resistance. It is worth mentioning that the famous gene sd1(see section on major breeding achievements) is a mutant. However, the most
commonly mutated trait over all crops was ‘‘semi-dwarfness’’. Table 1 summarizes
the number of varieties released around the world, which were developed by the use
of mutagens. The Food and Agriculture Organization of the United Nation (FAO)/
International Atomic Energy Agency (IAEA) Mutant Varieties Database indicates
that there were 2,541 releases up to March 2007. The largest numbers are from
cereals (1,212), followed by legumes and industrial crops. Among cereals rice
presented the highest number (525) with barley in second (303) and wheat in
third (200).
114 E.P. Guimaraes
7 Integration of New Biotechnologies in Breeding Programs
The first and most important aspect to successfully take advantage of the variety of
biotechnology tools available to rice breeders is to have a well-structured, efficient,
and effective breeding program. This statement may seem obvious for many readers
but it does not reflect the reality of a large portion of the rice breeding programs in
developing countries around the world.
FAO has started a worldwide plant breeding and associated biotechnology
assessment in 2002. This work has been concluded in a sample of more than 50
developing countries in all the different rice growing regions. Among other things,
the results indicate that almost every country has made investments in the area of
biotechnology recently. However, only a very limited number of them have rein-
forced their breeding activities and worse still, the great majority do not even have
well-structured and fully operational breeding programs that can incorporate bio-
technology tools. To add to this, very seldom have they ensured linkages between
biotechnology efforts and breeding priorities or strategies.
Anther culture is a simple biotechnology tool that has been around for quite a
long time. The technique allows the development of double haploid lines or true
breeding lines, which shortens the breeding cycle and helps produce new rice
varieties. One of the main uses of double haploid lines is for the development of
mapping populations for molecular analysis and mapping of DNA markers
(Lu et al., 1996).
As mentioned previously in this chapter, rice has a series of species that can and
have been used to address specific breeding problems such as resistance to pests and
tolerance to abiotic stresses. However, one of the main limitations on the use of wild
relatives in breeding programs is the lack of crossability between species due to
Table 1 Officially released mutant varieties of rice in the FAO/IAEA Mutant
Varieties Database, March 2007
Country Varieties
released (#)
Country Varieties
released (#)
Bangladesh 5 Japan 70
Brazil 28 Korea 7
Burkina Faso 3 Myanmar 5
China 222 Nigeria 3
Costa Rica 2 Pakistan 10
Ivory Coast 26 Philippines 8
France 5 Portugal 1
Guyana 26 Romania 1
Hungary 3 Senegal 2
India 40 Sri Lanka 1
Indonesia 6 Thailand 4
Iraq 3 USA 23
Italy 2 Vietnam 28
Rice Breeding 115
chromosomal and genetic differences. One alternative to overcome these sexual
barriers is to use embryo rescue and protoplast fusion, which are simple biotech-
nology techniques that have been used successfully in rice. Fertile O. sativa and
O. glaberrima progenies were obtained through backcrossing and double haploid
production by Jones et al. (1997). The NERICA varieties, mentioned elsewhere in
this chapter, provide a good example of how these techniques were used to help
address some specific breeding objectives.
Plant breeders want to use of molecular markers. Several different types of
markers are being used in rice, among which one may find the following: restriction
fragment length polymorphisms (RFLPs); randomly amplified polymorphic DNA
markers (RAPDs); amplified fragment length polymorphisms (AFLPs); diversity
array technology (DArT); simple sequence length polymorphisms (SSLPs) also
known as SSRs or microsatellites; transposable elements (TEs); and/or single
nucleotide polymorphisms (SNPs). If genes of interest are identified and linked to
some of these markers they can be used to aid selection in a process known as MAS.
Knowledge of gene and marker location, linkage strength, and stability is essential.
Therefore, basic information is required and molecular linkage maps play a major
role. Rice maps have been developed to that end; the first RFLP map was published
in 1988 and was constructed at Cornell University by McCouch et al. (1988).
Breeders are interested in transferring genes of interest from one parent to the
other. This process can be facilitated by tagging such genes, which means identify-
ing a tight linkage between the targeted gene and a molecular marker. By selecting
the marker the breeder is indirectly selecting the trait of interest using MAS with the
limitations of indirect selection. In the literature, there are examples of application
of MAS in rice to aid backcrossing programs; in fact, theoretical studies have
indicated that MAS can help reduce from 6 to 3 the number of backcrosses
necessary to transfer a targeted gene (Frisch et al., 1999). In hybrid rice, Chen
et al. (2000) transferred a resistance gene for bacterial leaf blight into a widely used
parent. Huang et al. (1997b) successfully pyramided four bacterial blight resistance
genes through MAS into a rice variety. Nevertheless, the application of this tool in
conventional breeding programs has been limited. The rice genome is one of the
most studied by scientists around the world. Arumuganathan and Earle (1991)
described it as having 430 Mb. Chen et al. (2002) described it as 400 Mb once re-
evaluated. Goff et al. (2002) sequenced the japonicas genome and Yu et al. (2002)
did the same for the indicas. Having the rice genome sequenced brings a new and
more important challenge that is to use this information to identify the biological
functions of these genes and their interactions with other genes and environments.
Therefore, the matching between genotyping and phenotyping plays an important
role and the existence of breeding programs with excellent screening techniques
and capable breeders are essential to capture the best advances of modern biotech-
nology and discard the rest. The introduction of an alien gene into rice by produc-
tion genetically engineered rice allows breeders to target problems that without this
technology it was not feasible. The golden rice is the most well known case of
application of genetic engineering in rice in the 1990s. This specific project
genetically engineered the provitamin A pathway into rice. Most cases, however,
116 E.P. Guimaraes
were related to the production of transgenic rice for resistance to diseases, insects,
and abiotic stresses. Khush and Brar (2003) presented a table with 19 examples of
transgenic rice.
In closing this section it is not redundant to reiterate the need of integrating
biotechnology tools and certain successful techniques into the existing breeding
programs. Decision-makers responsible for allocation of resources for research
should not have two choices – biotechnology or plant breeding – but only one
integrative way forward which is to ensure the integration of these activities
towards producing improved varieties to solve farmers’ demands.
8 Foundation Seed Production
Seed production is one of the key steps for the success of a variety. Thus, it has to be
considered as an integral part of the breeding programs. The objective of this
section is to indicate the linkages between foundation seed production and the
phases involved in a breeding program. As an example of how this can be done I
will use the past experience of the Embrapa Rice and Beans Centres in Brazil.
The segregating populations produced by the hundreds of crosses made every
year are taken to the field and advanced through pedigree selection or modified bulk
selection. As soon as the breeders identify potential breeding lines in the F4, F5, or
F6 generations they are included in the observational trials, which are planted
across locations throughout the country. The best 50–100 lines are promoted to
preliminary yielding tests planted across several locations also throughout the
country. This is the stage when the breeders start considering lines for the founda-
tion seed production. Headquarters seed specialists, together with breeders, select
around 100 panicles to initiate the seed production process using the panicle-row
process. As the breeding lines move from preliminary yield trials to advanced and
regional yield trials the seed multiplication process advances from 2 to 3 kg of
foundation seed to the required amount of high quality seeds necessary to attend the
seed producers. This strategy requires high resource mobilization since it starts
based on 20–30 breeding lines with potential to be released as varieties and ends on
one or two released varieties. However, it speeds up the process of varietal release
allowing to arriving at the moment of release with a large amount of high quality
seeds. In addition it links breeders and seed specialists in the early stages of the seed
production process ensuring the high quality of the final product.
9 Rice Breeding Capacity Around the World
FAO, in collaboration with CGIAR centers and other stakeholders has been asses-
sing the national plant breeding and related biotechnology capacity, as proposed in
the Global Plant of Action (FAO, 1996) of the International Treaty on Plant Genetic
Rice Breeding 117
Resources for Food and Agriculture (FAO, 2002). The mechanism to gather
information on countries’ capacity is a survey focusing on several breeding and
biotechnology issues. For this chapter the analysis will consider the number of full-
time equivalent1 (FTE) plant breeders2 available in all private and public institu-
tions in each surveyed country and the resource allocation per crop (rice in this
case). The organizations were asked to provide the total number FTE breeders and
the percentage of the total resources that was allocated to rice breeding activities.
The numbers in Table 2 were obtained by multiplying the total number of FTEs by
the percentage of resource allocations to rice. Preliminary survey results for a
sample of countries in Central Asia were published by Guimaraes et al. (2006a)
and in Africa by Guimaraes et al. (2006b). These results covered all crops; however,
in this chapter the focus will be on rice only (Table 2). As one might expect,
because of the importance of the rice crop for the Asian population, the largest
number of FTE breeders was observed in Asia, even though that was the region with
the least number of countries surveyed (only four countries were sampled). The
results indicated that there were 84.9 rice breeders, representing 21.6% of the total
FTE breeders in the region, the highest percentage of all the regions. The next
highest result was found for Latin America, which had 46 FTE rice breeders, some
17.1% of the total number of FTE breeders in the region. As rice is the staple food
for the majority of the countries in these two regions, these results reflect the
importance that the national programs give to the development of improved vari-
eties.
The total number of rice breeders in Brazil represents 50% of the number of rice
breeders present in all seven countries sampled in Latin America. Embrapa has two-
thirds of the total number of FTE rice breeders in the country. The state organ-
izations follow with much lower numbers while the private sector has only
two breeders working in the country. Considering the whole country’s breeding
capacity, rice represents only 4.4% (Table 2).
In Africa, for many countries, mainly in West Africa, rice is the staple food and
one of the most important sources of calories. The results in Table 2 reflect its
importance by the total number of FTE rice breeders working in Africa. An
important part of the 28.4 FTEs rice breeders are in West Africa. The West African
countries all have, with the exception of Niger and Senegal, more than two breeders
working in national rice breeding programs. However, looking at the total number
of FTE breeders in Africa rice represents a very small fraction (3.6%). The potential
that rice has in West African countries is due to its increasing popularity in
consumption patterns although the gap between supply and demand is still signifi-
cant. Nevertheless, some countries have invested in rice breeding to contribute to
the growth of local rice production (Oladele and Sakagami, 2004).
1A Full Time Equivalent (FTE) is the work done by a person who has any responsibility linked to
plant breeding (genetic enhancement, line development, line evaluation, or genetic studies) during
one year (365 days).2The survey considered as plant breeders all scientific personnel with a plant breeding degree and
also the ones directly involved in plant breeding activities.
118 E.P. Guimaraes
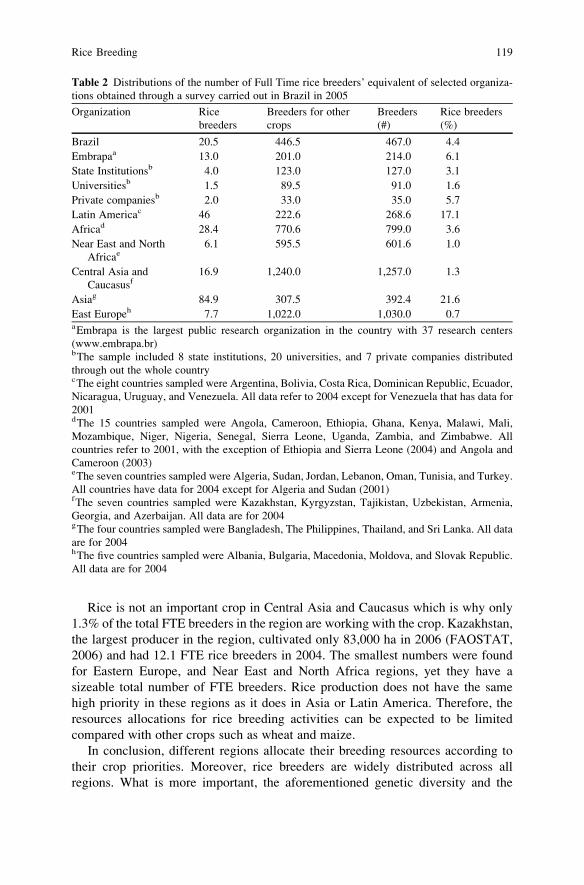
Rice is not an important crop in Central Asia and Caucasus which is why only
1.3% of the total FTE breeders in the region are working with the crop. Kazakhstan,
the largest producer in the region, cultivated only 83,000 ha in 2006 (FAOSTAT,
2006) and had 12.1 FTE rice breeders in 2004. The smallest numbers were found
for Eastern Europe, and Near East and North Africa regions, yet they have a
sizeable total number of FTE breeders. Rice production does not have the same
high priority in these regions as it does in Asia or Latin America. Therefore, the
resources allocations for rice breeding activities can be expected to be limited
compared with other crops such as wheat and maize.
In conclusion, different regions allocate their breeding resources according to
their crop priorities. Moreover, rice breeders are widely distributed across all
regions. What is more important, the aforementioned genetic diversity and the
Table 2 Distributions of the number of Full Time rice breeders’ equivalent of selected organiza-
tions obtained through a survey carried out in Brazil in 2005
Organization Rice
breeders
Breeders for other
crops
Breeders
(#)
Rice breeders
(%)
Brazil 20.5 446.5 467.0 4.4
Embrapaa 13.0 201.0 214.0 6.1
State Institutionsb 4.0 123.0 127.0 3.1
Universitiesb 1.5 89.5 91.0 1.6
Private companiesb 2.0 33.0 35.0 5.7
Latin Americac 46 222.6 268.6 17.1
Africad 28.4 770.6 799.0 3.6
Near East and North
Africae6.1 595.5 601.6 1.0
Central Asia and
Caucasusf16.9 1,240.0 1,257.0 1.3
Asiag 84.9 307.5 392.4 21.6
East Europeh 7.7 1,022.0 1,030.0 0.7aEmbrapa is the largest public research organization in the country with 37 research centers
(www.embrapa.br)bThe sample included 8 state institutions, 20 universities, and 7 private companies distributed
through out the whole countrycThe eight countries sampled were Argentina, Bolivia, Costa Rica, Dominican Republic, Ecuador,
Nicaragua, Uruguay, and Venezuela. All data refer to 2004 except for Venezuela that has data for
2001dThe 15 countries sampled were Angola, Cameroon, Ethiopia, Ghana, Kenya, Malawi, Mali,
Mozambique, Niger, Nigeria, Senegal, Sierra Leone, Uganda, Zambia, and Zimbabwe. All
countries refer to 2001, with the exception of Ethiopia and Sierra Leone (2004) and Angola and
Cameroon (2003)eThe seven countries sampled were Algeria, Sudan, Jordan, Lebanon, Oman, Tunisia, and Turkey.
All countries have data for 2004 except for Algeria and Sudan (2001)fThe seven countries sampled were Kazakhstan, Kyrgyzstan, Tajikistan, Uzbekistan, Armenia,
Georgia, and Azerbaijan. All data are for 2004gThe four countries sampled were Bangladesh, The Philippines, Thailand, and Sri Lanka. All data
are for 2004hThe five countries sampled were Albania, Bulgaria, Macedonia, Moldova, and Slovak Republic.
All data are for 2004
Rice Breeding 119
wise choice of germplasm help bring about food security in countries where rice is a
staple. This, however, depends on applying creativity to different breeding
approaches and the wise use of biotechnology tools.
References
Alvarado-A, J.R. (1997) Mejoramiento de riego en Chile y utilizacion de las seleccion recurrente.
In: Guimaraes, E.P. (Ed.) Seleccion recurrente en arroz. Centro Internacional de Agricultura
Tropical, Cali, Colombia, pp. 117–123.
Arumuganathan, K. and Earle, E.D. (1991) Nuclear DNA content of some important species. Plant
Mol. Biol. Rep. 9, 208–218.
Badan, A.C de., Guimaraes, E.P. and Ramis, C. (2005) Genetic gain for resistance to blast in a rice
population. In: Guimaraes, E.P. (Ed.) Population improvement, A way of exploiting ricegenetic resources in Latin America. Food and Agriculture Organization of the United Nations
(FAO), Rome, Italy, pp. 299–329.
Brondani, C., Rangel, P.H.N., Brondani, R.P.V. and Ferreira, M.E. (2002) QTL, mapping and
introgression of yield-related traits from Oryza glumaepatula to cultivated rice (Oryza sativa)using microsatellite markers. Theor. Appl. Genet. 104, 1192–1203.
Castro, E. Da M. de., Morais, O.P. de., Sant’Ana, E.P., Breseghello, F. and Neto, F.P. de M. (2000)
Mejoramiento poblacional de arroz de tierras altas en Brasil. In: Guimaraes, E.P. (Ed.) Avancesen el mejoramiento poblacional en arroz. Embrapa Arroz e Feijao, Santo Antonio de Goias,
Brasil, pp. 221–240.
Chatel, M. and Guimaraes, E.P. (1997) Recurrent selection in rice, using a male-sterile gene.Centro Internacional de Agricultura Tropical and Centre de cooperation internationale en
recherche agronomique pour le developpement, Cali, Colombia. pp. 1–70.
Chen, S., Lin, X.H., Xu, C.G. and Zhang, Q.F. (2000) Improvement of bacterial blight resistance of
‘Minghui 63’, an elite line of hybrid rice, by molecular marker-assisted selection. Crop Sci. 40,
239–244.
Chen, M., Presting, G., Barbazuk, W.B., Goicoechea, J.L., Blackmon, B., Frang, G., Kim, H.,
Frisch, D., Yu, Y., Sun, S., Higingbottom, S., Phimphilai, J., Phimphilai, D., Thurmond, S.,
Gaudette, B., Li, P., Lui, J., Hatfield, J., Main, D., Farrar, K., Henderson, C., Barnett, L., Costa,
R., Williams, B., Walser, S., Atkins, M., Hall, C., Budiman, M.A., Tomkins, J.P., Luo, M.,
Bancroft, I., Salse, J., Regad, F., Mohapatra, T., Singh, N.K., Tyagi, A.K., Soderlund, C., Dean,
R.A. andWing, R.A. (2002) An integrated physical and genetic map of rice genome. Plant Cell
14, 537–545.
Chen, X., Liu, X., Wu, D. and Shu, Q.Y. (2006) Recent progress of rice mutation breeding and
germplasm enhancement in China. Plant Mutat. Rep. 1(1), 4–6.
Courtois, B., Nelson, R. and Roumen, E. (1997) Creacion de un acervo genetico para mejorar la
resistancia parcial a Piricularia en el arroz de secanano, mediante la seleccion recurrente. In:
Guimaraes, E.P. (Ed.) Seleccion recurrente en arroz. Centro Internacional de Agricultura
Tropical, Cali, Colombia, pp. 189–202.
Cuevas-Perez, F.E., Guimaraes, E.P., Berrio, L.E. and Gonzalez, D.I. (1992) Genetic base of
irrigated rice in Latin America and the Caribbean, 1971 to 1989. Crop Sci. 32, 1054–1059.
Dilday, R.H. (1990) Contribution of ancestral lines in the development of new cultivars of rice.
Crop Sci. 32, 1054–1058.
Dingkuhn, M., Penning De Vries, F.W.T., De Datta, S.K. and van Laar, H.H. (1991) Concepts for a
new plant type for direct seeded flooded tropical rice. In: Direct seeded flooded rice in the
tropics. International Rice Research Institute, Manila, Philippines, pp. 17–38.
Donald, C.M. (1968) The breeding of crop ideotypes. Euphytica 17(3), 385–403.
120 E.P. Guimaraes
Dudley, J.W. and Lambert, R.J. (2004) 100 generations of selection for oil and protein in corn.
Plant Breed. Rev. 24(1), 79–110.
FAO (1996) Global Plan of Action of the Conservation and Sustainable Utilization of the Plant
Genetic Resources for Food and Agriculture. Rome, Italy.
FAO (2002) International Treaty on Plant Genetic Resources for Food and Agriculture. Rome,
Italy.
FAOSTAT (2006) FAO statistical database on food and agriculture. Available at http://faostat.
external.fao.org/default. Consulted on 05 December 2006.
Frisch, M., Bohn, M. and Melchinger, A.E. (1999) Comparation of selection strategies for marker-
assisted backcrossing of a gene. Crop Sci. 39, 1295–1301.
Fujimaki, H. (1979) Recurrent selection by using male sterility for rice improvement. Jpn. Agric.
Res. Qua. 13, 153–156.
Glaszmann, J.C. (1987) Isozymes and classification of Asian rice varieties. Theor. Appl. Genet.
74, 21–30.
Glaszmann, J.C. and Arraudeau, M. (1986) Rice plant type variation, “japonica” – “javanica”
relationship. Rice Genet. Newslett. 3, 41–43.
Goff, S.A., Ricke, D., Lan, T.H., Presting, G., Wang, R., Dunn, M., Glazebrook, J., Sessions, A.,
Oeller, P., Varma, H., Hadley, D., Hutchison, D., Martin, C., Katagiri, F., Lange, B.M.,
Moughamer, T., Xia, Y., Budworth, P., Zhong, J., Miguel, T., Paszkowski, U., Zhang, S.,
Colbert, M., Sun, W.L., Chen, L., Cooper, B., Park, S., Wood, T.C., Mao, L., Quail, P., Wing,
R., Dean, R., Yu, Y., Zharkikh, A., Shen, R., Sahasrabudhe, S., Thomas, A., Cannings, R.,
Gutin, A., Pruss, D., Reid, J., Tavtigian, S., Mitchell, J., Eldredge, G., Scholl, T., Miller, R.M.,
Bhatnagar, S., Adey, N., Rubano, T., Tusneem, N., Robinson, R., Feldhaus, J., Macalma, T.,
Oliphant, A. and Briggs, S. (2002) A draft sequence of the rice genome (Oryza sativa L. ssp.
japonica). Science 296, 92–100.Graterol, M.E.J. (2000) Caracterizacion de poblaciones e introduccion de variabilidad para iniciar
un programa de mejoramiento poblacional de arroz en Venezuela. In: Guimaraes, E.P. (Ed.)
Avances en el mejoramiento poblacional en arroz. Embrapa Arroz e Feijao, Santo Antonio de
Goias, Brasil, pp. 87–103.
GRUMEGA [Grupo de Mejoramiento Genetico Avanzado en Arroz] (2006a) Catalogue Registra-
tion of Gene Pools and Populations, for Rice Improvement by Recurrent Selection. Available
at http://iserver.ciat.cgiar.org/grumega/tiki-download_wiki_attachment.php?attId = 56. Con-
sulted on 6 December 2006.
GRUMEGA [Grupo de Mejoramiento Genetico Avanzado en Arroz] (2006b) Bolivia, “Esper-
anza” (2006) Nueva variedad de arroz para condiciones de secano. Available at http://iserver.
ciat.cgiar.org/grumega/tiki-download_wiki_attachment.php?attId = 18. Consulted on 6 De-
cember 2006.
GRUMEGA [Grupo de Mejoramiento Genetico Avanzado en Arroz] (2006c) Chile, “R Quila 23”
(2006) Available at http://iserver.ciat.cgiar.org/grumega/tiki-download_wiki_attachment.php?
attId = 16. Consulted on 6 December 2006.
GRUMEGA [Grupo de Mejoramiento Genetico Avanzado en Arroz] (2006d) Cultivar de arroz
irrigado da EPAGRI, SCS 113-Tio Taka. Available at http://iserver.ciat.cgiar.org/grumega/
tiki-download_wiki_attachment.php?attId = 58. Consulted on 6 December 2006.
Guimaraes, E.P. (1997) Seleccion recurrente en arroz. Centro Internacional de Agricultura
Tropical, Cali, Colombia. pp. 1–240.
Guimaraes, E.P. (1999) Hibridacao em arroz. In: Borem, A. (Ed.) Hibridacao artificial de plantas.Universidade Federal de Vicosa (UFV), Vicosa, Brasil, pp. 101–120.
Guimaraes, E.P. (2000) Avances en el mejoramiento poblacional en arroz. Embrapa Arroz
e Feijao, Santo Antonio de Goias, Brasil. pp. 1–311.
Guimaraes, E.P. (2002) Genetic diversity of rice production in Brazil. In: Nguyen, V.N. (Ed.)
Genetic diversity in rice production, Case studies from Brazil, India and Nigeria. Food and
Agriculture Organization of the United Nations (FAO), Rome, Italy, pp. 11–35.
Rice Breeding 121
Guimaraes, E.P. (2005) Population improvement, A way of exploiting rice genetic resources inLatin America. Food and Agriculture Organization of the United Nations (FAO), Rome, Italy.
pp. 1–350.
Guimaraes, E.P. and Correa-Victoria, F. (2000) Utilizacion de la seleccion recurrente para
desarrollar resistencia a Pyricularria grisea Sacc. en arroz. In: Guimaraes, E.P. (Ed.) Avancesen el mejoramiento poblacional en arroz. Embrapa Arroz e Feijao, Santo Antonio de Goias,
Brasil, pp. 165–175.
Guimaraes, E.P., Borrero, J. and Ospina-Rey, Y. (1996) Genetic diversity of upland rice germ-
plasm distributed in Latin America. Pesq. Agropec. Bras. 31(3), 187–194.
Guimaraes, E.P., Bedoshvili, D., Morgounov, A., Baboev, S., Iskakov, A., Muninjanov, H.,
Kueneman, E. and Paganini, M. (2006a) Plant breeding and related biotechnology competence
in Central Asia and recommendations to strengthen regional capacity. Agromeridian Theor.
Appl. Agric. Res. J. 2, 137–143.
Guimaraes, E.P., Kueneman, E. and Carena, M.J. (2006b) Assessment of national plant breeding
and biotechnology capacity in Africa and recommendations for future capacity building. Hort.
Sci. 41, 50–52.
Guohui, M. and Longping, Y. (2003) Hybrid rice achievements and development in China. In:
Virmani, S.S., Mao, C.X. and Hardy, B. (Eds.) Hybrid rice for food security, poverty allevia-tion, and environmental protection. International Rice Research Institute, Manila, Philippines,
pp. 247–256.
Harushima, Y., Nakagahra, M., Yano, M., Sasaki, T. and Murata, N. (2002) Diverse variation of
reproductive barriers in three intraspecific rice crosses. Genetics 160, 313–322.
He, Y., Li, X., Zhang, J., Jiang, G., Liu, S., Chen, S., Tu, J., Xu, C. and Zhang, Q. (2004) Gene
pyramiding to improve hybrid rice by molecular marker techniques. International Crop Science
Congress Brisbane, Australia, 26 Sep–1 Oct. http://www.cropscience.org.au/icsc2004/poster/
3/4/4/1041_heyuqing.htm. Consulted on 06 April 2007.
Hernaiz-L, S.I., Alvarado, J.R., Chatel, M., Castillo, D. and Ospina, Y. (2004) Improving irrigated
rice populations for temperate climate in Chile. In: Guimaraes, E.P. (Ed.) Population improve-ment, A way of exploiting rice genetic resources in Latin America. Food and Agriculture
Organization of the United Nations (FAO), Rome, Italy, pp. 129–143.
Hoan, N.T. and Nghia, N.H. (2003) Hybrid rice development and use in Vietnam. In: Virmani, S.
S., Mao, C.X. and Hardy, B. (Eds.) Hybrid rice for food security, poverty alleviation, andenvironmental protection. International Rice Research Institute, Manila, Philippines, pp. 357–
371.
Horie, T. (2001) Increasing yield potential in irrigated rice: breaking the yield barrier. In: Peng, S.
and Hardy, B. (Eds.) Rice research for food security and poverty alleviation. International RiceResearch Institute, Manila, Philippines, pp. 3–25.
Huang, N., Angeles, E.R., Domingo, J., Magpantay, G., Singh, S., Zhang, G., Kumaravadivel, N.,
Bennet, J. and Khush, G.S. (1997a) Pyramiding of bacterial blight resistance genes in rice:
marker assisted selection using RFLP and PCR. Theor. Appl. Genet. 95, 313–320.
Huang, N., Parco, A., Mew, T., Magpantay, G., McCouch, S., Guiderdoni, E., Xu, J., Subudhi, P.,
Angeles, E.R. and Khush, G.S. (1997b) RFLPmapping of isozymes, RAPD and QTLs for grain
shape, brown planthopper resistance in a doubled haploid rice population. Molecular Breeding
3(2), 105–113.
Hull, F.H. (1945) Recurrent selection for specific combining ability in corn. J. Am. Soc. Agron. 37
(2), 134–145.
Ismachin, M. and Sobrizal (2006) A significant contribution of mutation techniques to rice
breeding in Indonesia. Plant Mutat. Rep. 1(1), 18–22.
IRRI (2002) Rice almanac, source book for the most important economic activity on earth. Thirdedition. Maclean, J.L., Dawe, D.C., Hardy, B., and Hettel, G.P. (Eds.) International Rice
Research Institute, Manila, Philippines. pp. 1–253.
Jackson, M.T., Loresto, G.C., Appa Rao, S., Jones, M., Guimaraes, E.P. and Ng, N.Q. (1997) Rice.
In: Fuccillo, D., Sears, L. and Stapleton, P. (Eds.) Biodiversity in trust, conservation and use of
122 E.P. Guimaraes
plant genetic resources in CGIAR Centres. Cambridge University Press, Cambridge, UK, pp.
273–291.
Jackson, M.T. and Lettington, R.J.L. (2003) Conservation and use of rice germplasm, an evolving
paradigm under the International Treaty on Plant Genetic Resources for Food and Agriculture.
In: Sustainable rice production for food security. Proceedings of the 20th session of theInternational Rice Commission. Bangkok, Thailand, 23–26 July 2002, pp. 75–88.
Jones, M., Dingkuhn, M., Aluko, G.K. and Semon, M. (1997) Interspecific Oryza sativa L. x O.glaberrima Steud. progenies in upland rice improvement. Euphytica 94(2), 237–246.
Jones, M. and Wopereis-Pura, M. (2001) History of Nerica and PVS. Internal report, West Africa
Rice Development Association (WARDA); Bouake, Cote d’Ivoire.
Julfiquar, A.W., Jamil Hasan, M., Azad, A.K., Anwar Hossain, M. and Virmani, S.S. (2003)
Hybrid rice research and development in Bangladesh. In: Virmani, S.S., Mao, C.X. and Hardy,
B. (Eds.) Hybrid rice for food security, poverty alleviation, and environmental protection.International Rice Research Institute, Manila, Philippines, pp. 235–245.
Junjian, N., Colowit, P.M. and Mackill, D.J. (2002) Evaluation of genetic diversity in rice
subspecies using microsatellite markers. Crop Sci. 42(2), 601–607.
Kaneda, C. (1985) Development of very high-yielding rice varieties. Farming Japan 19, 25–29.
Khatiwada, S.P., Senadhira, D., Carpena, A.L., Zeigler, R.S. and Fernandez, P.G. (1996) Varia-
bility and genetics of tolerance for aluminum toxicity in rice (Oryza sativa L.) Theor. Appl.
Genet. 93(5–6), 738–744.
Khush, G.S. (1977) Disease and insect resistance in rice. Adv. Agron. 29, 265–341.
Khush, G.S. (1994) Increasing the genetic yield potential of rice, prospects and approaches. Int.
Rice Comm. Newsl. 43, 1–8.
Khush, G.S. and Brar, D.S. (2003) Biotechnology for rice breeding: progress and impact. In:
Sustainable rice production for food security. Proceedings of the 20th session of the Interna-tional Rice Commission, Bangkok, Thailand, 23–26 July 2002, pp. 41–58.
Khush, G.S. and Peng, S. (1996) Breaking the yield frontier of rice. In: Reynolds, M.P. (Eds.)
Increasing yield potential in wheat: Breaking the barriers. Proceedings of the workshop heldon 26–28 March 1996, Ciudad Obregon, Sonora, Mexico. International Maize and Wheat
Improvement Center, El Batan, Mexico. pp. 36–51.
Khush, G.S., Singh, R.J., Sur, S.C. and Librojo, A.L. (1984) Primary trisomics of rice, origin,
morphology, cytology and use in linkage mapping. Genetics 107, 141–163.
Khush, G.S., Bacalangco, E. and Ogawa, T. (1990) A new gene for resistance to bacterial blight
from O. longistaminata. Rice Genet. Newsl. 7, 121–122.Khush, G.S., Coffman, W.R. and Beachell, H.M. (2001) The history of rice breeding: IRRI’s
contribution. In: Rockwood, W.G. (Ed.) Rice research and production in the 21st century:Symposium honouring Robert F. Chandler Jr. International Rice Research Institute, Manila,
Philippines, pp. 117–135.
Latha, R., Thiyaqarajan, K. and Senthilvel, S. (2004) Genetics, fertility behaviour and molecular
analysis of a new TGMS line, TS6, in rice. Plant Breed. 123(3), 235–240.
Lu, C., Shen, L., Tan, Z., Xu, Y., He, P., Chen, Y., and Zhu, L. (1996) Comparative mapping of
QTLs for agronomic traits of rice across environments using a doubled haploid population.
Theor. Appl. Genet. 93(8), 1211–1217.
Mao, C.X. (2001) Improving seed production to speed up the global commercialization of hybrid
rice. In: Peng, S. and Hardy, B. (Eds.) Rice research for food security and poverty alleviation.International Rice Research Institute, Manila, Philippines, pp. 221–229.
Marassi, J.E., Marassi, M.A., Chatel, M. and Borrero, J. (2000) Desarrollo de poblaciones de arroz
en Argentina. In: Guimaraes, E.P. (Ed.) Avances en el mejoramiento poblacional en arroz.Embrapa Arroz e Feijao, Santo Antonio de Goias, Brasil, pp. 173–186.
Marassi, M.A., Marassi, J.E., Chatel, M. and Ospina, Y. (2004) Exploiting the genetic resources of
rice in Argentina through population improvement. In: Guimaraes, E.P. (Ed.) Populationimprovement, A way of exploiting rice genetic resources in Latin America. Food and Agricul-
ture Organization of the United Nations (FAO), Rome, Italy, pp. 113–127.
Rice Breeding 123
Maluszynski, M., Ahloowalia, B., Ashri, A., Nichterlein, K. and Zanten, L.V. (1998) Induced
mutation in rice breeding and germplasm enhancement. In: Assessment and orientationtowards the 21st century. Proceedings of the 19th session of the International Rice Commis-sion, Cairo, Egypt, 7–9 September 1998, pp. 194–204.
McCouch, S.R., Kochert, G., Yu, Z.H., Wang, Z.Y., Khush, G.S., Coffaman, D.R. and Tanksley, S.
D. (1988) Molecular mapping of rice chromosomes. Theor. Appl. Genet. 76, 815–829.
Mishra, B. (2002) Varietal improvement for rice production in India. In: Nguyen, V.N. (Ed.)
Genetic diversity in rice production, Case studies from Brazil, India and Nigeria. Food and
Agriculture Organization of the United Nations (FAO), Rome, Italy, pp. 37–91.
Mishra, B., Viraktamath, B.C., IIyas Ahmed, M., Ramesha, M.S. and Vijayakumar, C.H.M. (2003)
Hybrid rice development and use in India. In: Virmani, S.S., Mao, C.X. and Hardy, B. (Eds.)
Hybrid rice for food security, poverty alleviation, and environmental protection. InternationalRice Research Institute, Manila, Philippines, pp. 265–286.
Moncada, P., Martınez, C.P., Borrero, J., Gauch, H. Jr., Guimaraes, E.P., Tohme, J. and McCouch,
S.R. (2001) Quantitative trait loci for yield and yield components in an Oryza sativa x
Oryza rufipogon BC2F2 population evaluated in an upland environment. Theor. Appl. Genet.
102, 41–52.
Montalban, R., Destro, D., Silva, E.F. and Montano, J.C. (1998) Genetic base of Brazilian upland
rice cultivars. J. Genet. Breed. 52, 203–209.
Morinaga, T. (1954) Classification of rice varieties on the basis of affinity. In: International RiceCommission. Working Party on Rice Breeding Rep. 5th Meeting.
Morishima, H. (1984) Species relationships and the search for ancestros. In: Tsunoda, S. and
Takahashi, N. (Eds.) Biology of rice. Japan Sci. Soc. Press. Tokio, Japan, pp. 3–30.
Morishima, H. and Oka, H.I. (1981) Phylogenetic differentiation of cultivated rice. XXVII
Numerical evaluation of the Indica – Japonica differentiation. JPN. J. Breed. 31, 402–413.
Mou, T.M., Xing-Gui, L., Hoan, N.T. and Virmani, S.S. (2003) Two-line hybrid rice breeding in
and outside China. In: Virmani, S.S., Mao, C.X. and Hardy, B. (Eds.) Hybrid rice for foodsecurity, poverty alleviation, and environmental protection. International Rice Research Insti-
tute, Manila, Philippines, pp. 31–52.
Muralidharan, K., Prasad, G.S.V. and Rao, C.S. (2002) Yield performance of rice genotypes in
international multi-environment trials during 1976–1997. Curr. Sci. 83(5), 610–619.
Murchie, E.H., Hubbart, S., Peng, S. and Horton, P. (2001) Raising rice yield potential by
manipulating photosynthesis: improvement of radiation conversion efficiency. In: Peng, S.
and Hardy, B. (Eds.) Rice research for food security and poverty alleviation. International RiceResearch Institute, Manila, Philippines, pp. 119–128.
Oka, H.I. (1958) Intervarietal variation and classification of cultivated rice. Indian J. Genet. Plant
Breed. 18, 79–89.
Oka, H.I. (1964) Pattern of interspecific relationships and evolutionary dynamics in Oryza. In:Rice genetics and cytogenetics. Elsevier, Amsterdam, Netherlands. pp. 71–90.
Oladele, O.I. and Sakagami, J.I. (2004) Impact of technology innovation on rice yield gap in Asia
and West Africa – Technology transfer issues. In: Rural Poverty Reduction though Researchfor Development and Transformation, Proceeding of the Deutscher Tropentag, October 5–7,2004. Humboldt-Universitat, Berlin, Germany. p. 184.
Peng, S. and Khush, G.S. (2003) Four decades of breeding for varietal improvement of irrigated
lowland rice in the International Rice Research Institute. Plant Prod. Sci. 6(3), 157–164.
Peng, S., Cassman, K.G., Virmani, S.S., Sheehy, J. and Khush, G.S. (2005) Yield potential of
Tropical rice since the release of IR8 and the challenge of increasing rice yield potential. Crop
Sci. 39, 1552–1559.
Perez-Polanco, R., Chatel, M. and Guimaraes, E.P. (2000) Mejoramiento poblacional del arroz en
Cuba, Situacion actual y perspectives. In: Guimaraes, E.P. (Ed.) Avances en el mejoramientopoblacional en arroz. Embrapa Arroz e Feijao, Santo Antonio de Goias, Brasil, pp. 131–144.
Picard, E., Hours, C., Gregoire, S., Phan, T.H., and Meunier, J.P. (2004) Significant improvement
of androgenetic haploid and double haploid induction from wheat plants treated with a
chemical hybridization agent. Theor. Appl. Genet. 74(3), 289–297.
124 E.P. Guimaraes
Rai, M. (2003) Genetic diversity in rice production, past contribution and the potential of
utilization for sustainable rice production. In: Sustainable rice production for food security.Proceedings of the 20th session of the International Rice Commission, Bangkok, Thailand, 23–26 July 2002, pp. 89–115.
Rangel, P.H.N. and Neves, P.C.F. (1997) Seleccion recurrente aplicada al arroz de riego en Brasil.
In: Guimaraes, E.P. (Ed.) Seleccion recurrente en arroz. Centro Internacional de Agricultura
Tropical, Cali, Colombia, pp. 79–97.
Rangel, P.H.N., Guimaraes, E.P. and Neves, P.C.F. (1996) Base genetica das cultivares de arroz
(Oryza sativa L.) irrigado do Brasil. Pesq. Agropec. Bras. 31(5), 349–357.
Rangel, P.H.N., Zimmermann, F.J.P. and Fagundes, P.R.R. (2000) Mejoramiento poblacional del
arroz de riego en Brasil. In: Guimaraes, E.P. (Ed.) Avances en el mejoramiento poblacional enarroz. Embrapa Arroz e Feijao, Santo Antonio de Goias, Brasil, pp. 65–85.
Rangel, P.H.N., Cordeiro, A.C.C., Lopes, S.I.G., Morais, O.P. de, Brondani, C., Brondani, R.P.V.,
Yokoyama, S., Schiocchet, M., Bacha, R. and Ishy, T. (2005) Advances in population im-
provement of irrigated rice in Brazil. In: Guimaraes, E.P. (Ed.) Population improvement, A wayof exploiting rice genetic resources in Latin America. Food and Agriculture Organization of theUnited Nations (FAO), Rome, Italy, pp. 145–186.
Santos, P.G., Soares, P.C., Soares, A.A., Morais, O.P. and Cornelio, V.M.O. (1997) Estimativa do
progresso genetico do programa de mejoramento de arroz irrigado desenvolvido em Minas
Gerais no periodo 1974 a 1996. In: Anais da XXII Reuniao da Cultura do Arroz Irrigado, 1997.Balneario Camboriu, Santa Catarina, Brasil. pp. 27–20.
Sarkarung, S. (1991) A simplified crossing method for rice breeding. Fondo Latinoamericano de
Arroz de Riego (FLAR) and CIAT, Cali, Colombia. pp. 1–32.
Second, G. (1982) Origin of the genetic diversity of cultivated rice (Oryza spp): study of the
polymorphism scored at 40 isozyme loci. Jpn. J. Genet. 57, 25–57.
Sheehy, J.E., Mitchell, P.L., Dionora, J. and Ferrer, A. (2001) What governs ceiling yield and its
rate of attainment? In: Peng, S. and Hardy, B. (Eds.) Rice research for food security andpoverty alleviation. International Rice Research Institute, Manila, Philippines, pp. 69–77.
Shih-Cheng, L. and Loung Ping, Y. (1980) Hybrid rice breeding in China. In: Innovativeapproaches to rice breeding: Selected papers form the 1979 International Rice ResearchConference. International Rice Research Institute, Los Banos, Philippines, pp. 35–51.
Singh, R.J. and Ikehashi, H.I. (1981) Monogenic male sterility in rice, induction, identification and
inheritance. Crop Sci. 21(2), 286–289.
Sprague, G.F. and Tatum, L.A. (1941) General vs. specific combining ability in single crosses of
corn. J. Am. Soc. Agron. 34, 923–932.
Sun, C.Q., Wang, X.K., Li, Z.C., Yoshimura, A. and Iwata, N. (2001) Comparison of the genetic
diversity of common wild rice (Oryza rufipogon Griff.) and cultivated rice (O. sativa L.) usingRFLP markers. Theor. Appl. Genet. 102, 57–162.
Suwarno, Nuswantoro, M.W., Munarso, Y.P. and Direja, M. (2003) Hybrid rice development and
use in Indonesia. In: Virmani, S.S., Mao, C.X. and Hardy, B. (Eds.) Hybrid rice for foodsecurity, poverty alleviation, and environmental protection. International Rice Research Insti-
tute, Manila, Philippines, pp. 287–296.
Taillebois, J. and Guimaraes, E.P. (1989) CAN-IRAT5 upland rice population. Int. Rice Res.
Newsl. 14(3), 8.
Taillebois, J. and Castro, E. da M. de (1986) A new crossing technique. Int. Rice Res. Newsl. 11
(6), 6.
Tan, X.L., Vanavichit, A., Amornsilpa, S. and Trangoorung, S. (1998) Genetic analysis of rice
CMS-WA fertility restotation based on QTL mapping. Theor. Appl. Genet. 97(5/6), 994–999.
Tran, D.Q., Dao, T.T.B., Nguyen, H.D., Lam, Q.D., Bui, H.T., Nguyen, V.B., Nguyen, V.X., Le,
V.N., Do, H.A. and Phan, P. (2006) Rice mutation breeding in Institute of Agricultural
Genetics, Viet Nam. Plant Mutati. Rep. 1(1), 47–49.
Vaughan, D.A. (1994) The wild relatives of rice, A genetic resources handbook. International Rice
Research Institute, Manila, Philippines. pp. 1–137.
Rice Breeding 125
Virmani, S.S. (2003) Advances in hybrid rice research and development in the tropics. In:
Virmani, S.S., Mao, C.X. and Hardy, B. (Eds.) Hybrid rice for food security, poverty allevia-tion, and environmental protection. International Rice Research Institute, Manila, Philippines,
pp. 7–20.
Virmani, S.S., Viraktamath, B.C., Casal, C.L., Toledo, R.S., Lopez, M.T. and Manalo, J.O. (1997)
Hybrid rice breeding manual. International Rice Research Institute, Manila, Philippines. pp. 1–
151.
Virmani, S.S., Mao, C.X., Toledo, R.S., Hossain, M. and Janaiah, A. (2001) Hybrid rice seed
production technology for improving seed industries and rural employment opportunities in
Asia. Paper presented at the International Workshop on Seed and Seeding Sciences and
Technology. Taiwan, China, 10–17 June 2001.
Wang, L.Q. (1992) Advances in plant mutation breeding in China: a full analysis. Bull. Nucl.
Agric. Sci. 13, 282–295.
Wang, X.W., Lai, J.R., Fan, L. and Zhang, R.B. (1996) Effects of recurrent selection on popula-
tions of various generations in wheat by using the Tai Gu single dominant male-sterile gene. J.
Agric. Sci. 126(4), 397–402.
WARDA [West Africa Rice Development Association] (2003) Assessing the impact of NERICA
rice varieties: not just surveys and simple mathematics. Available at http://www.warda.cgiar.
org/publications/AR2002–03/assessing%20the%20impact.pdf. Consulted on 7 December
2006.
Wenfu, C., Zhenjin, X., Longbu, Z. and Shouren, Y. (2001) Development of the new rice plant
type and advances in research on breeding for super high yield. In: Peng, S. and Hardy, B.
(Eds.) Rice research for food security and poverty alleviation. International Rice Research
Institute, Manila, Philippines, pp. 43–50.
Werner, B.K. and Wilcox, J.R. (2004) Recurrent selection for yield in Glycine max using genetic
male-sterility. Euphytica 50(1), 19–26.
Xiao, J., Li, J., Grandillo, S., Ahn, S.N., Yuan, L., Tanksley, S.D. and McCouch, S.R. (1998)
Identification of trait-improving quantitative trait loci alleles from a wild rice relative, Oryzarufipogon. Genetics 150, 899–909.
Yang, S.R., Zhang, L.B. and Chen, W.F. (1996) Theories and methods of rice breeding for
maximum yield. Acta Agron. Sin. 22(3), 295–304.
Yamaguchi, Y., Ikeda, R., Hirasawa, H., Minami, M. and Ujikara, A. (1997) Linkage analysis of
termosensitive genetic male sterility gene, tms2, in rice (Oryza sativa L.). Breed. Sci. 47, 371–373.
Yu, J., Hu, S., Wang, J., Wong, K.S., Li, S., Liu, B., Deng, Y., Dai, L., Zhou, Y., Zhang, X., Cao,
M., Liu, J., Sun, J., Tang, J., Chen, Y., Huang, X., Lin, W., Ye, C., Tong, W., Cong, L., Geng,
J., Han, Y., Li, L., Li, W., Hu, G., Huang, X., Li, W., Li, J., Liu, Z., Li, L., Liu, J., Qi, Q., Liu, J.,
Li, L., Li, T., Wang, X., Lu, H., Wu, T., Zhu, M., Ni, P., Han, H., Dong, W., Ren, X., Feng, X.,
Cui, P., Li, X., Wang, H., Xu, X., Zhai, W., Xu, Z., Zhang, J., He, S., Zhang, J., Xu, J., Zhang,
K., Zheng, X., Dong, J., Zeng, W., Tao, L., Ye, J., Tan, J., Ren, X., Chen, X., He, J., Liu, D.,
Tian, W., Tian, C., Xia, H., Bao, Q., Li, G., Gao, H., Cao, T., Wang, J., Zhao, W., Li, P., Chen,
W., Wang, X., Zhang, Y., Hu, J., Wang, J., Liu, S., Yang, J., Zhang, G., Xiong, Y., Li, Z., Mao,
L., Zhou, C., Zhu, Z., Chen, R., Hao, B., Zheng, W., Chen, S., Guo, W., Li, G., Liu, S., Tao, M.,
Wang, J., Zhu, L., Yuan, L., and Yang, H. (2002) A draft sequence of the rice genome (Oryzasativa L. ssp. indica). Science 296, 79–92.
Yuan, L.P. (2003) The second generation of hybrid rice in China. In: Sustainable rice productionfor food security. Proceedings of the 20th session of the International Rice Commission.Bangkok, Thailand, 23–26 July 2002, pp. 117–120.
126 E.P. Guimaraes
Spring Wheat Breeding
M. Mergoum, P.K. Singh, J.A. Anderson, R. J. Pena, R.P. Singh,
S.S. Xu, and J.K. Ransom
Abstract Wheat (various species of the genus Triticum) is a grass originating fromthe Levant area of the Middle East. However, only hexaploid common wheat
(Triticum eastivum), and tetraploid durum wheat (Triticum turgidum ssp. durum)are presently cultivated worldwide. Not only is wheat an important crop today, it
may well have influenced human history. Wheat was a key factor enabling the
emergence of civilization because it was one of the first crops that could be easily
cultivated on a large scale, and had the additional advantage of yielding a harvest
that provides long-term storage of food. Today, there are different classes and uses
of wheat. Although, it is mainly used as a staple food to make flour for leavened, flat
and steamed breads, wheat can also be used as livestock feed, for fermentation to
make beer and other alcoholic liquids, and recently, as a source of bio-energy.
Global wheat production must increase at about 2% annually to meet future
demands. The potential of increasing the global arable land is limited; hence, future
increases in wheat production must be achieved by enhancing the wheat productiv-
ity to the land already in use. The objectives of most breeding programs include:
high and stable yields, superior end-use quality, desirable agronomic characteris-
tics, biotic (mainly, pests) resistance, and abiotic (environmental stresses) toler-
ance. While it is virtually impossible to combine all these characteristics into a
single ‘‘perfect’’ variety, continuous breeding efforts toward achieving these objec-
tives will ensure that new varieties possess as many desirable and economic traits as
possible. Details of the different breeding approaches to enhance modern wheat
breeding are discussed in this chapter.
M. Mergoum(*)
Department of Plant Sciences, Loftsgard Hall, P.O. Box 6050, North Dakota State University
Dept. 7670, Fargo, ND, 58108-6050, USA
M.J. Carena (ed.), Cereals,DOI: 10.1007/978-0-387-72297-9, # Springer Science + Business Media, LLC 2009 127
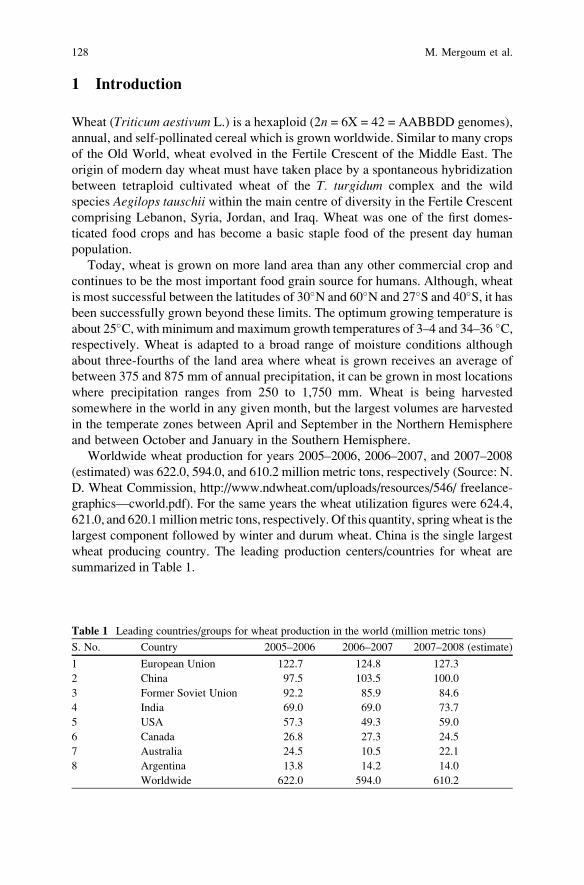
1 Introduction
Wheat (Triticum aestivum L.) is a hexaploid (2n = 6X = 42 = AABBDD genomes),
annual, and self-pollinated cereal which is grown worldwide. Similar to many crops
of the Old World, wheat evolved in the Fertile Crescent of the Middle East. The
origin of modern day wheat must have taken place by a spontaneous hybridization
between tetraploid cultivated wheat of the T. turgidum complex and the wild
species Aegilops tauschii within the main centre of diversity in the Fertile Crescent
comprising Lebanon, Syria, Jordan, and Iraq. Wheat was one of the first domes-
ticated food crops and has become a basic staple food of the present day human
population.
Today, wheat is grown on more land area than any other commercial crop and
continues to be the most important food grain source for humans. Although, wheat
is most successful between the latitudes of 30�N and 60�N and 27�S and 40�S, it hasbeen successfully grown beyond these limits. The optimum growing temperature is
about 25�C, with minimum and maximum growth temperatures of 3–4 and 34–36 �C,respectively. Wheat is adapted to a broad range of moisture conditions although
about three-fourths of the land area where wheat is grown receives an average of
between 375 and 875 mm of annual precipitation, it can be grown in most locations
where precipitation ranges from 250 to 1,750 mm. Wheat is being harvested
somewhere in the world in any given month, but the largest volumes are harvested
in the temperate zones between April and September in the Northern Hemisphere
and between October and January in the Southern Hemisphere.
Worldwide wheat production for years 2005–2006, 2006–2007, and 2007–2008
(estimated) was 622.0, 594.0, and 610.2 million metric tons, respectively (Source: N.
D. Wheat Commission, http://www.ndwheat.com/uploads/resources/546/ freelance-
graphics—cworld.pdf). For the same years the wheat utilization figures were 624.4,
621.0, and 620.1millionmetric tons, respectively. Of this quantity, springwheat is the
largest component followed by winter and durum wheat. China is the single largest
wheat producing country. The leading production centers/countries for wheat are
summarized in Table 1.
Table 1 Leading countries/groups for wheat production in the world (million metric tons)
S. No. Country 2005–2006 2006–2007 2007–2008 (estimate)
1 European Union 122.7 124.8 127.3
2 China 97.5 103.5 100.0
3 Former Soviet Union 92.2 85.9 84.6
4 India 69.0 69.0 73.7
5 USA 57.3 49.3 59.0
6 Canada 26.8 27.3 24.5
7 Australia 24.5 10.5 22.1
8 Argentina 13.8 14.2 14.0
Worldwide 622.0 594.0 610.2
128 M. Mergoum et al.
1.1 Wheat Uses
Worldwide, the main uses of wheat are for human food and animal feed. However,
wheat can be fractionated into grain components (starch, gluten, and oil), non-grain
components (straw), orminor components associatedwith flourmilling by-products,
particularly wheat bran. Three-phase centrifugal separation of starch, gluten, pento-
sans (hemicellulose), and fiber from wet-milled wheat flour results in wheat compo-
nents that have diverse uses in food and non-food products (Bergthaller, 1997).
Wheat starch can be chemically modified or hydrolyzed to yield many functional
products that can be used in the production of paper, adhesives, plastic films,
sweeteners, thickeners, cosmetic powders and creams, packaging materials, and
foams (Maningat and Seib, 1997). Yeast fermentation of starch to produce bio-fuel
and industrial alcohol is gaining interest worldwide (Maningat and Seib, 1997),
particularly now that fossil fuel prices are high and unpredictable. Vital gluten, a
co-product of wheat starch extraction, has been used for decades in the food
industry as a foaming agent, surfactant, labeling or packaging adhesive, and coating
or a film-forming membrane for food and non-food materials such as paper and
cardboard (Bergthaller, 1997; Popineau et al., 2002).
Wheat straw is rich in fibrous materials and is used in addition to traditional uses,
for making textiles, filters, sorbents, structural composites, molded products, and
packaging materials. Wheat straw may also be used as a relatively ‘‘clean’’ energy
source considering that when burned, its gas emissions are low (Culshaw, 1997).
Wheat germ contains around 11% oil, which is a good source of vitamin E. Wheat
germ oil is used in foods, insect repellents, pharmaceuticals, and cosmetics (Kah-
lon, 1989). Both wheat germ oil and bran (flour milling by-products) are rich in
polyunsaturated fatty acids and bioactive compounds, such as a mixture of long-
chain aliphatic primary alcohols known as policosanol that are effective for the
prevention and treatment of cardiovascular diseases and have been associated with
increased physical endurance and fitness (Varady et al., 2003). However, wheat is
still mainly used for human consumption in various forms of products.
1.2 Breads
Consumed globally, bread is common in human diets in the Western Hemisphere
and a staple food in North Africa, the Middle East, and West-Central Asia (Prior,
1997). Bread consumption is low in rural areas of Southeast Asia but tends to
increase among the urban population with improved income (McKee, 2006). All
wheat-based bread types (leavened, flat, and steamed) are made with flour doughs
showing different viscoelastic properties. Leavened breads are made from wheat
(and/or wheat-rye blends in Central and Eastern Europe) viscoelastic flour dough,
leavened by yeast and/or other fermenting agents. Flat breads are traditionally
consumed in Northern Europe, North Africa, the Middle East, South Asia, and
North and Central America (Faridi, 1988) and are prepared with fermented or
Spring Wheat Breeding 129
unfermented doughs made from unmixed wheat flour, or composite flours including
wheat and other cereals. Steamed bread, very popular in China and Southeast Asia
(He et al., 2003), is spherical and have a spongy crumb and no crust.
1.3 Flour Noodles
Wheat flour noodles are a staple food in Northern China and are widely consumed
all over the Far East (Liu et al., 2003). Flour noodles are made from sheeted stiff
flour dough that is cut into noodle strands and sold fresh or dried. Mechanized
noodle production predominates in Japan, while semi-mechanized and handmade
production predominates in China.
1.4 Breakfast Cereals and Cereal Bars
Wheat is used to manufacture ready-to-eat breakfast cereals and cereal bars, conve-
nience foods of increasing popularity as regular and calorie-low sources of nutrients
and dietary fiber to reduce obesity-related health problems (Palazzolo, 2003).
1.5 Cookies and Cakes
Produced worldwide, soft wheat-based foods come in wide variety of shapes,
textures, sizes, and flavors. Cookies are usually made with inelastic stiff dough,
but some cookies, cakes, pancakes, and waffles require thick or thin viscous
batters.
1.6 Blending
Hard Red Spring (HRS) wheat produced in USA and Canada is considered the
premium standard in the world market for baking bread and other products because
of its high protein and superior gluten functionality. HRS wheat from these two
countries is extensively used for blending with and improving the functional quality
of other cheaper but inferior wheat classes/other cereal flours in different parts of
the world. HRS wheat’s use in flour blends help flour mills meet their customer’s
demands for a specific level of protein content, water absorption, and mixing
stabilities. The blended products also have improved moistness, softness, and
increased shelf-life, making it more desired to the local consumer’s demand.
130 M. Mergoum et al.
2 Genetics
Springwheats botanically belong to commonwheat (Triticum aestivum L., 2n = 6X =
42). Spring growth habit of common wheat is genetically controlled by the
dominant vernalization gene Vrn1 (Yan et al., 2003). Common wheat is an allo-
hexaploid with the A, B, and D genomes. The 21 pairs of chromosomes are grouped
into 7 homoeologous groups and each chromosome has 2 homoeologues in the
other 2 genomes (Sears, 1954, 1966). Thus, many important characters of common
wheat are genetically controlled by orthologous gene sets located on colinear
regions of three homoeologous chromosomes such as the vernalization gene Vrn1on chromosome 5A, 5B, and 5D (Yan et al., 2003) and storage protein genes Gluand Gli on 1A, 1B, and 1D. Hexaploid common wheat behaves as a diploid
organism at meiosis due to the Ph1 (pairing homoeologous) gene on the long arm
of chromosome 5B, which prohibits pairing between homoeologous chromosomes
(Riley and Chapman, 1958). Since the absence or mutation of the Ph1 gene induceshomoeologous pairing, manipulation of the Ph1 gene has been a major approach for
transferring desirable genes from related wheat species to common wheat. A large
number of translocation lines containing alien genes for resistance to various
abiotic and biotic stresses have been developed using the ph1b mutant.
The allopolyploid nature allows common wheat to tolerate structural and nu-
merical changes of chromosomes. Various types of aneuploid and genetic stocks
have been established in spring wheat ‘‘Chinese Spring’’ (CS) and other cultivars.
The CS aneuploids and genetic stocks that are currently available include sets of
monosomics (2n – 1), trisomics (2n + 1), tetrasomics (2n + 2), nullisomics (2n – 2),nullisomic-tetrasomics (2n – 2 + 2), ditelosomics, ditelo-monotelosomics, double-
ditelosomics, monoisosomics, and segmental deletion lines (Sears, 1954, 1966; Gill
et al., 2004). These aneuploids have been widely used to locate individual genes or
molecular marker loci to specific chromosomes and chromosome intervals.
Common wheat possesses a very complex and huge genome with a size of
~16 � 109 bp, which consists of about 90% repeated sequences (Li et al., 2004).
Such a large genome with excess repetitive sequences seriously hampers genomic
analysis and whole-genome sequencing for gene discovery at the present time
(Janda et al., 2004). However, enormous progress in exploring the wheat genome
has been made through molecular and physical mapping and functional and com-
parative genomic studies. Thus far, about 5,000 molecular markers have been
mapped onto more than 20 genetic maps in wheat and its relative species (http://
wheat.pw.usda.gov/ggpages/mapsframe.html), from which a composite linkage
map has been compiled (http://wheat.pw.usda.gov/ggpages/wgc) (Gill et al.,
2004). A high-density microsatellite consensus linkage map consisting of 1,235
microsatellite marker loci has been established (Somers et al., 2004). More than
855,000 Expressed Sequence Tags (ESTs) have been generated from common
wheat (http://www.ncbi.nlm.nih.gov/dbEST) and about 7,000 unigenes have been
mapped to 159 bins across the 21 chromosomes (http://wheat.pw.usda.gov/nsf; Gill
et al., 2004). Two bacterial artificial chromosome (BAC) libraries consisting of
Spring Wheat Breeding 131
120,000 and 2,000,000 clones have been constructed from the genomes of common
wheat CS and ‘‘Renan’’, respectively (Gill et al., 2004). A sub-genomic BAC
library for chromosomes 1D, 4D, and 6D and two chromosome-specific
BAC libraries for chromosomes 3B and 1BS have been constructed using chromo-
some sorting (Janda et al., 2004; Safar et al., 2004).
The abundance of genetic and genomic resources in common wheat provides
great facilitation in characterizing the wheat genome and individual genes. The
well-characterized aneuploid stocks, molecular markers and maps, deletion-
mapped ESTs, and BAC libraries have considerably promoted molecular mapping
and tagging of genes from common wheat. A large number of important genes have
been precisely mapped and several genes including the leaf rust resistance genes
Lr21 and Lr10, powdery mildew resistance genes Pm3, Vrn1, and domestication
gene Q have been isolated by map-based cloning (Gill et al., 2004). Rapid advances
in wheat genomics would further deepen our understanding of the wheat genome
and genetics and strengthen improvement of cultivated wheat through innovative
paradigms of molecular breeding.
3 Wheat Gene Pools
Wheat has one of the largest gene pool among the cereal crops and is notable for its
diversity. Modern day wheat (Triticum aestivum L.) is a hexaploid composed of
AABBDD genome. The genome donors are T. urartu (A), the Sitopsis section of
Aegilops (B), and Aegilops tauschii (D) (Dvorak, 1998). Wheat belongs to tribe
‘‘Triticeae’’ of the family ‘‘Gramineae’’. There are three major gene pools of wheat
(Mujeeb-Kazi and Rajaram, 2002). Primary gene pool members cross readily
among one another and consist of all Triticum species. The primary gene pool
species include the common cultivated and landraces of hexaploid wheat, cultivated
and landraces of tetraploid wheat, wild T. dicoccoides and diploid donors of the
A and D genomes to durum and bread wheats. Genetic transfers from these two
genomes occur as a consequence of direct hybridization and homologous recombi-
nation with breeding protocols contributing different back-crossing and selection
strategies. Some cross combinations among primary gene pool members may
require embryo rescue, but cytogenetic manipulation procedures are not necessary.
The secondary gene pool is composed of the polyploid Triticum and Aegilopsspecies, which share one genome with the three genomes of wheat. The diploid
species of the ‘‘Sitopsis’’ sections are included in this pool, and hybrid products
within this gene pool demonstrate reduced chromosome pairing. Gene transfers
occur as a consequence of direct crosses, breeding protocols, and homologous
exchange between the related genome or through use of special manipulation
strategies among the non-homologous genome. Embryo rescue is a complementary
aid for obtaining hybrids.
Diploid and polyploid species are members of the tertiary gene pool.
Their genomes are non-homologous. Homologous exchanges cannot affect genetic
132 M. Mergoum et al.
transfers, but genomic homoeology of these species does permit the transfer of
genes by somewhat complex protocols, facilitated by irradiation or callus culture-
mediated translocation induction.
4 Varietal Groups/Classes
The type of cultivar of a crop used for commercial production is depended on the
mode of reproduction, economics of cost of seed production and the crop returns,
the nature, feasibility, and ease of seed production and distribution system and the
environment under which crop production occurs. Wheat is a monoecious plant
with perfect flowers. It reproduces sexually as an autogamous or self-pollinated
crop although limited (3%) cross pollination is possible. Wheat cultivars are
developed mainly by three means: introduction, selection, and hybridization. Intro-
duction of wheat cultivars grown elsewhere has been successful in the early
establishment and development of wheat production areas. The ‘‘Green Revolu-
tion’’ in the 1960s was as a result of the introduction of cultivars developed at
Centro Internacional de Mejoramiento de Maız y Trigo (CIMMYT) into more than
25 countries where the introduced cultivars were very productive and successful.
CIMMYT germplasm adapted to high input environments resistant to lodging as a
result of the semi-dwarf gene (Rht1) from the Japanese source ‘‘Norin 10’’ was
often introduced as cultivars/lines and selected for local adaptability and desirability
and the resulting selected genotype was then released as a cultivar. However, most
modern cultivars are developed by artificial hybridization or crossbreeding followed
by rigorous selection for desired traits.
In addition to landraces and local populations still grown in some areas, three
types of wheat cultivars are commercially grown: hybrids, multi-lines, and pure-
lines. Hybrid wheat cultivars are produced by the use of chemical gametocides and
cytoplasmic-genetic male sterility. However, hybrid wheats are grown in a limited
acreage due to the lack of heterotic groups for economic traits and the expense
involved in producing them. Two types of multi-line wheat cultivars are produced
(i) mixture of near-isogenic lines differing in the resistance genes to one or a few
wheat diseases and (ii) mixture of distinct cultivars. Multi-line wheat cultivars are
also grown commercially on a limited basis in few countries. The majority of
present day wheat cultivars are pure-lines and occupy the majority of wheat acreage
worldwide.
Based on genomic constitution, commercially grown wheat is of two main
classes (i) durum wheat, a tetraploid with AABB genomes and (ii) common wheat,
a hexaploid with AABBDD genomes. Common wheat is further classified into two
categories (winter vs. spring wheat) based on the distinct growing seasons. Winter
wheat, which normally accounts for 70–80% of US production, is sown in the fall
and harvested in the spring or summer while spring wheat is planted in the spring and
harvested in late summer or early fall. Outside of the USA, spring wheat is grown in
most countries except in northern Europe where winter wheat is dominant.
Spring Wheat Breeding 133
Based on kernel color, endosperm hardness, and other quality characteristics
spring wheat is classified into three distinct classes:
Hard red spring (HRS) wheat: Contains the highest percentage of protein of the
wheat classes, making it excellent for bread wheat with superior milling and baking
characteristics. The majority of the crop is grown in the Northern Great Plains of
USA (Montana, North Dakota, South Dakota, and Minnesota) and Canada. In USA,
North Dakota is the leading producer of HRS wheat accounting for 50% of US
production. USA produced spring wheat is largely exported to Central America,
Asia (Japan and Philippines), and parts of Europe.
Soft white (SW) wheat: Contains low protein content but is high yielding. It
produces flour for baking cakes, crackers, cookies, pastries, quick breads, muffins,
and snack foods. SW wheat is grown mainly in the Pacific Northwest and to a lesser
extent in California, Michigan, Wisconsin, and New York. SW is also grown in
significant amounts in Canada. It is exported to Egypt, Morocco, and Far East Asian
region.
Hard white spring (HWS) wheat: The newest class of wheat to be grown in the
USA. Closely related to red wheats (except for color genes), this class of wheat has
a milder, sweeter flavor, equal fiber and similar milling and baking properties. Flour
from HWS wheat is used mainly in the production of yeast breads, hard rolls,
bulgur, tortillas, and oriental noodles. HWS wheat is used primarily in domestic
markets, although it is also exported in limited quantities.
5 Current Goals of Wheat Breeding
With the ever-increasing human population the demand for wheat globally is bound
to increase considerably. Global wheat production must increase at 2% annually to
meet future demands. The potential of increasing the global arable land is limited;
hence, future increases in wheat production must be achieved by enhancing the
productivity to the land already in use. Developing cultivars with increased grain
yield potential, superior end-use quality, tolerance to abiotic stresses, and enhanced
resistance to diseases and pests would be essential (Singh et al., 2007). The
objectives of a wheat breeding program determine largely the parents used in
the development of breeding populations, methods of selection performed in the
breeding population, and the resource allocation. The major objectives of most
present day wheat breeding programs include the following:
5.1 Grain Yield
The most important objective of any wheat breeding program is to enhance grain
yield. Grain yield is a complexly inherited trait of low to moderate heritability and
134 M. Mergoum et al.
is strongly influenced by environmental conditions. Higher grain yields are usually
associated with lower protein content and delayed maturity. Wheat breeders at-
tempt to enhance grain yield without adversely affecting the protein content, which
is detrimental to its marketability, and the time to maturity, that may increase the
chances of production failure. Yield enhancement is often achieved by not only
selecting for greater genetic potential for yield per se but also by selecting for
resistance to biotic and abiotic stresses that may limit the expression of the
cultivar’s maximum yield potential. Breeding for enhanced yield depends on
(i) the average yield potential of the selected population, (ii) selection intensity,
(iii) genotypic variation for yield potential, and (iv) the degree to which genotypic
differences in yield potential are expressed in the selection nursery. Visual selection
and single plant evaluation for yield are not effective; hence, most breeders tend to
select for maturity, photoperiod response, shattering resistance, short stature, har-
vest index, and numerous disease reactions in early generation selections. These
traits directly or indirectly affect the yield potential of selected genotypes.
Wheat breeders use different approaches for yield evaluation due to the genetic
complexity of the trait and the considerable interaction between yield and environ-
ment. Tests across several years and locations are conducted to identify lines which
are genetically superior and stable for yield. Yield trials are conducted using
various experimental designs that include checks, randomization, and replications
to enhance the precision and accuracy of the selection process.
Rajaram (2001) emphasized that future yield increases will be based on (i) the
development and deployment of yield-enhancing, genetically based technologies to
produce future wheat cultivars, (ii) research and development of germplasm with
polygenically conferred multiple disease resistance targeted toward emerging crop-
ping systems such as zero tillage, (iii) solidifying research targeting marginal
environments both in terms of developing adapted improved germplasm and
conserving the natural resource base, especially in drought-prone areas, and (iv)
using biotechnology to aid conventional plant breeding by developing transgenics
and exploiting the application of molecular markers.
Management practices that optimize the genetic yield potential in available culti-
vars need to be developed. Furthermore, the development of genotypes that interact
positively with new crop management practices may be one means of increasing
productivity, especially in more favorable environments (Ransom et al., 2007).
5.2 Grain Quality
Wheat grain quality relates to how successfully wheat and flour perform in con-
sumer products and industrial processes. Enhancing wheat quality improves pro-
cessing efficiencies, makes more desirable and more diverse consumer products and
ensures the competitiveness of farmers, grain merchandisers, millers, and end
processors. Wheat quality criteria may vary drastically depending on the end-use.
Similarly, wheat cultivars may show large differences in their processing and end-
Spring Wheat Breeding 135
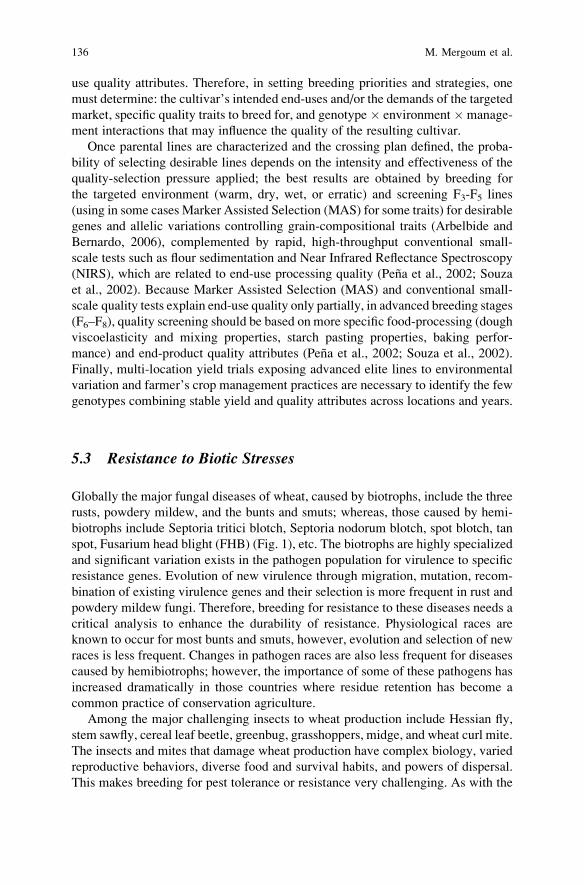
use quality attributes. Therefore, in setting breeding priorities and strategies, one
must determine: the cultivar’s intended end-uses and/or the demands of the targeted
market, specific quality traits to breed for, and genotype � environment �manage-
ment interactions that may influence the quality of the resulting cultivar.
Once parental lines are characterized and the crossing plan defined, the proba-
bility of selecting desirable lines depends on the intensity and effectiveness of the
quality-selection pressure applied; the best results are obtained by breeding for
the targeted environment (warm, dry, wet, or erratic) and screening F3-F5 lines
(using in some cases Marker Assisted Selection (MAS) for some traits) for desirable
genes and allelic variations controlling grain-compositional traits (Arbelbide and
Bernardo, 2006), complemented by rapid, high-throughput conventional small-
scale tests such as flour sedimentation and Near Infrared Reflectance Spectroscopy
(NIRS), which are related to end-use processing quality (Pena et al., 2002; Souza
et al., 2002). Because Marker Assisted Selection (MAS) and conventional small-
scale quality tests explain end-use quality only partially, in advanced breeding stages
(F6–F8), quality screening should be based on more specific food-processing (dough
viscoelasticity and mixing properties, starch pasting properties, baking perfor-
mance) and end-product quality attributes (Pena et al., 2002; Souza et al., 2002).
Finally, multi-location yield trials exposing advanced elite lines to environmental
variation and farmer’s crop management practices are necessary to identify the few
genotypes combining stable yield and quality attributes across locations and years.
5.3 Resistance to Biotic Stresses
Globally the major fungal diseases of wheat, caused by biotrophs, include the three
rusts, powdery mildew, and the bunts and smuts; whereas, those caused by hemi-
biotrophs include Septoria tritici blotch, Septoria nodorum blotch, spot blotch, tan
spot, Fusarium head blight (FHB) (Fig. 1), etc. The biotrophs are highly specialized
and significant variation exists in the pathogen population for virulence to specific
resistance genes. Evolution of new virulence through migration, mutation, recom-
bination of existing virulence genes and their selection is more frequent in rust and
powdery mildew fungi. Therefore, breeding for resistance to these diseases needs a
critical analysis to enhance the durability of resistance. Physiological races are
known to occur for most bunts and smuts, however, evolution and selection of new
races is less frequent. Changes in pathogen races are also less frequent for diseases
caused by hemibiotrophs; however, the importance of some of these pathogens has
increased dramatically in those countries where residue retention has become a
common practice of conservation agriculture.
Among the major challenging insects to wheat production include Hessian fly,
stem sawfly, cereal leaf beetle, greenbug, grasshoppers, midge, and wheat curl mite.
The insects and mites that damage wheat production have complex biology, varied
reproductive behaviors, diverse food and survival habits, and powers of dispersal.
This makes breeding for pest tolerance or resistance very challenging. As with the
136 M. Mergoum et al.
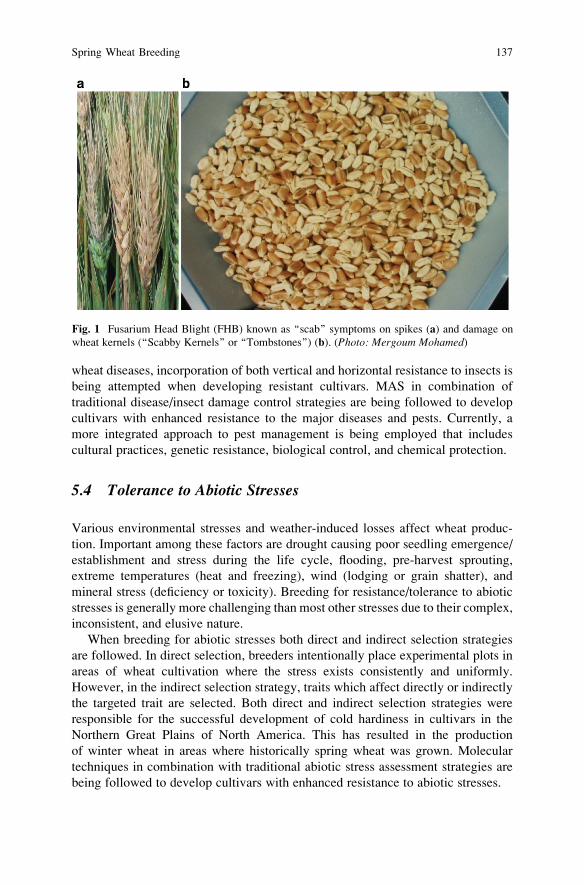
wheat diseases, incorporation of both vertical and horizontal resistance to insects is
being attempted when developing resistant cultivars. MAS in combination of
traditional disease/insect damage control strategies are being followed to develop
cultivars with enhanced resistance to the major diseases and pests. Currently, a
more integrated approach to pest management is being employed that includes
cultural practices, genetic resistance, biological control, and chemical protection.
5.4 Tolerance to Abiotic Stresses
Various environmental stresses and weather-induced losses affect wheat produc-
tion. Important among these factors are drought causing poor seedling emergence/
establishment and stress during the life cycle, flooding, pre-harvest sprouting,
extreme temperatures (heat and freezing), wind (lodging or grain shatter), and
mineral stress (deficiency or toxicity). Breeding for resistance/tolerance to abiotic
stresses is generally more challenging than most other stresses due to their complex,
inconsistent, and elusive nature.
When breeding for abiotic stresses both direct and indirect selection strategies
are followed. In direct selection, breeders intentionally place experimental plots in
areas of wheat cultivation where the stress exists consistently and uniformly.
However, in the indirect selection strategy, traits which affect directly or indirectly
the targeted trait are selected. Both direct and indirect selection strategies were
responsible for the successful development of cold hardiness in cultivars in the
Northern Great Plains of North America. This has resulted in the production
of winter wheat in areas where historically spring wheat was grown. Molecular
techniques in combination with traditional abiotic stress assessment strategies are
being followed to develop cultivars with enhanced resistance to abiotic stresses.
Fig. 1 Fusarium Head Blight (FHB) known as ‘‘scab’’ symptoms on spikes (a) and damage on
wheat kernels (‘‘Scabby Kernels’’ or ‘‘Tombstones’’) (b). (Photo: Mergoum Mohamed)
Spring Wheat Breeding 137
6 Breeding Methods and Techniques
In modern wheat breeding programs different breeding procedures and techniques
are followed depending upon a number of factors including (i) genetics of the trait
to be developed, (ii) resources available, and (iii) personal preference of the
breeder. Several different methods can be used to breed superior cultivars and
most present day wheat breeders follow a combination of several procedures,
each based specifically on the programs objectives and the resources available, to
him or her. The major breeding methods that are followed during development of
superior wheat cultivars include the following:
6.1 Backcrossing Selection
Backcrossing is a breeding method used to transfer one or few genes from one
parent (donor parent) that may be un-adapted or exotic to another parent (recipient
parent) that is an adapted cultivar in a given region. Backcross derived cultivars
possess the additional genes for resistances to diseases and pests that were lacking
in the parent (recipient) cultivar. Backcross breeding methodology is simple and
predictable and can be further hastened by the incorporation of off-season, green-
house nurseries or use of double haploids. However, this methodology of breeding
is not very successful in handling complex traits like yield; hence, breeders rarely
rely on this methodology alone. Backcross breeding method is used mainly to
improve parental lines or eliminate defects in useful genotypes.
6.2 Pedigree Selection
The pedigree selection method involves alternate parent–progeny evaluation start-
ing from early generations through to the advanced generations. Pedigree selection,
involving combination and transgressive breeding, is most often used by wheat
breeders in the development of superior cultivars. Selection for easily identifiable
characters with high heritability is effective in early generations while complex
traits like yield that have low heritabilites are selected in later generations. Shuttle
breeding using off-season nurseries and greenhouse facilities are utilized to fasten
the breeding process in most modern wheat breeding programs. Following the
pedigree method in the strict sense is slow, labor intensive, tedious, and requires
significant resources when dealing with large number of crosses and their proge-
nies. At North Dakota State University (NDSU), Fargo, the HRS wheat breeding
program handles large number of segregating populations in a combination of the
pedigree and bulk methods. Spikes of F2 plants are selected and grown as head rows
the following season. Selection for desired traits is done on a row basis from the F3
138 M. Mergoum et al.
to the F5 generations. Since the selected rows are harvested as bulks there is
sufficient seed to evaluate quality, adaptation, diseases, and yield earlier than
with the conventional pedigree method. Additionally, the pedigree method at
NDSU, Fargo, is combined with shuttle breeding using New Zealand and Arizona,
USA nurseries to speed up the selection process.
6.3 Bulk Selection
In traditional seed selection systems, natural selection was the key feature of
bulk selection that resulted in improvement, as surviving individuals tended to
be the fittest. However, in modern wheat breeding programs both natural and
artificial selection are performed in the bulk method also referred as selected-
bulk method. In bulk populations artificial selection may be performed for
disease and pest resistance, spike type, height, plant architecture, and awn
development. Often the bulk method is followed when stresses selected for are
absent or when dealing with crosses between different wheat types. Most wheat
breeders perform bulk selection on traits that are important but inconsistent in
occurrence like diseases or environmental stresses and if the genetic information
of the trait in consideration is not clearly understood. In these situations, bulk
populations are advanced until appropriate conditions occur for expression of the
traits and both natural and artificial selection favor the desired genotypes. At the
end of the bulking period, this is when a high degree of homozygosity is
achieved, individual plants are selected and their progenies are evaluated as in
the pedigree method.
6.4 Single Seed Descent
In the single seed descent (SSD) method of breeding the objective is to advance the
early generation rapidly with the expenditure of minimal resources. The SSD
method capitalizes on advancing two to three generations per year using green-
house/growth chamber and field/off season nurseries. Generally, SSD is used in
developing populations for genetic studies or just rapid advance of early generation
breeding material and in later stages the breeding material is evaluated as in the
pedigree selection method. However, modification of SSD involving single-spike
descent or single-hill descent methods are more commonly used. In these modifica-
tions wheat breeders are utilizing both the greenhouse and field facility and try
to hasten the breeding process. The single-spike descent method requires more
space and resources than SSD but gives breeder more accurate and reliable infor-
mation and helps ensure that progeny of each genotype will survive the selection
generation.
Spring Wheat Breeding 139
6.5 Recurrent Selection
Recurrent selection, more often used in cross-pollinated crops, is being adopted in
various wheat breeding programs with the long-term objective of developing
germplasm with a broad genetic base. Recurrent selection, which is a cyclic process
alternating between selection and hybridization, is also gaining more interest in
present day wheat breeding programs specially when dealing with complex traits.
Wheat breeders using recurrent selection do not make all possible inter-matings
among selected genotypes/parents of a given cycle. Additionally, they tend to delay
selection to advanced generations to get sufficient seed/homozygosity to accurately
evaluate breeding lines for the trait in consideration. In the HRS wheat breeding
program at NDSU, Fargo, one of the major challenges is to breed for FHB
resistance. The genetics of FHB resistance/tolerance is complex and disease assess-
ment is difficult. In this program the advance generation or double haploid breeding
material is evaluated and selected germplasm is re-hybridized in order to pyramid
the genes for FHB resistance. Good success, achieved at NDSU in tackling FHB is
attributed to the combined use of the pedigree method, double haploidy, and
recurrent selection breeding methods.
6.6 Double Haploidy
Haploid production followed by chromosome doubling results in the creation of
genetically pure lines (double haploids) within a short period of time. In most wheat
breeding programs, double haploid production is done by anther culture or wheat/
maize wide hybridization. Double haploidy enables wheat breeders to achieve
completely homozygous lines in one generation from early generation (F1 or F2)
breeding material. This procedure eliminates several generations of selfing
normally required before uniform lines can be evaluated in yield trials. Not only
does double haploidy fasten the breeding process, but it also saves resources/costs
required in the advancement and evaluation of segregating breeding material
through traditional breeding approaches. This is an important breeding procedure
that shortens the release of improved cultivars to 6–7 years as opposed to the
conventional 10–12 years. This technique, however, induces less genetic
variation than is generated by segregation and recombination in traditional breeding
methods.
6.7 Hybrid Wheat
Hybrid wheat production has been carried out mainly by private companies. These
private companies use either cytoplasmic male sterility (CMS) or chemical hybri-
dizing agents (CHA) for commercial hybrid production. The CMS hybrid produc-
140 M. Mergoum et al.
tion involves three different lines called the A-line, B-line, and R-line. The A-line is
the female parent and is male sterile due to gene(s) present in the cytoplasm. The R-
line or ‘‘Restorer line’’ is the male line and is used to cross-pollinate with the A-line
to produce hybrid seed. The R-line has one or more nuclear genes which can
override the male sterility trait of the A-line resulting in the production of fertile
hybrid seed. The B-line or ‘‘Maintainer line’’ possesses similar genetic make-up to
the A-line except it does not have the genes for male-sterility in the cytoplasm and
is used to maintain seed. The CHA hybrid production involves spray of chemicals,
prior to anthesis on the female parents which results in male sterility. Later the
male-sterile plants are pollinated by wind-borne pollen from untreated male-par-
ents. Seeds produced on the female parents which is harvested carefully and
marketed as hybrid seed.
Technical capabilities for controlled pollination continue to enhance resulting in
increasing the efficiency and number of hybrid wheat produced and evaluated. At
this stage there is limited hybrid wheat development and production worldwide.
Furthermore, there is relatively limited research and resources allocated to the
hybrid wheat so there is currently few ‘‘heterotic’’ groups identified. However, the
availability of CMS and CHA systems enhances the breeder’s ability to discover,
manipulate, exploit, and use genetic variability to develop superior hybrid wheat.
6.8 Mutation Breeding
Ionizing radiation (X-rays, gamma rays, and neutrons), ultraviolet light, and chemical
mutagens (ethyl methane sulfonate and diethyl sulfate) have been successfully used to
create mutations. Years of intensive efforts in mutation breeding, however, have
resulted in few successful accomplishments. Hence, mutation breeding is presently
mainly used to compliment other wheat breeding approaches. Evaluation of mutagen-
ized populations is performed in the M2 and M3 generations following the mutation
and subsequently the selected population is handled using traditional breeding
methods. The main traits for which useful mutations have been secured
include changes in morphology, physiology, reproductively, chemical composition,
and disease and more recently resistance to ‘‘Imazamox’’ (Imidazolinone)
herbicide.
6.9 Shuttle Breeding
Shuttle breeding, pioneered at CIMMYT, Mexico, was originally used to speed up
the breeding process by advancing and testing breeding material at contrasting
environments resulting into more than a single generation per year. Results reveal
higher success in shuttle breeding due to the exposure of the breeding material to
contrasting disease spectra, soil types, photoperiod length, and diverse environmen-
tal constraints. The success of shuttle breeding resulted in part in the ‘‘Green
Spring Wheat Breeding 141
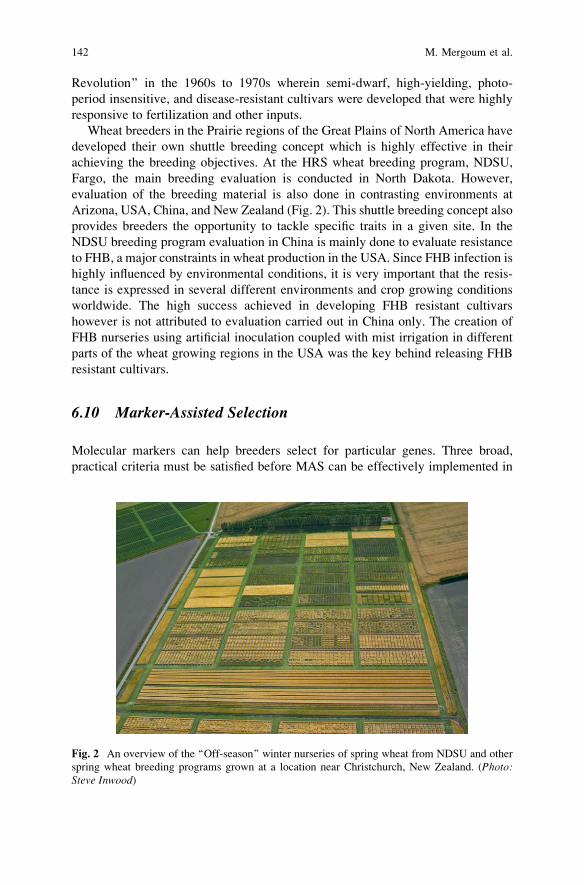
Revolution’’ in the 1960s to 1970s wherein semi-dwarf, high-yielding, photo-
period insensitive, and disease-resistant cultivars were developed that were highly
responsive to fertilization and other inputs.
Wheat breeders in the Prairie regions of the Great Plains of North America have
developed their own shuttle breeding concept which is highly effective in their
achieving the breeding objectives. At the HRS wheat breeding program, NDSU,
Fargo, the main breeding evaluation is conducted in North Dakota. However,
evaluation of the breeding material is also done in contrasting environments at
Arizona, USA, China, and New Zealand (Fig. 2). This shuttle breeding concept also
provides breeders the opportunity to tackle specific traits in a given site. In the
NDSU breeding program evaluation in China is mainly done to evaluate resistance
to FHB, a major constraints in wheat production in the USA. Since FHB infection is
highly influenced by environmental conditions, it is very important that the resis-
tance is expressed in several different environments and crop growing conditions
worldwide. The high success achieved in developing FHB resistant cultivars
however is not attributed to evaluation carried out in China only. The creation of
FHB nurseries using artificial inoculation coupled with mist irrigation in different
parts of the wheat growing regions in the USA was the key behind releasing FHB
resistant cultivars.
6.10 Marker-Assisted Selection
Molecular markers can help breeders select for particular genes. Three broad,
practical criteria must be satisfied before MAS can be effectively implemented in
Fig. 2 An overview of the ‘‘Off-season’’ winter nurseries of spring wheat from NDSU and other
spring wheat breeding programs grown at a location near Christchurch, New Zealand. (Photo:Steve Inwood)
142 M. Mergoum et al.
a breeding program: (i) efficiency/gain compared to phenotypic selection, (ii)
usefulness of markers in breeding-relevant populations, and (iii) the cost, through-
put, and expertise required. Markers for end-use quality (Gale, 2005) and disease
resistance (Liu and Anderson, 2003) are most likely to meet the first two criteria.
Inconsistent QTL effects across breeding populations are the main reason that there
are few examples of their use in MAS programs in wheat and other crops. Theoreti-
cal considerations aside, it should be noted that any MAS activity is competing
against or complimenting, and in most cases, not replacing a well-established
evaluation system based on phenotype. Most markers in use today are PCR-based
simple sequence repeats (SSR) or sequence-tagged-site (STS) markers. Backcross-
ing with markers and parental characterization for key genes are cost effective ways
of utilizing this technology. A recently completed USDA-funded project, MAS
wheat, utilized backcrossing with DNA markers to introgress 43 genes into 75
genetic backgrounds (Dubcovsky, 2004).
Efficient implementation of MAS demands the use of high-throughput equip-
ment and trained personnel. Although MAS is becoming a new capability in many
wheat breeding programs, its implementation is limited by the cost to support
trained personnel and purchase equipment and reagents. Establishment of the
USDA-ARS Regional Small Grains Genotyping Centers in the USA has dramati-
cally increased the capabilities of breeders to apply MAS by providing access to
high throughput DNA extraction and genotyping equipment. With such facilities,
MAS activities have expanded to include BC1, F2, and F3 populations. However,
only a fraction of genotypes potentially segregating for important genes can be
accommodated, even with this equipment and technology (Bonnett et al., 2005).
More efficient DNA extraction technologies and marker platforms [e.g. single
nucleotide polymorphisms (SNPs)] will allow more complete implementation of
MAS in wheat breeding programs in the future.
7 Major Breeding Achievements
To enhance production wheat cultivars need to be high yielding, resistant to biotic
and abiotic stresses, and possess high end-use quality. The main reason for the
Green Revolution in the 1960s was the development of wheat cultivars that were
semi-dwarf, lodging resistant, fertilizer responsive, high yielding with resistance to
major diseases and pests. The lodging resistance was attributed to the short stature
controlled by genes originating from the Japanese cultivar ‘‘Norin 10’’. Wheat
breeding is an ongoing process and there are several successes which include the
following:
7.1 Grain Yield
Wheat breeding has enabled dramatic increase in grain yield. The last 50 years saw
major success inwheatbreeding largelydue to theuseofshuttlebreeding (Fig.2), wide
Spring Wheat Breeding 143
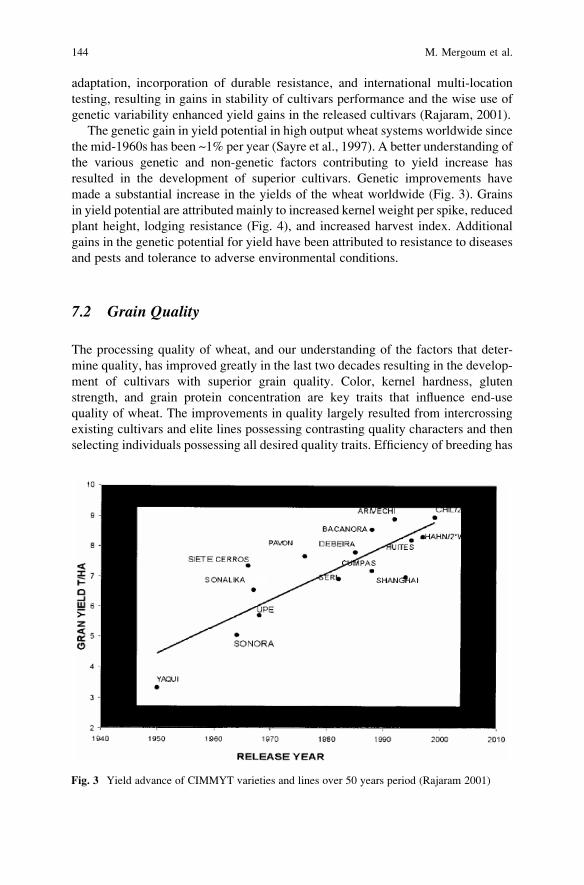
adaptation, incorporation of durable resistance, and international multi-location
testing, resulting in gains in stability of cultivars performance and the wise use of
genetic variability enhanced yield gains in the released cultivars (Rajaram, 2001).
The genetic gain in yield potential in high output wheat systems worldwide since
the mid-1960s has been ~1% per year (Sayre et al., 1997). A better understanding of
the various genetic and non-genetic factors contributing to yield increase has
resulted in the development of superior cultivars. Genetic improvements have
made a substantial increase in the yields of the wheat worldwide (Fig. 3). Grains
in yield potential are attributed mainly to increased kernel weight per spike, reduced
plant height, lodging resistance (Fig. 4), and increased harvest index. Additional
gains in the genetic potential for yield have been attributed to resistance to diseases
and pests and tolerance to adverse environmental conditions.
7.2 Grain Quality
The processing quality of wheat, and our understanding of the factors that deter-
mine quality, has improved greatly in the last two decades resulting in the develop-
ment of cultivars with superior grain quality. Color, kernel hardness, gluten
strength, and grain protein concentration are key traits that influence end-use
quality of wheat. The improvements in quality largely resulted from intercrossing
existing cultivars and elite lines possessing contrasting quality characters and then
selecting individuals possessing all desired quality traits. Efficiency of breeding has
Fig. 3 Yield advance of CIMMYT varieties and lines over 50 years period (Rajaram 2001)
144 M. Mergoum et al.
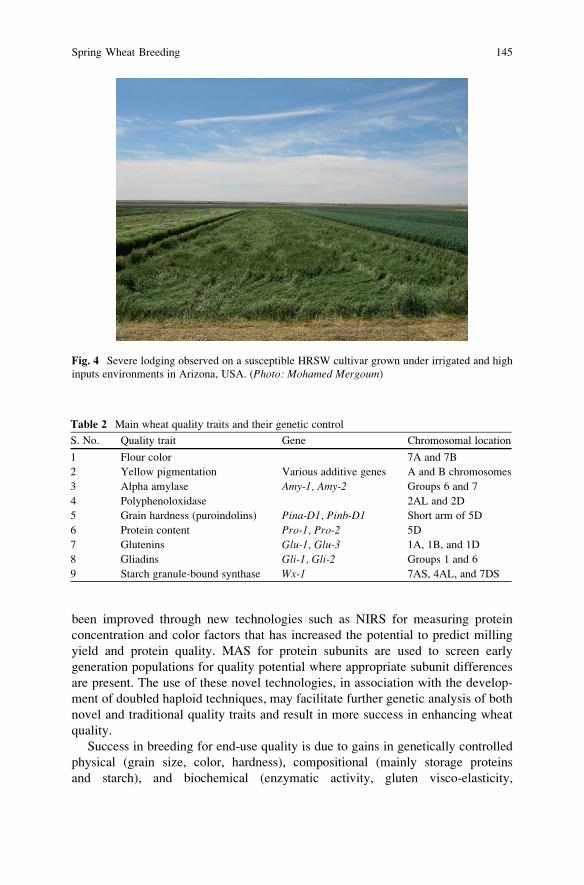
been improved through new technologies such as NIRS for measuring protein
concentration and color factors that has increased the potential to predict milling
yield and protein quality. MAS for protein subunits are used to screen early
generation populations for quality potential where appropriate subunit differences
are present. The use of these novel technologies, in association with the develop-
ment of doubled haploid techniques, may facilitate further genetic analysis of both
novel and traditional quality traits and result in more success in enhancing wheat
quality.
Success in breeding for end-use quality is due to gains in genetically controlled
physical (grain size, color, hardness), compositional (mainly storage proteins
and starch), and biochemical (enzymatic activity, gluten visco-elasticity,
Table 2 Main wheat quality traits and their genetic control
S. No. Quality trait Gene Chromosomal location
1 Flour color 7A and 7B
2 Yellow pigmentation Various additive genes A and B chromosomes
3 Alpha amylase Amy-1, Amy-2 Groups 6 and 7
4 Polyphenoloxidase 2AL and 2D
5 Grain hardness (puroindolins) Pina-D1, Pinb-D1 Short arm of 5D
6 Protein content Pro-1, Pro-2 5D
7 Glutenins Glu-1, Glu-3 1A, 1B, and 1D
8 Gliadins Gli-1, Gli-2 Groups 1 and 6
9 Starch granule-bound synthase Wx-1 7AS, 4AL, and 7DS
Fig. 4 Severe lodging observed on a susceptible HRSW cultivar grown under irrigated and high
inputs environments in Arizona, USA. (Photo: Mohamed Mergoum)
Spring Wheat Breeding 145
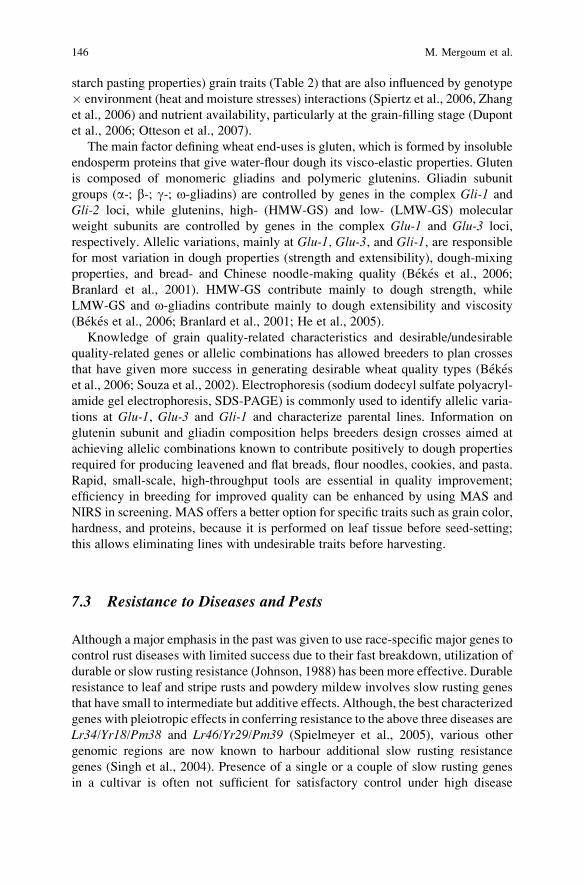
starch pasting properties) grain traits (Table 2) that are also influenced by genotype
� environment (heat and moisture stresses) interactions (Spiertz et al., 2006, Zhang
et al., 2006) and nutrient availability, particularly at the grain-filling stage (Dupont
et al., 2006; Otteson et al., 2007).
The main factor defining wheat end-uses is gluten, which is formed by insoluble
endosperm proteins that give water-flour dough its visco-elastic properties. Gluten
is composed of monomeric gliadins and polymeric glutenins. Gliadin subunit
groups (a-; b-; g-; o-gliadins) are controlled by genes in the complex Gli-1 and
Gli-2 loci, while glutenins, high- (HMW-GS) and low- (LMW-GS) molecular
weight subunits are controlled by genes in the complex Glu-1 and Glu-3 loci,
respectively. Allelic variations, mainly at Glu-1, Glu-3, and Gli-1, are responsiblefor most variation in dough properties (strength and extensibility), dough-mixing
properties, and bread- and Chinese noodle-making quality (Bekes et al., 2006;
Branlard et al., 2001). HMW-GS contribute mainly to dough strength, while
LMW-GS and o-gliadins contribute mainly to dough extensibility and viscosity
(Bekes et al., 2006; Branlard et al., 2001; He et al., 2005).
Knowledge of grain quality-related characteristics and desirable/undesirable
quality-related genes or allelic combinations has allowed breeders to plan crosses
that have given more success in generating desirable wheat quality types (Bekes
et al., 2006; Souza et al., 2002). Electrophoresis (sodium dodecyl sulfate polyacryl-
amide gel electrophoresis, SDS-PAGE) is commonly used to identify allelic varia-
tions at Glu-1, Glu-3 and Gli-1 and characterize parental lines. Information on
glutenin subunit and gliadin composition helps breeders design crosses aimed at
achieving allelic combinations known to contribute positively to dough properties
required for producing leavened and flat breads, flour noodles, cookies, and pasta.
Rapid, small-scale, high-throughput tools are essential in quality improvement;
efficiency in breeding for improved quality can be enhanced by using MAS and
NIRS in screening. MAS offers a better option for specific traits such as grain color,
hardness, and proteins, because it is performed on leaf tissue before seed-setting;
this allows eliminating lines with undesirable traits before harvesting.
7.3 Resistance to Diseases and Pests
Although a major emphasis in the past was given to use race-specific major genes to
control rust diseases with limited success due to their fast breakdown, utilization of
durable or slow rusting resistance (Johnson, 1988) has been more effective. Durable
resistance to leaf and stripe rusts and powdery mildew involves slow rusting genes
that have small to intermediate but additive effects. Although, the best characterized
genes with pleiotropic effects in conferring resistance to the above three diseases are
Lr34/Yr18/Pm38 and Lr46/Yr29/Pm39 (Spielmeyer et al., 2005), various other
genomic regions are now known to harbour additional slow rusting resistance
genes (Singh et al., 2004). Presence of a single or a couple of slow rusting genes
in a cultivar is often not sufficient for satisfactory control under high disease
146 M. Mergoum et al.
pressure. However, cultivars with ‘‘near immune’’ levels of resistance were
developed by combining three to five slow rusting genes (Lillemo et al., 2005).
Slow-rusting genes based resistance to leaf and stripe rusts is common in modern,
high-yielding spring wheat germplasm originating from CIMMYT (Singh et al.,
2007) and is used in further wheat improvement.
Stem rust, historically known to cause severe losses to wheat production, has
been controlled effectively through the use of genetic resistance in semi-dwarf
cultivars. Resistance gene Sr31, located on wheat-rye 1B/1R translocation contrib-
uted to a high level of resistance in several wheat cultivars developed worldwide in
recent years. Consequently stem rust disease is often not considered important in
wheat breeding in many countries. However, detection of Puccinia graminis triticirace Ug99 in 1999 in Uganda with its broad virulence, including the virulence for
Sr31, its migration to Kenya, Ethiopia and its detection in 2006 in Yemen and
Sudan, and evolution of its variant with virulence to resistance gene Sr24 were
recognized as highly significant events (Singh et al., 2006b). One of the major
challenge to wheat breeding is identifying or developing and diffusing adapted
resistant cultivars effective against Ug99 race. Sources of durable resistance to
Ug99, including some modern wheats have been identified (Singh et al., 2006b) in
combination with additional resistance genes, mostly of alien origin, can provide
effective control. If race-specific genes are used, they must be deployed in combi-
nation to enhance their longevity and MAS will prove to be very useful for success.
The Yangtze river basin of China with about 7 million ha has traditionally been
known to be highly prone to the FHB or scab epidemics. FHB disease incidences
leading to epidemics are now frequent in North America, Europe, and South
America. In addition to crop losses, the fungus also produces mycotoxins, such as
deoxynivalenol (DON) that accumulates in the grain and renders grain unsuitable
for human and livestock consumption (Fig. 1). Although several genomic regions
are now known to contribute quantitative resistance (Buerstmayr et al., 2002;
Anderson et al., 2001), a gene from a Chinese cultivar, ‘‘Sumai 3’’, in the short
arm of chromosome 3B has shown the largest and consistent effect in reducing
disease severity and mycotoxin accumulation (Anderson et al., 2001). At NDSU,
Fargo, the cultivar ‘‘Alsen’’ was released in 2000 and it possesses the 3BS resis-
tance gene (Mergoum et al., 2005b). Subsequently ‘‘Steele-ND’’ and ‘‘Howard’’,
released in 2004, possesses the resistance to FHB derived from wheat relative
Triticum dicoccoides (Mergoum et al., 2005a, 2006a). The latest and the most
effective FHB resistant cultivar, ‘‘Glenn’’, was released in 2005 and possesses
resistance of both Sumai 3 and Triticum dicoccoides (Mergoum et al., 2006b).
However, the Sumai 3 source of resistance to FHB was reported to possess grain
shattering (Zhang and Mergoum, 2007a,b), an undesirable trait for modern wheat
cultivars (Fig. 5). In the recent cultivar, ‘‘Glenn’’, this linkage is broken and Glenn
is reported to be both FHB and shattering resistant (Mergoum et al., 2006b).
Further progress in enhancing the level of FHB resistance beyond the current
level can come from a breeding strategy that would favor the accumulation of
multiple major and minor genes from various sources into a single genotype. This is
being attempted at the NDSU, HRS wheat breeding program by combining the
Spring Wheat Breeding 147
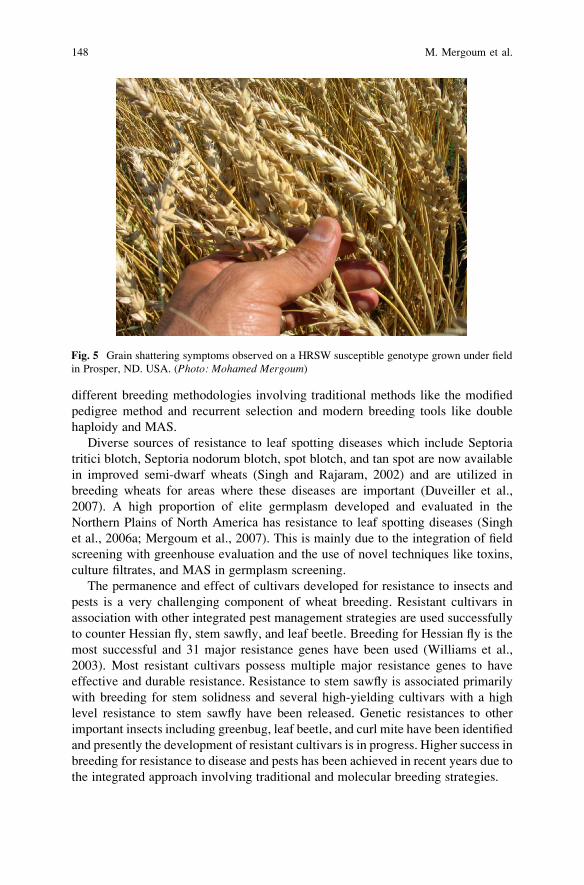
different breeding methodologies involving traditional methods like the modified
pedigree method and recurrent selection and modern breeding tools like double
haploidy and MAS.
Diverse sources of resistance to leaf spotting diseases which include Septoria
tritici blotch, Septoria nodorum blotch, spot blotch, and tan spot are now available
in improved semi-dwarf wheats (Singh and Rajaram, 2002) and are utilized in
breeding wheats for areas where these diseases are important (Duveiller et al.,
2007). A high proportion of elite germplasm developed and evaluated in the
Northern Plains of North America has resistance to leaf spotting diseases (Singh
et al., 2006a; Mergoum et al., 2007). This is mainly due to the integration of field
screening with greenhouse evaluation and the use of novel techniques like toxins,
culture filtrates, and MAS in germplasm screening.
The permanence and effect of cultivars developed for resistance to insects and
pests is a very challenging component of wheat breeding. Resistant cultivars in
association with other integrated pest management strategies are used successfully
to counter Hessian fly, stem sawfly, and leaf beetle. Breeding for Hessian fly is the
most successful and 31 major resistance genes have been used (Williams et al.,
2003). Most resistant cultivars possess multiple major resistance genes to have
effective and durable resistance. Resistance to stem sawfly is associated primarily
with breeding for stem solidness and several high-yielding cultivars with a high
level resistance to stem sawfly have been released. Genetic resistances to other
important insects including greenbug, leaf beetle, and curl mite have been identified
and presently the development of resistant cultivars is in progress. Higher success in
breeding for resistance to disease and pests has been achieved in recent years due to
the integrated approach involving traditional and molecular breeding strategies.
Fig. 5 Grain shattering symptoms observed on a HRSW susceptible genotype grown under field
in Prosper, ND. USA. (Photo: Mohamed Mergoum)
148 M. Mergoum et al.
7.4 Tolerance to Abiotic Stresses
Direct and indirect selection approaches, in recent years, have resulted in significant
success in developing cultivars effective against abiotic stresses. Drought regularly
limits wheat production in almost 50% of the wheat cropped area (Pfeiffer et al.,
2005). Wheat breeders have successfully developed cultivars better adapted to
moisture stress conditions resulting in 0.4–1.3% grain yield increase per annum
in many drier wheat producing areas (Byerlee and Traxler, 1995). Major success
achieved in wheat production under drought is due to the development of superior
cultivars and their production under improved agronomic practices. Different
breeding strategies including better understanding of genotype � environment
interactions to make reliable selection, development of reliable and repeatable
drought screening methods, and exploiting physiological basis of drought resis-
tance have contributed to the success. The identification of molecular markers
associated in drought resistance and their use in MAS in breeding programs may
improve selection for abiotic stress resistance in the future.
Considerable success has been achieved in breeding for lodging resistance by
developing semi-dwarf cultivars, resulting partly in the Green Revolution. The
improved lodging resistance conferred by reducing culm length and increasing
harvest index has further allowed exploitation of yield promoting factors like
response to irrigation and fertilization.
In recent years major emphasis, with considerable success, has been put on
breeding for pre-harvest sprouting resistance especially in white wheat, a trait that
is believed to be linked to sprouting. Genetic control of resistance to pre-harvest
sprouting has been identified and used in cultivar development with success.
Although pre-harvest sprouting is environmentally sensitive, selection for high
dormancy, desired plant morphology, and reduced rate of water uptake by spikes
have resulted in the development of resistant cultivars. Additionally, the selection
of genotypes with reduced levels of a-amylase activity in the grain obtained
through laboratory testing and MAS for pre-harvest sprouting have significantly
contributed to the development of resistant cultivars.
Considerable success has been obtained in selecting wheat tolerant to acidic soils
and aluminum toxicity as laboratory tests, MAS, and selection in fields can be
performed. However, limited success has been made in developing genotypes
tolerant to heat, flooding, salt and alkaline soils and wheat breeders are looking
for new avenues to address these challenges.
8 Integration of Novel Technologies in Breeding Programs
The past 15 years have witnessed substantial progress in the development and
advancement of numerous genomics tools in wheat including mapping, sequencing,
expressed sequence tags (ESTs), large insert libraries, gene cloning, bioinformatics,
Spring Wheat Breeding 149
and analysis of gene expression. These technologies have contributed to our
understanding of the wheat genome and its genetic improvement. Compared to
other major crop plants, genomic analysis of wheat is more difficult because it is
polyploid and has a relatively large genome (Arumuganathan and Earle, 1991),
more than 6 and 30 times larger than maize and rice, respectively. This is due to
large amounts of repetitive DNA (~90%). Genetic mapping is further hampered by
low levels of polymorphism (Anderson et al., 1993).
Genetic and physical maps are the foundation for genomics studies. The genetic
maps of wheat are well-populated with microsatellite markers that are useful for
MAS by breeders and anchoring other types of markers (Somers et al., 2004).
Physical maps have been constructed based on deletion lines (Endo and Gill, 1996)
that take advantage of wheat’s ability to tolerate the absence of chromosomal
segments due to compensation by homoeologues. BAC libraries have been pro-
duced for several Triticum species (see http://agronomy.ucdavis.edu/Dubcovsky/
BAC-library/ITMIbac/ITMIBAC.htm). These libraries are essential tools for phys-
ical mapping and also facilitate sequencing and map-based cloning efforts.
Agronomicaly important genes have been cloned in wheat, including the cereal
cyst nematode resistance gene, Cre3 (Lagudah et al., 1997); semi-dwarfing gene
Rht-B1 (syn. Rht1) (Peng et al., 1999); leaf rust resistance genes Lr10 (Feuillet
et al., 2003) and Lr21 (Huang et al., 2003); the vernalization genes Vrn1 (Yan et al.,2003), Vrn2 (Yan et al., 2004), and Vrn3 (Yan et al., 2006); aluminum tolerance
gene ALMT1 (Sasaki et al., 2004); powdery mildew resistance gene Pm3(Srichumpa et al., 2005); and the domestication gene Q (Simons et al., 2006).
Because of its large amounts of repetitive DNA, sequencing the entire wheat
genome using existing technology is not practical. However, there is increasing
evidence that the gene space of wheat is concentrated (Yan et al., 2003) and this
should facilitate future sequencing strategies that focus on gene-rich regions.
Although estimates of base pairs per cM, one estimate of gene density, vary
dramatically in wheat depending upon the chromosomal location, it is encourag-
ing that the maximum gene density is similar to that observed in Arabidopsis andrice. Most of the publicly available wheat sequence data are ESTs [more than
800,000 as of this writing (http://www.ncbi.nlm.nih.gov/dbEST/dbESTsummary.
html)]. In addition to being potential markers and landmarks, ESTs serve as
important connecting points among species. For example, a wheat EST may have
sequence homology with other organisms in which the function of the
corresponding gene has been determined, thus leading to the prediction of function
for the wheat homolog.
The synteny of cultivated wheat with its diploid relatives and partial synteny
with other grasses, including rice, greatly facilitates genomics activities related to
gene discovery (Devos, 2005). At the very least, the synteny with rice can be
exploited as a means of providing markers to more fully saturate the syntenous
region in wheat (Liu and Anderson, 2003). If a trait or biochemical pathway exists
in both rice and wheat, rice may serve as the source or intermediary to find the
homologous gene in wheat. However, many important targets for selection (e.g.
bread-making properties and resistance to several important diseases) will be
150 M. Mergoum et al.
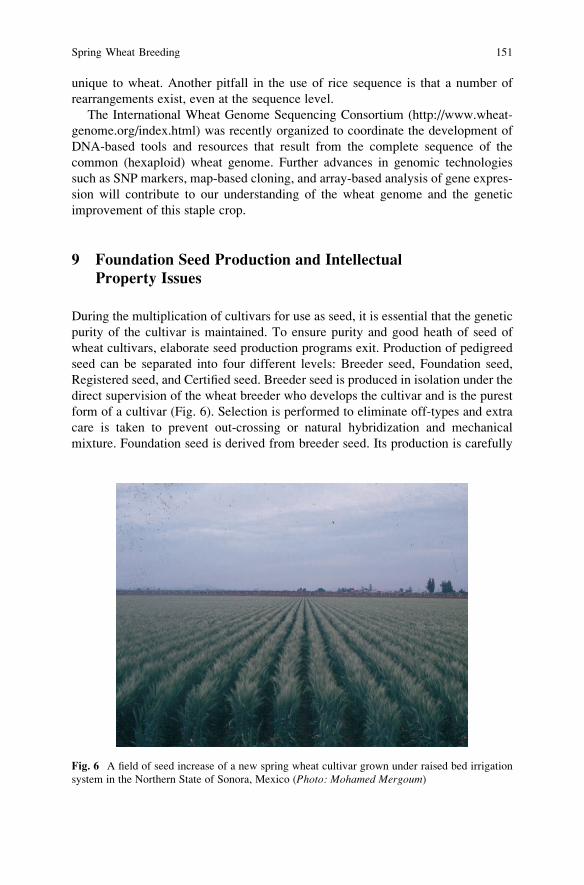
unique to wheat. Another pitfall in the use of rice sequence is that a number of
rearrangements exist, even at the sequence level.
The International Wheat Genome Sequencing Consortium (http://www.wheat-
genome.org/index.html) was recently organized to coordinate the development of
DNA-based tools and resources that result from the complete sequence of the
common (hexaploid) wheat genome. Further advances in genomic technologies
such as SNP markers, map-based cloning, and array-based analysis of gene expres-
sion will contribute to our understanding of the wheat genome and the genetic
improvement of this staple crop.
9 Foundation Seed Production and Intellectual
Property Issues
During the multiplication of cultivars for use as seed, it is essential that the genetic
purity of the cultivar is maintained. To ensure purity and good heath of seed of
wheat cultivars, elaborate seed production programs exit. Production of pedigreed
seed can be separated into four different levels: Breeder seed, Foundation seed,
Registered seed, and Certified seed. Breeder seed is produced in isolation under the
direct supervision of the wheat breeder who develops the cultivar and is the purest
form of a cultivar (Fig. 6). Selection is performed to eliminate off-types and extra
care is taken to prevent out-crossing or natural hybridization and mechanical
mixture. Foundation seed is derived from breeder seed. Its production is carefully
Fig. 6 A field of seed increase of a new spring wheat cultivar grown under raised bed irrigation
system in the Northern State of Sonora, Mexico (Photo: Mohamed Mergoum)
Spring Wheat Breeding 151
supervised or approved by seed producers of the parent seed agency. This agency is
generally an agricultural experiment station or a state foundation seed program with
trained experts to handle seed production. Foundation seed is produced in the area
of adaptation of the concerned cultivar and has to be certified by a seed certifying
agency for purity and other characteristics. Registered seed is derived from foun-
dation seed and is produced under the supervision of a seed certifying agency.
Production of registered seed is under control of a registered seed producer.
Registered seed is planted by seed growers to produce the certified seed. To be
certified, seed must meet the prescribed requirements regarding purity and quality
and certified seed is available to general distribution to farmers for commercial
commodity production.
Plant Variety Protection (PVP) and plant breeder’s rights (PBR) are the rights
granted by the government to a plant breeder, originator, or owner of a cultivar to
exclude others from producing or commercializing the seed of a cultivar for a
minimum period. To qualify for PBR protection, the cultivar has to be novel,
distinct from existing cultivars, and uniform and stable in its essential character-
istics. The PVP/PBR protects the released cultivars but not the genetic compo-
nents and the breeding procedures used in the development of the cultivar. Wheat
breeders strive to develop cultivars with novel traits which can be patented for
these novel traits. The PBR protections are generally valid for 20–25 years;
however, there is no restriction on the use of these cultivars as genetic material
in the development of future cultivars. One drawback of PVP and patents is that it
limits sharing of germplasm and the use of cultivars with novel traits may be
restricted.
10 Future Prospects
Globally by the year 2020 one billion metric tons of wheat will be required
compared to the current production of nearly 626 million metric tons (Rajaram,
2001). This challenging projection for wheat needs by 2020 can be achieved
provided there is continuous support and investment in agricultural research and
development, especially in conventional wheat breeding, integrated pest manage-
ment, improved seed multiplication and distribution systems, and optimum and
efficient use of inputs. Future wheat breeding will need to focus on redesigning the
wheat plant, discovery and assembly of hybrid vigor, efficient management of
water and drought, genetically superior systems of uptake and translocation of
nutrients, suitable germplasm adapted to conservation tillage practices, durable
and multiple disease resistance that would ensure superior germplasm for future
cultivars with high and stable yield potential available for commercial production
(Rajaram, 2001). Additionally, both traditional plant breeding in association with
modern plant breeding techniques like double haploid and MAS need to be
integrated to have a successful and productive wheat breeding program.
152 M. Mergoum et al.
References
Anderson, J.A., Churchill G.A., Autrique J.E., Tanksley S.D. and Sorrells M.E. (1993). Optimiz-
ing parental selection for genetic linkage maps. Genome 36, 181–186.
Anderson, J.A., Stack R.W., Liu S., Waldron B.L., Fjeld A.D., Coyne C., Moreno-Sevilla B.,
Mitchell F.J., Song Q.J., Cregan P.B. and Frohberg R.C. (2001). DNA markers for Fusarium
head blight resistance QTLs in two wheat populations. Theor. Appl. Genet. 102, 1164–1168.
Arbelbide, M. and Bernardo R. (2006). Mixed-model QTL mapping for kernel hardness and dough
strength in bread wheat. Theor. Appl. Genet. 112, 885–890.
Arumuganathan, K. and Earle E.D. (1991). Nuclear DNA content of some important plant species.
Plant Mol. Biol. Rep. 9, 208–218.
Bekes, F., Kemeny S. and Morell M. (2006). An integrated approach to predicting end-product
quality of wheat. Eur. J. Agron. 25, 155–162.
Bergthaller, W.J. (1997). New uses of wheat gluten and non-starch wheat components. In: J.L.
Steele and O.K. Chung (eds.). Proceedings of the First International Wheat Quality Confer-
ence. Grain Industry Alliance, Kansas, USA. pp. 285–301.
Bonnett, D.G., Rebetzke G.J. and Spielmeyer W. (2005). Strategies for efficient implementation of
molecular markers in wheat breeding. Mol. Breed. 15, 75–85.
Branlard, G., Dardevet M., Saccomano R., Lagoutte F. and Gourdon J. (2001). Genetic diversity of
wheat storage proteins and bread wheat quality. In: Z. Bedo and L. Lang (eds.). Wheat in a
Global Environment. Kluger Academic Publishers, The Netherlands. pp. 157–169.
Buerstmayr, H., Lemmens M., Hartl L., Doldi L., Steiner B., Stierschneider M. and Ruckenbauer
P. (2002). Molecular mapping of QTLs for Fusarium head blight resistance in spring wheat. I.
Resistance to fungal spread (type II resistance). Theor. Appl. Genet. 104, 84–91.
Byerlee, D. and Traxler G. (1995). National and international wheat improvement research in the
post green revolution period. Evolution and impacts. Am. J. Agric. Econ. 77, 268–278.
Culshaw, D. (1997). Straw as fuel. In: G.M. Campbell, C. Webb and S.L. McKee (eds.). Cereals,
Novel Uses, and Processes. Plenum Press, New York, pp. 153–158.
Devos, K.M. (2005). Updating the ‘Crop circle. Curr. Opin. Plant Biol. 8, 155–162.
Dubcovsky, J. (2004). Marker assisted selection in public breeding programs: The wheat experi-
ence. Crop Sci. 44, 1895–1898.
Dupont, F.M., Hurkman W.J., Vensel W.H., Tanaka C., Kothari K.M., Chung O.K. and Altenbach
S.B. (2006). Protein accumulation and composition in wheat grains: Effects of mineral
nutrients and high temperature. Eur. J. Agron. 25, 96–107.
Duveiller, E., Singh R.P. and Nicol J.M. (2007). The challenges of maintaining wheat productivi-
ty: Pests, diseases, and potential epidemics. Euphytica 157, 417–450.
Dvorak, J. (1998). Genome analysis in the Triticum-Aegilops alliance, In: A.E. Slinkard (eds.),
Proceedings of the 9th International Wheat Genetics Symposium, Vol. 1, Saskatoon, Saskatch-
ewan, Canada, University Extension Press, University of Saskatchewan, Saskatoon, Saskatch-
ewan. pp. 8–11.
Endo, T.R. and Gill B.S. (1996). The deletion stocks of common wheat. J. Hered. 87, 295–307.
Faridi, H. (1988). Flat breads. In: Y. Pomeranz (ed.). Wheat Chemistry and Technology. American
Association of Cereal Chemists, St. Paul, MN. pp 457–506.
Feuillet, C., Travella S., Stein N., Albar L. and Keller B. (2003). Map-based isolation of the leaf
rust disease resistance gene Lr10 from the hexaploid wheat (Triticum aestivum L.) genome.
Proc. Natl. Acad. Sci. USA 100, 15253–15258.
Gale, K.R. (2005). Diagnostic DNA markers for quality traits in wheat. J. Cereal Sci. 41, 181–192.
Gill, B.S., Appels R., Botha-Oberholster A.M., Buell C.R., Bennetzen J.L., Chalhoub B., Chumley
F., Dvorak J., Iwanaga M., Keller B., Li W., McCombie W.R., Ogihara Y., Quetier F. and
Sasaki T. (2004). A workshop report on wheat genome sequencing: International Genome
Research on Wheat Consortium. Genetics 168, 1087–1096.
Spring Wheat Breeding 153
He, Z.H., Liu A.H., Pena R.J. and Rajaram S. (2003). Suitability of Chinese wheat cultivars for
production of northern style Chinese steamed bread. Euphytica 131, 155–163.
He, Z.H., Liu L., Xia X.C., Liu J.J. and Pena R.J. (2005). Composition of HMW and LMW
glutenin subunits and their effects on dough properties, pan bread, and noodle quality of
Chinese bread wheats. Cereal Chem. 82, 345–350.
Huang, L., Brooks S.A., Li W., Fellers J.P., Trick H.N. and Gill B.S. (2003). Map-based cloning of
leaf rust resistance gene Lr21 from the large and polyploidy genome of bread wheat. Genetics
164, 655–664.
Janda, J., Bartos J., Safar J., Kubalakova M., Valarik M., Cıhalıkova J., Simkova H., Caboche M.,
Sourdille P., Bernard M., Chalhoub B. and Dolezel J. (2004). Construction of a subgenomic
BAC library specific for chromosomes 1D, 4D, and 6D of hexaploid wheat. Theor. Appl.
Genet. 109, 1337–1345.
Johnson, R. (1988). Durable resistance to yellow (stripe) rust in wheat and its implications in plant
breeding. In: N.W. Simmonds and S. Rajaram (eds.). Breeding strategies for resistance to the
rusts of wheat, CIMMYT, Mexico. pp. 63–75.
Kahlon, T.S. (1989). Nutritional implications and uses of wheat and oat kernel oil. Cereal Foods
World 34, 872–875.
Lagudah, E.S., Moullet O. and Appels R. (1997). Map-based cloning of a gene sequence encoding
a nucleotide binding domain and a leucine-rich region at the Cre3 nematode resistance locus of
wheat. Genome 40, 659–665.
Li, W., Zhang P., Fellers J.P., Friebe B. and Gill B.S (2004). Sequence composition, organization
and evolution of the core Triticeae genome. Plant J. 40, 500–511.
Lillemo, M., Chen X.M., He Z.H. and Singh R.P. (2005). Leaf rust resistance gene Lr34 is
involved in powdery mildew resistance of CIMMYT bread wheat line Saar. In: H.T. Buck,
J.E. Nisi and N. Solomon (eds.). Wheat Production in Stressed Environments. Mar del Plata,
Argentina. pp. 17.
Liu, J.J., He Z.H., Zhao Z.D., Pena R.J. and Rajaram S. (2003). Wheat quality traits and quality
parameters of cooked dry white Chinese noodles. Euphytica 131, 147–154.
Liu, S. and Anderson J.A. (2003). Marker assisted evaluation of Fusarium head blight resistant
wheat germplasm. Crop Sci. 43, 760–766.
Maningat, C.C. and Seib P.A. (1997). Update on wheat starch and its uses. In: J.L. Steele and O.K.
Chung (eds.). Proceedings of the First International Wheat Quality Conference. Grain Industry
Alliance, Kansas, USA. pp. 261–284.
McKee, D. (2006). Focus on Thailand. World Grain 24(8), 16–20.
Mergoum, M., Frohberg R.C., Miller J.D. and Stack R.W. (2005a). Registration of ‘Steele-ND’
wheat. Crop Sci. 45, 1163–1164.
Mergoum, M., Frohberg R.C. and Stack R.W. (2005b). Breeding hard red spring wheat for
Fusarium head blight resistance: Successes and challenges. In: H.T. Buck, J.E. Nisi and
N. Solomon (eds.). Wheat Production in Stressed Environments. Mar del Plata, Argentina.
pp. 161–167.
Mergoum, M., Frohberg R.C., Olson, T., Friesen T.L., Rasmussen J.B. and Stack R.W. (2006a).
Registration of ‘Howard’ wheat. Crop Sci. 46, 2702–2703.
Mergoum, M., Frohberg R.C., Olson T., Friesen T.L., Rasmussen J.B. and Stack R.W. (2006b).
Registration of ‘Glenn’ wheat. Crop Sci. 46, 473–474.
Mergoum, M., Singh P.K., Ali S., Elias E.M., Anderson J.A., Glover K.D. and Adhikari T.B.
(2007). Reaction of elite wheat genotypes from the northern Great Plains of North America to
Septoria diseases. Plant Dis. 91, 1310–1315.
Mujeeb-Kazi, A. and Rajaram S. (2002). Transferring alien genes from related species and genera
for wheat improvement. Bread Wheat: Improvement and Production. In: B.C. Curtis, S.
Rajaram and H. Gomez Macpherson (eds.). FAO Plant Production and Protection Series No
30. Food and Agriculture Organization of United Nations, Rome.
Otteson, B.N., MergoumM. and Ransom J.K. (2007). Response of spring wheat to varying seeding
rate and nitrogen management. Agron. J. (in press: A07–0002).
154 M. Mergoum et al.
Palazzolo, G. (2003). Cereal bars: they’re not just for breakfast anymore. Cereal Foods World 48,
70–72.
Pena, R.J. and Pfeiffer W.H. (2005). Breeding methodologies and strategies for durum wheat
quality improvement. In: C. Royo, M.N. Nachit, N. Di Fonzo, J.L. Araus, W.H. Pfeiffer and
G.A. Slafer (eds.). Durum Wheat Breeding: Current Approaches and Future Strategies. FoodProduct Press. The Haworth Press Inc., New York. pp. 663–772.
Pena, R.J., Trethowan R.M., Pfeiffer W.H. and van Ginkel M. (2002). Quality (end-use) improve-
ment in wheat. Compositional, genetic, and environmental factors. In: A.S. Basra and L.S.
Randhawa (eds.). Quality Improvement in Field Crops. Food Product Press, Haworth Press,
Inc., New York. pp. 1–37.
Peng, J.R., Richards D.E., Hartley N.M., Murphy G.P., Devos K.M., Flintham J.E., Beales J., Fish
L.J., Worland A.J., Pelica F., Sudhakar D., Christou P., Snape J.W., Gale M.D. and Harberd
N.P. (1999). ‘Green revolution’ genes encode mutant gibberellin response modulators. Nature
400, 256–261.
Pfeiffer, W.H, Trethowan R.M., van Ginkel M., Ortiz M.I. and Rajaram S. (2005). Breeding for
abiotic stress tolerance in wheat. In: M. Ashraf and P.J.C. Harris (eds.). Abiotic Stresses: Plant
Resistance through Breeding and Molecular Approaches. The Haworth Press, Inc. NY.
pp. 401–489.
Popineau, Y., Huchet B., Larre C. and Berot S. (2002). Foaming and emulsifying properties of
fractions of gluten peptides obtained by limited enzymatic hydrolysis and ultrafiltration. J.
Cereal Sci. 35, 327–335.
Prior, D. (1997). The cradle of civilization: A snapshot of the flour milling industry Feed & Grain,
October 1997, pp. 15–17.
Rajaram, S. (2001). Prospects and promise of wheat breeding in the 21st century. Euphytica 119,
3–15.
Ransom, J.K., Endres G.J. and Schatz B.G. (2007). Sustainable improvement of wheat yield
potential: The role of crop management. J. Agric. Sci. 14, 55–61.
Riley, R. and Chapman V. (1958). Genetic control of the cytological diploid behavior of hexaploid
wheat. Nature 182, 713–715.
Safar, J., Bartos J., Janda J., Bellec A., Kubalakova M., Valarik M., Pateyron, S., Weiserova J.,
Tuskova J., Cıhalıkova J., Vrana J., Simkova H., Faivre-Rampant P., Sourdille P., Caboche M.,
Bernard M., Dolezel J. and Chalhoub B. (2004). Dissecting large and complex genomes: flow
sorting and BAC cloning of individual chromosome from bread wheat. Plant J. 39, 960–968.
Sasaki, T., Yamamoto Y., Ezaki B., Katsuhara M, Ahn S.J., Ryan P.R., Delhaize E. and Matsu-
moto H. (2004). A wheat gene encoding an aluminum activated malate transporter. Plant J. 37,
645–653.
Sayre, K.D., Rajaram S. and Fisher R.A. (1997). Yield potential progress in short bread wheat in
the northwest Mexico. Crop Sci. 37, 36–42.
Sears, E.R. (1954). The aneuploids of common wheat. Mol. Agr. Exp. Sta. Res. Bull. 572, 1–59.
Sears, E.R. (1966). Nullisomic-tetrasomic combinations in hexaploid wheat. In: R. Riley and
K.R. Lewis (eds.). Chromosome Manipulation and Plant Genetics. Oliver & Boyd, Edinburgh.
pp. 29–45.
Simons, K.J., Fellers J.P., Trick H.N., Zhang Z., Tai Y.S., Gill B.S. and Faris J.D. (2006).
Molecular characterization of the major wheat domestication gene Q. Genetics 172, 547–555.Singh, P.K., Mergoum M., Ali S., Adhikari T.B., Elias E.M., Anderson J.A., Glover K.D. and
Berzonsky W.A. (2006a). Evaluation of elite wheat germplasm for resistance to tan spot. Plant
Dis. 90, 1320–1325.
Singh, R.P., Hodson D.P., Jin Y., Huerta-Espino J., Kinyua M.G., Wanyera R., Njau P. and Ward
R.W. (2006b). Current status, likely migration and strategies to mitigate the threat to wheat
production from race Ug99 (TTKS) of stem rust pathogen. CAB Reviews: Perspectives in
Agriculture, Veterinary Science, Nutrition and Natural Resources 1 (No. 054), 13pp.
Singh, R.P., Huerta-Espino J., Sharma R., Joshi A.K. and Trethowan R.M. (2007). High yielding
spring bread wheat germplasm for irrigated agro-ecosystems. Euphytica 157, 351–363.
Spring Wheat Breeding 155
Singh, R.P. and Rajaram S. (2002). Breeding for disease resistance in wheat. In: B.C. Curtis,
S. Rajaram and H. Gomez Macpherson (eds.). Bread Wheat Improvement and Production.
FAO, Rome. pp. 141–156.
Singh, R.P., William H.M., Huerta-Espino J. and Rosewarne G. (2004). Wheat Rust in Asia:
Meeting the Challenges with Old and New Technologies. New directions for a diverse planet:
Proceedings of the 4th International Crop Science Congress Brisbane, Australia, 26 Sep–1 Oct
2004 | ISBN 1 920842 20 9 | www.cropscience.org.au
Srichumpa, P., Brunner S., Keller B. and Yahiaoui N. (2005). Allelic series of four powderymildew
resistance genes at the Pm3 locus in hexaploid bread wheat. Plant Physiol. 139, 885–895.
Somers, D.J., Isaac P. and Edwards K. (2004). A high-density microsatellite consensus map for
bread wheat (Triticum aestivum L.). Theor. Appl. Genet. 109, 1105–1114.
Souza, E.J., Graybosch R.A. and Guttieri M.J. (2002). Breeding wheat for improved milling and
baking quality. In: A.S. Basra and L.S. Randhawa (eds.). Quality Improvement in Field Crops.
Food Product Press, Haworth Press, Inc., New York. pp. 39–74.
Spielmeyer, W., McIntosh R.A., Kolmer J. and Lagudah E.S. (2005). Powdery mildew resistance
and Lr34/Yr18 genes for durable resistance to leaf and stripe rust cosegregate at a locus on the
short arm of chromosome 7D of wheat. Theor. Appl. Genet. 111, 731–735.
Spiertz, J.H.J., Hamer, R.J., Xu, H.Y., Primo-Martin, C., Don C. and van der Putten, P.E.L.
2006. Heat stress in wheat; effects on grain weight and quality within genotypes. Europ. J.
Agr. 25, 89–95.
Varady, K.A., Wang Y. and Jones P.J.H. (2003). Role of policosanols in the prevention and
treatment of cardiovascular disease. Nutr. Rev. 61, 376–383.
Williams, C.E., Collier N., Sardesai C.C. and Ohm H.W. (2003). Phenotypic assessment and
mapped markers for H31, a new wheat gene conferring resistance to Hessian fly (Diptera:
Cecidomyiidae). Theor. Appl. Genet. 107, 1516–1523.
Yan, L., Fu D., Li C., Blechl A., Tranquilli G., Bonafede M., Sanchez A., Valarik M., Yasuda S.
and Dubcovsky J. (2006). The wheat and barley vernalization gene VRN3 is an orthologue of
FT. Proc. Natl. Acad. Sci. USA 103, 19581–19586.
Yan, L., Loukoianov A., Blechl A., Tranquilli G., Ramakrishna W., SanMiguel P., Bennetzen J.L.,
Echenique V. and Dubcovsky J. (2004). The wheat VRN2 gene is a flowering repressor down-
regulated by vernalization. Science 303, 1640–1644.
Yan, L., Loukoianov A., Tranquilli G., Helguera M., Fahima T. and Dubcovsky J. (2003).
Positional cloning of the wheat vernalization gene Vrn1. Proc. Natl. Acad. Sci. USA 100,
6263–6268.
Zhang, Y., He Z., Zhang A., van Ginkel M., Pena R.J. and Ye G. (2006). Pattern analysis on
protein properties of Chinese and CIMMYT spring wheat cultivars sown in China and
CIMMYT. Aus. J. Agric. Res. 57, 811–822.
Zhang, G. and Mergoum M. (2007a). Developing evaluation methods for kernel shattering in
spring wheat. Crop Sci. 47, 1841–1850.
Zhang, G. and Mergoum M. (2007b). Molecular mapping of kernel shattering and its association
with Fusarium head blight resistance in a Sumai3 derived population. Theor. Appl. Genet. 115,
757–766.
156 M. Mergoum et al.
Rye Breeding
H.H. Geiger and T. Miedaner
Abstract Rye (Secale cereale L.) is mainly a European cereal with about 75% of
the global production growing in Russia, Belarus, Poland, Germany, and Ukraine. It
has the best overwintering ability, and the highest tolerance to drought, salt, or
aluminium stress from all small-grain cereals. Harvest is used for bread making,
feed, and in growing demands for ethanol and biomethane production as a renew-
able energy source. Hybrid rye is competitive to triticale and wheat also on better
soils and grown in Germany on about 70% of the total rye acreage. Rye developed
in the Middle East as a secondary crop, cultivated rye has its greatest diversity in
landraces and populations from Central and East Europe. Their utility for breeding
has considerably increased by progress in marker-based introgression of donor
chromosome segments. Resistance breeding is presently focused on leaf and stem
rust (Puccinia recondita, P. graminis f.sp. secalis), ergot (Claviceps purpurea), andFusarium diseases. Leaf blotch (Rhynchosporium secalis) and soilborne viruses
might gain more attention in the future. Main breeding goals are grain yield, straw
shortness, lodging resistance, high kernel weight, tolerances to pre-harvest
sprouting and abiotic stresses. Population varieties comprise open-pollinated and
synthetic varieties. Both are derived from self-incompatible breeding populations
which are steadily improved by recurrent half- or full-sib selection. Open pollinated
varieties (OPVs) constitute selected fractions of those populations whereas synthetic
varieties are composed of specifically selected parents from which they can iden-
tically be reconstituted. Most modern population varieties contain germplasm from
two or more genetically distant gene pools. Hybrid breeding is based on self-fertile
gene pools and cytoplasmic genic male sterility (CMS) is used as hybridizing
mechanism. Long-lasting breeding cycles are needed for the development of seed
parent lines since testcrossing is only possible after the inbred lines have been
converted to CMS analogues by repeated backcrossing. Options to speed up
this process are discussed. Development of restorer lines is straightforward once
H.H. Geiger(*)
University of Hohenheim, Institute of Plant Breeding, Seed Science, and Population Genetics,
D-70593 Stuttgart, Germany, e-mail: [email protected]
M.J. Carena (ed.), Cereals,DOI: 10.1007/978-0-387-72297-9, # Springer Science + Business Media, LLC 2009 157
effective restorer genes have been introduced to the respective breeding popula-
tions. Recurrent improvement of fertility restoration is most efficiently accom-
plished by recombining selected inbred lines after the first or second testcrossing
stage. Commercial hybrid seed production requires well-skilled farmers, careful
seed processing, and deliberate logistics since rye produces huge amounts of pollen
which may be transported over long distances. Even the slightest genetic contami-
nation of the CMS pre-basis and basis seed production may render the respective
seed lots worthless for subsequent multiplication. To reduce the cost of the final
step of seed production, the CMS seed parent and the pollinator parent are grown as
a mixture in a 95:5 ratio. Thus, only about 95% of the certified seed consists of true
hybrid seed. Whereas the remainder 5% are randomly intermated plants of the
pollinator. However, the latter generally are poor competitors and therefore do not
impair the yielding performance of the ‘hybrid’ stand. In the last decades, population
and hybrid breeding led to substantial progress in grain yield and other traits.
1 Introduction
Rye (Secale cereale L.) is a diploid (2n = 2x = 14) annual, cross-pollinated cereal
with an effective gametophytic self-incompatibility system (Lundqvist, 1956).
Similar to many crops of the Old World, S. cereale evolved in the Fertile Crescent
of the Near East. Main regions of diversity are Turkey, Libanon, Syria, Iran, Iraq,
and Afghanistan. Rye was, however, never cultivated as a crop there but grew and
still grows as a weed within the stands of barley and wheat. Annual rye forms
evolved in this agricultural context by natural selection leading to semi- to non-
shattering ears, larger kernels, and dormancy (‘primitive rye’). Populations growing
at higher altitude show an excellent cold hardiness. The first cultivation of rye took
place in the region around the Caspian Sea at about 3000–4000 BC. Rye came to
Eastern Europe by Slavic people. During their migration to the West at about
500 BC, they brought the knowledge of rye growing to the Germanic, Celtic, and
Finnish peoples. During the whole Middle Ages and modern times till the 1960s,
rye was the major cereal crop from Germany to Eastern Siberia. Large breeding
progress in the self-pollinated crops, wheat and barley, lead to a decrease of the rye
acreage in regions where stress tolerance is less important. On a world-wide basis,
rye acreage was nearly halved in the last decade (Table 1). Main rye producing
countries presently are Russia, Belarus, Poland, Germany, and Ukraine. By far the
highest grain yields are obtained in Germany illustrating the high potential of the
crop under intensive growing conditions.
Rye is mostly grown as a winter cereal. Spring rye is superior in extremely cold
areas or where the snow cover lasts longer than 3 months. Compared to other
cereals, rye has the best overwintering ability and the highest tolerance to drought,
salt, or aluminium stress among all small-grain cereals. Rye excels in considerable
growth during late fall and resumes growth very quickly in early spring. Rye is
158 H.H. Geiger, T. Miedaner
more productive than other cereals on infertile, sandy, or acid soils, as well as on
poorly prepared land. Hybrid rye is competitive to triticale and wheat even on better
soils due to its higher yield potential.
About 50–75% of the harvest is used for bread making. Traditional rye bread is
the dark sour bread known in North Germany, Finland, the Baltics, Poland, Belarus,
and the Russian Federation. In Sweden, Denmark, and parts of Germany, rye flour
is commonly mixed with 25–50% wheat flour for bread making. The remainder rye
harvest is used for feeding, the production of alcohol (Schnaps, Vodka), and as a
resource for renewable bioenergy (bioethanole, biomethane, and combustion).
2 Germplasm and Use of Genetic Resources
Cultivated rye displays a broad range of genetic diversity reflecting the great ecologi-
cal differences among the various growing areas. As expected from a cross-pollinated
crop, a higher amount of genetic diversity can be found within than among popula-
tions (Persson and von Bothmer, 2000). A recent marker-based diversity study with
landraces and varieties from Nordic countries, Germany, and Poland revealed eight
clusters differing in origin (Persson et al., 2006). Large gene bank collections exist in
various countries (Table 2) comprising East European cultivars, landraces from
Europe, Asia, and South America, primitive populations from the Near East, and
wild Secale species. In European gene banks, 9,901 accessions are stored, one-thirdof which are likely to be duplicated (Podyma, 2003). Additionally, 236 accessions
are available from S. silvestre, S. iranicum, and S. montanum.In practical rye breeding, genetic resources have not been intensively utilized for
a number of reasons: (1) exotic germplasm generally lacks adaptation to the
targeted growing area, (2) substantial difference in performance between elite and
exotic germplasm for polygenic traits, (3) exotic germplasm is lacking inbreeding
tolerance, (4) little is known about their genetic distance to established heterotic
groups, and (5) genetic phenomena such as pleiotropy, epistasis, and coupling
phase linkage between desired and undesired alleles may hinder a direct utilization
Table 1 Main rye growing countries and acreages in 1995 and 2005 and average grain yield in
2005 (FAO, 2006)
Continent/Country Acreage (1,000 ha) Yield (t ha�1)
1995 2005 2005
Europe 8,613 5,620 2.46
Russian Federation 3,250 1,900 1.91
Poland 2,452 1,410 2.38
Belarus 969 580 2.16
Germany 861 555 5.07
Ukraine 552 610 1.95
Asia 1,126 587 1.87
USA 374 337 1.77
World 10,206 6,598 2.37
Rye Breeding 159
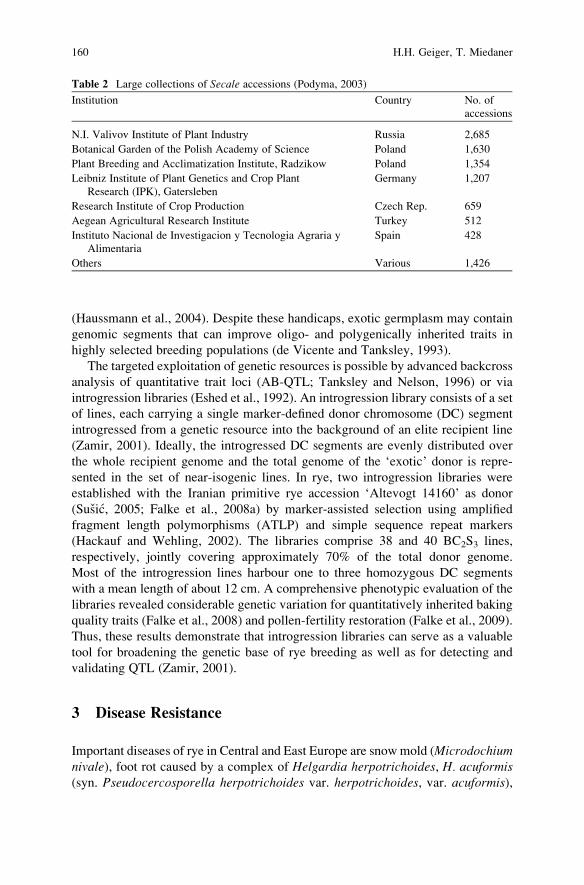
(Haussmann et al., 2004). Despite these handicaps, exotic germplasm may contain
genomic segments that can improve oligo- and polygenically inherited traits in
highly selected breeding populations (de Vicente and Tanksley, 1993).
The targeted exploitation of genetic resources is possible by advanced backcross
analysis of quantitative trait loci (AB-QTL; Tanksley and Nelson, 1996) or via
introgression libraries (Eshed et al., 1992). An introgression library consists of a set
of lines, each carrying a single marker-defined donor chromosome (DC) segment
introgressed from a genetic resource into the background of an elite recipient line
(Zamir, 2001). Ideally, the introgressed DC segments are evenly distributed over
the whole recipient genome and the total genome of the ‘exotic’ donor is repre-
sented in the set of near-isogenic lines. In rye, two introgression libraries were
established with the Iranian primitive rye accession ‘Altevogt 14160’ as donor
(Susic, 2005; Falke et al., 2008a) by marker-assisted selection using amplified
fragment length polymorphisms (ATLP) and simple sequence repeat markers
(Hackauf and Wehling, 2002). The libraries comprise 38 and 40 BC2S3 lines,
respectively, jointly covering approximately 70% of the total donor genome.
Most of the introgression lines harbour one to three homozygous DC segments
with a mean length of about 12 cm. A comprehensive phenotypic evaluation of the
libraries revealed considerable genetic variation for quantitatively inherited baking
quality traits (Falke et al., 2008) and pollen-fertility restoration (Falke et al., 2009).
Thus, these results demonstrate that introgression libraries can serve as a valuable
tool for broadening the genetic base of rye breeding as well as for detecting and
validating QTL (Zamir, 2001).
3 Disease Resistance
Important diseases of rye in Central and East Europe are snow mold (Microdochiumnivale), foot rot caused by a complex of Helgardia herpotrichoides, H. acuformis(syn. Pseudocercosporella herpotrichoides var. herpotrichoides, var. acuformis),
Table 2 Large collections of Secale accessions (Podyma, 2003)
Institution Country No. of
accessions
N.I. Valivov Institute of Plant Industry Russia 2,685
Botanical Garden of the Polish Academy of Science Poland 1,630
Plant Breeding and Acclimatization Institute, Radzikow Poland 1,354
Leibniz Institute of Plant Genetics and Crop Plant
Research (IPK), Gatersleben
Germany 1,207
Research Institute of Crop Production Czech Rep. 659
Aegean Agricultural Research Institute Turkey 512
Instituto Nacional de Investigacion y Tecnologia Agraria y
Alimentaria
Spain 428
Others Various 1,426
160 H.H. Geiger, T. Miedaner
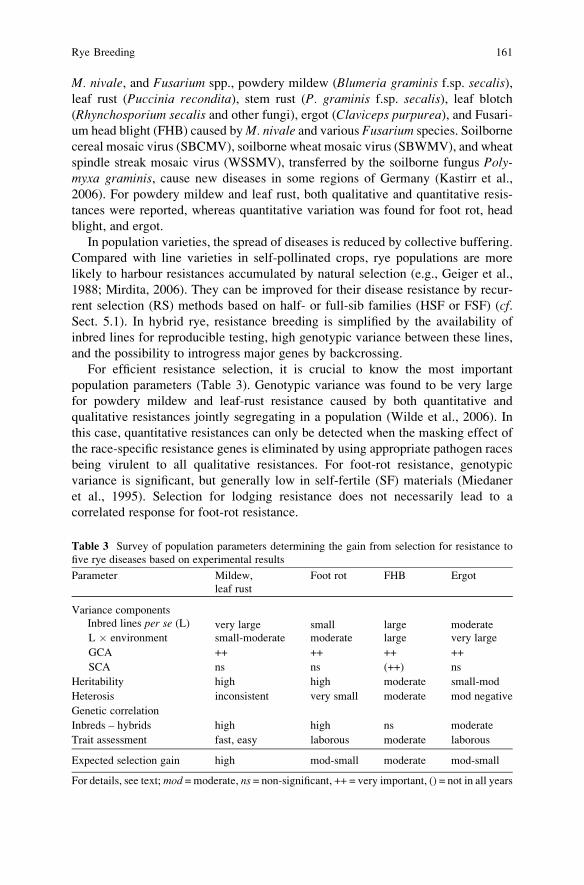
M. nivale, and Fusarium spp., powdery mildew (Blumeria graminis f.sp. secalis),leaf rust (Puccinia recondita), stem rust (P. graminis f.sp. secalis), leaf blotch
(Rhynchosporium secalis and other fungi), ergot (Claviceps purpurea), and Fusari-
um head blight (FHB) caused byM. nivale and various Fusarium species. Soilborne
cereal mosaic virus (SBCMV), soilborne wheat mosaic virus (SBWMV), and wheat
spindle streak mosaic virus (WSSMV), transferred by the soilborne fungus Poly-myxa graminis, cause new diseases in some regions of Germany (Kastirr et al.,
2006). For powdery mildew and leaf rust, both qualitative and quantitative resis-
tances were reported, whereas quantitative variation was found for foot rot, head
blight, and ergot.
In population varieties, the spread of diseases is reduced by collective buffering.
Compared with line varieties in self-pollinated crops, rye populations are more
likely to harbour resistances accumulated by natural selection (e.g., Geiger et al.,
1988; Mirdita, 2006). They can be improved for their disease resistance by recur-
rent selection (RS) methods based on half- or full-sib families (HSF or FSF) (cf.Sect. 5.1). In hybrid rye, resistance breeding is simplified by the availability of
inbred lines for reproducible testing, high genotypic variance between these lines,
and the possibility to introgress major genes by backcrossing.
For efficient resistance selection, it is crucial to know the most important
population parameters (Table 3). Genotypic variance was found to be very large
for powdery mildew and leaf-rust resistance caused by both quantitative and
qualitative resistances jointly segregating in a population (Wilde et al., 2006). In
this case, quantitative resistances can only be detected when the masking effect of
the race-specific resistance genes is eliminated by using appropriate pathogen races
being virulent to all qualitative resistances. For foot-rot resistance, genotypic
variance is significant, but generally low in self-fertile (SF) materials (Miedaner
et al., 1995). Selection for lodging resistance does not necessarily lead to a
correlated response for foot-rot resistance.
Table 3 Survey of population parameters determining the gain from selection for resistance to
five rye diseases based on experimental results
Parameter Mildew,
leaf rust
Foot rot FHB Ergot
Variance components
Inbred lines per se (L) very large small large moderate
L � environment small-moderate moderate large very large
GCA ++ ++ ++ ++
SCA ns ns (++) ns
Heritability high high moderate small-mod
Heterosis inconsistent very small moderate mod negative
Genetic correlation
Inbreds – hybrids high high ns moderate
Trait assessment fast, easy laborous moderate laborous
Expected selection gain high mod-small moderate mod-small
For details, see text;mod =moderate, ns = non-significant, ++ = very important, () = not in all years
Rye Breeding 161
For FHB resistance, genotypic variance between selfed lines is large and thus
can easily be exploited. Variation for ergot resistance is available in all materials
tested so far including cytoplasmic genic male sterile (CMS) materials and self-
incompatible (SI) populations (Mirdita, 2006). Environmental effects plays a mod-
erate to large role in all pathosystems. Even artificial inoculation with highly
aggressive isolates may result in strongly deviating infection levels in different
environments and cause significant genotype � environment interactions. This is
especially valid for FHB and ergot resistance. Heritability estimates are generally
lower for the latter two resistances compared with resistance to powdery mildew,
leaf rust, and foot rot.
General combining ability (GCA) variance is much more important than specific
combining ability (SCA) variance in all pathosystems (Table 3). The only exception
is FHB resistance where significant SCA was found, however, not consistently
across years (Miedaner and Geiger, 1996). No correlation was found between
inbred lines and their hybrids in this pathosystem (Miedaner et al., 2003),
in sharp contrast to the other pathosystems. Both findings necessitate multi-
environmental evaluation of testcross progeny. The use of moderately susceptible
testers is crucial to gain a maximum genetic differentiation. Moderate heterosis for
resistance was found in FHB resistance. For the foot and leaf diseases, heterosis is
practically absent. For ergot resistance, crosses normally display a higher disease
severity in terms of weight of sclerotia than their inbred lines (Mirdita, 2006).
Selection intensity is mainly restricted by the cost of inoculation and trait assess-
ment. The wind-borne diseases can be provocated rather easily and scoring at one
date on one leaf or even a single whole-plant rating will suffice (Miedaner et al.,
2002). The other extremes are foot-rot resistance requiring individual scoring of at
least ten stems per plot (Miedaner et al., 1995), and ergot resistance necessitating
separation of sclerotia from the grain and determining their weight proportion
(Mirdita et al., 2008).
Taking all parameters together, the expected selection gain is highest for mildew
and leaf-rust resistance and lowest for foot-rot resistance. For FHB resistance, the
necessity to test at the hybrid level substantially reduces the selection gain. These
characteristics of the above pathosystems have implications on the method and
generation in which selection for disease resistance should be practiced.
In hybrid breeding, mildew and leaf-rust resistance can easily be implemented in
the regular line development scheme (cf. Sect. 5.2.3) by selecting already in early
selfing generations. For all other diseases, specific pre-breeding procedures are
required aiming at an increased frequency of resistance alleles in the elite materials.
For improving foot-rot and ergot resistance, the introgression of positive alleles
from SI elite populations or genetic resources is recommended to increase the
genetic variance. Agreement between line and GCA effects allows selection
among lines per se, that is, without prior testcrossing. Only for FHB resistance,
selection should predominantly be carried out at the non-inbred level. A correlated
reduction can then be expected for low deoxynivalenol content.
Since no substantial heterosis for resistance was found in any of the pathosys-
tems, selection is necessary in both the seed- and the pollinator-line gene pools. In
162 H.H. Geiger, T. Miedaner
the future, experiments designed to estimate population parameters should be
combined with QTL analyses. Marker-assisted selection may considerably add to
progress in resistance breeding as recently demonstrated for FHB resistance in
wheat (Wilde et al., 2007).
4 Use and Breeding Goals
Most goals in winter rye breeding are similar to those in other small-grain cereals.
Generally, hybrid breeding is more flexible than population breeding in creating
varieties with specific characteristics.
Grain yield is by far the most important trait for rye growers. The average grain
yield in Europe presently (2004–2005) varies from 1.9 t ha�1 in Russia to 5.1 t ha�1
in Germany (Table 1). Generally, hybrids yield 15–20% more than population
varieties (cf. Sect. 6).Strawshortnessand lodgingresistance are important breeding goals. However, since
the culm is the major assimilation organ in rye (Nalborczyk et al., 1981), extremely
short-strawed rye varieties do not reach high grain yield levels, in particular under
severe stress. Therefore, dwarf or semi-dwarf varieties never gained large acreages.
Tolerance to drought and nutrient stress are important components of yield
stability because rye is widely grown on poor, sandy soils. Compared to wheat,
rye has a much higher tolerance to abiotic stresses, such as drought, nitrogen
deficiency, and high concentrations of aluminium, zinc, sodium, and acidity.
Baking quality: For milling and baking, mainly a high kernel weight and
resistance to pre-harvest sprouting is demanded. Because of its low dormancy,
rye kernels may start germinating already before harvest if the weather is warm and
moist. This leads to a deterioration of the starch and considerably reduces baking
quality. Indirect selection for low a-amylase activity by the falling number method
is effective in hybrid materials without negative influence on yield and other
agronomic traits (Wehmann et al., 1991). Indeed, some modern German hybrid
varieties combine both high yielding performance and high falling number. Another
important quality component is a high pentosane content that can indirectly be
measured by near-infrared spectroscopy (Rode et al., 2005).
Feeding quality: Rye is increasingly used as an animal feed either on farm or by
compound feed producers. The grain is rich in energy and contains more digestible
protein and total digestible nutrients than oats or barley and a higher starch content
than barley. Rye is not recommended in the diet for weaning pigs, growing chicken,
and turkeys and should be restricted to 40–50% of the diet for other animals because
of its high concentration of pentosanes (Boros, 2007). They negatively affect feed
intake, feed conversion efficacy, and growth rate in animals. Thus, pentosanes have
reverse effects on feeding and baking quality which means that contrasting genetic
materials are needed for the two usages. At present, only in Poland, low-pentosane
inbred lines are being developed by selecting for low extract viscosity (Madej
et al., 1990).
Rye Breeding 163
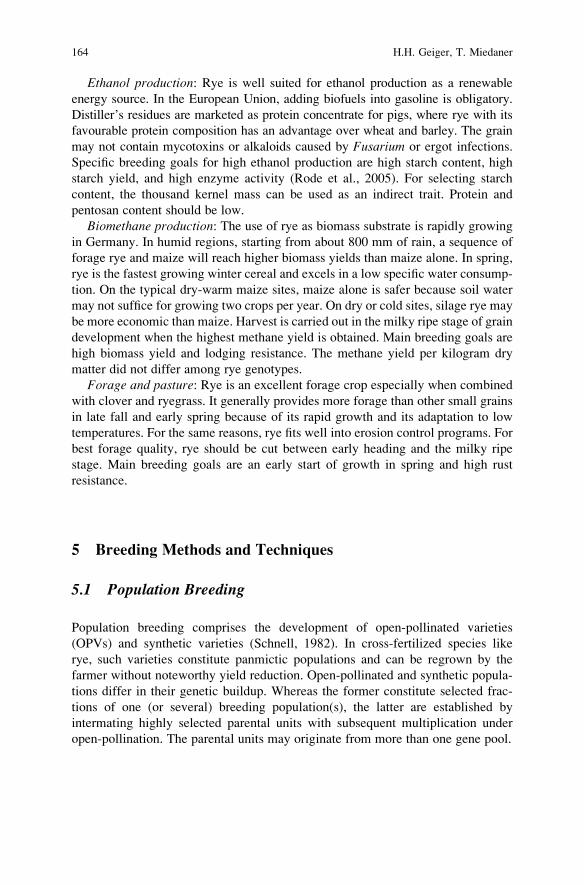
Ethanol production: Rye is well suited for ethanol production as a renewable
energy source. In the European Union, adding biofuels into gasoline is obligatory.
Distiller’s residues are marketed as protein concentrate for pigs, where rye with its
favourable protein composition has an advantage over wheat and barley. The grain
may not contain mycotoxins or alkaloids caused by Fusarium or ergot infections.
Specific breeding goals for high ethanol production are high starch content, high
starch yield, and high enzyme activity (Rode et al., 2005). For selecting starch
content, the thousand kernel mass can be used as an indirect trait. Protein and
pentosan content should be low.
Biomethane production: The use of rye as biomass substrate is rapidly growing
in Germany. In humid regions, starting from about 800 mm of rain, a sequence of
forage rye and maize will reach higher biomass yields than maize alone. In spring,
rye is the fastest growing winter cereal and excels in a low specific water consump-
tion. On the typical dry-warm maize sites, maize alone is safer because soil water
may not suffice for growing two crops per year. On dry or cold sites, silage rye may
be more economic than maize. Harvest is carried out in the milky ripe stage of grain
development when the highest methane yield is obtained. Main breeding goals are
high biomass yield and lodging resistance. The methane yield per kilogram dry
matter did not differ among rye genotypes.
Forage and pasture: Rye is an excellent forage crop especially when combined
with clover and ryegrass. It generally provides more forage than other small grains
in late fall and early spring because of its rapid growth and its adaptation to low
temperatures. For the same reasons, rye fits well into erosion control programs. For
best forage quality, rye should be cut between early heading and the milky ripe
stage. Main breeding goals are an early start of growth in spring and high rust
resistance.
5 Breeding Methods and Techniques
5.1 Population Breeding
Population breeding comprises the development of open-pollinated varieties
(OPVs) and synthetic varieties (Schnell, 1982). In cross-fertilized species like
rye, such varieties constitute panmictic populations and can be regrown by the
farmer without noteworthy yield reduction. Open-pollinated and synthetic popula-
tions differ in their genetic buildup. Whereas the former constitute selected frac-
tions of one (or several) breeding population(s), the latter are established by
intermating highly selected parental units with subsequent multiplication under
open-pollination. The parental units may originate from more than one gene pool.
164 H.H. Geiger, T. Miedaner
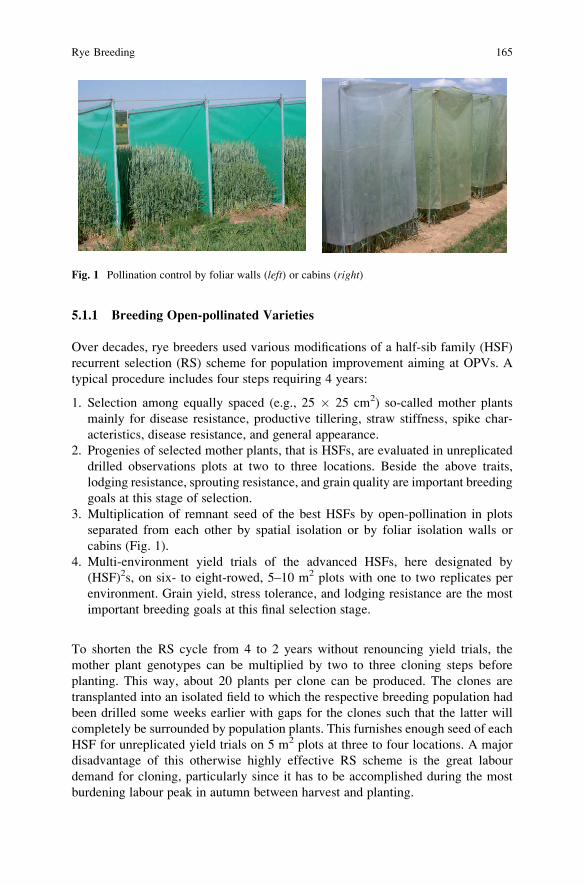
5.1.1 Breeding Open-pollinated Varieties
Over decades, rye breeders used various modifications of a half-sib family (HSF)
recurrent selection (RS) scheme for population improvement aiming at OPVs. A
typical procedure includes four steps requiring 4 years:
1. Selection among equally spaced (e.g., 25 � 25 cm2) so-called mother plants
mainly for disease resistance, productive tillering, straw stiffness, spike char-
acteristics, disease resistance, and general appearance.
2. Progenies of selected mother plants, that is HSFs, are evaluated in unreplicated
drilled observations plots at two to three locations. Beside the above traits,
lodging resistance, sprouting resistance, and grain quality are important breeding
goals at this stage of selection.
3. Multiplication of remnant seed of the best HSFs by open-pollination in plots
separated from each other by spatial isolation or by foliar isolation walls or
cabins (Fig. 1).
4. Multi-environment yield trials of the advanced HSFs, here designated by
(HSF)2s, on six- to eight-rowed, 5–10 m2 plots with one to two replicates per
environment. Grain yield, stress tolerance, and lodging resistance are the most
important breeding goals at this final selection stage.
To shorten the RS cycle from 4 to 2 years without renouncing yield trials, the
mother plant genotypes can be multiplied by two to three cloning steps before
planting. This way, about 20 plants per clone can be produced. The clones are
transplanted into an isolated field to which the respective breeding population had
been drilled some weeks earlier with gaps for the clones such that the latter will
completely be surrounded by population plants. This furnishes enough seed of each
HSF for unreplicated yield trials on 5 m2 plots at three to four locations. A major
disadvantage of this otherwise highly effective RS scheme is the great labour
demand for cloning, particularly since it has to be accomplished during the most
burdening labour peak in autumn between harvest and planting.
Fig. 1 Pollination control by foliar walls (left) or cabins (right)
Rye Breeding 165
In the course of time, many breeders changed from HSF to full-sib family (FSF)
selection (Fig. 2). The latter requires the production of pair crosses under pollina-
tion bags in the first year. Because of the self-incompatibility of rye this is possible
without emasculation. In the second year, FSFs instead of HSFs are grown in
observation plots, and best FSFs are multiplied under pollen isolation in the third
year. Finally, in the fourth year, (FSF)2s are evaluated in multi-location yield trials.
The expected response to selection is greater for the FS than for the HS scheme
because of complete parental control and greater genetic variance between the test
units [FSF vs HSF and (FSF)2 vs (HSF)2, respectively]. However, producing the pair
crosses requires a considerably higher experimental input than the corresponding
steps in the HS scheme. Furthermore, only a weak selection pressure is possible
among the plant pairs in year 1, and more (FSF)2s than (HSF)2s have to be
saved after each RS cycle to comply with a minimum effective population size
(Walsh, 2004).
1 20.000 pairs
Pair crossing
2 4.000 FSF
3 500 FSF
4 500 (FSF)2
Newcycle
~ 20 (FSF)2
bulked
20.000 pairs
Micro-plots
Isolated units
Multi–locationyield trial
Build upof OPV
Spaced plants
Seed multiplication
Spaced plants
Year Breeding operations Entries
Fig. 2 Flow diagram and dimensioning example (number of entries) of a full-sib family (FSF)recurrent selection scheme for intrapool population improvement in self-incompatible rye; (FSF)2 =
progeny of an FSF advanced under open pollination in a pollen isolation device
166 H.H. Geiger, T. Miedaner
As in the HS scheme, cloning the parent plants would allow to half the cycle
length of the FS scheme, and the same pros and cons would apply. This high-input
short-cycle scheme is well suited as a ‘crash’ procedure for rapidly increasing the
yield level of an otherwise satisfactory breeding population.
Most modern OPVs are built up by merging selected fractions of two or even
more genetically distant populations representing a set of heterotic pools. This way,
part of the ‘panmictic-midparent heterosis’ (Lamkey and Edwards, 1999) can be
used for enhancing the varietal performance. Experimental data (Hepting, 1978)
indicate that crossing two genetically distant rye populations may increase the yield
level of the population cross by 10–20% above that of the parent populations.
However, at Hardy–Weinberg equilibrium which is rapidly attained during seed
multiplication, about half of this increase is lost due to a corresponding drop in
heterozygosity.
5.1.2 Breeding Synthetic Varieties
The parental components, in short ‘parents’, of a synthetic variety can be HS or FS
families, clones, inbred lines, or other materials which can be preserved so that the
variety can identically be re-composed. However, long-term preservation of rye
clones, for example, by in vitro culture, is very difficult and expensive. Clones,
therefore, have not gained practical relevance in synthetic breeding so far. Selfing
SI genotypes (rather than cloning) is possible if the plants are cultivated at high
temperature (30–35 �C) shortly before and during anthesis (Wricke, 1978). How-
ever, only few seeds per spike can be obtained this way and many genotypes don’t
respond to the treatment at all. Indeed most synthetics are composed of HS or FS
families, and thus OPVs and synthetics basically have the same genetic structure
and breadth.
Although SF and SI materials do not differ in flowering characteristics, SF plants
display selfing rates of about 20–50% under open-pollination (Geiger and Schnell,
1970; Wricke, 1979). The resulting inbreeding was shown to drastically lower the
performance level of SF synthetics below that of SI synthetics (Singh et al., 1984).
Therefore, high-combining SF inbred lines as developed in hybrid breeding are not
suited as parents of synthetic varieties.
Selection of parents is mostly based on their intra-pool breeding values as
ascertained in RS programs. If parents from two or more heterotic groups are to be
combined, it would be desirable to additionally consider their inter-pool breeding
values. Production of testcross seed could be accomplished growing the candidates
in isolated plots with excessive tester pollen. However, such selection procedures
require much higher efforts or take more time to complete a selection cycle than the
HS and FS schemes described above. It therefore appears questionable whether
inter-pool testing is worthwhile in breeding synthetic rye varieties. Diallel or
factorial crosses for estimating SCA effects are not rewarding since SCA variance
determines only a negligible part of the genetic differentiation among synthetics.
Rye Breeding 167
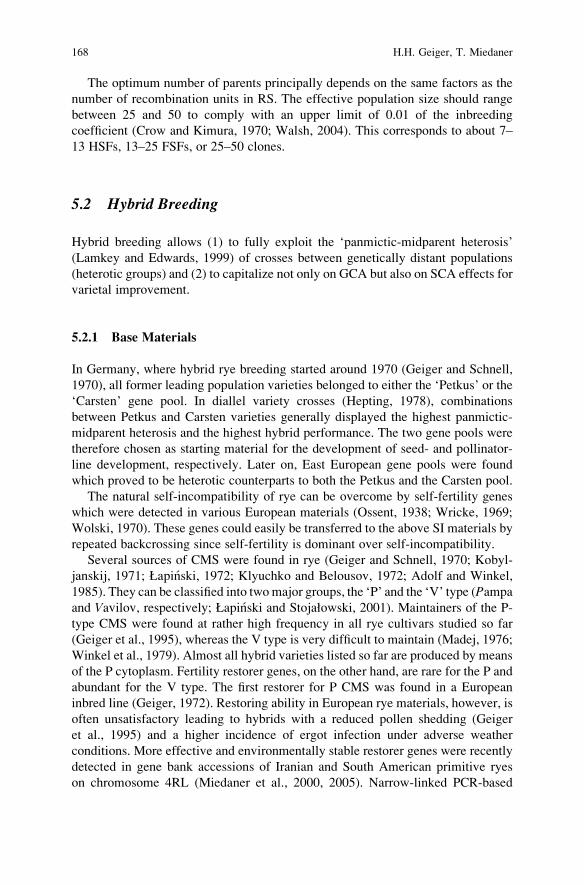
The optimum number of parents principally depends on the same factors as the
number of recombination units in RS. The effective population size should range
between 25 and 50 to comply with an upper limit of 0.01 of the inbreeding
coefficient (Crow and Kimura, 1970; Walsh, 2004). This corresponds to about 7–
13 HSFs, 13–25 FSFs, or 25–50 clones.
5.2 Hybrid Breeding
Hybrid breeding allows (1) to fully exploit the ‘panmictic-midparent heterosis’
(Lamkey and Edwards, 1999) of crosses between genetically distant populations
(heterotic groups) and (2) to capitalize not only on GCA but also on SCA effects for
varietal improvement.
5.2.1 Base Materials
In Germany, where hybrid rye breeding started around 1970 (Geiger and Schnell,
1970), all former leading population varieties belonged to either the ‘Petkus’ or the
‘Carsten’ gene pool. In diallel variety crosses (Hepting, 1978), combinations
between Petkus and Carsten varieties generally displayed the highest panmictic-
midparent heterosis and the highest hybrid performance. The two gene pools were
therefore chosen as starting material for the development of seed- and pollinator-
line development, respectively. Later on, East European gene pools were found
which proved to be heterotic counterparts to both the Petkus and the Carsten pool.
The natural self-incompatibility of rye can be overcome by self-fertility genes
which were detected in various European materials (Ossent, 1938; Wricke, 1969;
Wolski, 1970). These genes could easily be transferred to the above SI materials by
repeated backcrossing since self-fertility is dominant over self-incompatibility.
Several sources of CMS were found in rye (Geiger and Schnell, 1970; Kobyl-
janskij, 1971; Łapinski, 1972; Klyuchko and Belousov, 1972; Adolf and Winkel,
1985). They can be classified into twomajor groups, the ‘P’ and the ‘V’ type (Pampa
and Vavilov, respectively; Łapinski and Stojałowski, 2001). Maintainers of the P-
type CMS were found at rather high frequency in all rye cultivars studied so far
(Geiger et al., 1995), whereas the V type is very difficult to maintain (Madej, 1976;
Winkel et al., 1979). Almost all hybrid varieties listed so far are produced by means
of the P cytoplasm. Fertility restorer genes, on the other hand, are rare for the P and
abundant for the V type. The first restorer for P CMS was found in a European
inbred line (Geiger, 1972). Restoring ability in European rye materials, however, is
often unsatisfactory leading to hybrids with a reduced pollen shedding (Geiger
et al., 1995) and a higher incidence of ergot infection under adverse weather
conditions. More effective and environmentally stable restorer genes were recently
detected in gene bank accessions of Iranian and South American primitive ryes
on chromosome 4RL (Miedaner et al., 2000, 2005). Narrow-linked PCR-based
168 H.H. Geiger, T. Miedaner
markers are available for two of these sources: Pico Gentario and IRAN IX (Rfp1and Rfp2, respectively; Stracke et al., 2003). These new restorers were transferred
to elite pollinator lines by marker-assisted backcrossing and have substantially
improved pollen shedding of newly released hybrids (Wilde, personal communica-
tion).
5.2.2 Genetic Structure of Hybrids
All presently listed hybrids are crosses between a CMS single cross as seed parent
and a restorer synthetic as pollinator (Geiger, 1982):
ðACMS � BÞ � SynRfThe parent lines A and B of the CMS single cross may be derived from the same or
two different heterotic groups, both being unrelated to the pollinator gene pool.
The seed parent has to be absolutely male sterile under a wide range of environ-
mental conditions and to furnish adequate amounts of high-quality seed. Tomeet the
first requirement, the seed parent has to be genetically uniform to facilitate visual
male sterility control during pre-basis and basis seed production (cf. Section 5.3). Tocomply with the second requirement, the seed parent needs to be sufficiently
vigorous. Taken together, the two requirements can best be fulfilled by a single
cross between unrelated homozygous lines.
The restorer synthetic usually is composed of two inbred lines. The genetic
structure of the hybrid then corresponds to that of a double cross. As the vigour of
inbred lines has considerably been improved over selection cycles, breeders are
recently attempting to narrow down the genetic breadth of the pollinator parent by
combining two sister lines or by using just one partially inbred line. This allows to
more efficiently exploit SCA effects and to minimize the risk of negative epistatic
effects due to a disruption of coadapted parental gene arrangements caused by
segregation (Geiger, 1988). On the other hand, a genetically broader synthetic is a
more secure pollinator due to a longer pollen shedding period.
Limited data is available on the yielding stability of different hybrid types.
Becker et al. (1982) compared balanced sets of three-way and double crosses.
The authors found no consistent stability trend in favour of one or the other type.
However, the three highest yielding three-way crosses significantly surpassed the
three best double crosses.
5.2.3 Parent Line Development
Parent line development in commercial hybrid breeding programs is exclusively
done by selfing. No routinely applicable doubled-haploid technology exists so far
(Flehinghaus-Roux et al., 1995; Tenhola-Roininen et al., 2006; for review see
Rye Breeding 169
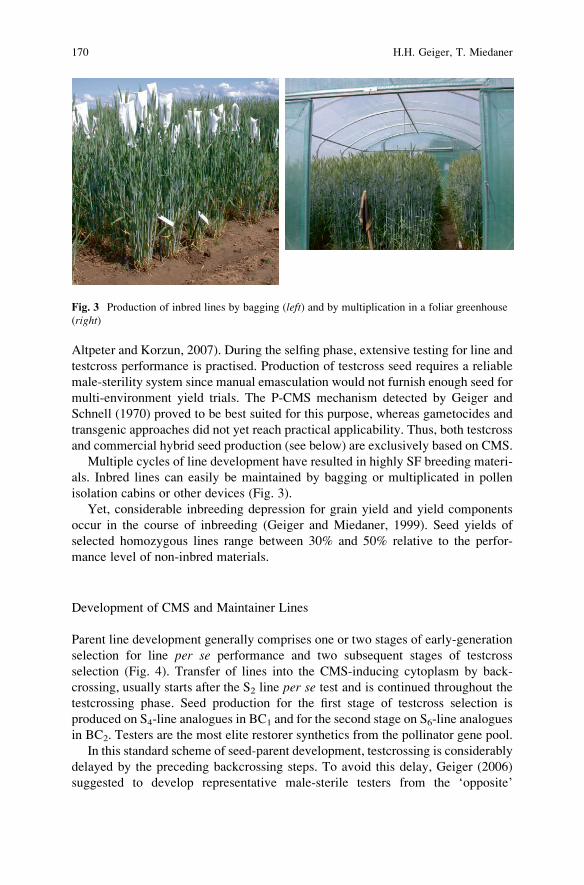
Altpeter and Korzun, 2007). During the selfing phase, extensive testing for line and
testcross performance is practised. Production of testcross seed requires a reliable
male-sterility system since manual emasculation would not furnish enough seed for
multi-environment yield trials. The P-CMS mechanism detected by Geiger and
Schnell (1970) proved to be best suited for this purpose, whereas gametocides and
transgenic approaches did not yet reach practical applicability. Thus, both testcross
and commercial hybrid seed production (see below) are exclusively based on CMS.
Multiple cycles of line development have resulted in highly SF breeding materi-
als. Inbred lines can easily be maintained by bagging or multiplicated in pollen
isolation cabins or other devices (Fig. 3).
Yet, considerable inbreeding depression for grain yield and yield components
occur in the course of inbreeding (Geiger and Miedaner, 1999). Seed yields of
selected homozygous lines range between 30% and 50% relative to the perfor-
mance level of non-inbred materials.
Development of CMS and Maintainer Lines
Parent line development generally comprises one or two stages of early-generation
selection for line per se performance and two subsequent stages of testcross
selection (Fig. 4). Transfer of lines into the CMS-inducing cytoplasm by back-
crossing, usually starts after the S2 line per se test and is continued throughout the
testcrossing phase. Seed production for the first stage of testcross selection is
produced on S4-line analogues in BC1 and for the second stage on S6-line analogues
in BC2. Testers are the most elite restorer synthetics from the pollinator gene pool.
In this standard scheme of seed-parent development, testcrossing is considerably
delayed by the preceding backcrossing steps. To avoid this delay, Geiger (2006)
suggested to develop representative male-sterile testers from the ‘opposite’
Fig. 3 Production of inbred lines by bagging (left) and by multiplication in a foliar greenhouse
(right)
170 H.H. Geiger, T. Miedaner
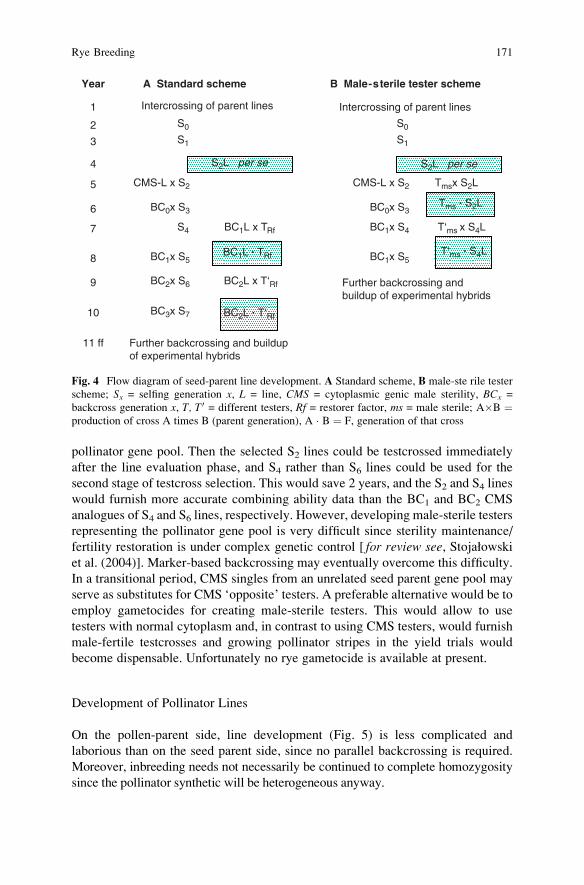
pollinator gene pool. Then the selected S2 lines could be testcrossed immediately
after the line evaluation phase, and S4 rather than S6 lines could be used for the
second stage of testcross selection. This would save 2 years, and the S2 and S4 lines
would furnish more accurate combining ability data than the BC1 and BC2 CMS
analogues of S4 and S6 lines, respectively. However, developing male-sterile testers
representing the pollinator gene pool is very difficult since sterility maintenance/
fertility restoration is under complex genetic control [ for review see, Stojałowskiet al. (2004)]. Marker-based backcrossing may eventually overcome this difficulty.
In a transitional period, CMS singles from an unrelated seed parent gene pool may
serve as substitutes for CMS ‘opposite’ testers. A preferable alternative would be to
employ gametocides for creating male-sterile testers. This would allow to use
testers with normal cytoplasm and, in contrast to using CMS testers, would furnish
male-fertile testcrosses and growing pollinator stripes in the yield trials would
become dispensable. Unfortunately no rye gametocide is available at present.
Development of Pollinator Lines
On the pollen-parent side, line development (Fig. 5) is less complicated and
laborious than on the seed parent side, since no parallel backcrossing is required.
Moreover, inbreeding needs not necessarily be continued to complete homozygosity
since the pollinator synthetic will be heterogeneous anyway.
1
2
3
4
5
6 BC0x S3 BC0x S3
BC1x S5
BC1x S4
BC1x S5
BC2x S6
BC3x S7
S47 BC1L x TRf
BC2L x T‘Rf
BC2L . T‘Rf
BC1L . TRf8
9
10
11 ff
B Male-sterile tester scheme
Intercrossing of parent lines
Tmsx S2L
T‘ms x S4L
T‘ms . S4L
Tms . S2L
Further backcrossing and buildup of experimental hybrids
Year A Standard scheme
S0
S1
S0
S1
S2L per se S2L per se
CMS-L x S2 CMS-L x S2
Intercrossing of parent lines
Further backcrossing and buildupof experimental hybrids
Fig. 4 Flow diagram of seed-parent line development. A Standard scheme, B male-ste rile tester
scheme; Sx = selfing generation x, L = line, CMS = cytoplasmic genic male sterility, BCx =
backcross generation x, T, T 0 = different testers, Rf = restorer factor, ms = male sterile; A�B ¼production of cross A times B (parent generation), A � B ¼ F, generation of that cross
Rye Breeding 171
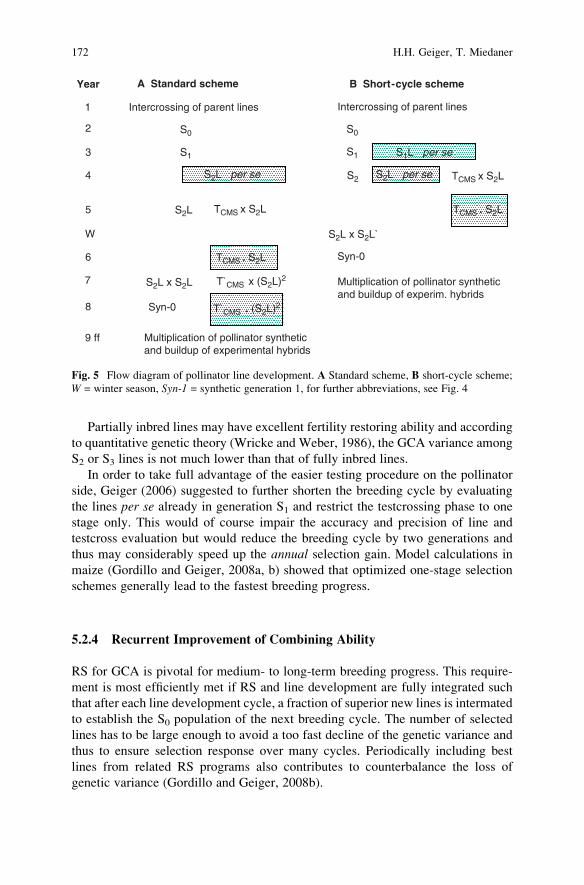
Partially inbred lines may have excellent fertility restoring ability and according
to quantitative genetic theory (Wricke and Weber, 1986), the GCA variance among
S2 or S3 lines is not much lower than that of fully inbred lines.
In order to take full advantage of the easier testing procedure on the pollinator
side, Geiger (2006) suggested to further shorten the breeding cycle by evaluating
the lines per se already in generation S1 and restrict the testcrossing phase to one
stage only. This would of course impair the accuracy and precision of line and
testcross evaluation but would reduce the breeding cycle by two generations and
thus may considerably speed up the annual selection gain. Model calculations in
maize (Gordillo and Geiger, 2008a, b) showed that optimized one-stage selection
schemes generally lead to the fastest breeding progress.
5.2.4 Recurrent Improvement of Combining Ability
RS for GCA is pivotal for medium- to long-term breeding progress. This require-
ment is most efficiently met if RS and line development are fully integrated such
that after each line development cycle, a fraction of superior new lines is intermated
to establish the S0 population of the next breeding cycle. The number of selected
lines has to be large enough to avoid a too fast decline of the genetic variance and
thus to ensure selection response over many cycles. Periodically including best
lines from related RS programs also contributes to counterbalance the loss of
genetic variance (Gordillo and Geiger, 2008b).
W
9 ff
B Short-cycle scheme
Intercrossing of parent lines
Multiplication of pollinator synthetic and buildup of experim. hybrids
Year A Standard scheme
Intercrossing of parent lines1
2
3
4
5
6
7
8
S0 S0
S1 S1
S2S2L per se S2L per se
S1L per se
S2L TCMS x S2L
TCMS x S2L
T`CMS x (S2L)2
T`CMS . (S2L)2
TCMS . S2L
TCMS . S2L
S2L x S2L
S2L x S2L`
Syn-0
Syn-0
Multiplication of pollinator syntheticand buildup of experimental hybrids
Fig. 5 Flow diagram of pollinator line development. A Standard scheme, B short-cycle scheme;
W = winter season, Syn-1 = synthetic generation 1, for further abbreviations, see Fig. 4
172 H.H. Geiger, T. Miedaner
In two-stage testcross selection schemes, the question arises whether the recom-
bination units (= lines to be intermated) should be selected after the first or the
second evaluation stage. The advantage of the former option would be a shorter
cycle length whereas the latter furnishes more accurate and precise performance
data. Model calculations for optimizing line development schemes (Tomerius,
2001; Tomerius et al., 2008) indicated that the second option will be superior
since the relative increase in selection gain per cycle is larger than the relative
reduction in cycle length. The number of lines to be recombined depends on the
testing intensity (years, locations, and replicates), the inbreeding coefficient of the
lines, and the cycle length, and should not fall below 20–30 in the aforementioned
breeding schemes.
5.2.5 Buildup of Experimental Hybrids
Once the very best lines have been identified, they are combined to CMS single
crosses on the seed-parent side and to restorer synthetics on the pollinator side.
Promising hybrids are then built up based on the estimated GCA of the parents for
the various performance traits. SCA effects are only considered in the final evalua-
tion of the experimental hybrids. There are two reasons for neglecting SCA before
building up these hybrids: First, estimation of SCA would require additional 2 years
and second, only one quarter of the SCA variance among factorial single crosses
contributes to the variance between double-cross hybrids. Furthermore, a compila-
tion of GCA and SCA variance component estimates over many rye experiments
showed that even for grain yield, GCA is far more important than SCA, particularly
in interpool crosses (Tomerius, 2001).
5.3 Commercial Hybrid Seed Production
Hybrid seed production is a multi-stage procedure (Fig. 6) requiring well-skilled
farmers, careful seed processing, and deliberate logistics.
Since rye as a wind-pollinated species produces huge amounts of pollen, which
may be transported over great distances [ for review see Feil and Schmid (2002)],
careful isolation is necessary to avoid genetic contamination of seed production
fields. Reproduction coefficients range between 60 and 100 in spaced-planted
stands of inbred lines and between 50 and 80 in stands of non-inbred materials
drilled at regular seeding rate (Wilde, 2007, personal communication).
Multiplying the CMS A line and its maintainer version generally requires 2–3
years. The CMS and male-fertile version are grown stripe-wise in a 2:1 to 3:1 ratio
depending on the field size. The fields should be located in non-rye-growing regions
to minimize the risk of contamination by alien pollen or by mechanical mixtures
during harvest or seed processing. Repeated careful checks for off-types are indis-
pensable before, during, and after anthesis. Even extremely few off-types (especially
Rye Breeding 173
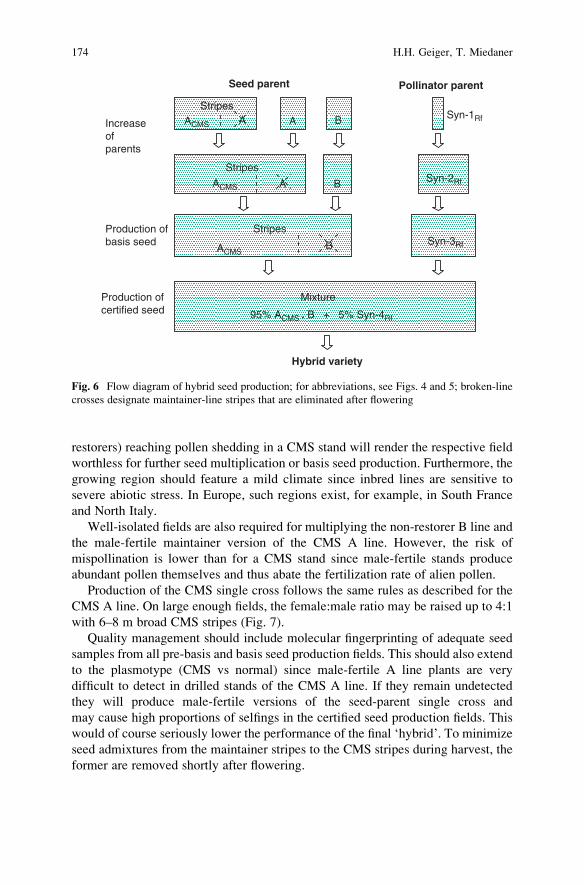
restorers) reaching pollen shedding in a CMS stand will render the respective field
worthless for further seed multiplication or basis seed production. Furthermore, the
growing region should feature a mild climate since inbred lines are sensitive to
severe abiotic stress. In Europe, such regions exist, for example, in South France
and North Italy.
Well-isolated fields are also required for multiplying the non-restorer B line and
the male-fertile maintainer version of the CMS A line. However, the risk of
mispollination is lower than for a CMS stand since male-fertile stands produce
abundant pollen themselves and thus abate the fertilization rate of alien pollen.
Production of the CMS single cross follows the same rules as described for the
CMS A line. On large enough fields, the female:male ratio may be raised up to 4:1
with 6–8 m broad CMS stripes (Fig. 7).
Quality management should include molecular fingerprinting of adequate seed
samples from all pre-basis and basis seed production fields. This should also extend
to the plasmotype (CMS vs normal) since male-fertile A line plants are very
difficult to detect in drilled stands of the CMS A line. If they remain undetected
they will produce male-fertile versions of the seed-parent single cross and
may cause high proportions of selfings in the certified seed production fields. This
would of course seriously lower the performance of the final ‘hybrid’. To minimize
seed admixtures from the maintainer stripes to the CMS stripes during harvest, the
former are removed shortly after flowering.
Production ofcertified seed
Mixture
Pollinator parent
Syn-1Rf
Syn-2Rf
Syn-3Rf
Seed parent
StripesACMS
Stripes
Stripes
ACMS
ACMSB
Hybrid variety
Increaseofparents
B
B
A
A
A
Production ofbasis seed
95% ACMS . B + 5% Syn-4Rf
Fig. 6 Flow diagram of hybrid seed production; for abbreviations, see Figs. 4 and 5; broken-line
crosses designate maintainer-line stripes that are eliminated after flowering
174 H.H. Geiger, T. Miedaner
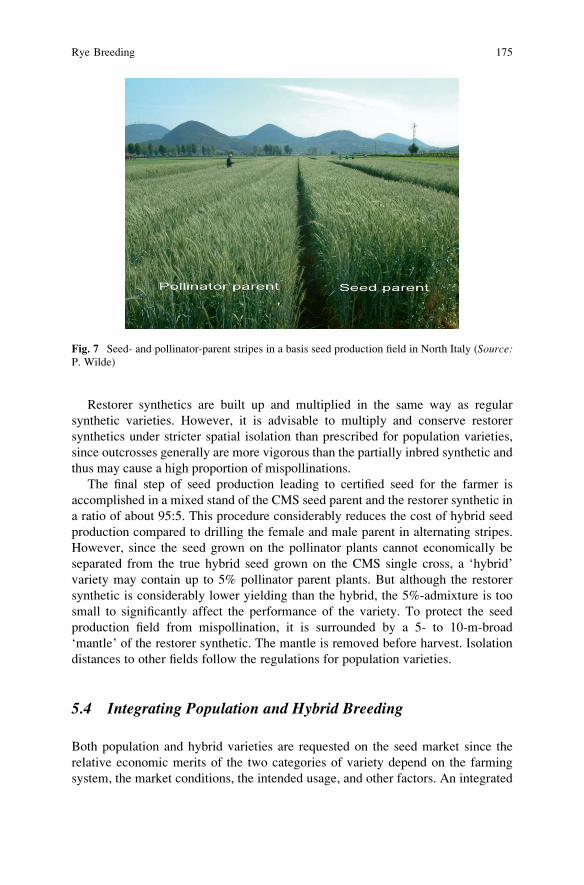
Restorer synthetics are built up and multiplied in the same way as regular
synthetic varieties. However, it is advisable to multiply and conserve restorer
synthetics under stricter spatial isolation than prescribed for population varieties,
since outcrosses generally are more vigorous than the partially inbred synthetic and
thus may cause a high proportion of mispollinations.
The final step of seed production leading to certified seed for the farmer is
accomplished in a mixed stand of the CMS seed parent and the restorer synthetic in
a ratio of about 95:5. This procedure considerably reduces the cost of hybrid seed
production compared to drilling the female and male parent in alternating stripes.
However, since the seed grown on the pollinator plants cannot economically be
separated from the true hybrid seed grown on the CMS single cross, a ‘hybrid’
variety may contain up to 5% pollinator parent plants. But although the restorer
synthetic is considerably lower yielding than the hybrid, the 5%-admixture is too
small to significantly affect the performance of the variety. To protect the seed
production field from mispollination, it is surrounded by a 5- to 10-m-broad
‘mantle’ of the restorer synthetic. The mantle is removed before harvest. Isolation
distances to other fields follow the regulations for population varieties.
5.4 Integrating Population and Hybrid Breeding
Both population and hybrid varieties are requested on the seed market since the
relative economic merits of the two categories of variety depend on the farming
system, the market conditions, the intended usage, and other factors. An integrated
Fig. 7 Seed- and pollinator-parent stripes in a basis seed production field in North Italy (Source:P. Wilde)
Rye Breeding 175
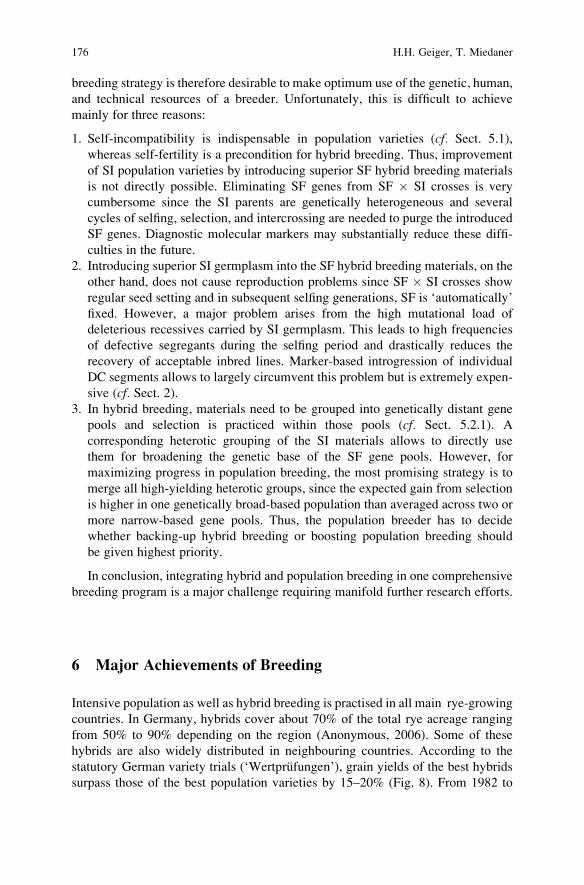
breeding strategy is therefore desirable to make optimum use of the genetic, human,
and technical resources of a breeder. Unfortunately, this is difficult to achieve
mainly for three reasons:
1. Self-incompatibility is indispensable in population varieties (cf. Sect. 5.1),
whereas self-fertility is a precondition for hybrid breeding. Thus, improvement
of SI population varieties by introducing superior SF hybrid breeding materials
is not directly possible. Eliminating SF genes from SF � SI crosses is very
cumbersome since the SI parents are genetically heterogeneous and several
cycles of selfing, selection, and intercrossing are needed to purge the introduced
SF genes. Diagnostic molecular markers may substantially reduce these diffi-
culties in the future.
2. Introducing superior SI germplasm into the SF hybrid breeding materials, on the
other hand, does not cause reproduction problems since SF � SI crosses show
regular seed setting and in subsequent selfing generations, SF is ‘automatically’
fixed. However, a major problem arises from the high mutational load of
deleterious recessives carried by SI germplasm. This leads to high frequencies
of defective segregants during the selfing period and drastically reduces the
recovery of acceptable inbred lines. Marker-based introgression of individual
DC segments allows to largely circumvent this problem but is extremely expen-
sive (cf. Sect. 2).3. In hybrid breeding, materials need to be grouped into genetically distant gene
pools and selection is practiced within those pools (cf. Sect. 5.2.1). A
corresponding heterotic grouping of the SI materials allows to directly use
them for broadening the genetic base of the SF gene pools. However, for
maximizing progress in population breeding, the most promising strategy is to
merge all high-yielding heterotic groups, since the expected gain from selection
is higher in one genetically broad-based population than averaged across two or
more narrow-based gene pools. Thus, the population breeder has to decide
whether backing-up hybrid breeding or boosting population breeding should
be given highest priority.
In conclusion, integrating hybrid and population breeding in one comprehensive
breeding program is a major challenge requiring manifold further research efforts.
6 Major Achievements of Breeding
Intensive population as well as hybrid breeding is practised in all main rye-growing
countries. In Germany, hybrids cover about 70% of the total rye acreage ranging
from 50% to 90% depending on the region (Anonymous, 2006). Some of these
hybrids are also widely distributed in neighbouring countries. According to the
statutory German variety trials (‘Wertprufungen’), grain yields of the best hybrids
surpass those of the best population varieties by 15–20% (Fig. 8). From 1982 to
176 H.H. Geiger, T. Miedaner
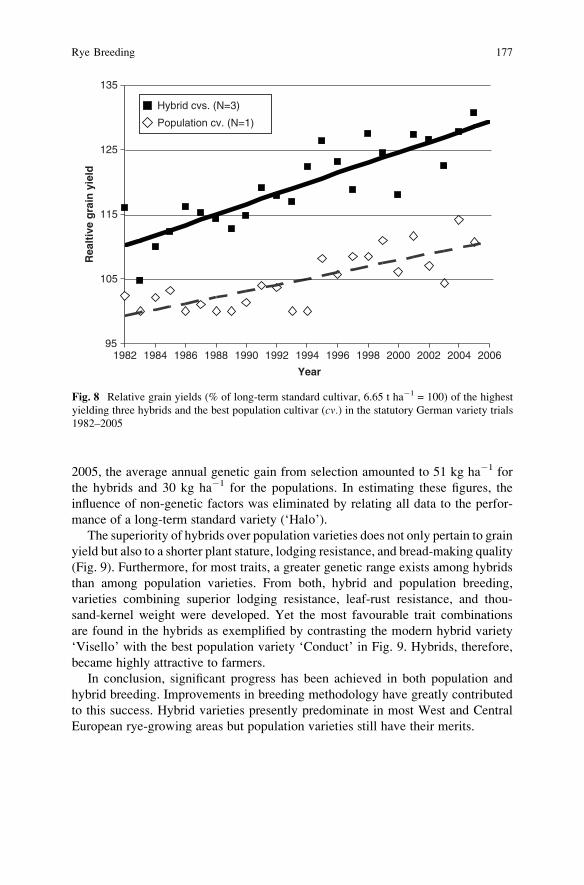
2005, the average annual genetic gain from selection amounted to 51 kg ha�1 for
the hybrids and 30 kg ha�1 for the populations. In estimating these figures, the
influence of non-genetic factors was eliminated by relating all data to the perfor-
mance of a long-term standard variety (‘Halo’).
The superiority of hybrids over population varieties does not only pertain to grain
yield but also to a shorter plant stature, lodging resistance, and bread-making quality
(Fig. 9). Furthermore, for most traits, a greater genetic range exists among hybrids
than among population varieties. From both, hybrid and population breeding,
varieties combining superior lodging resistance, leaf-rust resistance, and thou-
sand-kernel weight were developed. Yet the most favourable trait combinations
are found in the hybrids as exemplified by contrasting the modern hybrid variety
‘Visello’ with the best population variety ‘Conduct’ in Fig. 9. Hybrids, therefore,
became highly attractive to farmers.
In conclusion, significant progress has been achieved in both population and
hybrid breeding. Improvements in breeding methodology have greatly contributed
to this success. Hybrid varieties presently predominate in most West and Central
European rye-growing areas but population varieties still have their merits.
95
105
115
125
135
Year
Rea
ltiv
e g
rain
yie
ld
Hybrid cvs. (N=3)
Population cv. (N=1)
1982 1984 1986 1988 1990 1992 1994 1996 1998 2000 2002 2004 2006
Fig. 8 Relative grain yields (% of long-term standard cultivar, 6.65 t ha�1 = 100) of the highest
yielding three hybrids and the best population cultivar (cv.) in the statutory German variety trials
1982–2005
Rye Breeding 177
References
Adolf, K. and Winkel, A. (1985) A new source of spontaneous sterility in winter rye – preliminary
results. In: Proceedings of Eucarpia Meeting of the Cereal Section on Rye. 11–13 June 1985,
Svalov, Sweden, pp. 293–306.
Altpeter, F. and Korzun, V. (2007) Rye. In: E.C. Pua and M.R. Davey (Eds.), Biotechnology in
Agriculture and Forestry, Vol. 59, Transgenic Crops IV. Springer Berlin, Heidelberg,
Germany, pp. 107–117.
Anonymous (2006) Erntebericht zur Qualitat des deutschen Roggens. Bundesforschungsanstalt fur
Ernahrung und Lebensmittel (BfEL), Institut fur Getreide, Kartoffel- und Starketechnologie,
Detmold, Germany.
Becker, H.C., Geiger, H.H. and Morgenstern, K. (1982) Performance and phenotypic stability of
different hybrid types in winter rye. Crop Sci. 22, 340–344.
Boros, D. (2007) Quality aspects of rye for feed purposes. In: Proceedings of International
Symposium on Rye Breeding & Genetics. 28–30 June 2006, Groß Lusewitz, Germany,
Vortr. Pflanzenzuechtg. 71, 80–85.
Crow, J.F. and Kimura, M. (1970) An Introduction to Population Genetics Theory. Harper and
Row, New York.
de Vicente, M.C. and Tanksley S.D. (1993) QTL analysis of transgressive segregation in an
interspecific tomato cross. Genetics 134, 585–596.
Eshed, Y., Abu-Abied, M., Saranga, Y. and Zamir, D. (1992) A genome-wide search for wild-
species alleles that increase horticultural yield of processing tomatoes. Theor. Appl. Genet. 93,
877–886.
1 2 3 4 5 6 7 8 9
Plant height
Lodging
Leaf rust
Grain yield
1000-grainweight
Falling number
Protein content
Expression scale (1-9)
Fig. 9 Range of important traits (on a 1–9 scale) of 17 hybrid varieties (bold line) and 11 open-
pollinated varieties (broken line) contained in the German Recommended List 2006. Filled
triangles refer to the best hybrid variety (‘Visello’) and open triangles to the best population
variety (‘Conduct’)
178 H.H. Geiger, T. Miedaner
Falke, K.C., Susic, Z., Hackauf, B., Korzun, V., Schondelmaier, J., Wilde, P., Wehling, P.,
Wortmann, H., Mank, J., Rouppe van der Voort, J., Maurer, H., Miedaner, T. and Geiger, H.
H. (2008) Establishment of introgression libraries in hybrid rye (Secale cereale L.) from an
Iranian primitive rye accession as a new tool for rye breeding and genomics. Theor Appl Genet
117, 641–652.
Falke, K.C., Wilde, P. and Miedaner, T. (2009) Rye introgression lines as source of alleles for
pollen-fertility restoration in Pampa CMS. Plant Breed (in press).
FAO (2006) FAOSTAT database. Internet resource: http://faostat.fao.org/site/567/default.aspx
(verified Jan 18, 2007).
Flehinghaus-Roux, T., Deimling, S. and Geiger, H.H. (1995) Anther-culture ability in Secalecerale L. Plant Breed. 114, 259–261.
Feil, B. and Schmid, J.E. (2002) Dispersal of maize, wheat and rye pollen: A contribution to
determining the necessary isolation distances for cultivation of transgenic crops. Shaker,
Aachen.
Geiger, H.H. (1972) Wiederherstellung der Pollenfertilitat in cytoplasmatisch mannlich sterilem
Roggen. Theor. Appl. Genet. 42, 32–33.
Geiger, H.H. (1982) Zuchtung synthetischer Sorten. III. Einfluß der Vermehrungsgeneration und
des Selbstungsanteils. Vortr. Pflanzenzuchtung 1, 41–72.
Geiger, H.H. (1988) Epistasis and heterosis. In: B.S. Weir (Ed.), Proceeding of Second Interna-
tional Conference on Quantitative Genetics. 31 May – 5 June 1987, Raleigh, NC, Sinauer
Assoc. Inc., Sunderland, MA, USA, pp. 395–399.
Geiger, H.H., Schumacher, A.E. and Billenkamp, N. (1988) Haufigkeiten von vertikalen Resis-
tenzen und Virulenzen im Roggen-Mehltau-Pathosystem. Vortr. Pflanzenzuchtung 13, 5–17.
Geiger, H.H. (2006) Strategies of hybrid rye breeding. In: Proceedings of International Sympo-
sium on Rye Breeding & Genetics. 28–30 June 2006, Groß Lusewitz, Germany, p. 16.
Geiger, H.H. and Schnell, F.W. (1970) Cytoplasmic male sterility in rye (Secale cereale L.). CropSci. 10, 590–593.
Geiger, H.H., Yuan, Y., Miedaner, T. and Wilde, P. (1995) Environmental sensitivity of cytoplas-
mic genic male sterility (CMS) in Secale cereale L. In: U. Kuck and G. Wricke (Eds.), Genetic
Mechanisms for Hybrid Breeding. Adv. Plant Breed. 18, 7–17.
Geiger, H.H. and Miedaner, T. (1999) Hybrid rye and heterosis. In: J.G. Coors and S. Pandey
(Eds.), Genetics and Exploitation of Heterosis in Crops. Crop Science Society. America,
Madison, Wisconsin, USA, pp. 439–450.
Gordillo, G.A. and Geiger, H.H. (2008a) Optimization of DH-line based recurrent selection
procedures in maize under a restricted annual loss of genetic variance. Euphytica, 161,
141–154.
Gordillo, A., and Geiger, H.H. (2008b) Alternative recurrent selection strategies using doubled
haploid lines in maize breeding. Crop Sci. 48: 911–922.
Hackauf, B. andWehling, P. (2002) Identification of microsatellite polymorphisms in an expressed
portion of the rye genome. Plant Breed. 121, 17–25.
Haussmann, B.I.G., Parzies, H.K., Presterl, T., Susic, Z. and Miedaner, T. (2004) Plant genetic
resources in crop improvement (Review). Plant Genet. Resour. 2, 3–21.
Hepting, L. (1978) Analyse eines 7 � 7-Sortendialles zur Ermittlung geeigneten Ausgangsmater-
ials fur die Hybridzuchtung bei Roggen. Z. Pflanzenzuchtg. 80, 188–197.
Kastirr, U., Wortmann, H., Schmiedchen, B., Rabenstein, F. and Kuhne, T. (2006) Occurrence of
soil-borne viruses in rye and prospects for improving resistance to these viruses. In: Proceed-
ings of International Symposium on Rye Breeding & Genetics. 28–30 June 2006, Groß
Lusewitz, Germany, p. 34.
Klyuchko, P.F. and Belousov, A.A. (1972) Results of a genetic study of cytoplasmic male sterility
in winter rye (in Russian). Genetika 8(7), 9–15.
Kobyljanskij, V.D. (1971) The production of sterile analogues of winter rye, sterility, maintainers
and fertility restorers (in Russian). Tr. Prikl. Bot. Genet. Sel. 44, 76–85.
Rye Breeding 179
Lamkey, K.R. and Edwards, J.W. (1999) Quantitative genetics of heterosis. In: J.G. Coors and
S. Pandey (Eds.), The Genetics and Exploitation of Heterosis in Crops. ASA, CSSA, SSSA,
Madison, WI, pp. 31–48.
Łapinski, M. (1972) Cytoplasmic-genic type of male sterility in Secale montanum Guss. Wheat
Inf. Serv. 35, 25–28.
Łapinski, M. and Stojałowski, S. (2001) Occurrence of male sterility-inducing cytoplasm in rye
(Secale spp.) populations. Pl. Breed. Seed Sci. 48(2), 7–23.
Lundqvist, A. (1956) Self-incompatibility in rye. I. Genetic control in the diploid. Hereditas 42,
293–348.
Madej, L. (1976) The genetical characteristics of three sources of male sterility in rye (Secalecereale L.). Hod. Rosl. Aklim. i Nasienn., Warszawa 20, 157–174.
Madej, L., Raczynska-Bojanowska, K. and Rybka, K. (1990) Variability of the content of soluble
non-digestible polysaccharides in rye inbred lines. Plant Breed. 104, 334–339.
Miedaner, T. and Geiger, H.H. (1996) Estimates of combining ability for resistance of winter rye
to Fusarium culmorum head blight. Euphytica 89, 339–344.
Miedaner, T., Ludwig, W.F. and Geiger, H.H. (1995) Inheritance of foot rot resistance in winter
rye. Crop Sci. 35, 388–393.
Miedaner, T., Glass, C., Dreyer, F., Wilde, P., Wortmann, H. and Geiger, H.H. (2000) Mapping of
genes for male-fertility restoration in ‘Pampa’ CMS winter rye (Secale cereale L.). Theor.
Appl. Genet. 101, 1226–1233.
Miedaner, T., Gey, A.-K., Sperling, U. and Geiger, H.H. (2002) Quantitative-genetic analysis of
leaf-rust resistance in seedling and adult-plant stages of inbred lines and their testcrosses in
winter rye. Plant Breed. 121, 475–479.
Miedaner, T., Wortmann, H. and Geiger, H.H. (2003) Genetics of deoxynivalenol (DON) contam-
ination caused by Fusarium head blight in hybrid rye. Pl. Breed. Seed Sci. 48, 69–78.
Miedaner, T., Wilde, P. and Wortmann, H. (2005) Combining ability of non-adapted sources for
male-fertility restoration in Pampa CMS of hybrid rye. Plant Breed. 124, 39–43.
Miedaner, T., Susic, Z., Seggl, A., Hackauf, B., Korzun, V., Schondelmaier, J., Wilde, P.,
Wortmann, H., Rouppe van der Voort, J., Wehling, P. and Geiger, H.H. (2006) Entwicklung
und Evaluierung einer Introgressionsbibliothek bei Roggen. Ber. Tag. Vereinig. Pflanzenzuch-
ter und Saatgutkaufleute Osterreichs, Gumpenstein/Austria 57: Im Druck.
Mirdita, V. (2006). Genetische Variation fur Resistenz gegen Mutterkorn (Claviceps purpurea[Fr.] Tul.) bei selbstinkompatiblen und selbstfertilen Roggenpopulationen. Diss. Univ. Hohen-
heim. Internet resource: http://www.uni-hohenheim.de/ub/opus/volltexte/2006/148/ (verified
Jan 08, 2007).
Mirdita, V., Dhillon, B.S., Geiger, H.H. andMicdaner, T. (2008) Genetic variation for resistance to
ergot (Claviceps purpurea [Fr.] Tul.) among full-sib families of winter rye (Secale cereale L.).Theor. Appl. Genet. 118, 85–90.
Nalborczyk, E., Nalborczyk, T. and Wawrzonowska, B. (1981) Models of photosynthetic activity
in cereals. In: G. Akoyunoglou (Ed.), Photosynthesis VI. Photosynthesis and Productivity,
Photosynthesis and Environment, pp. 97–105. Balaban International Science Services,
Philadelphia, Pa.
Ossent, H.P. (1938) Zehn Jahre Roggenzuchtung in Muncheberg. Zuchter 10, 255–261.
Persson, K. and von Bothmer, R. (2000) Assessing the allozyme variation in cultivars and Swedish
landraces of rye (Secale cereale L.). Hereditas 132, 7–17.Persson, K., von Bothmer, R., Gullord, M. and Gunnarsson, E. (2006) Phenotypic variation and
relationships in landraces and improved varieties of rye (Secale cereale L.) from northern
Europe. Genet. Resour. Crop Evol. 53 (4), 857–866.
Podyma, W. (2003) Rye genetic resources in Europe. Pl. Breed. Seed Sci. 48 (2/2), 37–44.
Rode, J., Schumann, E., Weber, E., Wilde, P. and Wortmann, H. (2005) Rye breeding for
bioethanole production. Proceedings of 11th International Conference On Renewable
Resources and Plant Biotechnology. NAROSSA, 06–07 June 2005, Poznan, Polen.
180 H.H. Geiger, T. Miedaner
Roux, S.R., Miedaner, T., Geiger, H.H., Knopf, E., Wilde, P. andWortmann, H. (2003) Combining
ability vs. population performance of genetic resources in rye. Pl. Breed. Seed Sci. 48, 45–48.
Schnell, F.W. (1982) A synoptic study of the methods and categories of plant breeding. Z.
Pflanzenzuchtg. 89, 1–18.
Singh, R.K., Geiger, H.H., Diener, C. and Morgenstern, K. (1984) Effect of number of parents and
synthetic generation on the performance of self-incompatible and self-fertile rye populations.
Crop Sci. 24, 306–309.
Stojałowski, S., Łapinski, M. andMasojc, P. (2004) RAPDmarkers linked with restorer genes for the
C-source of cytoplasmic male sterility in rye (Secale cereale L.). Plant Breed. 123, 428–433.Stracke, S., Schilling, A.G., Forster, J., Weiss, C., Glass, C., Miedaner, T. and Geiger, H.H. (2003)
Development of PCR-based markers linked to dominant genes for male-fertility restoration in
Pampa CMS of rye (Secale cereale L.). Theor. Appl. Genet. 106, 1184–1190.Susic, Z. (2005). Experimental and simulation studies on introgressing genomic segments from
exotic into elite germplasm of rye (Secale cereale L.) by marker-assisted backcrossing. Ph.D.
thesis, University of Hohenheim, Germany.
Tanksley, S.D. and Nelson, J.C. (1996) Advanced backcross QTL analysis: a method for the
simultaneous discovery and transfer of valuable QTL from unadapted germplasm into elite
breeding lines. Theor. Appl. Genet. 92, 191–203.
Tenhola-Roininen, T., Immonen, S. and Tanhuanpaa, P. (2006) Rye doubled haploids as a research
and breeding tool – a practical point of view. Plant Breed. 125, 584–590.
Tomerius, A. (2001) Optimizing the development of seed-parent lines in hybrid rye breeding.
Diss. Univ. Hohenheim, Stuttgart. Internet resource: http://www.uni-hohenheim.de/ub/opus/
volltexte/2001/10/ (verified Jan 08, 2007).
Tomerius, A., Miedaner, T. and Geiger, H.H. (2008) A model calculation approach towords the
optimization of a standard scheme of seed-parent line development in hybrid rye breeding.
Plant Breed. 127, 433–440.
Walsh, B. (2004) Population- and quantitative-genetic models of selection limits. Plant Breed.
Rev. 24, 177–225.
Wehmann, F., Geiger, H.H. and Loock, A. (1991) Quantitative-genetic basis of sprouting resis-
tance in rye. Plant Breed. 106, 196–203.
Wilde, K., Geiger, H.H. and Miedaner, T. (2006) Significance of host complexity and diversity for
race-specific leaf-rust resistance in self-fertile synthetic rye populations. Plant Breed. 125,
225–230.
Wilde, F., Korzun, V., Ebmeyer, E., Geiger, H.H. and Miedaner, T. (2007) Comparison of
phenotypic and marker-based selection for Fusarium head blight resistance and DON content
in spring wheat. Mol. Breed. 19, 357–370.
Winkel, A., Muller, H.W. and Gabow, G. (1979) Uber die gegenwartigen Moglichkeiten zur
Schaffung von Hybridsorten und zur Nutzung von Sterilitatssystemen in der Roggenzuchtung.
Tag.-Ber., Akad. Landwirtsch.-Wiss. DDR, Berlin 168, 171–177.
Wolski, T. (1970) Studies on breeding of rye. Genetica Pol., Warszawa/Poznan 11, 1–26.
Wricke, G. (1969) Untersuchungen zur Vererbung der Selbstfertilitat beim Roggen (Secalecereale). Theor. Appl. Genet. 39, 371–378.
Wricke, G. (1978) Pseudo-Selbstkompatibilitat beim Roggen und ihre Ausnutzung in der Zuch-
tung. Z. Pflanzenzuchtg. 81, 140–148.
Wricke, G. (1979) Degree of self-fertilization under free pollination in rye populations containing
self-fertility gene. Z. Pflanzenzuchtg. 82, 281–285.
Wricke, G. and Weber, W.E. (1986) Quantitative Genetics and Selection in Plant Breeding.
deGruyter, Berlin.
Zamir, D. (2001) Improving plant breeding with exotic genetic libraries. Nat. Rev. Genet. 2,
983–989.
Rye Breeding 181
Grain Sorghum Breeding
Robert G. Henzell and David R. Jordan
Abstract Grain sorghum [Sorghum bicolor (L.) Moench] is a relatively drought-
and heat-resistant crop. World wide it is used as feed and food grain. In Australia, it
is used as a feed grain and is grown under rain-fed conditions. Water availability to
the plant is the major constraint to production. This chapter describes aspects of the
Department of Primary Industries and Fisheries sorghum breeding program. The
overall aim of this program is the development of germplasm which is licensed to
the private sector for the development of hybrid cultivars and use in their breeding
programs. This latter aspect has ensured program focus and the ready adoption by
industry of program products. The specific objectives of the program are the
development of germplasm with resistance to the sorghum midge, drought resis-
tance (stay-green) and yield. High levels of midge resistance have been developed
and combined with significant levels of stay-green and improved yield under
Australian conditions.
1 Introduction
Sorghum bicolor (L.) Moench is a relatively drought- and heat-resistant cereal crop.
In developed countries, it is used as a feed grain and for food and feed in the less
developed countries such as Africa and Asia. World wide its importance is likely to
increase because of the pressure on reliable food and animal feed supply, the latter
due in part, to a world population becoming more reliant on animal protein.
Sorghum’s relative drought and heat resistance may also increase its importance
world wide if the predicted effects of global warming come to pass. Additionally,
sorghum has a wide variety of other uses including beverages, building materials,
fuel (particularly in regions denuded of wood), ethanol production, broom produc-
tion and many others.
Cultivars are either inbreds or hybrids in the underdeveloped countries and F1
hybrids in the more developed countries. The cytoplasmic-nuclear male sterility
R.G. Henzell(*)
Department of Primary Industries and Fisheries, Hermitage Research Station, MS 508,
Warwic Q4370, Australia, e-mail: [email protected]
M.J. Carena (ed.), Cereals,DOI: 10.1007/978-0-387-72297-9, # Springer Science + Business Media, LLC 2009 183
system used to facilitate the production of hybrid cultivars was reported by
Stephens and Holland (1964) and resulted from the interaction between the A1
cytoplasm from the durra race (see later Taxonomy section) and the non-restorer
genes from the kafir race.
The nuclear genetics of this system was reviewed by Rooney (2000). Other
cytoplasmic-nuclear systems were reported by Schertz (1983).
In Australia, grain sorghum is grown on approximately 0.8 Mha with an average
yield of 2.6 t/ha. It is grown under dryland conditions in an environment that is
characterised by water stress particularly during grain fill.
2 Origin of Sorghum bicolor (L.) Moench
Harlan and De Wet (1971) have an excellent discussion on the origin and domesti-
cation of Sorghum bicolor (L.) Moench. It is generally agreed that S. bicolororiginated and was domesticated in the Sub-Saharan region of Africa and spread
to India and China. It is likely that the Sub-Saharan and north east regions of Africa
(particularly Ethiopia and Sudan) are the primary centres of origin and diversity and
that India and China are secondary centres. A tertiary pool of diversity is considered
to be the 19 wild species indigenous primarily to Australia, but also to South East
Asia and Africa (Lazarides et al., 1991). It is also generally agreed that S. bicolor (L.)Moench spp bicolor [later and above referred to as Sorghum bicolor (L.) Moench]
was derived from the wild species S. bicolor spp verticilliflorum and S. bicolorspp drummondii in Africa and from S.halepense and S. propinquum in Asia.
3 Taxonomy of the Genus Sorghum
Doggett (1988) and Dahlberg (2000) have comprehensive discussions on the
classification of sorghum. Their papers form the basis of the following discussion
along with some key publications for further reading. It is common that there
are variable interpretations of taxonomic literature and that for sorghum is no
exception.
Sorghum (described by Linnaeus in 1773 and named by Moench in 1794)
belongs to the Family Poaceae, Tribe Andropogoneae, which consists of 16 sub-
tribes, one of which is Sorghastrae (Stapf, 1917; Garber, 1950). Garber (1950)
considered this sub-tribe comprised two main genera, Cleistachne and Sorghum.Snowden (1935, 1936) and Garber (1950) suggested that the genus Sorghumcomprises six sub-genera.
This discussion relates only to the species Sorghum bicolor (L.) Moench sub-
genus Sorghum. All grain sorghums are in this species.
The genetic diversity within S. bicolor (L.) Moench forms the basis of the
thousands of years’ natural and farmer/user selection and the grain and forage sorghum
breeding programs that have occurred internationally during the last century. The
cultivated taxa were first grouped into 28 species by Snowden (1936). Classification
184 R.G. Henzell, D.R. Jordan
schemes since then have all been based on his historic work. These 28 species
were grouped into S. bicolor (L.) Moench for logistical reasons and because there
are no reproductive barriers between any of the Snowden species.
Later all named S. bicolor (L.) Moench accessions were first grouped into
working groups (WG) by Murty and Govil (1967) and later into five races and
ten intermediate groups by Harlan and de Wet (1972). This grouping was based on
plant phenotype and has proved to capture a major part of the genetic diversity in
the species. Hence, this grouping, particularly grouping on the basis of race, proved
very useful for breeders. The five races are bicolor, kafir, caudatum, durra and
guinea.
4 Cytogenetics and Genetics of S. bicolor (L.) Moench
The cytogenetics and nuclear genetics of S. bicolor has recently been reviewed by
Rooney (2000). Conclusions are that it is a diploidised tetraploid with a basic
chromosome number of 5. However, more recent molecular evidence (Sprangler
et al., 1999) suggests it may be a diploid with n = 10 chromosomes. From the point
of view of an applied breeder, sorghum is treated as a diploid.
Sorghum has extensive structural genomic resources such as dense genetic
marker maps, back libraries, physical maps and a large quantity of sequence
information. The full sequence of the sorghum genome was made available to
researchers in soon.
Numerous QTL studies have been carried out to elucidate the genetic architec-
ture of important traits. However, internationally, the use of molecular marker
technology in applied breeding programs has been limited.
5 Sources of Genetic Diversity
There is a large amount of genetic diversity in this species, many accessions of
which have been classified, characterised and evaluated although there are major
gaps, especially for multigenic traits (Rosenow and Dahlberg, 2000). Most of this
diversity is represented in land races from Africa, India and China. The large
number of accessions in the 122 collections reported in the IPGRI data base in
2006 presents a challenge for sorghum breeders who can work on only a portion of
these. A core collection (10%) has been developed at ICRISAT on the basis of
country of origin and phenotypic. Deu et al. (2006) and de Oliveira et al. (1996)
have written two papers where molecular markers have been used in an attempt to
measure genetic diversity in landraces. In general, markers are effective in describ-
ing locality of collection diversity but also to a lesser degree discriminating
amongst races. Also, the USDA-ARS/Texas A&M University’s Sorghum Conver-
sion Program (Stephens et al., 1967) has been a fruitful source of much of the
Grain Sorghum Breeding 185
germplasm used in breeding programs in Australia and elsewhere. The sorghum
conversion program is a pre-breeding exercise where dwarfing and photoperiod
insensitivity genes are backcrossed into exotic lines which are tall, photoperiod
sensitive. Substitution of the major genes controlling these traits greatly enhances
the ease with which this genetic diversity can be used by breeding programs
targeting subtropical and temperate environments where mechanical harvesting
is used.
6 Sorghum Breeding in Australia
In this chapter, we describe the approaches used and results achieved by a sorghum
breeding program conducted by the Department of Primary Industries and Fisheries
(DPI&F) in Queensland. The objective of most plant breeding programs is to
produce cultivars that are grown commercially by farmers. In contrast, germplasm
enhancement programs aim to develop lines or populations which have been
improved for particular characteristics that can then be used in breeding programs
as parent material.
In Australia, there are four private sector programs which provide all of the
commercially used cultivars (F1 hybrids). The DPI&F breeding program is the only
current public sector program in Australia and it operates as a germplasm enhance-
ment program providing strategic breeding services to the sorghum industry. The
public sector and the private sector programs have complementary roles and work
closely together. The DPI&F program’s role is the development of germplasm
which is licensed to the private sector for the development and sale of hybrid
cultivars.
The DPI&F program focuses on the assemblage of genes for important traits in a
relatively adapted genetic background with respect to grain yield. The latter is
achieved by testing the general combining ability for yield in a yield testing
program less rigorous than that for the identification of cultivars but sufficient to
eliminate poor combiners. The specific major objectives of the public program
include resistance to the sorghum midge, drought resistance (stay-green) and grain
yield. These objectives obviously reflect the major constraints to profitable grain
sorghum production in Australia.
6.1 Resistance to the Sorghum Midge (Stenodiplosis sorghicola[Coquillette])
The sorghum midge was a major constraint to the profitable production of grain
sorghum in Australia. The female midge deposits eggs in the spikelet at anthesis
and the larvae destroy the grain. Before host plant resistance, chemical control was
186 R.G. Henzell, D.R. Jordan
used resulting in an annual cost to industry of $A10 M (estimated in 1980). Our
midge resistance breeding program commenced in 1975 following the reporting of
germplasm with midge resistance (Johnson et al., 1973).
6.1.1 Mechanisms of Midge Resistance
Two major mechanisms of resistance have been reported – oviposition antixenosis
(Franzmann, 1993) and antibiosis (Sharma et al., 1993; Hardy et al., 2001; Tao
et al., 2003). The former mechanism results in fewer eggs being laid and the latter
results in death of the developing larvae before they damage the grain. The reasons
for these mechanisms are unknown, although it is suspected that spikelet structure
is implicated in the oviposition antixenosis mechanism, midge laying fewer eggs in
genotypes with small tightly appressed glumes. The reason for the antibiosis
mechanism is unknown. Oviposition antixenosis is the major mechanism used
and only recently has the antibiosis mechanism been incorporated in the breeding
program. It is likely that midge resistance will be durable because of the mechanism
of resistance and because the selection pressure on the insect will be reduced
because of the susceptible forage and weedy sorghums in the system. Resistance
also has an effect on the population dynamics (particularly population density) of
the sorghum midge.
6.1.2 Genetics of Midge Resistance
The genetics of the oviposition antixenosis mechanism is complex, reviewed by
Henzell et al. (1996). It is a polygenic trait that varies, amongst crosses, from
recessive to partially dominant and that both specific and general combining ability
are significant (Page, 1979) suggesting some diversity of resistance genes. This has
been supported by evidence of gene pyramiding in the breeding program.
A QTL mapping study by Tao et al. (2003) identified two QTLs for oviposition
antixenosis explaining a modest percentage of the genetic variation in a recombi-
nant inbred line population. One of these QTLs corresponds to a region under
selection from SC 165-14E, a source of resistance. Retrospective analysis of
pedigrees in our breeding program using molecular markers (Jordan et al., 2004)
shows that this chromosome region from the line SC 165-14E has been selected
through a number of cycles of phenotypic selection and crossing.
In contrast, the genetic architecture of the antibiosis mechanism may be rela-
tively simple with a single QTL explaining a large percentage of the phenotypic
variance (Tao et al., 2003).
6.1.3 Sources of Midge Resistance
The major sources of resistance used in the program are from the USDA-ARS/
Texas A&M University sorghum conversion program (Henzell et al., 1996). The
Grain Sorghum Breeding 187
key lines from the conversion program include TAM2566, SC 170-6, SC 173C, SC
165-14E, SC 108, each being race caudatum. Advanced lines from the Texas A&M
University sorghum breeding program were also used as were lines from ICRISAT
in India.
The ICRISAT line, ICSV745, has been used as the source of the antibiosis gene.
6.1.4 Breeding Methods for Midge Resistance
The pedigree and limited backcross methods have been employed to maintain local
adaptation while increasing resistance. The multigenic nature of midge resistance,
necessitated multiple cycles of crossing, evaluation, and selection of parents and
additional crossing to commence a new cycle with the occasional infusion of new
germplasm. Some parents were included on the basis of other traits, for example
grain yield and stay-green. The use of such midge susceptible germplasm obviously
slows progress in increasing midge resistance, but our approach has been to include
characters for local adaptation rather than to concentrate on midge resistance alone.
The biology of the sorghum midge creates considerable challenges for the plant
breeder. The life cycle of the midge is two weeks in summer with most of that time
being spent in juvenile form (egg, larvae or pupae) with adult midge living for only
a single day. Sorghum midge emerge from infected spikelets early in the morning,
mate and then the females lay their eggs in flowering sorghum spikelets. Only
florets that are actually flowering are vulnerable to infection by the midge. The
short lifespan, high reproductive rate and the short viability of the adult midge
results in large day-to-day variation in midge pressure. This is further complicated
by environmental factors such as wind, rainfall and temperature that have large
impacts on midge activity. Plants that vary in flowering time by one or two days can
experience very different midge pressures. As a result selection using conventional
field trials would result in low heritability and response to selection.
To counter this difficulty, a managed environment approach was used to increase
heritability in our selection environments by reducing day-to-day and seasonal
variation in midge pressure (Henzell et al., 1994). This approach involved pre-
planting of infector rows at regular temporal and spatial intervals throughout the
nursery increase the potential high midge populations and reduce day-to-day
variation. Individual panicles were marked with spray paint to indicate the day
they flowered. Midge damage is visually accessed on plants that flowered on a
particular day and compared with a set of check genotypes. This method allows for
the removal of temporal effects due to day-to-day midge pressure. This method
does not eliminate the possible confounding effect of visiting non-preference where
midge show preference for particular genotypes given choice but this preference is
not associated with resistance in a no choice environment. While preference can be
significant in some genotypes, the correlation between the field test where prefer-
ence is possible and the cage test, where it is not, is high (D. Butler and B.A.
Franzmann, personal communication).
188 R.G. Henzell, D.R. Jordan
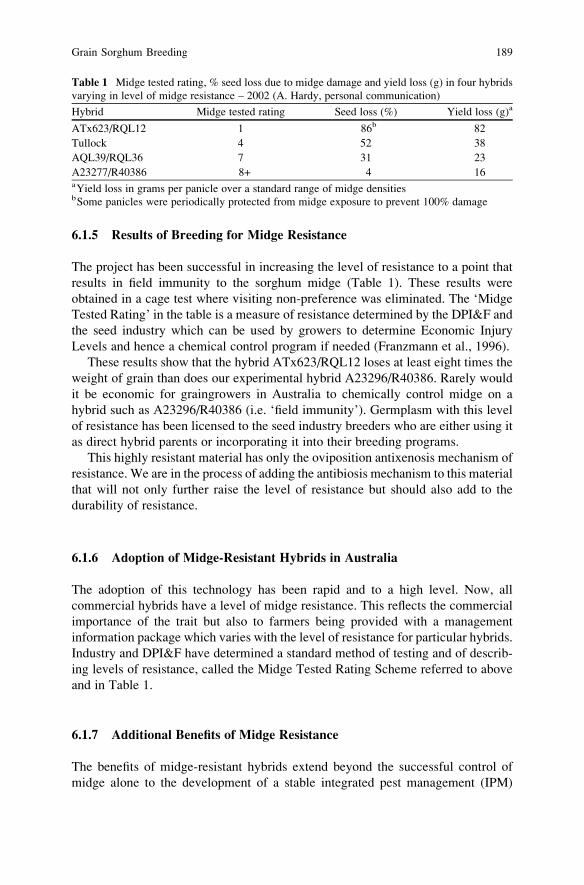
6.1.5 Results of Breeding for Midge Resistance
The project has been successful in increasing the level of resistance to a point that
results in field immunity to the sorghum midge (Table 1). These results were
obtained in a cage test where visiting non-preference was eliminated. The ‘Midge
Tested Rating’ in the table is a measure of resistance determined by the DPI&F and
the seed industry which can be used by growers to determine Economic Injury
Levels and hence a chemical control program if needed (Franzmann et al., 1996).
These results show that the hybrid ATx623/RQL12 loses at least eight times the
weight of grain than does our experimental hybrid A23296/R40386. Rarely would
it be economic for graingrowers in Australia to chemically control midge on a
hybrid such as A23296/R40386 (i.e. ‘field immunity’). Germplasm with this level
of resistance has been licensed to the seed industry breeders who are either using it
as direct hybrid parents or incorporating it into their breeding programs.
This highly resistant material has only the oviposition antixenosis mechanism of
resistance. We are in the process of adding the antibiosis mechanism to this material
that will not only further raise the level of resistance but should also add to the
durability of resistance.
6.1.6 Adoption of Midge-Resistant Hybrids in Australia
The adoption of this technology has been rapid and to a high level. Now, all
commercial hybrids have a level of midge resistance. This reflects the commercial
importance of the trait but also to farmers being provided with a management
information package which varies with the level of resistance for particular hybrids.
Industry and DPI&F have determined a standard method of testing and of describ-
ing levels of resistance, called the Midge Tested Rating Scheme referred to above
and in Table 1.
6.1.7 Additional Benefits of Midge Resistance
The benefits of midge-resistant hybrids extend beyond the successful control of
midge alone to the development of a stable integrated pest management (IPM)
Table 1 Midge tested rating, % seed loss due to midge damage and yield loss (g) in four hybrids
varying in level of midge resistance – 2002 (A. Hardy, personal communication)
Hybrid Midge tested rating Seed loss (%) Yield loss (g)a
ATx623/RQL12 1 86b 82
Tullock 4 52 38
AQL39/RQL36 7 31 23
A23277/R40386 8+ 4 16aYield loss in grams per panicle over a standard range of midge densitiesbSome panicles were periodically protected from midge exposure to prevent 100% damage
Grain Sorghum Breeding 189
strategy to control other major insect pests of sorghum, Helicoverpa armigera
(heliothis) and aphids. Additionally, a biological virus spray (NPV) is being used
in place of chemicals to control heliothis, now the most damaging insect pest of
grain sorghum in Australia (Murray et al., 2001). The value of beneficial insects in
controlling a wide range of insect pests is, in many cases, sufficient to reduce
infestations of heliothis and other insect pests such as aphids below economically
damaging levels (Murray et al., 2001). Reduced chemical usage also lessens the
threat of the development of insecticide resistance. The benefits of IPM-managed
midge-resistant hybrids are being exploited in regional or area-wide management
(AWM) of heliothis on the Darling Downs and elsewhere in Australia (Murray
et al., 2000). It is estimated that ongoing increased economic control of heliothis
and other insect pests in IPM-managed midge-resistant hybrids equates to $20/ha
(Hardy, unpublished data), while the additional environmental and marketing
benefits are significant.
7 Drought Resistance Breeding
Two distinctly different types of drought stress response have been identified and
described in sorghum depending on their incidence relative to anthesis (Rosenow
and Clark, 1981). The pre-anthesis response occurs between floral initiation and
anthesis while the post-anthesis response occurs during the grain filling period.
Much of Australia’s sorghum is grown in clay soils with a farming system that
utilises stored soil moisture. As a result post-anthesis drought stress is the predomi-
nant type of drought experienced by Australian sorghum crops. It has been this form
of drought resistance that has been targeted by our program.
Two strategies have been employed in the DPI&F sorghum breeding program
attempting to improve drought resistance: indirect selection for traits known to be
associated with yield under drought and direct selection for yield in drought
environments.
7.1 Indirect Selection for Drought Resistance
In contrast to most other cereals sorghum is a perennial crop grown as an annual and
if seasonal conditions permit the leaves and stem will remain green even as the
grains mature. Drought stress during the grain filling period leads to senescence of
the plant, reduced grain size, the invasion of the stem by a complex of fungi and
stalk lodging. The latter has a major impact on harvestable yield. Sorghum plants
which tend to retain more green leaf under this type of stress are said to have the
stay-green trait. The stay-green trait is a clear example of the successful use of
indirect selection for post-anthesis drought resistance breeding.
190 R.G. Henzell, D.R. Jordan
7.1.1 Stay-Green
Genotypes with stay-green were first reported in sorghum by Rosenow (1977).
Stay-green has been associated with higher grain yields under stress (Henzell et al.,
1992; Borrell et al., 1999; Jordan et al., 2003). It has also been associated with
lodging resistance (Rosenow et al., 1983) and larger grain size.
The strongest evidence for the value of the trait comes from a retrospective
analysis of 15 years of the DPI&F sorghum breeding trials that sampled 48
environments. This analysis indicated that stay-green was positively associated
with a best linear unbiased estimate of hybrid grain yield (Jordan et al., 2003).
Further analysis of this dataset showed that these environments could be classified
into two groups on the basis of G � E interactions. Stay-green was positively
associated with yield in one of these groups that contained environments where
post-anthesis drought stress was likely to have occurred. However, stay-green was
not associated either positively or negatively with grain yield in the other group
containing environments where post-anthesis drought is less frequent (unpublished
data). Importantly, this suggests that stay-green is not associated with low grain
yield in high yield environments.
7.1.2 Sources of Stay-Green
Rosenow et al. (1983) reported a number of stay-green genotypes. Testing in
Australia of these indicated B35 to be the best source of the trait. B35 is a partially
converted derivative of IS12655 a line collected in Ethiopia. QL12 is another
source of stay-green that has been used in our program. It is a derivative of KS19
which in turn is a derivative of the Nigerian line Short Kaura, the probable source of
QL12’s stay-green. Its stay-green is less strongly expressed but when combined in a
hybrid with B35 exhibits exceptional post-anthesis drought resistance (Borrell
et al., 2000).
7.1.3 Inheritance of and Molecular Markers for Stay-Green
Early studies on the inheritance of B35 stay-green were reviewed by Tao et al.
(2000) These ‘traditional’ studies suggest the trait is relatively simply inherited and
partially dominant. However, the marker work, internationally, also reviewed and
reported by Tao et al. (2000), suggested there are at least five regions associated
with the trait. However, Jordan et al. (2004), in a pedigree analysis study using
RFLP markers of the DPI&F program, found that there is one region associated
with stay-green that has been under strong phenotypic selection in the program.
This region was not identified in any of the QTLs found in the literature reviewed
by Tao et al. (2000).
Grain Sorghum Breeding 191
Selection will be much more efficient when validated markers are identified and
used because of its relatively low heritability. This is due to the expression of the
trait requiring specific environmental conditions that result in large genotype by
environment interactions.
Current work involves large-scale validation in a range of genetic backgrounds
to enable marker-assisted selection in our breeding program. At this stage all
selection for stay-green is based on phenotype.
7.1.4 Stay-Green Breeding Methodology
The pedigree and limited backcross methods have been used. As for midge resis-
tance, the approach has been to combine a number of traits including stay-green,
midge resistance, appropriate agronomic type (phenology and height) and grain
yield. The latter two traits being critical as a ‘stay-green’ like phenotype can be
generated by plants with low harvest index and variation in stay-green expression
can result from variation in phenology.
There are numerous genes involved, necessitating multiple cycles of crossing,
evaluation, and selection of parents and additional crossing to commence a new
cycle with the occasional infusion of new germplasm.
Only phenotypic selection has been used to date. This has proved to be reason-
ably effective because the trait is expressed in hybrid yield tests when post-anthesis
drought stress occurs.
7.1.5 Stay-Green Results
Progress has been made in transferring a moderate level of the trait from B35 to
otherwise locally adapted genotypes and combining this with a high level of midge
resistance. B35’s level of stay-green has not been recovered. There is a need to
increase the level of stay-green. Part of future stay-green breeding will involve
marker-assisted backcrossing of the validated markers for the region.
7.1.6 Adoption by Growers
At this time, the adoption of this technology is low because there are few ‘stay-
green’ commercial hybrids available and these have only a low level of stay-green.
Material with much higher levels of stay-green combined with high levels of midge
resistance are now in private breeding programs so it is reasonable to expect that the
real benefits of the trait will soon be available to graingrowers.
The annual value of this trait to industry when fully developed and adopted has
been estimated to be about $A30 M.
192 R.G. Henzell, D.R. Jordan
7.2 Direct Selection for Drought Resistance
The breeding methods used for breeding for midge resistance and stay-green
resulted in the narrowing of the genetic base in the DPI&F program (Jordan
et al., 1998). This, potentially, has at least two detrimental effects. One is a
reduction in the genetic variance and hence heritability for example for yield in
the breeding program gene pool. The other effect is a reduction in heterosis which,
in general, increases with the genetic diversity of the hybrid parents.
7.2.1 Increasing Genetic Diversity
A program to increase the genetic diversity in the gene pool was implemented. It is
anticipated that this will increase heritability. Initially, this was achieved by intro-
gressing putative genetic diversity using the pedigree breeding method. More
recently, a limited backcross method (BC1) has been used where the non-recurrent
parent introduces diversity and the recurrent parent is a proven source of midge
resistance and stay-green. Both methods have proven to be effective in increasing
yield while maintaining significant levels of midge resistance and stay-green. In the
case of the limited backcross method, hybrids have been produced, higher in yield
than that of the recurrent parent (Jordan et al., 2006).
At this stage, the non-recurrent parents are chosen not only on their proven
agronomic worth, but also on the basis of their suspected (e.g. on the basis of region
of collection and/or race) or known genetic diversity. Deu et al. (2006) and de
Oliveira et al. (1996) have shown that DNA markers allow a measure of genetic
diversity on the basis of their regional origin and to a lesser extent diversity
associated with taxonomic races. It has yet to be determined if diversity determined
with the marker systems used to date has any relation with diversity with respect to
important agronomic traits, many of which are multigenic in inheritance.
7.2.2 Defining the Target Population of Environments
In addition to increasing genetic diversity, other newer, technologies are being
tested in the program of directly selecting for drought resistance in Australia
(Borrell et al., 2006). In Australia, grain sorghum commonly experiences water
deficits even though it is normally grown in soils with relatively high water
holding capacity. The phenological timing, severity and duration of deficits varies
spatially (within and between tests) and temporally resulting in significant geno-
type by environment interactions, in turn resulting in low heritability for yield.
Differences in phenology and reaction to stress amongst the test genotypes add to
this complexity.
Methods of reducing the effects of genotype by environment interactions are
being employed. One such method involves defining the target population of
Grain Sorghum Breeding 193
environments – TPEs (Comstock, 1977; Borrell et al., 2006). On this basis and to
simplify TPEs for sorghum in Australia, Chapman et al. (2000) used a sorghum
crop growth model (Hammer and Muchow, 1994) and long-term weather and soils
data, to calculate a water stress index and grouped these by pattern analysis. This
approach not only identifies particular environment types but also indicates how
frequently these environment types occur in the TPE. Podlich and Cooper (1998)
suggested that genetic gain would be enhanced by using this information to weight
the data from individual tests depending on how frequently the environment of the
test occurred in the TPE. This method could also be used for selection for specific
adaptation to a particular pattern of water stress.
7.2.3 Statistical Methodology
Another tool is the use of newer statistical methodologies for spatial design and
analysis. It is common, particularly under stress conditions, that there are strong
spatial trends in the stress index within a test. This results in large error variances.
Newer methods have been developed and used to significantly improve this situa-
tion (Chan and Eccleston, 2003; Cullis and Gleeson, 1991; Gilmour et al., 1997).
Smith et al. (2001) reported a 6–46% increase in heritability for yield using these
techniques and Kelly (personal communication) reported an increase of 3–22% in
the genetic gain from DPI&F yield tests.
8 Conclusions
In this chapter, we have provided a description of a successful germplasm enhance-
ment program in sorghum. There is a diversity of sorghum breeding programs
world wide and we have presented only this program as a case study of a successful
germplasm enhancement exercise. The reasons for the success of the program in
making genetic progress have been the development of a good understanding of the
genetic architecture and biology of the traits in question. This allowed the develop-
ment of selection systems which maximised heritability either through increasing
genetic variability or by decreasing environmental variability or both. While the
program focused on particular traits, namely, stay-green and midge resistance,
considerable effort was made to ensure that adaptation to the target environment
was maintained via selection for acceptable performance in multi-environment
trials.
Future breeding sorghum breeding programs, including our own, will alter
markedly as new technologies such as whole genome marker screening, simulation
modelling and advances in statistical methods are adopted. However, some funda-
mental issues will remain such as the need to understand the genetic architecture
and biology of traits. This understanding allows appropriate and efficient breeding
methodologies to be developed.
194 R.G. Henzell, D.R. Jordan
Acknowledgements To the Department of Primary Industries and Fisheries, Queensland, and
the Grains Research and Development Corporation for financial support of the breeding
program. Also to Dr R.L. Brengman for the significant contribution he made to the program
during 1979 to 1996.
References
Borrell, A.K., Bidinger, F.R., and Sunitha, K. (1999) Stay-green associated with yield in recombi-
nant inbred sorghum lines varying in rate of leaf senescence. In: International Sorghum andMillets Newsletter. 40, 31–34.
Borrell, A.K., Hammer, G.L., and Henzell, R.G. (2000) Does maintaining green leaf area in
sorghum improve yield under drought? II. Dry matter partitioning and yield. Crop Science.40, 1037–1048.
Borrell, A.K., Jordan, D.R., Mullet, J., Henzell, R.G., and Hammer, G.L. (2006) Drought Adapta-
tion in Sorghum. In: Drought Adaptation in Cereals. The Hawath Press Inc. 335–399.
Chapman, S.C., Cooper, M.C., Hammer, G.L., and Butler, D.G. (2000) Genotype by environment
interactions affecting grain sorghum. II. Frequencies of different seasonal patterns of drought
stress are related to location effects on hybrid yields. Australian Journal of AgriculturalResearch. 57, 209–222.
Chan, B.S.P., and Eccleston, J.A. (2003) On the construction of nearest-neighbour balanced row-
column designs. Biometrics. 45, 97–106.Comstock, R.E. (1977) Quantitative genetics and the design of breeding programs. In: Proceed-
ings of the International Conference on Quantitative Genetics. 705–718. Ames, IA, Iowa State
University Press.
Cullis, B.R., and Gleeson, A.C. (1991) Spatial analysis of field experiments – an extension to two
dimensions. Biometrics. 47, 1449–1460.Dahlberg, J.A. (2000) Classification and characterization of Sorghum. In: C.W. Smith and R.A.
Frederiksen (Eds). Sorghum: origin, history, technology, and production. John Wiley & Sons,
Inc. New York, NY.
Deu, M., Rattunde, F., and Chantereau, J. (2006) A global view of genetic diversity in cultivated
sorghums using a core collection. Genome. 49, 168–180.de Oliveira, A.C., Richter, T., and Bennetzen, J.L. (1996) Regional and racial specificities in
sorghum germplasm assessed with DNA markers. Genome. 39, 579–587.de Wet, J.M.J., and Haran, J.R. (1971) The origin and domestication of Sorghum bicolor. Econ.
Bot. 25, 128–135.Doggett, H. (1988) Sorghum. 2nd. Ed. John Wiley & Sons, New York.
Franzmann, B.A. (1993) Ovipositional antixenosis to Contarinia sorghicola (Coquillett) (Diptera:
Cecidomyiidae). Journal of Australian Entomology Society. 32, 59–64.Franzmann, B.A., Butler, D.G., Henzell, R.G., Fletcher, D., and Cutler, J.H. (1996) A sorghum
industry scheme assigning midge resistance levels to commercial hybrids. In: M.A. Foale, R.G.
Henzell, and J.F. Kneipp (Eds). Proceedings of the Third Australian Sorghum Conference,Tamworth, 20–22 February 1996. Australian Institute of Agricultural Science, Melbourne,
Occasional Publication No. 93. pp. 359–363.
Garber, E.D. (1950) Cytotaxonomic studies in the genus Sorghum. University of California
Publications in Botany. 23, 283–361.
Gilmour, A.R., Cullis, B.R., and Verbyla, A.P. (1997) Accounting for natural and extraneous
variation in the analysis of field experiments. Journal of Agricultural Biological and Environ-mental Statistics. 2, 269–293.
Hardy, A.T., Tao, Y.Z., and Franzmann, B.A. (2001) New Host-Plant Resistance to the Sorghum
Midge in Grain Sorghum and the use of Molecular Marker Mediated Selection. In: A.K.
Grain Sorghum Breeding 195
Borrell, R.G. Henzell, and J.F. Kneipp (Eds). ‘Proceedings of 4th Australian Sorghum Confer-ence’, Kooralbyn, Gold Coast Hinterland, 5–8 February (CD Rom).
Hammer, G.L., and Muchow, R.C. (1994) Assessing climatic risk to sorghum production in water-
limited subtropical environment. I. Development and testing of a simulation model. FieldCrops Research. 36, 221–234.
Harlan, J.R., and deWet, M.J. (1971) The origin and domestication of Sorghum bicolor. Econ. Bot.25, 128–135.
Harlan, J.R., and de Wet, M.J. (1972) A simplified classification of cultivated sorghum. CropScience. 12, 172–176.
Henzell, R.G., Brengman, R.L., Fletcher, D.S., and McCosker, A.N. (1992) Relationship between
yield and non-senescence (stay-green) in some grain sorghum hybrids grown under terminal
drought stress. In: M.A. Foale, R.G. Henzell, and P.N. Vance. (Eds), Proceedings of the SecondAustralian Sorghum Conference. pp. 355–359. Gatton, February 4–6, 1992. Occasional Publi-
cation No.68, Melbourne: Australian Institute of Agricultural Science.
Henzell, R.G., Franzmann, B.A., and Brengman, R.L. (1994) Sorghum midge resistance research
in Australia. International Sorghum and Millets Newsletter. 35, 41–47.Henzell, R.G., Peterson, G.C., Teetes, G.L., Franzmann, B.A., Sharma, H.C., Youm, O., Ratna-
dass, A., Toure, A., Raab, J., and Ajayi, O. (1996) Breeding for resistance to panicle pests of
sorghum and pearl millet. In: Proceedings of the International Conference on Genetic Im-provement of Sorghum and Pearl Millet. September 23–27, Lubbock, Texas. pp. 481–489.
Johnson, J.W., Rosenow, D.T., and Teetes, G.L. (1973) Resistance to the sorghum midge in
converted exotic sorghum cultivars. Crop Science. 13, 174–175.Jordan, D.R., Tao, Y.Z., Godwin, I.D., Henzell, R.G., Cooper, M., and McIntyre, C.L. (1998) Loss
of genetic diversity associated with selection for resistance to sorghum midge in Australian
sorghum. Euphytica. 102, 1–7.Jordan, D.R., Tao, Y.Z., Godwin, I.D., Henzell, R.G., Cooper, M., and McIntyre, C.L. (2003)
Prediction of hybrid performance in grain sorghum using RFLP markers. Theoretical andApplied Genetics. 106, 559–567.
Jordan, D.R., Tao, Y.Z., Godwin, I.D., Henzell, R.G., Cooper, M., and McIntyre, C.L. (2004)
Comparison of identity by descent and identity by state for detecting genetic regions under
selection in a sorghum pedigree breeding program. Molecular Breeding. 14, 441–454.Jordan, D.R., Hammer, G.L., and Henzell, R.G. (2006) Breeding for yield in the DPI&F breeding
program. In: A.K. Borrell, R.G. Henzell, and D.R. Jordan. (Eds). Proceedings from the FifthAustralian Sorghum Conference. Gold Coast, Australia, 30-Jan to 2 Feb., 2006, CDROM
format, Range Media Pty. Ltd. ISGN; 0-6464673-0-1.
Lazarides, M., Hacker, J.B., and Andrew, M.H. (1991) Taxonomy, Cytology and Ecology of
Indigenous Australian Sorghums. (Sorghum Moench: Andropogoneae: Poaceae AustralianSystematic Botany. 4, 591–635.
Murty, B.R., and Govil, J.N. (1967) Description of 70 groups in genus sorghum based on a
modified Snowden classification. Indian Journal of Genetics. 27, 75–91.Murray, D., Miles, M., and Ferguson, J. (2000) Area-wide management of heliothis – results
of current studies. In: Proceedings of the Tenth Australian Cotton Conference, Brisbane.pp. 11–17.
Murray, D., Ferguson, J., Lloyd, R., Hopkinson, J., Maclean, S., and Powell, R. (2001) Advances
in heliothis management on grain sorghum in Australia. In: A.K. Borrell, R.G. Henzell, and J.F.
Kneipp (Eds). ‘Proceedings of 4th Australian Sorghum Conference’, Kooralbyn, Gold Coast
Hinterland, 5–8 February (CD Rom).
Page, F.D. (1979) Resistance to sorghum midge (Contarinia sorghicola Coquillet) in grain
sorghum. Australian Journal of Experimental Agriculture and Animal Husbandry. 19, 97–101.Podlich, D.W., and Cooper, M. (1998) QU-GENE: A simulation platform for quantitative analysis
of genetic models. Bioinformatics. 14, 623–653.Rooney, W.L. (2000) Genetics and cytogenetics. In: C.W. Smith and R.A. Frederiksen (Eds).
Sorghum: origin, history, technology, and production. JohnWiley & Sons, Inc. New York, NY.
196 R.G. Henzell, D.R. Jordan
Rosenow, D.T. (1977) Breeding for lodging resistance in sorghum. In: Proceedings of the 32rdCorn and Sorghum Research Conference 4, 171–185. DC: American Seed Trade Association.
Rosenow, D.T., and Clark, L.E. (1981) Drought tolerance in sorghum. In: Proceedings AnnualCorn and sorghum research Conference, December 9–11, 1981, Chicago, IL.
Rosenow, D.T., and Dahlberg, J.A. (2000) Collection, Conversion and Utilization of Sorghum. In:
C. Wayne Smith and A. Richard (Eds). Sorghum: origin, history, technology and production.
Frederiksen ISBN 0-471-24237-3 John Wiley and Son, Inc.
Rosenow, D.T., Quisenberry, J.E., Wendt, C.W., and Clark, L.E. (1983) Drought tolerant sorghum
and cotton germplasm. Agricultural Water Management. 7, 207–222.Schertz, K.F. (1983) Potentials with new cytoplasmic male sterility systems in sorghum. Proc.
Genet. Soc. Am. 38, 1–10.Sharma, H.C., Vidyasagar, P., and Subramanian, V. (1993) Antibiosis component of resistance in
sorghum to sorghum midge, Contarinia sorghicola. Annals Applied Biology. 123, 469–483.Smith, A.B., Cullis, B.R., and Thompson, R. (2001) Analysing variety by environment data using
multiplicative mixed models and adjustments for spatial field trend. Biometrics. 57, 1138–1147.Snowden, J.D. (1935) The classification of the cultivated Sorghums. Bull. Misc. Information,
No. 5. Royal Botanic Gardens, Kew, England. pp. 221–255.
Snowden, J.D. (1936) The cultivated races of Sorghum. Allard and Co., London.
Sprangler, R. Zaithik, B., Russo, E., and Kellogg, E. (1999) Andropogoneae Evolution and generic
Limits in Sorghum (Poaceae). Systematic Botany. 16, 279–299.Stapf, O. (1917) Flora of Tropical Africa. I. Reeve and Co. London.
Stephens, J.C., and Holland, R.F. (1964) Cytoplasmic male-sterility for hybrid seed production.
Agronomy Journal. 46, 20–25.Stephens, J.C., Miller, F.R., and Rosenow, D.T. (1967) Conversion of alien sorghums to early
combine genotypes. Crop Science. 7, 396.Tao, Y.Z., Henzell, R.G., Jordan, D.R., Butler, D.G., Kelly, A.M., and McIntyre, C.L. (2000)
Identification of genomic regions associated with stay-green in sorghum by testing RILs in
multiple environments. Theoretical and Applied Genetics. 100, 1225–1232.Tao, Y.Z., Hardy, A., Drenth, J., Henzell, R.G., Franzmann, B.A., Jordan, D.R., Butler, D.G., and
McIntyre, C.L. (2003) Identifications of two different mechanisms for sorghum midge resis-
tance through QTL mapping. Theoretical and Applied Genetics. 107, 116–122.
Grain Sorghum Breeding 197
Durum Wheat Breeding
Conxita Royo, Elias M. Elias, and Frank A. Manthey
Abstract This chapter summarizes the scientific and technical knowledge for
durum wheat breeding, giving some examples of the methods applied in national
programs. Section 1 refers to the importance of durum wheat in the world. Sections
2 and 3 give technical details on genetic diversity and the choice of germplasm,
while the main varietal groups are explained in Section 4. Information about the
major breeding achievements, current goals of breeding and breeding methods and
techniques are covered by Sections 5, 6 and 7 respectively. The integration of new
biotechnologies, particularly marker assisted selection, into breeding programs is
described on Section 8, while information about foundation seed production and
intellectual property rights are given on Section 9.
1 Introduction
Durum wheat [Triticum turgidum ssp. turgidum convar. durum (Desf.) MacKey] is
one of the oldest cultivated cereal species in the world. It is of great importance in
cereal areas of the Mediterranean Basin and North America, where the great bulk of
world production of this crop and land under cultivation with it are concentrated
(Table 1). The area annually planted with durum wheat worldwide is estimated to
be about 13.5 million ha, though it has shown a decreasing tendency since the 1970s
when it was close to 18 million ha (Belaid, 2000). The European Union devotes
around 3.5 million ha to its cultivation, with a production of around 9.2 million
metric tons. Canada is the second largest producer in the world and the greatest
exporter. Average global yields have increased from 1.4 t ha�1 during the 1970s to
more than 2 t ha�1 in recent years, leading to a great increase in total production.
However, a reduction in global production occurred in 2005 due to lower plantings
in the major EU durum-producing countries (Italy and Spain), combined with a
severe drought affecting growing areas in the Mediterranean Basin.
C. Royo(*)
IRTA (Institute for Food and Agricultural research and Technology) Generalitat de Catalunya,
Spain, Cereal Breeding, e-mail: [email protected]
M.J. Carena (ed.), Cereals,DOI: 10.1007/978/-0-387-72297-9, # Springer Science + Business Media, LLC 2009 199
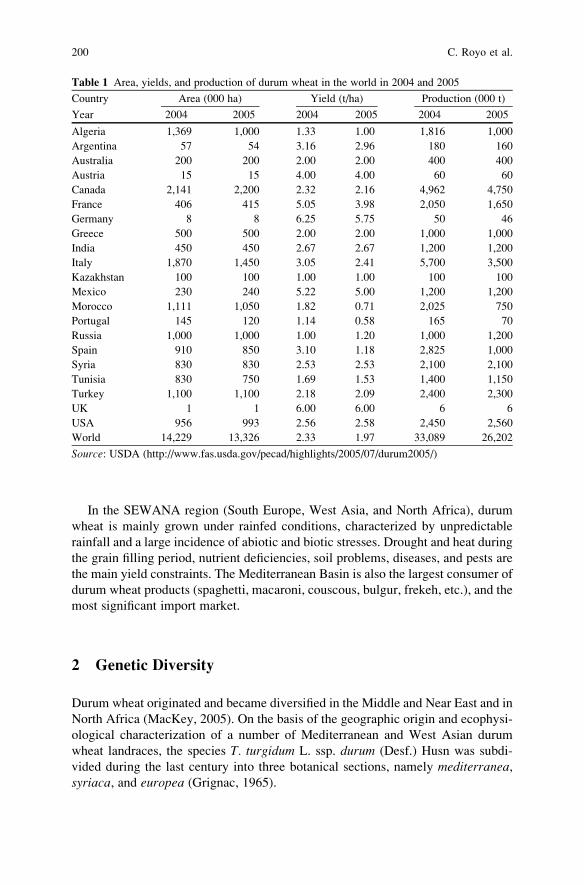
In the SEWANA region (South Europe, West Asia, and North Africa), durum
wheat is mainly grown under rainfed conditions, characterized by unpredictable
rainfall and a large incidence of abiotic and biotic stresses. Drought and heat during
the grain filling period, nutrient deficiencies, soil problems, diseases, and pests are
the main yield constraints. The Mediterranean Basin is also the largest consumer of
durum wheat products (spaghetti, macaroni, couscous, bulgur, frekeh, etc.), and the
most significant import market.
2 Genetic Diversity
Durum wheat originated and became diversified in the Middle and Near East and in
North Africa (MacKey, 2005). On the basis of the geographic origin and ecophysi-
ological characterization of a number of Mediterranean and West Asian durum
wheat landraces, the species T. turgidum L. ssp. durum (Desf.) Husn was subdi-
vided during the last century into three botanical sections, namely mediterranea,syriaca, and europea (Grignac, 1965).
Table 1 Area, yields, and production of durum wheat in the world in 2004 and 2005
Country Area (000 ha) Yield (t/ha) Production (000 t)
Year 2004 2005 2004 2005 2004 2005
Algeria 1,369 1,000 1.33 1.00 1,816 1,000
Argentina 57 54 3.16 2.96 180 160
Australia 200 200 2.00 2.00 400 400
Austria 15 15 4.00 4.00 60 60
Canada 2,141 2,200 2.32 2.16 4,962 4,750
France 406 415 5.05 3.98 2,050 1,650
Germany 8 8 6.25 5.75 50 46
Greece 500 500 2.00 2.00 1,000 1,000
India 450 450 2.67 2.67 1,200 1,200
Italy 1,870 1,450 3.05 2.41 5,700 3,500
Kazakhstan 100 100 1.00 1.00 100 100
Mexico 230 240 5.22 5.00 1,200 1,200
Morocco 1,111 1,050 1.82 0.71 2,025 750
Portugal 145 120 1.14 0.58 165 70
Russia 1,000 1,000 1.00 1.20 1,000 1,200
Spain 910 850 3.10 1.18 2,825 1,000
Syria 830 830 2.53 2.53 2,100 2,100
Tunisia 830 750 1.69 1.53 1,400 1,150
Turkey 1,100 1,100 2.18 2.09 2,400 2,300
UK 1 1 6.00 6.00 6 6
USA 956 993 2.56 2.58 2,450 2,560
World 14,229 13,326 2.33 1.97 33,089 26,202
Source: USDA (http://www.fas.usda.gov/pecad/highlights/2005/07/durum2005/)
200 C. Royo et al.
Recent studies indicate that the genetic diversity in durum wheat seems to be
structured, at least in part, according to a geographical pattern (Moragues et al., 2006,
2007; Maccaferri et al., 2005). In a study including durum wheat accessions from 22
countries, the widest genetic diversity within countries was found in the Indian
germplasm, while the lowest corresponded to the Bulgarian one (Pecetti et al.,
1992). A high level of diversity has also been found in germplasm from the Middle
East region (Yang et al., 1991), particularly Jordan (Rawashdeh et al., 2007), Turkey
(Akar and Ozgen, 2007), Iran, Egypt, Afghanistan, and Ethiopia (Asins and Carbo-
nell, 1989). The Ethiopian durum wheat seems to constitute a different pool from that
of other geographical regions (Pecetti et al., 1992). The Mediterranean genetic pool
appears to be different from the Southwest Asian (Moragues et al., 2006) and the
North American ones (Maccaferri et al., 2005), while gene pools from Syria and
Jordan seem to be closely related (Pecetti et al., 1992).
Durum wheat landraces, which were widely cultivated in the early twentieth
century, were later increasingly replaced by improved varieties. The introduction of
productive semi-dwarf cultivars resulted in the abandon of the genetically diverse,
locally well-adapted but unimproved landraces, and the extinction of on-farm
genetic variability. It has been suggested that the level of genetic diversity underlying
the successful modern varieties may have fallen due to the limited number of
ancestors, the relative uniformity of the pursued ideotype (Autrique et al., 1996;
Pecetti and Annicchiarico, 1998), the high selection pressure applied in breeding
programs, and the relatively small number of varieties currently in cultivation
(Skovmand et al., 2005). Pedigree analysis has revealed that, in some cases, the
genetic background of the modern pool of elite durum wheat varieties is narrow
(Maccaferri et al., 2005). A study including 51 cultivars derived from the CIMMYT/
ICARDA breeding program found that 15 ancestors were present in the pedigree of at
least 80% of the cultivars, 5 of them being present in all of them (Autrique et al.,
1996). Similarly, nine ancestors are present in the pedigree of more than half the
cultivars developed in Russia within the framework of various breeding programs
(Martynov et al., 2005). Moreover, Tunisian cultivars seem to be genetically more
similar than the old ones (Medini et al., 2005). The main risk of a narrowing of the
genetic background of the modern genetic pool is one of increased vulnerability to
diseases and pests (Frankel et al., 1995) and a fall in the abiotic stress tolerance,
particularly to the drought and high temperatures that are typical of many regions
growing durum wheat.
However, the results of several studies not only do not evidence an overall
decrease in the genetic diversity of durum wheat due to past breeding activities
(Martos et al., 2005) but even reveal that it is increasing over time as a result of the
introgression of genetic variability (Autrique et al., 1996; Maccaferri et al., 2003;
Martynov et al., 2005). CIMMYT and ICARDA, the two international centres
operating with durum wheat, have largely helped to widen the genetic pool of
current cultivars; shuttle breeding and germplasm exchange all around the world
have been key factors in creating the current overall variation in durum wheat.
Molecular analyses have revealed that the most recent CIMMYT-derived founders
are genetically distant from the old Mediterranean ones (Maccaferri et al., 2003).
Durum Wheat Breeding 201
Around 79,000 tetraploid and 253,000 unspecified Triticum accessions are
currently available in gene bank collections around the world (Skovmand et al.,
2005). The characterization of germplasm maintained in gene banks is crucial for
exploiting the existing genetic variability for traits of economic importance such as
yield, yield stability, grain quality, and tolerance to biotic and abiotic stresses.
Molecular genetic markers have proven to be a valuable tool for identifying
accessions containing genes and alleles of interest, frequently masked in undesir-
able phenotypes.
3 Choice of Germplasm
The first step in a breeding program consists in the creation of variability, usually by
hybridization, with the aim of accumulating enough genetic variation and providing
useful gene recombinations for the target traits in the progeny. The choice of
parents for crosses requires a priorization of the goals to be achieved by breeding,
and the collection and characterization of genetic sources carrying favourable
alleles for the target traits.
The parents to be used are usually chosen for their performance in terms of the main
breeding objectives: yield potential, end-use quality, and resistance to abiotic and biotic
stresses (Table 2). Crosses of elite � elite durum wheat adapted parents are usually
the choice when there is sufficient genetic variability within the species for the
target traits. However, when diversity within durum wheat is limited, other sources
of variation such as crosses with Triticeae relative species must be explored.
Crosses with bread wheat have been extensively used in durum wheat breeding to
introgress favourable alleles for many traits such as plant vigour, winter hardiness,
and fusarium head blight (FHB) tolerance. The Chinese bread wheat cultivar
‘Sumai 3’ has been widely used to incorporate tolerance to FHB into durum wheat.
Because of the low intraspecific genetic variability for drought tolerance in
durum wheat, some wild relatives such as T. turgidum ssp. dicoccoides and
T. urartu have been proposed as donors for drought resistance in prebreeding
programs (Kara et al., 2000; Valkoun, 2001). Other wild relatives such as Hordeumchilense (Forster et al., 1990) and Thinopyrum bessarabicum (King et al., 1997)
have been used to introgress tolerance to salinity in durum wheat (Mano and
Takeda, 1998; Colmer et al., 2006).
Most of the characteristics relevant for the agronomic performance of cultivars
are complex quantitative traits regulated by several genes. Genetic gains of grain
yield – the most common example of this kind of traits – have usually been
achieved after the Green Revolution by crossing a good number of high-yielding
parents with good combining ability. However, a large spectrum of genetic varia-
tion for yield components has been reported (Elias et al., 1996b). Genotypes with
extreme expression for the number of grains per spike, grains per spikelet, and spike
length have been developed from T. polonicum and other alien donors (Al-Hakimi
et al., 1997). An excellent review of wide crosses for durum wheat improvement
may be found in Mujeeb-Kazi (2005).
202 C. Royo et al.
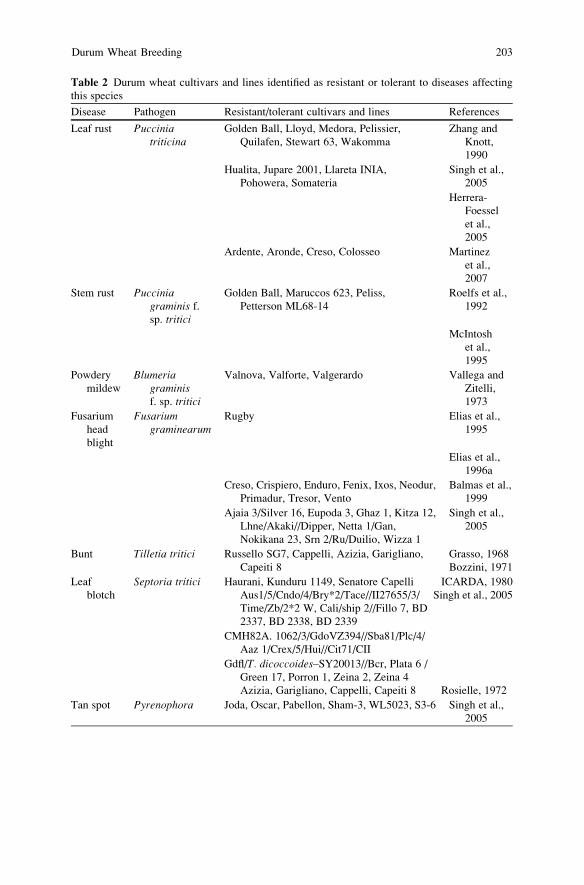
Table 2 Durum wheat cultivars and lines identified as resistant or tolerant to diseases affecting
this species
Disease Pathogen Resistant/tolerant cultivars and lines References
Leaf rust Pucciniatriticina
Golden Ball, Lloyd, Medora, Pelissier,
Quilafen, Stewart 63, Wakomma
Zhang and
Knott,
1990
Hualita, Jupare 2001, Llareta INIA,
Pohowera, Somateria
Singh et al.,
2005
Herrera-
Foessel
et al.,
2005
Ardente, Aronde, Creso, Colosseo Martinez
et al.,
2007
Stem rust Pucciniagraminis f.sp. tritici
Golden Ball, Maruccos 623, Peliss,
Petterson ML68-14
Roelfs et al.,
1992
McIntosh
et al.,
1995
Powdery
mildew
Blumeriagraminisf. sp. tritici
Valnova, Valforte, Valgerardo Vallega and
Zitelli,
1973
Fusarium
head
blight
Fusariumgraminearum
Rugby Elias et al.,
1995
Elias et al.,
1996a
Creso, Crispiero, Enduro, Fenix, Ixos, Neodur,
Primadur, Tresor, Vento
Balmas et al.,
1999
Ajaia 3/Silver 16, Eupoda 3, Ghaz 1, Kitza 12,
Lhne/Akaki//Dipper, Netta 1/Gan,
Nokikana 23, Srn 2/Ru/Duilio, Wizza 1
Singh et al.,
2005
Bunt Tilletia tritici Russello SG7, Cappelli, Azizia, Garigliano,
Capeiti 8
Grasso, 1968
Bozzini, 1971
Leaf
blotch
Septoria tritici Haurani, Kunduru 1149, Senatore Capelli
Aus1/5/Cndo/4/Bry*2/Tace//II27655/3/
Time/Zb/2*2 W, Cali/ship 2//Fillo 7, BD
2337, BD 2338, BD 2339
ICARDA, 1980
Singh et al., 2005
CMH82A. 1062/3/GdoVZ394//Sba81/Plc/4/
Aaz 1/Crex/5/Hui//Cit71/CII
Gdfl/T. dicoccoides–SY20013//Bcr, Plata 6 /
Green 17, Porron 1, Zeina 2, Zeina 4
Azizia, Garigliano, Cappelli, Capeiti 8 Rosielle, 1972
Tan spot Pyrenophora Joda, Oscar, Pabellon, Sham-3, WL5023, S3-6 Singh et al.,
2005
Durum Wheat Breeding 203
4 Varietal Groups
The genetic pools of durum wheat may be classified according to a pattern of
adaptability and geographical distribution. About 86% of the durum wheat
cultivated in the world has a spring growth habit, whereas the remaining 14% are
winter and facultative types, mostly restricted to the areas around the Mediterra-
nean, Black, and Caspian Seas (Palamarchuk, 2005). The following are some of the
most representative varietal groups:
4.1 The Italian Pool
The importance of durum wheat in Italy and the noteworthy breeding efforts
devoted from the beginning of the twentieth century to improving this species
make the Italian pool one of the most, if not the most, representative within the
Mediterranean Basin. Although other countries conducted breeding programs in the
early decades of the last century, Italy may be considered as a pioneer in durum
wheat improvement.
Numerous selections were obtained by Italian breeders during the early decades
of the twentieth century from a very large pool of Mediterranean landraces (Di
Fonzo et al., 2005). One of the most widely spread was the variety ‘Senatore
Capelli’, an ‘africanum’ type selected from the population ‘Jean Retifah’ from
Algeria that was released in 1915, used in further crosses and is still grown in some
areas (Di Fonzo et al., 2005). However, only small-yield increases were achieved at
the early times since most landraces were tall and very sensitive to lodging.
Breeding efforts resulted in the release of a number of improved varieties from
1950 to 1975. ‘Appulo’ and ‘Trinakria’ were two of the most outstanding varities,
due to their yielding ability, quality, and good adaptation to drought (Grifoni, 1964;
Ballatore, 1973). The varieties ‘Viscardo Montarani’, ‘Carlo Jucci’, and ‘Giovani
Raineri’ were obtained from crosses with hexaploid wheat aiming to enhance the
number of fertile florets per spikelet. Research on mutation breeding as a way to
induce shorter plants with strong straw resulted in the selection of lines with higher
yielding ability and short straw such as ‘Castelporziano’ and ‘Castelfusano’,
derived from the cultivar ‘Capelli’ (Scarascia-Mugnozza et al., 1972). The gap
between durum and bread wheat yield potential was filled by the release in 1974 of
‘Creso’, a high-quality variety derived from a cross between a CIMMYT dwarf line
and cv. ‘Castelfusano’.
During the last few decades, the Italian pool has been enriched with the incorpora-
tion of new gene pools, mainly from CIMMYT germplasm. The varieties ‘Simeto’,
‘Duilio’, ‘Arcangelo’, ‘Creso’, ‘Colosseo’, ‘Ciccuio’, ‘Ofanto’, ‘Grazia’, ‘Appulo’,
‘Rusticano’, ‘Radioso’, ‘Appio’, ‘Svevo’, ‘Neodur’, ‘Zenit’, and ‘Meridiano’ are
among the ones most cultivated by Italian farmers (Di Fonzo et al., 2005).
204 C. Royo et al.
4.2 The CIMMYT Pool
Durum wheat germplasm developed by CIMMYT has been the most widely used
by national programs worldwide. Variety release statistics reveal that more than
90% of the durum wheat varieties released in developing countries from 1991 to
1997 were introduced or derived from germplasm developed at CIMMYT (Pfeiffer
and Payne, 2005).
Early breeding efforts during the 1960s and 1970s were devoted to the intro-
gression of dwarfing genes and alleles for photoperiod insensitivity, improvement
of floral fertility, and enhanced biotic stress resistance (Pfeiffer et al., 2000). Further
efforts focused on agronomic components associated with high genetic yield
potential and wide adaptation in combination with acceptable quality attributes.
Varieties such as ‘Jori 69’ (released in 1969), ‘Cocorit 71’, ‘Mexicali 75’, and
‘Yavaros 79’ were widely adopted and some of them are still grown in many
countries. During the 1980s, a new generation of durum wheat varieties arose
(‘Altar 84’, ‘Aconchi 89’) from the development of the ideotype concept, with
balanced increase in all yield components. Later efforts concentrated on the stabili-
zation of grain yield potential and quality improvement.
Because of the appearance inMexico in 2001 of a new leaf rust (Puccinia triticinaEriks) race –designated as BBG/BR – the majority of the CIMMYT germplasm,
including some extensively grown cultivars such as ‘Mexicali 75’, ‘Yavaros 79’,
and ‘Altar 84’, became susceptible. Since 2001, the main objective of the CIMMYT
durum wheat breeding program has concentrated on developing leaf rust-resistant
germplasm and widening the genetic basis of leaf rust resistance in this widely
adapted gene pool. The high-yielding, rust-resistant cultivar ‘Jupare C2001’ was
released as an immediate emergency measure in Northern Mexico in 2001 and
grown commercially in 2002. Two other cultivars, ‘Samayoa C2004’ and ‘Bana-
michi C2004’, were released shortly thereafter to provide genetic resistance based
on different major genes and better quality attributes. Internationally, most leaf
rust-resistant germplasms have been distributed since 2003, with more recently a
considerable improvement in the overall levels of industrial quality attributes in the
material distributed. Whereas wide adaptation combined with durable resistance to
rusts – including the new threat of stem rust – is still the main focus of
the CIMMYT program, substantial emphasis is placed on quality and drought
tolerance-related traits.
4.3 The North American Pool
Durum introduction to the USA began in 1850 when the US Department of
Agriculture (USDA) introduced to the farmers the varieties ‘Algerian Flint’, ‘Turk-
ish Flint’, ‘Syrian Spring’, and ‘Arnautka’. Soon farmers found these varieties not
to be adapted to their region and were hard to mill and therefore were used for feed.
Durum Wheat Breeding 205
In 1870, durum wheat from Nicaragua was introduced to Texas. Again, millers
found it hard to mill and by 1890 durum had almost disappeared from production
(Carleton, 1901). In 1894, the USDA collected 1,000 spring and winter durum
varieties from all parts of the world and evaluated them for agronomic traits,
diseases, and production. The varieties ‘Nicaragua’ from Nicaragua, ‘Missogen’
and ‘Volvo’ from Greece, ‘Medeah’, ‘Pelissier’, and ‘El Safra’ from Algeria,
‘Candial’ from Argentina and Chili, and ‘Arnautka’ and ‘Kubanka’ from the former
USSR were selected for production (Joppa andWilliams, 1988). ‘Kubanka’ became
the leading cultivar from 1910 to 1920. Pure line selections were made from these
collected varieties. As a result, ‘Acme’ was selected from ‘Kubanka’ in 1909,
‘Mindum’ was selected from common wheat and released in 1917, and ‘Pentad’
was selected from a former USSR collection and released as red durum in 1903
(Joppa & Williams, 1988). ‘Pentad’ gained popularity because of its resistance to
stem rust (caused by Puccinia graminis Per.:Pers. f. sp. tritici Eriks. & E. Henn), but
it was given a separate class because of its red kernel colour which made it
unsuitable for pasta manufacturing. Over the years, most of these cultivars became
susceptible to the stem rust race 56, with the exception of ‘Pentad’. The newly
established durum breeding program attempted to transfer resistance from ‘Pentad’
but it proved to be difficult to transfer and the resulted progenies had very poor
quality (Joppa et al., 1988). Crosses for stem rust resistance with ‘Vernal’ emmer
were more successful. ‘Mindum’ had a moderate level of resistance to stem rust and
was the leading cultivar from 1920 to 1940.
Because of the importance of durum wheat for the state of North Dakota, the
durum plant breeding and genetic program was initiated in 1929 (Joppa et al., 1988)
and is the only public research project that develops and releases durum wheat
cultivars in USA. A year earlier, a similar breeding program was established in
Canada (Knott, 1995). ‘Carleton’ and ‘Stewart’ were the first cultivars released by
the North Dakota breeding program to the farmers in 1943 as result of crossing
‘Mindum’ to ‘Vernal’ emmer and back crossing twice to ‘Mindum’ (Joppa et al.,
1988). By 1949, these two cultivars became the most popular cultivars replacing
‘Mindum’. In 1953, ‘Stewart 221’ was developed in Canada by backcrossing
‘Stewart’ to ‘Mindum’. In 1950, the stem rust race 15B attacked all the durum
grown in USA and Canada and caused epidemics in 1953 and 1954. ‘Khapli’ emmer
and PI94701 were found to be resistant to race 15B. In 1955, ‘Langdon’ and ‘Yuma’
with stem rust resistance from ‘Khapli’ and ‘Ramsey’ and ‘Towner’ with resistance
from PI94701 were released to the farmers as resistant durum cultivars (Joppa et al.,
1988). ‘Langdon’ had good resistance to stem rust, but in 1957, it was overcome by
race 15B-2. ‘Langdon’ was crossed to derivatives of crosses of ‘Khapli’ emmer and
as a result, the two cultivars ‘Wells’ and ‘Lakota’ were released to the farmers in
1960 as resistant to all races and have yield similar to ‘Langdon’. However, both had
small kernels and low milling yield. Both were crossed to other cultivars for stem rust
diversity and kernel size. In 1966, ‘Leeds’ was released as a durum cultivar with stem
rust resistant, large kernels, and good milling yield. In 1963, also ‘Stewart 63’ was
206 C. Royo et al.
released by the University of Saskatchewan as a stem rust-resistant cultivar. Prior to
‘Stewart 63’, Canada was growing US cultivars such as ‘Mindum’, ‘Carlton’,
‘Stewart’, and ‘Ramsey’ (Clarke, 2005). Because of the epidemic of stem rust
that lasted 30 years, the breeding program had little time to accomplish other
objectives. However, in 1950, the cultivar ‘Nugget’ was released because of its
yellow pigment and reduced plant height.
In 1956, the semi-dwarf genes were introduced to the North American germ-
plasm to increase yield. However, progenies from crosses of semi-dwarf sources
with other cultivars did not result in higher yield (Joppa, 1973). Since then, several
semi-dwarf cultivars have been released from North Dakota such as ‘Cando’
(1975), ‘Calvin’ (1978), ‘Lloyd (1983)’, and ‘Plaza’ (1999) and from Canada,
such as AC ‘Morse’ (1996) and AC ‘Navigator’ (1999). In the 1970s, several
medium height to tall cultivars were released from North Dakota that had higher
yields than ‘Leeds’, such as ‘Rollete’ (1971), ‘Ward’ (1972), ‘Rugby’ (1973),
‘Crosby’ (1973), and ‘Botno’ (1973). All these cultivars had high yields, disease
resistance, and good colour but lacked gluten strength. The good colour in these
cultivars was incorporated from the Australian durum wheat ‘Heiti’ (Joppa et al.,
1988). In the 1970s, Canada released the cultivars ‘Wascana’ (1971), ‘Wakooma’
(1972), and ‘Coulter’ (1978). In 1970, there was a shift in the objectives of the
breeding program, and emphases were placed on developing strong gluten durum
cultivars in order to compete in the international expert market. ‘Cappelli’ a strong
gluten durum cultivar from Italy, was used to introduce gluten strength to North
Dakota germplasm. In 1976, ‘Edmore’ was released as the first strong gluten durum
cultivar followed by ‘Vic’ (1979), Lloyd, ‘Monroe’ (1985), and ‘Renville’ (1988).
At the same time period, Canada released the cultivars ‘Medora’ (1981), ‘Arcola’
(1984), and ‘Sceptre’ (1985). The current objective of the breeding program in
North Dakota is to release cultivars that have good agronomic traits and disease
resistance, and possess excellent quality for the domestic industry and the interna-
tional market. For genetic diversity, some germplasm has been introduced from
Europe and CIMMYT. However, most of the cultivars that have been developed in
the last 15 years in North Dakota have over 95% of North American germplasm in
their background. These cultivars are ‘Munich’ (1995), ‘Ben’ (1996), ‘Belzer’
(1997), ‘Mountrail’ (1998), ‘Maier’ (1998), ‘Lebsock’ (1999), ‘Plaza’ (1999),
‘Pierce’ (2001), ‘Dilse’ (2002), ‘Divide’ (2005), ‘Alkabo’ (2005), and ‘Grenora’
(2005). The highest yielding cultivars are ‘Alkabo’, ‘Divide’, ‘Grenora’, ‘Lebsock’,
and ‘Mountrail’. ‘Dilse’, ‘Divide’, and ‘Maier’ have the highest grain protein
concentration. ‘Alkabo’, ‘Belzer’, ‘Divide’, ‘Grenora’, and ‘Pierce’ have very
strong gluten. Several cultivars also have been released by Canada in the last 15
years such as ‘Plenty’ (1990), AC ‘Melita’ (1994), AC Morse, AC ‘Avonlea’
(1997), AC Navigator, AC ‘Pathfinder’ (1999), AC ‘Napoleon’ (1999), ‘Strong-
field’ (2003), and ‘Commander’ (2004). AC ‘Napoleon’ and ‘Strongfield’ have low
cadmium content and ‘Commander’ has high pigment content and very strong
gluten properties.
Durum Wheat Breeding 207
4.4 The Winter Pool
Local winter and facultative durum wheat populations were formed around 7000
BP in Anatolia, Turkey (Nesbitt and Samuel, 1996). Facultative and winter varieties
were derived from selections from old local collections during the early twentieth
century in countries from the Caucasian region (Armenia, Azerbaijan, Russian
Federation, and Georgia), the Near East region (Iran and Turkey), the Balkan region
(Bulgaria, Macedonia, and Romania), and the North Black Sea region (Ukraine).
Some of them, such as the local varieties ‘Ak-Bugda’ and ‘Sara Bugda’, have been
cultivated until recently (Palamarchuk, 2005). In the late nineteenth century, the
local facultative varieties ‘Agili’, ‘Sbei’, and ‘Hamira’ were grown in Tunisia and
‘Souri’, ‘Caid de Souef’, and ‘Kahla’ were grown in Algeria (Flaksberger, 1935).
The West Asian facultative landraces ‘Horani’, ‘Hourani’, ‘Gaza’, and ‘Haiti’ and
the Transylvanian variety ‘Arnaut’ have been widely used by many breeders
(Palamarchuk, 2005). Varieties ‘Selcuelu 97’, ‘Yilmar 98’, and ‘Ankara 98’ from
Turkey, ‘Pandur’ and ‘Condur’ from Romania, ‘Martondur 1’ and ‘Martondur 2’
from Hungary, ‘Leukurum 21’ from the Russian Federation, and ‘Dnepryana’ and
‘Leukurum 21’ from the Ukraine are examples of cold-tolerant varieties released in
the last decade (Palamarchuk, 2005).
5 Major Breeding Achievements
The first breeding efforts devoted to durum wheat were made in areas close to its
centre of origin and diversification, and consisted in selection within local landraces
and crosses between them (Tesemma and Bechere, 1998; Royo and Briceno-Felix,
in press). However, two of the most important milestones in the history of durum
wheat breeding were reached after the establishment of CIMMYT in 1965: the
introgression of dwarfing genes from genetically distant sources into adapted
germplasm and the incorporation of photoperiod insensitivity.
The Japanese hexaploid cultivar ‘Norin 10’ was the original donor of the
dwarfing gene most widely used in durum wheat breeding: the Rht-B1 (formerly
Rht1). This gene, located on the short arm of chromosome 4B (Gale et al., 1975;
Gale and Marshall, 1976; McVittie et al., 1978), confers insensitivity to exogenous
application of low concentrations of gibberellic acid (GA) solution (Gale and
Gregory, 1977). Alternative sources of dwarfism have been some GA-responsive
genes also derived from Japanese varieties (e.g., Akagomughi, Saitama 27), and
probably other minor genes first introduced by the Italian breeder Nazareno Stram-
pelli (Borghi, 2001). Dwarfing genes conferred tolerance to lodging and hence
adaptation to high rates of fertilizer application. During the second half of the
twentieth century, semi-dwarf wheats replaced old tall varieties in the irrigated and
high-yielding regions of the world.
208 C. Royo et al.
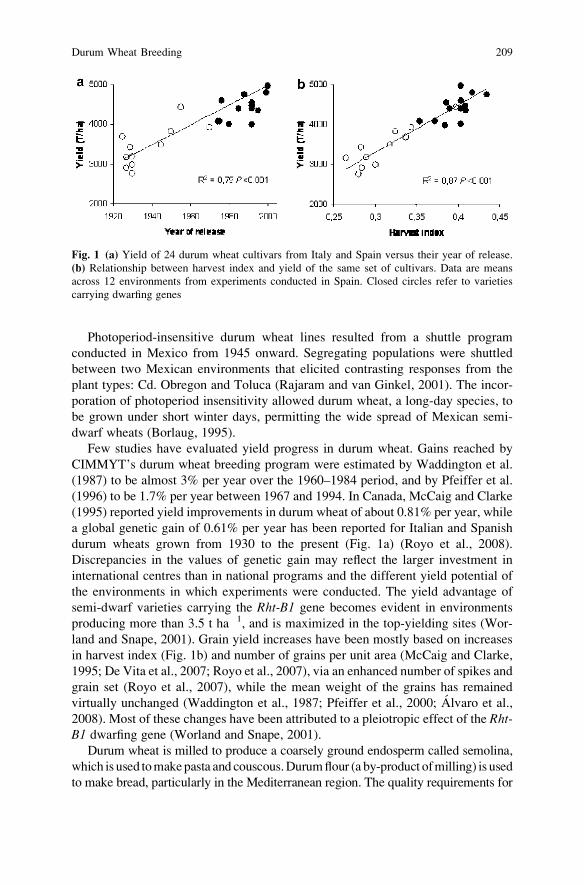
Photoperiod-insensitive durum wheat lines resulted from a shuttle program
conducted in Mexico from 1945 onward. Segregating populations were shuttled
between two Mexican environments that elicited contrasting responses from the
plant types: Cd. Obregon and Toluca (Rajaram and van Ginkel, 2001). The incor-
poration of photoperiod insensitivity allowed durum wheat, a long-day species, to
be grown under short winter days, permitting the wide spread of Mexican semi-
dwarf wheats (Borlaug, 1995).
Few studies have evaluated yield progress in durum wheat. Gains reached by
CIMMYT’s durum wheat breeding program were estimated by Waddington et al.
(1987) to be almost 3% per year over the 1960–1984 period, and by Pfeiffer et al.
(1996) to be 1.7% per year between 1967 and 1994. In Canada, McCaig and Clarke
(1995) reported yield improvements in durum wheat of about 0.81% per year, while
a global genetic gain of 0.61% per year has been reported for Italian and Spanish
durum wheats grown from 1930 to the present (Fig. 1a) (Royo et al., 2008).
Discrepancies in the values of genetic gain may reflect the larger investment in
international centres than in national programs and the different yield potential of
the environments in which experiments were conducted. The yield advantage of
semi-dwarf varieties carrying the Rht-B1 gene becomes evident in environments
producing more than 3.5 t ha�1, and is maximized in the top-yielding sites (Wor-
land and Snape, 2001). Grain yield increases have been mostly based on increases
in harvest index (Fig. 1b) and number of grains per unit area (McCaig and Clarke,
1995; De Vita et al., 2007; Royo et al., 2007), via an enhanced number of spikes and
grain set (Royo et al., 2007), while the mean weight of the grains has remained
virtually unchanged (Waddington et al., 1987; Pfeiffer et al., 2000; Alvaro et al.,
2008). Most of these changes have been attributed to a pleiotropic effect of the Rht-B1 dwarfing gene (Worland and Snape, 2001).
Durum wheat is milled to produce a coarsely ground endosperm called semolina,
which is used tomakepasta and couscous.Durumflour (a by-product ofmilling) is used
to make bread, particularly in the Mediterranean region. The quality requirements for
Fig. 1 (a) Yield of 24 durum wheat cultivars from Italy and Spain versus their year of release.
(b) Relationship between harvest index and yield of the same set of cultivars. Data are means
across 12 environments from experiments conducted in Spain. Closed circles refer to varieties
carrying dwarfing genes
Durum Wheat Breeding 209
these products are similar and include semolina rich in yellow (carotenoid) pig-
ments and high in protein and gluten strength. Thus, most durum breeding programs
are focused on improving the semolina yellowness, protein content, and protein
strength.
Semolina colour is evaluated at the F5 and subsequent generations in the NDSU
durum breeding program. Semolina colour (carotenoid pigment concentration) is a
highly heritable trait and is controlled by additive gene effects (Johnston et al.,
1983; Joppa et al., 1988). The high heritability indicates that only a few genes with
several alleles control the characteristic. Using Psy1–1 and Psy2–1 allele-specific
markers and chromosome mapping, the Psy1 and Psy2 genes were located on
chromosomes 7 and 5, respectively. Four quantitative trait loci (QTL) underlying
phenotypic variation in endosperm colour were identified on chromosomes 2A, 4B,
6B, and 7B. Psy1–1 locus co-segregated with the 7B QTL (Pozniak et al., 2007).
Yellowness of pasta depends on the carotenoid pigment concentration and
oxidative enzyme activity in the semolina. Oxidative enzymes, lipoxygenase,
polyphenol oxidase, and peroxidase, are found in wheat kernel. Lipoxygenase is
associated with loss of pigment content, particularly during pasta processing.
Lipoxygenase enzymes catalyze the oxidation of polyunsaturated fatty acids con-
taining a cis, cis-1, 4-pentadiene system, producing conjugated cis, trans-dienehydroperoxides (Siedow, 1991). Radicals produced during the intermediate steps of
this reaction are responsible for oxidative degradation of carotenoid pigments.
Lipid oxidation by lipoxygenase can occur during the processing and drying of
pasta, which results in a loss of yellow colour in pasta products (Icard-Verniere and
Feillet, 1999; Irvine and Winkler, 1950). Borrelli et al. (1999) reported a 16.3% loss
of carotenoid pigments during pasta processing. They reported that isoenzymic
forms LOX-2 and LOX-3, active at pH of dough, were responsible for the loss of
colour in pasta.
Variation exists in the expression of lipoxygenase genes (Manna et al., 1998).
Use of QTL may eventually allow screening of germplasm for oxidative enzymes
earlier in the breeding cycle. Carrera et al. (2007) reported the existence of a
duplication at the Lpx-B1 locus and an allelic variation for a deletion of the Lpx-B1/1 copy resulted in 4.5-fold reduction in lipoxygenase activity and improved
pasta colour but not semolina colour. They reported a molecular marker for the
deletion on chromosome 4B. A second lipoxygenase locus Lpx-A3 was mapped on
the homoeologuous region on chromosome 4A and was associated with semolina
and pasta colour but not with lipoxygenase activity in the mature grain. Lpx-B1locus has been mapped on the short arm of chromosome 4B whereas the Lpx-A3locus was mapped on the long arm of chromosome 4A.
Grain protein concentration and gluten strength are important quality traits in
durum wheat. Commercial pasta typically contains 7 g of protein per serving (56 g).
To meet protein requirement for labelling, the semolina would need 12.5% protein
(12% mb) or 12.2% protein at 14% mb. Durum cultivars with high-protein content
produce pasta products with greater cooked firmness and increased tolerance to
overcooking (Dexter and Matsuo, 1977; Grzybowski and Donnelly, 1979). Protein
concentration is evaluated at the F5 and subsequent generations in the NDSU durum
210 C. Royo et al.
breeding program. Whole grain protein is evaluated using a Technicon InfraAlyzer,
where the targeted whole grain protein concentration is 13.5% or higher, at
12% mb.
Emmer wheat (T. turgidum L. var. dicoccoides) represents a source of genetic
variability for grain protein concentration and can provide useful sources of high-
protein genes for introgression into durum breeding germplasms. Joppa and Can-
trell (1990) substituted individually all 14 chromosomes of a high-protein T.dicoccoides accession FA-15-3 into the genetic background of the durum cultivar
‘Langdon’. This and the subsequent studies showed that 5 of the 14 T. dicoccoidessubstitution lines (2A, 3A, 6A, 5B, and 6B) have a higher grain protein concentra-
tion than the ‘Langdon’ parent, which indicates that one or more genes that control
protein concentration are located on these chromosomes (Joppa and Cantrell, 1990,
1991; Cantrell and Joppa, 1991). Joppa et al. (1997) later mapped a QTL for protein
concentration in the LDN(Dic-6B) substitution line. They used a recombinant
inbred chromosome line population where the 6B chromosome of T. dicoccoidesand ‘Langdon’ were recombined in an otherwise ‘Langdon’ background.
This high-protein locus (QGpc.ndsu.6Bb) was located on the short arm and near
the centromere of chromosome 6B, flanked by restriction fragment length polymor-
phism (RFLP) loci Xmwg79 and Xabg387. They also showed that the QGpc.ndsu.6Bb locus was inherited as a single genetic factor (i.e., segregating in a 1:1
ratio in a recombinant inbred population) and explained 66% of the total phenotypic
variation in protein concentration.
Chee et al. (2001) studied the introgression of this high grain protein genetic
factor(s) into adapted durum germplasm and molecular mapping to verify the 6B
chromosomal region associated with the high-protein concentration. Analysis of
this character using simple regression and interval mapping procedures identified a
locus near Xcdo365 and Xmwg79 on chromosome 6B that has a major effect on
grain protein concentration. This high-protein locus, which explained up to 72% of
the phenotypic variance, accounted for a 15 g kg�1 increase in average protein
concentration and accounted for all the protein content differences between the two
parents. The 6B source of high-protein concentration is being used in several durum
breeding programs.
Storage proteins of durum wheat are composed of gliadins and glutenins. Gluten
is the protein matrix that is formed when gliadins and glutenins are hydrated and
mixed together. There is a market for the three gluten strengths. Weak gluten is
desirable for crimped or stamped pasta products, strong gluten is desirable for long
goods, and very strong gluten is desirable for blending with lower quality semolina
and may be advantageous in bread products. Visual selection for gluten strength can
be practiced starting at the F2 generation (McClung and Cantrell, 1986). Strong
gluten is linked with the gene Rg1 for glume colour in durum wheat (Liesle et al.,
1981; Hare et al., 1986). White glume colour is associated with strong gluten, while
buff or brown colour is associated with weak gluten. In the F2 population, only
white glume colour plants are selected in the NDSU durum breeding program.
Gluten strength at the F3 and subsequent generations is evaluated by the SDS micro-
sedimentation test developed by Dick and Quick (1983). A sedimentation value
Durum Wheat Breeding 211
below 30 mm indicates weak gluten, and a sedimentation value of 35 or higher
indicates strong gluten. SDS micro-sedimentation test is effective in distinguishing
weak from strong gluten, but is less effective in distinguishing strong from very
strong gluten. In later generations, gluten/dough strength can be evaluated using
SDS micro-sedimentation, mixograph, wet gluten/gluten index tests, alveograph,
and glutograph.
Gluten strength in durum wheat is highly heritable and its inheritance primarily
additive (Braaten et al., 1962). Gluten strength has been found to be related to
allelic variation at the g-gliadin (Gli-B1) locus. Bushuk and Zillman (1979)
reported that durum cultivars possessing the g-gliadin band 45 are of strong gluten
type and yield pasta products with greater firmness and other desirable cooking
qualities. Pasta products made from cultivars possessing the g-gliadin band 42, on
the other hand, have poor cooking quality. This allelic variation at the Gli-B1 locusis now believed to be only an association (marker) and not a causal agent for pasta
quality. Gliadin proteins provide cohesiveness to the gluten protein matrix and do
not contribute greatly to gluten strength due to their non-aggregating properties.
It is now generally accepted that genes coding for most g- and o-gliadins are
located on the short arm of homoeologous group 1 chromosomes (the Gli-1locus) and most genes coding for a- and b-gliadins are on the short arm of
homoeologous group 6 chromosomes (the Gli-3 locus). Both the Gli-1 and Gli-3are complex, multigenic loci. Each locus contains a tightly linked genes family
clustered in a discrete order and inherited as a block (Bietz, 1987).
Glutenin proteins can form polymeric complexes and are responsible for
strength and elasticity of gluten. Like the gliadins, the glutenins are found to be
inherited in blocks. Glutenins are divided into poorly soluble HMW and the
ethanol-soluble LMW subunits (Payne et al., 1984). Payne et al. (1984) showed
that HMW glutenins are synthesized by homoeologous loci on the long arms of
chromosome 1A, 1B, and 1D. These HMW glutenins gene loci are denoted Glu-A1,Glu-B1, andGlu-D1 for homoeologous chromosomes 1A, 1B, and 1D, respectively.
The LMW glutenin subunits are coded by genes at the Glu-3 locus located on the
short arm of homoeologous group 1 chromosomes (Jackson et al., 1983). The Glu-B3 locus on chromosome 1B is of particular importance to durum wheat quality
because of the LMW-1 and LMW-2 subunits coded to this locus. Pogna et al. (1988,
1990) determined that the LMW-2 subunits can strongly influence pasta-making
quality of durum wheat. The g-gliadin band 45 at the Gli-B1 locus is only a marker
for gluten strength, and LMW glutenin subunits at the Glu-B3 locus are responsiblefor cooking quality of pasta. It has been shown that theGli-B1 locus is tightly linked(2 recombinant units) to the Glu-B3 locus on the short arm of chromosome 1B
(Pogna et al., 1990). Furthermore, in most durum cultivars, g-gliadin 42 is linked inthe coupling phase to the LMW-1 subunits, and g-gliadin 45 is linked in the
coupling phase to the LMW-2 subunits. According to Feillet (1988), the LMW
glutenin proteins tend to form a strongly aggregated protein matrix through heat
treatments. A high content of LMW glutenin results in the formation of a large-
aggregated protein matrix, which contributes to pasta firmness (Feillet, 1988).
212 C. Royo et al.
Incorporation of disease resistance has also been a major goal of many breeding
programs. The most widely spread diseases affecting durumwheat are the three rusts,
so most past breeding efforts have focused on developing resistant cultivars, based
either on single race-specific genes and their combinations (Roelfs et al., 1992) or on
the involvement of genes with slow rusting effects (Caldwell, 1968). The designated
genes originated from durum (Lr14a and Lr23 for leaf rust, Sr2, Sr9d, Sr9e, Sr9g,Sr11, Sr12, Sr13, Sr14, and Sr17 for stem rust, and Yr7, Yr26, and Yr30 for stripe oryellow rust, McIntosh et al., 1995), but also genes from alien sources have been
incorporated in resistant cultivars. Durum wheat leaf rust resistance remained stable
for many years in several countries until it broke down in 2001 (Singh et al., 2004),
making it necessary to develop varieties resistant to the new race.
6 Current Goals of Breeding
The main challenges of durum wheat breeding are currently focused on: (1) grain
yield improvement, (2) introducing durable resistance to the main diseases,
(3) increasing grain quality, particularly the content of micronutrient in grains,
(4) improving the knowledge of the genotype � environment (GE) interaction, and
(5) incorporating biotechnological tools into breeding programs.
The current limitations to the expansion of wheat culture to new land and the
increasing global demand for wheat grain are among the reasons why yield im-
provement is still one of the main goals of breeding programs. Yield is a complex
polygenic regulated trait and several studies have demonstrated that genetic gains in
wheat are now more difficult to achieve than they were in the past, when the
introduction of dwarfing genes led to a dramatic increase in yield potential
(Reynolds et al., 1996; Donmez et al., 2001; Rajaram, 2001; Royo et al., 2008).
Nevertheless, the current knowledge of wheat genetics and ecophysiology allows
breeding for yield to be dealt with using different approaches according to the target
environment: increasing yield potential in stress-free environments and manipulat-
ing adaptation mechanisms in areas suffering severe abiotic stresses, particularly
drought.
One of the approaches being used to raise yield potential in wheat consists in
trying to increase the sink size by developing new genetic pools through wide
crosses or through the introgression of the multi-ovary trait (Reynolds et al., 2005).
Given that grain weight increases were limited in the past by the broad use of GA-
insensitive dwarfing genes, alternative sources of dwarfism namely the introgres-
sion of GA-sensitive genes are currently being explored to achieve yield gains
through increases in the potential grain size. The enlargement of the flag leaf area
duration after anthesis (Blake et al., 2007) and the exploitation of heterosis by
means of hybrid wheat production (Solomon et al., 2007) are also being investi-
gated as ways to increase yield potential. Physiological approaches focus on
improving the radiation use efficiency (total dry matter produced per unit of
intercepted radiation) (Monneveux et al., 2005).
Durum Wheat Breeding 213
Yield improvement for marginal environments is much more complex due to the
frequent simultaneous occurrence of a number of stresses (drought, high or low
temperatures, nutrient deficiencies, etc.) and the polygenic nature of stress toler-
ance, characterized by a low heritability and a high GE interaction. Results of
classical breeding methodologies were very successful in optimal environments in
the past, but genetic gains were limited on marginal lands. Germplasm development
for severe drought-stressed areas is currently focused on the identification and
introgression of traits for adaptation and crop survival. Some of the promising traits
proposed for yield improvement in rainfed, Mediterranean-type environments are
the presence of large coleoptiles (Rebetzke et al., 2004) and a better crop establish-
ment (Rebetzke et al., 2007) as ways to improve early vigour (Botwright et al.,
2002), the use of the Tin-gene for tiller inhibition (Duggan et al., 2005), and an
enhanced accumulation of water-soluble carbohydrates in the stems before anthesis
to improve the translocation of pre-anthesis assimilates to the filling grains when
photosynthesis is limited by terminal abiotic stresses (Ruuska et al., 2006). The
recent advance in the molecular knowledge of the plant responses to abiotic stresses
has resulted in the identification of a great number of QTLs and genes related to
stress tolerance. The new tools coming up from this knowledge are opening further
opportunities for yield improvement in sub-optimal environments.
The increasing restriction of the use of pesticides reinforces the deployment of
resistant varieties as the most economical and ecological way to control wheat
diseases. Monogenic hypersensitive resistance to rusts, the most widely used
strategy for the genetic control of these fungi, was easily overcome by the patho-
gens in the past. As a consequence, breeding efforts are now focused on the
incorporation of durable or slow rusting resistance, characterized by the crop
displaying a susceptible infection-type response, but with a reduced rate of epidem-
ic development (Hare, 1997; Herrera-Foessel et al., 2007). The appearance of a new
race of black stem rust (P. graminis Per.:Pers. f. sp. tritici Eriks. & E. Henn) in
Uganda in 1999 (caused by the race Ug99, designated as TTKS based on the North
American Designation) is threatening many of the world’s wheat growing regions
(Singh et al., 2007). A Global Rust Initiative (http://www.globalrust.org/) was
launched to monitor the further migration of this race and to evaluate the suscepti-
bility of the wheat varieties most cultivated in the world. Other diseases, such as tan
spot, have received less attention in the past, but population race structure has been
studied in some areas (Ali and Francl, 2003). Current research on FHB species is
concentrating on a detailed study of the interaction between wheat and the pathogen
and between the pathogen species themselves (Nicholson et al., 2007), while new
sources of resistance are being explored by means of wide crosses (Fedak et al.,
2007).
In quality, in addition to breeding for colour, protein characteristics, and gluten
strength, more effort should be given to improve other traits such as large uniform
kernel size, improved semolina extraction, and reduced ash and heavy metal
contents. There is interest in improving the nutritional value of durum wheat
products and to improve the micronutrient content and composition of durum
wheat.
214 C. Royo et al.
The increase in the bioavailable micronutrient content in wheat and other crops
is being addressed by the HarvestPlus Challenge Program of the CGIAR (http://
www.harvestplus.org/index.html). This program is a global alliance of institutions
and scientists seeking to improve human nutrition by breeding new varieties of
staple food crops, wheat among them, which have higher levels of micronutrients,
through a process called biofortification.
The need for better knowledge of the factors affecting the GE interaction and its
interpretation is receiving significant attention from the scientific community.
Efforts are currently devoted to mapping, elucidating the function, and assessing
the pleiotropic effects of the loci involved in the adaptation of wheat to different
environments, particularly concerning the genes controlling photoperiod sensitivity
(Ppd), vernalization requirement (Vrn), and intrinsic earliness (Eps). Molecular
marker methodologies may be a very useful tool for a better understanding of the
genes contributing to GE interactions. Research is also focused on the development
of new unreplicated experimental designs and accurate statistical methods for a
more precise and cost-effective field testing of large numbers of genotypes.
The progress and successes achieved in wheat genetics, genomics, and genetic
analysis has been enormous in recent times. Genes regulating important plant traits
are being cloned and their mechanisms of action understood. However, until now,
the benefit of all this research for breeding programs has been little other than the
incorporation of marker-assisted selection (MAS) in the screening schemes (Snape
and Moore, 2007). Translating gene discovery and understanding into facile tools
for plant breeders is still a major challenge for wheat researchers.
7 Breeding Methods and Techniques
The pedigree breeding method, bulk method, single seed-descent, backcross
method, recurrent selection, and doubled haploid are breeding methods that are
available to plant breeders for cultivar development. Detailed illustrations and
theory of these breeding methods are described by Fehr (1987). In general,
breeding programs use a modified pedigree breeding method for cultivar devel-
opment. Depending on the breeding program resources and philosophy, 50–300
crosses are made each year with the objective of developing parents for the
breeding program and cultivars for the target environment. From the time of
the crossing to cultivar release, 10–12 years of extensive research and testing are
done on experimental lines to evaluate their agronomic, milling, quality traits,
and disease resistance. Parents for crosses are selected based on their yield, test
weight, kernel weight, straw strength, disease resistance, drought tolerance, high
grain protein concentration, gluten strength, spaghetti colour, and other quality
traits. Breeding methodology of several durum wheat breeding programs around
the world can be found in Royo et al. (2005).
In a modified pedigree breeding method, crosses can be made in the field or the
greenhouse depending on their region. In the NDSU durum breeding program, F2
Durum Wheat Breeding 215
populations (1,000–2,000 plants per population) are grown in the field. In the F2population, 100–200 plants/spikes are selected based on phenology, plant height,
straw strength, disease resistance, glum colour, and other characteristics. Spikes are
threshed individually and planted as F2:3 head rows in the next year, one to two
kernel from each spike are saved as remnant in case of catastrophe. Some of these
populations could be planted in winter nurseries for advance thus obtaining two
generations in one year. First, F2:3 rows are selected based on characteristics
described earlier, and the best two to three spikes from each selected row are
selected to be grown as F3:4 rows in the next year. The same procedure is repeated
for the F3:4 rows to produce F4:5 rows. In addition to the two and three selected
spikes, ten spikes are cut from each F2:3 and F3:4 row to be used in part as remnant
and in part for measuring gluten strength using the SDS – micro-sedimentation test
(Dick and Quick, 1983). At the F4:5 generation, selection is practiced only among
head rows but not within rows. The selected lines are evaluated for yield, maturity,
straw strength, plant height, disease resistance such as tan spot (Pyrenophora tritici-repentis [Died.] Drech. anamorph Drechslera tritici-repentis (Died.) Shoem.],
Septoria (Septoria spp.), FHB (Fusarium graminearum Schwabe [teleomorph
Gibberella zea Schwein.] Petch), leaf rust (Puccinia triticina Erick), and stem
rust (P. graminis pers.:Pers.f. sp. tritici Eriks. & E. Henn), gluten strength, grain
protein concentration, colour, and other plant characteristics. Each selected line is
harvested as bulk, and enters into a preliminary yield trial (PYT) which is tested at
two to three locations. Selected lines from PYTs are evaluated in advanced yield
trials (AYTs) at two to three locations. Selected lines from AYTs are evaluated in
elite advanced trials (EDA) at three locations. Lines that are selected from EDA are
evaluated in uniform regional durum trials (URDN) at more than ten locations. The
plot size for the yield trials ranges from 3.6 to 7 m2. A randomized complete block
design is used when a small number of lines (<30) are tested in the trials, while a
lattice design is used in trials with large number of lines tested.
The lines from the URDN are planted in 1.4-m-wide and 20-m-long plots
called ‘‘drill strips’’ at six to seven locations in the target environment for further
testing and observation by the plant breeder. Drill strips are harvested, and the
grain is evaluated for test weight, kernel weight, kernel size, kernel hardness,
wheat protein content, total extraction, semolina extraction, semolina protein
content, semolina ash content, semolina specks, dough strength, spaghetti colour,
cooked weight, cooking loss, and cooked firmness. On the basis of these traits,
lines are advanced for further testing. The selected lines are also tested for yield
stability across locations. One-thousand spikes from the drill strips of promising
lines in the second year of testing in the URDN are harvested for seed purifica-
tion. Heads are threshed individually and seeded as head rows. Non-uniform
rows are discarded and the remaining rows are bulk harvested as breeder seed.
On the basis of performance, the plant breeder might recommend one or two
lines for release to a variety release committee. If approved, the newly released
line is given a varietal name, and the seed is increased and made available to
producers.
216 C. Royo et al.
8 Integration of New Biotechnologies in Breeding Programs
Molecular genetics can be integrated into the classical plant breeding methods and
used as a tool to increase the efficiency of breeding programs. Molecular markers
can be used in breeding programs to assess the genetic diversity available to the
breeder. Autrique et al. (1996) studied the genetic diversity of a collection of 113
improved cultivars and landraces from diverse regions, using RFLP, morphological
traits, and coefficient of parentage. Morphological traits and RFLPs showed lower
genetic distance for improved cultivars and for some landraces from Morocco and
Jordan, while the other landraces showed larger genetic distance. They concluded
that there is a narrow genetic diversity in breeding lines. However, Maccaferri et al.
(2003) using simple sequence repeats on 58 accessions from diverse regions
reported an increase in genetic diversity in durum wheat. Another use of molecular
genetics is to select a line based on presence of molecular marker ‘MAS’. There are
several reported markers in the literature that could be used for MAS in durum
wheat. Genotype with low polyphenol oxidase activity can be selected using the
simple sequence repeat marker Xgwm312@2A (Watanabe et al., 2006); Xgwm2,Xgwm666.1, Xcfa2164, Xbarc19, Xbarc356, and Xgwm674 are used to select genesaffecting brittle rachis (Nalam et al., 2006); the micro satellite Xgwm344 is used to
select for yellow pigment (Elouafi et al., 2001); Xcdo365 and Xmwg79 are two
markers flanking high grain protein concentration of T. dicoccoides 6B chromo-
some (Chee et al., 2001); Xgwm234, Xgwm299, and Xgwm544 are three micro-
satellite markers associated with pre-harvest sprouting resistance (Gelin et al.,
2005); and a microsatellite locus, Xgwm2, is tightly linked to FHB resistance
from T. diccocoides chromosome 3 (Otto et al., 2002).
In general, the use of MAS in durum wheat is limited in comparison with other
crops. More markers are needed for disease resistance, quality, and agronomic traits
to increase the efficiency of breeding programs.
9 Foundation Seed Production and Intellectual
Property Issues
Durum wheat seed is usually classified as belonging to one of the following
categories, representing advancing generations of seed production: breeder, foun-
dation, and certified. Breeder seed is the basic seed stock directly handled by the
breeder, resulting from a purification program. It provides the source for the initial
and recurring increase in foundation seed. It should be genetically so pure as to
guarantee that the foundation seed derived from it conforms to the prescribed
standards of genetic purity. Certified seed is the progeny of the foundation seed,
and its production should be handled so as to maintain genetic identity and purity
according to the standards prescribed for the crop. Certified seed is only produced
from varieties that have been registered following the rules established by the
Durum Wheat Breeding 217
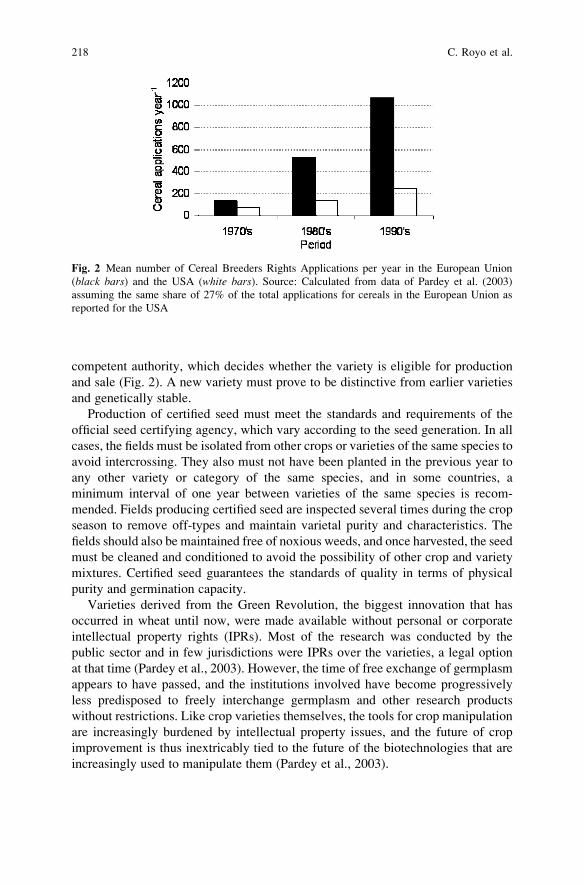
competent authority, which decides whether the variety is eligible for production
and sale (Fig. 2). A new variety must prove to be distinctive from earlier varieties
and genetically stable.
Production of certified seed must meet the standards and requirements of the
official seed certifying agency, which vary according to the seed generation. In all
cases, the fields must be isolated from other crops or varieties of the same species to
avoid intercrossing. They also must not have been planted in the previous year to
any other variety or category of the same species, and in some countries, a
minimum interval of one year between varieties of the same species is recom-
mended. Fields producing certified seed are inspected several times during the crop
season to remove off-types and maintain varietal purity and characteristics. The
fields should also be maintained free of noxious weeds, and once harvested, the seed
must be cleaned and conditioned to avoid the possibility of other crop and variety
mixtures. Certified seed guarantees the standards of quality in terms of physical
purity and germination capacity.
Varieties derived from the Green Revolution, the biggest innovation that has
occurred in wheat until now, were made available without personal or corporate
intellectual property rights (IPRs). Most of the research was conducted by the
public sector and in few jurisdictions were IPRs over the varieties, a legal option
at that time (Pardey et al., 2003). However, the time of free exchange of germplasm
appears to have passed, and the institutions involved have become progressively
less predisposed to freely interchange germplasm and other research products
without restrictions. Like crop varieties themselves, the tools for crop manipulation
are increasingly burdened by intellectual property issues, and the future of crop
improvement is thus inextricably tied to the future of the biotechnologies that are
increasingly used to manipulate them (Pardey et al., 2003).
Fig. 2 Mean number of Cereal Breeders Rights Applications per year in the European Union
(black bars) and the USA (white bars). Source: Calculated from data of Pardey et al. (2003)
assuming the same share of 27% of the total applications for cereals in the European Union as
reported for the USA
218 C. Royo et al.
IPRs aim to provide the exclusivity needed to stimulate innovation in science
and technology, and to supply incentives to bring new technologies and products to
the market in order to achieve economic benefits and promote the dissemination of
knowledge into the broader economy (Maskus, 2006). The IPRs of most relevance
for durum wheat breeding are plant variety rights which attempt to allow breeders
to control the marketing and use of their protected varieties. With two exceptions,
plant variety rights give their owners the right to exclude all others from increasing
seed, selling, importing, or using the variety without authorization for a fixed period
of time. The first exception is the ‘breeders’ exemption’ which allows the use of
protected plant varieties as parents in a breeding program to develop improved
germplasm, even without the permission of the rights holder. The second exception
is the ‘farmer’s privilege’ which allows farmers to retain enough seed from the
harvest of one year for re-planting in the following season (Maskus, 2006). After
the period of exclusive right expires, the patent enters the public domain and may be
used by anyone without restriction (Skovmand et al., 2005).
The Convention of the International Union for the Protection of New Varieties
of Plants (known by its French acronym as the UPOV Convention), currently
signed by more than 50 countries, establishes a framework of exclusive rights for
breeders of novel plant varieties. It first came into force in 1968 and was revised by
the UPOV Acts of 1978 and 1991. The 1978 Act retained the research exception
and the farmer’s privilege, but the standards were tightened considerably by the
1991 Act. Farmers may now only retain seed for use on their own land and may not
market or exchange protected seeds. Breeders must develop new varieties that are
not ‘essentially derived’ from protected parents (Maskus, 2006). Essentially
derived varieties are clearly distinguishable from the protected varieties, but are
predominantly derived from them.
References
Ali, S. and Francl, L.J. (2003) Population race structure of Pyrenophora tritici-repentis prevalenton wheat and non-cereal grasses in the Great Plains. Plant Dis. 87, 418–422.
Akar, T. and Ozgen, M. (2007) Genetic diversity in Turkish durum wheat landraces. In: H.T. Buck,
J.E. Nisi and N. Salomon (Eds.), Wheat Production in Stressed Environments. Springer,Dordrecht, pp. 753–760.
Al-Hakimi, A., Monneveux, P. and Nachit, M.M. (1997) Direct and indirect selection for drought
tolerance in alien tetraploid wheat � durum wheat crosses. In: H.J. Braun, F. Altay, W.E.
Kronstad, S.P.S. Beniwal and A. McNab (Eds.), Wheat: Prospects for Global Improvement.Proceedings of the 5th International Wheat Conference, Ankara, Turkey, 10–14 June 1996.Kluwer, London, pp. 353–360.
Alvaro, F., Isidro, J., Villegas, D., Garcıa del Moral, L.F. and Royo, C. (2008) Breeding effects on
grain filling, biomass partitioning and remobilization in Mediterranean durum wheat. Agron. J.
100, 352–360.
Asins, M.J. and Carbonell, E.A. (1989) Distribution of genetic variability in a durum wheat world
collection. Theor. Appl. Genet. 77, 287–294.
Durum Wheat Breeding 219
Autrique, E., Nachit, M.M., Monneveux, P., Tanksley, S.D. and Sorrells, M.E. (1996) Genetic
diversity in durum wheat based on RFLPs, morphophysiological traits, and coefficient of
parentage. Crop Sci. 36, 735–742.
Ballatore, G.P. (1973). Il sud non puo fare a meno del grano duro. L’Informatore Agrario, n. 2–3.
Balmas, V., Maccaroni, M., Santori, A. and Corazza, L. (1999) Fusariosi della spiga di cereali
autunno-vernini: indagine epidemiological e valutazione della resistenza varietale di frumento
duro nell’Italia centrale. Informatore Fitopatologico 12, 37–42.
Belaid, A. (2000) Durum wheat inWANA: Production, trade and gains from technological change.
In: C. Royo, M.M. Nachit, N. Di Fonzo and J.L. Araus (Eds.),Durum Wheat Improvement in theMediterranean Region: New challenges. Options Mediterraneennes. Series A. 40, 63–70.
Bietz, J.A. (1987) Genetic and biochemical studies of nonenzymatic endosperm proteins. In: E.G.
Heyne (Ed.). Wheat and Wheat Improvement. American Society of Agronomy. Madison, WI,
pp. 215–241.
Blake, N.K., Lanning, S.P., Martin, J.M., Sherman, J.D. and Talbert, L.E. (2007) Relationship of
flag leaf characteristics to economically important traits in two spring wheat crosses. Crop Sci.
47, 491–496.
Borghi, B. (2001) Italian wheat pool. In: A.P. Bonjean and W.J. Angus (Eds.), The World WheatBook, a History of Wheat Breeding. Lavoisier Publishing, Paris, pp. 289–309.
Borlaug, N.E. (1995) Wheat breeding at CIMMYT. Commemorating 50 Years of Research inMexico for Global Wheat Improvement. Wheat Special Report, No 20. P IV–VI.
Borrelli, G.M., Troccoli, A, DiFonzo, N. and Fares, C. (1999) Durum wheat lipoxygenase activity
and other quality parameters that affect pasta color. Cereal Chem. 76, 335–340.
Botwright, T.L., Condon, A.G., Rebetzke, G.J. and Richards, R.A. (2002) Field evaluation of early
vigour for genetic improvement of grain yield in wheat. Aust. J. Agric. Res. 53, 1137–1145.
Bozzini, A. (1971) First results of bunt resistance analysis in mutant of durum wheat. In Proc. ofthe FAO/IAEA Panel on Mutation Breeding for Disease Resistance, pp. 131–138.
Braaten, M.O., Lebsock, K.L. and Sibbitt, L.D. (1962) Intergeneration relations of physical
properties of dough and carotenoid pigment content in durum wheat. Crop Sci. 2, 277–280.
Bushuk, W. and Zillman, R.R. (1979) Procedure manual for polyacrylamide gel electrophoresis of
gliadins as a basis for wheat cultivar identification. University of Manitoba, Winnipeg, Canada.
Caldwell, R.M. (1968) Breeding for general and/or specific resistance. In: K.W. Finlay and K.W.
Shephard (Eds.), Proceedings of the Third International Wheat Genetics Symposium Canberra,
Australia, Australian Academy of Sciences, pp. 263–272.
Cantrell, R.G. and Joppa, L.R. (1991) Genetic analysis of quantitative traits in wild emmer
(Triticum turgidum L. var. dicoccoides). Crop Sci. 31, 645–649.
Carleton, M.A. (1901) Macaroni wheats. U.S. Dep. Agric. Bur. Plant Ind. Bull. 3. 62 pp.
Carrera, A., Echenique, V., Zhang, W., Helguera, M., Manthey, F., Schrager, A., Picca, A.,
Cervigni, G. and Dubcovsky, J. (2007) A deletion at the Lpx-B1 locus associated with low
lipoxygenase activity and improved pasta color in durum wheat (Triticum turgidum ssp.durum). J. Cereal Sci. 45, 67–77.
Colmer, T.D., Flowers, T.J. and Munns, R. (2006) Use of wild relatives to improve salt tolerance in
wheat. J. Exp. Bot. 57, 1059–1078.
Clarke, J.M. (2005) Durum wheat improvement in Canada. In: C. Royo, M.N. Nachit, N. Di
Fonzo, J.L. Araus, W.H. Pfeiffer and G.A. Slafer (Eds.), Durum Wheat Breeding: CurrentApproaches and Future Strategies. Food Products Press, New York, pp. 921–938.
Chee, P.W., Elias, E.M., Anderson, J.A. and Kianian, S.F. (2001) Evaluation of a high grain
protein QTL from Triticum turgidum L. var. dicoccoides in an adapted durum wheat back-
ground. Crop Sci. 41, 295–301.
De Vita, P., Nicosia, O.L.D., Nigro, F., Platani, C., Riefolo, C., Di Fonzo, N. and Cattivelli, L.
(2007) Breeding progress in morpho-physiological, agronomical and qualitative traits of
durum wheat cultivars released in Italy during the 20th century. Eur. J. Agron. 26, 39–53.
Dexter, J.E. and Matsuo, R.R. (1977) Influence of protein content on some durum wheat quality
parameters. Can. J. Plant Sci. 57, 717–727.
220 C. Royo et al.
Dick, J.W. and Quick, J.S. (1983) A modified screening test for rapid estimation of gluten strength
in early-generation durum wheat breeding lines. Cereal Chem. 60, 315–318.
Di Fonzo, N., Ravaglia, S., DeAmbrogio, E., Blanco, A. and Troccoli, A. (2005) Durum wheat
improvement in Italy. In: C. Royo, M.N. Nachit, N. Di Fonzo, J.L. Araus, W.H. Pfeiffer and
G.A. Slafer (Eds.), Durum Wheat Breeding: Current Approaches and Future Strategies. FoodProducts Press, New York, pp. 825–881.
Donmez, E., Sears, R.G., Shroyer, J.P. and Paulsen, G.M. (2001) Genetic gain in yield attributes of
winter wheat in the Great Plains. Crop Sci. 41, 1412–1419.
Duggan, B.L., Richards, R.A., van Herwaarden, A.F. and Fettell, N.A. (2005) Agronomic evalua-
tion of a tiller inhibition gene (tin) in wheat. I. Effect on yield, yield components, and grain
protein. Aust. J. Agric. Res. 56, 169–178.
Elias, E.M., Stack, R.W. and Mitchell-Fetch, J. (1995) To search for sources of resistance to
fusarium head blight in durum wheat. Current Research on Fusarium Head Blight of SmallGrains, North Dakota State University, USA.
Elias, E.M., Stack, R.W. and Joppa, L.R. (1996a) Identification and development of resistant
durum germplasm to fusarium head blight. Current Research on Fusarium Head Blight ofSmall Grains. North Dakota State University, USA.
Elias, E.M., Steiger, D.K. and Cantrell, R.G. (1996b) Evaluation of lines derived from wild emmer
chromosome substitutions: II. Agronomic traits. Crop Sci. 36, 228–233.
Elouafi, I., Nachit, M.M. and Martin, L.M. (2001) Identification of a microsatellite on chromo-
some 7B showing a strong linkage with yellow pigment in durum wheat (Triticum turgidum L.
var. durum). Hereditas 135, 255–261.Fedak, G., Cao, W., Xue, A., Savard, M., Clarke, J. and Somers, D.J. (2007) Enhancement of
Fusarium head blight resistance in bread wheat and durum by means of wide crosses. In: H.T.
Buck, J.E. Nisi and N. Salomon (Eds.),Wheat Production in Stressed Environments. Springer,The Netherlands, pp. 91–95.
Fehr, W.R. (1987) (Eds.) Principles of Cultivar Development. McGraw-Hill, Inc. New York.
Flaksberger, C.A. (1935) Cereals Wheat. State Agricultural Publishing Company.ML., pp. 1–434.
Forster, B.P., Phillips, M.S., Miller, T.E., Baird, E. and Powell, W. (1990) Chromosome location
of genes controlling tolerance to salt (NaCl) and vigour in Hordeum vulgare and H. chilense.Heredity 65, 99–107.
Feillet, P. (1988) Protein and enzyme composition of dururm wheat. P. 93–119. In: G. Fabriani and
C. Lintas (Eds.) Durum Wheat: Chemistry and Technology. American Society of Cereal
Chemists, Inc., St. Paul, MN, pp. 47–68.
Frankel, O.H., Brown, A.H.D. and Burdon, J.J. (1995) The Conservation of Plant Biodiversity.Cambridge: Cambridge University Press.
Gale, M.D. and Gregory, R.S. (1977) A rapid method for early generation selection of dwarf
genotypes in wheat. Euphytica 126, 733–739.
Gale, M.D. and Marshall, G.A. (1976) The chromosomal location of Gai1 and Rht1 genes for
gibberellin insensitivity and semi-dwarfism in a derivative of Norin 10 wheat. Heredity 37,
283–289.
Gale, M.D., Law, C.N. and Worland, A.J. (1975) The chromosomal location of a major dwarfing
gene from Norin 10 in new British semi dwarf wheats. Heredity 35, 417–421.
Gelin, J.R., Elias, E.M. and Kianian, S.F. (2005) Evaluation of two durum wheat (Triticumturgidum L. var. durum) crosses for pre-harvest sprouting resistance. Field Crops Res. 97,
188–196.
Grasso, V. (1968) Gli ustilaginali dei cereali in Italia (1938–1968). Abstract od Annali dellaFacolta di Agraria, Bari, Italy, Vol. XII, 239–308.
Grzybowski, R.A. and Donnelly, B.J. (1979) Cooking properties of spaghetti: factors affecting
cooking quality. J. Agric. Food Chem. 27, 380–384.
Grifoni, R. (1964) Appulo: nuovo grano duro precoce. Terra Pugliese, 13, 1.
Grignac, P. (1965) Contribution a l’etude du Triticum durum Desf. Paris: These Fac. De Toulouse.
Durum Wheat Breeding 221
Hare, R.A. (1997) Characterization and inheritance of adult plant stem rust resistance in durum
wheat. Crop Sci. 37, 1094–1098.
Hare, R.A., Du Cros, D.L. and Barnes, W.C. (1986) Genetic linkage between glume color and
gliadin proteins in durum wheat. Crop Sci. 26, 831–833.
Herrera-Foessel, S.A., Singh, R.P., Huerta-Espino, J., Yuen, J. and Djurle, A. (2005) New genes
for leaf rust resistance in CIMMYT durum wheats. Plant Dis. 89, 809–814.
Herrera-Foessel, S.A., Singh, R.P., Huerta-Espino, J., Crossa, J., Djurle, A. and Yuen, J. (2007)
Evaluation of slow rusting resistance components to leaf rust in CIMMYT durum wheats.
Euphytica 155, 361–369.
Icard-Verniere, C. and Feillet, P. (1999) Effects of mixing conditions on pasta dough development
and biochemical changes. Cereal Chem. 76, 558–565.
ICARDA (1980). Annual Report for RDTN, Aleppo, Syria.
Irvine, G.N. and Winkler, C.A. (1950) Factors affecting the color of macaroni. II. Kinetic studies
of pigment destruction during mixing. Cereal Chem. 27, 205–218.
Jackson, E.A., Holt, L.M. and Payne, P.I. (1983) Characterization of high-molecular-weight
gliadin and low-molecular-weight glutenin subunits of wheat endosperm by two-dimensional
electrophoresis and the chromosomal location of their controlling genes. Theor. Appl. Genet.
66, 29–37.
Johnston, R.A., Quick, J.S. and Hammond, J.J. (1983) Inheritance of semolina color in six durum
wheat crosses. Crop Sci. 23, 607–610.
Joppa, L.R. (1973) Agronomic characteristics of near-isogenic tall and semidwarf lines of durum
wheat. Crop Sci. 13, 743–746.
Joppa, L.R. and Cantrell, R.G. (1990) Chromosomal location of genes for grain protein content in
wild tetraploid wheat. Crop Sci. 30, 1059–1064.
Joppa, L.R. and Williams, N.D. (1988) Genetics and beeding of durum wheat in the United States.
In: G. Fabriani and C. Lintas (Ed.), Durum Chemistry and Technology. American Association
of Cereal Chemists, St. Paul, pp. 47–68.
Joppa, L.R., Hareland, G.A. and Cantrell, R.G. (1991) Quality characteristics of the Langdon
durum-dicoccoides chromosome substitution lines. Crop Sci. 31, 1513–1517.
Joppa, L.R., Du, C., Hart, G.E. and Hareland, G.A. (1997) Mapping gene(s) for grain protein in
tetraploid wheat (Triticum turgidum L.) using a population of recombinant inbred chromosome
lines. Crop Sci. 37, 1586–1589.
Kara, Y., Martin, A., Souyris, I., Rekika, D. and Monneveux, P. (2000) Root characteristics in
durum wheat (T. turgidum conv. durum) and some wild Triticeae species. Genetic variation
and relationship with plant architecture. Cereal Res. Commun. 28, 247–254.
King, I.P., Forster, B.P., Law, C.C., Cant, K.A., Orford, S.E., Gorham, J., Reader, S. and Miller, T.E.
(1997) Introgression of salt-tolerance genes from Thinopyrum bessarabicum into wheat. New
Phytologist 137, 75–81.
Knott, D.R. (1995) Durum wheat. In: A.E. Slinkard and D.R. Knott (Eds.), Harvest of Gold: TheHistory of Field Crop Breeding in Canada. University Extension Press, University of Sas-
katchewan, Saskatoon, Canada. pp. 67–81.
Liesle, D.F., Kosmolack, F.G. and Kovacs, M. (1981) Association of glume color with gluten
strength and gliadin proteins in durum wheat. Can. J. Plant Sci. 61, 149–151.
Maccaferri, M., Sanguineti, M.C., Donini, P. and Tuberosa, R. (2003) Microsatellite analysis
reveals a progressive widening of the genetic basis in the elite durum wheat germplasm. Theor.
Appl. Genet. 107, 783–797.
Maccaferri, M., Sanguineti, M.C., Donini, P., Porcedu, E. and Tuberosa, R. (2005) A retrospective
analysis of genetic diversity in durum wheat elite germplasm based on microsatellite analysis:
a case study. In: C. Royo, M.N. Nachit, N. Di Fonzo, J.L. Araus, W.H. Pfeiffer and G.A. Slafer
(Eds.), Durum Wheat Breeding: Current Approaches and Future Strategies. Food Products
Press, New York, pp. 99–142.
222 C. Royo et al.
MacKey, J. (2005) Wheat: Its concept, evolution and taxonomy. In: C. Royo, M. Nachit, N. Di
Fonzo, J.L. Araus, W.H. Pfeiffer and G.A. Slafer (Eds.), Durum Wheat Breeding: CurrentApproaches and Future Strategies. Food Products Press, New York, pp. 3–61.
Manna, F., Borrelli, G.M., Massardo, D.R., Wolf, K., Alifano, P., Del Giudice, L. and DiFonzo, N.
(1998) Differential expression of lipoxygenase genes among durum wheat cultivars. Cereal
Res. Commun. 26, 23–30.
Mano, Y. and Takeda, K. (1998) Genetic resources of salt tolerance in wild Hordeum species.
Euphytica 103, 137–141.
Martinez, F., Sillero, J.C. and Rubiales, D. (2007) Resistance to leaf rust in cultivars of bread
wheat and durum wheat grown in Spain. Plant Breeding 126, 13–18.
Martos, V., Royo, C., Rharrabti, Y. and Garcıa del Moral, L.F. (2005) Using AFLPs to determine
phylogenetic relationships and genetic erosion in durum wheat cultivars released in Italy and
Spain throughout the 20th century. Field Crops Res. 91, 107–116.
Martynov, S.P., Dobrotvorskaya, T.V. and Pukhalskiy, V.A. (2005) Analysis of genetic diversity
of spring durum wheat (Triticum durumDesf.) cultivars released in Russia in 1929–2004. Russ.
J. Genet. 41, 1113–1122.
Maskus, K.E. (2006) Intellectual property rights in agriculture and the interests of Asian-Pacific
economies. The World Economy 29, 715–742.
McCaig, T.N. and Clarke, J.M. (1995) Breeding durum wheat in western Canada. Historical trends
in yield and related variables. Can. J. Plant Sci. 75, 55–60.
McIntosh, R.A., Wellings, C.R. and Park, R.F. (1995)Wheat Rusts: An Atlas of Resistance Genes.CSIRO, Australia.
McClung, A.M. and Cantrell, R.G. (1986) Inheritance of gluten, color, and gluten strength in
durum wheat. Euphytica 35, 885–890.
McVittie, J.A., Gale, M.D., Marshall, G.A. and Westcott, B. (1978) The intrachromosomal
mapping of the Norin 10 and Tom Thumb dwarfing genes. Heredity 40, 67–70.
Medini, M. Hamza, S., Rebai, A. and Baum, M. (2005) Analysis of genetic diversity in Tunisian
durum wheat cultivars and related wild species by SSR and AFLP markers. Genet. Resour.
Crop Evol. 52, 21–31.
Monneveux, P., Reynolds, M.P. and Ribaut, J.M. (2005) Physiological basis of yield potential in
durum wheat. In: C. Royo, M. Nachit, N. Di Fonzo, J.L. Araus, W.H. Pfeiffer and G.A. Slafer
(Eds.), Durum Wheat Breeding: Current Approaches and Future Strategies. Food Products
Press, New York, pp. 425–460.
Moragues, M., Zarco-Hernandez, J., Moralejo, M.A. and Royo, C. (2006) Genetic diversity of
glutenin protein subunits composition in durum wheat landraces [Triticum turgidum ssp.
turgidum convar. durum (Desf.) MacKey] from the Mediterranean basin. Genet. Resour.
Crop Evol. 53, 993–1002.
Moragues, M., Moralejo, M., Sorrells, M.E. and Royo, C. (2007) Dispersal of durum wheat
[Triticum turgidum L. ssp. turgidum convar. durum (Desf.) MacKey] landraces across the
Mediterranean basin assessed by AFLPs and microsatellites. Genet. Resour. Crop Evol. 54,
1133–1144.
Mujeeb-Kazi, A. (2005) Wide crosses for durum wheat improvement. In: C. Royo, M. Nachit, N.
Di Fonzo, J.L. Araus, W.H. Pfeiffer and G.A. Slafer (Eds.), Durum Wheat Breeding: CurrentApproaches and Future Strategies. Food Products Press, New York, pp. 703–743.
Nalam, V.J., Vales, M.I, Watson, C.J., Kianian, S.F. and Reera-Lizarazu, O. (2006) Map-based
analysis of genes affecting the brittle rachis character in tetraploid wheat (Triticum turgidumL.). Theor. Appl. Genet. 112, 373–381.
Nesbitt, M. and Samuel, D. (1996) From staple crop to extinction? The archaeology and history of
hulled wheat. In: S. Padulosi, K. Hammer and J. Heller (Eds.), Hulled Wheats. Rome, Interna-
tional Plant Genetics Resources Institute, pp. 40–99.
Nicholson, P., Gosman, N., Draeger, R., Thomsett, M., Chandler, E. and Steed, A. (2007) The
Fusarium head blight pathosystem: status and knowledge of its components. In: H.T. Buck,
Durum Wheat Breeding 223
J.E. Nisi and N. Salomon (Eds.), Wheat Production in Stressed Environments. Springer, TheNetherlands, pp. 23–36.
Otto, C.D., Kianian, S.F., Elias, E.M., Stack, R.W. and Joppa, L.R. (2002) Genetic dissection of a
major Fusarium head blight QTL in tetraploid wheat. Plant Mol. Biol. 48, 625–632.
Palamarchuk, A. (2005) Selection strategies for traits relevant for winter and facultative durum
wheat. In: C. Royo, M. Nachit, N. Di Fonzo, J.L. Araus, W.H. Pfeiffer and G.A. Slafer (Eds.),
Durum Wheat Breeding: Current Approaches and Future Strategies. Food Products Press,
New York, pp. 599–644.
Pardey, P., Koo, B. and Nottenburg1, K. (2003) Creating, protecting, and using crop biotechnol-
ogies worldwide in an era of intellectual property. In WIPO-UPOV Symposium on intellectual
property rights in plant biotechnology. Geneva. pp. 2–39.
Payne, P.I., Corfield, K.G., Jackson, E.R. and Law, C.N. (1984) Wheat storage proteins: Their
genetics and their potential for manipulation by plant breeding. Philos. R. Soc. Lond. Ser. B.
304, 359–371.
Pecetti, L. and Annicchiarico, P. (1998) Agronomic value and plant type of Italian durum wheat
cultivars from different eras of breeding. Euphytica 99, 9–15.
Pecetti, L., Annicchiarico, P. and Damania, A.B. (1992) Biodiversity in a germplasm collection of
durum wheat. Euphytica 60, 229–238.
Pfeiffer, W.H. and Payne, T.S. (2005) CIMMYT durum wheat improvement program. In: C. Royo,
M. Nachit, N. Di Fonzo, J.L. Araus, W.H. Pfeiffer and G.A. Slafer (Eds.), Durum WheatBreeding: Current Approaches and Future Strategies. Food Products Press, New York,
pp. 1031–1048.
Pfeiffer, W.H., Sayre, K.D. and Mergoum, M. (1996) Enhancing genetic grain yield potential in
durum wheat and triticale. In: M.P. Reynolds, S. Rajaram and A. McNab (Eds.), IncreasingYield Potential in Wheat: Breaking the Barriers. CIMMYT, Mexico, pp. 90–100.
Pfeiffer, W.H., Sayre, K.D. and Reynolds, M.P. (2000) Enhancing genetic gain yield potential and
yield stability in durum wheat. In: C. Royo, M.M. Nachit, N. Di Fonzo, and J.L. Araus (Eds.),
Durum Wheat Improvement in the Mediterranean Region: New Challenges. Options
Mediterraneennes, Series A. 40, 88–93.
Pogna, N.E., Lafiandra, D., Feillet, P. and Autran, J.C. (1988) Evidence of a direct causal effect of
low molecular weight subunits of glutenins of on gluten viscoelasticity in durum wheat.
J. Cereal Sci. 7, 211–214.
Pogna, N.E. Autran, J.C., Mellini, F. Lafiandra, D. and Feillet, P. (1990) Chromosome 1B-encoded
gliadins and glutenin subunits in durum wheat: genetics and relationship of gluten strength.
J. Cereal Sci. 11, 15–34.
Pozniak, C.J., Knox, R.E., Clarke, F.R. and Clarke, J.M. (2007) Identification of QTL and
association of a phytoene synthase gene with endosperm colour in durum wheat. Theor.
Appl. Genet. 114, 525–537.
Rajaram, S. (2001) Prospects and promise of wheat breeding in the 21st century. Euphytica 119,
3–15.
Rajaram, S.D. and van Ginkel, M. (2001) Mexico: 50 years of international wheat breeding. In:
A.P. Bonjean and W.J. Angus (Eds.), The World Wheat Book, a History of Wheat Breeding.Lavoisier Publishing, Paris, pp. 579–608.
Rawashdeh, N.K., Haddad, N.I., Al-Ajlouni, M.M. and Turk, M.A. (2007) Phenotypic diversity of
durum wheat (Triticum durum Desf.) from Jordan. Genet. Resour. Crop Evol. 54, 129–138.
Rebetzke, G.J., Richards, R.A., Sirault, X.R.R. and Morrison, A.D. (2004) Genetic analysis of
coleoptile length and diameter in wheat. Aust. J. Agric. Res. 55, 733–743.
Rebetzke, G.J., Richards, R.A., Fettell, N.A., Long, M., Condon, A.G., Forrester, R.I. and
Botwright, T.L. (2007) Genotypic increases in coleoptile length improves stand establishment,
vigour and grain yield of deep-sown wheat. Field Crops Res. 100, 10–23.
Reynolds, M.P, Van Beem, J., Van Ginkel, M. and Hoisington, D. (1996) Breaking the yield
barriers in wheat: a brief summary of the outcomes of an international consultation. In: M.P.
224 C. Royo et al.
Reynolds, S. Rajaram and A. McNab (Eds.), Increasing Yield Potential in Wheat: Breaking theBarriers. CIMMYT, Mexico, pp. 1–10.
Reynolds, M.P., Pellegrineschi, A. and Skovmand, B. (2005) Sink-limitation to yield and biomass:
a summary of some investigations in spring wheat. Ann. Appl. Biol. 146, 39–49.
Roelfs, A.P., Singh, R.P. and Saari, E.E. (1992) Rust Diseases of Wheat: Concepts and Methods ofDisease Management. CIMMYT, Mexico, D.F.
Royo, C., Nachit, M., Di Fonzo, N., Araus, J.L., Pfeiffer, W.H. and. Slafer, G.A. (Eds.) (2005)
Durum Wheat Breeding: Current Approaches and Future Strategies. Food Products Press,
New York, 1084 pp.
Royo, C., Alvaro, F., Martos, V., Ramdani, A., Isidro, J., Villegas, D. and Garcıa del Moral, L.F.
(2007) Genetic changes in durum wheat yield components and associated traits in Italian and
Spanish varieties during the 20th century. Euphytica 155, 259–270.
Royo, C. and Briceno-Felix, G.A. Spanish Wheat Pool. In: A.P. Bonjean, W.J. Angus and M. van
Ginkel (Eds.), The World Wheat Book 2, a History of Wheat Breeding. Groupe Limagrain.
Lavoisier Publishing, Paris (in press).
Royo, C., Martos, V., Ramdani, A., Villegas, D., Rharrabti, Y. and Garcıa del Moral, L.F. (2008)
Changes in yield and carbon isotope discrimination of Italian and Spanish durum wheat during
the 20th century. Agron J. 100, 352–360.
Rosielle, A.A. (1972) Source of resistance in wheat to speckle leaf blotch caused by Septoriatritici. Euphytica 21, 152–161.
Ruuska, S.A., Rebetzke, G.J., van Herwaarden, A.F., Richards, R.A., Fettell, N.A., Tabe, L. and
Jenkins, C.L.D. (2006) Genotypic variation in water-soluble carbohydrate accumulation in
wheat. Funct. Plant Biol. 33, 799–809.
Scarascia-Mugnozza, G.T., Bagnara, D. and Bozzini, A. (1972) Mutagenesis applied to durum
wheat: results and perspective. In: Induced Mutations and Plant Improvement, IAEA Publ,
pp. 183–198.
Siedow, J.N. (1991) Plant lipoxygenase: Structure and function. Annu. Rev. Plant Physiol. Plant
Mol. Biol. 4, 145–188.
Singh, R.P., Huerta-Espino, J., Pfeiffer, W. and Figueroa-Lopez, P. (2004) Occurrence and impact
of a new leaf rust race on durum wheat in Northwestern Mexico from 2001 to 2003. Plant Dis.
88, 703–708.
Singh, R.P., Huerta-Espino, J., Fuente, G., Duveiller, E., Gilchrist, L., Henry, M. and Nicol, J.M.
(2005) Resistance to diseases. In: C. Royo, M. Nachit, N. Di Fonzo, J.L. Araus, W.H. Pfeiffer
and G.A. Slafer (Eds.), Durum Wheat Breeding: Current Approaches and Future Strategies.Food Products Press, New York, pp. 291–327.
Singh, R.P., Kinyua, M.G., Wanyera, R., Njau, P., Jin, Y. and Huerta-Espino, J. (2007) Spread of a
highly virulent race of Puccinia graminis tritici in Eastern Africa: Challenges and opportu-
nities. In: H.T. Buck, J.E. Nisi and N. Salomon (Eds.),Wheat Production in Stressed Environ-ments. Springer, The Netherlands, pp. 51–57.
Skovmand, B., Warburton, M.L., Sullivan, S.N. and Lage, J. (2005) Managing and collecting
genetic resources. In: C. Royo, M. Nachit, N. Di Fonzo, J.L. Araus, W.H. Pfeiffer and G.A.
Slafer (Eds.), Durum Wheat Breeding: Current Approaches and Future Strategies. FoodProducts Press, New York, pp. 143–163.
Snape, J.W. and Moore, G. (2007) Reflections and opportunities: gene discovery in the complex
wheat genome. In: H.T. Buck, J.E. Nisi and N. Salomon (Eds.), Wheat Production in StressedEnvironments. Springer, The Netherlands, pp. 677–684.
Solomon, K.F., Labuschagne, M.T. and Viljoen, C.D. (2007) Estimates of heterosis and associa-
tion of genetic distance with heterosis in durum wheat under different moisture regimes. J.
Agric. Sci. 145, 239–248.
Tesemma, T. and Bechere, E. (1998) Developing elite durum wheat landrace selections (compo-
sites) for Ethiopian peasant farm use: raising productivity while keeping diversity alive.
Euphytica 102, 323–328.
Durum Wheat Breeding 225
Vallega, J., and Zitelli, A, (1973) New high yielding Italian durum wheat varieties. In Proc. of the
Symposium on Genetics and Breeding of Durum Wheat, ed. G.T. Scarascia Mugnozza,
University of Bari, Italy, pp 373–399.
Valkoun, A.J. (2001) Wheat pre-breeding using wild progenitors. Euphytica 119, 17–23.
Waddington, S.R., Osmazai, M., Yoshida, M. and Ranson, J.K. (1987) The yield of durum wheats
released in Mexico between 1960 and 1984. J. Agric. Sci. Camb. 108, 469–477.
Watanabe, N., Akond, A.S.M.G.M. and Nachit, M.M. (2006) Genetic mapping of the gene
affecting polyphenol oxidase activity in tetraploid durum wheat. J. Appl. Genet. 47, 201–205.
Worland, T. and Snape, J.W. (2001) Genetic basis of worldwide wheat varietal improvement. In:
A.P. Bonjean and W.J. Angus (Eds.), The World Wheat Book, a History of Wheat Breeding.Lavoisier Publishing, Paris, pp. 59–100.
Yang, R.C., Jana, S. and Clarke, J.M. (1991) Phenotypic diversity and associations of some
potentially drought-responsive characters in durum-wheat. Crop Sci. 31, 1484–1491.
Zhang, H. and Knott, D.R. (1990) Inheritance of leaf rust resistance in durum wheat. Crop Sci. 30,
1218–1222.
226 C. Royo et al.
Barley
R.D. Horsley, J.D. Franckowiak, and P.B. Schwarz
Abstract Barley (Hordeum vulgare L.) is the cereal crop with the widest range of
production areas in the world. Compared to other cereals, barley is fourth in world
production behind maize (Zea mays L.), wheat (Triticum aestivum L.), and rice
(Oryza sativa L.). Barley has many uses, including livestock feed and forage,
human food, and malt beverages. Barley to be used for malting must meet speci-
fications for germination, kernel size and weight, grain protein, activity of several
enzymes, and many other traits. Barley for livestock and human food uses has much
fewer restrictions, but they are also critical in cultivar utilization. Likewise, quality
traits for barley used as forage are less well-defined, but they are important in
cultivar acceptance. This chapter outlines the different types of barley (e.g. six- vs.
two-rowed and malting vs. feed), items to consider when choosing parents for
crossing, current goals barley breeders, major breeding achievements, an example
of a breeding scheme for developing malting barley cultivars, examples of integra-
tion of biotechnology methods into breeding programs, and issues related to
cultivar release and intellectual property protection.
1 Introduction
Barley (Hordeum vulgare L.) is the cereal crop with the widest range of productionareas in the world. It is often the last cereal crop grown at the highest altitudes in the
Andes and Himalaya mountains; adjacent to the deserts of Africa, the Middle East,
and China; and near the artic circle in the northern reaches of Asia, Europe, and
North America. Because of its wide adaptation, barley often is grown where maize
(Zea mays L.) is unadapted or is not competitive with barley. Barley is frequently
considered by farmers the safest and easiest annual cool-season crop to grow for
grain. Compared to other cereals, barley is a distant fourth in world production
R.D. Horsley(*)
North Dakota State University, Department of Plant Sciences, NDSU Dept. 7060, Po Box 6050,
Fargo, ND 58108-6050, USA, e-mail: [email protected]
M.J. Carena (ed.), Cereals,DOI: 10.1007/978-0-387-72297-9, # Springer Science + Business Media, LLC 2009 227
behind maize, wheat (Triticum aestivum L.), and rice (Oryza sativa L.) (FAO,
http://faostat.fao.org/).
Barley has many uses, including livestock feed and forage, human food, and
malt beverages. Barley to be used for malting must meet specifications for germi-
nation, kernel size and weight, grain protein, activity of several enzymes, and many
other traits. Barley for livestock and human food uses has much fewer restrictions,
but they are also critical in cultivar utilization. Likewise, quality traits for barley
used as forage are less well-defined, but they are important in cultivar acceptance.
2 Genetic Diversity
Like many cereal crops, the center of origin of barley is the Fertile Crescent area of
southwest Asia (Bothmer et al., 2003, for review and references). The genus
Hordeum consists of approximately 32 species (Bothmer et al., 2003), of which
H. vulgare subsp. vulgare (2n = 2x = 14) is referred to as cultivated barley and the
original progenitor of cultivated barley, H. vulgare subsp. spontaneum [(C. Koch)
Thell.] (2n = 2x = 14) is often referred to as ‘‘wild barley’’. H. vulgare subsp.
spontaneum is found growing today from Morocco in northern Africa through
southwest Asia and into the highlands of central Asia. H. vulgare subsp. sponta-neum is an important, but underutilized source of genes for resistances to multiple
diseases (Fetch et al., 2003), agronomic performance (Pillen and Leon, 2003), and
possibly malt quality (Matus et al., 2003; Erkkila et al., 1998).
The primary genepool of H. vulgare consists of cultivars of cultivated barley,
landraces, and H. vulgare subsp. spontaneum (Harlan and de Wet, 1971). A major
advantage of using H. vulgare subsp. spontaneum as a source of genes is that it
readily crosses with cultivated barley. The secondary genepool consists only of the
perennial grass H. bulbosum L. Genes from H. bulbosum can be transferred to
cultivated barley via crossing, but embryo rescue must be used to generate viable
plants. In addition, the success of transferring genes is dependent on growth
conditions, especially temperature, and genotypes of the cultivated barley and
H. bulbosum used as parents (Pickering, 1989). An example of the successful
transfer of a gene from H. bulbosum to cultivated barley is the transfer of a gene
for powdery mildew resistance, incited by Erysiphe graminis DC. f. sp. hordei Em.
Marchal (Pickering et al., 1995). The remaining Hordeum species belong to the
tertiary genepool and obtaining successful crosses between them and cultivated
barley is very difficult (Bothmer et al., 1983).
3 Types of Barley
The floral structure of the barley plant is a spike, or, as it is sometimes referred to,
a head or ear (Bergal and Clemencet, 1962). Barley can be divided into two
groups based on spike morphology, six-rowed and two-rowed barley (Fig. 1).
228 R.D. Horsley et al.
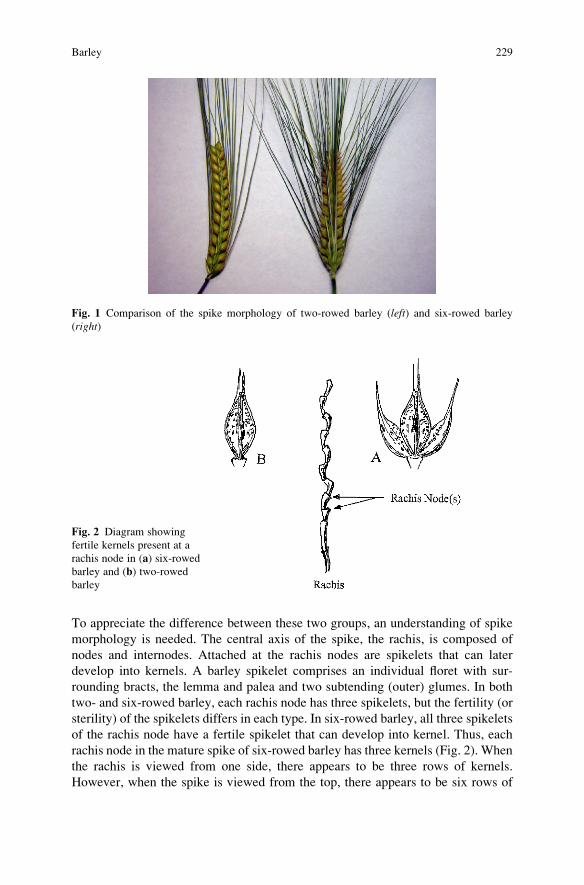
To appreciate the difference between these two groups, an understanding of spike
morphology is needed. The central axis of the spike, the rachis, is composed of
nodes and internodes. Attached at the rachis nodes are spikelets that can later
develop into kernels. A barley spikelet comprises an individual floret with sur-
rounding bracts, the lemma and palea and two subtending (outer) glumes. In both
two- and six-rowed barley, each rachis node has three spikelets, but the fertility (or
sterility) of the spikelets differs in each type. In six-rowed barley, all three spikelets
of the rachis node have a fertile spikelet that can develop into kernel. Thus, each
rachis node in the mature spike of six-rowed barley has three kernels (Fig. 2). When
the rachis is viewed from one side, there appears to be three rows of kernels.
However, when the spike is viewed from the top, there appears to be six rows of
Fig. 2 Diagram showing
fertile kernels present at a
rachis node in (a) six-rowed
barley and (b) two-rowed
barley
Fig. 1 Comparison of the spike morphology of two-rowed barley (left) and six-rowed barley
(right)
Barley 229
kernels. In two-rowed barley, only the central spikelet is fertile and will develop
into a kernel. The two lateral spikelets are sterile. When the spike is viewed from
above, there appears to be two rows of kernels.
The control of the fertility of the lateral spikelets is controlled by genes at the
vrs1 locus on chromosome 2H (Franckowiak and Lundqvist, 1997; Komatsuda
et al., 2007). The two-rowed character is dominant; hence, six-rowed is homozy-
gous recessive (vrs1 vrs1) for the vrs1 locus. The size of the lateral spikelets in
barley is controlled by the Int-c locus on chromosome 4H (Lundquist and
Franckowiak). Large lateral spikelet size is dominant; thus, the genotype of a six-
rowed spike is vrs1 vrs1 Int c Int-c and a two-rowed spike has the genotype Vrs1Vrs1 int-c int-c. Because the row number and size of lateral spikelets are under
control of single genes, there are no problems making crosses between six-rowed
and two-rowed barley.
Barley also can be grouped based on its intended use, malting or non-malting,
and the two types are usually segregated for storage. The level of segregation is
dependent on the requirements of the brewer. The malt blend used by a brewer may
be a general list of what cultivars may be included, or it may be specified that the
blend contain specific percentages of particular cultivars. In the latter case, each
cultivar must be stored and malted separately and then the cultivars are blended
before the malt shipment is sent to the brewer.
Barley malt is produced in a process where the barley is steeped in water to bring
the moisture to �43% moisture, germinated for 4–5 days, and dried or kilned.
These three processes are performed under closely monitored conditions. During
the malting process, the protein-cell wall matrix of the endosperm is modified or
broken down by enzymes that are produced and/or released during germination.
This process, called malt modification, exposes starch granules in the endosperm
that can be acted upon by amylytic enzymes during brewing to produce fermentable
sugars and releases nutrients used by yeast during fermentation. Both two-rowed
and six-rowed barley can be used for malting, but two-rowed barley is more
commonly used worldwide due to its larger kernels, higher malt extract levels,
and tradition. Large amounts of six-rowed barley are used in North America
because of its higher enzyme content and other characteristics that are useful
when beer is made with malt plus adjuncts (e.g., rice, maize, or sugar) (Schwarz
and Horsley, http://brewingtechniques.com/bmg/schwarz.html).
Other categories used to group barley include growth habit (i.e., spring, winter,
or facultative) and hull adherence (i.e., hulled or hulless). In many countries where
barley is a traditional crop, desirable attributes are associated with specific cultivars
or groups of cultivars for example soft straw, black seed, smooth awns, waxy starch,
or specific photoperiod responses. Malting barley cultivars commonly have the
spring growth habit; however, some winter six-rowed cultivars, such as Plaisant in
France, have been developed and used for malting. In the United States, breeding
programs at Oregon State University and the United States Department of Agricul-
ture – Agricultural Research Service (USDA-ARS) program at Aberdeen, Idaho
have as a priority development of winter malting barley. In Europe, non-malting
barley cultivars typically have the winter growth habit. Cultivars with this growth
230 R.D. Horsley et al.
habit often have a higher yield potential than spring barley because grain fill occurs
during the cooler part of summer as compared to spring barley. Emphasis in
developing winter malting barley in Europe is increasing due to farmers’ demands
and the need to ensure there is sufficient quantities of barley suitable for malting
and brewing. In areas where winter temperatures are milder, production of fall-
sown spring barley is common. The worldwide increase in demand for fuels derived
from plants, biofuels, will result in more competition among the crops that growers
produce. Land sown to crops used for production of biofuels, such as maize,
sorghum (Sorghum bicolor L.), rapeseed (Brasica napus L. and B. campestris L.),and wheat will likely increase at the expense of crops such as barley and pulses.
To date, almost all malting barley for brewing beer is hulled because the hulls
serve as a filter bed during the lautering process. However, there is some discussion
on use of hulless barley for brewing when mash filters are used instead of lautering
tuns. The largest use of hulless barley is for human food consumption. Hulless
barley is a food staple in the Andean and Himalayan regions, and is gaining
popularity in many other regions of the world due to its health benefits (Behall
and Hallfrisch, 2006, for review and references). Hulless barley also has been used
for some classes of livestock feed and has potential for the production of ethanol.
4 Choice of Germplasm
The choice of germplasm to use for crossing is most critical for developing locally
acceptable barley cultivars. Barley cultivars need to be adapted to specific produc-
tion areas and designed for specific uses. Malting barley, for example, is unique from
most other crops in that it is usually marketed and stored on an identity preserved
basis. As described earlier, malting barley cultivars are kept segregated from non-
malting barley cultivars, and often from each other, when they are sold and stored.
This segregation is done because cultivars used for malting and brewing must meet a
long list of specific criteria before they will be accepted for use by maltsters and
brewers. Guidelines for these characteristics, which includemeasurements on barley
and malt, often are provided to the breeders by organizations in the countries where
they work. Table 1 presents target requirements specified by the American Malting
Barley Association, Inc. (AMBA, Milwaukee, WI) in the United States for two-
rowed and six-rowed barley to be used by its member companies. The parameters
that receive the most attention in breeding programs are grain protein, kernel
plumpness, malt extract, enzymatic activity (a-amylase and diastatic power), and
measures of modification (b-glucan content, viscosity, or friability). A detailed
description of these malt parameters and others can be found in Kunze (2004).
Because of the long list of parameters that must be met, development of malting
barley cultivars is frequently done using crosses between parents that have accept-
able quality. Any limitations in malt quality of either parent usually appear in the
progeny. This need to make crosses between parents with acceptable quality has
led to very narrow germplasm bases because variability already has been severely
Barley 231
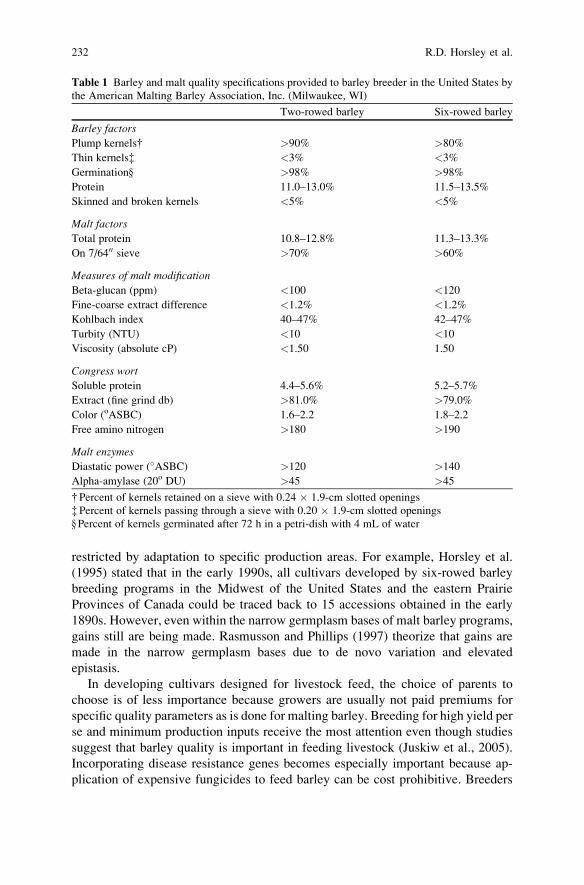
restricted by adaptation to specific production areas. For example, Horsley et al.
(1995) stated that in the early 1990s, all cultivars developed by six-rowed barley
breeding programs in the Midwest of the United States and the eastern Prairie
Provinces of Canada could be traced back to 15 accessions obtained in the early
1890s. However, even within the narrow germplasm bases of malt barley programs,
gains still are being made. Rasmusson and Phillips (1997) theorize that gains are
made in the narrow germplasm bases due to de novo variation and elevated
epistasis.
In developing cultivars designed for livestock feed, the choice of parents to
choose is of less importance because growers are usually not paid premiums for
specific quality parameters as is done for malting barley. Breeding for high yield per
se and minimum production inputs receive the most attention even though studies
suggest that barley quality is important in feeding livestock (Juskiw et al., 2005).
Incorporating disease resistance genes becomes especially important because ap-
plication of expensive fungicides to feed barley can be cost prohibitive. Breeders
Table 1 Barley and malt quality specifications provided to barley breeder in the United States by
the American Malting Barley Association, Inc. (Milwaukee, WI)
Two-rowed barley Six-rowed barley
Barley factors
Plump kernels{ >90% >80%
Thin kernels{ <3% <3%
Germination} >98% >98%
Protein 11.0–13.0% 11.5–13.5%
Skinned and broken kernels <5% <5%
Malt factors
Total protein 10.8–12.8% 11.3–13.3%
On 7/6400 sieve >70% >60%
Measures of malt modification
Beta-glucan (ppm) <100 <120
Fine-coarse extract difference <1.2% <1.2%
Kohlbach index 40–47% 42–47%
Turbity (NTU) <10 <10
Viscosity (absolute cP) <1.50 1.50
Congress wort
Soluble protein 4.4–5.6% 5.2–5.7%
Extract (fine grind db) >81.0% >79.0%
Color (oASBC) 1.6–2.2 1.8–2.2
Free amino nitrogen >180 >190
Malt enzymes
Diastatic power (�ASBC) >120 >140
Alpha-amylase (20o DU) >45 >45
{ Percent of kernels retained on a sieve with 0.24 � 1.9-cm slotted openings
{ Percent of kernels passing through a sieve with 0.20 � 1.9-cm slotted openings
}Percent of kernels germinated after 72 h in a petri-dish with 4 mL of water
232 R.D. Horsley et al.
developing hulless barley for the human consumption look to develop cultivars that
are high in soluble fiber to reduce the risk of cardiovascular disease (Behall et al.,
2004). The trait that receives the most attention is breeding for increased barley
b-glucan content.
5 Major Breeding Achievements
A unique feature of malting barley is that the life of cultivars can easily be 10 years
or more. In fact, some malting barley cultivars remain in the marketplace so long
that their name almost becomes a generic name for barley. For example, in the
1980s and 1990s, when international buyers purchased barley from Canada or the
United States, they requested Harrington. Buyers purchasing barley from Australia
at one time requested Clipper or Schooner.
A feature of the narrow germplasm base of malting barley is that the contribu-
tions of older cultivars, especially for disease resistance, are well known. In all
Midwest United States malting barley cultivars developed in North America since
the mid-1950s, the Rpg1 gene that confers resistance to wheat stem rust [incited by
Puccinia graminis f. sp. tritici (Eriks. & E. Henn.) D.M. Henderson] traces back to
the cultivar Peatland (Steffenson, 1992). Peatland is a pure line selection made at
the University of Minnesota from a Swiss landrace. The breeding line NDB112,
developed at North Dakota State University in the 1950s, has been used worldwide as
a source of resistance to the net and spot forms of net blotch [incited by Drechslerateres (Sacc.) Shoemaker f. teres and Drechslera teres f. maculata Smedeg,
respectively] and spot blotch [incited by Cochliobolus sativus (Ito & Kuribayashi)
Drechs. ex Dastur]. NDB112 is the source of durable resistance to spot blotch found
six-rowed cultivars developed in the Midwest of the United States and the Western
Prairie Provinces of Canada since the mid-1960s (Steffenson et al., 1996; Wilcox-
son et al., 1990).
Another example of a high percentage of cultivars having common genes is mloalleles that confer stable resistance to powdery mildew [incited by Blumeriagraminis (DC.) E.O. Speer f. sp. hordei Em. Marchal]. It has been estimated that
in over 70% of the European barley cultivars developed since the 1970s powdery
mildew is controlled by mlo alleles (Jorgenson, 1992). The mlo gene was first
identified in a barley mutant in 1942, but it was later found in an Ethiopian landrace
collected in the 1930s (Jorgenson, 1992).
The cultivar Diamant, developed using mutagenesis of the cultivar Valticky in
the former Czechoslovakia, is an important source of the semidwarf (sdw1) charac-ter in European barley cultivars. Triumph, developed from Diamant in the 1960s in
the former East Germany, is another important cultivar that can be found in the
pedigree of a high percentage of European malting barley cultivars (Russell et al.,
2000). Triumph also contributed a gene for resistance to leaf rust (incited by
Puccinia hordei Otth); however, this gene (Rph9.z) and a number of other leaf
rust resistance genes have been overcome by changes in pathogen races in
Barley 233
P. hordei. Stable leaf rust resistance in Europe is now provided by adult plant
resistance genes from the cultivar Vada or combinations of Rph genes.
These examples illustrate that the introduction of new genes into adapted
germplasm can be problematic and time-consuming. Testing the effects of new
genes before they are introduced into elite germplasm can be done using various
approaches that include development of near-isogenic lines (Wiebe, 1968). For
example, backcross-derived lines are used to compare genes in a common genetic
background and to minimize linkage effects. The largest group of backcross-
derived lines (over 750) developed is in the ‘‘Bowman’’ genetic background
(Davis et al., 1997).
Extensive quality parameters as are found for malting barley do not exist for feed
barley cultivars. However, feed quality attributes are being developed for several
classes of livestock. Using marker-assisted selection (MAS), the cultivarValier was
developed to incorporate excellent agronomic performance and improved feed
characters for beef cattle (Blake et al., 2002).
6 Current Goals of Breeding
The goal for breeding is dependent on whether the primary target is malting or non-
malting barley. For malting barley, maltsters and brewers specify quality para-
meters that must be met. Failure to meet all of their criteria usually results in the
cultivar not being recommended for production as a malting barley cultivar,
regardless of the other advantageous characteristics it may have. Cultivars also
must be accepted by growers because they might have more profitable alternatives.
The malting and brewing industry is conservative and is very particular when
accepting new cultivars. It is not unusual for a single cultivar to dominate the
market for 20 years or more. Examples of cultivars dominating a market for 10
years or more are the six-rowed cultivar Larker and Robust from the United States,
Conquest and Bonanza from Canada, and Plaisant from France; and the two-rowed
cultivars Harrington from Canada, Clipper and Schooner from Australia, Optic
from England, and Scarlett from Germany.
A high priority in many breeding programs is development of cultivars with
disease resistance to one or more pathogens or pests. As stated earlier, barley is
considered a low input crop; thus, it is often not financially expedient to use
chemical control. The easiest and most cost effective method of disease control is
growing resistant cultivars. The list of barley diseases caused by bacteria, fungi, and
viruses is plentiful (Mathre, 1997). Table 2 provides a partial list of important
bacterial, fungal, and viral diseases of barley. Barley diseases exist that can infect
all parts of the plant. A series of different root and crown rots severely limit root
development and plant survival. The effects of this group of diseases are especially
noticed during dry years or in dry areas of the field such as hill tops because roots
are unable to uptake sufficient water. Diseases that affect the foliage of the plants
such as the rusts, blotches, and leaf blights can severely reduce the photosynthetic
234 R.D. Horsley et al.
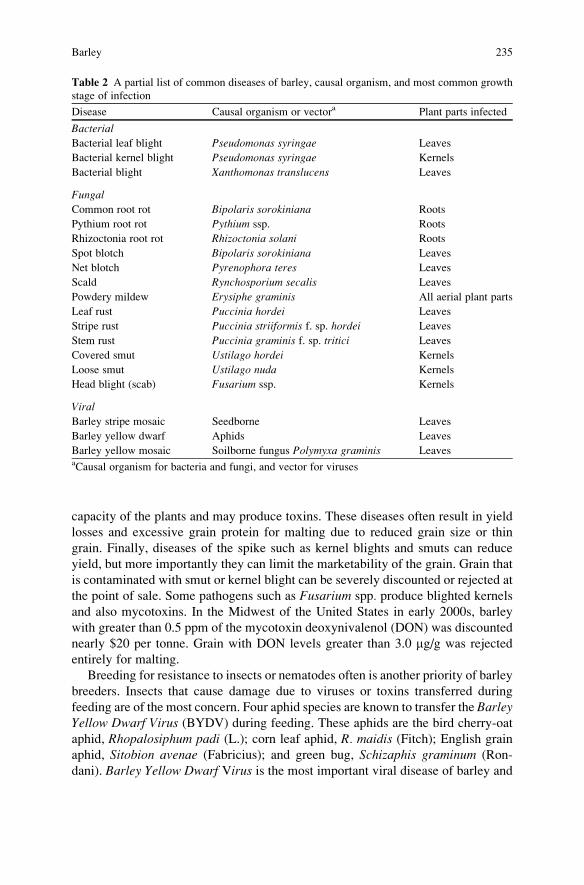
capacity of the plants and may produce toxins. These diseases often result in yield
losses and excessive grain protein for malting due to reduced grain size or thin
grain. Finally, diseases of the spike such as kernel blights and smuts can reduce
yield, but more importantly they can limit the marketability of the grain. Grain that
is contaminated with smut or kernel blight can be severely discounted or rejected at
the point of sale. Some pathogens such as Fusarium spp. produce blighted kernels
and also mycotoxins. In the Midwest of the United States in early 2000s, barley
with greater than 0.5 ppm of the mycotoxin deoxynivalenol (DON) was discounted
nearly $20 per tonne. Grain with DON levels greater than 3.0 mg/g was rejected
entirely for malting.
Breeding for resistance to insects or nematodes often is another priority of barley
breeders. Insects that cause damage due to viruses or toxins transferred during
feeding are of the most concern. Four aphid species are known to transfer the BarleyYellow Dwarf Virus (BYDV) during feeding. These aphids are the bird cherry-oat
aphid, Rhopalosiphum padi (L.); corn leaf aphid, R. maidis (Fitch); English grain
aphid, Sitobion avenae (Fabricius); and green bug, Schizaphis graminum (Ron-
dani). Barley Yellow Dwarf Virus is the most important viral disease of barley and
Table 2 A partial list of common diseases of barley, causal organism, and most common growth
stage of infection
Disease Causal organism or vectora Plant parts infected
Bacterial
Bacterial leaf blight Pseudomonas syringae Leaves
Bacterial kernel blight Pseudomonas syringae Kernels
Bacterial blight Xanthomonas translucens Leaves
Fungal
Common root rot Bipolaris sorokiniana Roots
Pythium root rot Pythium ssp. Roots
Rhizoctonia root rot Rhizoctonia solani Roots
Spot blotch Bipolaris sorokiniana Leaves
Net blotch Pyrenophora teres Leaves
Scald Rynchosporium secalis Leaves
Powdery mildew Erysiphe graminis All aerial plant parts
Leaf rust Puccinia hordei Leaves
Stripe rust Puccinia striiformis f. sp. hordei Leaves
Stem rust Puccinia graminis f. sp. tritici Leaves
Covered smut Ustilago hordei Kernels
Loose smut Ustilago nuda Kernels
Head blight (scab) Fusarium ssp. Kernels
Viral
Barley stripe mosaic Seedborne Leaves
Barley yellow dwarf Aphids Leaves
Barley yellow mosaic Soilborne fungus Polymyxa graminis LeavesaCausal organism for bacteria and fungi, and vector for viruses
Barley 235
is found worldwide. Use of resistant cultivars has provided effective control for this
disease. Russian wheat aphid, Diuraphis noxia (Kurdjumov), can cause severe
losses in some barley production areas by injecting a toxin into the plant while
feeding. As with the aphids that transmit BYDV, development of resistant cultivars
is the best control against damage by this pest.
Three nematode genera are known to cause economic damage to barley (Mathre,
1997). Cereal cyst nematodes are a complex of several species of nematode that
belong to the Heterodera avenea group. In seriously damaged plants, the roots are
stunted and produce many lateral roots. Control of this pest has been accomplished
using resistant cultivars among other methods. The cereal root-knot nematode
(Meloidogyne naasi Franklin) is known to cause economic yield losses in barley.
Damage caused by this complex of nematodes is similar to that of the cereal cyst
nematodes. Control of damage due to cereal root-knot nematodes is usually accom-
plished using crop rotation, not genetic resistance. The root-lesion nematodes,
Pratylenchus spp., can cause damage in arid environments when water stress
occurs.
Breeding for abiotic stresses are also a high priority for many barley breeders. A
non-exhaustive list of these stresses includes drought and flooding, high and low
temperatures, mineral deficiencies and toxicities, poor soil tilth (structure), or pre-
harvest sprouting. A complicating factor of abiotic stresses is that plants often are
exposed to multiple stresses at the same time and common responses to the stresses
often are elicited in plants (Langridge et al., 2006). This fact makes breeding for
abiotic stresses much more difficult than breeding for biotic stresses. Functional
genomic technologies are being used to gain a better understanding of how plants
respond to abiotic stresses (Langridge et al., 2006). However, establishment of
effective breeding strategies based on this information will be challenging.
Cultivars and accessions, including unadapted genotypes, land races, and wild
barley accessions that are resistant or tolerant to most economically important biotic
and abiotic stresses, usually can be found after sometimes exhaustive searches
(Ullrich et al., 1995). However, sources of the resistance genes are often poorly
adapted to the target environment and desirable genes may show linkage drag to
undesirable traits. When a new problem (e.g., a disease or pest) arises or resistance
breaks down in currently grown cultivars, breeders can develop improved cultivars in
a short time if they have been working on the problem. When a loss of resistance is
unanticipated, it can easily take more than 10 years to incorporate new resistance into
acceptable cultivars. In the case of malting barley, this time frame is grossly under-
estimated because stringent quality parameters must be maintained.
To maintain barley as profitable part of a cropping system, both productivity and
market access are important issues. Where both malting and non-malting barley
cultivars are grown, risk assessments by growers are based on marketability and
often determine which types of barley and cultivars are sown. Central Europe is a
production area where the balance shifted toward feed barley cultivars that have
a winter growth habit and a higher yield potential because grain-fill occurs during a
cooler portion of the summer. In areas where production of arable crops is a high-risk
undertaking, barley cultivars having multiple resistances should be advantageous.
236 R.D. Horsley et al.
This challenge has been undertaken by the ICARDA barley breeding programs
in Mexico and Syria. The ICARDA-Mexico program has demonstrated that use
of shuttle breeding can result in the development of cultivars that are high yielding
in both short-day and long-day environments (Vivar, 2001). This germplasm
also has many disease resistances and abiotic stress tolerances in improved
genetic backgrounds, but this resource is difficult to use when malting barley is
targeted.
A major challenge in barley breeding is the adaptation of introduced germplasm
to new production areas. The reasons for this can range from the occurrence of new
disease pathotypes to altered malt quality requirements for export markets. Such
production areas are often marginal for arable crops or have unique combinations of
production constraints. Using molecular tools to develop cultivars by design,
Eglinton et al. (2006) demonstrated that breeding of cultivars for a specific produc-
tion area can be successful. However, the use of similar techniques in other
programs may be limited by the number of desirable genes for which closely linked
markers have been identified (Collard et al., 2005).
Many barley breeders are expected to develop improved cultivars using limited
financial and physical resources. The two-rowed barley breeding program at North
Dakota State University (NDSU) in the United States is an example of where the
existing barley genetic resources were poorly adapted to a production area when the
program was started in the early 1970s. One advantage the two-rowed introductions
had was that they were more productive than the six-rowed cultivars developed for
the region during dry seasons in western North Dakota. To improve two-rowed
lines, crosses were made between two-rowed introductions and adapted six-rowed
cultivars. The most important selection criteria in early generations were low grain
protein (Foster et al., 1967) and kernel plumpness. The first cultivar released from
this program was Bowman (Franckowiak et al., 1985). Using a North Dakota
material, Choo et al. (2005) demonstrated that large grain size and low protein
are associated, and Emebiri et al. (2007) showed that low grain protein and high
yield are associated. The unanticipated result of the later study was recovery of
doubled-haploid (DH) lines from a single cross with yields equal to those of the best
check cultivar.
7 Breeding Methods and Techniques
To illustrate the various breeding methods and techniques used in combination to
develop barley, a breeding scheme used at NDSU for developing malting barley
cultivars is described. This scheme uses a modified-pedigree breeding method and
off-season nurseries to reduce the length of time needed to develop new cultivars by
up to three years. Applications of alternative methods of breeding, such as recurrent
selection and use of DHs or breeding for non-malting barley cultivars will be
described later. The possible substitution of these methods for those used in the
NDSU scheme will be described.
Barley 237
The breeding scheme used at NDSU is a collaborative effort between the
breeding team of a breeder, plant pathologist, and cereal chemist; regional agrono-
mists; and the malting and brewing industries. The organization representing the
malting and brewing industries is the American Malting Barley Association, Inc.
(AMBA). As described earlier, this organization provides breeders in the United
States with baseline criteria that must be met by new cultivars before they will be
recommended for use by their members.
7.1 NDSU Breeding Scheme
Each year, over 150 crosses are made with the hope that a new cultivar will be
developed. From the time of crossing to cultivar uptake, 10–12 years of extensive
testing are done on experimental lines to evaluate their agronomic, malting, and
brewing quality traits. A description of the testing a barley line must go through
before it is released as a named cultivar is listed below. The key features are
rapid generation advance and maximization of selection opportunities in early
generations.
7.2 Year 1
Crosses of selected parents are made in the fall greenhouse nursery to incorporate
such characters as high yield, disease resistance, straw strength, drought tolerance,
and malt quality. In the winter greenhouse nursery, hybrid seeds (F1) from the
crosses are sown in the greenhouse to increase seed for summer evaluation.
F2 populations are grown in the field during summer in North Dakota. The
number of plants grown for each cross depends on the purpose of the cross. For
example, in crosses made to incorporate Fusarium head blight (FHB) resistance, up
to 18,000 F2 plants may be grown. In a typical cross made for malting quality
improvements, the F2 population size is approximately 2,000 to 3,000 plants. From
the better crosses, individual spikes are selected from plants that express favorable
plant characteristics for maturity, kernel plumpness, straw strength, spike fertility,
and plant height. After harvest, all spikes from a cross are bulk threshed, the grain is
cleaned, and the seed is sized to remove kernels that pass through a sieve with 0.2�1.9-cm slotted openings.
7.3 Year 2
A sample of the cleaned-sized F3 seed is sown in October in an off-season nursery
near Christchurch, New Zealand, for generation advancement. In February at
maturity, about 200 spikes are harvested from each cross. The harvested spikes
are then threshed and sown in progeny rows (1.5 m long) during the spring at up to
two locations to avoid weather-caused loss of specific nurseries. From the best
238 R.D. Horsley et al.
crosses, approximately 1,500 progeny rows are selected at the end of the growing
season based on appearance. These F4 rows are evaluated for straw strength,
maturity, plant height, and disease resistance. From within each selected row, one
spike is selected from each of the three ‘‘best’’ plants. Selection of spikes is based
on kernel plumpness, spike length, seed set, and kernel color. After the spikes are
selected, the remaining portion of the row is harvested in bulk, threshed, and sent to
the Barley Quality Laboratory under the direction of Dr. Paul Schwarz, Department
of Plant Sciences.
The spikes selected from each row are individually threshed and the seed from
the three spikes are compared to identify the ‘‘best’’ two. Selection among grain
from spikes is based on kernel color, blighted kernels, kernel plumpness, and hull
retention. Seed from the two selected spikes is sown in late October as individual
progeny rows (2 m long) in the off-season nursery near Yuma, Arizona.
During the winter, quality prediction tests are conducted in Dr. Schwarz’s
laboratory on the F4 rows that were bulk harvested. Quality tests performed are
kernel assortment (i.e., kernel plumpness) test weight, barley protein using near
infra-red reflectance spectrometry, and barley diastatic power using an assay that
utilizes papain to release bound b-amylase.
7.4 Year 3
On the basis of quality data, rows in Arizona having favorable quality are consid-
ered for harvest in late March. Among the rows with acceptable quality, rows are
selected for harvest based on maturity, plant height, uniformity, and straw strength.
From the rows harvested, approximately 675 lines are advanced to replicated
preliminary yield trials (PYTs) that are randomized using a lattice design and
grown at two locations in North Dakota. The lines in the PYTs are assigned an
‘‘ND number’’ and seed increase is started to provide seed for the following year’s
trials. Lines in the PYTs are evaluated for grain yield, maturity, plant height, foliar
diseases, lodging, straw breakage, and test weight. Seed from one location of lines
having good agronomic performance are sent to the USDA-ARS Cereal Crops
Research Unit (USDA-ARS-CCRU) at Madison, Wisconsin, for malt quality anal-
ysis and to Dr. Stephen Neate in the Department of Plant Pathology, NDSU. Malt
quality characters studied on each line are barley protein, kernel plumpness, kernel
color, soluble wort protein, malt extract, fine-coarse difference, wort viscosity,
diastatic power, and alpha amylase activity. Dr. Neate evaluates the lines for
reaction to the net and spot blotch pathogens on both seedlings and adult plants in
the greenhouse.
7.5 Year 4
On the basis of agronomic and malting quality data, about 75 ND lines are advanced
to the intermediate yield trial (IYT) at seven locations in North Dakota and one
Barley 239
location in eastern Montana. The lines are evaluated for the same agronomic,
disease, and malt quality traits studied in the PYTs. In addition, larger scale pure
seed increases of the IYT lines are produced. Reactions to the net blotch and spot
blotch pathogens are evaluated in field nurseries by Dr. Neate. Seed of promising
ND lines from two to three locations is sent to the USDA-ARS-CCRU for malt
quality analyses.
7.6 Year 5
About 20 promising ND lines are advanced to the advance yield trial (AYT) based
on agronomic and malt quality data collected over the previous two summers. The
AYT is grown at the same location as the IYT. Lines are evaluated for the same
agronomic, disease, and malt quality traits studied in the previous yield trials. Seed
of promising lines from two to three locations is forwarded to the USDA-ARS-
CCRU for malt quality analyses. On the basis of the agronomic and malt quality
characteristics, up to four lines are sent to the AMBA for the first year of Pilot Scale
Evaluation. Seed for this evaluation is obtained from two of the best six locations of
large increase plots that are grown specifically for the AMBA’s tests. For this
evaluation, 17 kg of each entry is divided among the malting and brewing members
of AMBA and malt quality is compared to the check cultivars.
7.7 Year 6
ND lines submitted for pilot scale evaluation are entered in varietal yield trial
(VYT) at the same locations as the AYT, in North Dakota Agricultural Experiment
Station (NDAES) Varietal Trials at six locations across North Dakota, and in
Cooperative Regional Yield Trials grown at 8 to 15 locations across the barley
growing regions in the United States. Lines are evaluated for the same agronomic,
disease, and malt quality traits studied in the previous yield trials. Grain samples of
lines passing first-year pilot scale evaluation and having good agronomic potential
are submitted to AMBA for second-year pilot scale evaluation.
7.8 Year 7
ND lines passing first-year pilot scale evaluation are entered in VYT, Cooperative
Yield Trials, and NDAES Varietal Trials. Lines are evaluated for the same agro-
nomic, disease, and malt quality traits studied in the previous yield trials. Seed of
promising ND lines is increased in the Arizona off-season nursery incase permis-
sion is granted by the AMBA for an ND line to be advanced to plant scale
evaluation. Seed sufficient to sow about 250 hectares is needed from the off-season
increase. In general, the AMBA allows only one line per breeding program to be
entered for plant scale evaluation.
240 R.D. Horsley et al.
The most promising ND line passing its second year of pilot scale evaluation is
submitted to the AMBA for plant scale evaluation. In this evaluation, the malting
and brewing quality of large grain samples (�435–655 MT) are used for evaluation
by one or more maltsters and brewers.
In preparation for possible release, seed purification of the ND-line begins.
Approximately 1,000 single spike selections are sown as single progeny rows.
Rows containing off-type plants are removed and the remaining rows are harvested
in bulk.
7.9 Year 8
The ND-line submitted for plant scale evaluation is tested in the same yield trials
mentioned for year 7 and evaluated for the same agronomic, disease, and malt
quality traits. If the ND line passes its first year of plant scale testing, it is entered for
the second year of plant scale testing. Seed from the bulked head rows is sown by
the NDAES Foundation Seedstocks Program to produce Breeder seed in prepara-
tion for possible cultivar release.
Occasionally, extremely promising lines may be released as named cultivars at
this time. This is done if growers and NDSU scientists, regional agronomists, and
growers see an economic benefit from immediate distribution of the cultivar.
7.10 Year 9
The ND line submitted for its second year of plant scale testing is entered in the
same yield trials as the previous two years and evaluated for the same agronomic,
disease, and malt quality traits.
On the basis of acceptance of an ND line by the AMBA, it is assigned a cultivar
name and released as a recommended malting barley cultivar. Breeder seed is sown
by the NDAES Foundation Seedstocks Program to produce Foundation seed.
7.11 Year 10
Foundation seed is sold to growers that are members of the North Dakota Crop
Improvement Association so they can produce Registered Seed.
No two breeding programs can use the same breeding scheme. Variations to the
scheme above can be made at any stage to accommodate specific resources and
breeding goals. For example, DH techniques or MAS based on DNA markers could
be used to shorten the length of time needed to develop new cultivars by several
years. These methods will be described in greater detail in the next section. Off-
season or glasshouse nurseries also can reduce the length of time needed to develop
new cultivars by providing for two or more field generations per year. Locations
used for off-season nurseries by breeders in the northern hemisphere include the
Barley 241
southwestern United States, Argentina, and New Zealand. Finally, non-malting or
feed barley cultivars can be developed much quicker than malting barley cultivars
because extensive quality testing is not needed. Feed barley cultivars often can be
developed three to four years quicker than malting barley cultivars.
8 Integration of New Biotechnologies in Breeding Programs
Utilization of DH technology to extract lines from F1 plants produces homozygous
lines in about one year. This can reduce the time needed to develop new cultivars by
two to three years because early generation testing of material while selfing is not
needed. Additionally, the DH method may be advantageous for breeders develop-
ing winter barley cultivars because they do not usually use off-season nurseries for
generation advancement. Two methods of DH production are used for barley, the
Hordeum bulbosum L. method (Chen and Hayes, 1989) and the microspore culture
method (Ziuddin et al., 1992). In the H. bulbosum method, F1 plants are typically
used as the female and crossed with pollen from selected H. bulbosum clones.
Following pollination, the seven chromosomes from H. bulbosum are gradually
eliminated in most embryos, leaving the growing embryo with only seven chromo-
somes from the female plant. Because the endosperm collapses, the growing
embryo has to be rescued before two weeks under sterile conditions and cultured
on growth media, resulting in production of mostly haploid plants (n = 7). A very
small proportion of the embryos will undergo spontaneous doubling to 2n = 14. To
double the chromosome number to 2n = 14, the crown of the plant is soaked in
colchicine. In our experience in using this method, less than 15% of the pollinated
florets result in DH plants.
The production of DH plants by culturing microspores from immature anthers
was used on a limited basis prior to the mid-1990s because success was genotype
specific and larger numbers of albino plants were obtained. Ziuddin et al. (1992)
developed a system of DH production from microspores that greatly reduced these
problems and several breeding programs adopted this method. Successful utiliza-
tion of this method is dependent on having high-quality growth chambers and
facilities to nurse the DH plants produced.
Selection of F1 plants from complex crosses or plants in early generations using
molecular marker-assisted selection (MAS) has been employed in barley with
limited success. In theory, selection of plants based on their DNA composition
early in the breeding program should increase efficiency because only plants with
the genes of interest would be evaluated. Microsattelite or simple sequence repeat
(SSR) markers are most commonly used; however, success is often limited to
simply inherited traits for which closely linked markers have been identified. Traits
that were selected with some success using MAS include resistance to cereal cyst
nematode and boron tolerance (Ogbonnaya et al., 1998) and covered smut, incited
byUstilago hordei (Pers.) Lagerh (Ardiel et al., 2002). The development of markers
for MAS of lines with resistance to FHB is receiving a lot of attention. Microsatel-
lite markers linked to FHB-resistance quantitative trait loci (QTL) have been
242 R.D. Horsley et al.
mapped in several resistance sources (Horsley et al., 2006; Dahleen et al., 2003;
Mesfin et al., 2003; Ma et al., 2000; de la Pena et al., 1999; Zhu et al., 1999).
However, successful use of these markers for MAS has been limited. Recently,
research on utilizing single nucleotide polymorphism (SNP) markers has increased
significantly. It is hoped that these markers will permit successful utilization of
MAS over a wider range of crosses and traits.
Transformation of barley offers another method for introducing new traits into
barley. However, many industries, including maltsters, brewers, and food producers
do not accept transformed barley for processing. Stable transformation of barley
using microparticle bombardment was first reported by Wan and Lemaux (1994).
A method of using Agrobacterium tumefaciens for transforming barley was devel-
oped shortly afterward (Tingay et al. 1997). For both methods, the cultivar Golden
Promise has been found the easiest to transform; thus, it is widely used.
An inadequacy of Golden Promise is that is a non-malting barley cultivar
which is not adapted for production in stressed environments. An alternative to
transforming Golden Promise is the two-rowed malting barley cultivar Conlon
(Manoharan et al., 2006).
9 Cultivar Release and Intellectual Property Issues
Depending on where the cultivar is being developed or utilized, different rules for
regional testing and registration apply. Similarly, the rules for sales of seed and
protection of intellectual property rights are dependent on the country where the
cultivars were developed and/or will be sold. The general procedures for registering
and protecting a new cultivar are listed below for Australia, Canada, the European
Union, and the United States.
9.1 Australia
Barley cultivar development in Australia is primarily done by public breeding
programs funded by the federal government through the Grains Research and
Development Corporation (GRDC) and state governments. Since the start of this
century, the breeding effort has changed from ones conducted by each state to one
program (Barley Breeding Australia, BBA) with a national focus. Barley cultivars
and lines nearing release are evaluated in the National Variety Trial (NVT) system
established by GRDC and managed by the Australia Crop Accreditation System,
Ltd. Cultivars recommended for release by BBA are put out for public tender and
bids by commercialization parties are evaluated by a panel including the breeder or
the barley industry development officer, the Department of Primary Industries’
business manager, and GRDC. Before a cultivar can receive a recommendation or
accreditation as a malting barley cultivar, it must undergo an evaluation overseen
by Barley Australia. Barley Australia was formed out of the Malting Barley
Barley 243
Development Council in 2005. Similar to the AMBA in the United States, Barley
Australia is composed of members in the malting and brewing industries and
facilitates collaboration between their members and public barley researchers.
The accreditation process requires two years of evaluation that includes plant
scale malting evaluation by a maltster that is a member of the Malting and Brewing
Industry Barley Technical Committee and pilot brewing conducted by Pilot Brew-
ing Australia in Melbourne. On the basis of results of these two years of evalua-
tions, Barley Australia meets to decide if the cultivar should be accredited as a
malting barley cultivar. Breeder seed is maintained by the breeding organization.
Maintenance of other classes of seed and seed quality assurance are responsibilities
of the commercialization partner.
9.2 Canada
InCanada, the number of public barley breeding programs outnumbers the number of
private programs. A formal cultivar registration system is mandated by the federal
SeedsAct andRegulations. TheCanadian Food InspectionAgency (CFIA) is respon-
sible for implementing the Act and Regulations. There are various registration
recommending committees across the country formost commercial crops. Essentially,
all malting barley cultivars are tested and recommended for registration in western
Canada, the area where most barley is grown. The Prairie Recommending Com-
mittee for Oat and Barley (PRCOB) provides recommendations to the CFIA on
which candidates should become registered cultivars. Prior to registration, pro-
spective cultivars are evaluated in Co-operative (‘‘Co-op’’) and Collaborative
(‘‘Collab’’) trials for a minimum of two years at each stage, with the second
year of Co-op trials and the first year of Collab trials typically taking place in the
same year. At the Co-op stage, agronomic performance, disease resistance, and
malting quality are all evaluated, while at the Collab stage only malting quality is
evaluated. Malting quality evaluation during the Co-op trials is coordinated by the
Grain Research Laboratory (GRL), Canadian Grain Commission (CGC), and
during the Collab trials by the Brewing and Malting Barley Research Institute
(BMBRI). BMBRI industry members and the GRL carry out the malting tests at
both stages, sharing the results with the PRCOB, which then makes recommenda-
tions to the CFIA Variety Registration Office on whether a candidate should be
registered. The PRCOB also evaluates and makes recommendations on non-
malting lines. Post-registration, malting and brewing companies carry out plant
scale evaluation of registered malting barley cultivars and decide which cultivars
they will use. The Canadian Malting and Brewing Technical Center (CMBTC)
publishes an annual list of ‘‘recommended malting barley varieties’’ as one of the
signals to barley growers on the anticipated demand for specific cultivars for both
the domestic and export markets. Production and sale of pedigreed seed of
registered cultivars is carried out under license from the breeding institution,
typically by one or more seed companies. The CFIA’s Web site lists all registered
cultivars and their license holders. Intellectual property rights can be protected by
244 R.D. Horsley et al.
obtaining a Plant Breeder Right certificate under Canada’s Plant Breeder’s Rights
legislation.
9.3 European Union
Regulations and laws for cultivar registration in the European Union (EU) can
appear very complex for someone working outside the system. Because of these
complexities and differences in the regulations between countries, it is impossible
in this chapter to provide an in-depth review on the processes for cultivar registra-
tion and protection of intellectual property rights. The reader is encouraged to
contact the official cultivar registration office in each country for precise details.
In general, development of cultivars in Europe is dominated by large multinational
companies such as Limagrain and Syngenta, and many small family or regional/
sub-regional companies. The number of public breeding programs in Europe is
much fewer than in North America and Australia. Cultivars developed by public
programs and family and regional/sub-regional companies often market their culti-
vars through larger multipurpose agricultural companies or conglomerates. Euro-
pean barley breeding companies are dependent on royalties; thus, developing a
cultivar that is adapted to more than one county is an important goal because this
can significantly increase the royalty stream.
The information presented below represents the rules and procedures for the
27 countries that make up the EU. The process of getting approval to increase
and sell seed of a new cultivar requires two separate procedures that are
typically done concurrently. The first procedure is called Distinct Uniform and
Stable (DUS) testing. This procedure is more commonly called the International
Union for the Protection of New Varieties of Plants (UPOV) testing. The
second procedure is the national listing/national registration trials. These DUS
and national listing tests are carried out separately and the results are intended
for separate audiences. The DUS testing can be done in one EU country chosen
by the breeder, as long as they are a citizen of an EU country. After two years
of DUS testing, the breeder receives what is called the UPOV Report onTechnical Examination and protection for the cultivar. Protection is granted for
25 years, but without a national listing, the breeder does not have the right to
produce and sell seed. To receive a national listing, the breeder can choose one
preferred country to submit the cultivar for testing, and this country can be different
from the one where DUS testing is conducted. The country that performs the
national listing trial will purchase the UPOV report from the country that did the
DUS testing.
Rules for the national listing trials are based on the laws of the country where the
trials are conducted. The length of the trial is dependent on the crop being tested and
the country where the tests occur. Typically, the trials are conducted for two or
three years and the new cultivars are compared to reference cultivars. Each country
has different reference cultivars and these can change in each year of testing.
Permission to advance to a second year of national listing testing is dependent on
Barley 245
the rules of the country where the tests are done. Some countries, such as Germany,
require that a new cultivar must be above a specified index based on multiple traits
before it can be advanced to a second year of testing. Other countries have no such
rule, so every cultivar can go through the entire two to three years of testing. For a
cultivar to receive a national listing, it must be superior to the reference cultivar(s)
for most traits. If a cultivar successfully receives a national listing, the listing is
good for 10 years. After 10 years, the breeder needs to reapply to keep the cultivar
listing current.
Upon completion of DUS and national listing testing in one country, the breeder
has one year to apply for cultivar protection across the entire EU. The application is
a formal act that does not require additional field testing. The EU protection is
important because it allows the breeder to recuperate royalties in each EU country
where the cultivar is grown. The EU protection is good for 25 years as long as the
breeder keeps their national listing current. If the breeder does not reapply for
national listing after 10 years, the EU protection ends. Finally, EU protection or a
national protection does not prevent other breeders within the EU from using
protected cultivars as parents for crossing.
The testing described above is done regardless if the cultivar has potential use for
malting and brewing. To determine the utility of a cultivar, the breeder must have
their own quality laboratory or make arrangements for an outside laboratory to
evaluate the malting potential of a line before it enters DUS and national listing
tests. Depending on the country where national listing tests are done, evaluation of
malt quality may be part of the process. For example, malt quality is evaluated in
Germany and France as part of their national listing testing. Nevertheless, none of
the quality evaluations done before or during national listing testing give any
indication if a cultivar will be used by the malting and brewing industries.
Determination of a cultivar’s suitability for malting and brewing is typically
determined after DUS and national listing tests are completed. In some
countries, quality evaluation is organized by allied members of the malting
and brewing industries, which may include breeders, brewers, maltsters, nation-
al or regional institutes, or universities. For example, the evaluation program in
France is overseen by the Comite Biere Malt Orge (CBMO), in Germany by
the Berlin Program, and in Great Britain by the Cereal Technical Advisory
Committee (CTAC). However, because many EU countries do not have such
national organizations, they look to the European Brewing Convention (EBC)
for evaluating new cultivars that are nationally listed. The EBC coordinates the
testing of new cultivars in field trials under variable growing conditions and
the countries where the tests are conducted are assigned to one of four regions
(Table 3). The EBC produces reports that summarize data from both national trials
and their trials so members of the European malting and brewing industries can
identify new cultivars that may be of interest, especially those that have acceptable
agronomic performance and malt quality when produced in multiple regions. As is
done across the world, large international brewers will perform their own plant
scale malting and brewing evaluations to determine if they will use a new cultivar.
246 R.D. Horsley et al.
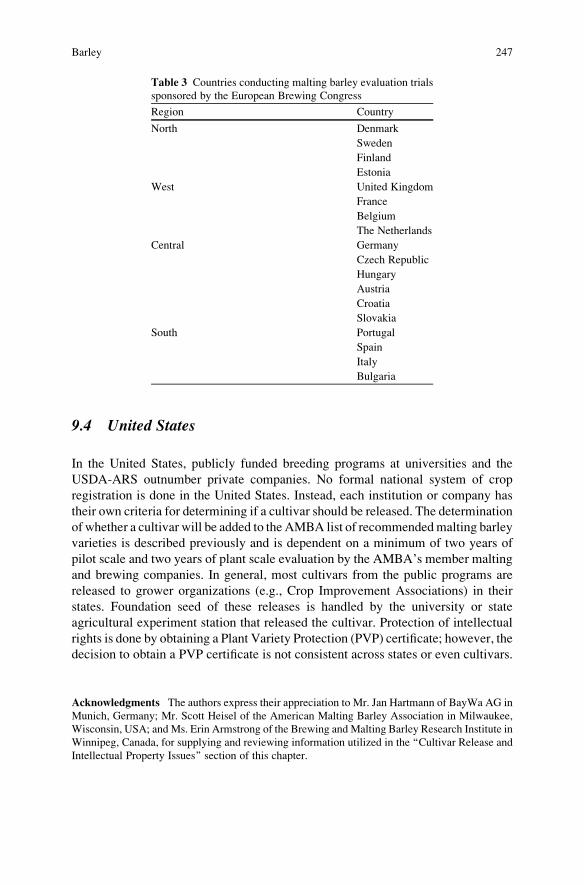
9.4 United States
In the United States, publicly funded breeding programs at universities and the
USDA-ARS outnumber private companies. No formal national system of crop
registration is done in the United States. Instead, each institution or company has
their own criteria for determining if a cultivar should be released. The determination
of whether a cultivar will be added to the AMBA list of recommendedmalting barley
varieties is described previously and is dependent on a minimum of two years of
pilot scale and two years of plant scale evaluation by the AMBA’s member malting
and brewing companies. In general, most cultivars from the public programs are
released to grower organizations (e.g., Crop Improvement Associations) in their
states. Foundation seed of these releases is handled by the university or state
agricultural experiment station that released the cultivar. Protection of intellectual
rights is done by obtaining a Plant Variety Protection (PVP) certificate; however, the
decision to obtain a PVP certificate is not consistent across states or even cultivars.
Acknowledgments The authors express their appreciation to Mr. Jan Hartmann of BayWa AG in
Munich, Germany; Mr. Scott Heisel of the American Malting Barley Association in Milwaukee,
Wisconsin, USA; and Ms. Erin Armstrong of the Brewing and Malting Barley Research Institute in
Winnipeg, Canada, for supplying and reviewing information utilized in the ‘‘Cultivar Release and
Intellectual Property Issues’’ section of this chapter.
Table 3 Countries conducting malting barley evaluation trials
sponsored by the European Brewing Congress
Region Country
North Denmark
Sweden
Finland
Estonia
West United Kingdom
France
Belgium
The Netherlands
Central Germany
Czech Republic
Hungary
Austria
Croatia
Slovakia
South Portugal
Spain
Italy
Bulgaria
Barley 247
References
Ardiel, G.S., T.S. Grewal, P. Deberdt, B.G. Rossnagel, and G.J. Scoles. 2002. Inheritance of
resistance to covered smut in barley and development of a tightly linked SCAR. Theor. Appl.
Genet. 104:457–464.
Behall, K.M., and J.G. Hallfrisch. 2006. Effects of barley consumption in CVD risk factors. Cereal
Foods World 51:12–15.
Behall, K.M., D.J. Scholfield, J.G. Hallfrisch. 2004. Lipids significantly reduced by diet containing
barley compared to whole wheat and brown rice in moderately hypercholesterolemic men.
J. Am. Med. Assoc. 23:55–62.
Bergal, P., and M. Clemencet. 1962. The botany of the barley plant. In A.H. Cook (ed.) Barley andmalt: biology, biochemistry and technology, pp. 1–23. Academic Press, New York, 1962.
Blake, T., J.G.P. Bowman, P. Hensleigh, G. Kushna, G. Carlson, L. Welty, J. Eckhoff, K. Kephart,
D. Wichman and P.M. Hayes. 2002. Registration of “Valier” barley. Crop Sci. 42:1748–1749.
Bothmer, R. von, J. Flink, N. Jacobsen, M. Katimaki, and T. Landstrom. 1983. Interspecific
hybridization with cultivated barley. Hereditas 99:219–244.
Bothmer, R. von, K. Sato, T. Komatsuda, S. Yasuda, and G. Fischbeck. 2003. The domestication
of cultivated barley. In R. von Bothmer, Th. van Hintum, H. Knupffer, and K. Sato (eds.),
Diversity in Barley (Hordeum vulgare), pp. 9–27. Elsevier Science B.V., Amsterdam, The
Netherlands.
Chen, F., and P.M. Hayes. 1989. A comparison of Hordeum bulbosum mediated haploid
production efficiency in barley using in vitro floret and tiller culture. Theor. Appl. Genet.
77:701–704.
Choo, T.M., B. Vigier, K.H. Ho, S. Ceccarelli, S. Grando, J.D. Franckowiak. 2005. Comparison of
black, purple, and yellow barleys. Genet. Resour. Crop Evol. 52:121–126.
Collard, B.C.Y., M.Z.Z. Jahufer, J.B. Brouwer, and E.C.K. Pang. 2005. An introduction to
markers, quantitative trait loci (QTL) mapping and marker-assisted selection for crop improve-
ment: The basic concepts. Euphytica 142:169–196.
Dahleen, L., H. Agrama, R. Horsley, B. Steffenson, P. Schwarz, A. Mesfin, and J. Franckowiak.
2003. Identification of QTLs associated with Fusarium head blight resistance in Zhedar
2 barley. Theor. Appl. Genet. 108:95–104.
Davis, M.P., J.D. Franckowiak, T. Konishi, and U. Lundqvist (eds.). 1997. Barley Genetics
Newsletter, Volume 26. American Malting Barley Assoc., Inc. Milwaukee, WI.
Eglinton, J., S. Coventry, and K. Chalmers. 2006. Breeding outcomes from molecular genetics.
p 743–749. In C.F. Mercer (ed.) Proc. of the 13th Australasian Plant Breeding Conference,
Christchurch, New Zealand 18–21 April 2006.
Erkkila, M.J., R. Leah, H. Ahokas, and V. Cameron-Mills. 1998. Allele-dependent barley grain
b-amylase activity. Plant Physiol. 117:679–685.
Emebiri, L., D.B. Moody, C. Black, M. van Ginkel, and E. Hernandez. 2007. Improvements
in malting barley grain yield by manipulation of genes influencing grain protein content.
Euphytica 155:185–194.
Fetch, T. G., Jr., B.J. Steffenson, and E. Nevo. 2003. Diversity and sources of multiple disease
resistance in Hordeum spontaneum. Plant Dis. 87:1439–1448.Foster, A.E., G.A. Peterson, and U.J. Banasick. 1967. Heritability of factors affecting malting
quality of barley, Hordeum vulgare L. Emend. Lam. Crop Sci. 7:611–613.
Franckowiak, J.D., and U. Lundqvist. 1997. BGS 6, Six-rowed spike 1, vrs1. Barley Genet. Newsl.26:49–50.
Franckowiak, J.D., A.E. Foster, V.D. Pederson, and R.E. Pyler. 1985. Registration of Bowman
barley. Crop Sci. 25:883.
Horsley, R., D. Schmierer, C. Maier, C. Urrea, B. Steffenson, P. Schwarz, J. Franckowiak,
M. Green, B. Zhang, and A. Kleinhofs. 2006. Identification of QTL associated with Fusarium
head blight resistance in barley accession CIho 4196. Crop Sci. 46:145–156.
248 R.D. Horsley et al.
Horsley, R.D., P.B. Schwarz, and J.J. Hammond. 1995. Genetic diversity in malt quality of North
American six-rowed spring barley. Crop Sci. 35:113–118.
Jorgensen, J.H., 1992. Discovery, characterization and exploitation of Mlo powdery mildew
resistance in barley. Euphytica 63:141–152.
Juskiw, P., J. Helm, L. Oatway, and J. Nyachiro. 2005. Breeding for feed barley quality in hulled
two-row barley. 12th Australian Barley Technical Symposium (ABTS) http://www.cdesign.
com.au/proceedings_abts2005/papers%20(pdf)/tues_1620.pdf.
Komatsuda, T., M. Pourkheirandish, C. He, P. Azhaguvel, H. Kanamori, D. Perovic, N. Stein,
A. Graner, T. Wicker, A. Tagiri, U. Lundqvist, T. Fujimura, M. Matsuoka, T. Matsumoto, and
M. Yano. 2007. Six-rowed barley originated from a mutation in a homeodomain-leucine zipper
I-class homeobox gene. PNAS 104:1424–1429.
Kunze, W. 2004. Technology brewing and malting; 3rd International edition – in English. VLB,
Berlin.
Langridge, P., N. Paltridge, and G. Fincher. 2006. Functional genomics of abiotic stress tolerance
in cereals. Brief. Funct. Genomic Proteomic 4:343–354.
Lundquist and Franckowiak, http://wheat.pw.usda.gov/ggpages/bgn/26/
Ma, Z., B. Steffenson, L. Prom, and L. Lapitan. 2000. Mapping of quantitative trait loci for
Fusarium head blight resistance in barley. Phytopathology 90:1079–1088.
Manoharan, M., L.S. Dahleen, T.M. Hohn, S.M. Neate, X. Yu, N.J. Alexander, S.P. McCormick,
P. Bregitzer, P.B. Schwarz, and R.D. Horsley. 2006. Expression of 3-Oh-Triothecene acetyl-
transferase in barley and effects on Fusarium head blight. Plant Sci. 171:699–706.
Mathre, D.E. (ed.) 1997. Compendium of Barley Diseases, second edition. Amer. Phytopath. Soc.,
St. Paul, MN.
Matus, I., A. Corey, T. Filchkin, P.M. Hayes, M.I. Vales, J. Kling, O. Riera-Lizarazu, K. Sato,
W. Powell, and R. Waugh. 2003. Development and characterization of recombinant chromo-
some substitution lines (RCSLs) using Hordeum vulgare subsp. spontaneum as a source of
donor alleles in a Hordeum vulgare subsp. vulgare background. Genome 46:1010–1023.
Mesfin, K., K. Smith, R. Dill-Macky, C. Evans, R. Waugh, C. Gustus, and G. Muehlbauer. 2003.
Quantitative traits loci for Fusarium head blight resistance in barley detected in a two-rowed by
six rowed population. Crop Sci. 43:307–318.
Ogbonnaya, F.C., D.B. Moody, A. Rehman, J.M. Kollmorgen, and H.A. Eagles. 1998. Marker
assisted selection for resistance to cereal cyst nematode and boron tolerance in barley. p. 189.
In Plant & Animal Genome VI Conference Abstracts.
de la Pena, R., K. Smith, F. Capettini, G. Muehlbauer, M. Gallo-Meagher, R. Dill-Macky, D.
Somers and D. Rasmusson.1999. Quantitative trait loci associated with resistance to Fusarium
head blight and kernel discoloration in barley. Theor. Appl. Genet. 99:561–569.
Pickering, R.A. 1989. Plant regeneration and variants from calli derived from immature embryos
of diploid barley (Hordeum vulgare L.) and H. bulbosum L. crosses. Theor. Appl. Genet.
78:105–112.
Pickering, R., A. Hill, M. Michel, and G. Timmerman-Vaughan. 1995. The transfer of a powdery
mildew resistance gene from Hordeum bulbosum L. to barley (Hordeum vulgare L.) chromo-
some 2 (2I). Theor. Appl. Genet. 91:1288–1292.
Pillen, K., and J. Leon. 2003. Advanced backcross QTL analysis in barley (Hordeum vulgare L.).Theor. Appl. Genet. 107:340–352.
Rasmusson, D.C. and R.L. Phillips. 1997. Plant breeding progress and genetic diversity from de
novo variation and elevated epistasis. Crop Sci. 37:303–310.
Russell, J.R., R.P. Ellis, W.T.B. Thomas, R. Waugh, J. Provan, A. Booth, J. Fuller, P. Lawrence,
G. Young, and W. Powell. 2000. A retrospective analysis of spring barley germplasm devel-
opment from “foundation genotypes” to currently successful cultivars. Mol. Breed. 6:533–568.
Steffenson, B.J. 1992. Analysis of durable resistance to stem rust in barley. Euphytica 63:153–167.
Steffenson, B.J., P.M. Hayes, and A. Kleinhofs. 1996. Genetics of seedling and adult plant
resistant to net blotch (Pyrenophora teres f. teres) and spot blotch (Cochliobolus sativus) inbarley. Theor. Appl. Genet. 92:552–558.
Barley 249
Tingay, S., D. McElroy, R. Kalla, S. Fleg, M. Wang, S. Thornton, and R.I.S. Brettell. 1997.
Agrobacterium tumefaciens-mediated barley transformation. Plant J. 11:1369–1376.
Ullrich, S.E., D.M. Wesenberg, H.E. Blockelman, and J.D. Franckowiak. 1995. International
cooperation in barley germplasm activities. In R.R. Duncan (ed.) International germplasm
transfer: past and present, pp. 157–170. CSSA Special Publ. 23. CSSA and ASA, Madison, WI.
Vivar, H.E. 2001. Two decades of barley breeding. In H.E. Vivar and A. McNab (eds.). Breeding
Barley in the New Millennium: Proceedings of an International Symposium, pp. 77–82.
CIMMYT, Mexico., D.F.
Wan, Y., and P. Lemaux. 1994. Generation of large numbers of independent transformed fertile
barley plants. Plant Physiol. 104:37–48.
Wiebe, G.A. 1968. Breeding. In Barley: Origin, botany, culture, winterhardiness, genetics, utili-
zation, pests. pp.96–104. (Agric. Handbook No. 338, Agric. Res. Service, U.S. Dept. Agric.,
Washington, D.C. or USDA Agric. Handb. No. 338.).
Wilcoxson, R.D., D.C. Rasmusson, and M.R. Miles. 1990. Development of barley resistant to spot
blotch and genetics of resistance. Plant Dis. 74:207–210.
Zhu, H., L. Gilchrist, P. Hayes, A. Kleinhofs, D. Kudrna, Z. Liu, L, Prom, B. Steffenson,
T. Toojinda, and H. Vivar. 1999. Does function follow form? Principal QTLs for Fusariumhead blight (FHB) resistance are coincident with QTLs for inflorescence traits and plant height
in a doubled-haploid population of barley. Theor. Appl. Genet. 99:1221–1232.
Ziuddin, A., A. Marsolais, E. Simion, and K.J. Kasha. 1992. Improved plant regeneration from
wheat anther and barley microspore culture using phenylacetic acid (PAA). Plant Cell Rep.
11:489–498.
250 R.D. Horsley et al.
Winter and Specialty Wheat
P. Baenziger, R. Graybosch, D. Van Sanford, and W. Berzonsky
Abstract Wheat is the most widely grown crop in the world. Winter wheat is
primarily common wheat (2n¼ 6x¼ 42) which has extensive germplasm resources
that are used in breeding, often for disease and insect resistance. Though wheat can
be used as a forage crop and its grain for animal feed, the primary uses of common
wheat are to make products used for human consumption; hence end-use quality is
also a major breeding objective. The quality characteristics of these products are
often associated with kernel hardness which affects milling, kernel color, and
specific climatic zones or regions. The soft red and white wheat cultivars of the
Eastern and Southeastern U.S. are generally used to make breakfast cereals, cook-
ies, cakes, and crackers. The hard red and white wheat cultivars of the Great Plains
are used predominantly for leavened products such as bread. The soft white wheat
cultivars of the Pacific Northwest are often exported and used to make noodles or
steam breads. These end-uses and production (adaptation) regions determine the
germplasm pools used by wheat breeders. All of the common self pollinated
breeding methods are used to breed new wheat cultivars. The choice of breeding
method is usually based upon breeding objective and program resources. Breeding
methods and objectives are evolving with new technology and market changes.
1 Introduction
The two main commercial types of wheat are durum (Triticum durum L., 2n = 4x =28) and common (Triticum aestivum L., 2n = 6x = 42) wheat, the latter being the
more widely grown. Wheat has three growth habits, namely winter (wheat grown
primarily during the winter months, that requires vernalization to flower, and can
withstand prolonged periods of below freezing temperatures), facultative (wheat
grown primarily during the winter months in mild climates, that may or may not
require vernalization to flower, and cannot withstand prolonged periods of below
P. Baenziger(*)
362D Plant Science Building, Department of Agronomy and Horticulture, University of Nebraska,
Lincoln, NE 68583-0915 USA
M.J. Carena (ed.), Cereals,DOI: 10.1007/978-0-387-72297-9, # Springer Science + Business Media, LLC 2009 251
freezing temperatures), and spring (wheats grown primarily during the spring and
summer months, that normally do not require vernalization to flower, and cannot
withstand moderate periods of below freezing temperatures). Growth habit should
be viewed as a continuum from winter wheat to facultative wheat to spring wheat,
Because wheat can be grown through the winter or summer, is very drought
tolerant, and is used primarily for human consumption, it is the most widely
grown crop in the world (218,283,000 ha; http://www.nass.usda.gov/Publications/
Ag_Statistics/2007/chap01.pdf, verified May 19, 2008; note Web address will
change annually, so the primary address is http://www.nass.usda.gov/Publica-
tions/Ag_Statistics, which will have the most recent Agricultural Statistics). In
this chapter, we will concentrate on winter wheat breeding using examples of
breeding which target cultivar development in the United States, but examples
relating to global winter wheat breeding will be discussed as appropriate. It should
be noted that as a winter annual, wheat is often grown in rotation with summer
annual crops if the growing season is long enough and moisture is sufficient.
2 Genetic Diversity and Germplasm Selection
In North America, all cultivated winter wheat species are forms of common wheat.
The desert durum wheats of the southwest United States are facultative wheats. An
allohexaploid, T. aestivum has three genomes (A, B, and D), each composed of
seven chromosome pairs. These genomes derive from related ancestral species.
Chromosomes of each genome are numbered 1–7, with each number designating a
homoeologous set. Homoeologous chromosomes are similar both in structure and
gene content, and thus, they can compensate for each other as was demonstrated
in the production of nullisomic–tetrasomic lines (Sears, 1953). Chromosomes
derived from related species of the grass tribe Triticeae also may substitute for
wheat chromosomes (Friebe et al., 1996). Wild and domestic relatives of wheat
routinely are utilized as valuable sources of genes for wheat improvement. Wide or
interspecific hybridization, when followed by radiation treatment or the induction of
homoeologous recombination, can result in the successful transfer of chromosomes
arms, or smaller chromosome segments, resulting in the formation of wheat-alien
translocation lines (Friebe et al., 1996). Manipulating homoeologous chromosome
recombination to incorporate alien chromatin is known as chromosome engineer-
ing, and it has been a mainstay of wheat improvement programs for the past
50 years.
The majority of alien chromosome segments conferring disease and pest resis-
tance to wheat have been derived from species of the genus Aegilops, two species ofperennial wheat grasses, Thinopyrum elongatum (Host) Dewey and Elytrigia inter-media (Host) Nevski, and from rye (Secale cereale L.) (Friebe et al., 1996). An
examination of pedigrees of recent entrants in the US Department of Agriculture-
Agricultural Research Service (USDA-ARS) Hard Winter Wheat Regional Nursery
Trials (http://www.ars.usda.gov/Research/docs.htm?docid=11932, verified May19,
252 P. Baenziger et al.
2008) indicates that US hard winter wheat breeders are utilizing various germplasm
lines as donors of genes from wild and cultivated relatives. Examples include
KS96WGRC39, which carries a leaf rust (incited by Puccinia triticina Eriks)
resistance gene (Lr41) and tan spot [incited by Pyrenophora tritici-repentis(Died.) Drechs.] resistance from Aegilops tauschii (Brown-Guedira et al., 1999);
KS90WGRC10, also carrying Lr41 from A. tauschii; KS91WGRC11, providing
Lr42, again from A. tauschii (Cox et al., 1994); and KS93WGRC27, which carries
Wsm-1, a gene conferring resistance to wheat streak mosaic virus.Wsm-1 is presenton a T4DL·4Ai#2S, wheat‐A. intermedium chromosome (Gill et al., 1995). North
American breeders of hard winter wheat long have used the Sr24 and Lr24resistance genes, which are in the cultivar Agent but which are derived from
T. elongatum (McIntosh et al., 1976), as well as a greenbug [Schizaphis graminum(Rondani)] resistance gene (Gb3) derived from A. tauschii and present in the wheatcultivar Largo (Hollenhorst and Joppa, 1983). Winter wheat breeders in the US
Pacific Northwest (PNW) have been incorporating resistance to eyespot (straw-
breaker foot rot incited by Tapesia yallundaeWallwork and Spooner) derived from
A. ventricosa via the wheat VPM-1. VPM-1 also has served as a donor of genes for
resistance to cereal cyst nematode (CCN; Heterodera avenae), stem rust (incited by
P. graminis Pers.: Pers. f. sp. tritici Eriks and E. Henn), stripe rust (incited by
P. striiformis Westendorp f. sp. tritici), and leaf rust (Seah et al., 2000).
Both soft and hard winter wheat breeders have long utilized genes for resistance
to pathogens and insect pests from rye (Secale cereale L.), especially those on
chromosome arm 1RS. Both 1BL.1RS (originally transferred from the Russian
cultivar Kavkaz) and 1AL.1RS (from the cultivar Amigo) have been introduced
into the soft and hard winter wheat gene pools. These chromosome arms originally
served as sources of leaf and stem rust resistance, resistance to powdery mildew,
and, in the case of 1AL.1RS, resistance to greenbug. In addition, both chromosomes
must confer, at least in some genetic backgrounds, broad agronomic adaptation, via
stress resistance (Graybosch, 2001). The 1AL.1RS chromosome translocation is more
prevalent in the US advanced hard winter wheat breeding lines, while 1BL.1RS is
more prevalent in US soft winter wheat breeding lines (http://www.ars.usda.gov/
Research/docs.htm?docid=11932).
Reduced end-use quality is rarely attributed to transfers from nonrye sources.
For example, Divis et al. (2006) found no significant or consistent quality problems
associated with the presence of Wsm-1. However, wheats carrying 1RS often
exhibit undesirable baking characteristics. Desirable genes from rye are linked to
traits that alter the grain composition of the recipient wheat cultivars. These effects
have been the subject of several review articles (see Graybosch, 2001).
While the majority of wheat cultivars are developed through matings of elite
germplasm, unadapted wheat landraces and accessions from the USDA-ARS Na-
tional Small Grains Collection (Aberdeen, ID) frequently serve as donors for
important traits. Examples include Russian wheat aphid [Diuraphis noxia (Mord-
vilko)] resistance, derived from several landraces (Souza, 1998; Souza et al., 1991),
the null granule-bound starch synthase gene mutants used to develop waxy
Winter and Specialty Wheat 253
(amylose-free) wheats (Morris and Konzak, 2001), and novel high molecular
weight glutenin subunits derived from A. tauschii and T. turgidum var. dicoccoides.
3 Varietal Groups
Winter wheat in the United States may be divided into four varietal groups or gene
pools as follows: (1) Eastern and Southeastern soft wheats, (2) Southern Great
Plains wheats, (3) Northern Great Plains wheats, and (4) Pacific Northwest (PNW)
wheats. Each represents distinct groups in terms of both agroecological adaptations
and end-use properties (soft wheat for uses ranging from cookies to cakes to cereals or
hard wheats primarily used for bread making). On a global scale, winter wheat can
also be divided into varietal groups or gene pools based upon agroecological adapta-
tion and end-use properties. It should be noted that the nomenclature can be confus-
ing. Hard wheat in Europe can refer to durum wheat, whereas, soft wheat can refer to
common wheat, regardless of its kernel hardness. Also, in countries where warm
season crops such as maize (Zea mays L.) or sorghum (Sorghum vulgare L.) are notgrown or expensive to import, wheat is often grown as an animal feed.
Breeding efforts within each group largely consist of matings of elite types from
the same gene pool, with matings between wheats from alternative gene pools
primarily made to transfer genes for pest and pathogen resistance. Wheat cultivars
produced in the eastern region of the United States comprise soft red winter (SRW)
and soft white winter (SWW) market classes. SWW wheat is grown predominately
in Michigan and New York. In Michigan, historically, SWW wheats have been
grown for their use in breakfast cereals. Millers and end users in southern states have
shown interest in expanding SWW acreage because of their potential use in health
food products, but concerns about sprouting and the ability to produce a consistently
high quality product have largely stalled these efforts. Thus, most of the wheat
produced east of the Mississippi river is SRW wheat. Much of the SRW wheat crop
is milled domestically, while approximately one third is exported (http://www.ers.
usda.gov/Data/Wheat/WheatYearbook.aspx#Trade, verified May 19, 2008).
Eastern wheat breeders have always contended with numerous fungal diseases
that flourish in their typically high rainfall, humid target environments. Recently,
however, this region has been dominated by Fusarium head blight or head scab
(incited by Fusarium spp.) Since the mid 1990s, when the Northern US Corn Belt
experienced a severe head scab epidemic, resistance has become a key breeding
objective for many, if not all of the breeding programs in the eastern wheat region.
Much of this breeding research has been facilitated by the US Wheat and Barley
Scab Initiative (http://www.scabusa.org, verified May 19, 2008). Breeders have
made much progress in developing resistant varieties since this initiative was
undertaken. This has required use of scab-resistant Chinese spring wheats such as
‘‘Sumai 3’’ (Yu, 1982), ‘‘native’’ SRW resistance such as ‘‘Truman,’’ and a combi-
nation of the two. The component of this disease that differentiates it from many
other diseases in its potential to cause losses is the array of mycotoxins (primarily
254 P. Baenziger et al.
deoxynivalenol) produced by the fungus upon invasion of the plant (Bai and
Shaner, 1994). Food and feed safety concerns have resulted in very low tolerances
of this toxin in finished products, and flour millers have come to regard absence of
deoxynivalenol as a primary quality target goal (Mesterhazy et al., 1999). While
millers and end users have always been concerned about having resistance to
Fusarium head blight, the production of mycotoxins in scabby wheat has elevated
this concern.
The eastern wheat region consists of the area from Louisiana to New York and
eastern Kansas to the Atlantic coastal plain. In this region, cultivars are often
licensed to companies with broad multistate sales targeting wide adaptation. Bree-
ders identify broadly adapted wheat lines by entering candidate cultivars in two
USDA-ARS regional nurseries grown annually at 30 locations each. Advanced and
preliminary breeding lines are often entered in a host of collaborative nurseries that
are organized by the breeders themselves.
Winter wheats of the PNW region typically have the longest grain-fill periods,
and subsequently often are low in grain protein content. Because of periodic snow
cover which insulates and protects the crowns, winter hardiness typically is less
than that of Northern Great Plains wheats. Various quality types are produced,
including soft white, club, hard white, and hard red. PNW wheats typically incor-
porate resistance to stripe and leaf rusts, eyespot (strawbreaker foot rot), powdery
mildew [incited by Blumeria graminis (DC.) E.O. Speer], Cephalosporium stripe
(incited by Hymenula cerealis Ellis and Everh.), and dwarf bunt (incited by Tilletiacontroversa Kuhn in Rabenh).
As previously noted, VPM-1 resistance genes are heavily utilized in this region,
primarily originating from the winter wheat cultivar Madsen (Allan et al., 1989).
Precipitation is high and irrigation is widely practiced, although PNW wheats
cultivated further from the Pacific coast, in regions such as Idaho, Utah, andMontana,
receive less moisture and hence, have more drought tolerance.
Winter wheat is cultivated in the Great Plains of North America across a wide
area, stretching from southern Texas north to South Dakota, and from the Missouri
River Valley to the eastern slopes of the Rocky Mountains. Winter wheats also are
grown along with spring wheats from South Dakota north to the prairies of Canada.
Such a large geographic area represents an array of ecological habitats, and hence,
the need for cultivars with diverse agronomic properties. Wheats of this region may
be considered members of two broad gene pools, the Southern Great Plains (Texas,
Oklahoma, Kansas, and Colorado) and the Northern Great Plains (Nebraska, South
Dakota, North Dakota, Wyoming, and Montana). The Great Plains region generally
is semiarid, and irrigation, while common, typically is used to produce higher value
crops such as maize (Zea mays L.). Hence, the majority of the wheat in this region is
cultivated under dryland (rainfed) environments, and drought tolerance is a trait of
paramount importance. From the earliest cultivation of wheat in this area (~1870)
until 1980, hard red winter wheat was the predominant type. In the early 1980s,
breeders, commencing in Kansas, initiated the development of hard white winter
wheats. As of this writing, breeders have released the hard white winter wheat
cultivars Rio Blanco, Arlin, Trego, Betty, Heine, Lakin, Danby, Avalanche, Intrada,
Winter and Specialty Wheat 255
Platte, Nuplains, NuFrontier, Antelope, and Arrowsmith, but hard red winter
cultivars still predominate in the region.
Wheats of the Southern Great Plains gene pool often are bred for dual purpose,
namely, grazing and grain production. Winters, especially in Texas and Oklahoma,
are mild, and livestock producers typically will feed cattle on wheat pasture that
grows continuously during the winter months. Depending on spring rainfall
amounts and the price of grain, cattle may be removed in spring, and a grain crop
harvested. Hence, wheats of this region typically are selected for regrowth potential
after grazing. Other characteristics of Southern Great Plains wheats include resis-
tance to leaf rust, tan spot, greenbug, Russian wheat aphid, and soil-borne mosaic
virus. Southern Great Plains wheats also are early to break spring dormancy, and are
early heading. They typically lack sufficient winter hardiness for cultivation north
of the Kansas/Nebraska border. They also are nearly all semidwarf types. Since
2000, periodic outbreaks of stripe rust have plagued the Southern Great Plains,
whereas, before, stripe rust rarely was seen in this region, as the rust pathogen
typically did not multiply under the warm, arid conditions. However, the evolution
of new races (Chen, 2005), not slowed by typical Great Plains environmental
conditions, has led to periodic outbreaks in areas rarely exposed to this disease in
the past. Breeding for resistance in the Southern Great Plains has become a priority
for all breeding programs, since the majority of wheats adapted to this region are
susceptible to new race(s).
While wheat is cultivated across a vast area in the Northern Great Plains, at
present, there are five active breeding programs, three university based and two
private. Mandatory traits of Northern Great Plains wheats include winter hardiness
and resistance to stem rust. Snow cover in this region often is short lived; hence,
winter wheats must be capable of surviving severe winter conditions. Other impor-
tant traits include resistance to Hessian fly (Mayetiola destructor Say), leaf and
stripe rust, and soil-borne mosaic virus. Wheat streak mosaic virus probably is the
most commonly encountered disease in this region. To date, cultivars with effective
resistance are just beginning to be deployed (e.g., RonL). However, breeding lines
with both the Wsm-1 resistance gene and acceptable agronomic performance have
been identified (Divis et al., 2006), and the recent release of Mace indicates good
progress is being made in developing cultivars with resistance to this pathogen.
Two notable differences in the Northern Great Plains gene pool, as compared to the
Southern Great Plains one, are the more frequent occurrence of tall or so-called
‘‘tall-semidwarf’’ wheat cultivars and of photoperiod sensitive wheat cultivars. In
the drier western regions of the Northern Great Plains, tall wheats are established
early, can be planted to moisture due to their longer coleoptile, perform well, and
provide sufficient height for effective and efficient harvesting by combine (Budak
et al., 1995). They also leave adequate straw for winter grazing, soil moisture
retention, and erosion control. Examples of recently released tall-semidwarf wheats
for this region include Millennium and Husker Genetics Brand Overland. There still
remain considerable hectares of conventional tall wheats such as Buckskin and
Scout 66, released several decades ago; there are also more recently released tall
wheats, such as Pronghorn and Goodstreak. Photoperiod sensitivity is needed
256 P. Baenziger et al.
because of its epistatic interactions with vernalization genes to provide greater low
temperature tolerance for a longer period of time that is needed in regions with
longer winters (Mahfoozi et al., 2001).
4 Breeding for End Use Quality
Hard wheats traditionally have been used for the production of leavened bakery
products, such as breads, rolls, bagels, and baguettes, and for many different types
of Asian noodles. Great Plains breeding programs generally are designed to develop
wheats for large-scale mechanized bakeries using sponge-and-dough technology
and, hence, they aim to produce cultivars with strong tolerance to over-mixing. For
use in US commercial bread baking, hard wheat cultivars should possess grain
protein concentrations of ~130 g/kg, good mixing tolerance, adequate bread loaf
volume, and should produce loaves with a good internal appearance. Flour water
absorption should be high enough to meet product specifications. Tolerance to over-
mixing is defined in commercial settings as the range of mix times above and below
peak dough development, at which a given lot of flour will function properly in a
baking procedure. This is an important variable, since in mechanized plants, under-
or over-mixed doughs can result in poor final product or in a stoppage of production
(‘‘down-time’’). Breeding programs are unable to precisely replicate the commer-
cial definition of ‘‘tolerance,’’ due to the larger sample sizes, long times, and bake
evaluation resources necessary for its estimation. Wheat breeding programs have
instead relied on small-scale measures of gluten strength, either via the sodium
dodecyl sulfate (SDS) sedimentation test or via some type of physical dough testing
procedure, most commonly the mixograph. In later generations, small-scale (~100 g
flour) ‘‘pup-loaf’’ bake procedures are used. High small-scale loaf volumes, which
likely represent the combined effects of high protein concentration and high gluten
content, are the best predictors of overall commercial quality potential. Small-scale
testing typically starts at the F4 or F5 generations, with early culling based on
mixograph properties and grain protein concentrations. Baking tests generally are
conducted each year on breeding lines at the F6 through F8 generations (Baenziger
et al., 2001).
While numerous schemes have been proposed for the selection of wheats based
either on high molecular weight (HMW) glutenin subunit composition (Payne,
1987) or on the direct measurement of glutenin content (Singh et al., 1990), such
procedures have not gained favor in US hard wheat breeding programs. This
situation partially derives from the relative high frequency of ‘‘optimal’’ subunits
already present in US hard wheat gene pools (Graybosch, 1992), and the conclusion
that essentially the same type of information is likely derived from simpler and less
expensive tests.
The bread making quality of nearly all hard wheats improves with increased
flour protein concentration. Increased protein concentration is somewhat amenable
to improvement by breeding based on safe, accurate, and simple tests, such as near-
Winter and Specialty Wheat 257
infrared reflectance spectroscopy (NIR). Expression of protein concentration is,
however, highly variable, with much of the overall variation being due to environ-
ment (Peterson et al., 1992). Genes conditioning increased protein concentration
have been discovered, and, more importantly, there seem to be a number of
independent loci. Thus, combining genes could be used to increase protein concen-
tration. Two notable sources of higher flour protein are Atlas 66 and Plainsman V.
These two sources seem to differ in their effects on dough strength. Atlas 66 types,
such as Lancota, have shorter mix times, but good mixing tolerance and good loaf
volume potential. Plainsman V types have long mixing times, strong tolerance to
over-mixing, and high loaf volume potential. The Plainsman V source has been
used to develop superior baking quality cultivars (Peterson et al., 1993), such as
Jagger, Jagalene, Karl, Karl 92, Nuplains, and Wesley.
Interest in developing hard white wheat cultivars has required that additional
quality screening procedures be added to breeding programs. Asian wet noodles
require lower protein content and a more mellow gluten type than that used for
bread production. Breeders now typically decide whether they should retain only
those wheats with gluten types and protein contents suitable for making bread
products or whether they should retain ‘‘dual purpose’’ white wheats with gluten
types and protein contents suitable for both bread and noodle products. Fortunately,
US hard white winter wheat cultivars developed and intended for bread end-use
products are similar in protein content and quality to hard red winter wheat cultivars
(Pike and MacRitchie, 2004). Product discoloration also is a concern, especially for
fresh Asian noodles which are produced and sold within 48 h, but small-scale tests
exist that can address this issue. Enzyme polyphenol oxidase (PPO) levels in
the flour have been associated with the undesirable discoloration of many food
products derived from white wheats. Thus, newly developed white wheats should
have low or, if possible, negligible levels of PPO. Simple and nondestructive assays
to screen seed for PPO levels have been developed (Bernier and Howes, 1994), and
these are being applied in early generation selection. Low PPO hard white winter
wheat cultivars released to date include Lakin and Platte. Flour starch swelling
capacity is also important when developing white wheats for certain Asian noodles,
particularly Japanese udon noodles. Cultivars lacking at least one gene for the
production of granule-bound starch synthase (GBSS), called ‘‘partial waxy’’ culti-
vars, exhibit higher starch swelling and are desirable for the production of udon-
type noodles (Graybosch, 1998; Hung et al., 2006). Breeders can select for this trait
by testing for starch pasting properties using a Rapid ViscoAnalyser, the official
designation or by testing for the absence of a GBSS gene using molecular markers
(Zhang et al., 2008).
In general, hard red wheats are more tolerant to preharvest seed sprouting than
hard white wheats (Mares and Ellison, 1989). Preharvest sprouting results in a release
of degradative enzymes, especially amylases, with a concomitant loss in test weight,
seed germination, and flour baking quality. Genetic variation does exist among white
wheats for this trait, and white wheats with genes conditioning tolerance have been
identified (Mares, 1992). In breeding programs, the falling number test, which
provides an indirect measure of a-amylase activity, can be used in early generations
258 P. Baenziger et al.
to identify white wheats with preharvest sprouting tolerance. However, the falling
number test may be used to segregate lines only if sprouting has already occurred.
In years in which environmental conditions are not ‘‘favorable’’ for preharvest
sprouting, irrigation systems might be needed to induce trait expression. Alterna-
tively, germination tests on grain harvested at physiological maturity, and subse-
quently dried, have been used to select lines for resistance to preharvest sprouting
(Wu and Carver, 1999). Rio Blanco, Danby, and Nuplains are hard white winter
wheat cultivars which possess genes conditioning tolerance to preharvest sprouting.
Grain hardness probably is the single most important quality factor, as it
ultimately governs the type of end-use quality applications for which a wheat
cultivar may be used. Because of partitioning of gene pools based on grain
characteristics in the United States, many programs rarely screen for hardness in
early generations. In addition, the level of desired hardness is easily detected during
milling for small-scale quality tests. The availability of the single-kernel hardness
tester (Perten) makes hardness screening during early generations relatively easy in
a breeding program. In addition, this instrument can determine seed weight and
size, and more recent models have been outfitted with NIR technology for deter-
mining protein concentration. This instrument also calculates the deviation within a
sample for each trait, which is useful information when one is attempting to develop
more uniform cultivars. Uniformly hard or soft kernels are very important for
milling and for the production of flour where traits such as starch damage impact
end-use functionality.
For soft wheat, end products include cookies, crackers, cakes, other pastries and
waffles, pretzels, soup thickeners, and biscuits. The diverse properties of these
products require a wheat type which has soft kernel texture, does not exhibit pre-
harvest sprouting, resists insect infestation, resists disease infection and mycotoxin
development, and exhibits high milling yield and high test weight. For acceptable
quality pastry products, medium protein content and strength, and low alkaline water
retention are also important. For production of high quality crackers, pretzels, and flat
breads, a wheat type would be required to have medium kernel texture, higher protein
content and strength, and medium alkaline water retention. As markets continue to
emerge for new products developed from SWWand SRWwheat types, the traditional
need for weak gluten to assure large cookie diameter has been expanded to include
the need for stronger gluten soft wheat types for the production of various crackers.
Because it is often difficult to source wheat types with diverse end-use quality
characteristics, SWW and SRW wheat cultivars developed for emerging products
markets often are most successfully marketed strictly on an identity-preserved basis.
5 Breeding Methods
There are numerous self-pollinated breeding methods (e.g., pedigree, bulk, back-
cross, double-haploid, and single seed descent) that can be applied to winter wheat
improvement, and these methods have been described in the necessary detail in
Winter and Specialty Wheat 259
various plant breeding textbooks. Suffice it to say, all of these methods have been
used successfully by winter wheat breeders, and the breeding method choice will
often depend upon a breeder’s individual situation. For example, in countries with
high labor costs (e.g., Europe, Japan, parts of North and South America), the bulk
breeding method is often employed because it is very labor efficient and suited to
the use of mechanical drills and harvesters. In countries with lower labor costs and
with high equipment costs, the pedigree method is often used because it provides
much more information on each selected line than does the bulk breeding method.
The backcross breeding method is likely used when the objective is to add a single
important trait to an existing adapted cultivar, such as when a new pathogen or pest
strain arises or when a pathogen or pest expands its area of adaptation (e.g., the
Russian wheat aphid entering the United States in 1985). Single-seed descent,
though commonly used in spring wheat breeding because of its short generation
time (does not require a vernalization period), tends to be used less frequently in
winter wheat breeding. The double-haploid method is preferred for rapidly devel-
oping inbred lines in winter wheat. Either anther/microspore culture or the wheat �maize haploid induction system can be used. The wheat � maize haploid induction
system is probably more commonly used because dependence on the wheat geno-
type used is less of a factor in creating double-haploids. However, all double-
haploid breeding methods are relatively labor intensive and, hence, it is costly to
use in many countries.
Though the common breeding methods have been described individually and in
detail in textbooks (e.g., Acquaah, 2007), in practice, few are used on a strictly
individual basis and without being combined with other methods. Most breeders
use a ‘‘mix and match’’ approach where they might use one breeding method for an
early generation objective and then change to a different method for a later generation
objective. Common examples of this approach would be using a pedigree method to
select plants with excellent disease or insect resistance (highly heritable traits in the
early generations) and with good plant phenotype followed by using double-haploid
or single seed descent to produce pure lines. This process eliminates many of the
obviously unwanted types early, thus reducing the needed number of lines, before the
labor intensive production and testing of pure lines is required. Similarly, bulk
breeding could be used to eliminate spring growth habit types (again a highly
heritable trait) and followed by practicing pedigree selection using the remaining
winter hardy progeny.
Though often not discussed in detail, the generation in which the final selection
is practiced in winter wheat breeding has very important ramifications on the
uniformity of the resultant cultivar (Baenziger et al., 2006). The earlier the genera-
tion of final selection, the more likely it is that the line will have heterozygous loci
which will lead to heterogeneity (a mixture of homozygous lines) in later genera-
tions. With each generation of self-pollination, heterozygosity is reduced and,
hence, the amount of heterogeneity in later generations is also reduced. In countries,
such as the United States, lines derived from early generations are tolerated because
cultivar heterogeneity can be described as a cultivar characteristic for intellectual
property protection (part of Plant Breeders’ Rights). Consequently, many cultivars
260 P. Baenziger et al.
are F3- or F4-derived lines. However, in many other countries (particularly Europe)
where cultivar uniformity (e.g., little heterogeneity) is required to obtain Plant
Breeders’ Rights, most final selections are made in later generations. The double-
haploid breeding method, the use of which results in a completely homozygous line,
has a distinct advantage in these countries.
As an outgrowth of the US Wheat and Barley Scab Initiative, the concept of
regional genotyping laboratories was proposed and labs were established to foster
marker-assisted selection in plant breeding (Van Sanford et al., 2001). The three
USDA-ARS labs that serve winter wheat breeding programs in the United States
are located in Manhattan, KS; Raleigh, NC; and Pullman, WA. These labs have
provided public breeding programs the opportunity to carry out marker-assisted
breeding in association with accelerated backcrossing and forward crossing of
parents. Some of this research was ongoing in individual breeding programs, but
the high throughput sequencers that are used for allele fragment analysis in these
labs allow breeding programs to undertake large-scale projects. These projects
often involve the collaboration of several breeding programs, and the size of
these projects would otherwise preclude individual programs from undertaking
them. An excellent example of a very large-scale collaborative project that involves
the genotyping labs is the wheat Coordinated Agricultural Projects (CAP) Initiative
(http://maswheat.ucdavis.edu/, verified May 19, 2008). In terms of winter wheat
participation this involves at least ten breeding programs in as many different states.
6 Transgenic Wheats
Because of a lack of acceptance by consumers, no genetically modified (GM) or
transgenic wheat cultivars have been deployed anywhere in the world. Nonetheless,
experiments with transgenic wheat can be, and are, conducted. USDA-APHIS
maintains a public database of all field trials with transgenic wheat (http://www.
aphis.usda.gov/brs/database.html, verified May 19, 2008). According to this data-
base, over 400 such trials have been completed in the United States. Transgenic
phenotypes evaluated include those presumably expressing traits with enhanced
gluten strength, resistance to Fusarium head blight, glyphosate resistance, starch
modifications, increased grain lysine content, tolerance to heavy metals, resistance
to take-all [incited by Gaeumannomyces graminis (Sacc.) Arx and D. Olivier var.
tritici J. Walker], enhanced grain yield, male sterility, altered grain hardness,
resistance to cyanamide, and altered carbohydrate metabolism. Whether these and
additional traits will someday be available to wheat breeders remains more of a
socioeconomic question rather than a scientific one. Ironically, many products
made from other genetically engineered crops and organisms are nearly essential
to the products made from wheat. For example, it would be virtually impossible to
bake bread without transgenic soybean or cottonseed oil, high fructose corn syrup,
and some of the added fortifying agents, which are produced by GM bacteria.
Winter and Specialty Wheat 261
Similarly, the commonly used whey from milk might be produced from dairy cows
protected by GM vaccines or given growth hormones to increase milk production.
7 Foundation Seed Production and Intellectual
Property Issues
The last step in bringing a cultivar to market is increasing the amount of seed from
that which is maintained as breeders’ seed to commercial quantities. The intellectual
property issues have been described in detail elsewhere (e.g., Baenziger et al., 2000),
so, it is perhaps best to briefly mention the current practices and trends in intellectual
property and seed increase. Historically, most cultivars that were protected were
done so under national laws developed by nations to be in compliance with the
International Union for the Protection of Varieties (http://www.upov.int/, verified
May 19, 2008). For example, in the United States, the Plant Variety Protection
Office (http://www.ams.usda.gov/Science/PVPO/PVPindex.htm, verified May 19,
2008) administers the Plant Variety Protection Act (PVPA). However, with more
patented traits becoming available, many new cultivars are being protected by
patents and by the PVPA. With continued interest in value-added traits and with
transgenic wheat research continuing this trend of patent protection, in addition to
PVPA, is likely to continue.Where there is dual ownership (e.g., one entity owns the
patented trait and another entity owns the cultivar), additional intellectual property
agreements, such as licenses to use traits, are involved. Furthermore, as cultivar
development agencies become increasingly specialized, licenses for the increase of
seed and sales are becoming more common. This trend is recognized in the case of
publicly developed cultivars, which are frequently no longer fully marketed by the
institutions that supported their development. Also, some countries with National
Plant Breeders’ Rights and who support collection of royalties for cultivars have
reduced the incentive for the cultivar developer to have their own seed increase
organization, at least one beyond the breeder or foundation seed classes.
For example, in the eastern soft winter wheat region, there has been a trend over
the past 10 years to shift away from publicly released varieties to some sort of
licensing (Whitt, 2005). Typically, agricultural experiment stations associated with
public US institutions, will license marketing rights, either exclusively or nonex-
clusively depending on individual state seed laws. Most experiment stations have
continued to release public cultivars, albeit at a much reduced frequency. Licensed
cultivars generate royalties, and a percentage of these royalties are returned to the
breeding programs to provide funding for continued research. Because experiment
stations retain ownership and germplasm rights, this trend has seemingly not had an
adverse impact on germplasm exchange in the region. However, from 2004 to 2006,
some seed companies announced their intention to patent all of their varieties and to
limit the extent to which these varieties can be used as parents in crosses. Because
germplasm exchange among public wheat breeding programs is still vigorously
262 P. Baenziger et al.
maintained, this decision is expected to have a very limited impact in the eastern
wheat production region of the United States.
The classes of seed during multiplication have various names, but most fre-
quently they are known as breeder seed from which foundation seed is produced
from which registered seed can be produced, from which certified seed is produced.
Certified seed is sold to the producers. In the United States, the certification process
can be found at the American Organization of Seed Certifying Agencies (AOSCA;
http://www.aosca.org/, verified May 19, 2008). Each class has specific levels of
purity and proximity to other cultivars (to avoid outcrossing) during the seed
increase. Many certified seed producers will harvest the outer edge of the seed
field as grain and the center for seed. Outcrossing is more likely at the edge of a field
rather than in the center (where outcrossing will occur but the crosses will be
sibmatings between plants of the cultivar rather than different cultivars). In addi-
tion, no matter how well a combine harvester is cleaned, there will always be some
seed remaining in the combine that can mix with the next cultivar. By cleaning the
combine and then harvesting the edge of the seed field as grain, the combine has
effectively been ‘‘cleaned’’ by running the seed cultivar through the combine.
References
Acquaah, G. 2007. Principles of plant breeding and genetics. Blackwell, Malden, MA.
Allan, R.E., Peterson, C.J., Rubenthaler, G.L., Line, R.F., and Roberts, D.E. 1989. Registration of
Madsen wheat. Crop Sci. 29(6): 1575.
Baenziger, P.S., Mitra, A., and Edwards, I.B. 2000. Protecting the value in value added crops:
Intellectual property rights. In C.F. Murphy and D.M. Peterson (eds.) Designing crops for
added value. American Society of Agronomy, Madison, WI, pp. 239–248.
Baenziger, P.S., Russell, W.K., Graef, G.L., and Campbell, B.T. 2006. Improving lives: 50 years
of crop breeding, genetics and cytology (C-1). Crop Sci. 46: 2230–2244.
Baenziger, P.S., Shelton, D.R., Shipman, M.J., and Graybosch, R.A. 2001. Breeding for end-use
quality: Reflection on the Nebraska experience. Euphytica 119: 95–100.
Bai, S., and Shaner, G. 1994. Scab of wheat: Prospects for control. Plant Dis. 78: 760–766.
Bernier, A.-M., and Howes, N.K. 1994. Quantification of variation in tyrosinase activity among
durum and common wheat cultivars. J. Cereal Sci. 19: 157–159.
Brown-Guedira, G.L., Cox, T.S., Bockus, W.W., Gill, B.S., and Sears, R.G. 1999. Registration of
KS96WGRC38 and KS96WGRC39 tan spot-resistant hard red winter wheat germplasms. Crop
Sci. 39: 596.
Budak, N., Baenziger, P.S., Eskridge, K.M., Baltensperger, D., and Moreno-Sevilla, B. 1995. Plant
height response of semidwarf and nonsemidwarf wheats to the environment. Crop Sci. 35:
447–451.
Chen, X.M. 2005. Epidemiology and control of stripe rust [Puccinia striiformis f. sp. tritici] on
wheat. Can. J. Plant Pathol. 27: 314–337.
Cox, T.S., Sears, R.G., Gill, B.S., and Jellen, E.N. 1994. Registration of KS91WGRC11,
KS92WGRC15, and KS92WGRC23 leaf rust resistant hard red winter wheat germplasms.
Crop Sci. 34: 546–547.
Divis, L.A., Graybosch, R.A., Peterson, C.J., Baenziger, P.S., Hein, G.L., Beecher, B.B., and
Martin, T.J. 2006. Agronomic and quality effects in winter wheat of a gene conditioning
resistance to wheat streak mosaic virus. Euphytica 152: 41–49.
Winter and Specialty Wheat 263
Friebe, B., Jiang, J., Raupp, W.J., McIntosh, R.A., and Gill, B.S. 1996. Characterization of wheat-
alien translocations conferring resistance to diseases and pests. Current status. Euphytica 91:
59–87.
Gill, B.S., Friebe, B., Wilson, D.L., Martin, T.J., and Cox, T.S. 1995. Registration of
KS93WGRC27 wheat streak mosaic virus-resistant hard red winter wheat germplasm. Crop
Sci. 35: 1236–1237.
Graybosch, R.A. 1992. The high-molecular-weight glutenin composition of cultivars, germplasm
and parents of U.S. red winter wheats. Crop Sci. 32: 1151–1155.
Graybosch, R.A. 1998. Waxy wheats: Origins, properties, and prospects. Trends Food Sci.
Technol. 9: 135–142.
Graybosch, R.A. 2001. Uneasy Unions: Quality effects of rye chromatin transfers to wheat.
J. Cereal Sci. 33: 3–16.
Hollenhorst, M.M., and Joppa, L.R. 1983. Chromosomal location of genes for resistance to
greenbug in “Largo” and “Amigo” wheats. Crop Sci. 23: 91–93.
Hung, P.V., Maeda, T., and Morita, N. 2006. Waxy and high-amylose wheat starches and flours –
Characteristics, functionality and application. Trends Food Sci. Technol. 17: 448–456.
Mahfoozi, S., Limin, A.E., and Fowler, D.B. 2001. Influence of vernalization and photoperiod
responses on cold hardiness in winter cereals. Crop Sci. 41: 1006–1011.
Mares, D.J. 1992. Genetic studies of sprouting tolerance in red and white wheats. In M.K. Walker-
Simmons and J.L. Reid (eds.) Pre-harvest sprouting in cereals 1992. American Association of
Cereal Chemists, St. Paul, MN, pp. 21–29.
Mares, D.J., and Ellison, F.W. 1989. Dormancy and pre-harvest sprouting tolerance in white-
grained and red-grained wheats. In K. Ringlund, E. Mosleth, and D.J. Mares (eds.) Fifth
International Symposium on pre-harvest sprouting in cereals. Westview Press, Boulder, CO,
pp. 75–84.
McIntosh, R.A., Dyck, P.L., and Green, G.J. 1976. Inheritance of leaf rust and stem rust resistances
in wheat cultivars Agent and Agatha. Aust. J. Agric. Res. 28: 37–45.
Mesterhazy, A., Bartok, T., Mirocha, C.G., and Komoroczy, R. 1999. Nature of wheat resistance to
Fusarium head blight and the role of deoxynivalenol for breeding. Plant Breed. 118: 97–110.
Morris, C.F., and Konzak, K. 2001. Registration of hard and soft homozygous waxy wheat
germplasm. Crop Sci. 41: 934–935.
Payne, P.I. 1987. The genetical basis of breadmaking quality in wheat. Aspects Appl. Biol. 15:
79–90.
Peterson, C.J., Graybosch, R.A., Baenziger, P.S., and Grombacher, A.W. 1992. Influence of
genotype and environment on quality characteristics of hard red winter wheat. Crop Sci. 32:
98–103.
Peterson, C.J., Graybosch, R.A., Baenziger, P.S., Shelton, D.R., Worrall, W.D., Nelson, L.A.,
McVey, D.V., and Hatchett, J.H. 1993. Release of N86L177 wheat germplasm. Crop Sci. 33:
350.
Pike, P.R., and MacRitchie, F. 2004. Protein composition and quality of some new hard white
winter wheats. Crop Sci. 44: 173–176.
Seah, S., Spielmeyer, W., Jahier, J., Sivasithamparam, K., and Lagudah, E.S. 2000. Resistance
gene analogs within an introgressed chromosomal segment derived from Triticum ventricosum
that confers resistance to nematode and rust pathogens in wheat. MPMI 13: 334–341.
Sears, E.R. 1953. Nullisomic analysis in common wheat. Am. Nat. 87: 245–252.
Singh, N.K., Donovan, R., and MacRitchie, F. 1990. Use of sonication and size-exclusion high-
performance liquid chromatography in the study of wheat flour proteins. II. Relative quantity
of gluten as a measure of breadmaking quality. Cereal Chem. 67: 161–170.
Souza, E. 1998. Host plant resistance to the Russian wheat aphid (Homoptera:Aphidae) in wheat
and barley (pp. 122–147). In S.S. Quisenberry and F.B. Peairs (ed.) Response model for an
introduced pest – The Russian wheat aphid. Thomas Say Publ. in Ento- mol.: Proc. Entomol.
Soc. Am., Lanham, MD.
264 P. Baenziger et al.
Souza, E., Smith, C.M., Schotzko, D., and Zemetra, R.S. 1991. Greenhouse evaluation of red
winter wheats for resistance to the Russian wheat aphid. Euphytica 57: 221–225.
Whitt, D. 2005. Update on variety release procedures, branding and patents. Proc. of the Eastern
Wheat Workers/Southern Small Grain Workers Conf. (C.S. Swanson, ed), May 9–12, Bowling
Green, KY.
Wu, J., and Carver, B.F. 1999. Sprout damage and preharvest sprout resistance in hard white
winter wheat. Crop Sci. 39: 441–447.
Van Sanford, D., Anderson, J., Campbell, K., Costa, J., Cregan, P., Griffey, C. Hayes, P. andWard,
R. 2001. Discovery and deployment of molecular markers linked to fusarium head blight
resistance: An integrated system for wheat and barley. Crop Sci. 41: 638–644.
Yu, Y.J. 1982. Monosomic analysis for scab resistance and yield components in the wheat cultivar
Soo-moo-3. Cereal Res. Commun. 10: 185–190.
Zhang, X.K., Liu, L., He, Z.H., Sun, D.J., He, X.Y., Xu, Z.H., Zhang, P.P., Chen, F., and Xia, X.C.
2008. Development of two multiplex PCR assays targeting improvement of bread-making and
noodle qualities in common wheat. Plant Breed. 127: 109–115.
Winter and Specialty Wheat 265
Triticale: A ‘‘New’’ Crop with Old Challenges
M. Mergoum, P.K. Singh, R.J. Pena, A.J. Lozano-del Rıo, K.V. Cooper,
D.F. Salmon, and H. Gomez Macpherson
Abstract Triticale (X Triticosecale), a Man-made cereal grass crop obtained from
hybridization of wheat (Triticum spp) with rye (Secale cereale). The hope was thattriticale would combine the high yield potential and good grain quality of wheat,
and the resistance/tolerance to the biotic and abiotic stresses of rye. Triticale grains
can be used for human food and livestock feed. Since the last century, triticale has
received significant attention as a potential energy crop. Today, research is
currently being conducted includes the use of this crop biomass in bio-energy
production. The aim of a triticale breeding programs mainly focuses on the
improvement of economic traits such as grain yield, biomass, nutritional factors,
plant height, as well as traits such as early maturity and high grain volume weight.
Intense breeding and selection have made very rapid genetic improvements in
triticale seed quality. The agronomic advantages and improved end-use properties
of the triticale grains over wheat achieved by research and development efforts make
triticale an attractive option for increasing global food production particularly, for
marginal and stress-prone growing conditions. Details of the different breeding
approaches utilized to enhance modern triticale cultivars for various uses are
discussed in this chapter.
1 Introduction
Triticale (X Triticosecale Wittmack), a human-made crop, is a hybrid small grain
produced between wheat and rye. The name ‘‘triticale’’ is an international crop
name, with variations in pronunciation to suit the local language and dialect and is
derived from the combination of the scientific classifications of the two genera
involved, that is, wheat (Triticum) and rye (Secale). The triticale hybrids are all
amphidiploid, which means the plant is diploid for two genomes derived from
M. Mergoum(*)
North Dakota State University, Department of Plant Sciences, NDSU Dept. 7670, Po Box 6050,
Fougo, ND 58108-6050
M.J. Carena (ed.), Cereals,DOI: 10.1007/978-0-387-72297-9, # Springer Science + Business Media, LLC 2009 267
different species, in other words triticale is an allotetraploid. It is produced by
doubling the chromosomes of the sterile hybrid that is produced using conventional
plant breeding hybridizing techniques between wheat and rye. In earlier years most
work was done on octoploid triticale; however, different ploidy levels have been
created and evaluated over time. The octoploids showed little promise, but hexa-
ploid triticale was successful enough to find commercial application.
Triticale cultivars, grown for forage as well as for grain, can be classified into
three basic types: spring, winter, and intermediate (facultative). Spring types
exhibit upright growth and produce much forage early in their growth. They are
generally insensitive to photoperiod and have limited tillering. Winter types are
generally planted in the fall, but also can be planted in the spring in some situations.
Winter types have prostrate type of growth in the early stages of development. In
general, winter types yield more forage than spring types mainly due to their long
growth cycle. Intermediate (facultative) types, as the name implies, are intermedi-
ate to spring and winter types (Mergoum et al., 2004; Salmon et al., 2004).
Winter triticale differs from spring triticale because it requires vernalization to
initiate heading. If winter types are spring seeded and there is no vernalization then
the plants will remain vegetative and can be used for forage. Although the area
under spring triticale acreage and the number of countries growing triticale has
increased as a result of work conducted at the International Maize and Wheat
Improvement Center (Centro Internacional de Mejoramiento de Maız y Trigo,
CIMMYT), Mexico, the majority of the world triticale acreage is still under winter
types. While the CIMMYT program concentrated on spring and facultative triti-
cales, an intensive effort in Poland rapidly progressed winter type triticale, and
supplied breeding material around the world. This expanding area under winter
triticale acreage includes mainly northern Europe and North America.
Although a relatively new crop, the history of triticale goes back to the late
1870s when the first crosses were attempted in Scotland. Detailed and fully
referenced accounts of the fascinating history of triticale can be read in Ammar
et al. (2004) and Oettler (2005). The first report describing the production of sterile
hybrid plants between wheat and rye occurred in 1875 (Wilson, 1875). The first
fertile, ‘‘true’’ triticale was produced by Rimpau in 1888, from crosses between
Triticum aestivum and rye, followed by spontaneous chromosome doubling (Rim-
pau, 1891). Over the next 50 years, isolated experimentation and research occurred
throughout Europe. It was not until the 1960s that the first commercial releases
became available for producers. Commercially available triticale is almost always a
second-generation hybrid, that is, a cross between two kinds of triticale (primary
triticales). Generally, triticale combines the high yield potential and good grain
quality of wheat with disease and environmental tolerance (including soil condi-
tions) of rye. Triticale is, therefore, a crop which is particularly suited for marginal
environments (acid- or drought-prone soils) or where disease pressure is high.
Depending on the cultivar, triticale can more or less resemble either of its parents.
Current production is concentrated in Europe with nearly 90% of the world
production and ~7 million acres harvested annually. US production is nearly
1 million acres, with the majority of the planted acres used for forage and pastures.
268 M. Mergoum et al.
Production trends do show steady growth over the last 20 years with a 50% growth
in production during the last decade. The leading producers of triticale worldwide
are Germany, France, Poland, Australia, China, and Belarus. In 2005, according to
the Food and Agriculture Organization (FAO), 13.5 million tons of triticale grain
was harvested in 28 countries across the world. This is likely to be an under-
estimation as figures for Canada and the USA were not included.
2 Uses
Triticale, now a well-established crop internationally, is used for food, feed (mono-
gastrics and ruminants), grazed or stored forage and fodder, silage, green-feed, and
hay. In recent years, triticale has received attention as a potential energy crop and
research is currently being conducted on the use of the crops biomass in bioethanol
production. Interest in triticale has developed around two areas of potential use for
the grain and its use as forage crop.
2.1 Feed Grain
The first area of interest is for use as a feed grain because it has proven to be a
good source of protein, amino acids, and vitamin B. The protein content of triticale
lines has ranged from 10% to 20% on a dry weight basis, which is higher than
wheat. The amino acid composition of the protein is similar to wheat, but may be
slightly higher in lysine. In addition, it is a better ruminant feed than other cereals
due to its high starch digestibility. Results of feeding experiments indicate that pigs
fed triticale-based diets had rates of gain and feed efficiencies similar to those of
pigs fed corn-based diets. So, triticale has been found to be a palatable grain and can
be used as either the partial or the sole grain source in diets for all classes of swine.
Also, diets containing triticale grain are balanced to meet lysine rather than crude
protein requirements (Myer, 2002; Boros, 2002). Modern triticale grain is an
excellent feed grain for use in mixed poultry diets. Grain from modern triticale
varieties has been reported to be comparable in energy value to other cereal grains
for use in mixed diets of beef and dairy cattle, sheep, broilers and laying hens,
and pigs and its protein is well utilized (Gursoy and Yilmaz, 2002; Myer and
Lozano del Rio, 2004).
2.2 Food Grain
The second area of interest for triticale grain is in developing it as a food grain
cereal that would exhibit unique baking traits. As a food grain, triticale has also
been recognized as a hardy crop capable of helping combat world hunger. Triticale
has potential in the production of bread and other food products such as pasta and
Triticale: A ‘‘New’’ Crop with Old Challenges 269
breakfast cereals (Pena, 2004). The protein content is higher than that of wheat
although the glutenin fraction is less. Assuming increased acceptance, the milling
industry will have to adapt to triticale and develop milling techniques suited
for triticales. While most of the varieties available are not suitable for leavened
bread making on their own because of a weak and sticky gluten, they can be used
in leavened products when blended with wheat flour. Triticale is suitable for
producing a range of unleavened products such as cakes, cookies, biscuits, waffles,
noodles, flour tortillas, and spaghetti (Skovmand et al., 1984). Triticale can be
milled into flour using standard wheat or rye flour-milling procedures. Triticale
cultivars possessing improved grain shape and plumpness produce flour yields
equal or closer to those of wheat (Saxena et al., 1992). The low flour extraction
rates commonly shown by soft triticale may be increased by milling wheat–triticale
grain blends; mixing wheat–triticale at a 75:25 ratio prior to milling produces flour
yields comparable to those of wheat milled alone (Pena and Amaya, 1992).
Triticale has also been used alone or in blends with other cereal grains to manufac-
ture high fiber snacks prepared by extrusion or by flaking triticale grains.
2.3 Forage Crop
Triticale has been and is increasingly grown for livestock grazing, cut forage (green
chop), whole-plant silage, hay, and forage/grain dual purpose (Myer and Lozano
del Rio, 2004). Triticale can be grown as a monocrop, winter/spring blend, and
mixture with legumes, other cereal, and/or annual ryegrass. The advantage with
blends is that the grazing season can be extended and/or forage nutritive value
improved, in particular when blended with legumes.
In general, forage yield of triticale compares very favorably to other forage
small-grain cereals in studies done all over the world (Varughese et al., 1996;
Lozano et al., 1998). Research on the evaluation of triticale as a forage for rumi-
nants has generally indicated comparative nutritive values to other forage cereal
crops (Lozano et al., 1998). Spring triticale provides an excellent alternative
to other spring cereals such as barley and oats. Spring triticale has been shown to
be more drought tolerant than other spring cereals (Barary et al., 2002). Facultative
and winter types are particularly well suited for grazing as they generally have a
better distribution of forage over the growing season (Fig. 1).
The cutting and subsequent storage of triticale forage for silage is similar to that
of any other small-grain forage. The best time to cut triticale for silage is in the boot
to early-heading stage. Triticale cut earlier than the soft dough stage requires wilting
in order to make high quality silage. Triticale like other small grains can provide a
good source of hay when properly cut, cured, and baled (Fig. 2). For best results and
quality, triticale should be cut between late boot and early heading stage.
Straw is an important by-product of triticale grain production and is often
overlooked (Myer and Lozano del Rio, 2004). Triticale produces more straw than
other small-grain cereals. Straw is frequently the only source of livestock feed
270 M. Mergoum et al.
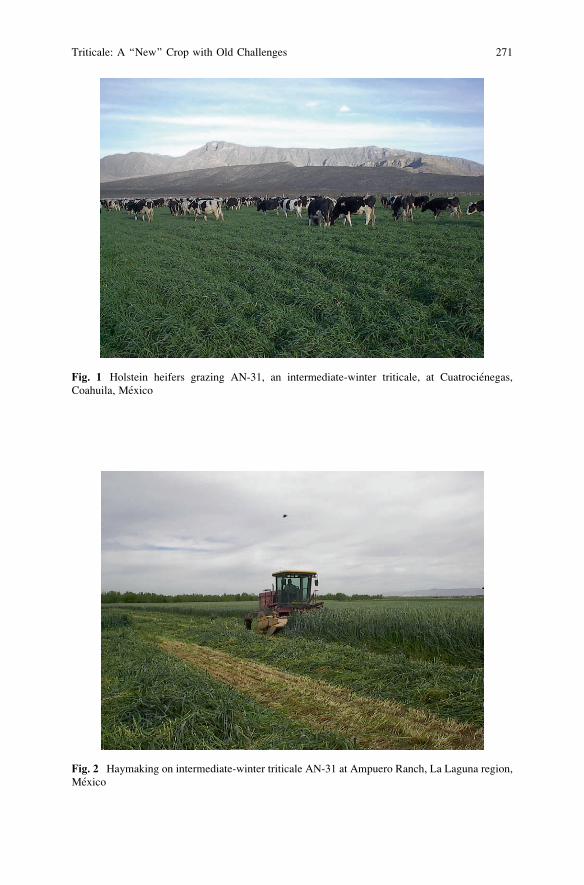
Fig. 2 Haymaking on intermediate-winter triticale AN-31 at Ampuero Ranch, La Laguna region,
Mexico
Fig. 1 Holstein heifers grazing AN-31, an intermediate-winter triticale, at Cuatrocienegas,
Coahuila, Mexico
Triticale: A ‘‘New’’ Crop with Old Challenges 271
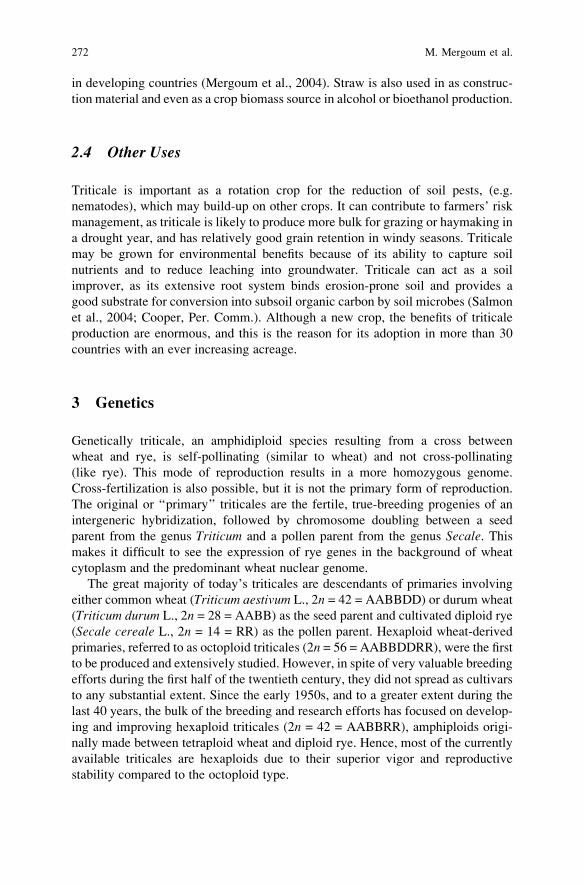
in developing countries (Mergoum et al., 2004). Straw is also used in as construc-
tion material and even as a crop biomass source in alcohol or bioethanol production.
2.4 Other Uses
Triticale is important as a rotation crop for the reduction of soil pests, (e.g.
nematodes), which may build-up on other crops. It can contribute to farmers’ risk
management, as triticale is likely to produce more bulk for grazing or haymaking in
a drought year, and has relatively good grain retention in windy seasons. Triticale
may be grown for environmental benefits because of its ability to capture soil
nutrients and to reduce leaching into groundwater. Triticale can act as a soil
improver, as its extensive root system binds erosion-prone soil and provides a
good substrate for conversion into subsoil organic carbon by soil microbes (Salmon
et al., 2004; Cooper, Per. Comm.). Although a new crop, the benefits of triticale
production are enormous, and this is the reason for its adoption in more than 30
countries with an ever increasing acreage.
3 Genetics
Genetically triticale, an amphidiploid species resulting from a cross between
wheat and rye, is self-pollinating (similar to wheat) and not cross-pollinating
(like rye). This mode of reproduction results in a more homozygous genome.
Cross-fertilization is also possible, but it is not the primary form of reproduction.
The original or ‘‘primary’’ triticales are the fertile, true-breeding progenies of an
intergeneric hybridization, followed by chromosome doubling between a seed
parent from the genus Triticum and a pollen parent from the genus Secale. Thismakes it difficult to see the expression of rye genes in the background of wheat
cytoplasm and the predominant wheat nuclear genome.
The great majority of today’s triticales are descendants of primaries involving
either common wheat (Triticum aestivum L., 2n = 42 = AABBDD) or durum wheat
(Triticum durum L., 2n = 28 = AABB) as the seed parent and cultivated diploid rye
(Secale cereale L., 2n = 14 = RR) as the pollen parent. Hexaploid wheat-derived
primaries, referred to as octoploid triticales (2n = 56 = AABBDDRR), were the first
to be produced and extensively studied. However, in spite of very valuable breeding
efforts during the first half of the twentieth century, they did not spread as cultivars
to any substantial extent. Since the early 1950s, and to a greater extent during the
last 40 years, the bulk of the breeding and research efforts has focused on develop-
ing and improving hexaploid triticales (2n = 42 = AABBRR), amphiploids origi-
nally made between tetraploid wheat and diploid rye. Hence, most of the currently
available triticales are hexaploids due to their superior vigor and reproductive
stability compared to the octoploid type.
272 M. Mergoum et al.
What makes the history and evolution of triticale as a species so unique com-
pared to that of wheat or other allopolyploids is that its evolution occurred during
the last 130 years and its most dramatic evolutionary events (i.e. allopolyploidiza-
tion as a result of intergeneric hybridization followed by chromosome doubling)
were almost all directed by humans. Earlier ‘‘in campo’’ work, with wheat–rye
crosses was difficult due to low survival of the resulting hybrid embryo and
spontaneous chromosome doubling. To improve the viability of the embryo and
thus avoid its abortion, in vitro culture techniques were developed. Colchicine was
used as a chemical agent to double the chromosomes. These developments initiated
the successful new era of triticale crop.
4 Early Triticale Breeding
The first triticale at the hexaploid level was reported in 1938, followed by others
from various locations, for example, USA, Japan, Spain, Hungary, and the Russian
Federation. Breeding efforts during the 1940s and early 1950s concentrated on the
production and intercrossing of both octoploid and primary triticales, although
these were of no commercial value. More intensive breeding programs with the
explicit objective of developing triticale into a commercial crop were initiated
during the 1950s in Spain (Sanchez-Monge, 1974), Canada (Shebeski, 1974), and
Hungary (Kiss, 1974). These programs led to the release of the first cultivars, being
Triticale numbers 57 and 64 in Hungary in 1968, followed by ‘‘Cachirulo’’ in Spain,
and ‘‘Rosner’’ in Canada, both in 1969.
In 1953, the University of Manitoba, Winnipeg, Canada, began the first North
American triticale breeding program working mostly with durum wheat–rye
crosses. Early breeding efforts concentrated on developing a high yielding and
drought-tolerant human food crop species suitable for marginal wheat-producing
areas. Both winter and spring types were developed, with emphasis on spring types.
Since Canada’s program, other public and private programs have initiated both
durum wheat–rye and common wheat–rye crosses. The major triticale development
program in North America is now at CIMMYT in Mexico, with some private
companies continuing triticale programs. The CIMMYT Triticale Improvement
Program started in 1964 under the leadership of Dr. N.E. Borlaug, followed by
Dr. F.J. Zillinsky in 1968 (Zillinsky and Borlaug, 1971). This program, in coopera-
tion with the University of Manitoba, was funded initially by the Rockefeller
Foundation. In 1971, the Government of Canada undertook complete funding of
the CIMMYT Triticale Improvement Program. Breeding work diminished at the
University of Manitoba and was later replaced by breeding and agronomic devel-
opment programs of Alberta Agriculture, Food, and Rural Development (Field
Crop Development Centre, Lacombe) and Agriculture and Agri-Food Canada
(Swift Current and Lethbridge).
In the beginning, several major hurdles had to be overcome to tailor triticale to
become a viable crop. Early triticales, though vigorous in growth habit, were
Triticale: A ‘‘New’’ Crop with Old Challenges 273
extremely late, very tall, sterile, photoperiod sensitive, and possessed shriveled
seeds. The first major breakthrough came by serendipity when a triticale plant
resulting from a natural out-cross to unknown Mexican semi-dwarf bread wheat
was selected in 1967. The selected line, designated ‘‘Armadillo,’’ made a major
contribution to triticale improvement worldwide since it was the first triticale
identified to carry a chromosome substitution wherein the D-genome chromosome
was substituted for the respective R-genome homeologue. Because of this drastic
improvement in triticale germplasm, numerous cultivars were released, and the
crop was promoted to farmers as a ‘‘miracle crop.’’ By the late 1980s, data from
international yield trials revealed that complete hexaploid triticale (AABBRR) was
agronomically much superior to 2D(2R)-substituted hexaploid types, particularly
under marginal growing conditions. Thereafter, triticale germplasm at CIMMYT
was gradually shifted towards complete R-genome types to better serve these
marginal environments. Today, CIMMYT is the principal supplier of improved
spring triticale germplasm for many national and regional agricultural research
systems around the world. The spring material also serves as an ancestral constitu-
ent of most winter triticales cultivars.
5 Achievements in Triticale Breeding
The last four decades of research on triticale initiated by CIMMYT in association
with National Agricultural Research Systems (NARS) around the world have
resulted in significant improvements of triticale crop. Triticale today is an interna-
tional crop grown in more than 28 countries with the number of countries and the
acreage under triticale production increasing. In 2003, triticale occupied nearly
3 million ha worldwide, compared to about 1 million ha in 1988 (Varughese et al.,
1996; FAO, 2003). Results from many research and developments project demon-
strate that triticale has potential as an alternative crop for different end-uses in a
wide range of environments, particularly for marginal and stress-prone growing
conditions.
5.1 Yield Increase
Major success in increasing the triticale yield has been attributed to research and
development conducted at CIMMYT, Mexico. Under near optimal conditions at
Ciudad Obregon, Mexico, a comparison of maximum-yield trials of triticale devel-
oped at CIMMYT revealed an average increase of 1.5% per year (Sayre et al., 1996)
(Fig. 3). The genetic gain in yield potential was mainly due to a substantial increase
in harvest index, grains/m2, spikes/m2, test weight, and a decrease in plant height.
Lodging resistance in triticale has been successfully introgressed using the
dwarfing genes from both Triticum and Secale species. This has resulted in a
274 M. Mergoum et al.
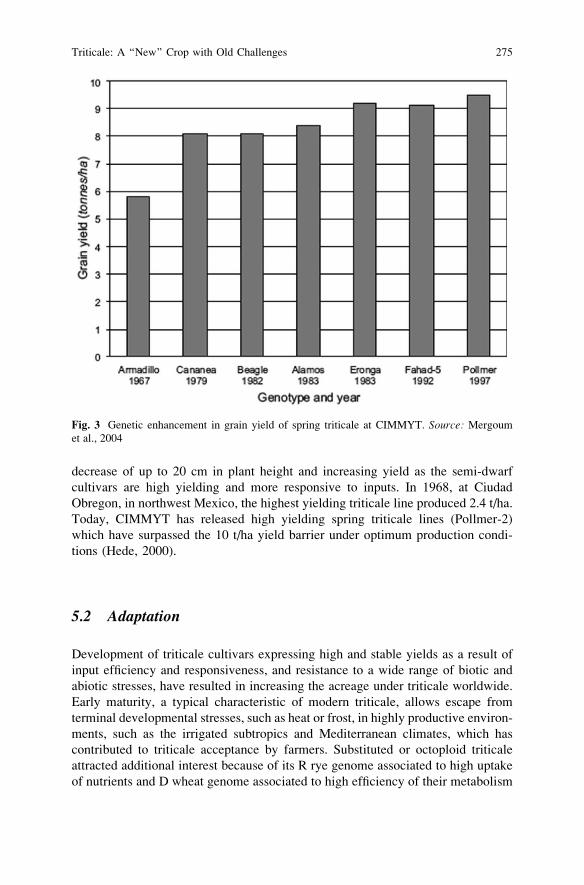
decrease of up to 20 cm in plant height and increasing yield as the semi-dwarf
cultivars are high yielding and more responsive to inputs. In 1968, at Ciudad
Obregon, in northwest Mexico, the highest yielding triticale line produced 2.4 t/ha.
Today, CIMMYT has released high yielding spring triticale lines (Pollmer-2)
which have surpassed the 10 t/ha yield barrier under optimum production condi-
tions (Hede, 2000).
5.2 Adaptation
Development of triticale cultivars expressing high and stable yields as a result of
input efficiency and responsiveness, and resistance to a wide range of biotic and
abiotic stresses, have resulted in increasing the acreage under triticale worldwide.
Early maturity, a typical characteristic of modern triticale, allows escape from
terminal developmental stresses, such as heat or frost, in highly productive environ-
ments, such as the irrigated subtropics and Mediterranean climates, which has
contributed to triticale acceptance by farmers. Substituted or octoploid triticale
attracted additional interest because of its R rye genome associated to high uptake
of nutrients and D wheat genome associated to high efficiency of their metabolism
Fig. 3 Genetic enhancement in grain yield of spring triticale at CIMMYT. Source: Mergoum
et al., 2004
Triticale: A ‘‘New’’ Crop with Old Challenges 275
(Osborne and Rengel, 2002). Modern triticale cultivars have good tolerance of
aluminum, which becomes increasingly available in acid soil conditions, and have
good efficiency for accessing major nutrient (phosphorus) and trace elements
(manganese, copper, zinc) in alkaline soils where these elements tend to become
poorly available.
Many triticale cultivars have good water-logging tolerance, tolerance to periods
of drought, and some Polish material has been demonstrated to have good tolerance
to salinity (Koebner and Martin, 1996). Under marginal land conditions, where
abiotic stresses related to environment (drought or temperature extremes) and soil
conditions (extreme pH levels, salinity, toxicity, or deficiency of elements) are the
limiting factors for grain production, modern triticale cultivars have consistently
shown its advantages and has outperformed the existing cultivated cereal crops
(Mergoum et al., 2004).
Since, triticale cultivation is similar to traditional cereal crops and it offers many
more end-use alternatives for both humans and animals, triticale is more often grown
in stressed environments with low input for grazing, grain, and straw production. In
addition, triticale is grown as forage or for dual purposes involving grain and forage
production. Research reveals an increase in the adaptation and successful production
of triticale to stressed environments, particularly to water stress (Barary et al., 2002).
Both successful breeding and management have resulted in acceptance of triticale as
a major alternate crop to traditional cereal crops.
5.3 Enhanced Quality
Triticale breeding programs worldwide including CIMMYT have emphasized
improving the product quality and developing triticale cultivars for specific end-
uses. The most significant improvement was achieved for plumper grain. The test
weight of the best Armadillo selections in 1970 at CIMMYT was 73.7 kg/hl
compared to 65.8 kg/hl of the best line in 1968 (Zillinsky and Borlaug, 1971).
Substantial progress has continued to improve test weight, and some modern
triticales can reach 80 kg/hl under favorable environmental conditions (Mergoum
et al., 2004). Since 1990, due to specific end-use and market requirements, more
emphasis has been given to developing triticale for specific end-uses, such as
milling and baking purposes, feed grain, dual purpose (forage and grain), and
grazing types. Variability present in the triticale germplasm for preharvest sprout-
ing and gluten quality has been exploited by breeders to develop cultivars with
enhanced quality and sprouting resistance which has improved the bread-making
qualities of triticale grain.
In general, winter triticale produces higher forage biomass than spring types.
Therefore, their use for forage (grazing), cut forage, silage, and grain or hay has
been improved through the release of several forage-specific cultivars. In addition,
in many countries cereal straw is a major feed source for animals and in some years
can have greater value than grain. Under arid and semiarid conditions, triticale has
276 M. Mergoum et al.
been shown consistently to produce higher straw yields than wheat and barley
(Mergoum et al., 1992).
5.4 Biotic Resistance
Initially, biotic stresses did not appear to be a serious constraint to triticale
production; however, as triticale acreage increased, most wheat and rye diseases
started to infect triticale (Singh and Saari, 1991). In comparison with wheat,
triticale appears to have good resistance to several common wheat diseases and
pests including rusts (Puccinia sp.), Septoria complex, smuts (Ustilago and
Urocystis sp.), bunts (Tilletia sp.), powdery mildew (Blumeria graminis), cerealcyst nematode (Heterodera avenae), and Hessian fly (Mayetiola destructor). It alsoresists virus diseases, such as barley yellow dwarf, wheat-streak mosaic, barley-
stripe mosaic, and brome mosaic (Varughese et al., 1996; Skovmand et al., 1984).
However, it gets disease in common with other cereals, but there is considerable
varietal variation in terms of disease resistance. Triticale has relatively greater
susceptibility than wheat to diseases such as spot blotch (Bipolaris sorokiniana),scab (Fusarium sp.), and ergot (Claviceps purpurea) and bacterial diseases caused
by Xanthomonas sp. and Pseudomonas sp., which preclude the immediate commer-
cial introduction of triticale in those areas where wheat is otherwise better adapted
(e.g. Zambia and Brazil) (Skovmand et al., 1984). In the past, susceptibility to ergot
was a major limitation to triticales expansion. However, its susceptibility in the past
was linked to problems with floret sterility, and ergot is not seen as a major problem
in current varieties.
The reaction of triticale to many diseases and pests meets the expectations
of a combined resistance found in the two parental species. The disease and
insect resistance reactions of one or the other of the parents is reflected in triticale
progeny, or the reaction of triticale is intermediate between that of wheat and rye,
as in the case of take-all (Gaeumannomyces graminis) and Russian wheat aphid
(Diuraphis noxia). There is some evidence that triticale varieties vary in their
resistance depending on the number of rye-genetic material (chromosomes) present
with varieties that have a greater number of rye chromosomes having greater
resistance to take-all (Wallwork, 1989). The considerable variability present in
triticale germplasm for different diseases and pest is being exploited by breeders to
develop durable resistant cultivar which has resulted in wide-scale production of
triticale worldwide.
6 Breeding Strategies
For long-term success, a strategy for crop enhancement that emphasizes the main-
tenance and generation of genetic diversity, while carefully balancing diversity
objectives required to ensure long-term progress with the relatively narrower
Triticale: A ‘‘New’’ Crop with Old Challenges 277
frequency of favorable alleles necessary to achieve short-term breeding goals, is
necessary. In triticale, the lack of genetic diversity may be overcome by the varied
spectrum of human-introduced diversity. For example, spring and winter wheat
and rye gene pools are accessed through direct interspecific (wheat � triticale) and
intraspecific (winter triticale � spring triticale) crosses. Octoploid � hexaploid
triticale crosses guarantee an influx of cytoplasmic variability. In addition, genetic
variability can also be achieved by producing new triticales wherein some chromo-
somes from the R genome have been replaced by some from the D genome. Many
modern triticale lines developed from such crosses carry D(A), D(B), and D(R)
whole chromosome substitutions or chromosome translocations which add valuable
traits to triticale. Furthermore, results from CIMMYT International Triticale Yield
Nurseries suggest adaptive advantages of complete triticale carrying a 6D(6A)
substitution (Mergoum et al., 2004).
Genetic traits from related wheat species are transferred into triticale via wheats
carrying alien introgressions. Additional introgression involves the crossing of
closely related plant relatives and results in the transfer of ‘‘blocks’’ of genes.
Genes located in the proximal areas of chromosomes may be linked thus preventing
or severely hampering genetic recombination which is necessary to incorporate the
desirable genes. A weak colchicine chemical solution has been employed to
increase the probability of recombination in the proximal chromosome regions
and thus the introduction of the translocation to that region. The resultant translo-
cation of smaller blocks that indeed carry the gene(s) of interest has decreased the
probability of introducing unwanted genes. The optimal chromosomal constitution
of triticale, the makeup of homeologous AA, BB, DD, and RR chromosomes or
chromosome arms, has yet to be defined, and unique optimal chromosomal config-
urations for the diverse agroecological zones and end-uses are likely to emerge. In
addition, unique combinations are being attempted in hybrid triticale.
The development of populations with specific traits facilitates the combination
of desirable traits from different unadapted genotypes with adapted germplasm.
Recently, more emphasis has been directed towards improving certain triticale
agronomic traits, including grain-filling duration and rate, earliness and tillering
capacity, but quality parameters have also to be addressed, such as test weight,
protein content, and gluten strength enhancement (Boros, 2002). Although triticale
has shown good resistance to most prevalent diseases and insects in most cereal-
growing areas, with the spread of this crop and the race specialization of pests,
triticale has become vulnerable to certain diseases or insects.
Breeding for the abiotic stresses of marginal lands (acid, sandy, or alkaline
soils), trace element deficiencies (copper, manganese, and zinc), or trace element
toxicity (high boron), and the different types of moisture stresses will still constitute
a major effort in spring and winter/facultative triticale improvement worldwide.
This can be achieved by exploiting key locations during selection, screening, and
yield testing and through shuttle-breeding involving NARSs (e.g. Brazil for acid
soils and sprouting and Morocco for terminal drought and sandy soils) (Mergoum
et al., 2004). Further improvements, particularly in grain plumpness, grain color
278 M. Mergoum et al.
(white or amber), and gluten quantity and quality, are expected to make triticale
more attractive as a food grain.
Triticale is a self-pollinated crop although some degree of cross-pollination is
possible. Modern triticale-breeding programs follow different breeding strategies
in order to develop superior triticale cultivars. Traditional breeding methodolo-
gies applicable for self pollinated crops like ‘‘Backcrossing selection,’’ ‘‘Pedigree
selection,’’ ‘‘Bulk selection,’’ and ‘‘Single Seed Descent’’ are followed in com-
bination with breeding strategies like recurrent selection and hybrid triticale,
which are predominantly followed in a cross-pollinated crop. In addition, modern
breeding approaches involving shuttle breeding, double haploidy, marker-assisted
selection (MAS), and genetic transformations are performed in most triticale-
breeding programs. The following breeding strategies in combination with tradi-
tional breeding method are likely to further enhance the gains in triticale
breeding.
6.1 Shuttle Breeding
Shuttle breeding, pioneered at CIMMYT, Mexico, was originally used to speed up
the wheat breeding process by advancing and testing breeding material, at contrast-
ing environments, has been successfully adopted in triticale breeding. Higher
success in shuttle breeding is observed due to the exposure of the breeding germ-
plasm to contrasting disease spectra, soil types, photoperiod length, and diverse
environmental conditions. The success of shuttle breeding in triticale resulted in
development in high yielding-adapted triticale cultivars worldwide and their large
scale production in a relatively small time. Collaboration and sharing of germplasm
among triticale breeders, due to participation of multiple triticale breeding
centers in shuttle breeding, have further helped in development of superior
triticale cultivars (Pfeiffer, 1995).
6.2 Hybrid Triticale
Based on the commercial success of other hybrid crops, the use of hybrid
triticales as a strategy for enhancing yield in favorable as well as marginal
environments has proven successful over time. Earlier research conducted by
CIMMYT made use of a chemical hybridizing agent (CHA) in order to evaluate
heterosis in hexaploid triticale hybrids (Mergoum et al., 2004). To select the most
promising parents for hybrid production, testcrosses conducted in various envir-
onments are required. This is because the variance of their specific combining
ability (SCA) under differing environmental conditions is the most important
component in evaluating their potential as parents to produce promising hybrids.
Triticale: A ‘‘New’’ Crop with Old Challenges 279
Commercially exploitable yield advantages of hybrid triticale cultivars are depen-
dent on improving parent heterosis and on advances in inbred-line development.
Yield improvements of up to 20% have been achieved in hybrid triticale cultivars
(Oettler et al., 2001, 2003) The identification of good combining ability or ‘‘heter-
otic groups’’ at an early stage in the breeding program can reduce the costs
associated with ‘‘carrying’’ a large number of plants through the program and
thus forms part of efficient selection.
6.3 Double Haploids
Double haploid (DH) plants have the potential to save much time in the develop-
ment of inbred lines. This is achieved in a single generation in DH as opposed to
many in case of traditional breeding methods which would otherwise occupy much
physical space/facilities. Various techniques exist to create DHs. The androgenesis
techniques involving in vitro culture of anthers and microspores is most often used
in triticale (Bernard and Charmet, 1984; Gonzalez and Jouve, 2000). Many culti-
vars within triticale are recalcitrant in that the success rate of achieving whole
newly generated plants is very low. Genotype � culture–medium interaction is
responsible for varying success rates, as is a high degree of microspore abortion
during culturing (Gonzalez and Jouve, 2005). It is also known that the response of
parental triticale lines to anther culture is correlated to the response of their progeny
(Gonzalez et al., 1997). Such information further help in optimizing the DH
production process.
Chromosome elimination is another method of producing DHs and involves
hybridization of triticale with maize (Zea mays L.) followed by auxin treatment and
the artificial rescue of the resultant haploid embryos before they naturally abort.
This technique is unfortunately less successful in triticale. However, Imperatacylindrica (a grass) was found to be just as effective as maize with respect to the
production of DHs in both wheat and triticale (Pratap et al., 2005).
6.4 Marker-Assisted Selection
MAS is a form of indirect selection for a given trait which is becoming an important
component of modern plant breeding. Triticale has not been well characterized with
respect to molecular markers; although, an abundance of rye and wheat molecular
markers are available and makes it possible to track segments/genes thereof within
a triticale background. It is generally accepted that molecular markers are better
predictors than morphological markers (agronomic traits) due to their insensitivity
to variation in environmental conditions.
Comparative genome mapping has revealed a high degree of similarity in
terms of sequence colinearity between closely related crop species. This allows
280 M. Mergoum et al.
the exchange of such markers within a group of related species such as wheat, rye,
and triticale. One study established a 58% and 39% transferability rate to triticale
from wheat and rye, respectively (Kuleung et al., 2004). ‘‘Transferability’’ refers to
the phenomenon where the sequence of deoxyribonucleic acid (DNA) nucleotides
flanking the simple sequence repeat (SSR) loci is sufficiently homologous or similar
between genomes of closely related species. Thus DNA primers designed for one
species can be used to detect SSRs in related species. Hence, there is great potential
that SSR markers available in wheat and rye can be successfully used for triticale
(Kuleung et al., 2004). Yong (2001) performed an amplified fragment length
polymorphism (AFLP) analysis in order to identify 2RL-specific markers in a
wheat–rye translocation line (2BS/2RL) developed for resistance to biotype L. of
Hessian fly. He developed a sequence-tagged site (STS) primer for diagnostics of
2RL (SJ07), applicable in wheat, rye, and triticale.
6.5 Genetic Transformation
The genetic transformation of crops referred to as GMO (genetically modified
organisms) involves the incorporation of ‘‘foreign’’ genes or, rather, very small
DNA fragments compared to introgression discussed earlier. Amongst other uses,
transformation is a useful tool to introduce novel traits/characteristics into the
transformed crop. These novel traits/genes may be coming from any donor species
which may not be transferred using conventional breeding due to lack of sexual
compatibility between the two species. Two methods have been attempted to
transform triticale, that is, Agrobacterium-mediated trasnformation and biolistics
transformation. Triticale has been transformed via biolistics with a 3.3% success
rate (Zimny et al., 1995), while a recent study by Nadolska-Orczyk et al. (2005)
reported that Agrobacterium-mediated transformation was possible, however, the
success rate was very low.
7 Future Challenges
Scientists and producers are interested in triticale because it is well adapted to harsh
environmental conditions of high elevation, acid soil, salinity and aluminum toxic-
ity, drought, and waterlogged soils (Mergoum et al., 2004). Triticale also has
greater tolerance to common wheat diseases than wheat (Horlein and Valentine,
1995). Triticale grain also is high in essential amino acids, which makes it more
nutritionally valuable than wheat, although the baking quality is inferior to that of
bread wheat (Horlein and Valentine, 1995). Therefore, triticale is a promising crop
and a valuable genetic resource for transferring (‘‘bridge’’) desirable genes, partic-
ularly disease-resistance genes, from rye to wheat.
Triticale: A ‘‘New’’ Crop with Old Challenges 281
7.1 Adaptation
The relatively low adoption of triticale by farmers in several countries is in contrast
with encouraging international nursery data, cultivar releases, and reports from
NARS scientists and on-farm data, which indicate the high production potential of
triticale, particularly for small farmers in marginal environments. However, there
are several transitory social- and economic-related issues that limit triticale expan-
sion in many countries. Improvements in several economic and biological traits are
required in order to tailor this crop to fit farmers’ needs and market requirements.
Triticale is the only man-made crop and just over 130 years of breeding, it is
still in the process of evolving not only as a species but also in its utilization. Based
on the genomes that contribute to triticale the crop has the potential to have all of
the genetic variability that exists in the parental species, and it is relatively easy to
introgress new genetic material from the parental species through the use of
conventional pollination techniques.
In areas where opportunistic organisms such as ergot (Claviceps purpurea) arenot a problem, hybrid triticale is feasible. Programs in CIMMYT (Ammar et al.,
2006), Australia (Darvey et al., 2006), and Europe (Warzecha and Salak-Warzecha,
2006) as well as in other countries are working on the development of hybrid
systems that are expected to provide yield advantages of up to 15% compared to
conventional triticale. To date the complex nature of the triticale genome, which
carries some minor partial restoration genes, has made it difficult to develop stable
male sterile parents and maintainers. Once these problems are worked out, hybrid
production system will not only provide increased yield for use in food, feed,
fodder, and industrial applications but will also be of value to the developer for
controlling seed distribution.
7.2 Uses
In the early stages of development during the last century a considerable amount of
effort was placed on utilizing the adaptation of triticale to high stress environments
to develop a crop for the direct production of food. However, triticale has become
an important feed and fodder crop in most parts of the world where significant
numbers of hectares are grown. Although triticale may not as yet have reached the
goal of being a significant direct human food, animal feed grains and fodder are
essential for the production of livestock which are a food source for humans.
Consequently, triticale is in reality becoming a crop which can positively impact
the world food supply. In addition to the more conventional uses, triticale is also
being considered as a feedstock for ethanol production and in ‘‘Biorefining’’ and
‘‘Molecular Farming.’’
The current trend in the development of renewable fuels such as ethanol from
grain or straw and plant biomass is in the most part based on sugarcane, maize, and
282 M. Mergoum et al.
sugarbeet. Triticale as a small-grained cereal is an excellent source of starch (Boros,
2006) or cellulose for ethanol production in areas were production of the most
common sources of ethanol is not feasible, such as in the extreme northern and
southern latitudes, higher altitudes, and other high stress environments. These are
also areas where wheat and barley is grown, but the yield advantage and stability of
triticale over wheat, under a range of environments, makes it a valuable source of
feedstock for the fermentation process.
Another area in biorefining that triticale has a potential fit is the production of
fiber from whole plant biomass or from straw as a harvest byproduct. ‘‘The
Canadian Triticale Biorefinery Initiative’’ (Eudes, 2006), as well as similar pro-
grams elsewhere, plans to look not only at the potential of conventionally produced
triticales but also at the genetically engineered triticale intended for purely indus-
trial purposes. Given the concerns with development of GMOs this includes a
detailed evaluation of biosafety issues related to potential contamination of food
related and nonindustrial crops prior to any subsequent field production.
It is expected that the production of triticale both in the hectares grown and yield
potential will continue to increase. The additional use of the crop for grain and
biomass in renewable fuels and other industrial products as well as ‘‘Molecular
Farming’’ has significant potential. Unfortunately, the land base available for crop
production is finite, and changes in the environment such as ‘‘Global Warming’’
could have a serious impact on current crop production. Alternative uses for crops
such as triticale will potentially compete with the production of human food and
definitely will compete with the livestock feed and fodder supply.
7.3 Genetic Diversity
The large-scale triticale development program at CIMMYT, Mexico, has done
much to increase the knowledge base on triticale and provide a range of triticale
germplasm with wide adaptation to a range of environments. However, the genetic
diversity in current programs is extremely narrow (Mergoum et al., 2004). This is
not unexpected since the process of variety selection in a breeding program by its
nature narrows the genetic base and not all regional/national breeding programs
have the resources to conduct extensive germplasm development. New international
initiatives in variety and germplasm development are expected to have a major
impact on further increases in winter and spring triticale germplasm and variety
development through collaborative work in conjunction with international germ-
plasm programs such as CIMMYT.
7.4 Genomics
Genomics by definition involves the identification of all genes in a particular
genome which in the case of hexaploid triticale involves the A, the B, the R, and
portions of the D genomes. The production of genome maps in cereals allows for
Triticale: A ‘‘New’’ Crop with Old Challenges 283
the development of systems such as genetic markers that can be used in MAS.
Although a significant amount of work has been done in wheat and rye, more is
required in triticale in order to effectively utilize MAS. Xue-Feng et al. (2002)
found that genome modification or evolution is occurring in triticale since many of
the RFLP bands normally found in rye are not expressed in triticale and that if the
bands were found in both parents the expression could be up to three times greater
than in the parents. Further research in this area may assist in understanding why
traits from the parental species are either incompletely or not expressed in triticale.
There is no doubt that the use of genetic markers in triticale will have an important
impact on continued development and selection of superior types. Although initially
triticale tended to show higher levels of disease resistance than more commonly
cultivated cereal species, the increase in area grown to triticale has resulted in
triticale becoming susceptible to a range of diseases under increased disease pres-
sure. This is exemplified by the susceptibility of triticale in Belgium (Haesaert et al.,
2006) to powdery mildew (Erysiphe graminis f. sp. tritici), a pathogen, which
triticale was highly resistant. The development of markers for disease resistance
will have a significant impact combined with other selection criteria.
7.5 Health Issues
Triticale has not as yet become a staple food in the form of leavened bread, as
originally intended when work was first initiated on the crop, but it does perform
well in the production of unleavened products. The primary concern in these
products has been color which does not result in the same appearance as traditional
products (Bakhshi et al., 1998). Several programs have been developing hard white/
ambers versions of triticale. Despite the fact that the uptake of triticale as a human
food has been somewhat disappointing, triticale has excellent nutritional quality.
Early studies have indicated that triticale has excellent vitamin balance and excel-
lent amino acid content (Villegas et al., 1970). Other factors such as fiber and lipid
quality have an important impact of human dietary health.
Salmon et al. (2002) discussed the importance of the high dietary fiber in
triticale. High fiber content in food helps regulate blood glucose which is an
advantage for individuals who are diabetic. Insoluble fiber assists in maintaining
colon health and soluble fiber assists in reducing glucose release and absorption
there by controlling blood cholesterol. In the same study the lipid content of triticale
was found to be significantly higher than in wheat. This is very important since
components of the lipid fraction can have antioxidant activity and result in meta-
bolic regulation of cholesterol.
The utilization of triticale in a continually widening range of application bodes
well for the expansion of the crop. Significantly, more work is required to take
advantage of the nutritive health benefits as well as continuing the risk management
aspects of food safety such as mycotoxins from organisms such as Fusarium species
which appear to attacking small-grain cereals on a world-wide basis.
284 M. Mergoum et al.
References
Ammar, K., Crossa, J. and Pfieffer, W.H. (2006). Developing a hybrid seed production system and
evaluation of heterosis in hybrids from CIMMYT’s spring triticale germplasm. In: Botes W.
(ed.). Proc. 6th Int. Triticale Symp. September 3–7, 2006. Stellenbosch, SA.
Ammar, K., Mergoum, M. and Rajaram, S. (2004). The history and evolution of triticale. In:
Mergoum, M. and Gomez-Macpherson H. (eds.). Triticale improvement and production. FAO
Plant Production and Protection Paper No. 179, pp 1–9.
Bakhshi, A.K., Bakhshi, R., Saxena, A.K. and Dhindsa, G.S. (1998). Suitability of amber colored
triticales in Indian ethnic food items. In: Juskiw P. (ed.). Proc. 4th Int. Triticale Symp. July 26–
31, 1998. Red Deer, AB, Canada. pp 92–101.
Barary, M., Warwick, N.W.M., Jessop, R.S. and Taji, A.M. (2002). Osmotic adjustment and
drought tolerance in Australian triticales. In: Arseniuk E. (ed.). Proc. 5th Int. Triticale Symp.
June 30–July 5, 2002, Radzikow, Poland. pp. 135–141.
Bernard, S. and Charmet, G. (1984). Diallel analysis of androgenetic plant production in hexaploid
triticale (X Triticosecale, Wittmack). Theor. Appl. Genet. 69, 55–61.
Boros, D. (2002). Physico-chemical quality indicators suitable in selection of triticale for high
nutritive value. In: E. Arseniuk, ed. Proc. 5th Int. Triticale Symp., June 30–July 5, 2002,
Radzikow, Poland, pp. 239–244.
Boros, D. (2006). Triticale of high end-use quality chance to increase its value on world cereal
markets. In: Botes W. (ed.). Proc. 6th Int. Triticale Symp. September 3–7, 2006. Stellenbosch,
SA.
Darvey, N.L., Zhao, X. and Trethowan, R. (2006). Isolated microspore culture in a cyclical
breeding system for the production of inbred lines and hybrids. In: Botes W. (ed.). Proc. 6th
Int. Triticale Symp. September 3–7, 2006. Stellenbosch, SA.
Eudes, F. (2006). Canadian triticale biorefinery initiative. In: Botes W. (ed.). Proc. 6th Int.
Triticale Symp. September 3–7. Stellenbosch, SA.
FAO. (2003). FAOSTAT, FAO statistical datab agriculture. Available at http://apps.fao.org.
Gonzalez, J.M. and Jouve, N. (2000). Improvement of anther culture media for haploid production
in triticale. Cereal Res. Commun. 28, 65–72.
Gonzalez, J.M. and Jouve, N. (2005). Microspore development during in vitro androgenesis in
triticale. Biologia Plantarum 49, 23–28.
Gonzalez, J.M., Hernandez, I. and Jouve, N. (1997). Analysis of anther culture response in
hexaploid triticale. Plant Breeding 116, 302–304.
Gursoy, U. and Yilmaz, A. (2002). Determination of energy values and digestibility characteristics
of triticale varieties. J. Anim. Sci. 80, 396.
Haesaert, G., Derycke, V., Latre, J. and Hermans, B. (2006). Evolution of disease pressure on
triticale under Belgian growing conditions: overview of the last 20 years. In: Botes W. (ed.).
Proc. 6th Int. Triticale Symp. September 3–7, 2006. Stellenbosch, SA.
Hede, A.R. (2000). A new approach to Triticale improvement. Available at http://www.cimmyt.
org.
Horlein, A. and Valentine, J. (1995). Triticale (X Triticosecale). In: Williams J.T. (ed). Cereals and
pseudocereals. Chapman and Hall, New York, NY. pp 187–221.
Lozano, A.J., Zamora, V.M., Diaz-Solis, H., Mergoum, M. and Pfeiffer, W.H. (1998). Triticale
forage production and nutritional value in the northern region of Mexico. In: Proc. 4th Int.
Triticale Symp.Vol. 2. Alberta Agric. Rural Dev. Ctr., Lacombe, AB, Canada. p. 259.
Kiss, A. (1974). Triticale breeding experiments in Eastern Europe. In: MacIntyre R. and Campbell
M. (eds.). Triticale: Proc. Int. Symp. 1973. International Development Research Centre, El
Batan, Mexico; Ottawa, Ont., Canada. pp. 41–50.
Koebner, R.M.D. and Martin, P.K. (1996). High levels of salt tolerance revealed in triticale. In: H.
Guides-Pinto et al., eds. Proc. 3rd Int. Triticale Symp., June 1994, Lisbon, Portugal, pp. 429–
436.
Triticale: A ‘‘New’’ Crop with Old Challenges 285
Kuleung, C., Baenziger, P.S. and Dweikat, I. (2004). Transferability of SSR markers among
wheat, rye, and triticale. Theor. Appl. Genet. 108, 1147–1150.
Mergoum, M., Pfeiffer, W.H., Pena, R.J., Ammar, K. and Rajaram, S. (2004). Triticale crop
improvement: the CIMMYT programme. In: Mergoum, M. and Gomez-Macpherson H. (eds.).
Triticale improvement and production. FAO Plant Production and Protection Paper No. 179.
Food and Agriculture Organization of United Nations, Rome. pp. 11–26.
Mergoum, M., Ryan, J. and Shroyer, J.P. (1992). Triticale in Morocco: potential for adoption in the
semi-arid cereal zone. J. Nat. Res. Life Sci. Edu. 21, 137–141.
Myer, R.O. (2002). Triticale grain in young pig diets. In: Proc. Fifth Internat’l Triticale Sympo-
sium. Vol. I. Plant Breeding and Acclimatization Inst., Radzikow, Poland. p 272.
Myer, R. and Lozano del Rio, A.J. (2004) Triticale as animal feed. In: Mergoum, M. and Gomez-
Macpherson H. (eds.). Triticale improvement and production. FAO Plant Production and
Protection Paper No. 179. Food and Agriculture Organization of United Nations, Rome. pp.
49–58.
Nadolska-Orczyk, A., Przetakiewicz, A., Kopera, K., Binka, A. and Orczyk, W. (2005). Efficient
method of Agrobacterium-mediated transformation for triticale (X Tritosecale Wittmack).
J. Plant Growth Regul. 24, 2–10.
Oettler, G. (2005). The fortune of a botanical curiosity-Triticale: past, present and future. J. Agric.
Sci. 143, 329–346.
Oettler, G., Becker, H.C. and Hoppe, G. (2001) Heterosis for yield and other agronomic traits of
winter triticale F1 and F2 hybrids. Plant Breed. 120, 351–353.
Oettler, G., Burger, H. and Melchiner, A.E. (2003). Heterosis and combining ability for grain yield
and other agronomic traits in winter triticale. Plant Breed. 122, 318–321.
Osborne, L.D. and Rengel, Z. (2002) Screening cereals for genotypic variation in efficiency of
phosphorus uptake and utilization. Aust. J. Agric. Res. 53, 295–303.
Pena, R.J. (2004). Food uses of triticale. In: Mergoum, M. and Gomez-Macpherson H. (eds.).
Triticale improvement and production. FAO Plant Production and Protection Paper No. 179.
Food and Agriculture Organization of United Nations, Rome. pp. 37–48.
Pena, R.J. and Amaya, A. (1992). Milling and bread making properties of wheat-triticale grain
blends. J. Sci. Food Agric. 60, 483–487.
Pfeiffer, W.H. (1995). Triticale breeding at CIMMYT. In: Rajaram S. and Hettel G.P. (eds.).
Wheat breeding at CIMMYT: commemorating 50 years of research in Mexico for global wheat
improvement. Wheat Special Report No. 29, Mexico, DF, CIMMYT. pp. 87–95.
Pratap, A., Sethi, G.S. and Chaudhary, H.K. (2005). Relative efficiency of different gramineae
genera for haploid induction in triticale and triticale x wheat hybrids through the chromosome
elimination technique. Plant Breeding 124, 147–153.
Rimpau, W. (1891). Kreuzungsprodukte landwirthschaftlicher Kulturpflanzen. Landwirthschaftli-
cher Jahrbucher 20, 335–371.
Salmon, D.F., Mergoum, M. and Gomez Macpherson, H. (2004). In: Mergoum M. and Gomez-
Macpherson H. (eds.). Triticale production and management. FAO Plant Production and
Protection Paper No. 179. pp. 27–36.
Salmon, D.F., Temelli, F. and Spence, S. (2002). Chemical composition of western Canadian
triticale varieties. In: Arseniuk E. (ed.). Proc. 5th Int. Triticale Symp. June 30–July 5, 2002.
Radzikow, Poland. pp. 445–450.
Sanchez-Monge, E. (1974). Development of triticales in western Europe. In: MacIntyre R. and
Campbell M. (eds.). Triticale: Proc. Int. Symp. 1973. International Development Research
Centre, El Batan, Mexico; Ottawa, Ont., Canada. pp. 31–39.
Saxena, A.K., Bakhshi, A.K., Sehgal, K.L. and Sandha, G.S. (1992). Effect of grain texture on
various milling and end use properties of newly bred advanced triticales (wheat x rye) lines. J.
Food Sci. Tech. 29, 14–16.
Sayre, K., Pfeiffer, W.H. and Mergoum, M. (1996). Triticale: grain potential and response to input
management levels. In: Triticale Topics. Int. Ed. No. 14, pp. 9–16.
286 M. Mergoum et al.
Shebeski, L.H. (1974). Future Role of triticales in Agriculture. In: MacIntyre R. and Campbell M.
(eds.). Triticale: Proc. Int. Symp. 1973. International Development Research Centre, El Batan,
Mexico; Ottawa, Ont., Canada. pp. 247–250.
Singh, R.P. and Saari, E.E. (1991). Biotic stresses in triticale. In: Proc. 2nd Int. Triticale Symp.,
Passo Fundo, Rio Grande do Sul, Brazil, October 1–5, 1990. Mexico, DF, CIMMYT. pp. 171–
177.
Skovmand, B., Fox, P.N. and Villareal, R.L. (1984). Triticale in commercial agriculture: progress
and promise. Adv. Agron. 37, 1–45.
Varughese, G., Pfeiffer, W.H. and Pena, R.J. (1996). Triticale (Part 1): a successful alternative
crop. Cer. Foods World 41, 474–482.
Villegas, E., McDonald, C.E. and Gilles, K.A. 1970. Variability in Lysine content of wheat, rye
and triticale. Cer. Chem. 47, 746.
Wallwork, H. (1989). Screening for resistance to take-all in wheat, triticale and wheat-triticale
hybrid lines. Euphytica 40, 103–110.
Warzecha, R. and Salak-Warzecha, K. (2006). Progress in CMS development for hybrid triticale.
In: Botes W. (ed.). Proc. 6th Int. Triticale Symp., September 3–7, 2006. Stellenbosch, SA.
Wilson, A.S. (1875). Wheat and rye hybrids. In: Transactions and Proceedings of the Botanical
Society, Edinburgh 12, 286–288.
Xue-Feng, M., Rodrigues, M., Milla, A. and Gustafson, J.P. (2002). AFLP-based genome studies
of triticale following polyploidization. In: Arseniuk E. (ed.). Proc. 5th Int. Triticale Symp. June
30–July 5, 2002. Radzikow, Poland. pp. 89–94.
Yong, W.S. (2001). Development of AFLP and STS markers for identifying wheat-rye transloca-
tions possessing 2RL. Euphytica 121, 279–287.
Zillinsky, F.J. and Borlaug, N. (1971). Progress in developing triticale as an economic crop.
CIMMYT Res. Bull. 17. Mexico, DF, CIMMYT. 27 pp.
Zimny, J., Becker, D., Brettschneider, R. and Lorz, H. (1995). Fertile, transgenic Triticale (XTriticosecale Wittmack). Molecular Breeding 1, 155–164.
Triticale: A ‘‘New’’ Crop with Old Challenges 287
Statistical Analyses of Genotype
by Environment Data
Ignacio Romagosa, Fred A. van Eeuwijk, and William T.B. Thomas
Abstract We introduce in this chapter a series of linear and bilinear models for the
study of genotype by environment interaction (GE) and adaptation. These models
increasingly incorporate available genetic, physiological, and environmental infor-
mation for modelling genotype by environment interaction (GE). They are based on
analyses of variance and regression and can be formulated in most standard
statistical packages. We use the data of a series of trials for 65 barley genotypes
(G) grown in 12 environments (E) for illustration and interpretation of the output of
such analyses. We aim at identifying key environmental covariables to explain
differential phenotypic responses as well as to estimate genotypic sensitivities to
these covariables. Using genetic covariables in the form of molecular markers, we
partition genotypic main effect terms and GE terms into main effects for quantita-
tive trait loci (QTL) and QTL by environment interaction (QTL.E). The QTL.E
estimates can be further regressed on environmental covariables to target differen-
tial QTL expression potentially related to environmental factors. We believe that
the statistical models that describe GE in direct association to genetic, physiologi-
cal, and environmental information provide insight in GE and facilitate the devel-
opment and deployment of new breeding strategies
1 Introduction
Despite recent advancements in molecular marker-assisted selection, applied cereal
breeding still relies largely on direct phenotypic selection of advanced genotypes.
Breeders focus in the first segregating generations on highly heritable traits, such as
height, spike morphology, phenology, to concentrate later on complex traits like
grain yield and end-use quality. A major objective in plant breeding programs is to
assess the suitability of advanced lines or potential cultivars for agricultural pur-
poses across a range of agro-ecological conditions. To this purpose breeders
I. Romagosa(*)
Centre UdL-IRTA, University of Lleida, Lleida, Spain. e-mail: [email protected]
M.J. Carena (ed.), Cereals,DOI: 10.1007/978-0-387-72297-9, # Springer Science + Business Media, LLC 2009 291
perform so-called Multi Environment Trials (METs). In METs, a set of genotypes is
evaluated in a series of trials that sample the target environmental range in order to
identify those that are partially or wholly adapted (specific and wide adaptation,
respectively). Data from METs are typically summarized in the form of genotype
by environment tables of means. Simple inspection of such tables of means will
often reveal the presence of genotype by environment interaction (GE), that is,
differences between genotypes that are trial dependent. GE weakens association
between phenotype and genotype, reducing genetic progress in breeding programs.
Most studies in which the magnitude of GE for cereal grain yield has been measured
have detected a large and statistically significant interaction; only studies
with limited genotypic and/or environmental diversity found negligible or non-
significant interaction. Therefore, identification of superior genotypes largely
depends on extensive METs, conducted over years at different locations. This
identification is hindered in the presence of GE Statistical models for MET data
need to contain facilities for describing GE.
Statistical analyses that detect and describe GE have been one of the most
extensively reviewed areas of applied statistics in breeding [for example in
Annicchiarico (2002); Cooper and Hammer (1996); Fox et al. (1997); Gauch
(1992); Kang (1990, 1998); Kang and Gauch (1996); Kempton and Fox (1997);
Romagosa and Fox (1993); van Eeuwijk (1996, 2006); van Eeuwijk et al. (1996,
2005, 2007); Voltas et al. (2002)]. Past studies were largely empirical, describing
postdictively genotypic performances across a sample of environments in the form of
two-way genotype-environment tables of means. Such statistical characterizations
of genotypic responses across environments, while frequently deployed by breeders,
do not provide any physiological insight into the basis of the response.
Recent efforts have searched for the genetic factors underlying GE in the form of
genetic covariables defined on the genotypes to describe GE patterns. Quantitative
trait loci (QTL) responsible for adaptation have been reported in several populations
for most crop species (see, e.g. Paterson, 1998). QTL related to adaptation show
different effects in different environments. Themagnitude of individual QTL effects
(expressed as the amount of GE variation explained by a particular QTL) varied
among populations. Some QTL underlying GE were coincident with QTL for the
genotypic main effect, that is, QTL with constant expression across environments,
within given populations, but the agreement between QTL locations across popula-
tions was low. Because QTL locations vary across environments and populations,
implementation of selection methodologies for such QTL in applied breeding
programs generally remains a challenge.
A landmark publication offering new perspectives on the integration of geneti-
cal, statistical, and physiological approaches to plant breeding is the book by
Cooper and Hammer (1996). Modern GE studies have introduced external environ-
mental, physiological, and/or genetic information to develop statistical models
whose parameters relate better to physiological knowledge (see Spiertz et al.,
2007), and therefore offer better possibilities for implementation of QTL selection
methodologies in breeding programs.
292 I. Romagosa et al.
Our approach in this chapter is practical; we introduce a series of statistical
models for the analysis of GE and adaptation that increasingly use additional
genetic, physiological, and environmental information for modelling GE. We be-
lieve that the more advanced statistical models that describe GE in direct relation to
genetic, physiological, and environmental information provide more insight in GE
and facilitate the development of appropriate breeding strategies. We illustrate the
models via analyses of a barley data set. For didactical reasons, we take a somewhat
simplified approach by avoiding more elaborate, and in the end more powerful
mixed model methodology for understanding GE as described in Verbyla et al.
(2003),Malosetti et al. (2004), Piepho (1997, 2000), Piepho and Pillen (2004), Smith
et al. (1999, 2005), and Boer et al. (2007). We will focus on analysis of variance and
regression types of models, because the basics of our approach are best illustrated in
this slightly simplified context. After mastering the material described in this
chapter, interested readers should consult the mixed model papers noted above.
We use a real worked example based on a subset of a large barley trial which
formed part of a European Union international cooperation project called ‘Mapping
Adaptation of Barley to Droughted Environments’ (EU FP5 INCO-MED
ICA3-CT2002-10026). In this project, a population of 192 genotypes, composed
of landraces, older, and contemporary cultivars sampling key regions around the
Mediterranean basin and the rest of Europe, was grown in 28 environments with
varying degrees of stress from which a series of papers are now being prepared
(Comadran et al., 2008; Pswarayi et al., 2008). For the purposes of this chapter, we
will restrict our analysis to grain yield to just the 65 modern cultivars grown in the
less stress prevalent sites. Again, the purpose is to facilitate comprehension of the
statistical methods described and the interpretation of key parameters, rather than
produce a comprehensive and integrated analysis of the physiological and genetic
bases of adaptation in this species.
All data files as well as the GenStat 9.1 (Payne et al., 2006) codes for generating
the results discussed below are available from the authors.
2 An Example Data Set: Grain Yield of 65 Modern Barley
Cultivars Grown in 12 Mediterranean Environments
Barley (Hordeum vulgare L.) (see Chap. 7 in this book and Slafer et al., 2002) is thefourth most widely grown cereal crop after wheat, rice, and maize. More than any of
these three crops, it is well adapted over a large range of growing environments
being sown from the most fertile areas to the poorest marginal environments.
Barley is a highly self-pollinated diploid species (2n = 2x = 14) that has been
proposed as a model species for other cereal crops. It shows a high degree of natural
and easily inducible variation. The chromosomes are large (6–8 mm) as is the
genome (5 � 109 bp DNA, @1,200 cM) with a physical/genetic distance ratio of
between 0.1 and 300 Mb/cM (Kleinhofs and Han, 2002). In this chapter, we will
carry out analyses on a subset of a large cultivar trial carried out in the Mediterra-
Statistical Analyses of Genotype by Environment Data 293
nean basin. In particular, yields for 65 modern cultivars (released after 1990) were
used for this study. Thirty-one of these cultivars were releases from North Mediter-
ranean countries, 14 from other European countries, 9 from South Mediterranean,
9 from Turkey, and the last 2 from Jordan. The genotypes were multiplied at the
ICARDA field site in Tel Hadya, Syria, for harvest year 2003 to produce sufficient
seed for trialling in the subsequent two years. Grain yields from 12 of the original
28 sites different sites (Table 1) selected for moderate levels of abiotic stress are
used in this study.
2.1 Genotyping
Each of the 65 cultivars was genotyped with a stratified set of 50 polymorphic
genomic and EST-derived Simple Sequence Repeat (SSR) molecular markers that
gave good coverage, 6–8 per chromosome, of the barley genome (Russell et al.,
2004). These markers provided a coarse genome-wide survey of the genetic diver-
sity represented in the 65 modern cultivars. To increase genomic coverage further,
Diverse Arrays Technology (DArT1, www.diversityarrays.com) was used as a
high throughput assay that had already been successfully used to map over 1,000
markers in barley (Wenzl et al., 2006). DArT1 analysis produced 1,130 biallellic
markers with corresponding PIC values ranging from 0.061 to 0.500 with an
average diversity value of 0.387. Fifty-six alleles were present in less than 10%
of the 65 modern cultivars and 10 were particularly rare as they only appeared in
less than 5% of the cultivars. Out of the 1,130 markers, 811 markers were located on
the DArT consensus map. Overall map coverage was good (Fig. 1), but there was
a notable lack of markers on chromosome 4H with gaps greater than 20 cM.
Nevertheless, the DArT1 platform provided a rapid and cost-effective means of
generating sufficient markers for a reasonably dense genome-wide scan of marker
trait associations.
As the SSR markers were sufficient in number to cover the barley genome and
they were not closely linked, they were used to identify underlying population
substructure among the cultivars. The program Structure (Pritchard et al., 2000;
Falush et al., 2003, 2007) uses genotype data consisting of unlinked markers to
implement a model-based clustering method for inferring and identifying distinct
genetic populations and for assigning individuals to populations. Structure assumes
a model in which there are K populations (where K may be unknown), each of
which is characterized by a number of loci with population-specific distributions of
allele frequencies. Individuals in the sample are characterized with respect to the
identified genetic populations in terms of membership probabilities; the higher the
membership probability with regard to a particular population, the more likely it is
that the individual belongs to that population. The genetic populations are con-
structed such as to achieve Hardy-Weinberg and linkage equilibrium within the
identified populations. The program is freely available and well documented and
can be downloaded from http://pritch.bsd.uchicago.edu/software.
294 I. Romagosa et al.
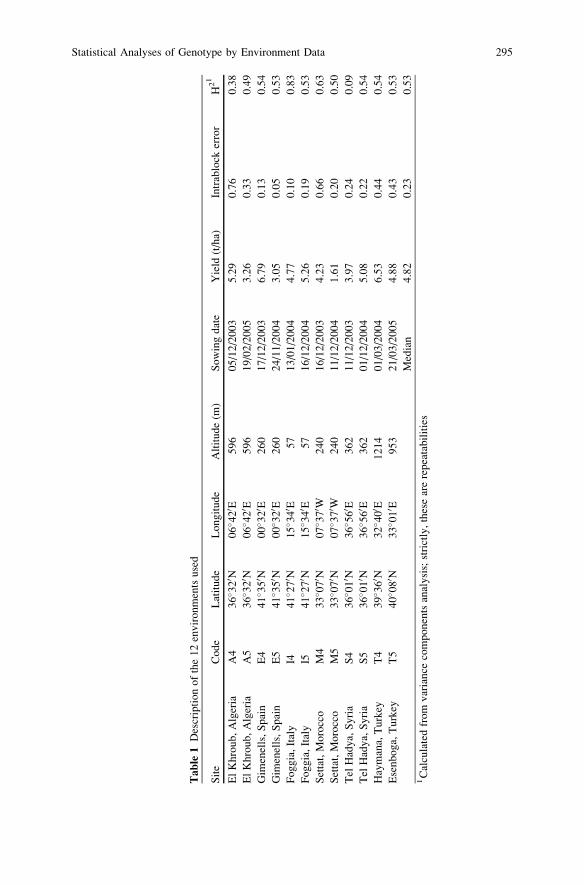
Table
1Descriptionofthe12environmentsused
Site
Code
Latitude
Longitude
Altitude(m
)Sowingdate
Yield
(t/ha)
Intrablock
error
H21
ElKhroub,Algeria
A4
36� 320 N
06� 420 E
596
05/12/2003
5.29
0.76
0.38
ElKhroub,Algeria
A5
36� 320 N
06� 420 E
596
19/02/2005
3.26
0.33
0.49
Gim
enells,Spain
E4
41� 350 N
00� 320 E
260
17/12/2003
6.79
0.13
0.54
Gim
enells,Spain
E5
41� 350 N
00� 320 E
260
24/11/2004
3.05
0.05
0.53
Foggia,Italy
I441� 270 N
15� 340 E
57
13/01/2004
4.77
0.10
0.83
Foggia,Italy
I541� 270 N
15� 340 E
57
16/12/2004
5.26
0.19
0.53
Settat,Morocco
M4
33� 070 N
07� 370 W
240
16/12/2003
4.23
0.66
0.63
Settat,Morocco
M5
33� 070 N
07� 370 W
240
11/12/2004
1.61
0.20
0.50
Tel
Hadya,Syria
S4
36� 010 N
36� 560 E
362
11/12/2003
3.97
0.24
0.09
Tel
Hadya,Syria
S5
36� 010 N
36� 560 E
362
01/12/2004
5.08
0.22
0.54
Haymana,Turkey
T4
39� 360 N
32� 400 E
1214
01/03/2004
6.53
0.44
0.54
Esenboga,Turkey
T5
40� 080 N
33� 010 E
953
21/03/2005
4.88
0.43
0.53
Median
4.82
0.23
0.53
1Calculatedfrom
variance
componentsanalysis;strictly,thesearerepeatabilities
Statistical Analyses of Genotype by Environment Data 295
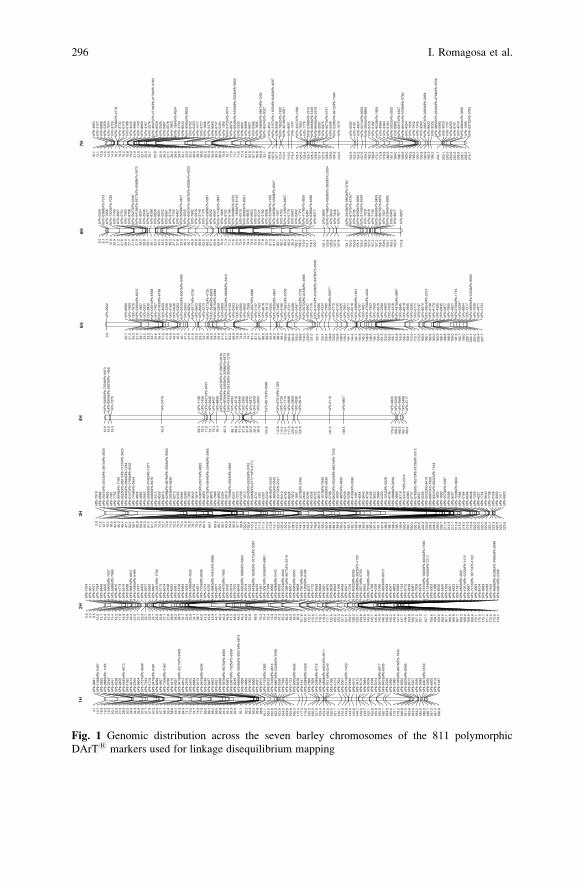
bPb-
9881
4.1
bPb-
1348
bPb-
0487
10.7
bPb-
3622
18.9
bPb-
0885
bPb-
1165
19.2
bPb-
3249
19.3
bPb-
6451
20.1
bPb-
6238
25.5
bPb-
0405
27.2
bPb-
6482
bPb-
9573
28.5
bPb-
1562
33.3
bPb-
9414
34.6
bPb-
2055
34.9
bPb-
9604
36.9
bPb-
7137
bPb-
9608
37.6
bPb-
7043
37.7
bPb-
1318
37.9
bPb-
0476
bPb-
0481
47.0
bPb-
8094
47.4
bPb-
4657
47.7
bPb-
7306
bPb-
2183
48.1
bPb-
9788
53.4
bPb-
4418
58.6
bPb-
9337
59.1
bPb-
9418
bPb-
3217
bPb-
6408
64.6
bPb-
4813
64.9
bPb-
2976
71.1
bPb-
5675
73.2
bPb-
8884
74.7
bPb-
2175
75.6
bPb-
0429
bPb-
8294
77.9
bPb-
5749
89.0
bPb-
9957
89.1
bPb-
6853
89.2
bPb-
4531
89.5
bPb-
0468
90.8
bPb-
9676
bPb-
9675
bPb-
4980
91.0
bPb-
5683
91.3
bPb-
2967
bPb-
7325
bPb-
6358
91.9
bPb-
0249
92.0
bPb-
8960
bPb-
3835
bPb-
9057
bPb-
2813
bPb-
7859
92.1
bPb-
4662
92.2
bPb-
1922
93.4
bPb-
9360
95.5
bPb-
9767
95.6
bPb-
0910
98.8
bPb-
1193
bPb-
3382
101.
1bP
b-61
3310
2.5
bPb-
7435
bPb-
4614
102.
8bP
b-88
97bP
b-53
34bP
b-45
9010
2.9
bPb-
5290
103.
8bP
b-71
8610
4.0
bPb-
4949
104.
6bP
b-17
2310
5.8
bPb-
9005
bPb-
9032
106.
3bP
b-61
5811
5.4
bPb-
1541
117.
3bP
b-33
89bP
b-53
3911
9.8
bPb-
7899
125.
3bP
b-76
0912
6.5
bPb-
3089
bPb-
9116
127.
0bP
b-79
4912
9.4
bPb-
4898
bPb-
6901
bPb-
6911
129.
6bP
b-91
21bP
b-52
4913
0.2
bPb-
1366
130.
5bP
b-12
1313
1.1
bPb-
7524
140.
1bP
b-20
0714
2.3
bPb-
1419
bPb-
7429
143.
6bP
b-91
8014
4.0
bPb-
4515
145.
8bP
b-34
7314
8.7
bPb-
6770
149.
5bP
b-39
8414
9.7
bPb-
9108
152.
1bP
b-51
9815
5.8
bPb-
5014
155.
9bP
b-06
19bP
b-06
1716
0.0
bPb-
8453
bPb-
8935
160.
1bP
b-22
4016
4.0
bPb-
2565
165.
2bP
b-18
8217
9.1
bPb-
1940
bPb-
8676
bPb-
1942
179.
2bP
b-95
5218
0.8
bPb-
6200
bPb-
6065
181.
0bP
b-81
1218
3.6
bPb-
5201
183.
9bP
b-03
9518
4.2
bPb-
0589
185.
0bP
b-83
07bP
b-55
5018
6.0
bPb-
2260
186.
7bP
b-65
0218
7.3
bPb-
3116
187.
4bP
b-14
8718
8.8
1HbP
b-70
240.
6bP
b-36
113.
3bP
b-97
579.
5bP
b-73
5412
.0bP
b-68
4812
.1bP
b-02
0512
.9bP
b-59
00bP
b-75
5715
.3bP
b-56
88bP
b-79
6915
.4bP
b-06
1516
.2bP
b-47
7417
.8bP
b-55
1918
.9bP
b-51
8819
.6bP
b-96
81bP
b-68
4720
.3bP
b-42
85bP
b-54
8921
.0bP
b-51
9121
.1bP
b-00
0323
.3bP
b-09
7723
.7bP
b-59
5023
.9bP
b-68
9724
.7bP
b-44
81bP
b-17
0825
.0bP
b-07
1525
.8bP
b-83
7427
.1bP
b-21
0827
.8bP
b-82
9228
.0bP
b-59
9128
.2bP
b-61
2828
.3bP
b-69
6331
.7bP
b-30
5032
.6bP
b-10
98bP
b-45
2333
.6bP
b-87
5034
.1bP
b-48
2138
.7bP
b-72
29bP
b-80
3840
.0bP
b-12
1241
.3bP
b-67
5542
.8bP
b-96
82bP
b-42
61bP
b-96
8643
.9bP
b-48
7744
.7bP
b-25
0146
.2bP
b-48
75bP
b-79
0646
.3bP
b-31
9046
.8bP
b-35
7447
.5bP
b-79
7548
.0bP
b-84
4948
.2bP
b-06
53bP
b-16
64bP
b-69
9248
.3bP
b-35
1949
.0bP
b-22
3061
.8bP
b-64
38bP
b-16
28bP
b-10
72bP
b-50
87bP
b-69
7069
.5
bPb-
1847
70.3
bPb-
3067
bPb-
3056
bPb-
6881
70.4
bPb-
7039
73.4
bPb-
9992
74.9
bPb-
6088
bPb-
5440
78.3
bPb-
8100
81.3
bPb-
9754
bPb-
4040
81.4
bPb-
3681
bPb-
3677
bPb-
2219
82.0
bPb-
6207
83.2
bPb-
6063
bPb-
6055
94.5
bPb-
0858
95.3
bPb-
7991
bPb-
3563
101.
6bP
b-19
26bP
b-61
9410
2.4
bPb-
8737
112.
2bP
b-17
7211
2.4
bPb-
8260
112.
7bP
b-09
9411
6.3
bPb-
2481
116.
9bP
b-38
7011
7.1
bPb-
9258
122.
4bP
b-89
4912
5.2
bPb-
1266
125.
3bP
b-94
5812
7.2
bPb-
0541
127.
5bP
b-71
2413
4.2
bPb-
8302
bPb-
8306
138.
3bP
b-38
58bP
b-39
25bP
b-11
0313
9.7
bPb-
2971
bPb-
5755
139.
8bP
b-59
4214
2.8
bPb-
7816
bPb-
4997
143.
9bP
b-47
6814
5.7
bPb-
4228
145.
8bP
b-10
6614
5.9
bPb-
0659
bPb-
8010
146.
0bP
b-40
9414
6.2
bPb-
6047
146.
3bP
b-98
0314
6.4
bPb-
0326
147.
0bP
b-11
5414
7.7
bPb-
0775
148.
7bP
b-91
9915
4.9
bPb-
6087
156.
3bP
b-72
0815
7.2
bPb-
5619
157.
3bP
b-18
15bP
b-18
20bP
b-82
04bP
b-15
66bP
b-11
84bP
b-40
92bP
b-72
1115
7.7
bPb-
0303
158.
6bP
b-19
8615
8.7
bPb-
8530
159.
0bP
b-54
6016
0.4
bPb-
1593
161.
1bP
b-03
0116
6.5
bPb-
6222
166.
9bP
b-11
8116
7.7
bPb-
4602
bPb-
4601
168.
3bP
b-10
51bP
b-42
32bP
b-14
1516
8.4
bPb-
9587
168.
9bP
b-72
12bP
b-16
11bP
b-31
0216
9.4
bPb-
3993
170.
1bP
b-87
3417
0.5
bPb-
0689
170.
7bP
b-40
9317
1.4
bPb-
7455
172.
0bP
b-86
98bP
b-62
96bP
b-10
85bP
b-60
4817
2.6
bPb-
4691
bPb-
2408
174.
7
2H
bPb-
7918
0.0
bPb-
6884
11.5
bPb-
2561
bPb-
2553
bPb-
3815
bPb-
3824
12.7
bPb-
4895
13.4
bPb-
7481
18.5
bPb-
7705
44.6
bPb-
9945
bPb-
1799
46.3
bPb-
0650
bPb-
2891
bPb-
1137
bPb-
3025
46.4
bPb-
9583
bPb-
3689
bPb-
1264
47.1
bPb-
6127
bPb-
7199
bPb-
9402
52.1
bPb-
7448
bPb-
0654
56.1
bPb-
4824
58.9
bPb-
3865
59.0
bPb-
0663
59.3
bPb-
3565
bPb-
9745
bPb-
1077
61.4
bPb-
6990
bPb-
6978
61.7
bPb-
2415
72.5
bPb-
4259
72.6
bPb-
8913
72.7
bPb-
6298
bPb-
6878
bPb-
3569
bPb-
9903
73.0
bPb-
2929
bPb-
2838
74.3
bPb-
9213
75.2
bPb-
0433
75.3
bPb-
6664
75.4
bPb-
5289
75.9
bPb-
7350
76.0
bPb-
3642
78.7
bPb-
1814
79.2
bPb-
5487
bPb-
0527
bPb-
6825
79.3
bPb-
4859
82.3
bPb-
6275
bPb-
6944
bPb-
2548
bPb-
2965
bPb-
9878
89.1
bPb-
7989
89.9
bPb-
4660
90.7
bPb-
2324
92.1
bPb-
2910
93.0
bPb-
7938
bPb-
2993
bPb-
5892
93.2
bPb-
6347
96.6
bPb-
7273
97.7
bPb-
0158
99.6
bPb-
1012
100.
5bP
b-20
40bP
b-63
29bP
b-07
4210
2.6
bPb-
0068
bPb-
6777
**bP
b-67
7111
0.3
bPb-
4747
111.
0bP
b-13
0111
1.2
bPb-
5351
111.
5bP
b-24
4011
2.2
bPb-
4645
bPb-
2433
112.
8bP
b-38
05bP
b-00
4011
6.7
bPb-
3317
bPb-
9131
125.
2bP
b-84
1012
5.4
bPb-
6765
130.
0bP
b-80
2413
1.6
bPb-
7872
134.
5bP
b-16
8114
3.5
bPb-
3278
bPb-
2406
144.
2bP
b-26
3014
4.3
bPb-
5295
146.
2bP
b-93
3614
6.4
bPb-
6722
148.
8bP
b-46
1615
2.5
bPb-
1579
bPb-
7695
158.
2bP
b-42
09bP
b-36
3016
0.9
bPb-
5796
184.
5bP
b-86
37bP
b-25
50bP
b-86
21bP
b-72
4518
4.6
bPb-
1609
189.
9bP
b-48
37bP
b-48
3019
0.5
bPb-
6249
191.
9bP
b-52
9819
3.1
bPb-
4156
bPb-
5396
193.
7bP
b-14
8119
3.9
bPb-
4564
194.
1bP
b-38
4319
5.0
bPb-
4739
195.
1bP
b-31
0919
5.2
bPb-
3623
197.
4bP
b-76
8919
7.7
bPb-
2420
197.
9bP
b-12
53bP
b-62
2819
8.0
bPb-
4748
198.
1bP
b-28
88bP
b-95
9919
8.4
bPb-
3899
198.
7bP
b-91
1819
9.9
bPb-
5379
**bP
b-53
7420
0.0
bPb-
6383
200.
1bP
b-27
3720
0.2
bPb-
0789
bPb-
7827
bPb-
5129
bPb-
5312
200.
3bP
b-85
5720
0.5
bPb-
0200
202.
3bP
b-00
32bP
b-84
1920
3.8
bPb-
8907
bPb-
1928
204.
5bP
b-83
41bP
b-83
22bP
b-71
6420
4.6
bPb-
1822
209.
5bP
b-18
9320
9.7
bPb-
5570
bPb-
4387
211.
0bP
b-25
8621
2.3
bPb-
9207
213.
1bP
b-72
38bP
b-58
6421
3.4
bPb-
7684
213.
5bP
b-01
6421
4.5
bPb-
8504
215.
0bP
b-08
4821
8.4
bPb-
7256
220.
0bP
b-62
2122
0.3
bPb-
7724
220.
7bP
b-96
4022
0.8
bPb-
7738
222.
4bP
b-01
3622
2.5
bPb-
3933
222.
6bP
b-14
1122
3.1
bPb-
9923
223.
6
3H
bPb-
9406
bPb-
7534
bPb-
9413
12.6
bPb-
8569
bPb-
2837
bPb-
1469
15.0
bPb-
7275
15.5
bPb-
2476
45.0
bPb-
1148
69.5
bPb-
7436
70.5
bPb-
6427
bPb-
6437
71.0
bPb-
6640
73.1
bPb-
8437
73.2
bPb-
8896
76.4
bPb-
4183
bPb-
2427
bPb-
0130
bPb-
0516
bPb-
9039
bPb-
0365
bPb-
3268
bPb-
6973
bPb-
4333
bPb-
0513
bPb-
3045
bPb-
1278
82.3
bPb-
9504
86.1
bPb-
4216
89.8
bPb-
6949
91.5
bPb-
2305
91.6
bPb-
4290
91.8
bPb-
6872
92.0
bPb-
6259
92.2
bPb-
3684
96.6
bPb-
8013
bPb-
0098
104.
8
bPb-
8701
bPb-
1329
112.
8bP
b-37
3911
4.2
bPb-
7719
115.
1bP
b-99
9811
7.0
bPb-
3809
120.
8bP
b-50
9012
1.5
bPb-
0610
122.
9
bPb-
6110
141.
5
bPb-
9867
149.
4
bPb-
9820
179.
6bP
b-52
6518
0.2
bPb-
9668
180.
5bP
b-34
6818
2.1
bPb-
3717
183.
4
4H
bPb-
9562
0.9
bPb-
8580
20.7
bPb-
1909
21.2
bPb-
7676
25.3
bPb-
2460
bPb-
8072
31.0
bPb-
1807
33.1
bPb-
0091
33.2
bPb-
3830
33.3
bPb-
0351
bPb-
6568
33.7
bPb-
7407
34.6
bPb-
6183
bPb-
6186
36.4
bPb-
8259
41.6
bPb-
2266
41.8
bPb-
5166
42.6
bPb-
0536
43.5
bPb-
6363
45.0
bPb-
0050
bPb-
6067
bPb-
6495
46.1
bPb-
5504
47.3
bPb-
9632
47.6
bPb-
9317
bPb-
2795
51.9
bPb-
6603
53.0
bPb-
8589
53.5
bPb-
2273
53.7
bPb-
4273
bPb-
4135
58.0
bPb-
1046
bPb-
8929
59.0
bPb-
8675
bPb-
0949
59.4
bPb-
5369
59.9
bPb-
0909
61.6
bPb-
3792
bPb-
0899
bPb-
3412
61.7
bPb-
9163
64.2
bPb-
0503
68.9
bPb-
7627
73.9
bPb-
6260
74.0
bPb-
3852
74.5
bPb-
7289
74.7
bPb-
4067
bPb-
0686
87.4
bPb-
2147
87.5
bPb-
7763
87.7
bPb-
9618
88.0
bPb-
1813
89.0
bPb-
0325
94.9
bPb-
2835
bPb-
4891
98.5
bPb-
1485
98.6
bPb-
9186
99.4
bPb-
7561
bPb-
0709
100.
6bP
b-47
2110
4.6
bPb-
6288
104.
8bP
b-24
9710
5.0
bPb-
5532
bPb-
7120
108.
8bP
b-35
72bP
b-20
13bP
b-39
8511
9.3
bPb-
6967
120.
6bP
b-71
7012
1.0
bPb-
8101
bPb-
2425
bPb-
9476
bPb-
4698
bPb-
9486
122.
1
bPb-
4334
123.
1bP
b-73
9512
6.4
bPb-
5596
bPb-
5597
**12
8.8
bPb-
0710
133.
6bP
b-61
3513
5.8
bPb-
2325
138.
9bP
b-78
5413
9.3
bPb-
0071
144.
1bP
b-95
1814
4.4
bPb-
4988
bPb-
1831
144.
7bP
b-07
9714
4.8
bPb-
1661
145.
3bP
b-47
58bP
b-44
9414
6.8
bPb-
7953
146.
9bP
b-75
6914
9.1
bPb-
6578
150.
5bP
b-25
8015
1.3
bPb-
2960
153.
5bP
b-14
2015
5.5
bPb-
4318
155.
7bP
b-49
70bP
b-38
8715
5.8
bPb-
5845
155.
9bP
b-83
1915
6.4
bPb-
3945
159.
1bP
b-35
9017
2.0
bPb-
0171
173.
1bP
b-91
4717
5.2
bPb-
8070
180.
5bP
b-58
54bP
b-23
1418
0.7
bPb-
3138
182.
6bP
b-61
7918
3.2
bPb-
4595
183.
9bP
b-08
3518
8.1
bPb-
0877
188.
8bP
b-19
6518
8.9
bPb-
4621
189.
0bP
b-07
99bP
b-17
1919
1.3
bPb-
3309
**19
2.7
bPb-
8854
199.
0bP
b-12
1720
0.7
bPb-
4809
bPb-
5333
bPb-
9660
202.
1bP
b-70
0820
4.0
bPb-
4971
206.
4bP
b-47
3320
7.7
5H
bPb-
0359
5.5
bPb-
0386
bPb-
7313
6.1
bPb-
7068
6.7
bPb-
7323
bPb-
7030
12.9
bPb-
7193
20.9
bPb-
3807
21.2
bPb-
2751
21.6
bPb-
7362
26.0
bPb-
8708
27.7
bPb-
5027
bPb-
4246
27.8
bPb-
6419
bPb-
2677
bPb-
6069
bPb-
2672
27.9
bPb-
3554
28.2
bPb-
2930
28.8
bPb-
8477
29.1
bPb-
8398
30.1
bPb-
6659
33.4
bPb-
9651
33.5
bPb-
5252
33.6
bPb-
6661
34.9
bPb-
9749
36.3
bPb-
7755
37.2
bPb-
6457
37.8
bPb-
2058
bPb-
3427
39.9
bPb-
4555
46.3
bPb-
0597
bPb-
3927
bPb-
6002
bPb-
6023
46.7
bPb-
7492
46.9
bPb-
5910
52.8
bPb-
3746
56.8
bPb-
7179
63.6
bPb-
5389
bPb-
5381
66.2
bPb-
2592
67.0
bPb-
6567
69.8
bPb-
9114
bPb-
3487
69.9
bPb-
1666
70.0
bPb-
9702
71.3
bPb-
5196
71.5
bPb-
5698
bPb-
3722
71.6
bPb-
1466
bPb-
6142
72.5
bPb-
0019
73.8
bPb-
9082
bPb-
9051
74.3
bPb-
9835
74.4
bPb-
5822
74.9
bPb-
5270
75.0
bPb-
6721
76.8
bPb-
4783
77.8
bPb-
3068
78.2
bPb-
3230
bPb-
1256
81.3
bPb-
4409
bPb-
4369
bPb-
8347
81.5
bPb-
1657
82.1
bPb-
4753
82.2
bPb-
4125
bPb-
6607
89.2
bPb-
5778
90.2
bPb-
5903
90.3
bPb-
0432
100.
1bP
b-17
2410
6.3
bPb-
4178
bPb-
0606
110.
9bP
b-04
5111
1.1
bPb-
6385
bPb-
6386
118.
1bP
b-83
7112
0.7
bPb-
3895
131.
1bP
b-57
48bP
b-42
69bP
b-38
33bP
b-20
5413
3.8
bPb-
3643
135.
8bP
b-74
4613
7.6
bPb-
7877
137.
8
bPb-
2940
bPb-
2863
bPb-
3760
151.
7bP
b-67
27bP
b-67
35**
152.
5bP
b-87
3515
3.6
bPb-
9292
bPb-
9285
155.
1bP
b-31
44bP
b-93
4915
5.3
bPb-
1029
156.
9bP
b-39
1915
7.0
bPb-
7146
157.
2bP
b-98
90bP
b-04
0315
7.3
bPb-
6875
bPb-
6876
158.
7bP
b-16
2115
9.6
bPb-
2304
bPb-
8382
159.
7bP
b-04
4316
0.2
bPb-
9817
162.
9
bPb-
0857
174.
8
6H
bPb-
4064
10.1
bPb-
3127
13.1
bPb-
6868
13.9
bPb-
5259
14.5
bPb-
7004
14.6
bPb-
9729
14.9
bPb-
7038
bPb-
2718
16.2
bPb-
3732
16.3
bPb-
6170
16.5
bPb-
0108
16.8
bPb-
4445
19.9
bPb-
9986
21.9
bPb-
1140
22.0
bPb-
8809
22.1
bPb-
4167
22.9
bPb-
2076
25.7
bPb-
4097
bPb-
3718
bPb-
0179
bPb-
9783
bPb-
6029
25.8
bPb-
2595
25.9
bPb-
5897
26.3
bPb-
0578
27.1
bPb-
7863
28.2
bPb-
1994
bPb-
4634
28.6
bPb-
3733
29.0
bPb-
8043
32.1
bPb-
9585
bPb-
8639
33.0
bPb-
6752
33.2
bPb-
6453
38.0
bPb-
7417
38.3
bPb-
3727
38.8
bPb-
1806
55.2
bPb-
2478
55.4
bPb-
8660
56.9
bPb-
6747
59.3
bPb-
5494
66.9
bPb-
1360
70.6
bPb-
5172
bPb-
5074
70.7
bPb-
0678
71.0
bPb-
8939
bPb-
6156
bPb-
0324
bPb-
5852
71.1
bPb-
2533
71.6
bPb-
9601
72.4
bPb-
9898
81.8
bPb-
6821
82.8
bPb-
0366
87.0
bPb-
7835
89.8
bPb-
2866
bPb-
2867
bPb-
1209
89.9
bPb-
8524
bPb-
0037
93.1
bPb-
4541
104.
8bP
b-31
57bP
b-11
05bP
b-84
60bP
b-45
9710
7.6
bPb-
8568
107.
7bP
b-79
52bP
b-19
5211
0.4
bPb-
4219
bPb-
3561
110.
5bP
b-80
5111
5.0
bPb-
1447
116.
4bP
b-32
27bP
b-15
9612
5.4
bPb-
7603
125.
5bP
b-17
7012
5.6
bPb-
2188
bPb-
7915
125.
7bP
b-89
56bP
b-51
2612
6.4
bPb-
8690
bPb-
2379
126.
8bP
b-20
9712
7.4
bPb-
6975
127.
5bP
b-80
74bP
b-57
4712
8.3
bPb-
5599
129.
6bP
b-52
96bP
b-99
12bP
b-73
9913
4.9
bPb-
1079
143.
5
bPb-
0202
152.
9bP
b-41
9115
3.3
bPb-
4924
154.
3bP
b-62
14bP
b-06
3915
7.5
bPb-
2855
bPb-
8860
159.
2bP
b-04
1916
5.3
bPb-
0182
166.
6bP
b-85
39bP
b-16
6917
0.1
bPb-
4389
172.
8bP
b-34
8417
8.9
bPb-
9104
180.
3bP
b-59
23bP
b-59
3518
7.4
bPb-
0889
188.
0bP
b-09
17bP
b-61
6718
8.1
bPb-
8644
bPb-
0758
bPb-
0760
188.
6bP
b-43
9418
9.0
bPb-
1556
189.
2bP
b-76
4218
9.3
bPb-
7345
190.
7bP
b-95
6319
3.8
bPb-
2897
bPb-
2693
bPb-
2854
194.
9bP
b-88
3319
5.3
bPb-
3226
196.
2bP
b-98
65bP
b-26
20bP
b-97
04bP
b-55
56bP
b-09
9520
2.7
bPb-
3020
203.
1bP
b-17
3720
3.3
bPb-
0259
203.
9bP
b-67
0120
4.5
bPb-
4419
205.
8bP
b-98
84bP
b-35
6620
8.1
bPb-
1690
208.
2bP
b-03
75bP
b-07
8321
6.1
7H
Fig. 1 Genomic distribution across the seven barley chromosomes of the 811 polymorphic
DArT1 markers used for linkage disequilibrium mapping
296 I. Romagosa et al.
On the basis of Structure, four groups were identified (Fig. 2) which made
geographical and physiological sense. Key factors distinguishing groups were
their winter versus spring habit, phenotypically determined by late spring sowing
in Northern Europe, and whether they were two- versus six-row ear type. The four
groups consisted of (a) eight of the nine Turkish cultivars (Tk); (b) twenty-four
North Mediterranean two- and other six-row types, which included three genotypes
from Spain and North Africa (NMW) and were mainly winter habit; (c) twelve
spring cultivars, mainly six-row types from the South and West Mediterranean,
including the only two genotypes from Jordan (SW); and (d) twenty-one North
Mediterranean two-row spring types (NMS).
2.2 Phenotyping
The original 192 genotypes from which our 65 form a subset were multiplied at
the ICARDA field site in Tel Hadya, Syria, for harvest year 2003 to produce
sufficient seed for trials in subsequent years. This common seed source was used
for sowing trials across the Mediterranean region to estimate yield in a wide range
of environments (Table 1).
The experimental designs for individual trials consisted of, first, an unreplicated
trial for the 192 entries, augmented by four repeated checks that were included in a
diagonal fashion. Second, as a special feature, a partial replicate, built up in a similar
way as the initial full replicate, was added, containing a quarter of the entries tomake
300 trial plots. The whole trial was sown in a rectangular grid of 15 rows and 20
columns at each site but with a different randomization and composition of the
partial replication. Three of the four repeated checks varied across sites, with one
being a specific landrace, and two others being an old and a modern cultivar that
were specific to the region in which the trial was being grown. The fourth check was
cv ‘Rihane’, which was grown at every site. The partial replication together with the
repeated checks served to estimate the experimental error and correct for any spatial
patterns for each trial. Trials were sown in plots of 6 m2 at each site and were grown
according to local practise for sowing rate and other inputs.
We conducted a two-step statistical analysis, where we first obtained by mixed
model analysis spatially corrected Best Linear Unbiased Predictors (BLUPs) for
grain yield of the genotypes in each trial. Second, we organized the genotypic
BLUPs in a two-way genotype by environment table of means, the analysis of
which will be the topic of this chapter. The mixed model analysis of the individual
trials is relevant and interesting and will be communicated elsewhere.
Repeatabilities for grain yield at each site varied between 0.09 and 0.83 in
Syria 2004 and Italy 2004, respectively, with a median value of 0.54, considered
relatively high for this trait. To assess the relative importance of the different terms
of the model, a rough estimate of the experimental error across trials was required.
We used the median of the average plot error divided by the average number of
replicates. Given that in the complete trials designs at each site there were 300 plots
and 192 entries, we approximated the number of replicates by 1.5. Thus, an intra
Statistical Analyses of Genotype by Environment Data 297
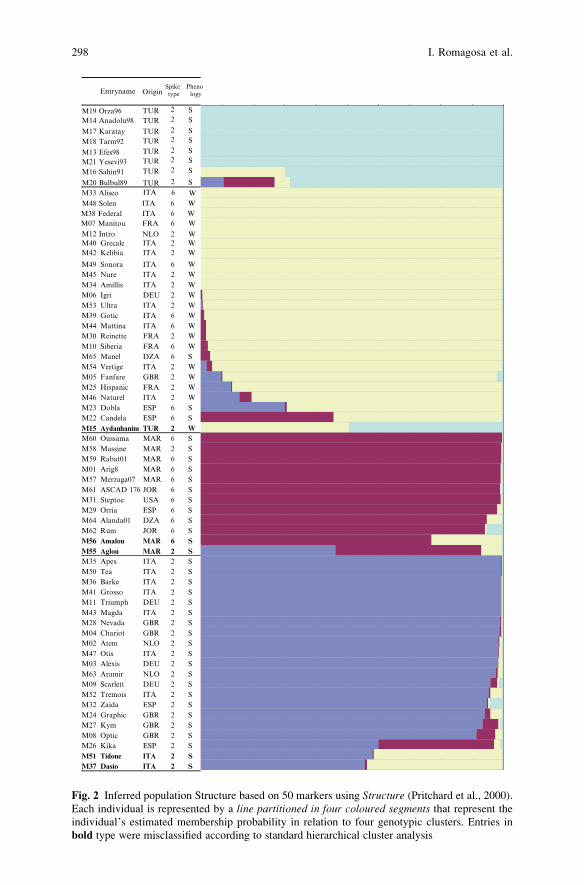
M15
EntrynameOriginSpike
type logy
M42KelibiaITA2W
M49SonoraITA6WM45NureITA2WM34AmillisITA2WM06IgriDEU2WM53UltraITA2WM39GoticITA6WM44MattinaITA6WM30ReinetteFRA2WM10SiberiaFRA6WM65ManelDZA6SM54VertigeITA2WM05FanfareGBR2WM25HispanicFRA2WM46NaturelITA2WM23DoblaESP6SM22CandelaESP6SM15 TUR2WM60OussamaMAR6SM58MassineMAR2SM59Rabat01MAR6SM01Arig8MAR6SM57Merzaga07MAR6SM61ASCAD 176JOR6SM31SteptoeUSA6SM29OrriaESP6SM64Alanda01DZA6SM62RumJOR2SM56AmalouMAR6SM55AglouMAR2SM35ApexITA2SM50TeaITA2SM36BarkeITA2SM41GrossoITA2SM11TriumphDEU2SM43MagdaITA2SM28NevadaGBR2SM04ChariotGBR2SM02AtemNLO2SM47OtisITA2SM03AlexisDEU2SM63AramirNLO2SM09ScarlettDEU2SM52TremoisITA2SM32ZaidaESP2SM24GraphicGBR2SM27KymGBR2SM08OpticGBR2SM26KikaESP2SM51TidoneITA2SM37DasioITA2S
Spike type
Pheno logy
M42 Kelibia ITA 2 WM40 Grecale ITA 2 W
M49 Sonora ITA 6 WM45 Nure ITA 2 WM34 Amillis ITA 2 WM06 Igri DEU 2 WM53 Ultra ITA 2 WM39 Gotic ITA 6 WM44 Mattina ITA 6 WM30 Reinette FRA 2 WM10 Siberia FRA 6 WM65 Manel DZA 6 SM54 Vertige ITA 2 WM05 Fanfare GBR 2 WM25 Hispanic FRA 2 WM46 Naturel ITA 2 WM23 Dobla ESP 6 SM22 Candela ESP 6 SM15 Aydanhanim TUR 2 WM60 Oussama MAR 6 SM58 Massine MAR 2 SM59 Rabat01 MAR 6 SM01 Arig8 MAR 6 SM57 Merzaga07 MAR 6 SM61 ASCAD 176 JOR 6 SM31 Steptoe USA 6 SM29 Orria ESP 6 SM64 Alanda01 DZA 6 SM62 Rum JOR 6 SM56 Amalou MAR 6 SM55 Aglou MAR 2 SM35 Apex ITA 2 SM50 Tea ITA 2 SM36 Barke ITA 2 SM41 Grosso ITA 2 SM11 Triumph DEU 2 SM43 Magda ITA 2 SM28 Nevada GBR 2 SM04 Chariot GBR 2 SM02 Atem NLO 2 SM47 Otis ITA 2 SM03 Alexis DEU 2 SM63 Aramir NLO 2 SM09 Scarlett DEU 2 SM52 Tremois ITA 2 SM32 Zaida ESP 2 SM24 Graphic GBR 2 SM27 Kym GBR 2 SM08 Optic GBR 2 SM26 Kika ESP 2 SM51 Tidone ITA 2 SM37 Dasio ITA 2 S
OriginEntryname
M19 Orza96 TUR S2
TUR S2
TUR S2
TUR S2
TUR S2
TUR S2
TUR S2
TUR S2
M14 Anadolu98
M17 KaratayM18 Tarm92
M13 Efes98M21 Yesevi93M16 Sahin91
M20 Bulbul89M33 AliseoM48 SolenM38 FederalM07 Manitou
ITA 6 WITAFRA
6 W6 W
NLO 2 W
ITA 6 W
M12 Intro
Fig. 2 Inferred population Structure based on 50 markers using Structure (Pritchard et al., 2000).
Each individual is represented by a line partitioned in four coloured segments that represent theindividual’s estimated membership probability in relation to four genotypic clusters. Entries in
bold type were misclassified according to standard hierarchical cluster analysis
298 I. Romagosa et al.
block error across trials value, derived from Table 1, equal to 0.23 is available for a
number of specific purposes below. The experimental error across environments did
not seem particularly homogeneous. However, for the sake of simplicity we will
ignore that complication.
2.3 Explicit Environmental Characterization
We recorded a series of meteorological variables at each site. They were maximum,
minimum, and average daily mean temperature, rainfall, reference evapotranspira-
tion (ET0), and radiation for three consecutive growth periods: tillering, jointing,
and grain filling. To characterize physically the environment, we then derived ten
different variables at each of the three phenological stages. They were number of
days with minimum temperature below 0� (dTb0); number of days with average
daily temperature below 4� (base temperature) (dTbb); number of days with
maximum temperature over 30� (dTo30); average maximum temperature (TMx);
average minimum temperature (TMn); difference between the maximum and the
minimum temperature (Tdif); total growing degree days (GDD); total rainfall plus
irrigation (mm) (WT); a measurement of the ratio between available water and
evapotranspirative demand, 100 � total water/ET0, (WDT); average photo thermal
quotient (PQ) defined as solar radiation divided by average daily temperature. The
above environmental characterizations were calculated separately for each of three
developmental stages: tillering (1), jointing (2), and grain filling (3).
As data for jointing and physiological maturity were not available for each trial,
we arbitrarily defined jointing as heading date minus three weeks and physiological
maturity as heading date plus two weeks. Thus, to reveal the meteorological
conditions during tillering we considered the period from sowing to heading
minus three weeks. We averaged daily variables for the three weeks before heading
to determine the meteorological variables during jointing. Finally, we averaged the
daily meteorological variables from heading to two weeks after heading to charac-
terize the grain-filling period.
Figure 3 shows a biplot that allows graphical exploration of relationships
between environments (squares), between meteorological variables (circles), and
of environments together with meteorological variables. The environments
(objects) and meteorological variables are positioned on the biplot according to
their scores from a principal components analysis, where the variables were stan-
dardized. The distances between environments correspond to the differences in
meteorological conditions. Similar environments are plotted together and different
ones are plotted further apart. The direction of a meteorological variable shows
how the value for that variable changes across the plot. Projecting environments
orthogonally on the variable representations allows a direct assessment of the
relative values for that variable for each of the environments. The origin represents
for each variable its average. Environments projecting above the origin (in the
direction of the arrow) were above average for that variable, environments project-
ing below the origin were below average. Such an interpretation requires that the
Statistical Analyses of Genotype by Environment Data 299
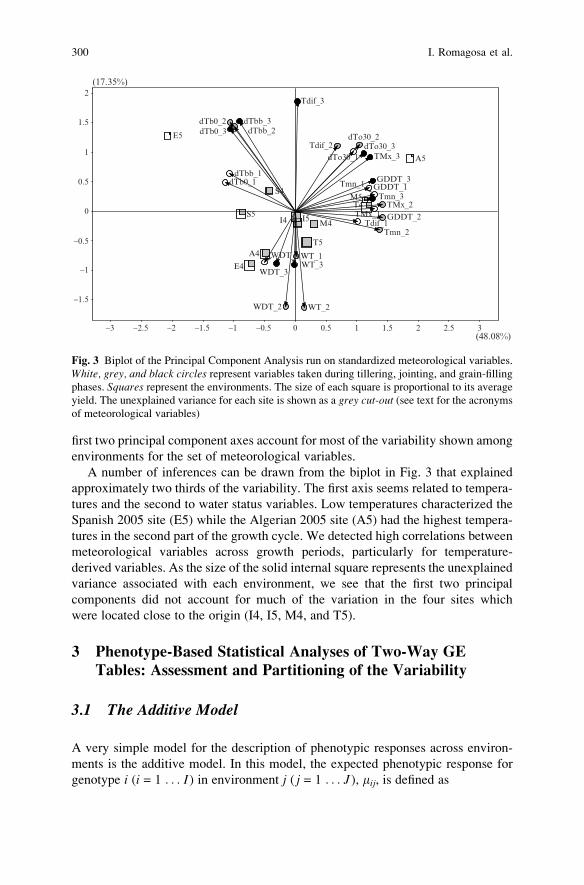
first two principal component axes account for most of the variability shown among
environments for the set of meteorological variables.
A number of inferences can be drawn from the biplot in Fig. 3 that explained
approximately two thirds of the variability. The first axis seems related to tempera-
tures and the second to water status variables. Low temperatures characterized the
Spanish 2005 site (E5) while the Algerian 2005 site (A5) had the highest tempera-
tures in the second part of the growth cycle. We detected high correlations between
meteorological variables across growth periods, particularly for temperature-
derived variables. As the size of the solid internal square represents the unexplained
variance associated with each environment, we see that the first two principal
components did not account for much of the variation in the four sites which
were located close to the origin (I4, I5, M4, and T5).
3 Phenotype-Based Statistical Analyses of Two-Way GE
Tables: Assessment and Partitioning of the Variability
3.1 The Additive Model
A very simple model for the description of phenotypic responses across environ-
ments is the additive model. In this model, the expected phenotypic response for
genotype i (i = 1 . . . I) in environment j ( j = 1 . . . J), mij, is defined as
-1.5
-3 -2.5 -2 -1.5 -1 -0.5 0 0.5 1 1.5 2 2.5 3
-1
-0.5
0
0.5
1
1.5
2
A4
A5
E4
E5
I4 I5M4
M5S4
S5T4
T5
dTb0_1
dTb0_2dTb0_3
dTbb_1
dTbb_2dTbb_3
dTo30_1
dTo30_2dTo30_3
TMx_1TMx_2
TMx_3
Tmn_1
Tmn_2
Tmn_3
Tdif_1
Tdif_2
Tdif_3
GDDT_1
GDDT_2
GDDT_3
WT_1
WT_2
WT_3WDT_1
WDT_2
WDT_3
(48.08%)
(17.35%)
Fig. 3 Biplot of the Principal Component Analysis run on standardized meteorological variables.
White, grey, and black circles represent variables taken during tillering, jointing, and grain-filling
phases. Squares represent the environments. The size of each square is proportional to its average
yield. The unexplained variance for each site is shown as a grey cut-out (see text for the acronyms
of meteorological variables)
300 I. Romagosa et al.
mij ¼ mþ Gi þ Ej ð1Þ
with m the general mean, Gi the genotypic main effect, and Ej the environmental
main effect (both expressed as deviations from the general mean).
For balanced data, the estimate for the main effect of genotype i is the averageacross environments of the phenotypic observations indexed by i minus the general
mean. Likewise, the estimate for the main effect of environment j follows from the
average across genotypes of observations indexed by j. So, genotypic main effects
depend on the particular set of environments that were included in the experiments,
while environmental main effects depend on the genotypes that were included.
The main purpose of the additive model is to interpret phenotypic differences in
terms of mean differences between the genotypes on the one hand and mean
differences between the environments on the other hand. The additive model is a
benchmark model for all other models and is really applicable only in the unlikely
event of the absence of GE or, maybe, in the presence of moderate GE. The additive
model describes the phenotypic responses for a set of genotypes to a set of
environments as a set of parallel lines. The analysis of variance for this model
applied to our data is shown in Table 2 (i). Both the environments and genotypes
were highly significant explaining 85.2% and 2.5% of the total sum of squares.
3.2 The Full Interaction Model
Means across environments are relevant indicators of genotypic performance when
there is no GE. If, however, GE is present, the use of means across environments
ignores the differential reaction of genotypes to environmental changes. Hence, a
common way to extend the additive model is to add a term for each combination of
genotype and environment:
mij ¼ mþ Gi þ Ej þ ðG:EÞij ð2Þ
Model (2) has as many independent parameters as genotype by environment
combinations. With this model, predictions of phenotypic responses for environ-
ments that were not in the set of trial environments is impossible, because there will
be no estimates for the particular (G.E)ij terms. In our example, the analysis of
variance table for the full interaction model is shown in Table 2 (ii). In terms of
sums of squares, G.E was approximately six times greater than G. If we use the
rough estimate of the experimental error across trials identified above, 0.23 t/ha,
every term in the model was highly significant.
To assess the relative importance of each term in the model, an alternative to the
magnitude of sum of squares in the ANOVA table, or equivalently, their R2, which
depends on the number of degrees of freedom associated to each term, is the use of
variance components (and their associated standard errors). Useful variance com-
Statistical Analyses of Genotype by Environment Data 301
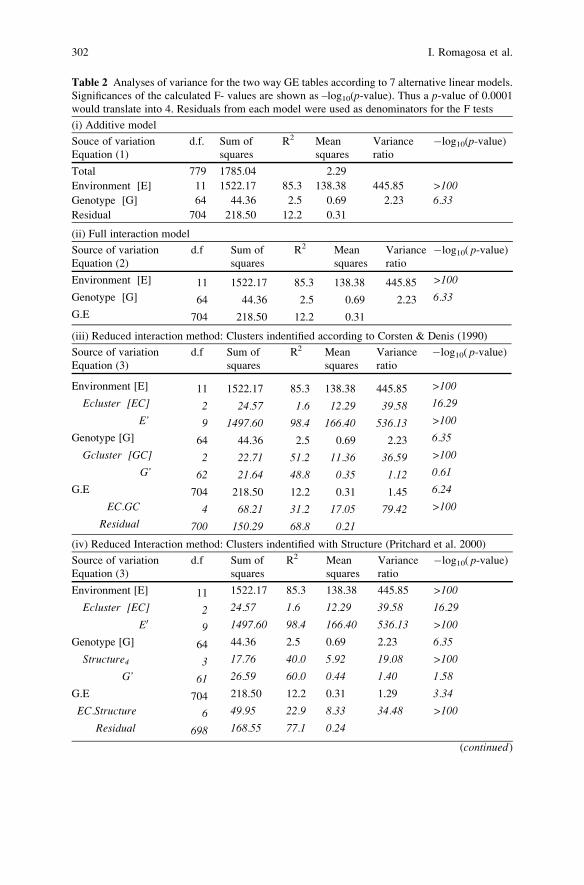
Table 2 Analyses of variance for the two way GE tables according to 7 alternative linear models.
Significances of the calculated F- values are shown as –log10(p-value). Thus a p-value of 0.0001would translate into 4. Residuals from each model were used as denominators for the F tests
(i) Additive model
Souce of variation
Equation (1)
d.f. Sum of
squares
R2 Mean
squares
Variance
ratio
�log10(p-value)
Total 779 1785.04 2.29
Environment [E] 11 1522.17 85.3 138.38 445.85 >100
Genotype [G] 64 44.36 2.5 0.69 2.23 6.33
Residual 704 218.50 12.2 0.31
(ii) Full interaction model
Source of variation
Equation (2)
d.f Sum of
squares
R2 Mean
squares
Variance
ratio
�log10( p-value)
Environment [E] 11 1522.17 85.3 138.38 445.85 >100
Genotype [G] 64 44.36 2.5 0.69 2.23 6.33
G.E 704 218.50 12.2 0.31
(iii) Reduced interaction method: Clusters indentified according to Corsten & Denis (1990)
Source of variation
Equation (3)
d.f Sum of
squares
R2 Mean
squares
Variance
ratio
�log10( p-value)
Environment [E] 11 1522.17 85.3 138.38 445.85 >100
Ecluster [EC] 2 24.57 1.6 12.29 39.58 16.29
E’ 9 1497.60 98.4 166.40 536.13 >100
Genotype [G] 64 44.36 2.5 0.69 2.23 6.35
Gcluster [GC] 2 22.71 51.2 11.36 36.59 >100
G’ 62 21.64 48.8 0.35 1.12 0.61
G.E 704 218.50 12.2 0.31 1.45 6.24
EC.GC 4 68.21 31.2 17.05 79.42 >100
Residual 700 150.29 68.8 0.21
(iv) Reduced Interaction method: Clusters indentified with Structure (Pritchard et al. 2000)
Source of variation
Equation (3)
d.f Sum of
squares
R2 Mean
squares
Variance
ratio
�log10( p-value)
Environment [E] 11 1522.17 85.3 138.38 445.85 >100
Ecluster [EC] 2 24.57 1.6 12.29 39.58 16.29
E09 1497.60 98.4 166.40 536.13 >100
Genotype [G] 64 44.36 2.5 0.69 2.23 6.35
Structure4 3 17.76 40.0 5.92 19.08 >100
G’ 61 26.59 60.0 0.44 1.40 1.58
G.E 704 218.50 12.2 0.31 1.29 3.34
EC.Structure 6 49.95 22.9 8.33 34.48 >100
Residual 698 168.55 77.1 0.24
(continued)
302 I. Romagosa et al.
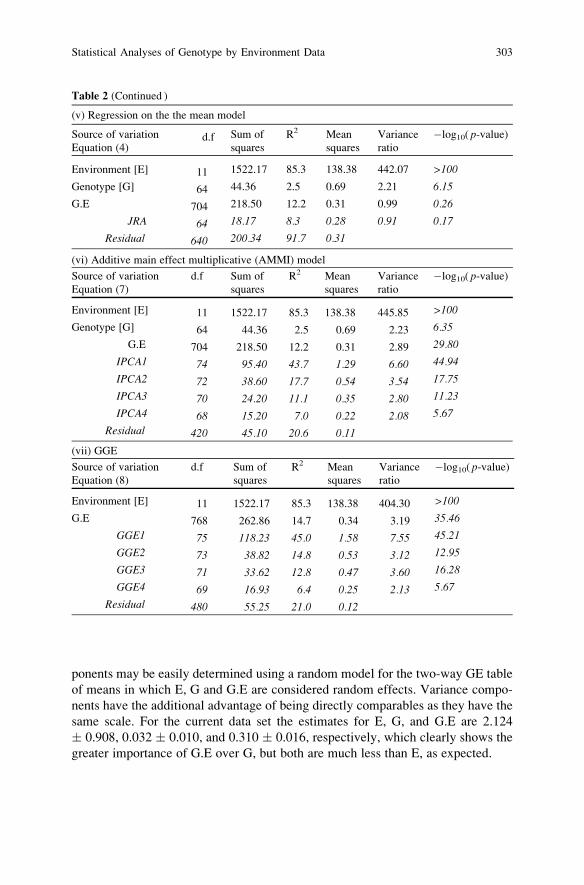
ponents may be easily determined using a random model for the two-way GE table
of means in which E, G and G.E are considered random effects. Variance compo-
nents have the additional advantage of being directly comparables as they have the
same scale. For the current data set the estimates for E, G, and G.E are 2.124
� 0.908, 0.032 � 0.010, and 0.310 � 0.016, respectively, which clearly shows the
greater importance of G.E over G, but both are much less than E, as expected.
Table 2 (Continued )
(v) Regression on the the mean model
Source of variation
Equation (4)d.f Sum of
squares
R2 Mean
squares
Variance
ratio
�log10( p-value)
Environment [E] 11 1522.17 85.3 138.38 442.07 >100
Genotype [G] 64 44.36 2.5 0.69 2.21 6.15
G.E 704 218.50 12.2 0.31 0.99 0.26
JRA 64 18.17 8.3 0.28 0.91 0.17
Residual 640 200.34 91.7 0.31
(vi) Additive main effect multiplicative (AMMI) model
Source of variation
Equation (7)
d.f Sum of
squares
R2 Mean
squares
Variance
ratio
�log10( p-value)
Environment [E] 11 1522.17 85.3 138.38 445.85 >100
Genotype [G] 64 44.36 2.5 0.69 2.23 6.35
G.E 704 218.50 12.2 0.31 2.89 29.80
IPCA1 74 95.40 43.7 1.29 6.60 44.94
IPCA2 72 38.60 17.7 0.54 3.54 17.75
IPCA3 70 24.20 11.1 0.35 2.80 11.23
IPCA4 68 15.20 7.0 0.22 2.08 5.67
Residual 420 45.10 20.6 0.11
(vii) GGE
Source of variation
Equation (8)
d.f Sum of
squares
R2 Mean
squares
Variance
ratio
�log10( p-value)
Environment [E] 11 1522.17 85.3 138.38 404.30 >100
G.E 768 262.86 14.7 0.34 3.19 35.46
GGE1 75 118.23 45.0 1.58 7.55 45.21
GGE2 73 38.82 14.8 0.53 3.12 12.95
GGE3 71 33.62 12.8 0.47 3.60 16.28
GGE4 69 16.93 6.4 0.25 2.13 5.67
Residual 480 55.25 21.0 0.12
Statistical Analyses of Genotype by Environment Data 303
3.3 Reduced Interaction Model: Clustering of Genotypesand Environments
An improvement on the full interaction model can be attained by grouping geno-
types and environments in such a way that the majority of the interactions are
represented by the interactions between the groups of genotypes and environments.
If meaningful clusters of genotypes (GC) and environments (EC) are identified,
such a reduced interaction model would help in understanding the nature of GE. In
model terms, the expected phenotypic response for a genotype i (i = 1 . . . I) thatbelongs to a given cluster of genotypes identified as GCk (k = 1 . . . K, where K is
hopefully much smaller than I ) in the environment j (j = 1 . . . J ) that belongs to a
cluster of environments ECl (l = 1 . . . L, where L < J), mi(j)k(l), would be defined as
miðkÞjðlÞ ¼ mþ ½GCk þ G0iðkÞ� þ ½ECl þ E0
jðlÞ� þ ½ðGC:ECÞkl þ ðG:EÞ0iðkÞ jðlÞ� ð3Þ
where m stands for the general mean, GCk is the genotype-grouping main effect
expressed as a deviation from the general mean, Gi(k) stands for a residual genotypic
main effect or deviation of the mean of genotype i from the mean of its GCk group,
and should be noticeably smaller than the original Gi in Eq. (2) if the genotype
groups are to be useful. Likewise ECl represents the environmental-grouping main
effect expressed as a deviation from the general mean. E0j(l) symbolizes the devia-
tion of environment j from the mean of the environmental group ECl. Each of the
square bracket pairs in Eq. (3) reflects an orthogonal partitioning of G, E, and GE.
The most important term for our purposes is (GC.EC)kl. This interaction term gives
a deviation from the simple additive model for the combination of genotype group kand environment group l. When successful, the portion of the interaction explained
by (GC.EC)kl should be substantial in relation to the whole of the initial GE.
Corsten and Denis (1990) developed a useful algorithm to simultaneously cluster
genotypes and environments in an orthogonal balanced two-way table in order to
identify groups of genotypes and environments that maximally explain GE. Starting
with a significant interaction, the procedure goes through a sequence of steps in each
of which the mean square for interaction is calculated for all possible sub-tables
consisting of a pair of rows (genotypes) or a pair of columns (environments) from the
full table. The pair of rows or columns with the minimal mean square for interaction
is merged, giving an updated table, and the process is repeated. Thus, a sequence of
amalgamations of rows and columns is produced, eventually leading to a 2� 2 table.
In this way, the total sum of squares for the interaction is made up of orthogonal
increments. The pattern of amalgamations can be visualized in the form of two
dendrograms. When an estimate for error is available, a cut-off value for group
identification can be calculated. The resulting genotype and environment groups
hopefully provide more insight in the driving forces behind GE. The clustering
procedure is conceptually very simple, but laborious to implement in standard
304 I. Romagosa et al.
statistical programs. The Biometris library of GenStat, www.biometris.wur.nl,
includes an easily implemented procedure, named CINTERACTION and devel-
oped by J. Thissen and de J. de Bree, that runs the Corsten and Denis (1990)
algorithm.
The top of Fig. 4 illustrates the CINTERACTION-derived dendograms for
genotypes and sites. The horizontal axis shows the cumulative interaction sum of
squares built up in the agglomerative hierarchical clustering steps. The first geno-
typic cluster (GC1) was made up of a mixture of predominantly winter and a few
spring genotypes; the second (GC2) of mainly spring types. The third cluster
contained all Turkish lines and a few winter types (GC3). A graphical representation
of the reduction of complexity of the GE is shown at the bottom of Fig. 4.
Genotypes in GC3 interacted positively with environments in EC1 and negatively
with Morocco 2004 (M4), the latter defining EC2. As mentioned, genotypes in GC3
are late winter and Turkish entries that did well in a series of temperate sites, and
very poorly under warm conditions.
Table 2 (iii) shows the partitioning of the variation and corresponding tests when
the genotype and environment groups from the clustering above are introduced as apriori defined groups in model (3), that is, when the groups would have been
defined independent of the data. As the groups were actually obtained from analysis
of the data, that is, a posteriori, the tests will inflate the importance of the groups in
describing the interaction. However, for general exploratory purposes, Table 2 (iii)
is reliable enough. We see that three genotypic and environment clusters explained,
with just four out of the total of 704 degrees of freedom, more than 30% of the G.E
sum of squares. To test the grouping effect on the interaction, we used a model with
fixed genotypic and environmental clusters in combination with random genotypes
and sites within the respective clusters. We then tested the significance of the
portion of G.E explained by the groups against their residuals, which is a more
appropriate test than testing it against the intra-trial experimental error. This
revealed that a highly significant portion of the interaction was associated with
the groups.
Throughout this chapter, we will use the Corsten and Denis (1990) derived
groups. Similar group interaction models could be defined using alternative geno-
typic and/or environmental groupings, but due to the nature of the Corsten and
Denis algorithm, alternative groupings will explain less of the G.E. Table 2 (iv)
shows the partitioning of GE using the four Structure-defined genotype groups and
the three above-defined environment groups. These four genotypic groups com-
bined with the three environmental clusters detected above, explained with six
degrees of freedom, just over 20% of the interaction sum of squares. The reason for
the lesser importance of the Structure solution is clear. Contrary to the Corsten and
Denis (1990) clusters, the Structure clusters are based on all genetic information,
some of which is unlikely to be related to grain yield, which is the response process
under current study.
Statistical Analyses of Genotype by Environment Data 305
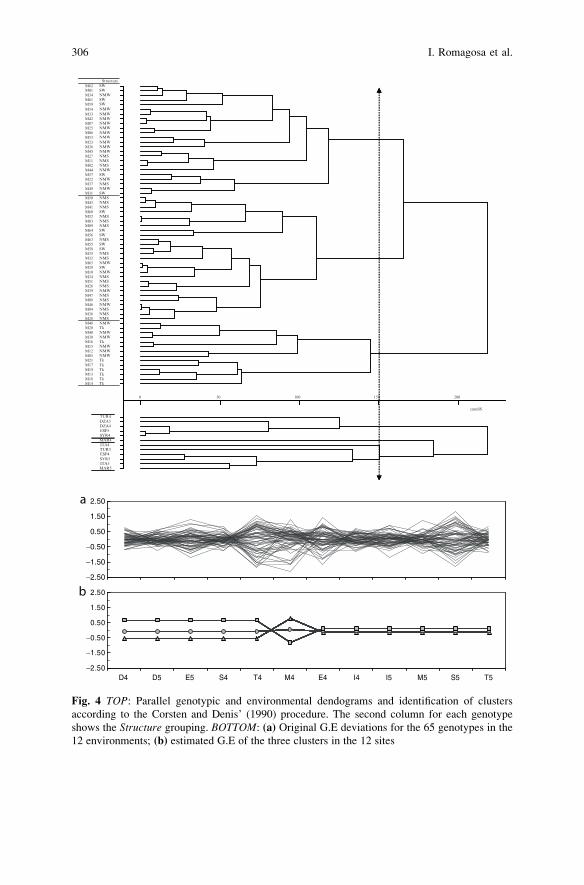
cumSS
Structure
0 20015010050
StructureM62 SWM01 SWM34 NMWM61 SWM59 SWM54 NMWM33 NMWM42 NMWM07 NMWM25 NMWM06 NMWM53 NMWM23 NMWM38 NMWM45 NMWM27 NMSM11 NMSM02 NMSM44 NMWM57 SWM22 NMWM37 NMSM49 NMWM31 SWM50 NMSM43 NMSM41 NMSM60 SWM52 NMSM03 NMSM09 NMSM64 SWM56 SWM63 NMSM55 SWM58 SWM35 NMSM32 NMSM65 NMWM29 SWM10 NMWM24 NMSM51 NMSM26 NMSM39 NMWM47 NMSM08 NMSM46 NMWM04 NMSM36 NMSM28 NMSM48 NMWM20 TkM40 NMWM30 NMWM16 TkM15 NMWM12 NMWM05 NMWM21 TkM17 TkM19 TkM13 TkM18 TkM14 Tk
TUR4DZA5DZA4ESP5SYR4MAR4ITA4TUR5ESP4SYR5ITA5MAR5
−2.50
−1.50
−0.50
0.50
1.50
2.50a
b
−2.50D4 D5 E5 S4 T4 M4 E4 I4 I5 M5 S5 T5
−1.50
−0.50
0.50
1.50
2.50
Fig. 4 TOP: Parallel genotypic and environmental dendograms and identification of clusters
according to the Corsten and Denis’ (1990) procedure. The second column for each genotype
shows the Structure grouping. BOTTOM: (a) Original G.E deviations for the 65 genotypes in the
12 environments; (b) estimated G.E of the three clusters in the 12 sites
306 I. Romagosa et al.
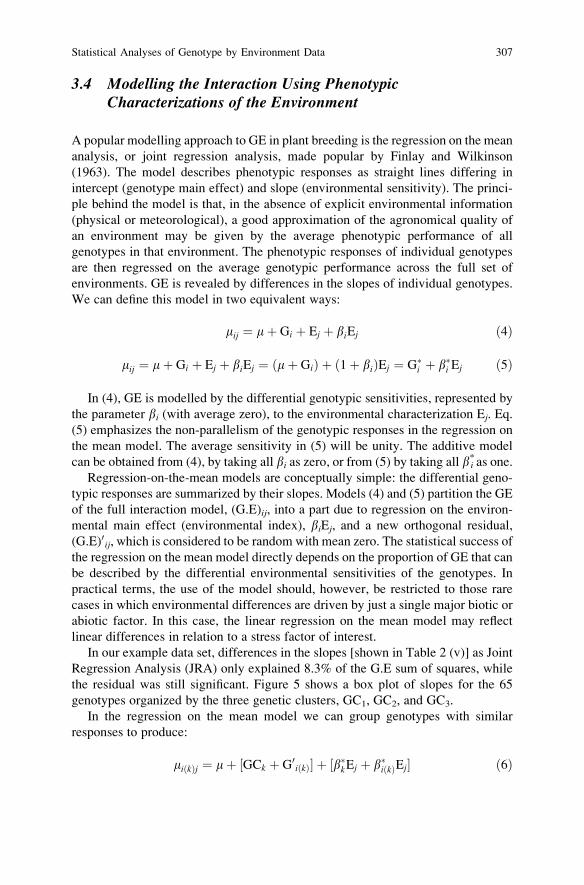
3.4 Modelling the Interaction Using PhenotypicCharacterizations of the Environment
A popular modelling approach to GE in plant breeding is the regression on the mean
analysis, or joint regression analysis, made popular by Finlay and Wilkinson
(1963). The model describes phenotypic responses as straight lines differing in
intercept (genotype main effect) and slope (environmental sensitivity). The princi-
ple behind the model is that, in the absence of explicit environmental information
(physical or meteorological), a good approximation of the agronomical quality of
an environment may be given by the average phenotypic performance of all
genotypes in that environment. The phenotypic responses of individual genotypes
are then regressed on the average genotypic performance across the full set of
environments. GE is revealed by differences in the slopes of individual genotypes.
We can define this model in two equivalent ways:
mij ¼ mþ Gi þ Ej þ biEj ð4Þ
mij ¼ mþ Gi þ Ej þ biEj ¼ ðmþ GiÞ þ ð1þ biÞEj ¼ G�i þ b�i Ej ð5Þ
In (4), GE is modelled by the differential genotypic sensitivities, represented by
the parameter bi (with average zero), to the environmental characterization Ej. Eq.
(5) emphasizes the non-parallelism of the genotypic responses in the regression on
the mean model. The average sensitivity in (5) will be unity. The additive model
can be obtained from (4), by taking all bi as zero, or from (5) by taking all b*i as one.Regression-on-the-mean models are conceptually simple: the differential geno-
typic responses are summarized by their slopes. Models (4) and (5) partition the GE
of the full interaction model, (G.E)ij, into a part due to regression on the environ-
mental main effect (environmental index), biEj, and a new orthogonal residual,
(G.E)0ij, which is considered to be randomwith mean zero. The statistical success of
the regression on the mean model directly depends on the proportion of GE that can
be described by the differential environmental sensitivities of the genotypes. In
practical terms, the use of the model should, however, be restricted to those rare
cases in which environmental differences are driven by just a single major biotic or
abiotic factor. In this case, the linear regression on the mean model may reflect
linear differences in relation to a stress factor of interest.
In our example data set, differences in the slopes [shown in Table 2 (v)] as Joint
Regression Analysis (JRA) only explained 8.3% of the G.E sum of squares, while
the residual was still significant. Figure 5 shows a box plot of slopes for the 65
genotypes organized by the three genetic clusters, GC1, GC2, and GC3.
In the regression on the mean model we can group genotypes with similar
responses to produce:
miðkÞj ¼ mþ ½GCk þ G0iðkÞ� þ ½b�kEj þ b�iðkÞEj� ð6Þ
Statistical Analyses of Genotype by Environment Data 307
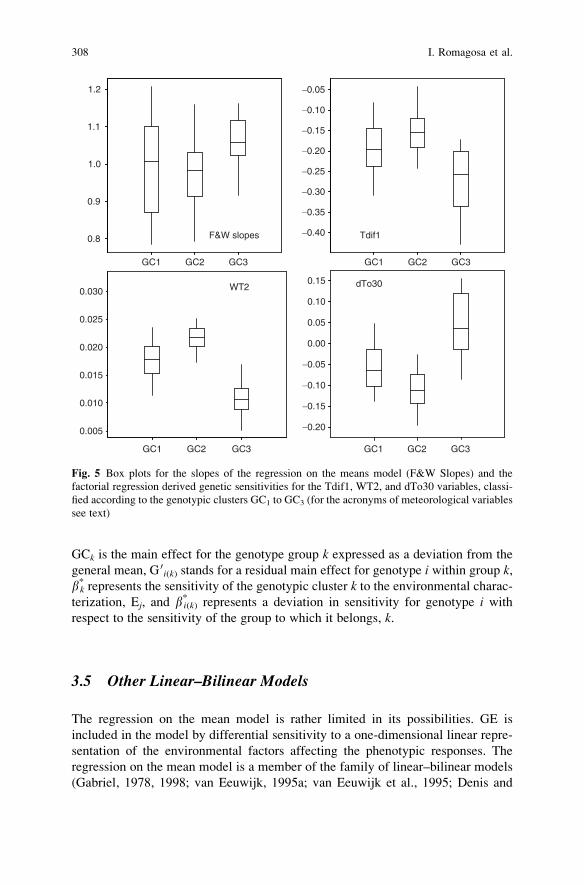
GCk is the main effect for the genotype group k expressed as a deviation from the
general mean, G 0i(k) stands for a residual main effect for genotype i within group k,
b*k represents the sensitivity of the genotypic cluster k to the environmental charac-
terization, Ej, and b*i(k) represents a deviation in sensitivity for genotype i withrespect to the sensitivity of the group to which it belongs, k.
3.5 Other Linear–Bilinear Models
The regression on the mean model is rather limited in its possibilities. GE is
included in the model by differential sensitivity to a one-dimensional linear repre-
sentation of the environmental factors affecting the phenotypic responses. The
regression on the mean model is a member of the family of linear–bilinear models
(Gabriel, 1978, 1998; van Eeuwijk, 1995a; van Eeuwijk et al., 1995; Denis and
1.1
GC3
0.9
GC2GC1
1.0
1.2
0.8
−0.35
−0.40
−0.05
−0.15
−0.25
GC3GC2GC1
−0.10
−0.30
−0.20
0.030
0.020
GC3
0.010
GC2GC1
0.015
0.025
0.005
−0.15
−0.20
0.15
0.05
−0.05
GC3GC2GC1
0.10
−0.10
0.00
F&W slopes
WT2
Tdif1
dTo30
Fig. 5 Box plots for the slopes of the regression on the means model (F&W Slopes) and the
factorial regression derived genetic sensitivities for the Tdif1, WT2, and dTo30 variables, classi-
fied according to the genotypic clusters GC1 to GC3 (for the acronyms of meteorological variables
see text)
308 I. Romagosa et al.
Gower, 1996; Crossa and Cornelius, 2002). Other models of this class allow more
flexible and powerful characterizations of the environment. All linear–bilinear
models describe GE by differential genotypic sensitivities to one or more environ-
mental characterizations that are simple linear functions of the phenotypic data
themselves.
Linear–bilinear models contain simple additive (linear) and multiplicative
(bilinear) terms. In the regression on the mean model, using the regression formu-
lation (5), G*i + b*iEj, the linear part of the model is given by G*i, while the bilinear
part is given by b*iEj. The latter term is not an ordinary regression term, because
both genotypic and environmental parameters have to be estimated simultaneously.
A bilinear model becomes a standard linear model in the genotypic parameters
upon fixation of the environmental parameters, and it becomes linear in the
environmental parameters upon fixation of the genotypic parameters. This property
forms the basis for a general estimating procedure for the parameters (Gabriel and
Zamir, 1979; Gabriel, 1998; van Eeuwijk, 1995b).
Additional bilinear terms provide higher flexibility for the modelling of GE. A
popular example of a linear–bilinear model with a facility for multiple bilinear
terms is the Additive Main effects and Multiplicative Interaction effects model, or
AMMI model (Gollob, 1968; Mandel, 1969; Gabriel, 1978; Gauch, 1988). The
model is defined as follows:
mij ¼ mþ Gi þ Ej þXK
k¼1
akibkj ð7Þ
with aki and bkj genotypic and environmental parameters (scores) for the bilinear
term k, which in this case represents the number of multiplicative terms necessary
for an adequate description of GE. Similar to the multiplicative term in the
regression on the mean model, the genotypic scores, aki, can be interpreted as
sensitivities, and the environmental scores, bkj, are environmental characterizations.
From a statistical point of view, the environmental scores for the first bilinear term
represent the best environmental characterization possible for the description of
GE. It is the environmental variable with maximally different genotypic sensitiv-
ities. The second bilinear term represents the second best environmental characteri-
zation, etc.
The parameter estimates for an AMMI model with two bilinear terms, K = 2, can
conveniently be visualized by means of a biplot (Kempton, 1984; Fox et al., 1997).
The first and second bilinear terms are often called IPCA1 and IPCA2, where IPCA
stems from interaction principal component analysis. The position of the point of
genotype i in the biplot is given by the estimates for the genotypic scores, a1i anda2i; similarly, the point coordinates for environment j originate from the estimates
for the environmental scores (b1j, b2j). Distances from the origin (0, 0) are propor-
tional to the amount of interaction due to genotypes over environments or to
environments in relation to genotypes. Genotypes that are located close to each
other in the biplot behave similarly with regard to adaptation patterns. Environ-
Statistical Analyses of Genotype by Environment Data 309
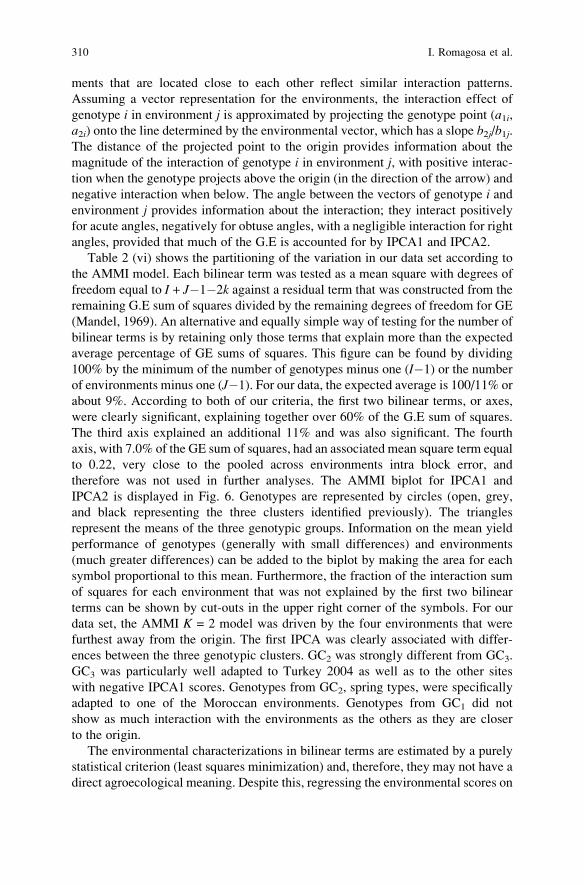
ments that are located close to each other reflect similar interaction patterns.
Assuming a vector representation for the environments, the interaction effect of
genotype i in environment j is approximated by projecting the genotype point (a1i,a2i) onto the line determined by the environmental vector, which has a slope b2j/b1j.The distance of the projected point to the origin provides information about the
magnitude of the interaction of genotype i in environment j, with positive interac-
tion when the genotype projects above the origin (in the direction of the arrow) and
negative interaction when below. The angle between the vectors of genotype i andenvironment j provides information about the interaction; they interact positively
for acute angles, negatively for obtuse angles, with a negligible interaction for right
angles, provided that much of the G.E is accounted for by IPCA1 and IPCA2.
Table 2 (vi) shows the partitioning of the variation in our data set according to
the AMMI model. Each bilinear term was tested as a mean square with degrees of
freedom equal to I + J�1�2k against a residual term that was constructed from the
remaining G.E sum of squares divided by the remaining degrees of freedom for GE
(Mandel, 1969). An alternative and equally simple way of testing for the number of
bilinear terms is by retaining only those terms that explain more than the expected
average percentage of GE sums of squares. This figure can be found by dividing
100% by the minimum of the number of genotypes minus one (I�1) or the number
of environments minus one (J�1). For our data, the expected average is 100/11% or
about 9%. According to both of our criteria, the first two bilinear terms, or axes,
were clearly significant, explaining together over 60% of the G.E sum of squares.
The third axis explained an additional 11% and was also significant. The fourth
axis, with 7.0% of the GE sum of squares, had an associated mean square term equal
to 0.22, very close to the pooled across environments intra block error, and
therefore was not used in further analyses. The AMMI biplot for IPCA1 and
IPCA2 is displayed in Fig. 6. Genotypes are represented by circles (open, grey,
and black representing the three clusters identified previously). The triangles
represent the means of the three genotypic groups. Information on the mean yield
performance of genotypes (generally with small differences) and environments
(much greater differences) can be added to the biplot by making the area for each
symbol proportional to this mean. Furthermore, the fraction of the interaction sum
of squares for each environment that was not explained by the first two bilinear
terms can be shown by cut-outs in the upper right corner of the symbols. For our
data set, the AMMI K = 2 model was driven by the four environments that were
furthest away from the origin. The first IPCA was clearly associated with differ-
ences between the three genotypic clusters. GC2 was strongly different from GC3.
GC3 was particularly well adapted to Turkey 2004 as well as to the other sites
with negative IPCA1 scores. Genotypes from GC2, spring types, were specifically
adapted to one of the Moroccan environments. Genotypes from GC1 did not
show as much interaction with the environments as the others as they are closer
to the origin.
The environmental characterizations in bilinear terms are estimated by a purely
statistical criterion (least squares minimization) and, therefore, they may not have a
direct agroecological meaning. Despite this, regressing the environmental scores on
310 I. Romagosa et al.
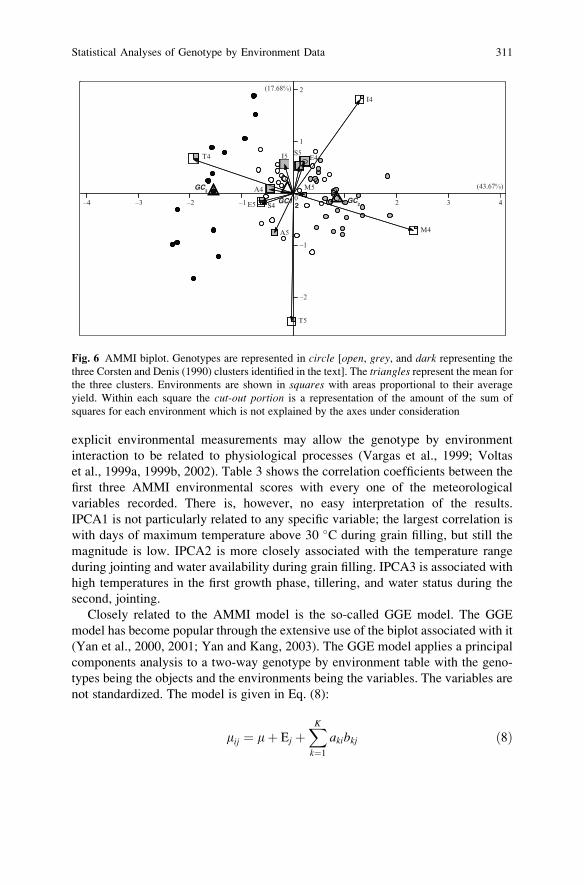
explicit environmental measurements may allow the genotype by environment
interaction to be related to physiological processes (Vargas et al., 1999; Voltas
et al., 1999a, 1999b, 2002). Table 3 shows the correlation coefficients between the
first three AMMI environmental scores with every one of the meteorological
variables recorded. There is, however, no easy interpretation of the results.
IPCA1 is not particularly related to any specific variable; the largest correlation is
with days of maximum temperature above 30 �C during grain filling, but still the
magnitude is low. IPCA2 is more closely associated with the temperature range
during jointing and water availability during grain filling. IPCA3 is associated with
high temperatures in the first growth phase, tillering, and water status during the
second, jointing.
Closely related to the AMMI model is the so-called GGE model. The GGE
model has become popular through the extensive use of the biplot associated with it
(Yan et al., 2000, 2001; Yan and Kang, 2003). The GGE model applies a principal
components analysis to a two-way genotype by environment table with the geno-
types being the objects and the environments being the variables. The variables are
not standardized. The model is given in Eq. (8):
mij ¼ mþ Ej þXK
k¼1
akibkj ð8Þ
-4
-2
-1
1
2
A4
A5
E4
E5
I4
I5
M4
M5
S4
S5T4
T5
(43.67%)
(17.68%)
GC12
GC3
GC2-3 -2 -1 4
01 2 3
Fig. 6 AMMI biplot. Genotypes are represented in circle [open, grey, and dark representing the
three Corsten and Denis (1990) clusters identified in the text]. The triangles represent the mean for
the three clusters. Environments are shown in squares with areas proportional to their average
yield. Within each square the cut-out portion is a representation of the amount of the sum of
squares for each environment which is not explained by the axes under consideration
Statistical Analyses of Genotype by Environment Data 311
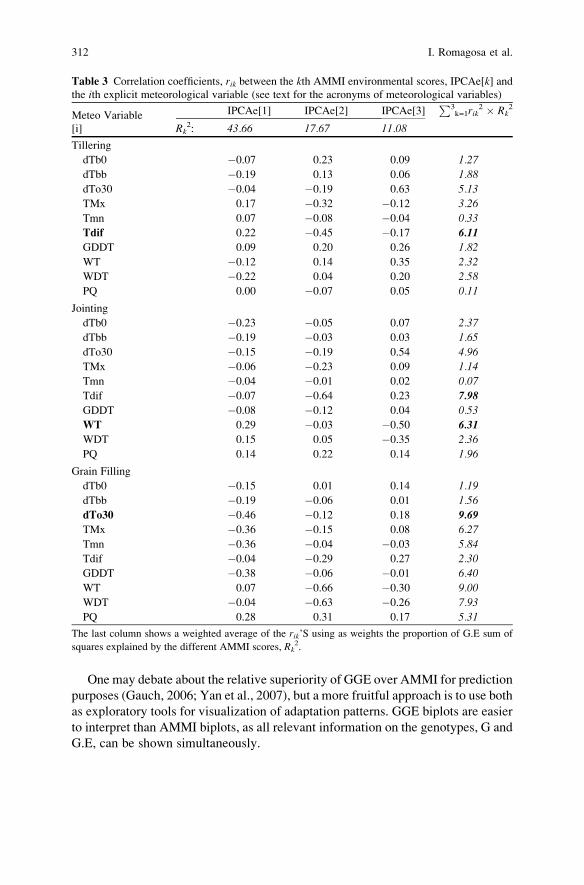
One may debate about the relative superiority of GGE over AMMI for prediction
purposes (Gauch, 2006; Yan et al., 2007), but a more fruitful approach is to use both
as exploratory tools for visualization of adaptation patterns. GGE biplots are easier
to interpret than AMMI biplots, as all relevant information on the genotypes, G and
G.E, can be shown simultaneously.
Table 3 Correlation coefficients, rik between the kth AMMI environmental scores, IPCAe[k] andthe ith explicit meteorological variable (see text for the acronyms of meteorological variables)
Meteo Variable IPCAe[1] IPCAe[2] IPCAe[3]P3
k=1rik2 � Rk
2
[i] Rk2: 43.66 17.67 11.08
Tillering
dTb0 �0.07 0.23 0.09 1.27
dTbb �0.19 0.13 0.06 1.88
dTo30 �0.04 �0.19 0.63 5.13
TMx 0.17 �0.32 �0.12 3.26
Tmn 0.07 �0.08 �0.04 0.33
Tdif 0.22 �0.45 �0.17 6.11
GDDT 0.09 0.20 0.26 1.82
WT �0.12 0.14 0.35 2.32
WDT �0.22 0.04 0.20 2.58
PQ 0.00 �0.07 0.05 0.11
Jointing
dTb0 �0.23 �0.05 0.07 2.37
dTbb �0.19 �0.03 0.03 1.65
dTo30 �0.15 �0.19 0.54 4.96
TMx �0.06 �0.23 0.09 1.14
Tmn �0.04 �0.01 0.02 0.07
Tdif �0.07 �0.64 0.23 7.98
GDDT �0.08 �0.12 0.04 0.53
WT 0.29 �0.03 �0.50 6.31
WDT 0.15 0.05 �0.35 2.36
PQ 0.14 0.22 0.14 1.96
Grain Filling
dTb0 �0.15 0.01 0.14 1.19
dTbb �0.19 �0.06 0.01 1.56
dTo30 �0.46 �0.12 0.18 9.69
TMx �0.36 �0.15 0.08 6.27
Tmn �0.36 �0.04 �0.03 5.84
Tdif �0.04 �0.29 0.27 2.30
GDDT �0.38 �0.06 �0.01 6.40
WT 0.07 �0.66 �0.30 9.00
WDT �0.04 �0.63 �0.26 7.93
PQ 0.28 0.31 0.17 5.31
The last column shows a weighted average of the rik’S using as weights the proportion of G.E sum of
squares explained by the different AMMI scores, Rk2.
312 I. Romagosa et al.
4 Models for Interaction Using Explicit Environmental
Characterizations
4.1 Factorial Regression Models
Bilinear models for interaction can be used for exploratory analysis of GE. We
attempted to construct hypothetical environmental characterizations to which gen-
otypes have different sensitivities. The results of analysis with bilinear models do
not necessarily have an interpretable physiological basis. To ascertain whether we
can invoke a physiological explanation, we can check the relationship of the
environmental main effects and scores with explicit characterizations of the envi-
ronment (physical and meteorological).
Suppose that for a particular data set the regression on the mean model gives an
adequate description of GE and that the environmental main effect is a direct
reflection of the average daily temperature, Tj. Eq. (4) can then be modified with
the parameter Ej in the GE part of the regression on the mean model becoming a
function of Tj: mij = m + Gi + Ej + bi f(Tj). Describing the interaction as driven
linearly by temperature then leads to mij = m + Gi + Ej + biTj, with bi the sensitivityof genotype i to changes in temperature. These statistical models for GE that
include differential genotypic sensitivity to explicit environmental variables belong
to the class of factorial regression models (Denis, 1988; van Eeuwijk et al., 1996).
Extension to more environmental variables and more complex response curves
are conceptually simple. For our example data this is, however, somewhat compli-
cated by the reduced number of environments. If we consider the GE a resultant of
three variables: ‘average difference between daily maximum and minimum tem-
perature during jointing’, z1j, ‘total water during jointing’, z2j, and ‘number of days
with temperature above 30 �C during grain filling’, z3j, then the following model
may be appropriate:
mij ¼ mþ Gi þ Ej þ b1iz1j þ b2iz2j þ b3i z3j ð9Þ
In model (9), b1i, b2i, and b3i are the genotypic sensitivities to these three
variables, respectively. The model resembles closely a linear–bilinear model with
three bilinear terms for the interaction, mij = m + Gi + Ej + a1ib1j + a2ib2j + a3ib3j. Inthis bilinear model, the environmental scores b1j, b2j, and b3j are, theoretically, thebest environmental covariables for explaining GE. Physiological understanding
of GE requires us to interpret these scores in terms of explicit environmental
characterizations.
4.2 Variable Selection
A central question when using factorial regression models is the choice of covari-
ables for description of GE. Continuous monitoring of the environment is becoming
Statistical Analyses of Genotype by Environment Data 313
increasingly common, so the question arises how to summarize the most relevant
features of the environment from a GE point of view (Cooper and Hammer, 1996).
Purely statistical approaches as variable subset-selection procedures will not solve
this problem, because they often lead to incomprehensible models. Ecophysiologi-
cal understanding of the genotypes and environments under study should therefore
complement statistical considerations and we should use such knowledge to
delimit the collection of potentially useful sets of environmental covariables.
Even then, different combinations of variables may give similar goodness of fit
(Voltas et al., 1999a,b).
A further point of consideration is that yield arises from an integration of growth
processes over the entire crop life cycle, from which it may be concluded that the
order of inclusion of variables should reflect the sequence of growth stages. We
would therefore begin by testing for inclusion of variables observed during tillering,
followed by those variables recorded during jointing, after having corrected for the
tillering variables, and finally including those variables related to the grain-filling
phase. For barley, Voltas et al. (1999a,b) presented examples of the use of factorial
regression using physiological knowledge in analysis of adaptation and GE.
Our goal is not to identify the ‘best’ factorial regression model, but to illustrate
the use of such models in practical analyses. In this context, Table 4 exemplifies
analysis of variance tables for factorial regression models that linearly incorporate
one by one the ten explicit meteorological variables recorded at each of the three
growing phases. We used the genotypic groups obtained from the Corsten and
Denis (1990) clustering procedure to partition the variation explained by factorial
regression on the environmental covariables into a part due to regression for the
genotypic clusters (one response for each of the three groups) and a part due to
residual genotypic variation within clusters (residual genotypic deviations from the
group response). The best individual variable was ‘days of temperature over 30�Cduring grain filling’. However, the amount of the G.E sum of squares explained,
although highly significant, was limited (13.54%; 8.27% for differential responses
between groups and 5.27% for residual genotypic differences within groups). The
three best variables were relatively uncorrelated and highly significant when
incorporated into a multiple factorial regression model. Altogether they explained
33% of the G.E sum of squares (Table 5). Figure 5 shows the box plots for the fitted
sensitivities of the 65 entries for these three variables separately, taking into
account the genetic groups. From Fig. 5 the different adaptive behaviour of GC3
group is again evident. Similar observations on the differences between the groups
can be made using other techniques, see for example Fig. 4. This difference could
be casually or causally attributed to one or more of the meteorological variables
identified here.
For identifying subsets of environmental covariables, multiple (factorial) regres-
sion variable subset procedures may be computationally and conceptually complex.
Furthermore, estimated genotypic parameters may be difficult to interpret within
elaborate regression models. An alternative approach to variable selection would be
to correlate the estimates for the environmental scores from linear–bilinear models
(e.g. the first AMMI IPCA scores) with a candidate set of environmental covari-
314 I. Romagosa et al.
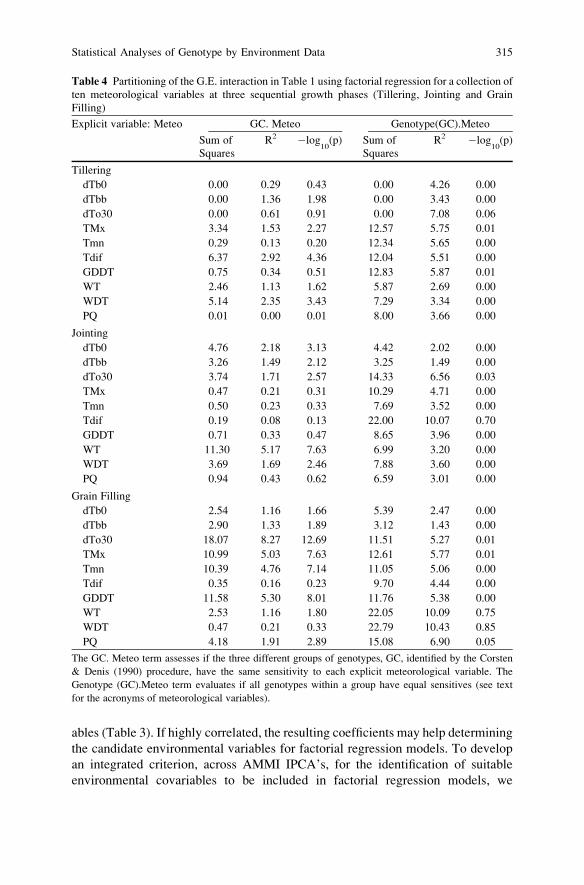
ables (Table 3). If highly correlated, the resulting coefficients may help determining
the candidate environmental variables for factorial regression models. To develop
an integrated criterion, across AMMI IPCA’s, for the identification of suitable
environmental covariables to be included in factorial regression models, we
Table 4 Partitioning of the G.E. interaction in Table 1 using factorial regression for a collection of
ten meteorological variables at three sequential growth phases (Tillering, Jointing and Grain
Filling)
Explicit variable: Meteo GC. Meteo Genotype(GC).Meteo
Sum of
Squares
R2 �log10(p) Sum of
Squares
R2 �log10(p)
Tillering
dTb0 0.00 0.29 0.43 0.00 4.26 0.00
dTbb 0.00 1.36 1.98 0.00 3.43 0.00
dTo30 0.00 0.61 0.91 0.00 7.08 0.06
TMx 3.34 1.53 2.27 12.57 5.75 0.01
Tmn 0.29 0.13 0.20 12.34 5.65 0.00
Tdif 6.37 2.92 4.36 12.04 5.51 0.00
GDDT 0.75 0.34 0.51 12.83 5.87 0.01
WT 2.46 1.13 1.62 5.87 2.69 0.00
WDT 5.14 2.35 3.43 7.29 3.34 0.00
PQ 0.01 0.00 0.01 8.00 3.66 0.00
Jointing
dTb0 4.76 2.18 3.13 4.42 2.02 0.00
dTbb 3.26 1.49 2.12 3.25 1.49 0.00
dTo30 3.74 1.71 2.57 14.33 6.56 0.03
TMx 0.47 0.21 0.31 10.29 4.71 0.00
Tmn 0.50 0.23 0.33 7.69 3.52 0.00
Tdif 0.19 0.08 0.13 22.00 10.07 0.70
GDDT 0.71 0.33 0.47 8.65 3.96 0.00
WT 11.30 5.17 7.63 6.99 3.20 0.00
WDT 3.69 1.69 2.46 7.88 3.60 0.00
PQ 0.94 0.43 0.62 6.59 3.01 0.00
Grain Filling
dTb0 2.54 1.16 1.66 5.39 2.47 0.00
dTbb 2.90 1.33 1.89 3.12 1.43 0.00
dTo30 18.07 8.27 12.69 11.51 5.27 0.01
TMx 10.99 5.03 7.63 12.61 5.77 0.01
Tmn 10.39 4.76 7.14 11.05 5.06 0.00
Tdif 0.35 0.16 0.23 9.70 4.44 0.00
GDDT 11.58 5.30 8.01 11.76 5.38 0.00
WT 2.53 1.16 1.80 22.05 10.09 0.75
WDT 0.47 0.21 0.33 22.79 10.43 0.85
PQ 4.18 1.91 2.89 15.08 6.90 0.05
The GC. Meteo term assesses if the three different groups of genotypes, GC, identified by the Corsten
& Denis (1990) procedure, have the same sensitivity to each explicit meteorological variable. The
Genotype (GC).Meteo term evaluates if all genotypes within a group have equal sensitives (see text
for the acronyms of meteorological variables).
Statistical Analyses of Genotype by Environment Data 315
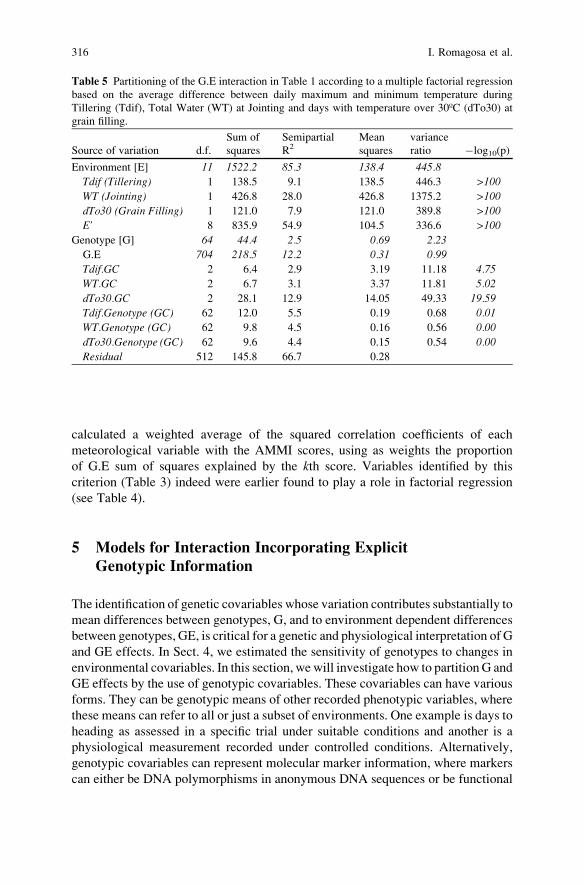
calculated a weighted average of the squared correlation coefficients of each
meteorological variable with the AMMI scores, using as weights the proportion
of G.E sum of squares explained by the kth score. Variables identified by this
criterion (Table 3) indeed were earlier found to play a role in factorial regression
(see Table 4).
5 Models for Interaction Incorporating Explicit
Genotypic Information
The identification of genetic covariables whose variation contributes substantially to
mean differences between genotypes, G, and to environment dependent differences
between genotypes, GE, is critical for a genetic and physiological interpretation of G
and GE effects. In Sect. 4, we estimated the sensitivity of genotypes to changes in
environmental covariables. In this section, wewill investigate how to partitionG and
GE effects by the use of genotypic covariables. These covariables can have various
forms. They can be genotypic means of other recorded phenotypic variables, where
these means can refer to all or just a subset of environments. One example is days to
heading as assessed in a specific trial under suitable conditions and another is a
physiological measurement recorded under controlled conditions. Alternatively,
genotypic covariables can represent molecular marker information, where markers
can either be DNA polymorphisms in anonymous DNA sequences or be functional
Table 5 Partitioning of the G.E interaction in Table 1 according to a multiple factorial regression
based on the average difference between daily maximum and minimum temperature during
Tillering (Tdif), Total Water (WT) at Jointing and days with temperature over 30ºC (dTo30) at
grain filling.
Source of variation d.f.
Sum of
squares
Semipartial
R2Mean
squares
variance
ratio �log10(p)
Environment [E] 11 1522.2 85.3 138.4 445.8
Tdif (Tillering) 1 138.5 9.1 138.5 446.3 >100
WT (Jointing) 1 426.8 28.0 426.8 1375.2 >100
dTo30 (Grain Filling) 1 121.0 7.9 121.0 389.8 >100
E’ 8 835.9 54.9 104.5 336.6 >100
Genotype [G] 64 44.4 2.5 0.69 2.23
G.E 704 218.5 12.2 0.31 0.99
Tdif.GC 2 6.4 2.9 3.19 11.18 4.75
WT.GC 2 6.7 3.1 3.37 11.81 5.02
dTo30.GC 2 28.1 12.9 14.05 49.33 19.59
Tdif.Genotype (GC) 62 12.0 5.5 0.19 0.68 0.01
WT.Genotype (GC) 62 9.8 4.5 0.16 0.56 0.00
dTo30.Genotype (GC) 62 9.6 4.4 0.15 0.54 0.00
Residual 512 145.8 66.7 0.28
316 I. Romagosa et al.
genes. Whatever the covariable, factorial regression can then be used to detect and
locate gene/QTL main effects and gene/QTL by environment interactions.
Consider a co-dominant marker in a diploid crop with genotypes MM, Mm, and
mm. To represent this information in a factorial regression model, we can create a
covariable with values xi for genotype i of 2, 1, and 0 to represent genotypes MM,
Mm, and mm, respectively. The genotypic covariable takes a value equal to the
number of M alleles. In a factorial regression model that includes this covariable xi,under the assumption that the marker coincides with a QTL, the interpretation of the
accompanying slope, say r, will be that of the effect of a QTL allele substitution of
m by M. Effectively, r stands for the additive genetic effect of the QTL. However,
typically markers do not coincide with QTL. To identify QTL, we need to fit
factorial regression models for a grid of markers and virtual markers along the
genome. The virtual markers are constructed from flanking marker information
following well-known procedures for standard biparental crosses between inbred
lines (see Lynch and Walsh, 1998).
Genotypic covariables derived from molecular marker information can be intro-
duced in an additive model for the phenotype, model (1), to describe mean
differences between genotypes across environments as follows:
mij ¼ mþ ½xirþ G0i� þ Ej ð10Þ
where xir + G0i represents a partitioning of the genotypic main effects in (1), Gi.
Model (10) is fitted at a grid of points across the genome. The genotypic covariable
xi changes in relation to the genomic position that we are testing for a possible QTL
expression. When (10) is fitted at positions close to QTL, the regression on xi willexplain a significant part of the genotypic differences. The slope r is the potential
QTL main effect at the genomic position corresponding to xi and G0i is a residual
genotypic main effect that should be smaller than the original Gi.
For a full genome scan, model (10) should be fitted a large number of times and
this requires a multiple test correction of the significance level for assessing
significance of xi. A very conservative Bonferroni correction would simply take
the significance level for individual markers (including virtual markers) as the
genome-wide level divided by the total number of markers. In this approach,
markers are assumed to be independent. Less conservative corrections attempt to
consider dependence between markers, as will be the case due to linkage even with
relatively few markers in a linkage group. One such method is estimating an
effective number of independent tests across the genome and then dividing the
genome-wide significance level by the effective number of independent tests. The
latter number can be estimated in various ways. An interesting approach, based on
eigenvalue decomposition of the correlation matrix of the full set of marker-derived
covariables, is presented by Li and Ji (2005). Alternative approaches use simulation
or permutation. An approximate rule could be to consider tests independent when
they are more than a certain genetic distance apart, for example, 20 or 30 cM in the
case of populations derived from biparental crosses or as little as 1-10 cM when
Statistical Analyses of Genotype by Environment Data 317
considering a diverse pannel of genotypes. Such a rule would lead to a significance
level for individual tests that is equal to the genome-wide significance level divided
by a number between 50 and 200, according to the nature of the genetic population
used, for a genome of size 1,000 cM, which is roughly equivalent to the reported
map length of barley in many mapping studies.
For the sake of simplicity, we will only apply simple marker regression to our
data, that is, we will take model (10) using observed markers as the basis for our
QTL models. Model (10) is a single QTL model. To construct multiple QTL
models, a composite interval mapping strategy can be developed using a straight-
forward extension of model (10), where we add so-called co-factors, markers that
correct for QTL elsewhere on the genome. Co-factors can be selected from the
genetic predictors corresponding to the QTL identified in a preliminary genome
scan by marker regression or simple interval mapping.
Besides terms for QTL main effects, factorial regression models can also include
terms for QTL by environment interaction:
mij ¼ mþ ½xirþ G0i� þ Ej þ ½xirj þ ðG:EÞ0ij� ð11Þ
The (G.E)ij term from model (2) is partitioned in a term due to differential QTL
expression across environments, xirj, and a random residual, (G.E)0ij. In the pres-
ence of significant QTL by environment interaction, the new parameter rj adjuststhe average QTL expression across environments, r, to a more appropriate level for
the individual environment j.Models (10) and (11) can be used for any type of segregating population
provided that appropriate genetic predictors are constructed. The same models are
useful for QTL mapping in the situation of a collection of genotypes without a
clearly defined family structure: linkage disequilibrium mapping, or association
mapping. The problem with collections of genotypes with arbitrary structure is that
linkage disequilibrium between markers and traits does not necessarily result from
genetic linkage between a marker and a QTL. When the collection of genotypes
consists of various sub populations, such as winter and spring types in the case of
barley, false marker trait associations can occur due to differences in marker allele
frequencies between the sub populations. For correct inference on marker trait
associations, we therefore need to correct for any potential population structure
prior to QTL detection.
A popular way to identify population structure is described by Pritchard et al.
(2000), whose approach is available within the package Structure. However,
alternative methods of defining population structure usually perform as well as
the Structure approach. For example, as we have seen in Sect. 2, one may define
population structure on the basis of the origin of the material.
Assuming that the genotypes are grouped according to a population structure
definition, then an additive model which incorporates QTL main effects, see model
(10), corrected for population structure is
318 I. Romagosa et al.
miðkÞj ¼ mþ ½GCk þ xiðkÞrþ G0iðkÞ� þ Ej ð12Þ
where m stands for the general mean, GCk is the sub population to which genotype ibelongs expressed as a deviation from the general mean, xi(k) represent the marker
information for genotype i within sub population k, r is the QTL main effect and
G0i(k) corresponds to a residual genotypic effect.
In an analogous way, the (G.E)ij term from the full interaction model can be
partitioned into a term for the interaction of sub population with environment, a
term for differential QTL expression across environments, xi(k)rj, and a residual,
(G.E)0i(k)j. The complete model for marker trait association analysis incorporating
QTL main effects and QTL by environment interactions is
miðkÞj ¼ mþ ½GCk þ xiðkÞrþ G0iðkÞ� þ Ej þ ½ðGC:EÞkj þ xiðkÞrj þ ðG:EÞ0iðkÞj� ð13Þ
When the environments also have a structure, we can generalizemodel (13) to become
miðkÞjðlÞ ¼ mþ ½GCk þ xiðkÞrþ G0iðkÞ� þ ½ECl þ E0
jðlÞ�þ ½ðGC:ECÞkl þ ðGC:EÞ0kjðlÞ þ xiðkÞrl þ xiðkÞrjðlÞ þ ðG:EÞ0iðkÞjðlÞ�
ð14Þ
In (14), r stands for consistent QTL effects across all environments, rl is a
deviation of the main effect QTL for environment group l, and rj(l) stands for aresidual QTL effect in environment j. Interaction between genotype and environ-
ment groups is represented by (GC.EC)kl. (GC.E)0kj(l) gives an environment-specific
correction to the genotype by environment group interaction. (G.E)0i(k)j(l) gives afinal residual GE term.
To demonstrate our approach, we applied models (10) to (14) to our data.
To account for multiple testing, we used a significance criterion for QTL detection
of –log10( p-value) > 3, that is, p-value < 0.001; this criterion corresponded
empirically to a Bonferroni correction based on 50 independent tests across the
full genome, taking about 30 cM as the distance at which marker trait association
tests become independent. We used 811 genetic covariables, DArT1 markers of
known genomic position, for a genome-wide scan. The genetic covariables took the
values of 1 or 0, depending on the (homozygous) presence or absence of each
anonymous DArT sequence.
Figure 7 shows the number of DArT1 markers which, when utilized in Eq. 10
(uncorrected for structure) and Eq. 12 (corrected), produced a significance level
[log10(p-value)] and accounted for a fraction of the phenotypic variation (R2)
greater than a particular value shown on the X axes. For example, 144 of the
markers had a log10(p-value) greater than 4 in the uncorrected data, while 40% of
the markers, 316 out of 811, explained more than 5% of the original uncorrected
differences in yield. Approximately 5% of the markers, with at least one marker
located on each of barley’s seven chromosomes, explained individually more than
20% of the phenotypic differences for yield (data not shown). In fact, significant
Statistical Analyses of Genotype by Environment Data 319
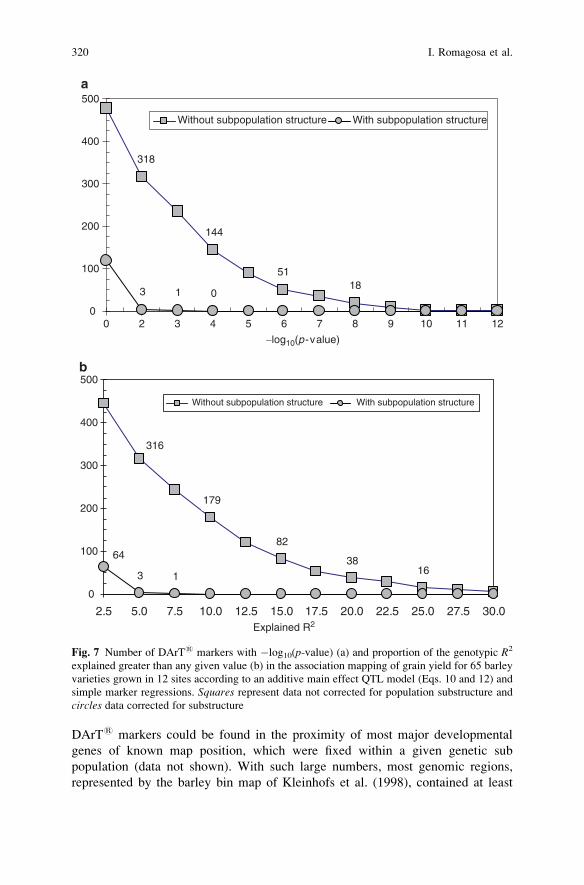
DArT1 markers could be found in the proximity of most major developmental
genes of known map position, which were fixed within a given genetic sub
population (data not shown). With such large numbers, most genomic regions,
represented by the barley bin map of Kleinhofs et al. (1998), contained at least
318
a
144
5118
3 1 0
00 2 3 4 5 6 7 8 9 10 11 12
100
200
300
400
500
Without subpopulation structure With subpopulation structure
−log10(p-value)
3 1
316
b
179
82
3816
64
0
100
200
300
400
500
2.5 5.0 7.5 10.0 12.5 15.0 17.5 20.0 22.5 25.0 27.5 30.0
Without subpopulation structure With subpopulation structure
Explained R2
Fig. 7 Number of DArT1 markers with �log10(p-value) (a) and proportion of the genotypic R2
explained greater than any given value (b) in the association mapping of grain yield for 65 barley
varieties grown in 12 sites according to an additive main effect QTL model (Eqs. 10 and 12) and
simple marker regressions. Squares represent data not corrected for population substructure and
circles data corrected for substructure
320 I. Romagosa et al.
one significant QTL. Many of these QTL would not have any direct use in breeding
as their putative associations with yield are unlikely to be causal.
Few main effect QTL were detected when the sub population structure was
included (model 12). Only three markers explained more than 5% of the phenotypic
variation observed for grain yield. The lack of significant QTL for the main effects
on population corrected data is not that surprising given the high variability of
environments across the entire Mediterranean basin. QTL that interacted with the
environments were more frequent than QTL main effects both in the uncorrected
(applying Eq. 11) and, particularly, for the corrected data (Eq. 13) (Fig. 8). In the
latter case, 99 DArT markers had a p-value smaller than 0.0001, and 55 below 10�6.
Twenty-nine markers explained more than 5% of the G.E interaction, and 12 each
explained more than 7.5% of G.E.
The outputs for the different models are listed in Table 6 for the specific DArT1
marker bPb0429, located in bin 6 of chromosome 1H. It may be worth mentioning
that no major developmental gene has been detected so far in this region, which
makes this marker particularly interesting. Sequential orthogonal partitioning of G,
E, and G.E according to Eqs. 11–14 in population structure uncorrected and
corrected data are shown in this table. The number of degrees of freedom and the
total variation did not coincide with those in Table 2, as a number of entries could
not be genotyped with this marker and, thus, these entries were not included in the
analyses. bPb0429 explained more than 20% of the main effect genotypic differ-
ences in the uncorrected data (Table 6, Eqs. 10 and 12), but only 1.1% of the
genotypic main effects in the corrected (Table 6, Eqs. 11, 13, and 14). Genetic
effects were more tightly associated with differential QTL expression across
individual environments than to the groups of environments and to QTL main
effects. The interaction bPb0429.E represented 20% of G.E on uncorrected data
(Table 6, Eq. 12) and 10% of G.E on corrected (Table 6, Eq. 13). The effect of
this marker varied significantly among groups of environments and, particularly,
between environments within each environmental group. This latter term of the
model, bPb0429.E in Eq. 14 (Table 6), had a –log10(p-value) equal to 16.54 and
explained almost 9% of G.E.
Table 7 shows estimates for QTL main effects and QTL.E associated with
bPb0429 according to Eqs. 10–14. Some of these values should be interpreted
with care as they represent deviations from specific levels. QTL effects were
larger in uncorrected data. Presence of marker bPb0429 translated into a yield
decrease of 0.27 t/ha across environments once corrected for population substruc-
ture, versus 0.34 t/ha on uncorrected data. The QTL effects varied between envi-
ronment groups, with the estimated effect in environment group 3 being 1.09 t/ha
larger than in group 1, which was 0.22 t/ha larger than in group 2 (Table 7, Eq. 14).
They also varied significantly across specific environments within and across
environmental groups, being particularly large for Italy 2004, in which the
difference associated to this marker was 1.75 t/ha and of different sign than that
for Turkey 2005, with an associated effect of +1.00 t/ha. These genetic effects
based on population structure corrected data are often not readily observable
from the raw data. This fact can be observed in Fig. 9, in which separate box
Statistical Analyses of Genotype by Environment Data 321
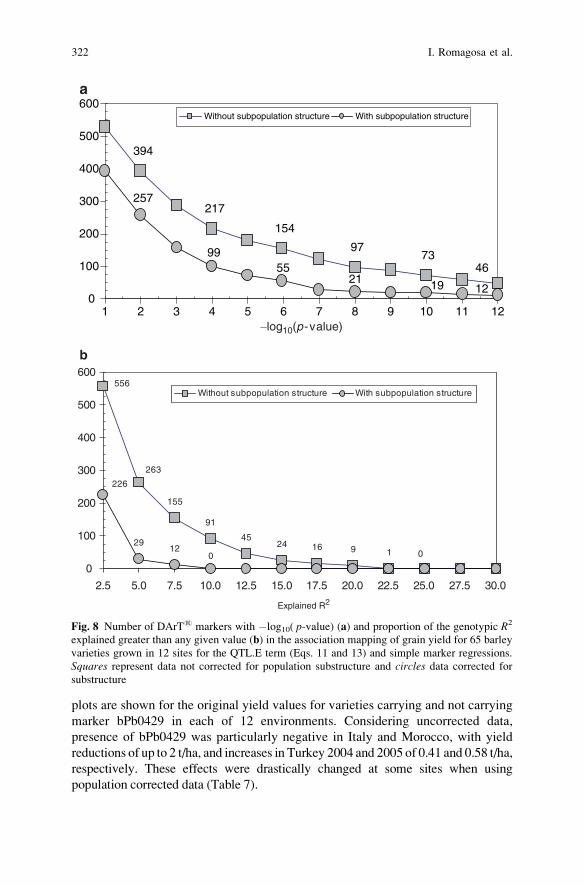
plots are shown for the original yield values for varieties carrying and not carrying
marker bPb0429 in each of 12 environments. Considering uncorrected data,
presence of bPb0429 was particularly negative in Italy and Morocco, with yield
reductions of up to 2 t/ha, and increases in Turkey 2004 and 2005 of 0.41 and 0.58 t/ha,
respectively. These effects were drastically changed at some sites when using
population corrected data (Table 7).
394
217
154
9773
46
257
99
19 1221
55
0
100
200
300
400
500
600
1 2 3 4 5 6 7 8 9 10 11 12
Without subpopulation structure With subpopulation structure
−log10(p -value)
a
155
4516
129
12
263
91
249 0
556
0
226
0
100
200
300
400
500
600
2.5 5.0 7.5 10.0 12.5 15.0 17.5 20.0 22.5 25.0 27.5 30.0
Without subpopulation structure With subpopulation structure
Explained R2
b
Fig. 8 Number of DArT1 markers with �log10( p-value) (a) and proportion of the genotypic R2
explained greater than any given value (b) in the association mapping of grain yield for 65 barley
varieties grown in 12 sites for the QTL.E term (Eqs. 11 and 13) and simple marker regressions.
Squares represent data not corrected for population substructure and circles data corrected for
substructure
322 I. Romagosa et al.
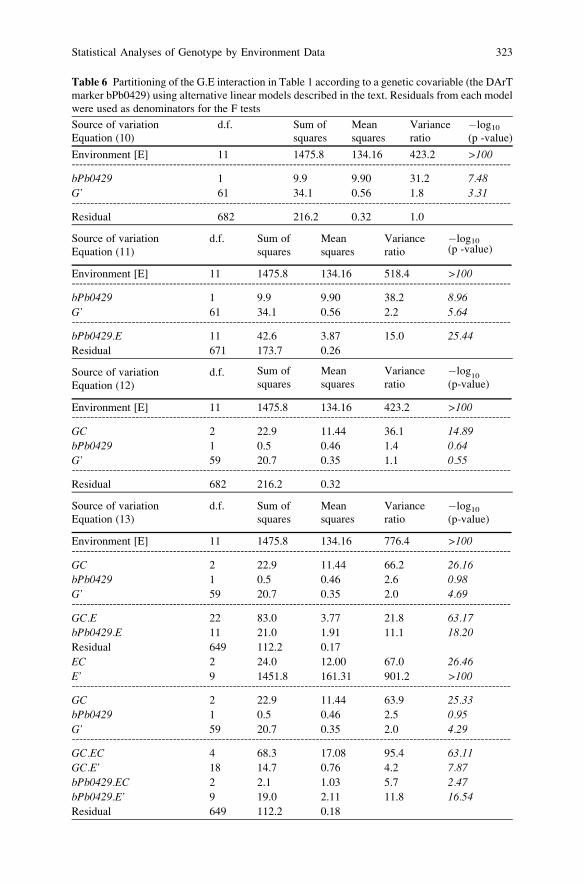
Table 6 Partitioning of the G.E interaction in Table 1 according to a genetic covariable (the DArT
marker bPb0429) using alternative linear models described in the text. Residuals from each model
were used as denominators for the F tests
Source of variation
Equation (10)
d.f. Sum of
squares
Mean
squares
Variance
ratio
�log10(p -value)
Environment [E] 11 1475.8 134.16 423.2 >100---------------------------------------------------------------------------------------------------------------------
bPb0429 1 9.9 9.90 31.2 7.48
G’ 61 34.1 0.56 1.8 3.31---------------------------------------------------------------------------------------------------------------------
Residual 682 216.2 0.32 1.0
Source of variation
Equation (11)
d.f. Sum of
squares
Mean
squares
Variance
ratio
�log10(p -value)
Environment [E] 11 1475.8 134.16 518.4 >100---------------------------------------------------------------------------------------------------------------------
bPb0429 1 9.9 9.90 38.2 8.96
G’ 61 34.1 0.56 2.2 5.64---------------------------------------------------------------------------------------------------------------------
bPb0429.E 11 42.6 3.87 15.0 25.44
Residual 671 173.7 0.26
Source of variation
Equation (12)
d.f. Sum of
squares
Mean
squares
Variance
ratio
�log10
(p-value)
Environment [E] 11 1475.8 134.16 423.2 >100---------------------------------------------------------------------------------------------------------------------
GC 2 22.9 11.44 36.1 14.89
bPb0429 1 0.5 0.46 1.4 0.64
G’ 59 20.7 0.35 1.1 0.55---------------------------------------------------------------------------------------------------------------------
Residual 682 216.2 0.32
Source of variation
Equation (13)
d.f. Sum of
squares
Mean
squares
Variance
ratio
�log10(p-value)
Environment [E] 11 1475.8 134.16 776.4 >100---------------------------------------------------------------------------------------------------------------------
GC 2 22.9 11.44 66.2 26.16
bPb0429 1 0.5 0.46 2.6 0.98
G’ 59 20.7 0.35 2.0 4.69---------------------------------------------------------------------------------------------------------------------
GC.E 22 83.0 3.77 21.8 63.17
bPb0429.E 11 21.0 1.91 11.1 18.20
Residual 649 112.2 0.17
EC 2 24.0 12.00 67.0 26.46
E’ 9 1451.8 161.31 901.2 >100---------------------------------------------------------------------------------------------------------------------
GC 2 22.9 11.44 63.9 25.33
bPb0429 1 0.5 0.46 2.5 0.95
G’ 59 20.7 0.35 2.0 4.29---------------------------------------------------------------------------------------------------------------------
GC.EC 4 68.3 17.08 95.4 63.11
GC.E’ 18 14.7 0.76 4.2 7.87
bPb0429.EC 2 2.1 1.03 5.7 2.47
bPb0429.E’ 9 19.0 2.11 11.8 16.54
Residual 649 112.2 0.18
Statistical Analyses of Genotype by Environment Data 323
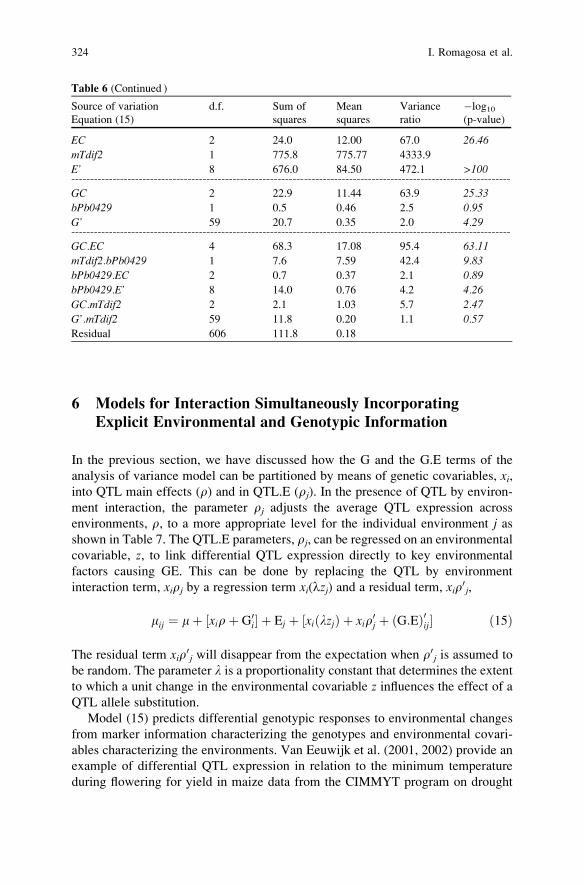
6 Models for Interaction Simultaneously Incorporating
Explicit Environmental and Genotypic Information
In the previous section, we have discussed how the G and the G.E terms of the
analysis of variance model can be partitioned by means of genetic covariables, xi,into QTL main effects (r) and in QTL.E (rj). In the presence of QTL by environ-
ment interaction, the parameter rj adjusts the average QTL expression across
environments, r, to a more appropriate level for the individual environment j asshown in Table 7. The QTL.E parameters, rj, can be regressed on an environmental
covariable, z, to link differential QTL expression directly to key environmental
factors causing GE. This can be done by replacing the QTL by environment
interaction term, xirj by a regression term xi(lzj) and a residual term, xir0j,
mij ¼ mþ ½xirþ G0i� þ Ej þ ½xiðlzjÞ þ xir0j þ ðG:EÞ0ij� ð15Þ
The residual term xir0j will disappear from the expectation when r0j is assumed to
be random. The parameter l is a proportionality constant that determines the extent
to which a unit change in the environmental covariable z influences the effect of aQTL allele substitution.
Model (15) predicts differential genotypic responses to environmental changes
from marker information characterizing the genotypes and environmental covari-
ables characterizing the environments. Van Eeuwijk et al. (2001, 2002) provide an
example of differential QTL expression in relation to the minimum temperature
during flowering for yield in maize data from the CIMMYT program on drought
Table 6 (Continued )
Source of variation
Equation (15)
d.f. Sum of
squares
Mean
squares
Variance
ratio
�log10(p-value)
EC 2 24.0 12.00 67.0 26.46
mTdif2 1 775.8 775.77 4333.9
E’ 8 676.0 84.50 472.1 >100---------------------------------------------------------------------------------------------------------------------
GC 2 22.9 11.44 63.9 25.33
bPb0429 1 0.5 0.46 2.5 0.95
G’ 59 20.7 0.35 2.0 4.29---------------------------------------------------------------------------------------------------------------------
GC.EC 4 68.3 17.08 95.4 63.11
mTdif2.bPb0429 1 7.6 7.59 42.4 9.83
bPb0429.EC 2 0.7 0.37 2.1 0.89
bPb0429.E’ 8 14.0 0.76 4.2 4.26
GC.mTdif2 2 2.1 1.03 5.7 2.47
G’.mTdif2 59 11.8 0.20 1.1 0.57
Residual 606 111.8 0.18
324 I. Romagosa et al.
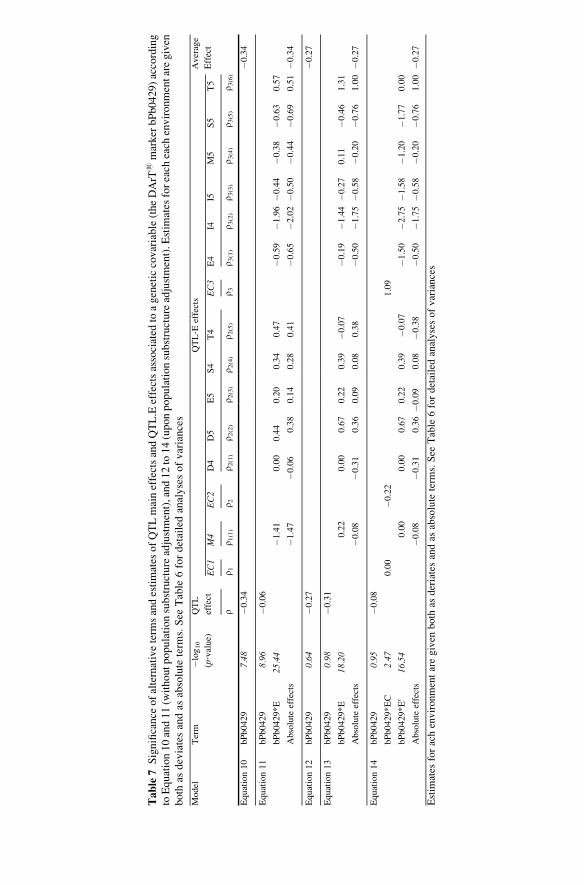
Table7
Significance
ofalternativeterm
sandestimates
ofQTLmaineffectsandQTL.E
effectsassociated
toageneticcovariable(theDArT
1marker
bPb0429)according
toEquation10and11(w
ithoutpopulationsubstructure
adjustment),and12to14(uponpopulationsubstructure
adjustment).E
stim
ates
foreach
each
environmentaregiven
both
asdeviatesandas
absolute
term
s.See
Table
6fordetailedanalysesofvariances
Model
Term
�log10
(p‐value)
QTL
effect
QTL‐E
effects
Average
Effect
EC1
M4
EC2
D4
D5
E5
S4
T4
EC3
E4
I4I5
M5
S5
T5
rr 1
r 1(1)
r 2r 2
(1)
r 2(2)
r 2(3)
r 2(4)
r 2(5)
r 3r 3
(1)
r 3(2)
r 3(3)
r 3(4)
r 3(5)
r 3(6)
Equation10
bPb0429
7.48
�0.34
�0.34
Equation11
bPb0429
8.96
�0.06
bPb0429*E
25.44
�1.41
0.00
0.44
0.20
0.34
0.47
�0.59
�1.96
�0.44
�0.38
�0.63
0.57
Absolute
effects
�1.47
�0.06
0.38
0.14
0.28
0.41
�0.65
�2.02
�0.50
�0.44
�0.69
0.51
�0.34
Equation12
bPb0429
0.64
�0.27
�0.27
Equation13
bPb0429
0.98
�0.31
bPb0429*E
18.20
0.22
0.00
0.67
0.22
0.39
�0.07
�0.19
�1.44
�0.27
0.11
�0.46
1.31
Absolute
effects
�0.08
�0.31
0.36
0.09
0.08
0.38
�0.50
�1.75
�0.58
�0.20
�0.76
1.00
�0.27
Equation14
bPb0429
0.95
�0.08
bPb0429*EC
2.47
0.00
�0.22
1.09
bPb0429*E0
16.54
0.00
0.00
0.67
0.22
0.39
�0.07
�1.50
�2.75
�1.58
�1.20
�1.77
0.00
Absolute
effects
�0.08
�0.31
0.36
�0.09
0.08
�0.38
�0.50
�1.75
�0.58
�0.20
�0.76
1.00
�0.27
Estim
ates
forachenvironmentaregiven
both
asderiatesandas
absolute
term
s.See
Table6fordetailedanalysesofvariances
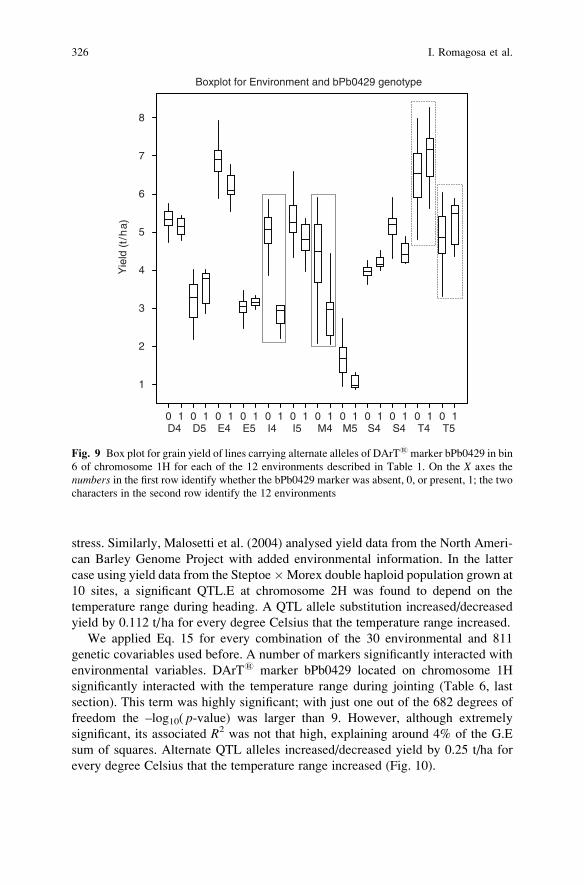
stress. Similarly, Malosetti et al. (2004) analysed yield data from the North Ameri-
can Barley Genome Project with added environmental information. In the latter
case using yield data from the Steptoe�Morex double haploid population grown at
10 sites, a significant QTL.E at chromosome 2H was found to depend on the
temperature range during heading. A QTL allele substitution increased/decreased
yield by 0.112 t/ha for every degree Celsius that the temperature range increased.
We applied Eq. 15 for every combination of the 30 environmental and 811
genetic covariables used before. A number of markers significantly interacted with
environmental variables. DArT1 marker bPb0429 located on chromosome 1H
significantly interacted with the temperature range during jointing (Table 6, last
section). This term was highly significant; with just one out of the 682 degrees of
freedom the –log10( p-value) was larger than 9. However, although extremely
significant, its associated R2 was not that high, explaining around 4% of the G.E
sum of squares. Alternate QTL alleles increased/decreased yield by 0.25 t/ha for
every degree Celsius that the temperature range increased (Fig. 10).
Boxplot for Environment and bPb0429 genotype
8
6
4
2
7
3
1
0 1 0 1 0 1 0 1 0 1 0 1 0 1 0 1 0 1 0 1 0 1 0 1
5
Yie
ld (
t/h
a)
D4 D5 E4 E5 I4 I5 M4 M5 S4 S4 T4 T5
Fig. 9 Box plot for grain yield of lines carrying alternate alleles of DArT1marker bPb0429 in bin
6 of chromosome 1H for each of the 12 environments described in Table 1. On the X axes the
numbers in the first row identify whether the bPb0429 marker was absent, 0, or present, 1; the two
characters in the second row identify the 12 environments
326 I. Romagosa et al.
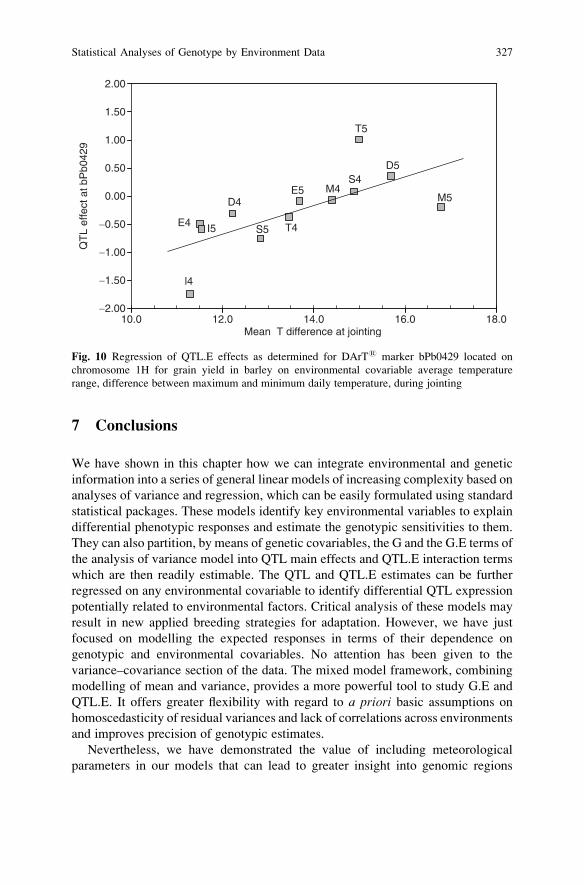
7 Conclusions
We have shown in this chapter how we can integrate environmental and genetic
information into a series of general linear models of increasing complexity based on
analyses of variance and regression, which can be easily formulated using standard
statistical packages. These models identify key environmental variables to explain
differential phenotypic responses and estimate the genotypic sensitivities to them.
They can also partition, by means of genetic covariables, the G and the G.E terms of
the analysis of variance model into QTL main effects and QTL.E interaction terms
which are then readily estimable. The QTL and QTL.E estimates can be further
regressed on any environmental covariable to identify differential QTL expression
potentially related to environmental factors. Critical analysis of these models may
result in new applied breeding strategies for adaptation. However, we have just
focused on modelling the expected responses in terms of their dependence on
genotypic and environmental covariables. No attention has been given to the
variance–covariance section of the data. The mixed model framework, combining
modelling of mean and variance, provides a more powerful tool to study G.E and
QTL.E. It offers greater flexibility with regard to a priori basic assumptions on
homoscedasticity of residual variances and lack of correlations across environments
and improves precision of genotypic estimates.
Nevertheless, we have demonstrated the value of including meteorological
parameters in our models that can lead to greater insight into genomic regions
−2.00
−1.50
−1.00
−0.50
0.00
0.50
1.00
1.50
2.00
10.0Mean T difference at jointing
QT
L ef
fect
at b
Pb0
429
D4E5 M4
S4
T5
D5
M5
E4 I5
D4E5 M4
S4
T5
D5
M5
E4 I5
D4
T4
E5 M4S4
T5
D5
M5
E4
l4
I5
12.0 14.0 16.0 18.0
S5
Fig. 10 Regression of QTL.E effects as determined for DArT1 marker bPb0429 located on
chromosome 1H for grain yield in barley on environmental covariable average temperature
range, difference between maximum and minimum daily temperature, during jointing
Statistical Analyses of Genotype by Environment Data 327
underlying interactions with the environment. This has been achieved despite a
common assignment of the onset of jointing and senescence for all genotypes under
study. As there is genetic variation in the duration of the jointing and grain-filling
growth phases, we expect that inclusion of genotypic specific jointing and grain
filling times as genetic covariables will improve the fit of our models.
Acknowledgements Contribution of the other partners of the EU FP5 INCO-MED project ‘Mapping
Adaptation of Barley to Droughted Environments’ in assembling this data set is highly
appreciated, namely, Salvatore Ceccarelli and Stefania Grando from ICARDA, Syria; Michele
Stanca from the Istituto Sperimentale per la Cerealicoltura, Italy; Jose Luis Molina-Cano and
Alexander Pswarayi from the Centre UdL-IRTA, Spain; Taner Akar from the Central Research for
Field Crops, Turkey; Adnan Al-Yassin from NCARTT, Jordan; Abdelkader Benbelkacem from
ITGC, Algeria; Mohammed Karrou and Hassan Ouabbou from INRA, Morocco; Nicola Pecchioni
and Enrico Francia from the Universita di Modena e Reggio Emilia, Italy; Wafaa Choumane from
Tishreen University, Latakia, Syria; and Jordi Bort and Jose Luis Araus from the University of
Barcelona. We also want to express our gratitude to Jordi Comadran, Joanne Russell from SCRI
for providing the marker data used for association mapping and to Christine Hackett from BioSS
for fruitful statistical discussions. The above work was funded by the European Union-INCO-
MED program (ICA3-CT2002-10026). The Centre UdL-IRTA forms part of the Centre
CONSOLIDER on Agrigenomics and acknowledges partial funding from grant AGL2005-
07195-C02-02 from the Spanish Ministry of Science and Education. Fred van Eeuwijk wants to
acknowledge funding of the Generation Challenge Program (project G4007.09: Methodology and
software development for marker-trait association analyses).
References
Annicchiarico, P. (2002) Genotype x Environment Interactions – Challenges and Opportunities for
Plant Breeding and Cultivar Recommendations. Food and Agriculture Organization of the
United Nations, Rome.
Boer, M., Wright, D. Feng, L., Podlich, D., Luo, L., Cooper, M. and van Eeuwijk, F.A. (2007)
A mixed model QTL analysis for multiple environment trial data using environmental covari-
ables for QTLxE, with an example in maize. Genetics 177, 1801–1813.
Comadran, J., Russell, J.R., van Eeuwijk, F., Ceccarelli, S., Grando, S., Stanca, A.M., Francia, E.,
Pecchioni., N., Akar, T., Al-Yassin, A., Benbelkacem, A., Choumane, W.,Ouabbou, H., Bort,
J., Araus, J.L., Pswarayi, A., Romagosa, I., Hackett, C.A. and Thomas, W.T.B. (2008)
Mapping adaptation of barley to droughted environments. Euphytica 161, 35–45.
Cooper, M. and Hammer, G.L. (Eds.) (1996) ‘Plant Adaptation and Crop Improvement’. CAB
International, Wallingford, UK.
Corsten, L.C.A. and Denis, J.B. (1990) Structuring interaction in two-way tables by clustering.
Biometrics 46, 207–215.
Crossa, J. and Cornelius, P. (2002) Linear–bilinear models for the analysis of genotype–environment
interaction. In: Kang, M.S. (Ed.) Quantitative genetics, genomics and plant breeding.
pp. 305–322. CAB International, Wallingford, UK.
Denis, J.B. (1988) Two-way analysis using covariates. Statistics 19, 123–132.
Denis, J.B. and Gower, J.C. (1996) Asymptotic confidence regions for biadditive models: inter-
preting genotype-environment interactions. Applied Statistics 45, 479–492.
328 I. Romagosa et al.
Falush, D., Stephens, M., and Pritchard, J.K. (2003) Inference of population structure: Extensions
to linked loci and correlated allele frequencies. Genetics, 164, 1567–1587.
Falush, D., Stephens, M., and Pritchard, J.K. (2007) Inference of population structure using
multilocus genotype data: dominant markers and null alleles. Molecular Ecology Notes 7,
574–578.
Finlay, K.W. and Wilkinson, G.N. (1963) The analysis of adaptation in a plant breeding
programme. Australian Journal of Agricultural Research 14, 742–754.
Fox, P.N., Crossa, J. and Romagosa, I. (1997) Multi-environment testing and genotype environ-
ment interaction. In: R.A. Kempton and P.N. Fox (Eds.) Statistical Methods for Plant Variety
Evaluation. pp. 117–137. Chapman and Hall, London.
Gabriel, K.R. (1978) Least squares approximation of matrices by additive and multiplicative
models. Journal of the Royal Statistical Society, Series B 40, 186–196.
Gabriel, K.R. (1998) Generalised bilinear regression. Biometrika 85, 689–700.
Gabriel, K.R. and Zamir, S. (1979) Lower rank approximations of matrices by least squares with
any choice of weights. Technometrics, 21, 489–498.
Gauch, H.G. (1988) Model selection and validation for yield trials with interaction. Biometrics, 44,
705–715.
Gauch, H.G. (1992) Statistical Analysis of Regional Yield Trials. Elsevier, Amsterdam.
Gauch, H.G. (2006) Statistical Analysis of Yield Trials by AMMI and GGE. Crop Science, 46,
1488–1500.
Gollob, H.F. (1968) A statistical model which combines features of factor analysis and analysis of
variance techniques. Psychometrika, 33, 73–115.
Kang, M.S. (Ed.). (1990) Genotype-By-Environment Interaction and Plant Breeding. Louisiana
State University, Baton Rouge, Louisiana.
Kang, M.S. (1998) Using genotype-by-environment interaction for crop cultivar development.
Advances in Agronomy, 62, 199–252.
Kang, M.S. and Gauch, H.G. (1996) Genotype by Environment Interaction: New Perspectives.
CRC Press, Boca Raton, FL.
Kempton, R.A. (1984) The use of biplots in interpreting variety by environment interactions
Journal of Agricultural, 103, 123–135.
Kempton, R.A. and Fox, P.N. (1997) Statistical Methods for Plant Variety Evaluation. Chapman
and Hall, London.
Kleinhofs, A. and Han, F. (2002) Molecular Mapping of the Barley Genome. In: Slafer G.A.,
Molina-Cano, J.L., Savin, R., Araus, J.L. and Romagosa, I. (Eds.) Barley Science: Recent
Advances from Molecular Biology to Agronomy of Yield and Quality. pp. 31–63. Haworth
Pres, Binghamton, NY.
Kleinhofs, A., Kudrna, D.A. and Matthews, D. (1998) Co-ordinators report: Integrating
barley molecular and morphological/physiological marker maps. Barley Genetics Newsletter,
28, 89–91.
Li, J. and Ji, L. (2005) Adjusting multiple testing in multilocus analyses using the eigenvalues of a
correlation matrix. Heredity, 95, 221–227.
Lynch, M. and Walsh, J.B. (1998) ‘Genetics and analysis of quantitative traits’. Sinauer Associ-
ates, Sunderland, Massachusetts.
Malosetti, M., Voltas, J., Romagosa, I., Ullrich, S.E. and van Eeuwijk, F.A. (2004) Mixed models
including environmental variables for studying QTL by environment interaction. Euphytica,
137, 139–145.
Mandel, J. (1969) The partitioning of interaction in analysis of variance. J Res NBS 73B, 309–328.
Paterson, A.H. (Ed.) (1998) Molecular Dissection of Complex Traits. CRC Press., Boca Raton, FL.
Payne, R.W., Harding, S.A., Murray, D.A., Soutar, D.M., Baird, D.B., Welham, S.J., Kane, A.F.,
Gilmour, A.R., Thompson, R., Webster, R., Tunnicliffe, E., Wilson, G. (2006) GenStat release
9 reference manual, part 2 directives. VSN International, Hemel Hempstead, UK.
Piepho, H.P. (1997) Analyzing genotype-environment data by mixed models with multiplicative
effects. Biometrics 53, 761–766.
Statistical Analyses of Genotype by Environment Data 329
Piepho, H.P. (2000) A mixed model approach to mapping quantitative trait loci in barley on the
basis of multiple environment data. Genetics 156, 2043–2050.
Piepho, H.P. and Pillen, K. (2004) Mixed modeling for QTL x environment interaction analysis.
Euphytica 137, 147–153.
Pritchard, J. K., Stephens, M. and Donnelly, P. (2000) Inference of population structure using
multilocus genotype data. Genetics 155, 945–959.
Pswarayi, A., van Eeuwijk, F., Ceccarelli, S., Grando, S., Comadran, J., Russell, J.R., Stanca,
A.M., Francia, E., Pecchioni, N., Akar, T., Al-Yassin, A., Benbelkacem, A., Choumane, W.,
Karrou, M., Ouabbou, H., Bort, J., Araus, J.L., Molina-Cano, J.L., Thomas, W.T.B., and
Romagosa, I. (2008) Barley adaptation and improvement in the Mediterranean basin. Plant
Breeding 127, 554–556.
Romagosa, I. and Fox, P.N. (1993) Genotype-environment interaction and adaptation. In:
Hayward, M.D., Bosemark, N.O., and Romagosa, I. (Eds.) Plant Breeding, Principles and
Prospects. Pp. 373–390. Chapman and Hall, London.
Russell, J., Booth. A., Fuller, J., Harrower, B., Hedley, P., Machray, G., and Powell, W. (2004) A
comparison of sequence-based polymorphism and haplotype content in transcribed and anon-
ymous regions of the barley genome. Genome 47, 389–398.
Slafer, G.A., Molina-Cano, J.L., Savin, R., Araus, J.L. and Romagosa, I. (Eds.) (2002) Barley
Science: Recent Advances from Molecular Biology to Agronomy of Yield and Quality.
Haworth Press, Binghamton, NY.
Smith, A.B. (1999) Multiplicative mixed models for the analysis of multi-environment trial data.
PhD thesis, Dpt of Statistics, University of Adelaide, South Australia.
Smith, A.B., Cullis, B.R. and Thompson, R. (2005) The analysis of crop cultivar breeding and
evaluation trials: an overview of current mixed model approaches; Journal of Agricultural
Science Cambridge 143, 1–14.
Spiertz, J.H.J., Struik, P.C. and van Laar, H.H. (Eds.) (2007) Scale and Complexity in Plant
Systems Research. Gene-Plant-Crop relations. Wageningen UR Frontier Series. Vol 21.
Springer, Dordrecht, The Netherlands.
van Eeuwijk, F.A. (1995a) Linear and bilinear models for the analysis of multi-environment trials:
I An inventory of models. Euphytica 84, 1–7.
van Eeuwijk, F.A. (1995b) Multiplicative interaction in generalized linear models. Biometrics 51,
1017–1032.
van Eeuwijk, F.A. (1996) Between and Beyond Additivity and Non-Additivity: the Statistical
Modelling of Genotype by Environment Interaction in Plant Breeding. PhD Thesis. Wagenin-
gen, The Netherlands.
van Eeuwijk, F.A. (2006) Genotype by environment interaction: basics and beyond. In: Lamkey,
K. and Lee, M. (Ed.) Plant Breeding: The Arnell Hallauer International Symposium, pp. 155–
170. Blackwell Publishing, Oxford.
van Eeuwijk, F.A. Crossa, J., Vargas, M. and Ribaut, J.M. (2001) Variants of factorial regression
for analysing QTL by environment interaction. In: Gallais, A., Dillmann, C. and Goldringer, I.
(Eds.) ‘Eucarpia, Quantitative Genetics and Breeding Methods: the way Ahead’. pp. 107–116.
INRA Editions Versailles Les Colloques series 96.
van Eeuwijk, F.A., Crossa, J., Vargas, M. and Ribaut, J.M. (2002) Analysing QTL by environment
interaction by factorial regression, with an application to the CIMMYT drought and low
nitrogen stress programme in maize. In: Kang, M.S. (Ed.) ‘Quantitative Genetics, Genomics
and Plant Breeding’. pp. 245–256. CAB International, Wallingford, UK.
van Eeuwijk, F.A., Denis, J.B. and Kang, M.S. (1996) Incorporating additional information on
genotypes and environments in models for two-way genotype by environment tables. In Kang,
M.S. and Gauch H.G. (Eds.) ‘Genotype-by-Environment Interaction’. pp. 15–50. CRC Press,
Boca Raton, FL.
van Eeuwijk, F.A., Keizer, L.C.P. and Bakker, J.J. (1995) Linear and bilinear models for the
analysis of multi-environment trials. II. An application to data from the Dutch Maize Variety
Trials. Euphytica 84, 9–22.
330 I. Romagosa et al.
van Eeuwijk, F.A., Malosetti, M., Yin, X., Struik, P.C. and Stam, P. (2005) Statistical models for
genotype by environment data; From conventional ANOVA models to eco-physiological QTL
models. Australian Journal of Agricultural Research 56, 883–894.
van Eeuwijk, F.A., Malosetti, M. and Boer, M.P. (2007) Modelling The Genetic Basis Of
Response Curves Underlying Genotype By Environment Interaction. In: Spiertz, J.H.J., Struik,
P.C. and van Laar, H.H. (Eds.) Scale and Complexity in Plant Systems Research. Gene-Plant-
Crop relations. Wageningen UR Frontier Series. Vol 21. Springer, Dordrecht, The Netherlands.
Vargas, M., Crossa, J., van Eeuwijk, F.A., Ramırez, M.E. and Sayre, K. (1999) Using AMMI,
factorial regression, and partial least squares regression models for interpreting genotype
x environment interaction. Crop Science 39, 955–967.
Verbyla, A., Eckermann, P.J., Thompson, R. and Cullis, B. (2003) The analysis of quantitative trait
loci in multienvironment trials using a multiplicative mixed model. Australian Journal of
Agricultural Research 54, 1395–1408.
Voltas, J., van Eeuwijk, F., Igartua, E., Garcia del Moral, L.F., Molina-Cano, J.L. and Romagosa,
I. (2002) Genotype by Environment Interaction and Adaptation in Barley Breeding: Basic
Concepts and Methods of Analysis. In: Slafer G.A., Molina-Cano, J.L., Savin, R., Araus, J.L.
and Romagosa, I. (Eds.) Barley Science: Recent Advances from Molecular Biology to Agron-
omy of Yield and Quality. pp. 205–241. Haworth Pres. Binghamton, NY.
Voltas, J., van Eeuwijk, F.A., Sombrero, A., Lafarga, A., Igartua, E. and Romagosa I (1999a)
Integrating statistical and ecophysiological analysis of genotype by environment interaction for
grain filling of barley in Mediterranean areas I. Individual grain weight. Field Crops Research
62, 63–74.
Voltas, J., van Eeuwijk, F.A., Araus, J.L. and Romagosa, I. (1999b) Integrating statistical and
ecophysiological analysis of genotype by environment interaction for grain filling of barley in
Mediterranean areas II. Grain growth. Field Crops Research 62, 75–84.
Wenzl, P., Li, H., Carling, J., Zhou, M., Raman, H., Paul, E., Hearnden, P., Maier, C., Xia, L.,
Caig, V., Ovesna, J., Cakir, M., Poulsen, D., Wang, J., Raman, R., Smith, K.P, Muehlbauer,
G.P, Chalmers, K.J., Kleinhofs, A., Huttner, E. and Kilian, A. (2006) A high-density consensus
map of barley linking DArT markers to SSR, RFLP and STS loci and agricultural traits. BMC
Genomics 7, 206.
Yan, W. and Kang, M.S. (2003) GGE Biplot Analysis: A Graphical Tool for Breeders, Geneticists,
and Agronomists. CRC Press. Boca Raton, FL.
Yan, W., Cornelius, P.L., Crossa, J. and Hunt, L.A. (2001) Two Types of GGE Biplots for
Analyzing Multi-Environment Trial Data. Crop Science 41:656–663.
Yan, W., Hunt. L.A., Sheng, Q. and Szlavnics, Z. (2000) Cultivar evaluation and mega-environment
investigation based on the GGE biplot. Crop Science 40, 597–605.
Yan, W., Kang, M.S., Baoluo Ma B, Woods, S. and Cornelius, P.L. (2007) GGE Biplot vs. AMMI
Analysis of Genotype-by-Environment Data. Crop Science 47, 643–653.
Statistical Analyses of Genotype by Environment Data 331
Breeding for Quality Traits in Cereals: A
Revised Outlook on Old and New Tools
for Integrated Breeding
Lars Munck
Abstract Breeding for complex multigenic phenotypic quality characters in cer-
eals by chemical analyses and functional pilot tests is traditionally a slow and
expensive process. The development of new instrumental screening methods for
complex quality traits evaluated by multivariate data analysis has during the last
decades revolutionised the economy and scale in breeding for quality. The tradi-
tional explorative plant breeding view is pragmatically oriented to manipulate thewhole plant and its environment by ‘‘top down’’ observation and selection to
improve complex traits, such as yield and baking quality. The new molecular and
biochemical techniques are promising in increasing the genetic variation by break-
ing the barriers of species and in explaining the chemical and genetic basis of
quality. In molecular biology traits are seen ‘‘bottom up’’ from the genome per-
spective, for example, to find genetic markers by quantitative trait loci (QTL). To
improve efficiency the plant breeder can now complement his classical tools of
observation by overviewing the whole physical–chemical composition of the seed
by near infrared spectroscopy (NIRS) from a Principal Component Analysis (PCA)
score plot to connect to genetic, (bio)chemical, and technological data through
pattern recognition data analysis (chemometrics). Genes and genotypes can also be
directly evaluated as imprints in NIR spectra. Recent applications in NIR technolo-
gy by ‘‘data breeding’’ demonstrate manual selection for complex high-quality
traits and seed genotypes directly from a PCA score plot. New equipment makes
automatic analysis and sorting for complex quality traits possible both in bulk and
on single seed basis. Seed sorting can be used directly in seed production and to
speed up selection for quality traits in early generations of plant breeding and to
document genetic diversity in gene banks.
L. Munck
University of Copenhagen, Faculty of Life Sciences, Department of Food Science, Quality and Tech-
nology, Spectroscopy and Chemometrics Group, Frederiksberg, Denmark, e-mail: [email protected]
M.J. Carena (ed.), Cereals,DOI: 10.1007/978-0-387-72297-9, @ Springer Science + Business Media, LLC 2009 333
1 Introduction: The Need for an Upgrading of the Classical
Holistic Tools of the Plant Breeder to Breed for Complex
Quality Traits
Until recently, the plant breeder was an integrated member of the agricultural
food producing society where the whole production chain could be overviewed
‘‘top down,’’ including plant husbandry, cleaning, milling, cooking, baking, and
brewing. Information from all these operations in food production and utilization
were self-evidently related. They were integrated to the immediate sensory benefits
of taste, smell, and mouth feel and to the longer perspective of satiety, health, and
growth of children. The total phenomenological experience of society could be
fixed into language, equipment and habits and expressed in selected cereal cultivars
with specific advantages to be exploited and perfected in future generations.
The invention of man-made crossbreeding and artificial fertilizers to fix nitrogen
from the air, laid the foundation to the first generation of modern plant breeders thatgreatly increase yield and quality in cereal production throughout the twentieth
century (Olsson, 1986). However, it takes at least 10–15 years to produce a new
variety by conventional breeding. A new second generation of ‘‘plant breeders’’
(Anderson, 1996) are, therefore, suggesting that one should design the biological
diversity needed ‘‘bottom up’’ from the deoxyribonucleic acid (DNA) by biochem-
istry, genetic engineering, and gene transfer (Shewry and Casey, 1999; Horvath
et al., 2002), rather than searching for solutions pragmatically in gene banks and in
the field by expensive selection. Along these lines, molecular genetic screening
methods by DNA markers through quantitative trait loci (QTL) (Arus and
Gonzales, 1993) have been developed to breed for the more and less complex
quality traits in practice. However, these methods have hereto not been cost
effective enough (Thomas, 2002) to be used directly in the breeding work for
selection of complex quality traits in great plant numbers.
The plant breeder’s task is to produce a whole functional plant which combines
high and reliable yield with quality. One should therefore ask how holistic plantbreeding at all can absorb, combine, and prioritize the great many fragments ofknowledge regarding, for example, gene sequences and proteins, characterized bya precise but limited scope, that are produced by so many skilled scientists?
2 Analyses and Data Models in Screening for Simple
and Complex Quality Traits and the Genes Behind
2.1 Screening and Validation Methods for Technologicaland Physical–Chemical Quality
The classical maize breeding work in Illinois selecting for high and low protein and
oil since the 1890s (Dudley and Lambert, 1969), demonstrates the great genetic
334 L. Munck
flexibility of cross-fertilized populations and the interdependence in seed synthesis
between the different chemical components locked in within the limits of the seed
coat. Because protein and oil has 2.1 and 2.5 times the energy costs of starch for
plant dry-matter (DM) production, selection for yield indirectly results in high
starch, low protein, and oil composition of seeds (MacKey, 1981). Breeding for
yield is thus not quality neutral. Behind the traditional seemingly univariate coarse,
chemical criteria protein, oil, starch, crude fiber, and ash lie a complex abundance
of chemical components that are analyzed by chemical separation methods, such as
electrophoresis, extraction, and (gas) chromatography for a deeper definition of
quality. Most of these analyses are because of costs not directly included in the
selection work but are rather used by breeders, scientists, and the industry for an
explanatory evaluation of the final products – the marketed varieties.
From a physiological and sampling point of view the individual seed should be
considered as the ultimate unit behind grain composition. It is now possible to
analyze 300 g of seeds in 3 min on an individual basis by image analysis gaining six
form factors and three colors (Graincheck, Foss A/S, Hillerød, Denmark). A
destructive seed hardness measurement instrument also analyzes seed width and
water content of individual seeds (SKCS 4100, Perten Instruments, Inc., Reno, NV,
USA). These two instruments are of great use in defining the physical seed quality
(Sect. 7.3) including risk assessment for fungal infection.
A range of complex functional food analyses aims at visualizing the technologi-
cal trait important for industrial use of the final product. This can be done by
miniature versions of dehullers, rice polishers, roller mills, sifters, pasta extruders,
cookers, amylographs, wheat dough quality instruments (farinographs, mixographs,
extensiographs), baking machines, micro maltings, and pilot brewing facilities
(Wrigley and Morris, 1996; Bergman et al., 2003).
In earlier generations, small sample screening physical–chemical screening
methods are used, such as the falling number test (for field germination), the Zeleny
sedimentation test (for wheat protein quality), and the alkali test (for rice cooking
quality).
2.2 Nondestructive Screening for Quality Traits and ImprovedGenotypes by NIR Spectroscopy Evaluated by PatternRecognition Data Analysis (Chemometrics)
The introduction of near infrared spectroscopy (NIRS) since 1973 (Williams, 2002;
Møller Jespersen and Munck, 2008), for prediction of simple and complex seed
quality characteristics, has fundamentally changed the economy of quality assess-
ment for both plant breeders and the grain and food industries. The NIRS instru-
ments come in two principal versions: near infrared transmission (NIT) 850–1,050
nm applicable to whole seeds (in batches or single) and near infrared reflection
(NIR) 400–2,500 nm working on milled seeds also including the visual spectral
area. Both NIT and NIR spectra give a reproducible and informative log 1/R
Breeding for Quality Traits in Cereals 335
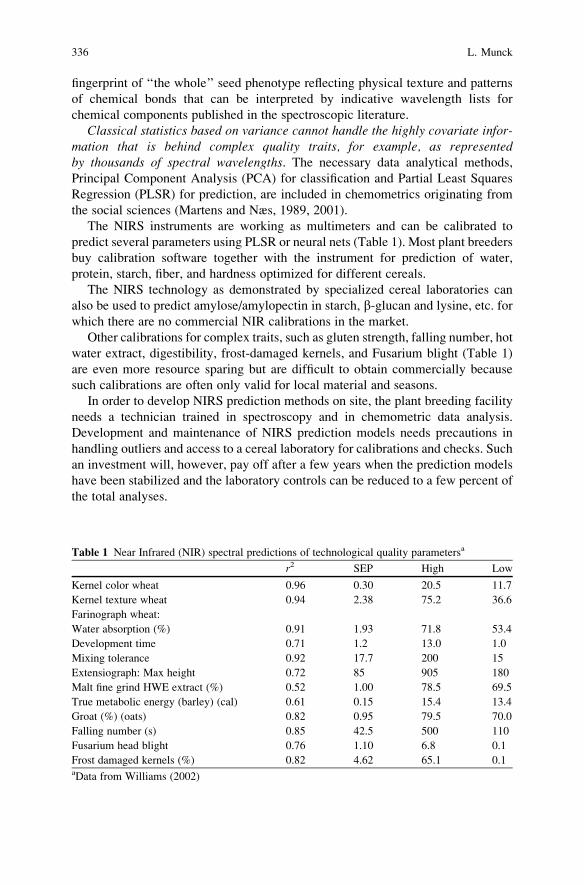
fingerprint of ‘‘the whole’’ seed phenotype reflecting physical texture and patterns
of chemical bonds that can be interpreted by indicative wavelength lists for
chemical components published in the spectroscopic literature.
Classical statistics based on variance cannot handle the highly covariate infor-mation that is behind complex quality traits, for example, as representedby thousands of spectral wavelengths. The necessary data analytical methods,
Principal Component Analysis (PCA) for classification and Partial Least Squares
Regression (PLSR) for prediction, are included in chemometrics originating from
the social sciences (Martens and Næs, 1989, 2001).
The NIRS instruments are working as multimeters and can be calibrated to
predict several parameters using PLSR or neural nets (Table 1). Most plant breeders
buy calibration software together with the instrument for prediction of water,
protein, starch, fiber, and hardness optimized for different cereals.
The NIRS technology as demonstrated by specialized cereal laboratories can
also be used to predict amylose/amylopectin in starch, b-glucan and lysine, etc. for
which there are no commercial NIR calibrations in the market.
Other calibrations for complex traits, such as gluten strength, falling number, hot
water extract, digestibility, frost-damaged kernels, and Fusarium blight (Table 1)
are even more resource sparing but are difficult to obtain commercially because
such calibrations are often only valid for local material and seasons.
In order to develop NIRS prediction methods on site, the plant breeding facility
needs a technician trained in spectroscopy and in chemometric data analysis.
Development and maintenance of NIRS prediction models needs precautions in
handling outliers and access to a cereal laboratory for calibrations and checks. Such
an investment will, however, pay off after a few years when the prediction models
have been stabilized and the laboratory controls can be reduced to a few percent of
the total analyses.
Table 1 Near Infrared (NIR) spectral predictions of technological quality parametersa
r2 SEP High Low
Kernel color wheat 0.96 0.30 20.5 11.7
Kernel texture wheat 0.94 2.38 75.2 36.6
Farinograph wheat:
Water absorption (%) 0.91 1.93 71.8 53.4
Development time 0.71 1.2 13.0 1.0
Mixing tolerance 0.92 17.7 200 15
Extensiograph: Max height 0.72 85 905 180
Malt fine grind HWE extract (%) 0.52 1.00 78.5 69.5
True metabolic energy (barley) (cal) 0.61 0.15 15.4 13.4
Groat (%) (oats) 0.82 0.95 79.5 70.0
Falling number (s) 0.85 42.5 500 110
Fusarium head blight 0.76 1.10 6.8 0.1
Frost damaged kernels (%) 0.82 4.62 65.1 0.1aData from Williams (2002)
336 L. Munck
There is, however, another application of existing NIR instruments (Møller
Jespersen and Munck, 2008) for sample classification without the need for com-
mercial calibrations that requires a minimum of training and that has the potential
of being even more important than prediction of specific quality traits.
Very few, if any plant breeders are aware of that they without expensivecalibration software can use their NIR instruments as an explorative extension oftheir sight to evaluate the total physical–chemical fingerprint of seeds from theirbreeding lines as compared to high- and low-quality standard varieties grown inthe same field.
Such a classification of simple and complex quality traits by ‘‘data breeding,’’ as
demonstrated in Sects. 7.1–7.3, is possible by a PCA score plot seen on a computer
display (Martens and Næs, 1989; Munck and Møller, 2005; Munck, 2005, 2006). A
complete automation of the NIRS measurement is possible. The breeder can now
use the NIR technology in the early stages of breeding and wait with the most
expensive conventional analyses for quality until a year before the official yield
analyses.
2.3 QTL Analyses for Complex Traits Revitalizedby Chemometrics
Phenotypic data, such as NIR spectra from biological individuals, are highly
informative because they are compressible into multivariate representations rang-
ing from chemical components to complex technological traits as shown in Table 1.
The fundamental compressibility of phenotypic nature to indicate heritability
explains why plant breeding based on inspection of the whole plant phenotype
has been so successful through the pass of thousands of years as judged from the
present wealth of cultivars adapted to a great variety of uses.
Let it be no doubt. Classical analysis of variance in genetics assuming normal
distribution and free variability of variables, analyzing genes, and traits pair-wise
has been extremely successful in mapping the statistical gene by linkage maps as
confirmed at the physical low level of resolution mapping with Giemsa stain and at
the high level by DNA sequencing (Kleinhofs and Han, 2002). When DNA
technology enabled applications of multivariate restriction fragment length poly-
morphism (RFLP) and PCR markers the idea of QTL emerged based on classic
statistics of variance (Arus and Gonzales, 1993), where genes near to the markers
are correlated to more and less complex quantitative phenotypic traits.
QTL seem to function well when both the genotypic and phenotypic traits are
simple. However, the localization of a QTL is hereto only considered as approxi-
mate, as discussed by Kleinhofs and Han (2002), and a more accurate localization
should be performed by additional backcrosses. Several other researchers, such as
Thomas (2002) in barley and Darrah et al. (2003) in maize, mention several
arguments to explain why QTL are not yet widely used as a tool in plant breeding,
Breeding for Quality Traits in Cereals 337
such as lack of laboratory resources and the too limited population size applied in
crosses.
However, it now stands clear from the NIR experience (Martens and Næs, 2001)
that classical statistics cannot handle complex covariate data, because of the
distributional assumptions, which are an inseparable part of the statistical model
of variance used in the classical QTL analysis. An explorative data program that
can define gene expression unsupervised as patterns in the phenotype is thus
essential (Munck, 2007).
As discussed by Darrah et al. (2003), the QTL approach can now be revitalized
as ‘‘association genetics,’’ a term originating from medical genetics. It includes
pattern recognition data analysis now in plant genetics using data reduction by
least-squares solutions (Knott and Haley, 2000) in PCA (Wilson et al., 2004) and in
PLSR (Bjørnstad et al., 2004). The chemometric data models based on pattern
recognition are much better suited for evaluation of complex QTLs than classical
statistics based on variance.
Thus different mathematical models should be used for the gamete and zygote levels of
biological organization where classical probability statistics effective on the gene recom-
bination level in populations should be complimented by pattern recognition analysis
(chemometrics) for analyzing interactive gene expression at the phenotype level with the
biological individual as the ultimate unit. (Sects. 7.1–7.4, Munck and Møller, 2005)
Wilson et al. (2004) recently demonstrated a combination of NIR and DNA
mapping evaluated by PCA in maize.
The widening of the genetic basis by gene transfer across the barriers of species
by molecular techniques (Horvath et al., 2002; Anderson, 1996) could constitute
another turning point in plant breeding, if the sceptic arguments against genetically
modified organism (GMO) from the public can be refuted. However, transferred
genes as well as mutants often have pleiotropic side effects, for example, on yield
that cannot be foreseen. New compensating gene backgrounds have therefore to be
bred by classical pragmatic plant breeding to optimize the expression of each gene
with regard to quality without compromising yield. As will be exemplified in the
following the NIR–PCA model makes such an adaptation feasible in practice in
plant breeding on a mass scale.
2.4 Characterizing and Connecting Complex Genetic,Biochemical, and Technological Traits in CerealVariety Testing
Genetic engineering is focused on specific traits such as transformation of a gene
for heat-tolerant b-glucanase from a Bacillius sp. to barley (Horvath et al., 2002) ofpotential importance for both the feed and the brewing industries. In manipulating
complex technological traits, such as baking quality in wheat, it is difficult to be
able to predict the final result of a gene manipulation.
338 L. Munck
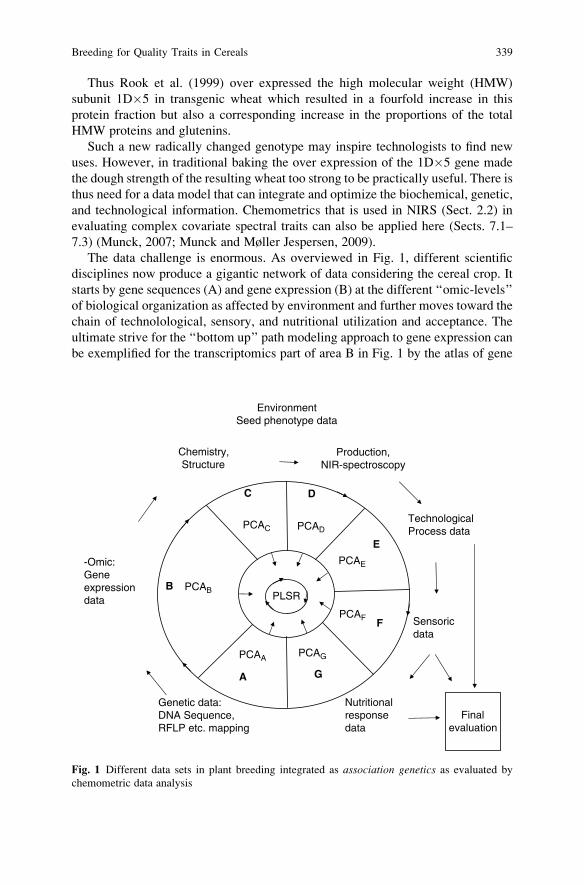
Thus Rook et al. (1999) over expressed the high molecular weight (HMW)
subunit 1D�5 in transgenic wheat which resulted in a fourfold increase in this
protein fraction but also a corresponding increase in the proportions of the total
HMW proteins and glutenins.
Such a new radically changed genotype may inspire technologists to find new
uses. However, in traditional baking the over expression of the 1D�5 gene made
the dough strength of the resulting wheat too strong to be practically useful. There is
thus need for a data model that can integrate and optimize the biochemical, genetic,
and technological information. Chemometrics that is used in NIRS (Sect. 2.2) in
evaluating complex covariate spectral traits can also be applied here (Sects. 7.1–
7.3) (Munck, 2007; Munck and Møller Jespersen, 2009).
The data challenge is enormous. As overviewed in Fig. 1, different scientific
disciplines now produce a gigantic network of data considering the cereal crop. It
starts by gene sequences (A) and gene expression (B) at the different ‘‘omic-levels’’
of biological organization as affected by environment and further moves toward the
chain of technolological, sensory, and nutritional utilization and acceptance. The
ultimate strive for the ‘‘bottom up’’ path modeling approach to gene expression can
be exemplified for the transcriptomics part of area B in Fig. 1 by the atlas of gene
Genetic data:DNA Sequence,RFLP etc. mapping
EnvironmentSeed phenotype data
-Omic:Gene expression data
Chemistry,Structure
TechnologicalProcess data
Sensoricdata
Nutritional responsedata
Production,NIR-spectroscopy
Finalevaluation
PLSRPCAB
PCAC PCAD
PCAE
PCAF
PCAGPCAA
B
C D
E
F
GA
Fig. 1 Different data sets in plant breeding integrated as association genetics as evaluated by
chemometric data analysis
Breeding for Quality Traits in Cereals 339
expression of the barley variety Morex (Druka et al., 2006). This consortium of
scientists used the Affymetrix Barley 1 GeneChip to express at least 21,439 genes
in 15 tissues at 8 developmental stages. The barley data set is now available at the
Internet. The question is now how such data may benefit the plant breeder directlyin his selection work and how it should be evaluated?
Chemometric data analysis (Fig. 1) provides a method through principal com-
ponents (PCs) to sum up in functional traits the interactions of the many chemical
and genetic entities, which science has so skillfully defined.
The use of chemometrics in wheat proteomics [two-dimensional electrophoresis
(2DE), mass spectrometry, and NIR data from gluten], to classify cultivars accord-
ing to baking quality, is reviewed by Gottlieb et al. (2004). There are in the rich
literature of cereal proteomics only a few applications (Sect. 7.3) on using chemo-
metrics to connect to other data sets according to the model in Fig. 1. The
exploratory pattern recognition data approach starts unsupervised with data reduc-tion to let the data set speak for itself. The task is to explore relationships that cannoteasily be anticipated by the usual strategy of problem reduction. The patterns of
manifest variables from the samples in the dataset are explored as a whole, forexample, by a PCA score plot with a minimum of specific assumptions. A latent,
hidden world behind data is assumed and is indirectly observed by PCs. They are
composed automatically by finding the major directions in the data set and are
characterized by combining different amounts of variables. The complex manifest
data in biology can almost always be compressed in a sequence of a few (Sects. 2–5)
latent, orthogonal PCs numbered 1,2.3, . . . according to their falling share of the
total variance of the data set (Martens and Næs, 1989). The PCs are plotted in x–yscore plots (e.g., PC1 to PC2 and PC2 to PC3) where the samples are classified
according to their score values at the PC axes. The nature of the PCs is revealed as
functional factors by introducing prior knowledge to interpret the combination of
manifest variables that are composing the PCs (Sects. 7.1–7.3). A PCA biplot
demonstrates the relationships between samples and variables.
PCAs from seven different data sets of cereal quality trait evaluation are
suggested in Fig. 1 where the compressibility of each data set into more or less
functional PCs is investigated. Multiple PCs from the data sets A–G in Fig. 1 may
communicate with each other by PLSR analysis that also is built on principal
components (Martens and Næs, 1989). It is thus possible by PLSR to validate to
what degree the same data structure is present in two or more data sets together and
to use one to predict the parameters in the other as demonstrated in Sect. 7.3. In fact
NIRS introduces a complimentary approach to System Biology (Munck, 2007;
Munck and Møller Jespersen, 2009).
In exploiting the widely different data sets outlined in Fig. 1 to back up plant
breeders, data quality is the limiting factor beside the costs of analyzes. While
protein electrophoresis (2DE) spots are quite tricky to reproduce and digitize
(Gottlieb et al., 2004), the strength in NIRS is its very high reproducibility and
physical–chemical relevance as revealed by chemometrics.
340 L. Munck
3 Quality Traits in Cereal Technology and Plant Breeding
3.1 Wheat
Today’s cultivated hexaploid bread wheat (Triticum aestivum) originates from the
fertile crescent in the Middle East since about 8000 BC. Wheat is together with
rice and maize the three major cereals in the world with a production of about
570 million tons/year (Williams, 2002). For pasta the tetraploid wheat T. turgidum(durum) is widely used. The good taste of bread from ancient wheats T. mono-coccum (diploid) and tetraploid T. dicoccum (emmer) are now increasingly enjoyed
as specialty foods in Europe and the USA (Abdel-Aal and Wood, 2005). The major
characteristics of bread wheat are: winter and spring habit, color, red or white, of
bran (testa), and degree of hardness. A special roller milling process for wheat flour
developed 150 years ago is permitting a clear-cut separation between the endo-
sperm (white, low ash flour) and the outer seed coat (bran) facilitating high volume
bread with a white bread crumb (Schofield, 1994). Sprouted kernels in the field are
detrimental to bread and pasta quality leading to increased levels of a-amylase and
other enzymes. Hard seed and high protein (gluten) content is characteristic for
special high-quality bread varieties and further supported by a dry climate. The
glassy, transparent hard wheat seed makes high starch damage in the roller milling
process and results in high water absorption of the dough and in a large bread
volume (Schofield, 1994). The hard texture of the wheat seed is due to a single gene
(Ha) in Chromosome 5D. Schofield (1994) has identified a protein – friabiline – that
is lining the surface of the starch granule. It seems to protect the granule to be cut
through when the seed is divided with a knife and is indicative for soft seeds. The
friabiline trait is firmly associated to the Ha gene.
The classical early work in the protein biochemistry of wheat by Payne et al.
(1983), clarified that the strength and elasticity of gluten is under control of
endosperm protein loci for HMV and low molecular weight (LMV), glutenines
(Glu), and gliadines (Gli). Five loci were identified located on the first and sixth
chromosomes. Since then biochemical and molecular research have described most
of the proteins in wheat and barley endosperm and identified several of the genes
and gene sequences controlling them (Shewry and Casey, 1999; Shewry, 1992;
Schofield, 1994). The genetic variation of wheat, barley, and maize has been
instrumental in this pioneering work on seed proteins also including a wide range
of barley and maize mutants. The rapidly increasing biochemical and molecular
knowledge with regard to specific proteins genes has been of great explanatory
importance for plant breeders and food technologists to choose the right varieties.
As discussed in Sects. 7.3–7.4, it is now possible to exploit this knowledge directly
in the wheat breeding work.
Breeding for Quality Traits in Cereals 341
3.2 Barley
Barley (Hordeum vulgare) is among the oldest cereals exploited by mankind with a
great adaptability to both cold temperate and hot-arid climate zones. It has tradi-
tionally been used as a food after dehulling, polishing, and milling (Bhatty, 1993).
In Japan and Korea, the whole polished barley seed is still used as a substitute for
rice. About 160 million tons of barley is produced annually worldwide about 80%
of which is used for feed and ~15% for the brewing and distilling industries
(Williams, 2002). Because of the earlier focus in the brewing industry on research,
there is now an abundance of detailed information regarding, starches, proteins,
plant hormones, enzymes, and b-glucans (Shewry, 1992; Munck, 1992a, b;
Swanston and Ellis, 2002), as well as about the estimated hereditability of traits
(Kleinhofs and Han, 2002; Ullrich, 2002), for the plant breeder and the brew
masters to exploit. As discussed in Sect. 3.1 such information is of great explanato-
ry importance to define high quality lines to be used in crosses. However, to be
exploited directly in quality breeding and in improving technology the functionalityof all these variables have to be revealed as complexes of relations. Thus a major
collection of barley seed enzymes of importance in starch synthesis, germination,
and malting is induced by the same plant hormone – gibberellic acid (Swanston and
Ellis, 2002). This implies a data reduction because all these enzymes are dependent
on the same hormone mechanism for their expression.
From the maltsters point of view, barley malt is evaluated according to 11
parameters obtained from the EBC (European Brewing Convention) wort extrac-
tion method in the laboratory. Malt quality is traditionally evaluated according to
specification limits given for each of the 11 single values. Still problems might arise
in full-scale beer production even if the malt is fulfilling all individual specifica-
tions. A PCA study on the 11 malt quality variables from a set of 186 malts (Munck,
1991), all following the specifications, revealed that malt quality should not been
evaluated as 11 independent variables but instead as three functional factors or PCsexplaining 66% of the variation namely
PC1 ‘‘Chemistry’’ – extract, wort color, soluble N in wort, Kolbach index – all
characteristic for starch content and enzyme activity,
PC2 ‘‘Physics’’ – Friability, wort b-glucan and viscosity, malt modification and
homogeneity, extract difference – all variables dependent on malt hardness, cell
wall thickness (b-glucan), and resistance toward malt modification, and
PC3 protein in malt.
The PCA score plot sorted out all malt samples from the barley variety Minerva,
which gave problems in full-scale production in spite of fulfilling the malt speci-
fications. It had a bad ‘‘chemistry’’ (PC1) value that could be detected as a specific
pattern in a PCA (PC1–PC2) score plot when all the 11 variables were evaluated
together (Munck, 1991).
The resistance toward cell wall breakdown, which is a significant part of the
‘‘physics’’ quality trait of malt modification, can be visualized as seen in a light box
342 L. Munck
by staining the endosperm cell walls of half malt seeds by calcofluor (Aastrup et al.,
1981). The b-glucan-containing cell walls are broken down by enzymes excreted
both from the germ and from the aleuron layer. A b-glucan-reduced barley mutant
with slender endosperm cell walls (Aastrup and Munck, 1984) had a faster modifi-
cation in spite of unchanged b-glucanase activity. In barleys with live embryo the
physical–chemical composition of the barley endosperm as revealed by NIT spec-
troscopy is the limiting factor (Munck and Møller, 2004) for both malt modification
rate and germination velocity (vigor). Thus a simple 1 day (vigor) to 3 days
(viability) x–y germination plot is able to predict and classify pilot malting perfor-
mance (extract and wort b-glucan) of barley varieties grown in different years. Thisexemplifies the importance of a separate representation of the main functional
criteria as simple x–y relations in evaluating quality traits by classification of
varieties from plots rather than by a single score value for malt quality as was
further discussed by Munck and Møller (2004).
3.3 Rye
Rye (Secale cereale), originating from the wild form S. montanum, has been much
later introduced in agriculture than barley and wheat (Scoles et al., 2001). The
worldwide annual production for feed and food in the late-1990s is slightly
below 30 million tons mainly in North Eastern Europe and in North America
(Williams, 2002). Rye cannot form gluten after mixing with water. Instead, the
water absorbing pentosans (arabinoxylans) are important for the baking perfor-
mance of rye bread. Rye is relatively well defined with classical genetic chromo-
some maps as well as by RFLP- and PCR-based markers (Scoles et al., 2001). The
long rye bread process needs hard work if made manually. The long shelf life of the
rye bread gives a basis for an industrial process that facilitates a wide distribution of
the products.
Rye bread production is sensitive for weather conditions because of its tendency
for precocious sprouting giving high a-amylase, protease, and pentosanase activities,
as reflected in a low falling number (viscometric test of flour). There are three loci for
a-amylase in rye (Scoles et al., 2001). The sourdough fermentation and addition of
lactic acid to the dough counteract the effects of sprouted seeds in dark rye bread, but
may not be able to suppress effects of taste and odor from damaged seeds of the final
dark rye bread (Seibel and Weipert, 2001). Rye crisp bread is especially sensitive to
sprouted seeds. New hybrid rye varieties are more resistant to sprouting and perform
well in milling and baking processes (Seibel and Weipert, 2001).
Rye flour of different granulations and whiteness are produced with a shortened
wheat roller milling process. Low extraction rye flours are mixed with wheat flour
to produce lighter form of loaf with an attractive rye flavor (Seibel and Weipert,
2001).
Breeding for Quality Traits in Cereals 343
3.4 Oats
Like many small grains mainly used for feed, oats (Avena sativa,) production has
decreased due to competition with the more high-yielding cereals, wheat and maize
(Burrows, 1986). Around 30 million tons are produced worldwide as an average
(Williams, 2002). In later years oats food products have been in focus as a dietary
food because of their attractive taste combined with a high-quality dietary fiber (b-glucan; McCleary and Prosky, 2001), a great wealth of antioxidants (tocopheroles,
phenols, and flavones derivatives (Collins, 1986), and high-quality seed oil and
protein (Burrows, 1986). The oat hull is a large part of the seed (23–28%), which
covers the dehulled seed (groat) including the endosperm. There are naked seed
varieties that are more attractive as food and feed raw materials, if field scattering
can be avoided by breeding (Burrows, 1986). Rolled oat flakes, oat flour for cakes,
as well as oat bran and oat milk-like drinks enriched in b-glucan are the main food
products. The oats seeds have to be steamed before dehulling in order to eliminate
the lipase activity of the groats to secure the shelf life of the final products. Clinical
trials have demonstrated the positive health effects of oats (McCleary and Prosky,
2001), which led to a decision in 1997 of the Food and Drug Administration in the
USA that oat food labels may carry a claim that oat products may reduce heart
disease when combined with a low-fat diet.
3.5 Rice
Rice (Orytza sativa) is a semiaquatic plant originating from South-East Asia, now
grown widely on all continents. It is one of the leading food crops in the world and
the staple food for more than half of the world’s population (Childs, 2003). Of a
world harvest of ~600 million metric tons, only about 23 million tons are traded on
the world market compared to about 105 million tons for wheat and 72 million tons
for maize (Williams, 2002). There are 420,500 rice samples of rice and related
species kept in germplasm collections which guarantee a rich source of genetic
variation for quality traits (Bergman et al., 2003). The rice genome has recently
been completely sequenced in 430,000 base pairs in the 12 � 2 chromosomes, an
international effort coordinated by the International Rice Research Institute from
the Philippines. This breakthrough is fundamental, as a tool in comparative studies
to understand quality traits in other cereals.
Rice is mainly used for cooking after dehulling the seed (paddy) into brown rice,
which is polished to white rice. The yield of white rice is only about 67%. The rice
industry thus produces a large tonnage of by-products, including rice oil, rice flour
(from broken rice) and fiber. Starch that constitutes about 90% of the milled rice is a
key component, where the relations between the starch components amylopectin
(glutinous sticky) and amylose (firm nonsticky) determine cooking quality and gelati-
nization temperature (Fitzgerald, 2003). In order to fully evaluate the subtleness of rice
cooking quality, sensory panels are necessary for estimating mouth-feel/texture,
344 L. Munck
smell, and taste. The special aromatic cultivars of rice of Basmati and Jasmine type
preferred in India, Pakistan, and in Thailand contain 2-acetyl-1-pyrrolidine.
The physical form of the rice kernels is not genetically associated with their
cooking and processing qualities. However, traditionally seed form is associated to
cooking quality on the rice markets. Seed form, for example short kernels of Italian
rice, is associated to low amylose–high amylopectin glutinous products suitable for
porridge. Consumers in North and South America, Southern China, and Europe
prefer a long rice kernel with an intermediate amylose content, which after cooking
is firm and fluffy. In Japan, Northern China, and Korea, a soft, moist, and sticky-
cooked product is estimated that is easily eaten by chopsticks (Bergman et al.,
2003). These rice seeds are of medium length. Another style of rice preferred
by Japanese and Koreans has short grains and low amylose and gelatinization
temperature. The cooked grain has a high degree of glossiness, lack of off-flavor,
distinct aroma, and sticky but smooth texture that are maintained after cooling
involving a minimum of retrogradation of starch. Kernel discoloration is an impor-
tant quality attribute that can be corrected by photoelectric seed sorters (Bergman
et al., 2003). During rice polishing of brown rice, important vitamins and minerals
are removed from the product. Milled rice has a longer shelf life than brown rice.
Wetting and preheating rice in the parboiling process allows vitamins and minerals
to migrate into the endosperm creating a more nutritious product. Parboiling also
decrease seed breakage by healing cracks and improving milling yield. Endosperm
texture and crack formation are important for the milling yield in rice.
3.6 Maize
Maize or corn (Zea mays) is the second most important grain of commerce cereal
with a yearly world production of ~600 million tons (Williams, 2002), 40% of
which is produced in the USA. It originates from Mexico (Eckhoff and Paulsen,
1999) and is today mainly used as a feed in industrial countries (in USA including
export 80%). The most important cultivar classes in yellow maize are dent (semi-
hard most US maize), floury (soft), flint, (very hard), and popcorn (small hard
seeds). Maize is used extensively in many countries as a food cereal. White maize is
the staple food in South Africa where up to 14 million tons are produced in a season
(Williams, 2002). The large maize seeds are best stored on intact cobs as in
traditional maize farming. The combiner introduced the danger of mechanical
damage and cracks, which makes the kernel more sensitive for molding (Paulsen
et al., 2003). Mold toxins in maize, such as aflatoxine, are a major problem for
livestock and humans in humid climates. Cracks in seeds result in difficulties to
isolate the whole intact germ in the dry milling process and in a high fat content and
shorter shelf life of the grits and flour products. When the combiner was introduced
grain driers were needed to reduce water content. Gentle slow drying at moderate
temperature is needed to keep the structure of the large maize kernel intact. Hard
Breeding for Quality Traits in Cereals 345
seeds are more resistant to mold and insect damage than soft and keep germination
vigor for a longer time during storage (Paulsen et al., 2003).
Maize, like most cereals, is not a complete food for most livestock and humans
because it is deficient in essential amino acids especially lysine and tryptophane
(see Sect. 5). It is the raw material basis for large-scale industrial wet and dry
milling operations for production of starch, food grade oil, maize gluten (for feed),
flour, grits, and alcohol (Sect. 4). Industrial food products made from maize
also include sweeteners, syrups, cornflakes, tortillas, salty snacks (the market
value $20.6 billion in USA in 2000), puddings, and a wide range of convenience
foods (Rooney and Serna-Salvidar, 2003). These authors describe several versions
of traditional maize food products (including their local names) locally
prepared worldwide, such as whole grain products (n = 4), thin unfermented
porridges (6), ditto fermented (3), thick porridges (7), snack foods (3), steamed
food-couscous (2), unfermented breads (8), fermented bread (1), fermented dough
(2), and beer (8).
Maize with all its endosperm mutants (Darrah et al., 2003) is a favorable genetic
model for studying carbohydrate synthesis in cereals. A wide range of specific
mutants with multiple pleiotrophic effects is expressed in the endosperm. Analogues
are to some extent present in rice (Fitzgerald, 2003) and barley (Munck et al., 2004).
The genetically buffered allopolyploid wheat does not show the same variation in
carbohydrate genes although waxy wheat is now available (Graybosch, 1998). The
starch granule (plastid) population in maize is rather uniform in maize (A-starch)
which makes a high yield in wet starch milling process compared to wheat and
barley that, additionally, have a population of smaller starch granules (B-starch)
that are more difficult to isolate. The starch granule consists of branched amylopec-
tin starch with a high swelling and gelatinization capacity (favorable as a compo-
nent in frozen foods) compared to the linear amylose component which is
a preferred component in industrial applications, for example, for membranes as
a substitute for plastics. The waxy (wx) recessive gene may produce 100% amylo-
pectin. The endosperm mutant gene amylose extender (ae) plus modifiers increase
the amylose in maize up to 80%.
An endosperm mutant that results in a decrease in starch is an indication to look
for other components that the plant may synthesize as compensation. In maize
many such mutants [e.g., sugary su, sugary extender se, shrunken (sh)-2, and brittle(bt)-1 and 2] tend to produce sugars (up to 35%) together with phytoglycogen that is
an amylopectin with reduced molecular size (Eckhoff and Paulsen, 1996). Instead,
in barley starch mutants a compensative production of the polymer b-glucan is
common (Munck et al., 2004). A wide range of special purpose cereals based on
endosperm mutants (in maize involving about 12 genes) is now commercially
available (Eckhoff and Paulsen, 1996). It is notable that most of these mutants
that have lesions in the DNA coding for specific starch synthesizing enzymes are of
commercial interest because of their unforeseeable pleiotropic multivariate effects
on the entire endosperm synthesis (see Sect. 7).
346 L. Munck
3.7 Sorghum and Millets
Grain sorghum (Sorghum bicolor) production is about 60 million tons annually
(Williams, 2002). It is a grass originating from Africa, which is able to give yield
under dry and hot conditions where maize will not thrive. High-yielding sorghums
are grown abundantly in hot climates as a raw material to the feed industry.
Sorghum is, however, equally important as a reliable food source for subsistence
farmers in the hot and dry tropics of Africa and Asia where an abundance of
different cultivars and food-processing habits have been developed throughout
historical time.
Millets (world production about 30 million tons/year (Williams, 2002) is a
collective name for nine small-seeded grass species (House, 1995) including
Pearl millet (Pennisetum glaucum) and Foxtail millet (Setaria italica) that are notdirectly related. They have a low yield, but are even more drought and heat resistant
than sorghum and are of fundamental importance for the survival of the poorest
farmers in the most difficult locations.
Polyphenolic compounds including tannins produced in the testa layer are a
characteristic element in the genetic diversity of sorghum (Serna-Saldivar and
Rooney, 1995). Sorghum due to specific genes may be almost tannin free or contain
different amounts of tannins, which may diffuse from the testa into the endosperm.
Only inspection of the testa layer by a knife cut in the seeds gives a safe indication
of the state of tannins in sorghum. The color of the outer pericarp of sorghum grain
is not related to the high polyphenol/tannine trait. Very high tannin sorghums are
toxic and lethal for birds and rodents but resistant to insects and fungal infection.
They are carcinogenic to humans. High tannin sorghum is grown for bird control to
protect the harvest. In spite of these harsh conditions, humans have succeeded in
creating food processes based on soaking, lime treatment, malting, and fermenta-
tion to make these seeds edible (Murthy and Kumar, 1995).
Opaque, low alcohol-fermented beers containing yeast and bran are produced in
great amounts by the population in south of Sahara in Africa based on sorghum and
millets. Several hundreds of liters of such beers are consumed per capita in Western
Africa. Because of the germination and fermentation process, the negative effects
of the harsh polyphenols and the often-contaminated water are neutralized. The
liquid is further supplemented by the essential amino acids and vitamins from the
yeast to make a nutritional product approaching the value of cow’s milk.
Sorghum endosperm has the lowest content of the essential amino acid lysine of
all cereals [down to 1.8% (Munck, 1995)] but is rich in starch. The kafirin proteins
of sorghum are highly cross-linked low lysine storage proteins that retards digestion
of the other components of a meal, for example starch. Such a diet takes time to get
used to but has the advantage of keeping satiety for a long time. Adequate protein
supplementation by, for example, pulses produces nutritious foods when combined
by dehulled and milled products from low and medium tannin sorghums (Munck,
1995).
Breeding for Quality Traits in Cereals 347
Cooking sorghum into porridges and to fermented kisra as in East Africa
increase insoluble dietary fiber due to bound protein (mainly kaferins) and
enzyme-resistant starch (Bach Knudsen and Munck, 1985). The sorghum proteins
associate with dietary fiber and are transported as ‘‘dietary’’ components to the
lower intestines for microbiological digestion, strongly increasing the volume of
the fecal stools (Munck, 1995; Bach Knudsen and Munck, 1985). If sorghum and
millet foods could compete with maize and wheat products in the cities by estab-
lishing local milling industries (Munck, 1995), many countries in Africa would
have had a chance of being self sufficient in food grains.
4 Quality Aspects in Breeding Cereals for Whole Crop
Utilization in the Nonfood and Food Industries
The technological development in agriculture and industry has a decisive influence
on plant breeding. The invention of artificial nitrogen fertilizer based on fossil
energy 150 years ago is the prerequisite for feeding today’s expanding world
population. It is the most effective way to invest fossil resources to trap carbon
dioxide and to boast the utilization of energy from the sun. In subsistence plant
husbandry, all parts of the crops were needed for survival and were, therefore,
carefully utilized for food and nonfood purposes (Munck, 1995). Still tenths of
million of tons of starch and plant oils are used for nonfood purposes world wide
for, for example, paper and the detergents. In the order of 8% of the current world
production of paper pulp is based on straw (~30 million tons Munck, 1992a).
However, cheep energy-downgraded straw, to be burnt in the field, when
combiners where introduced. In the industrial revolution, local biological and
agricultural production chains, which to a great extent were self-sufficient yet low
producing, were broken up due to new technology, transport, and trade. During the
1950–1960s the agricultural raw materials for nonfood purpose were to a large
extent exchanged by substitutes based on coal, mineral oil, and gas. Now in 2006
when oil prices exceed US $50 per barrel, the whole plant utilization
concept (Munck, 2004, 1993) is starting to be economically feasible as outlined
in Fig. 2 with maize as an example.
Very large-scale maize and wheat industrial units (above 500,000 tons/year and
unit) for starch, oil, and ethanol manufacturing with feed as a byproduct are now in
operation in USA, Europe, and South America. There is a wealth of possibilities
for utilizing the starch polymer after modification by means of organic chemistry
to cation and anion starches for the paper industry or by microbiological
transformations to, for example plastic molds, ethanol, acetone, and butanol
(Fig. 2). Unfractionated straw has a mediocre value for feed as well as for paper.
However, the leaf fraction has improved protein and energy value for feed, and the
internode part has a content of a-cellulose as high as in wood (Petersen and Munck,
1994). The internode fraction is excellent for paper and for fiberboards. A simple
disc mill plus a sifter is able to separate straw into fine leaf meal and coarse
348 L. Munck
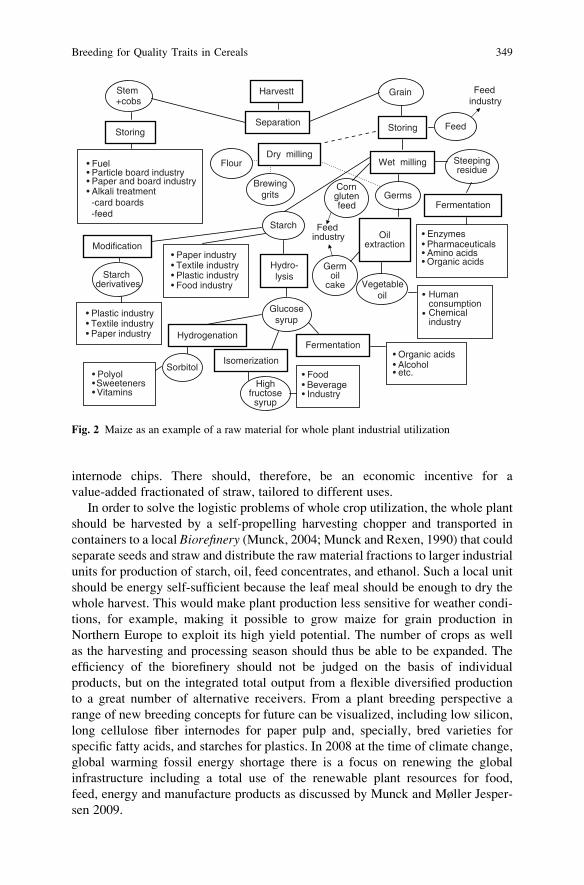
internode chips. There should, therefore, be an economic incentive for a
value-added fractionated of straw, tailored to different uses.
In order to solve the logistic problems of whole crop utilization, the whole plant
should be harvested by a self-propelling harvesting chopper and transported in
containers to a local Biorefinery (Munck, 2004; Munck and Rexen, 1990) that could
separate seeds and straw and distribute the raw material fractions to larger industrial
units for production of starch, oil, feed concentrates, and ethanol. Such a local unit
should be energy self-sufficient because the leaf meal should be enough to dry the
whole harvest. This would make plant production less sensitive for weather condi-
tions, for example, making it possible to grow maize for grain production in
Northern Europe to exploit its high yield potential. The number of crops as well
as the harvesting and processing season should thus be able to be expanded. The
efficiency of the biorefinery should not be judged on the basis of individual
products, but on the integrated total output from a flexible diversified production
to a great number of alternative receivers. From a plant breeding perspective a
range of new breeding concepts for future can be visualized, including low silicon,
long cellulose fiber internodes for paper pulp and, specially, bred varieties for
specific fatty acids, and starches for plastics. In 2008 at the time of climate change,
global warming fossil energy shortage there is a focus on renewing the global
infrastructure including a total use of the renewable plant resources for food,
feed, energy and manufacture products as discussed by Munck and Møller Jesper-
sen 2009.
Harvestt
Separation
GrainStem +cobs
Storing
• Fuel• Particle board industry• Paper and board industry• Alkali treatment-card boards-feed
Storing
Dry millingWet milling
Feed
Feed industry
Flour
Brewinggrits
Starch
Cornglutenfeed
Germs
Steepingresidue
Modification
Starch derivatives
• Plastic industry• Textile industry• Paper industry
• Paper industry• Textile industry• Plastic industry• Food industry
Fermentation
• Enzymes• Pharmaceuticals• Amino acids• Organic acids
Feed industry
Germoil
cake Vegetableoil • Human
consumption• Chemical
industry
Hydro-lysis
Glucosesyrup
Oilextraction
Hydrogenation
Isomerization
Fermentation
Sorbitol
Highfructosesyrup
• Organic acids• Alcohol• etc.• Food
• Beverage• Industry
• Polyol• Sweeteners• Vitamins
Fig. 2 Maize as an example of a raw material for whole plant industrial utilization
Breeding for Quality Traits in Cereals 349
5 Breeding for Nutritional Quality
In defining nutritional needs of humans and animals, cereals have played an
important role (Munck, 1972). The importance of B-vitamins was elucidated due
to deficiency symptoms that were introduced when brown rice was polished and the
germ and aleuron was removed. The essential amino acids were defined when
deficient maize protein was fed to young rats and adding lysine and tryptophane
could restore the growth. During the 1930s, practically, all nutritionally important
elements were defined and could be purified and put together in synthetic diets to
maintain growth in rats.
In the 1960s, there was a major focus in science on alleviating the amino
acid deficiencies of cereal protein by plant breeding. Remarkably a range of
‘‘high lysine’’ mutants were isolated in maize, barley, and sorghum (Axtell, 1981;
Sect. 6), which drastically improved the nutritional value of the proteins by
changing the balance between the proteins high and low in essential amino acids.
The maize mutants, such as opaque-2 and floury-2, were previously known as
morphological mutants with defects in grain filling and with decreasing starch
and increasing sugar content indicating a complex pleiotropic effect of the mutant
gene.
The majority of the cereal production is probably used for feed that has not been
adequately reflected in plant breeding for cereal quality (Ullrich, 2002). However,
as discussed above, starch content is related to yield because starch is the most
economical way for the plant to produce dry substance. Carbohydrates and their
availability is, therefore, the main target of quality for the purpose of feed (Rudi
et al., 2006). In poultry and pig feeding, cereals are mainly used as an energy
(starch) source with some protein, vitamins, and minerals which has to be supple-
mented by, for example, soybean press cake and phosphorous and calcium. Avail-
ability of energy in feeding cereals is highly dependent on the thickness and
composition of the endosperm cell walls containing b-glucan, arabinoxylans, andcellulose surrounding the starch granules as well as on the hardness of the particles
from the seed milled to flour. NIRS can estimate these physical–chemical factors
and is thus able to predict digestibility (Table 1). A soft endosperm with slender cell
walls preferred for malting should thus be preferred also for feed.
Intense animal production gives local pollution problems when the limited land
has difficulties in absorbing the manure. It has until, recently, been overseen that the
large content of nonessential amino acids such as glutamine and aspartic acid in
maize and barley is not adequately utilized by soybean protein supplementation
targeted for an optimization of the limited amino acid lysine, that also carries with it
large amounts of unessential amino acids. There is thus an overfeeding of protein.
The very high lysine barley mutant Risø 1508 (gene lys3a, 5.2% lysine g/16 g N)
allows for optimal growth in pigs at a much lower protein content after some
supplementation. In fact, it is a gene for 15–20% less nitrogen pollution in feeding
slaughter pigs (Munck, 1992b). The same effect can be obtained by supplementing
with microbiologically produced pure lysine.
350 L. Munck
Phosphorus is mainly bound to phytic acid in cereals and cannot be utilized by
the animal. Mutants have been obtained in barley and maize (Pilu et al., 2003,
Rasmussen and Hatzac, 1998) that reduced phytic acid and led to an increase in
inorganic phosphorus that can be utilized. Thus, addition of phosphorus to the diet
can be diminished as well as the total amount excreted in the feces and in the urine
(Poulsen et al., 2001). Another approach to the same problem is demonstrated in
wheat with a transgenic expression of an Aspergillus phytase (Brinch-Pedersen
et al., 2000) that is able to degrade phytate during digestion.
The high b-glucan barley mutants (up to 20% DM; Munck et al., 2004) are
detrimental for poultry and swine that can not utilize this kind of dietary fiber but
may be of interest in feeding live stock if the b-glucan and can be utilized as a slow-release carbohydrate by the microbiological digestion in the rumen.
Plant breeding and nutrition as sciences are based on complex interactions
between many elements that need a multivariate approach to be understood. An
optimal diet for growth of young children is certainly not optimal for the mainte-
nance of health in adults. During the last 20 years, attention has been given to foods
with a slow release of glucose during digestion (low glycemic index, GI) to avoid
stress in the insulin production that may lead to diabetes. The constituents of bran
and the endosperm cell walls (McCleary and Prosky, 2001) that are indigestible in
upper part of the digestive system function in several ways in the diet. One function
is trapping starch for a more slow digestion. The other function is as filler stimulat-
ing the gut to increase the flow through the digestive system washing out cholester-
ol and carcinogenic substances. A third function is to serve as a source of energy for
the microbes and as a water absorber in the colon. One could conclude that the
biological variation in the composition of the cereal seed is a great source of
inspiration also in nutritional research.
6 Mutation Breeding for Endosperm Quality Traits
Natural endosperm mutations with attractive sensory traits, such as sugary-2 in
maize and high lysine sorghum (Axtell, 1981; Darrah et al., 2003), has always
attracted the consumers and were propagated and bred. There were great expecta-
tions when artificial mutants were produced in the 1930s. Now, one should be able
to induce new genes in high-yielding genotypes to obtain a shortcut in breeding
(van Harten, 1998). This way of thinking also prevails in today’s genetic engineer-
ing concept. There are unexpected pleiotropic side effects of mutants and trans-
ferred genes, for example, on yield and seed quality. However, the flexibility of
nature is great. It is in most cases possible to find ‘‘a happy home’’ for the new gene
(Ramage, 1987) by recurrent crossing and selection. Very few mutation breeders
and genetic engineers believe that such a tedious, less glamorous work would at all
be successful. They, therefore, tend to concentrate their work in inducing new
mutants and transferring new genes.
Breeding for Quality Traits in Cereals 351
The breeding cases of high lysine (opaque-2) quality protein maize (QPM) from
Centro Internacional de Mejoramiento de Maız y Trigo (CIMMYT) (Vasal, 1999)
and of high lysine barley (Risø mutant 1508, gene lys3a) from Carlsberg Research
Laboratory (Munck, 1992b) demonstrate that the negative pleiotropic effects on
yield and seed quality of these mutants can be compensated by optimizing the gene
background to these mutants by intensive classical cross breeding and selection. It
is not the plant-breeding prospects but the limited notion of quality control of the
market and competition with soybean meal and industrially produced amino acids
that have prevented the use of these high lysine varieties in the feed industry.
From a theoretical point of view mutations (Munck, 2005, 2006; Sects. 7.1–7.2)
with their near isogenic backgrounds give a much more clear cut insight into the
multivariate aspect of pleiotropy than QTL analysis combined with backcrosses
(Kleinhofs and Han, 2002). Pleiotropy has tended to be underestimated by geneti-
cists and molecular biologists because of lack of tools and data programs to
overview the phenotype. For the first time, pleiotropy of specific genes can
now be studied as physical–chemical imprints in the endosperm tissue by
NIRS and chemometrics as demonstrated in Sect. 7 (Munck et al., 2004; Munck,
2005, 2006).
7 Four Examples on How NIR Technology Supports Advances
in Plant Breeding, Seed Sorting, and Plant Science
7.1 ‘‘Data Breeding’’: NIR Spectra of Barley Endosperm MutantsEvaluated by PCA Support a Selection for Complex Traitsand Genotypes Based on a Physical–Chemical Interpretationof Spectral Data
In 1999, the barley ‘‘high lysine’’ mutation collection selected 1965–1989 by the
dye-binding method (Munck et al., 1970) at Svalof, Risø, and Carlsberg was used as
a test case for NIRS and chemometrics (Munck et al., 2001; Munck, 2003; Munck
et al., 2004).
The spectral analysis of the 28 barley samples grown in greenhouse in Fig. 3 is
performed unsupervised. The NIR spectra 1,100–2,500 nm (Foss-NIR Systems
6500, USA) from milled samples are outlined in Fig. 3a. A PCA classification of
the spectral patterns (every second wavelength was omitted) is presented in Fig. 3b.
The samples are now identified by consulting the field book. There are three main
clusters: N for normal barley, P for high lysine mutants, such as Risø mutants
8 (lys4d ) and 1508 (lys3a) in Bomi, and, finally, the cluster C for starch-reduced
mutants with only a slight lysine improvement including Risø mutants 13 (lys5f )and 16 in Bomi and mutant 29 (lys5g) in Carlsberg II.
352 L. Munck
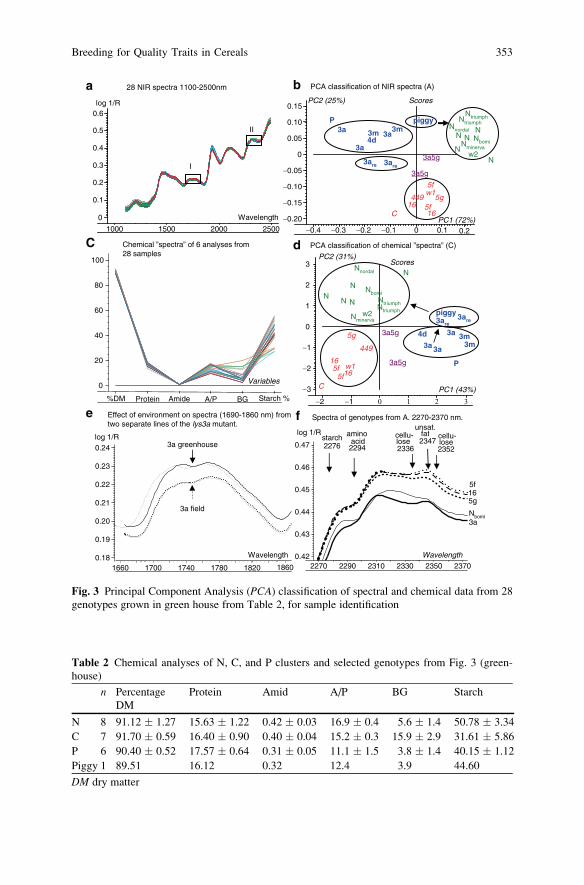
Table 2 Chemical analyses of N, C, and P clusters and selected genotypes from Fig. 3 (green-
house)
n Percentage
DM
Protein Amid A/P BG Starch
N 8 91.12 � 1.27 15.63 � 1.22 0.42 � 0.03 16.9 � 0.4 5.6 � 1.4 50.78 � 3.34
C 7 91.70 � 0.59 16.40 � 0.90 0.40 � 0.04 15.2 � 0.3 15.9 � 2.9 31.61 � 5.86
P 6 90.40 � 0.52 17.57 � 0.64 0.31 � 0.05 11.1 � 1.5 3.8 � 1.4 40.15 � 1.12
Piggy 1 89.51 16.12 0.32 12.4 3.9 44.60
DM dry matter
a 28 NIR spectra 1100-2500nm
−0.20
−0.4 −0.3 −0.2 −0.1 0 0.1 0.2
−0.15
−0.10
−0.05
0
0.05
0.10
0.15
3a
3a 3a3m 3m4d
1616
449
piggy
3a5g
3a5g
5f
5f5g
w1
w2
N NN
NN
PC1 (72%)
PC2 (25%) Scores
C
P
b PCA classification of NIR spectra (A)
−3
−2 −1 0 1 2 3
−2
−1
0
1
2
3
3a 3a
3a
3m3m4d
16
16
449
piggy 3are
3are 3are
3are
3a5g
3a5g
5f5f
5g
w1
w2
NN
Nbomi
Nbomi
N
N
Nminerva
Nminerva
Nnordal
Nnordal
Ntriumph
NtriumphNtriumph
Ntriumph
PC1 (43%)
PC2 (31%)Scores
N
P
C0
%DM Protein Amide A/P BG
20
40
60
80
100
Variables
C Chemical ”spectra” of 6 analyses from28 samples
d PCA classification of chemical ”spectra” (C)
0
2000 250015001000
0.1
0.2
0.3
0.4
0.5
0.6
Wavelength
log 1/R
I
II
Wavelength0.18
0.19
0.20
0.21
0.22
0.23
0.24log 1/R
3a greenhouse
3a field
1860 2270 2290 2310 2330 2350 23701660 1700 1740 1780 1820
unsat.fat2347
0.42
0.43
0.44
0.45
0.46
0.47
Wavelength
3a
165f
5g
Nbomi
log 1/R amino acid2294
starch2276
cellu-lose 2352
cellu-lose 2336
f Spectra of genotypes from A. 2270-2370 nm. e Effect of environment on spectra (1690-1860 nm) fromtwo separate lines of the lys3a mutant.
Starch %
Fig. 3 Principal Component Analysis (PCA) classification of spectral and chemical data from 28
genotypes grown in green house from Table 2, for sample identification
Breeding for Quality Traits in Cereals 353
The C mutants have been extensively used in studies of starch synthesis in the
developing barley endosperm (see review by Rudi et al., 2006). It was found that
Risø 16 lacks one of the adenosine diphosphate (ADP)-glucose pyrophosphorylase
(AGPase) genes that are necessary for starch synthesis while lys5f and lys5g that areallelic in the lys5 locus are low in starch because they have an inactive ADP–
glucose membrane transporter. It was therefore surprising to find that all genotypes
located in cluster C (Fig. 3b) more or less compensated the loss in starch by an
overproduction of b-glucan as shown in Table 2. A new regulative pathway for the
biochemists to evaluate was thus anticipated (Munck et al., 2004) by revealing six
b-glucan compensating low starch mutants of the C type.
The spectral outliers outside the N, P, and C clusters in Fig. 3b are the double
recessive lys3a5g recombinants and three recombinants from the Carlsberg high
lysine barley-breeding program (1974–1989) for improved seed quality and starch
content. The very high lysine ‘‘Piggy’’ lys3a recombinant (45% increase in lysine)
is moving in the PCA spectral score plot (Fig. 3b) from the P toward the N cluster
indicating an improvement in starch (Table 2) due to 15 years selection work for
improved seed quality.
However, now when the NIR technology has been introduced, selection of
improved varieties can be made directly by interpreting their position in a spectral
PCA score plot in relation to high quality controls by ‘‘data breeding’’ (Munck
and Møller, 2005; Munck et al., 2004). The validation of the NIR PCA score plot
(Fig. 3b) is made by a parallel data set of six analyses (Table 2) that is represented
as 28 ‘‘chemical spectra’’ in Fig. 3c. A PCA on this data set (Fig. 3d) makes a
classification equal to that of NIR (Fig. 3b).
It may be surprising to plant geneticists and breeders that individual samples and
genotypes can be evaluated by direct visual evaluation of the patterns of NIR
spectra as in Figs. 3e–f and Fig. 4. However, in the spectroscopic literature,
wavelengths are tentatively assigned to represent specific spectral bonds and
components as indicated in Fig. 3f. The spectral reproducibility of two separate
lines of the lys3a mutant is demonstrated for two environments in Fig. 3e for the
small area I in Fig. 3a enlarged in Fig. 3e. The environmental effect is mainly seen
as an offset (Munck et al., 2001). The spectral signatures 2,270–2,370 nm (area II in
Fig. 3a) of four mutants and the Bomi control are visualized in Fig. 3f. The spectral
patterns of the high b-glucan C mutants 16 (16.6%) and lys5f (19.8%) are almost
identical (see discussion in Sect. 7.2) while the lys5g mutant with a lower b-glucancontent (13.3%) is different. The lys3a P spectrum has a distinct pattern deviating
from the C and the N (Bomi) spectra. The bulb at 2,347 nm characteristic for all the
four mutant spectra in Fig. 3f indicates an increase in unsaturated fat that was
verified as a pleiotropic effect (Munck et al., 2004).
The heterogeneity in physical–chemical representation in the 2,190–2,400 nm
NIR area is demonstrated in Table 3 for six chemical components for an enlarged
barley material. The spectral prediction coefficients of the six chemical analyses are
listed for each of seven 30 nm intervals in a PLSR (iPLS) evaluation (Nørgaard
et al., 2000) explaining the physical–chemical basis of the spectral patterns of the
genes and genotypes visualized in Figs. 3e–f and 4.
354 L. Munck
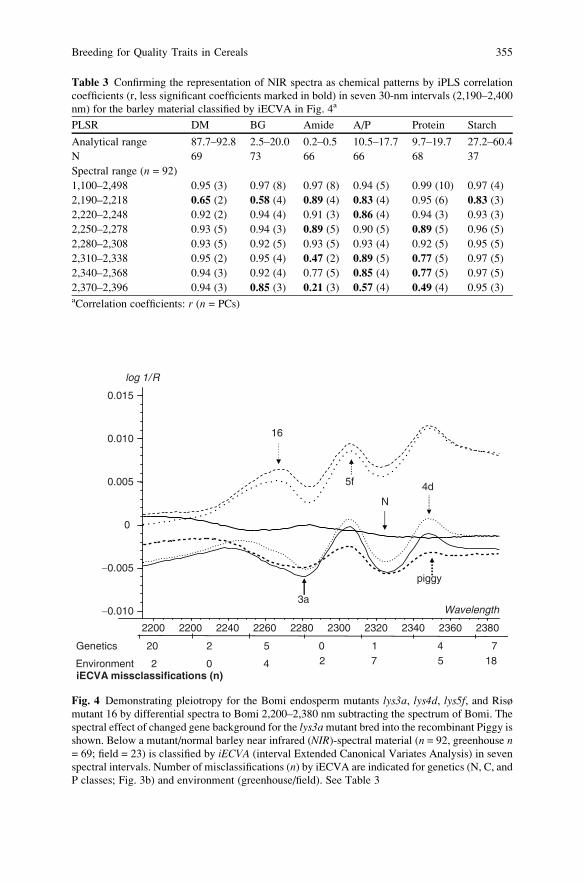
Table 3 Confirming the representation of NIR spectra as chemical patterns by iPLS correlation
coefficients (r, less significant coefficients marked in bold) in seven 30-nm intervals (2,190–2,400
nm) for the barley material classified by iECVA in Fig. 4a
PLSR DM BG Amide A/P Protein Starch
Analytical range 87.7–92.8 2.5–20.0 0.2–0.5 10.5–17.7 9.7–19.7 27.2–60.4
N 69 73 66 66 68 37
Spectral range (n = 92)
1,100–2,498 0.95 (3) 0.97 (8) 0.97 (8) 0.94 (5) 0.99 (10) 0.97 (4)
2,190–2,218 0.65 (2) 0.58 (4) 0.89 (4) 0.83 (4) 0.95 (6) 0.83 (3)
2,220–2,248 0.92 (2) 0.94 (4) 0.91 (3) 0.86 (4) 0.94 (3) 0.93 (3)
2,250–2,278 0.93 (5) 0.94 (3) 0.89 (5) 0.90 (5) 0.89 (5) 0.96 (5)
2,280–2,308 0.93 (5) 0.92 (5) 0.93 (5) 0.93 (4) 0.92 (5) 0.95 (5)
2,310–2,338 0.95 (2) 0.95 (4) 0.47 (2) 0.89 (5) 0.77 (5) 0.97 (5)
2,340–2,368 0.94 (3) 0.92 (4) 0.77 (5) 0.85 (4) 0.77 (5) 0.97 (5)
2,370–2,396 0.94 (3) 0.85 (3) 0.21 (3) 0.57 (4) 0.49 (4) 0.95 (3)aCorrelation coefficients: r (n = PCs)
iECVA missclassifications (n)
−0.010
−0.005
0
0.005
0.010
0.015
23802200
55 18
0 1 4 772 0 4Environment
22
20
2200 2240 2260 2280 2300 2320 2340 2360
3a
4d
16
piggy
5f
N
Wavelength
log 1/R
Genetics
Fig. 4 Demonstrating pleiotropy for the Bomi endosperm mutants lys3a, lys4d, lys5f, and Risø
mutant 16 by differential spectra to Bomi 2,200–2,380 nm subtracting the spectrum of Bomi. The
spectral effect of changed gene background for the lys3amutant bred into the recombinant Piggy is
shown. Below a mutant/normal barley near infrared (NIR)-spectral material (n = 92, greenhouse n= 69; field = 23) is classified by iECVA (interval Extended Canonical Variates Analysis) in seven
spectral intervals. Number of misclassifications (n) by iECVA are indicated for genetics (N, C, and
P classes; Fig. 3b) and environment (greenhouse/field). See Table 3
Breeding for Quality Traits in Cereals 355
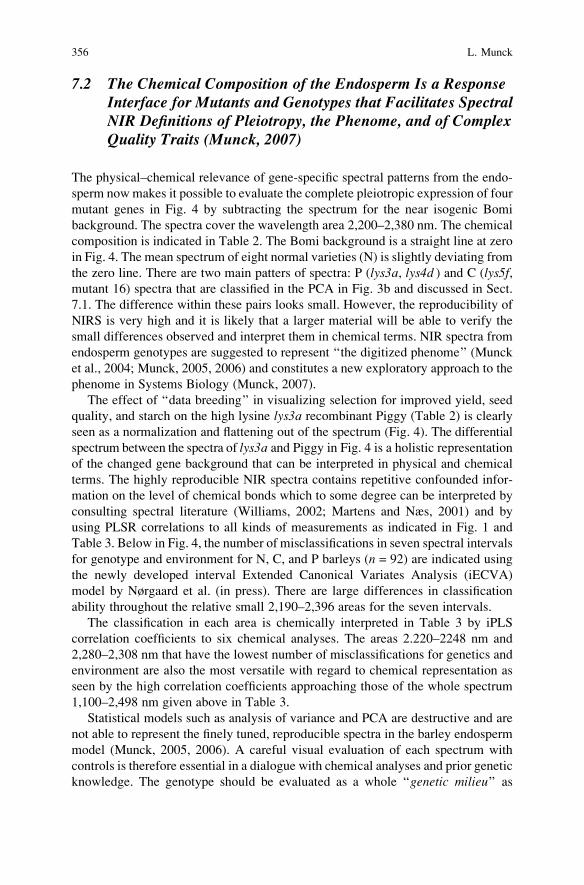
7.2 The Chemical Composition of the Endosperm Is a ResponseInterface for Mutants and Genotypes that Facilitates SpectralNIR Definitions of Pleiotropy, the Phenome, and of ComplexQuality Traits (Munck, 2007)
The physical–chemical relevance of gene-specific spectral patterns from the endo-
sperm now makes it possible to evaluate the complete pleiotropic expression of four
mutant genes in Fig. 4 by subtracting the spectrum for the near isogenic Bomi
background. The spectra cover the wavelength area 2,200–2,380 nm. The chemical
composition is indicated in Table 2. The Bomi background is a straight line at zero
in Fig. 4. The mean spectrum of eight normal varieties (N) is slightly deviating from
the zero line. There are two main patters of spectra: P (lys3a, lys4d ) and C (lys5f,mutant 16) spectra that are classified in the PCA in Fig. 3b and discussed in Sect.
7.1. The difference within these pairs looks small. However, the reproducibility of
NIRS is very high and it is likely that a larger material will be able to verify the
small differences observed and interpret them in chemical terms. NIR spectra from
endosperm genotypes are suggested to represent ‘‘the digitized phenome’’ (Munck
et al., 2004; Munck, 2005, 2006) and constitutes a new exploratory approach to the
phenome in Systems Biology (Munck, 2007).
The effect of ‘‘data breeding’’ in visualizing selection for improved yield, seed
quality, and starch on the high lysine lys3a recombinant Piggy (Table 2) is clearly
seen as a normalization and flattening out of the spectrum (Fig. 4). The differential
spectrum between the spectra of lys3a and Piggy in Fig. 4 is a holistic representationof the changed gene background that can be interpreted in physical and chemical
terms. The highly reproducible NIR spectra contains repetitive confounded infor-
mation on the level of chemical bonds which to some degree can be interpreted by
consulting spectral literature (Williams, 2002; Martens and Næs, 2001) and by
using PLSR correlations to all kinds of measurements as indicated in Fig. 1 and
Table 3. Below in Fig. 4, the number of misclassifications in seven spectral intervals
for genotype and environment for N, C, and P barleys (n = 92) are indicated using
the newly developed interval Extended Canonical Variates Analysis (iECVA)
model by Nørgaard et al. (in press). There are large differences in classification
ability throughout the relative small 2,190–2,396 areas for the seven intervals.
The classification in each area is chemically interpreted in Table 3 by iPLS
correlation coefficients to six chemical analyses. The areas 2.220–2248 nm and
2,280–2,308 nm that have the lowest number of misclassifications for genetics and
environment are also the most versatile with regard to chemical representation as
seen by the high correlation coefficients approaching those of the whole spectrum
1,100–2,498 nm given above in Table 3.
Statistical models such as analysis of variance and PCA are destructive and are
not able to represent the finely tuned, reproducible spectra in the barley endosperm
model (Munck, 2005, 2006). A careful visual evaluation of each spectrum with
controls is therefore essential in a dialogue with chemical analyses and prior genetic
knowledge. The genotype should be evaluated as a whole ‘‘genetic milieu’’ as
356 L. Munck
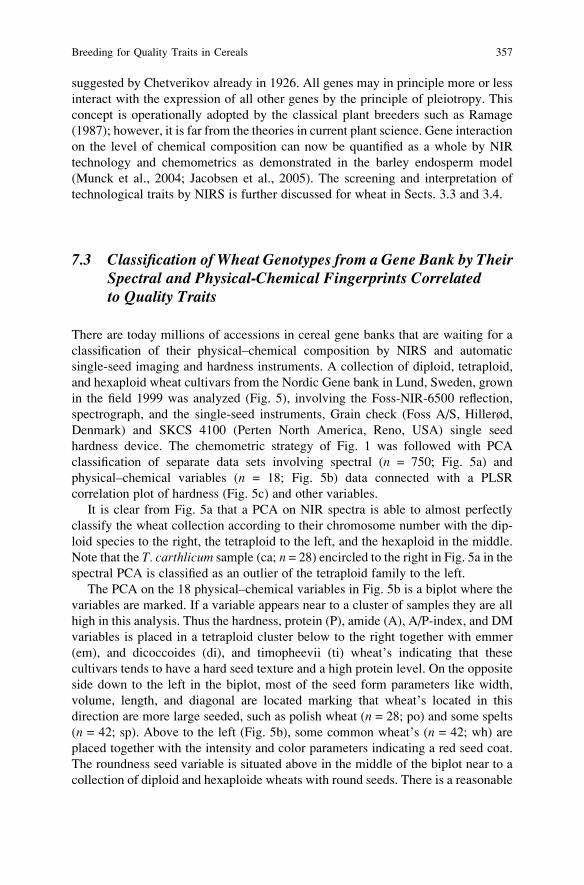
suggested by Chetverikov already in 1926. All genes may in principle more or less
interact with the expression of all other genes by the principle of pleiotropy. This
concept is operationally adopted by the classical plant breeders such as Ramage
(1987); however, it is far from the theories in current plant science. Gene interaction
on the level of chemical composition can now be quantified as a whole by NIR
technology and chemometrics as demonstrated in the barley endosperm model
(Munck et al., 2004; Jacobsen et al., 2005). The screening and interpretation of
technological traits by NIRS is further discussed for wheat in Sects. 3.3 and 3.4.
7.3 Classification of Wheat Genotypes from a Gene Bank by TheirSpectral and Physical-Chemical Fingerprints Correlatedto Quality Traits
There are today millions of accessions in cereal gene banks that are waiting for a
classification of their physical–chemical composition by NIRS and automatic
single-seed imaging and hardness instruments. A collection of diploid, tetraploid,
and hexaploid wheat cultivars from the Nordic Gene bank in Lund, Sweden, grown
in the field 1999 was analyzed (Fig. 5), involving the Foss-NIR-6500 reflection,
spectrograph, and the single-seed instruments, Grain check (Foss A/S, Hillerød,
Denmark) and SKCS 4100 (Perten North America, Reno, USA) single seed
hardness device. The chemometric strategy of Fig. 1 was followed with PCA
classification of separate data sets involving spectral (n = 750; Fig. 5a) and
physical–chemical variables (n = 18; Fig. 5b) data connected with a PLSR
correlation plot of hardness (Fig. 5c) and other variables.
It is clear from Fig. 5a that a PCA on NIR spectra is able to almost perfectly
classify the wheat collection according to their chromosome number with the dip-
loid species to the right, the tetraploid to the left, and the hexaploid in the middle.
Note that the T. carthlicum sample (ca; n = 28) encircled to the right in Fig. 5a in the
spectral PCA is classified as an outlier of the tetraploid family to the left.
The PCA on the 18 physical–chemical variables in Fig. 5b is a biplot where the
variables are marked. If a variable appears near to a cluster of samples they are all
high in this analysis. Thus the hardness, protein (P), amide (A), A/P-index, and DM
variables is placed in a tetraploid cluster below to the right together with emmer
(em), and dicoccoides (di), and timopheevii (ti) wheat’s indicating that these
cultivars tends to have a hard seed texture and a high protein level. On the opposite
side down to the left in the biplot, most of the seed form parameters like width,
volume, length, and diagonal are located marking that wheat’s located in this
direction are more large seeded, such as polish wheat (n = 28; po) and some spelts
(n = 42; sp). Above to the left (Fig. 5b), some common wheat’s (n = 42; wh) are
placed together with the intensity and color parameters indicating a red seed coat.
The roundness seed variable is situated above in the middle of the biplot near to a
collection of diploid and hexaploide wheats with round seeds. There is a reasonable
Breeding for Quality Traits in Cereals 357
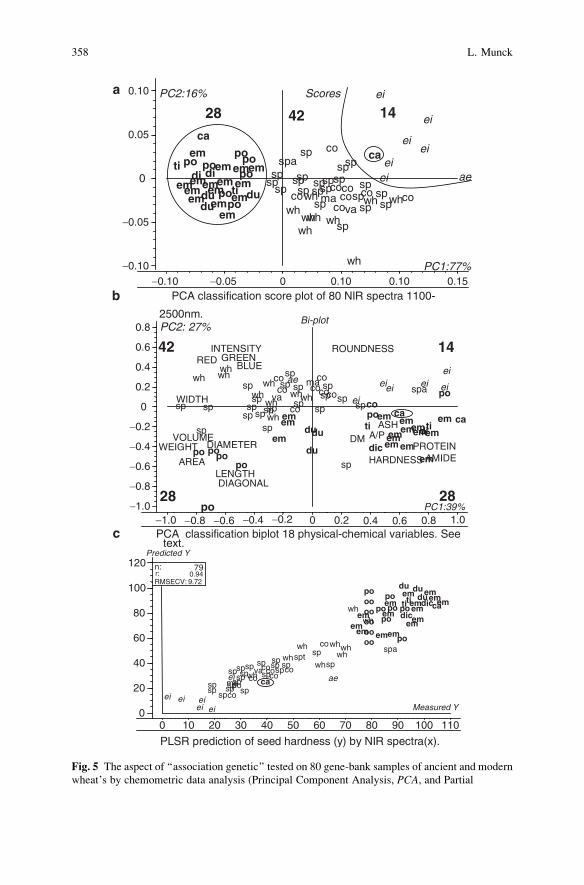
PCA classification score plot of 80 NIR spectra 1100-
2500nm.
PLSR prediction of seed hardness (y) by NIR spectra(x).
−0.10
−0.10 −0.05 0 0.10 0.10 0.15
−0.05
0
0.05
0.10a
b
c
po
em
po
wh
ei
poempo
popo
eipo
ei
eiei
duem
ditiem
di
ca
ca
ae
emem
du
em ei
em
emem
em
emdu
em
em
ti
em
sp
sp
spsp
sp
spsp
wh
spsp
spsp
spsp
maspsp
sp
spsp spsp
coco
cowh
wh
spwhwh
coco
wh coco
co
whva
spa
wh
PC1:77%
PC2:16% Scores
28 14
00 10 20 30 40 50 60 70 80 90 100 110
20
40
60
80
100
120
spsp
sp
spsp
sp
sp
wh
wh
speisp
sp
sp
sp
sp
ma
sp
ei
sptsp
spsp
ei
spsp
ei eico
co
co
wh
wh
sp
ca
wh
ae
wh co
coei
whpo
empopo
em
po
pooooooooooo
popo duem
dictiem
dicca
emem
du
em
emem
ememem
duememti
em
cococowh
va
spawh
n:r:RMSECV:
790.949.72
Measured Y
Predicted Y
PCA classification biplot 18 physical-chemical variables. Seetext.
−1.0−1.0
−0.8
−0.8
−0.6
−0.6
−0.4
−0.4
−0.2
−0.2
0
0
0.2
0.2
0.4
0.4
0.6
0.6
0.8
0.8 1.0
sp
sppo
sp emsp
spsp
po
spwh
wh
sp
ei
po
sp spsp
em
po
sp
poposp
ma
sp
ei
sp
spsp
po
sp
ei
sp sp
eiei
du
cococo
wh
wh
sp
em
dic
tiemdi
caca
wh ae
wh
coem
emdu
em
coei
em
wh
ememem
emdu
em
emtiem
co
coco
whva
spawh
ASH
PROTEINAMIDE
A/PDM
HARDNESS
DIAMETERWEIGHT
WIDTH
LENGTHDIAGONAL
ROUNDNESS
AREA
VOLUME
RED GREENBLUE
INTENSITY
PC1:39%
PC2: 27%Bi-plot
42 14
2828
42
Fig. 5 The aspect of ‘‘association genetic’’ tested on 80 gene-bank samples of ancient and modern
wheat’s by chemometric data analysis (Principal Component Analysis, PCA, and Partial
358 L. Munck
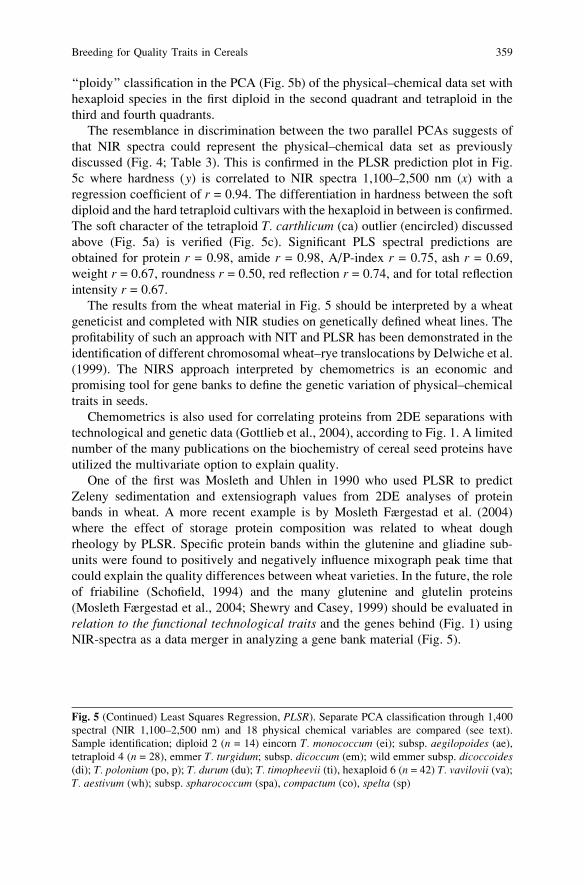
‘‘ploidy’’ classification in the PCA (Fig. 5b) of the physical–chemical data set with
hexaploid species in the first diploid in the second quadrant and tetraploid in the
third and fourth quadrants.
The resemblance in discrimination between the two parallel PCAs suggests of
that NIR spectra could represent the physical–chemical data set as previously
discussed (Fig. 4; Table 3). This is confirmed in the PLSR prediction plot in Fig.
5c where hardness (y) is correlated to NIR spectra 1,100–2,500 nm (x) with a
regression coefficient of r = 0.94. The differentiation in hardness between the soft
diploid and the hard tetraploid cultivars with the hexaploid in between is confirmed.
The soft character of the tetraploid T. carthlicum (ca) outlier (encircled) discussed
above (Fig. 5a) is verified (Fig. 5c). Significant PLS spectral predictions are
obtained for protein r = 0.98, amide r = 0.98, A/P-index r = 0.75, ash r = 0.69,
weight r = 0.67, roundness r = 0.50, red reflection r = 0.74, and for total reflection
intensity r = 0.67.
The results from the wheat material in Fig. 5 should be interpreted by a wheat
geneticist and completed with NIR studies on genetically defined wheat lines. The
profitability of such an approach with NIT and PLSR has been demonstrated in the
identification of different chromosomal wheat–rye translocations by Delwiche et al.
(1999). The NIRS approach interpreted by chemometrics is an economic and
promising tool for gene banks to define the genetic variation of physical–chemical
traits in seeds.
Chemometrics is also used for correlating proteins from 2DE separations with
technological and genetic data (Gottlieb et al., 2004), according to Fig. 1. A limited
number of the many publications on the biochemistry of cereal seed proteins have
utilized the multivariate option to explain quality.
One of the first was Mosleth and Uhlen in 1990 who used PLSR to predict
Zeleny sedimentation and extensiograph values from 2DE analyses of protein
bands in wheat. A more recent example is by Mosleth Færgestad et al. (2004)
where the effect of storage protein composition was related to wheat dough
rheology by PLSR. Specific protein bands within the glutenine and gliadine sub-
units were found to positively and negatively influence mixograph peak time that
could explain the quality differences between wheat varieties. In the future, the role
of friabiline (Schofield, 1994) and the many glutenine and glutelin proteins
(Mosleth Færgestad et al., 2004; Shewry and Casey, 1999) should be evaluated in
relation to the functional technological traits and the genes behind (Fig. 1) using
NIR-spectra as a data merger in analyzing a gene bank material (Fig. 5).
Fig. 5 (Continued) Least Squares Regression, PLSR). Separate PCA classification through 1,400
spectral (NIR 1,100–2,500 nm) and 18 physical chemical variables are compared (see text).
Sample identification; diploid 2 (n = 14) eincorn T. monococcum (ei); subsp. aegilopoides (ae),tetraploid 4 (n = 28), emmer T. turgidum; subsp. dicoccum (em); wild emmer subsp. dicoccoides(di); T. polonium (po, p); T. durum (du); T. timopheevii (ti), hexaploid 6 (n = 42) T. vavilovii (va);T. aestivum (wh); subsp. spharococcum (spa), compactum (co), spelta (sp)
Breeding for Quality Traits in Cereals 359
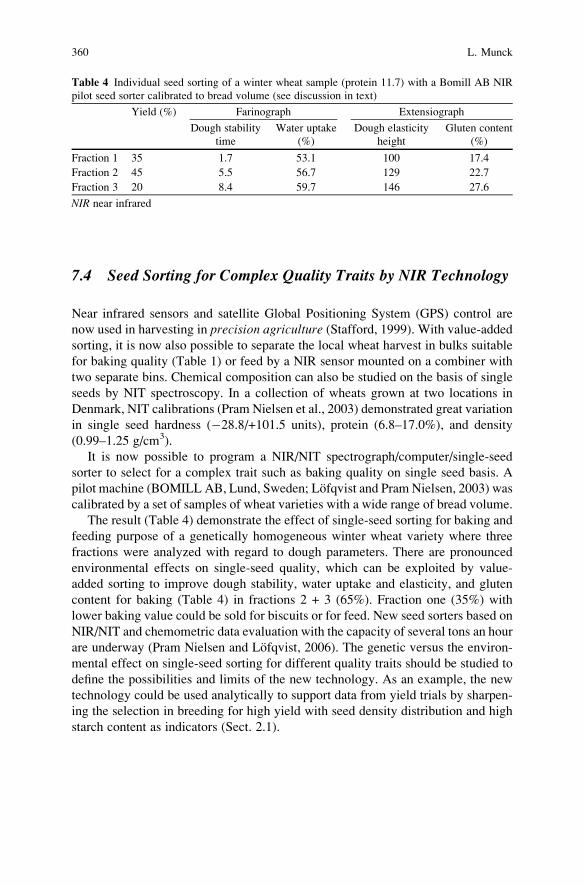
7.4 Seed Sorting for Complex Quality Traits by NIR Technology
Near infrared sensors and satellite Global Positioning System (GPS) control are
now used in harvesting in precision agriculture (Stafford, 1999). With value-added
sorting, it is now also possible to separate the local wheat harvest in bulks suitable
for baking quality (Table 1) or feed by a NIR sensor mounted on a combiner with
two separate bins. Chemical composition can also be studied on the basis of single
seeds by NIT spectroscopy. In a collection of wheats grown at two locations in
Denmark, NIT calibrations (Pram Nielsen et al., 2003) demonstrated great variation
in single seed hardness (�28.8/+101.5 units), protein (6.8–17.0%), and density
(0.99–1.25 g/cm3).
It is now possible to program a NIR/NIT spectrograph/computer/single-seed
sorter to select for a complex trait such as baking quality on single seed basis. A
pilot machine (BOMILL AB, Lund, Sweden; Lofqvist and Pram Nielsen, 2003) was
calibrated by a set of samples of wheat varieties with a wide range of bread volume.
The result (Table 4) demonstrate the effect of single-seed sorting for baking and
feeding purpose of a genetically homogeneous winter wheat variety where three
fractions were analyzed with regard to dough parameters. There are pronounced
environmental effects on single-seed quality, which can be exploited by value-
added sorting to improve dough stability, water uptake and elasticity, and gluten
content for baking (Table 4) in fractions 2 + 3 (65%). Fraction one (35%) with
lower baking value could be sold for biscuits or for feed. New seed sorters based on
NIR/NIT and chemometric data evaluation with the capacity of several tons an hour
are underway (Pram Nielsen and Lofqvist, 2006). The genetic versus the environ-
mental effect on single-seed sorting for different quality traits should be studied to
define the possibilities and limits of the new technology. As an example, the new
technology could be used analytically to support data from yield trials by sharpen-
ing the selection in breeding for high yield with seed density distribution and high
starch content as indicators (Sect. 2.1).
Table 4 Individual seed sorting of a winter wheat sample (protein 11.7) with a Bomill AB NIR
pilot seed sorter calibrated to bread volume (see discussion in text)
Yield (%) Farinograph Extensiograph
Dough stability
time
Water uptake
(%)
Dough elasticity
height
Gluten content
(%)
Fraction 1 35 1.7 53.1 100 17.4
Fraction 2 45 5.5 56.7 129 22.7
Fraction 3 20 8.4 59.7 146 27.6
NIR near infrared
360 L. Munck
8 The Economy in Breeding and Sorting for Complex Quality
Traits in Cereals in the Future
NIRS evaluated by chemometrics is an extension of breeder’s vision to the micro
world by ‘‘high tech’’ tools. It includes chemometric pattern recognition data
analysis that will also considerably sharpen QTL analysis and connect to genomic
data. NIR screening and ‘‘association genetics’’ will link the practical breeding
work on the physical–chemical phenotype level to molecular and biochemical data
evaluated as whole traits from the computer interface. The biological diversity of
gene banks will be able to be defined and documented by NIR spectra. Selection by
‘‘data breeding’’ of high-quality genotypes as whole spectroscopic patterns in a
PCA is extremely cost-effective. The instruments already available now are, how-
ever, with few exceptions only used for specific analytes.
In order to fully introduce the advantages of the new technology, the conserva-
tive market on cereal handling and processing have to be convinced of the advan-
tages for seeds tailored and marketed for specific uses. Sorting individual seeds in
full production scale for complex quality traits by NIRS launches new opportunities
for added value in cereal production if the process can be made economical.
Already, the introduction of the now available pilot-scale NIR seed sorters in
early generation selection will drastically change theory in genetics and the logis-
tics of quality improvement in plant breeding. In fact, NIRS introduces a new
exploratory view on the phenome in systems biology (Munck, 2007). The newchallenge for the universities and the industry is to create a renaissance in classicalplant breeding by the new high-tech direct tools for observation and selection. Asecond generation of plant breeders should be educated who can combine thetraditional phenomenological ‘‘top down’’ and the molecular ‘‘bottom up’’ per-spectives bound together by the advanced data and screening technology that nowis available.
Acknowledgments The contribution to figures, tables, and language correction, from my
colleagues Birthe Møller, Lars Nørgaard and Gilda Kischinovsky, is gratefully acknowledged.
Bo Løfqvist, A.B. Bomill, and Lund Sweden has kindly supplied the data in Table 4. I am indebted
to the great number of friends, coworkers, and employers in Sweden, Denmark, and
internationally, who have inspired me when writing this chapter.
References
Aastrup, S. and Munck, L. (1984) A b-glucan mutant in barley with thin cellwalls. In: R.D. Hill
and L. Munck (Eds.), New Approaches to Research on Cereal Carbohydrates. Elsevier,Amsterdam, pp. 291–296.
Aastrup, S., Gibbons, G.C. and Munck, L. (1981) A rapid method for estimating the degree of
modification in barley by measurement of cell wall breakdown. Carlsberg Research Commu-nications 46, 77–86.
Breeding for Quality Traits in Cereals 361
Abdel-Aal, E. and Wood, P.J. (Eds.) (2005) Specialty Grains for Food and Feed. American
Association of Cereal Chemists, St. Paul, MN.
Anderson, O. (1996) Molecular approaches to cereal quality improvement. In: R.J. Henry and P.S.
Kettlewell (Eds.), Cereal Grain Quality. Chapman and Hall, London, pp. 371–404.
Arus, P. and Gonzales, J. (1993) Marker-assisted selection. In: M.D. Hayward, N.O. Bosemark and
I. Romagosa (Eds.), Plant Breeding: Principles and Prospects. Chapman and Hall, London,
pp. 314–331.
Axtell, J.D. (1981). Breeding for improved nutritional quality. In: K.J. Frey (Ed.), Plant BreedingII. Iowa State University Press, Ames, IA, pp. 365–432.
Bach Knudsen, K.E. and Munck, L. (1985) Dietary fibre contents and compositions of sorghum
and sorghum-based foods. Journal Cereal Science 3, 153–164.Bergman, C.J., Bhattacharya, K.R. and Ohtsubo, K. (2003) Rice and end use quality analysis. In:
E.T. Champagne (Ed.), Rice: Chemistry and Technology. American Association of Cereal
Chemists, St. Paul, MN, pp. 415–472.
Bhatty, R.S. (1993) Nonmalting uses of barley. In: A.W. MacGregor and R.S. Bhatty. Barley:Chemistry and Technology. American Association of Cereal Chemists, St. Paul, MN, pp.
355–418.
Bjørnstad, A., Westad, F. and Martens, H. (2004) Analysis of genetic marker-phenotype relation-
ships by jack-knifed partial least squares regression (PLSR). Hereditas 141, 149–165.Brinch-Pedersen, H., Olesen, A., Rasmussen, S.K. and Holm, P.B. (2000) Generation of transgenic
wheat for constitutive accumulation of an Aspergillus phytatase. Molecular Breeding 6,
195–206.
Burrows, V.D. (1986) Breeding oats for food and feed: conventional and new techniques and
materials. In: F.H. Webster (Ed.), Oats: Chemistry and Technology. American Association of
Cereal Chemists, St. Paul, MN.
Chetverikov, S.S. (1926) On certain aspects on the evolutionary process. Translated from the
original article in Zurnal Eksperimentalnoi Biologii, A2, -54 by M. Barker. In: Proc. American
Phil. Soc. 105(2), 167–195.
Childs, N.W. (2003) Production and utilization of rice. In: E.T. Champagne (Ed.), Rice: Chemistryand Technology. American Association of Cereal Chemists, St. Paul, MN, pp. 1–23.
Collins, F.W. (1986) Oat phenolics: structure, occurrence and function. In: F.H. Webster (Ed.),
Oats: Chemistry and Technology. American Association of Cereal Chemists, St. Paul, MN, pp.
227–291.
Darrah, L.L., MacMullen, M.D. and Zuber, M.S. (2003) Breeding genetics and seed corn produc-
tion. In: P.J. White and L.A. Johnson (Eds.), Corn: Chemistry and Technology. American
Association of Cereal Chemists, St. Paul, MN, pp. 35–67.
Delwiche, S.R., Graybosch, R.A. and Peterson, J. (1999) Identification of wheat lines possessing
the 1AL.1RS or 1BL.1RS wheat-rye translocation by near-infrared spectroscopy. CerealChemistry 76(2), 255–260.
Druka, A., Muehlbauer, G., Druka, I., Caldo, R., Baumann, U., Rostoks, N., Schreiber, A., Wise,
R., Close, T., Kleinhofs, A., Graner, A., Schulman, A., Langridge, P., Sato, K., Hayes, P.,
McNicol, J., Marshall, D. and Waugh, R. (2006) An atlas of gene expression from seed to seed
through barley development. Functional and Integrative Genomics 6(3), 202–211. Available athttp://www.barleybase.org
Dudley, J.W. and Lambert, R.J. (1969) Genetic variability after 65 generations of selection in
Illinois high oil–low oil, high protein and low protein strains of Zea mays. Journal of CropScience 9(2), 179–181.
Eckhoff, S.R. and Paulsen, M.R. (1996) Maize. In: R.J. Henry and P.S. Kettlewell (Eds.), CerealGrain Quality. Chapman and Hall, London, pp. 77–112.
Fitzgerald, M. (2003) Starch. In: E.T. Champagne (Ed.), Rice: Chemistry and Technology.American Association of Cereal Chemists, St. Paul, MN, pp. 109–141.
Gottlieb, D.M., Schultz, J. Bruun, S.W., Jacobsen, S. and Søndergaard, I. (2004). Multivariate
approaches in plant science. Phytochemistry 65, 1531–1548.
362 L. Munck
Graybosch, R.A. (1998) Waxy wheatOs: origin, properties, prospects. Trends in Food Science andTechnology 9, 135–142.
Horvath, H., Huang, J., Wong, O.T. and von Wettstein, D. (2002) Experiences with genetic
transformation of barley and characteristics of transgenic plants. In: G.A. Slafer, J-L.
Molina-Cano, R. Savin, J.L. Araus and I. Romagosa (Eds.), Barley Science: Recent Advancesfrom Molecular Biology to Agronomy of Yield and Quality. Food Products Press, New York,
NY, pp. 143–204.
House, L.R. (1995) Sorghum and millets: history, taxonomy and distribution. In: D.A.V. Dendy
(Ed.), Sorghum and Millets: Chemistry and Technology. The American Association of Cereal
Chemistry, St. Paul, MN, pp. 1–10.
Jacobsen, S., Søndergaard, I., Møller, B., Desler, T. and Munck, L. (2005) A chemometric
evaluation of the underlying physical and chemical patterns that support near Infrared spec-
troscopy of barley seeds as a tool for explorative classification of endosperm genes and gene
combinations. Journal of Cereal Science 42(3), 281–299.Kleinhofs, A. and Han, F. (2002) Molecular mapping of the barley genome. In: G.A. Slafer, J.-L.
Molina-Cano, R, Savin, J.L. Araus and I. Romagosa (Eds.), Barley Science: Recent Advancesfrom Molecular Biology to Agronomy of Yield and Quality. Food Products Press, New York,
NY, pp. 31–64.
Knott, S.A. and Haley, C.S. (2000) Multitrait least squares for quantitative trait loci detection.
Genetics 156, 899–911.Lofqvist, B. and Pram Nielsen, J. (2003). A method of sorting objects comprising organic material.
European Patent EC B07C5/34; G01N21/35G.
MacKey, J. (1981) Cereal production. In: Y. Pomeranz and L. Munck (Eds.), Cereals: A Renew-able Resource. American Association of Cereal Chemists, St. Paul, MN, pp. 5–20.
Martens, H. and Ns, T. (1989) Multivariate Calibration. Wiley, Chichester.
Martens, H. and Ns, T. (2001) Multivariate calibration by data compression. In: P. Williams and
K. Norris (Eds.), Near Infrared Technology in the Agricultural and Food Industries. American
Association of Cereal Chemists, St. Paul, MN, pp. 59–100.
McCleary, B.V. and Prosky, L (2001) Advanced Dietary Fiber Technology. MPG Books Bodmin,
Cornwall.
Mosleth, E. and Uhlen, A.-K. (1990) Identification of quality-related gliadins and prediction of
bread-making quality from the electrophoretic patterns of gliadins and high molecular weight
subunits of glutenin. Norwegian Journal of Agricultural Science 4, 27–45.Mosleth Færgestad, E., Solheim Flæte, N.E., Magnus, E.M., Hollung, K., Martens, H. and Uhlen,
A.-K. (2004) Relationships between storage protein composition, protein content, growing
season and flour quality of bread wheat. Journal of the Science of Food and Agriculture 84,
887–886.
Munck, L. (1972) Improvement of nutritional value in cereals. Hereditas 72, 1–128.Munck, L. (1991) Quality criteria in the production chain from malting barley to beer. Ferment 4,
235–241.
Munck, L. (1992a) The contribution of barley to agriculture today and in the future. In: L. Munck
(Ed.), Barley Genetics VI. Muncksgaard Int. Publish. Ltd., Copenhagen, Denmark, pp. 1099–
1109.
Munck, L. (1992b) The case of high-lysine barley breeding. In: P.R. Shewry (Ed.), Barley:Genetics, Biochemistry, Molecular Biology and Biotechnology. C. A. B. Int., Great Britain,pp. 573–601.
Munck, L. (1993) On the utilization of renewable plant resources. In: M.D. Hayward, N.O.
Bosemark and I. Romagosa (Eds.), Plant Breeding Principles and Prospects. Chapman and
Hall, London, pp. 500–522.
Munck, L. (1995) New milling technologies and products whole plant utilization by milling and
separation of the botanical and chemical components. In: D.A.V. Dendy (Ed.), Sorghum andMillets: Chemisty and Technology. The American Association of Cereal Chemistry St. Paul,
MN, pp. 223–281.
Breeding for Quality Traits in Cereals 363
Munck, L. (2003) Detecting diversity – a new holistic exploratory approach. In: R. von Bothmer,
T. van Hintum, H. Knupffer and K. Sato (Eds.), Diversity in Barley. Elsevier Science B.V.,
Amsterdam, pp. 227–245.
Munck, L. (2004) Whole plant utilisation. Encyclopaedia of Grain Science, Elsevier, Amsterdam,
pp. 459–466.
Munck, L. (2005) The revolutionary aspect of exploratory chemometric technology. The Royal
and Veterinary University of Denmark, Narayana Press, Gylling, Denmark, pp. 352.
Munck, L. (2006) Conceptual validation of self-organisation studied by spectroscopy in an
endosperm gene model as a data driven logistic strategy in chemometrics. Chemometricsand Intelligent Laboratory Systems 84, 26–32.
Munck, L. (2007) A new holistic exploratory approach to Systems Biology by near infrared
spectroscopy evaluated by chemometrics and data inspection. Journal of Chemometrics 21,406–426.
Munck, L. and Møller, B. (2004) A new germinative classification model of barley for prediction
of malt quality amplified by a near infrared transmission spectroscopy calibration for vigour
‘‘on-line’’ both implemented by multivariate data analysis. Journal of the Institute of Brewing110(1), 3–17.
Munck, L. and Møller, B. (2005) Principal component analysis of near infrared spectra as a tool of
endosperm mutant characterisation and in barley breeding for quality. Czech Journal ofGenetics and Plant Breeding 41(3), 89–95.
Munck, L. and Rexen, F. (Eds.). (1990) Agricultural Refineries: A Bridge from Farm to Industry.The Commission of the European Communities, EUR 11583 EN.
Munck, L., Karlsson, K.E., Hagberg, A. and Eggum, B.O. (1970) Gene for improved nutritional
value in barley seed protein. Science 168, 985–987.Munck, L., Pram Nielsen, J., Møller, B., Jacobsen, S., Søndergaard, I., Engelsen, S.B.,
Nørgaard, L. and Bro, R. (2001) Exploring the phenotypic expression of a regulatory prote-
ome-altering gene by spectroscopy and chemometrics. Analytica Chimica Acta 446, 171–186.
Munck, L., M¿ller, B., Jacobsen, S. and S¿ndergaard, I. (2004) Near infrared spectra indicate
specific mutant endosperm genes and reveal a new mechanism for substituting starch with
(1!3, 1!4)-b-glucan barley. Journal of Cereal Science 40, 213–222.Murthy, D.S. and Kumar, K.A. (1995) Traditional uses of sorghum and millets. In: D.A.V. Dendy
(Ed.), Sorghum and Millets: Chemistry and Technology. The American Association of Cereal
Chemistry, St. Paul, MN, pp. 185–222.
Nørgaard, L., Saudland, A., Wagner, J., Nielsen, J.P., Munck, L. and Engelsen, S.B. (2000)
Interval partial least squares regression (iPLS): a comparative chemometric study with an
example from near-infrared spectroscopy. Applied Spectroscopy 54(3), 413–419.Nørgaard, L., Bro, R., Westad, F. and Balling Engelsen, S. (2006) A modification of canonical
variates to handle highly collinear multivariate data. Journal of Chemometrics 20, 425–435.Olsson, G. (Ed.). (1986) Svalof 1886–1986. LTs Publishers, Stockholm.
Paulsen, M.R., Watson, S.A. and Singh, M. (2003) Measurement and maintenance of Corn
Quality. In: P.J. White and L.A. Johnson (Eds.), Corn: Chemistry and Technology. American
Association of Cereal Chemists, St. Paul. MN, pp. 159–212.
Payne, P.I., Thompson, R., Bartels, R., Harberd, N., Harris, P. and Law, C. (1983) The high
molecular weight subunits of glutenin: classical genetics, molecular genetics and the relation-
ship with bread making quality. Proceedings of the 6th International Wheat Genetics Sympo-sium, Japan, pp. 827–834.
Petersen, P.B. and Munck, L. (1994) Whole crop utilization of barley including new potential uses.
In: A.W. MacGregor and R.S. Bhatty (Eds.), Barley Chemistry and Technology. The American
Association of Cereal Chemistry, St. Paul, MN, pp. 437–474.
Pilu, R., Panzeri, D., Gavazzi, G., Rasmussen, S.K., Consonni, G. and Nielsen, E. (2003)
Phenotypic, genetic and molecular characterization of a maize low phytic acid mutant
(lpa241). Theoretical and Applied Genetics 107, 980–987.
364 L. Munck
Poulsen, H.D., Johansen, K.S., Hatzack, F. Boisen, S. and Rasmusssen, S.K. (2001) The nutritional
value of low phytate barley evaluated in rats. Acta Agriculturae Scandinavica – Section A,Animal Science 51, 53–58.
Pram Nielsen, J. and Lsfqvist, B. (2006) Method and device for sorting objects. European Patent
EC B07C5/36C1; BO75/34.
Pram Nielsen, J.P., Pedersen, D.K. and Munck, L. (2003) Development of non-destructive
screening methods for single kernel characterisation of wheat. Cereal Chemistry 80, 274–280.Ramage, R.T. (1987) A history of barley breeding methods. Plant Breeding Reviews 5, 95–138.Rasmussen, S.K. and Hatzak, F. (1998) Identification of two low phytate barley grain mutants by
TLC and genetic analysis. Hereditas 129, 107–112.Rooke, M.S., Bekes, F., Fido, R., Barro, F., Gras, P., Tatham, A.S., Barcelo, P., Lazzeri, P. and
Shewry, P.R. (1999) Over expression of a gluten protein in transgenic wheat results in greatly
increased dough strength. Journal of Cereal Science 30, 115–120.Rooney, L.W. and Serna-Salvidar, S.O. (2003) Food use of whole corn and dry-milled fractions.
In: P.J. White and L.A. Johnson (Eds.), Corn: Chemistry and Technology. American Associa-
tion of Cereal Chemists, St. Paul, MN, pp. 496–535.
Rudi, H., Uhlen, A.K., Harstad, O.M. and Munck, L (2006) Genetic variability in cereal carbohy-
drate compositions and potentials for improving nutritional value. Animal Feed Science andTechnology 130(1–2), 55–65.
Schofield, J.D. (1994) Wheat proteins: structure and functionality in milling and bread making. In:
W. Bushuk and V.F. Rasper (Eds.),Wheat – Production, Properties and Quality. Chapman and
Hall, Glasgow, pp. 73–105.
Scoles, G.J., Gustafson, J.P. and McLeod, J.G. (2001) Genetics and breeding. In: W. Bushuk (Ed.),
Rye: Production, Chemistry and Technology. American Association of Cereal Chemists, St.
Paul, MN, pp. 9–35.
Seibel, W. and Weipert, D. (2001) Bread baking and other food uses around the world. In: W.
Bushuk (Ed.), Rye: Production, Chemistry and Technology. American Association of Cereal
Chemists, St. Paul, MN, pp. 147–211.
Serna-Saldivar, S. and Rooney, L.W. (1995) Structure and chemistry of sorghum and millets. In:
D.A.V. Dendy (Ed.), Sorghum and Millets: Chemistry and Technology. The American Associ-
ation of Cereal Chemistry, St. Paul, MN, pp. 69–124.
Shewry, P.R. (1992) Barley seed proteins. In: P.R. Shewry (Ed.), Barley: Genetics, Biochemistry,Molecular Biology and Biotechnology. C.A.B. International, Wallingford. U.K., pp. 319–335.
Shewry, P.R. and Casey, R. (Eds.) (1999) Seed Proteins. Kluwer, ISBN 0-4128-1570-2.
Stafford, J.V. (Ed.). (1999) Precision Agriculture 99. Part II and I. Sheffield Academic Press,
Sheffield.
Swanston, J.S. and Ellis, R.P. (2002) Genetics and breeding of malt quality attributes. In: G.A.
Slafer, J.-L. Molina-Cano, R. Savin, J.L. Araus and I. Romagosa (Eds.), Barley Science:Recent Advances from Molecular Biology to Agronomy of Yield and Quality. Food Products
Press, New York, NY, pp. 85–114.
Thomas, W.T.B. (2002) Molecular marker-assisted versus conventional selection. In: G.A. Slafer,
J.-L. Molina-Cano, R. Savin, J.L. Araus and I. Romagosa (Eds.), Barley Science: RecentAdvances from Molecular Biology to Agronomy of Yield and Quality. Food Products Press,
New York, NY, pp. 177–204.
Ullrich, S. (2002) Genetics and breeding of barley feed quality attributes. In: G.A. Slafer, J.-L.
Molina-Cano, R. Savin, J.L. Araus and I. Romagosa (Eds.), Barley Science: Recent Advancesfrom Molecular Biology to Agronomy of Yield and Quality. Food Products Press, New York,
NY, pp. 115–142.
van Harten, A.M. (1998) Mutation Breeding – Theory and Applications, Cambridge University
Press, Cambridge.
Vasal, S.K. (1999) Qualiy maize story. In: Improving Human Nutrition Through Agriculture.Intern. Rice Res. Inst., Los Banos, Philippines, pp. 1–19.
Breeding for Quality Traits in Cereals 365

Williams, P.C. (2002) Near infrared spectroscopy of cereals. In: J.M. Chalmers and V.R. Griffiths
(Eds.), Handbook of Vibrational Spectroscopy. Wiley, Chichester. Vol. 5, pp. 3693–3719.
Wilson, L.M., Whitt, R.S., Ibanez, A.M., Rocheford, T.R., Goodman, M.M. and Buckler IV, E.S.
(2004) Dissection of maize kernel composition and starch production by candidate gene
association. The Plant Cell 16, 2719–2733.Wrigley, C.W. and Morris, C.F. (1996) Breeding for quality improvement. In: R.J. Henry and
P. Kettlewell (Eds.), Cereal Grain Quality. Chapman and Hall, London, pp. 326–369.
366 L. Munck
Breeding for Silage Quality Traits in Cereals
Y. Barriere, S. Guillaumie, M. Pichon, and J.C. Emile
Abstract Forage plants are the basis of ruminant nutrition. Among cereal forages,
maize cropped for silage making is the most widely used. Much research in
genetics, physiology, and molecular biology of cereal forages is thus devoted to
maize, even if silage of sorghum or immature small-grain cereals and straws of
small-grain cereals are also given to cattle. Cell wall digestibility is the limiting
factor of forage feeding value and is, therefore, the first target for improving their
feeding value. Large genetic variation for cell wall digestibility was proven from
both in vivo and in vitro experiments in numerous species. Among the regular
maize hybrids [excluding brown-midrib (bm) ones], the cell wall digestibility
nearly doubled from 32.9% to 60.1%. Genetic variation has also been proven in
cell wall digestibility of sorghum and wheat, barley or rice forage, or straw, with
lower average values than in maize. Despite lignin content is well known as an
important factor making cell wall indigestible, breeding for a higher digestibility of
plant needs the use of specific traits estimating the plant cell wall digestibility.
Quantitative trait loci (QTL) analysis, studies of single-nucleotide polymorphism
(SNP) � feeding value traits relationships, studies of mutants and deregulated
plants, and expression studies will contribute to the comprehensive knowledge of
the lignin pathway and cell wall biogenesis. Plant breeders will then be able to
choose the best genetic and genomic targets for the improvement of plant digest-
ibility. Favorable alleles or favorable QTL for cereal cell wall digestibility will thus
be introgressed in elite lines through marker-assisted introgression. Efficient breed-
ing of maize and others annual forage plants demands a renewing of genetic
resources because only a limited number of lines are actually known with a high
cell wall digestibility. Among bm genes, the bm3 mutant in maize and the bmr12
(and possibly bmr18) mutant in sorghum, which are both altered in the caffeic acid
O-methyltransferase (COMT) activity, appeared as the most efficient in cell wall
digestibility improvement. Genetic engineering is both an inescapable tool in
mechanism understanding and an efficient way in cereal breeding for improved
feeding value. Moreover, gene mining and genetic engineering in model plant
Y. Barriere(*)
Unite de Genetique et d’Amelioration des Plantes Fourrageres, INRA, Route de Saintes, BP6,
F-86600 Lusignan, France, e-mail: [email protected]
M.J. Carena (ed.), Cereals,DOI: 10.1007/978-0-387-72297-9, # Springer Science + Business Media, LLC 2009 367
and systems (Arabidopsis, Zinnia, Brachypodium, . . .) are also essential comple-
mentary approaches for improvement of cell wall digestibility in grass and cereal
forage crops.
1 Introduction
Forage plants and cereals are the basis of energy nutrition of ruminant. However,
although forages contain almost the same amount of gross energy as do grains per
unit of dry matter (DM), the energy value of forages is lower and much more
variable, ranging approximately from 80% (leafy ray grass) to 33% (wheat straw) of
maize grain value. Silage maize energy value, which is among the highest forage
values, reached an average value of 6.3 MJ/kg DM, but is nearly equal only to 75%
of grain maize value. This difference results from the high content of cell walls in
forage plants and to the limited digestion of this fiber part by the microorganisms of
rumen and, to a lesser degree, of large intestine of animals. The quantitative
importance of lignins in the cell wall, their variable structure, and a variety of
cross-linkages between cell wall components all have variable depressive effects on
cell wall carbohydrate degradation by microorganisms in the rumen and/or large
intestines of herbivores (Barriere et al., 2003a, 2004a, b; Grabber et al., 2004; Ralph
et al., 2004). The energy supplied by a forage plant in animal diets is thus related to
the forage or silage intake and digestibility. For a given animal, intake and digest-
ibility are plant characteristics resulting of plant growth and cell wall development.
Both traits are subject to plant genetic variation and are, therefore, of major interest
in breeding for silage quality in cereals.
Protein content is also a trait of major interest in animal nutrition. Observed
variation between grass genotypes are mostly related to the nitrogen dilution law
[nitrogen = 3.40� (yield�0.37)], with lower nitrogen content in plants when the DM
yield is higher (Plenet and Cruz, 1997). True variation for protein content is low,
especially in maize, and programs devoted to the improvement of protein content in
whole plant of cereals did seemingly not really succeeded. However, the low
protein content of ensiled cereal diets is easily corrected by cattle cakes (soya,
sunflower, and rapeseed). Moreover, the availability of sunflower and rapeseed
cakes is expected to increase with oleaginous plants cropping for biofuel produc-
tion. An alternative to the use of cattle cakes for the improvement of silage protein
content is the mixed cropping and ensiling of small grain cereals with legumes such
as vetch or pea.
Among cereals cropped for silage making, maize is the most widely used.
Sorghum and immature small-grain cereals (wheat, barley, triticale, . . .) are also
given to cattle after ensiling. Straws, including rice straws in tropical areas, are also
used for cattle feeding after grain harvest. Because of the economic importance of
the ‘‘corn’’ crop worldwide, and of the economic importance of forage maize in
Europe, much research in physiology, genetics, and molecular biology of cereals
and grasses silage quality traits is devoted to maize. However, due to the close
phylogenic positions of grasses, breeding targets of interest in maize should easily
368 Y. Barriere et al.
be extrapolated to other C4 and C3 grasses. The focus of this chapter will be on
maize, as there are more little data available on cell wall digestibility improvement
in other cereals, but information on other cereals cropped for silage will also be
reported when available.
2 Genetic Variations for Cell Wall Digestibility in Cereals
2.1 Devising an Estimate of Cell Wall Digestibility
Cell wall digestibility, which is the limiting factor of the energy availability in
cattle, is the key target for improving the energy value of ensiled cereal crops. This
trait is also free of digestible starch and soluble carbohydrate contents that are
subject to extensive environmental variation. Moreover, due to rumen microorgan-
ism ecology and correlative acidosis risks, the optimal grain content in cereal
silages has to be adjusted according to the extra starch content of the diet, and
according to the proportion of by-pass starch. Higher grain content in the cereal
silages is favorable if the diet included grass silage, whereas the optimum starch
content in maize is lower and was thus proved to be close to 30% when no other raw
food is given to dairy cattle (Barriere and Emile, 1990; Barriere et al., 1997). This
result, which was shown in maize, is very likely true in immature small-grain
cereals which have a lower content of by-pass starch.
The more relevant assessments of plant digestibility are done with animals, and
these measurements were mostly often based on sheep in digestibility crates. For
practical and financial reasons, digestibility assessments done during breeding cycles
have to be performed using in vitro tests of digestibility and must be easily and
accurately predicted through near infrared reflectance spectroscopy (NIRS). The first
in vitro digestibility trait (IVDMD) was proposed by Tilley and Terry (1963) and was
based on plant sample degradation by rumen fluid taken from fistulated cows.
Different whole plant enzymatic IVDMD were also developed in Europe, including
the one of Aufrere andMichalet-Doreau (1983) used in France for hybrid registration,
which are of easier management and lower costs as they do not required anaerobic
conditions or the maintenance of animals giving rumen fluid. NIRS calibrations for
both Tilley and Terry and enzymatic IVDMD were developed in different European
and US labs. Correlations between these different enzymatic IVDMD are high and
most often greater than 0.90 (INRA Lusignan, unpublished data). For plant breeding
purpose, cell wall digestibility can be easily computed, based on a Tilley–Terry or an
enzymatic IVDMD and on content in cell wall or noncell wall constituents of the
plants (all traits predicted through NIRS calibrations). As proposed by Struik (1983)
and Dolstra and Medema (1990), the in vitro neutral detergent fiber digestibility
(IVNDFD) can be computed assuming that the non-NDF part (NDF; Goering and van
Soest, 1971) of plant material is completely digestible
[IVNDFD = 100 � (IVDMD � (100 � NDF))/NDF].
Breeding for Silage Quality Traits in Cereals 369
Complementarily, according to Argillier et al. (1995) and Barriere et al. (2003a),
the in vitro digestibility of the ‘‘non starch, non soluble carbohydrates, and non
crude protein’’ part (DINAGZ) is computed assuming these three constituents are
completely digestible.
½DINAGZ ¼ 100� ðIVDMD� ST� SC� CPÞ=ð100� ST� SC� CPÞ�
where ST, SC, and CP are starch, soluble carbohydrates, and crude protein contents,
respectively.
Either for evaluation of genetic resources or during successive generation of elite
hybrid breeding, lignin content and cell wall digestibility estimates are easier and
cheaper to obtain from lines rather than after topcrossing. Moreover, variance of
traits is greater in lines than in hybrids. Correlations between hybrid values and per
se values ranged between 0.62 and 0.94 for cell wall digestibility traits and between
0.63 and 0.87 for lignin content in maize, while similar correlations were low for
starch content and did not exceed 0.30 (Barriere et al., 2003a). These results
strengthened the relevance of choice of lines from their per se value in breeding
cycle for the improvement of forage cell wall digestibility in maize. This result is
also very likely true in sorghum.
Reported correlations between Tilley–Terry and enzymatic IVDMD ranged in
maize from 0.50 and 0.84, while correlations between enzymatic IVDMD and in
vivo organic matter digestibility ranged from 0.57 to 0.82 (Barriere et al., 2003a).
An important concern is therefore that in vivo and in vitro methods does rank, or
not, genotypes in a similar order. Comparisons of hybrids ranking based either on
in vivo data (Barriere et al., 2004a) or on in vitro correlative values (INRA
Lusignan, unpublished data) showed that both NDF digestibility (NDFD) and
IVNDFD or DINAGZ traits allowed similarly to the elimination of hybrids with
poor cell wall digestibility, or to the choice of hybrids with high cell wall
digestibility, including bm3 hybrids. Breeding for higher cell wall digestibility
is thus efficient when it is based on an in vitro trait, such as IVNDFD, DINAGZ,
or a Tilley–Terry-based estimate. However, in restricted ranges of variation such
as within subsamples of hybrids of low, intermediate, or high cell wall digestibil-
ity, respectively, genotype ranking often partly differed whether an in vivo or in
vitro trait was used. The plant cell wall is not completely similarly degraded
when subjected to in vivo and in vitro conditions. This fact, which does not
impede breeding efficiency, could be more limiting during registration processes
if new hybrids are compared to a threshold value, inducing the possibility of
rejecting hybrids not significantly different from the accepted ones when they
would be fed to cattle, or the reverse.
2.2 Genetic Variation for Cell Wall Digestibility in Maize
Data giving variation for maize in vivo organic matter digestibility (OMD) are
available from several investigations. Conversely, in vivo cell wall digestibility
370 Y. Barriere et al.
variation was rarely investigated in maize or other cereals. From a study based on
478 hybrids (Barriere et al., 2004a), the in vivo cell wall digestibility in maize
(estimated as NDFD) nearly doubled from 32.1% to 60.4% with an average value
equal to 48.8%. Whereas the genotype effect for NDFD was highly significant, the
NDFD genotype� year interaction was not significant, strengthening the interest of
cell wall traits during breeding programs. Studies of genotypic correlations showed
that OMD was related to NDFD (r = 0.76) but not to grain content (r = �0.16).
Similarly, the correlation between NDF content and NDFD was also low (r = 0.10),
highlighting that no significant relationship existed between the cell wall digest-
ibility and the cell wall content for maize plants harvested at a similar maturity
stage. Based on the results obtained in ruminants, the genetic progress in plant
energy value appears thus directly related to NDFD improvement. Besides these in
vivo investigations, much research has shown large genetic variations in the in vitro
cell wall digestibility of maize (Argillier et al., 2000; Barriere et al., 1997), with
similarly, small genotype � environment interaction effects compared to main
effects. Heritability of in vivo and in vitro cell wall digestibility traits was high,
ranging between 0.65 and 0.80, and it was at least equal to that of yield (Roussel
et al., 2002). Breeding for higher in vitro cell wall digestibility values should
therefore be very efficient, and the expected progress for the first selection cycle
of breeding for cell wall digestibility could thus reach 3.0% points.
The genetic variations in cell wall digestibility of maize silage have conse-
quences on young bull or dairy cow performances, even if maize was not the only
constituent of the diet (Barriere et al., 1995a, b; Emile et al., 1996; Hunt et al., 1993;
Istasse et al., 1990), strengthening the interest of breeding silage maize for higher
cell wall digestibility. All other factors being equal, when comparing hybrids with
low or high cell wall digestibility in dairy cows, fat-corrected milk (FCM) yields
could differ from 1 to 3 kg among hybrids. The protein contents in milk were also
equal or higher in hybrids with higher cell wall digestibility. In a similar way,
differences in average daily gains of young bulls reached 100 g/day among hybrids.
2.3 Genetic Variation for Cell Wall Digestibility in Sorghumand Small-Grain Cereals
Cell wall digestibility was shown lower in sorghum silages than in maize silages,
with values ranging between 40% and 45% when maize values ranged between
39% and 59% (Barriere et al., 2003a). Sorghum silage had similarly lower OMD
values than maize, despite the fact that some grain sorghum silages had higher grain
content than maize (Barriere et al., 2003a). This could be hypothetically related to
the different morphology of the two plants. Maize bears one ear at the lower third of
the plant when sorghum bears grainy panicle at its upper part with higher mechani-
cal constraints inducing likely a greater need of lignification and rigidity of the
stalk. Consequently, in most studies that compared sorghum with maize silage
Breeding for Silage Quality Traits in Cereals 371
(Aydin et al., 1999), milk production was consistently higher for cows fed maize
silage than for those fed sorghum silage. However, results of Mahanta and Pachauri
(2005) showed that some varieties of sorghum had a significantly higher cell-wall
digestibility than that of current varieties, leading to higher silage digestibility and
intake in sheep. As it was the case for maize few years, a higher silage energy value
is rarely a trait considered in sorghum-breeding programs.
Genetic variation in cell wall digestibility of small-grain cereals was rarely
investigated, either in silage, even most often in straws. From Barriere et al.
(2003a), average NDFD in triticale and wheat silage were close to 49%, and close
to 46% in rye, but these values were considered as significantly overestimated
because the low or very low forage intakes of awned plants by animals. Genetic
variation in cell wall digestibility of rice straw has been reported by Abou-el-Enin
et al. (1999) from 53 varieties with in sacco NDFD ranging from 21.2% to 31.1%.
Differences in IVDMD between varieties of barley and between varieties of oats
harvested at the soft-dough stage have been reported by Tingle and Dawley (1974),
likely related to difference in cell wall digestibility as plants were harvested at a
similar stage of maturity. Large differences in IVDMD of barley straw were also
reported by Capper et al. (1988). These differences were due to variations in cell
wall digestibility because the NDF content of straw is higher than 80%. Similarly,
varietal differences in IVDMD of rice straw have been reported and ranged from
23.6% to 36.9% (Vadiveloo, 1992) or from 23.6% to 35.6% (Agbagla-Dohnani
et al., 2001; in sacco OMD). When it was investigated, the variation in feeding
values of straws of different varieties of cereal crops affected the performance of
cattle (Capper et al., 1988; Orskov et al., 1988; Reid et al., 1988 quoted in Capper
et al., 1992; Schiere et al., 2004).
Cell wall digestibility of straw could not be used directly as a breeding criterion
in small-grain cereal improvement programs. This would induce extra costs that
could not be paid off by seed sales. However, identification of varieties with more
digestible straws is of interest for cattle breeders using their farm-produced straws.
Especially, in lands with limited availability of water during summer where ensiled
small-grain cereals could be an alternative to maize, varietal information on stem
cell wall digestibility can be obtained at low costs by cereals breeders or merchants
with important economical benefit in cattle feeding (Schiere et al., 2004). In
addition, small-grain cereals seems significantly used in complex mixture often
including wheat or triticale, oat, forage pea, and vetch, giving silages of higher yield
than pure legumes and of higher nitrogen content than pure cereals. However,
conversely to maize or sorghum, of which energy value varied little according to
the date of ensiling in a 27–35% interval of DM content, great decreases in cell wall
digestibility and energy content are observed in small-grain cereal silages, due to
the rapid decrease of stem digestibility during plant maturation. Cropping of
mixture of cereals and legumes can contribute partly to reduce the negative
susceptibility of plants to a small delayed harvest and improved the digestibility
of the mixed diet (Droushiotis, 1989).
372 Y. Barriere et al.
3 Intake as a Primary Nutritional Factor of Cattle Fed Cereal
Silages or Straws
3.1 Genetic Variation for Intake in Cereal Silages
Ruminants consuming forage diets, high in cell wall content, often are unable to eat
sufficient quantities of food to meet their energy demands. Voluntary intake is thus
a primary nutritional factor controlling animal production. DM content is the first
factor of intake variation in any silage. Moreover, DM contents are also involved in
optimal silage fermentation and conservation, in silage palatability. Maize DM
content between 32% and 37% allowed satisfactory compromises for these different
traits. For a given DM content, genetic variation in intake was first observed in
interspecific comparisons. Most studies that compared sorghum with maize silage
have shown that DM intake was consistently higher for cows fed maize silage than
for those fed sorghum silage, with lower cell wall digestibility. The average DM
intakes of sorghum silage were 81 and 85% that of maize, when fed to heifers or
dairy cows in the Cummings and McCullough (1969) and Aydin et al. (1999)
experiments, respectively. However, unpublished recent results at INRA Lusignan
have shown that intake of grain sorghum silage could be as high as intake of maize
silage, even if the milk production was lower or only equal to that of maize with
sorghum silage. Within species, Blaxter et al. (1961) and Hawkins et al. (1964),
respectively, first reported that voluntary intake was positively correlated with plant
digestibility and negatively correlated with its lignin content. Later, intake of maize
hybrids of low cell wall digestibility was shown lower than the intake of hybrids of
higher cell digestibility (Barriere et al., 1995a, b, 2003b, 2004c; Emile et al., 1996).
However, for a given and rather high cell wall digestibility, some rare hybrids were
shown to have indeed a higher intake in dairy cows than most of other ones. Ciba-
semences (1990, 1995) have shown a higher intake for the kindred hybrids, Briard
and Bahia, close to 0.5 and 1.0 kg, respectively, compared to a commonly used
hybrid. More demonstratively, the voluntary intake of hybrid DK265 in cattle was
proved to be greater than that of all other hybrids (Barriere et al., 1995a, 2004c).
When maize silage was given as about 80% of the diet, dairy cows fed DK265 silage
had an average intake reaching nearly 1.5 kg/day more than hybrids with the same
DM and grain contents, and, in two comparisons, with the same cell wall
digestibility.
3.2 Devising a Breeding Criterion for Genetic Improvementof Intake
Intake can be truly measured only with cattle. Mostly, due to the great impossibility
for plant breeders to work with cattle, there was then ‘‘a failure of most scientists to
recognize the importance of voluntary intake’’ (Minson and Wilson, 1994). The
Breeding for Silage Quality Traits in Cereals 373
regulation of intake in cattle is above all a physical regulation. The intake of a
forage is thus controlled by the time it needs to be broken in the mouth so to be
swallowed and the time this forage is retained in the rumen and ruminated until
particles reach a size close to 1 mm and escape out of the rumen through the
digestive tract (Fernandez et al., 2004; Jung and Allen, 1995; Minson and Wilson,
1994). All traits that make fiber particles physically strong and difficult to reduce in
size can be considered to be involved in variation of intake. Variations in cell wall
digestibility (NDFD) thus explained nearly one-half of intake variations in cows
(Barriere et al., 2003b). Scattered but convergent results allow hypothesizing that
the second half of genetic variations for intake are explained by plant tissue
friability and susceptibility to crushing, specific characteristics likely present at a
high level in hybrids, such as DK265, and explaining its extra intake. Intensity of
cross-linking within arabinoxylan chains and between arabinoxylans and lignins
through ferulic and diferulic acid bridges are probably linked to the stiffness and
mechanical properties of tissues (MacAdam and Grabber, 2002). Improvement of
cell wall digestibility in maize (and very likely in other cereal forage plants) will
bring about an improvement in intake. Complementarily, lowering cross-linkages
between cell compounds would also allow specifically an improvement of intake.
Breeding for lower ferulate cross-links is possible (Casler and Jung, 1999), even if it
is difficult to correlate, directly, content of ferulate release by solvolytic methods
and intensity of linkage in plant tissues (Grabber et al., 2004).
4 Genetic Resources for Cell Wall Digestibility Improvement
4.1 Necessity of Specific Genetic Resources for the Improvementof Feeding Value Traits
Maize is likely the plant species in which the genetic improvement for agronomic
traits was the most remarkable during the last five decades in Europe (Barriere et al.,
1987, 2005, 2006; Derieux et al., 1987), and in the last century in the USA (Russell,
1984; Troyer, 1999, 2002). In forage maize (Barriere et al., 1987, 2004a, 2005), the
genetic progress was close to 0.17 t/ha/year for hybrids registered in France between
1986 (the first year with registration after forage maize official trials) and 2000. In
the period before 1986, forage yield improvement was correlative to the genetic
progress in grain and was nearly equal to 0.10 t/ha/year (Barriere et al., 1987).
However, feeding value was not considered for forage maize registration until 1998
in France, even if little earlier in more northern countries, and a significant drift of
hybrids toward lower cell wall digestibility values was observed (Table 1) in the last
two or three decades (Barriere and Argillier, 1997; Barriere et al., 2004a). In the
USA, Lauer et al. (2001) highlighted an annual rate of forage yield increase of
0.13–0.16 t/ha since 1930. But they did not find any change in the cell wall
digestibility of plants, despite major improvement in stalk standability, and in
stalk-rot resistance, were achieved during the same period. The discrepancy
374 Y. Barriere et al.
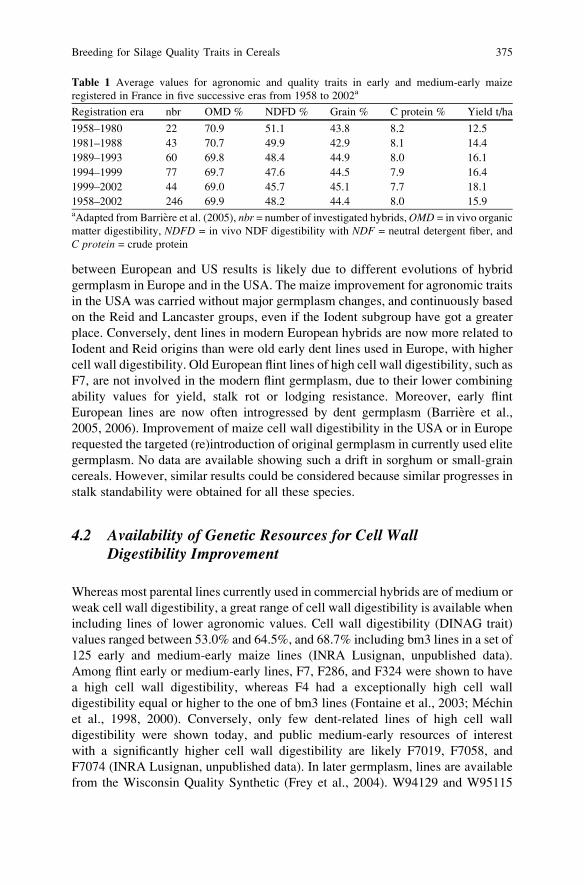
between European and US results is likely due to different evolutions of hybrid
germplasm in Europe and in the USA. The maize improvement for agronomic traits
in the USA was carried without major germplasm changes, and continuously based
on the Reid and Lancaster groups, even if the Iodent subgroup have got a greater
place. Conversely, dent lines in modern European hybrids are now more related to
Iodent and Reid origins than were old early dent lines used in Europe, with higher
cell wall digestibility. Old European flint lines of high cell wall digestibility, such as
F7, are not involved in the modern flint germplasm, due to their lower combining
ability values for yield, stalk rot or lodging resistance. Moreover, early flint
European lines are now often introgressed by dent germplasm (Barriere et al.,
2005, 2006). Improvement of maize cell wall digestibility in the USA or in Europe
requested the targeted (re)introduction of original germplasm in currently used elite
germplasm. No data are available showing such a drift in sorghum or small-grain
cereals. However, similar results could be considered because similar progresses in
stalk standability were obtained for all these species.
4.2 Availability of Genetic Resources for Cell WallDigestibility Improvement
Whereas most parental lines currently used in commercial hybrids are of medium or
weak cell wall digestibility, a great range of cell wall digestibility is available when
including lines of lower agronomic values. Cell wall digestibility (DINAG trait)
values ranged between 53.0% and 64.5%, and 68.7% including bm3 lines in a set of
125 early and medium-early maize lines (INRA Lusignan, unpublished data).
Among flint early or medium-early lines, F7, F286, and F324 were shown to have
a high cell wall digestibility, whereas F4 had a exceptionally high cell wall
digestibility equal or higher to the one of bm3 lines (Fontaine et al., 2003; Mechin
et al., 1998, 2000). Conversely, only few dent-related lines of high cell wall
digestibility were shown today, and public medium-early resources of interest
with a significantly higher cell wall digestibility are likely F7019, F7058, and
F7074 (INRA Lusignan, unpublished data). In later germplasm, lines are available
from the Wisconsin Quality Synthetic (Frey et al., 2004). W94129 and W95115
Table 1 Average values for agronomic and quality traits in early and medium-early maize
registered in France in five successive eras from 1958 to 2002a
Registration era nbr OMD % NDFD % Grain % C protein % Yield t/ha
1958–1980 22 70.9 51.1 43.8 8.2 12.5
1981–1988 43 70.7 49.9 42.9 8.1 14.4
1989–1993 60 69.8 48.4 44.9 8.0 16.1
1994–1999 77 69.7 47.6 44.5 7.9 16.4
1999–2002 44 69.0 45.7 45.1 7.7 18.1
1958–2002 246 69.9 48.2 44.4 8.0 15.9aAdapted from Barriere et al. (2005), nbr = number of investigated hybrids,OMD = in vivo organic
matter digestibility, NDFD = in vivo NDF digestibility with NDF = neutral detergent fiber, and
C protein = crude protein
Breeding for Silage Quality Traits in Cereals 375
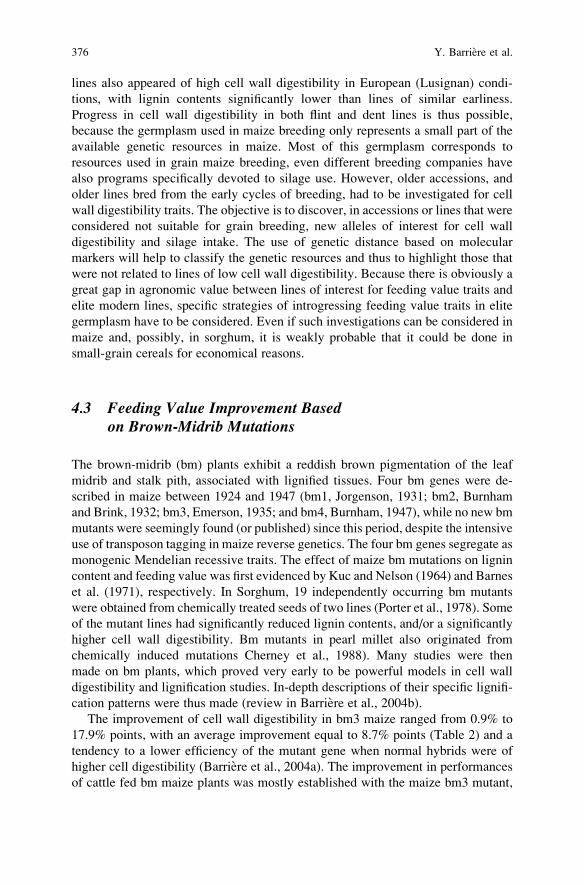
lines also appeared of high cell wall digestibility in European (Lusignan) condi-
tions, with lignin contents significantly lower than lines of similar earliness.
Progress in cell wall digestibility in both flint and dent lines is thus possible,
because the germplasm used in maize breeding only represents a small part of the
available genetic resources in maize. Most of this germplasm corresponds to
resources used in grain maize breeding, even different breeding companies have
also programs specifically devoted to silage use. However, older accessions, and
older lines bred from the early cycles of breeding, had to be investigated for cell
wall digestibility traits. The objective is to discover, in accessions or lines that were
considered not suitable for grain breeding, new alleles of interest for cell wall
digestibility and silage intake. The use of genetic distance based on molecular
markers will help to classify the genetic resources and thus to highlight those that
were not related to lines of low cell wall digestibility. Because there is obviously a
great gap in agronomic value between lines of interest for feeding value traits and
elite modern lines, specific strategies of introgressing feeding value traits in elite
germplasm have to be considered. Even if such investigations can be considered in
maize and, possibly, in sorghum, it is weakly probable that it could be done in
small-grain cereals for economical reasons.
4.3 Feeding Value Improvement Basedon Brown-Midrib Mutations
The brown-midrib (bm) plants exhibit a reddish brown pigmentation of the leaf
midrib and stalk pith, associated with lignified tissues. Four bm genes were de-
scribed in maize between 1924 and 1947 (bm1, Jorgenson, 1931; bm2, Burnham
and Brink, 1932; bm3, Emerson, 1935; and bm4, Burnham, 1947), while no new bm
mutants were seemingly found (or published) since this period, despite the intensive
use of transposon tagging in maize reverse genetics. The four bm genes segregate as
monogenic Mendelian recessive traits. The effect of maize bm mutations on lignin
content and feeding value was first evidenced by Kuc and Nelson (1964) and Barnes
et al. (1971), respectively. In Sorghum, 19 independently occurring bm mutants
were obtained from chemically treated seeds of two lines (Porter et al., 1978). Some
of the mutant lines had significantly reduced lignin contents, and/or a significantly
higher cell wall digestibility. Bm mutants in pearl millet also originated from
chemically induced mutations Cherney et al., 1988). Many studies were then
made on bm plants, which proved very early to be powerful models in cell wall
digestibility and lignification studies. In-depth descriptions of their specific lignifi-
cation patterns were thus made (review in Barriere et al., 2004b).
The improvement of cell wall digestibility in bm3 maize ranged from 0.9% to
17.9% points, with an average improvement equal to 8.7% points (Table 2) and a
tendency to a lower efficiency of the mutant gene when normal hybrids were of
higher cell digestibility (Barriere et al., 2004a). The improvement in performances
of cattle fed bm maize plants was mostly established with the maize bm3 mutant,
376 Y. Barriere et al.
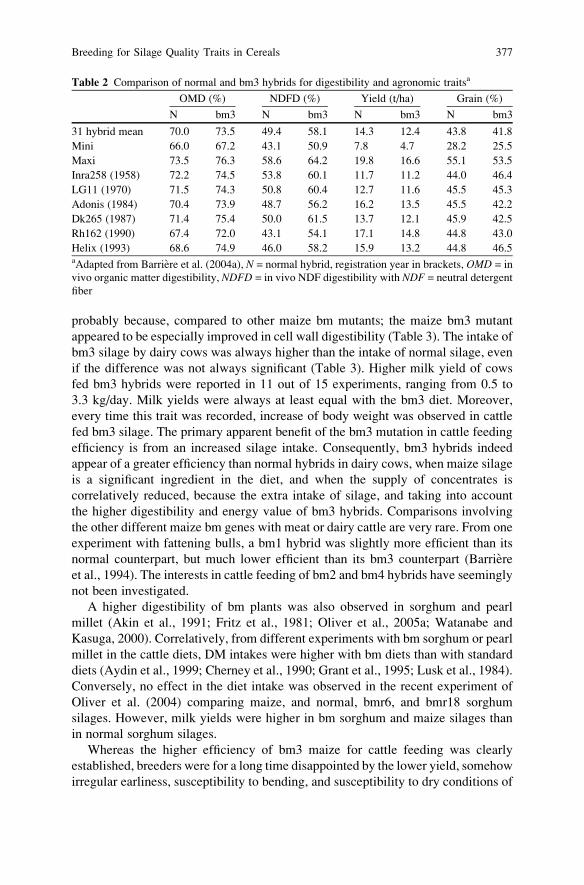
probably because, compared to other maize bm mutants; the maize bm3 mutant
appeared to be especially improved in cell wall digestibility (Table 3). The intake of
bm3 silage by dairy cows was always higher than the intake of normal silage, even
if the difference was not always significant (Table 3). Higher milk yield of cows
fed bm3 hybrids were reported in 11 out of 15 experiments, ranging from 0.5 to
3.3 kg/day. Milk yields were always at least equal with the bm3 diet. Moreover,
every time this trait was recorded, increase of body weight was observed in cattle
fed bm3 silage. The primary apparent benefit of the bm3 mutation in cattle feeding
efficiency is from an increased silage intake. Consequently, bm3 hybrids indeed
appear of a greater efficiency than normal hybrids in dairy cows, when maize silage
is a significant ingredient in the diet, and when the supply of concentrates is
correlatively reduced, because the extra intake of silage, and taking into account
the higher digestibility and energy value of bm3 hybrids. Comparisons involving
the other different maize bm genes with meat or dairy cattle are very rare. From one
experiment with fattening bulls, a bm1 hybrid was slightly more efficient than its
normal counterpart, but much lower efficient than its bm3 counterpart (Barriere
et al., 1994). The interests in cattle feeding of bm2 and bm4 hybrids have seemingly
not been investigated.
A higher digestibility of bm plants was also observed in sorghum and pearl
millet (Akin et al., 1991; Fritz et al., 1981; Oliver et al., 2005a; Watanabe and
Kasuga, 2000). Correlatively, from different experiments with bm sorghum or pearl
millet in the cattle diets, DM intakes were higher with bm diets than with standard
diets (Aydin et al., 1999; Cherney et al., 1990; Grant et al., 1995; Lusk et al., 1984).
Conversely, no effect in the diet intake was observed in the recent experiment of
Oliver et al. (2004) comparing maize, and normal, bmr6, and bmr18 sorghum
silages. However, milk yields were higher in bm sorghum and maize silages than
in normal sorghum silages.
Whereas the higher efficiency of bm3 maize for cattle feeding was clearly
established, breeders were for a long time disappointed by the lower yield, somehow
irregular earliness, susceptibility to bending, and susceptibility to dry conditions of
Table 2 Comparison of normal and bm3 hybrids for digestibility and agronomic traitsa
OMD (%) NDFD (%) Yield (t/ha) Grain (%)
N bm3 N bm3 N bm3 N bm3
31 hybrid mean 70.0 73.5 49.4 58.1 14.3 12.4 43.8 41.8
Mini 66.0 67.2 43.1 50.9 7.8 4.7 28.2 25.5
Maxi 73.5 76.3 58.6 64.2 19.8 16.6 55.1 53.5
Inra258 (1958) 72.2 74.5 53.8 60.1 11.7 11.2 44.0 46.4
LG11 (1970) 71.5 74.3 50.8 60.4 12.7 11.6 45.5 45.3
Adonis (1984) 70.4 73.9 48.7 56.2 16.2 13.5 45.5 42.2
Dk265 (1987) 71.4 75.4 50.0 61.5 13.7 12.1 45.9 42.5
Rh162 (1990) 67.4 72.0 43.1 54.1 17.1 14.8 44.8 43.0
Helix (1993) 68.6 74.9 46.0 58.2 15.9 13.2 44.8 46.5aAdapted from Barriere et al. (2004a), N = normal hybrid, registration year in brackets, OMD = in
vivo organic matter digestibility, NDFD = in vivo NDF digestibility with NDF = neutral detergent
fiber
Breeding for Silage Quality Traits in Cereals 377
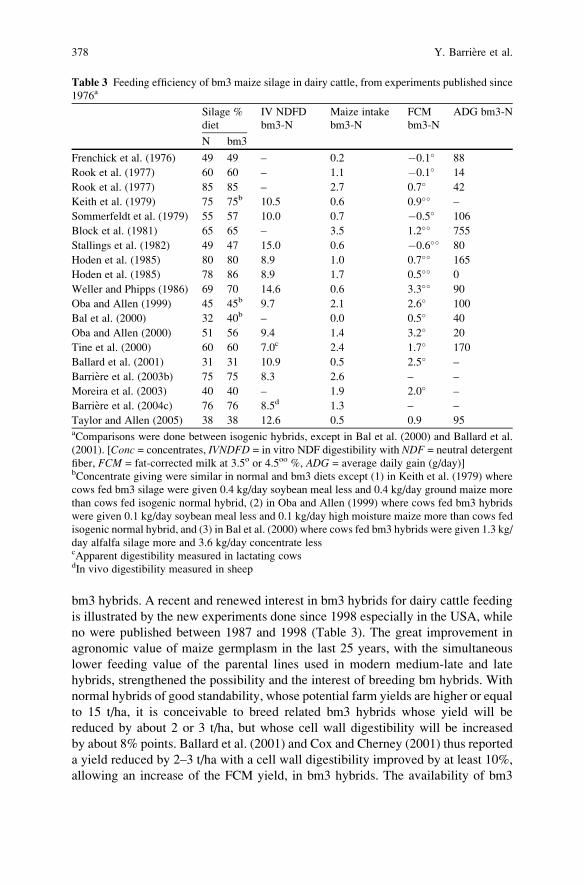
bm3 hybrids. A recent and renewed interest in bm3 hybrids for dairy cattle feeding
is illustrated by the new experiments done since 1998 especially in the USA, while
no were published between 1987 and 1998 (Table 3). The great improvement in
agronomic value of maize germplasm in the last 25 years, with the simultaneous
lower feeding value of the parental lines used in modern medium-late and late
hybrids, strengthened the possibility and the interest of breeding bm hybrids. With
normal hybrids of good standability, whose potential farm yields are higher or equal
to 15 t/ha, it is conceivable to breed related bm3 hybrids whose yield will be
reduced by about 2 or 3 t/ha, but whose cell wall digestibility will be increased
by about 8% points. Ballard et al. (2001) and Cox and Cherney (2001) thus reported
a yield reduced by 2–3 t/ha with a cell wall digestibility improved by at least 10%,
allowing an increase of the FCM yield, in bm3 hybrids. The availability of bm3
Table 3 Feeding efficiency of bm3 maize silage in dairy cattle, from experiments published since
1976a
Silage %
diet
IV NDFD
bm3-N
Maize intake
bm3-N
FCM
bm3-N
ADG bm3-N
N bm3
Frenchick et al. (1976) 49 49 – 0.2 �0.1� 88
Rook et al. (1977) 60 60 – 1.1 �0.1� 14
Rook et al. (1977) 85 85 – 2.7 0.7� 42
Keith et al. (1979) 75 75b 10.5 0.6 0.9�� –
Sommerfeldt et al. (1979) 55 57 10.0 0.7 �0.5� 106
Block et al. (1981) 65 65 – 3.5 1.2�� 755
Stallings et al. (1982) 49 47 15.0 0.6 �0.6�� 80
Hoden et al. (1985) 80 80 8.9 1.0 0.7�� 165
Hoden et al. (1985) 78 86 8.9 1.7 0.5�� 0
Weller and Phipps (1986) 69 70 14.6 0.6 3.3�� 90
Oba and Allen (1999) 45 45b 9.7 2.1 2.6� 100
Bal et al. (2000) 32 40b – 0.0 0.5� 40
Oba and Allen (2000) 51 56 9.4 1.4 3.2� 20
Tine et al. (2000) 60 60 7.0c 2.4 1.7� 170
Ballard et al. (2001) 31 31 10.9 0.5 2.5� –
Barriere et al. (2003b) 75 75 8.3 2.6 – –
Moreira et al. (2003) 40 40 – 1.9 2.0� –
Barriere et al. (2004c) 76 76 8.5d 1.3 – –
Taylor and Allen (2005) 38 38 12.6 0.5 0.9 95aComparisons were done between isogenic hybrids, except in Bal et al. (2000) and Ballard et al.
(2001). [Conc = concentrates, IVNDFD = in vitro NDF digestibility with NDF = neutral detergent
fiber, FCM = fat-corrected milk at 3.5o or 4.5oo %, ADG = average daily gain (g/day)]bConcentrate giving were similar in normal and bm3 diets except (1) in Keith et al. (1979) where
cows fed bm3 silage were given 0.4 kg/day soybean meal less and 0.4 kg/day ground maize more
than cows fed isogenic normal hybrid, (2) in Oba and Allen (1999) where cows fed bm3 hybrids
were given 0.1 kg/day soybean meal less and 0.1 kg/day high moisture maize more than cows fed
isogenic normal hybrid, and (3) in Bal et al. (2000) where cows fed bm3 hybrids were given 1.3 kg/
day alfalfa silage more and 3.6 kg/day concentrate lesscApparent digestibility measured in lactating cowsdIn vivo digestibility measured in sheep
378 Y. Barriere et al.
hybrids on the seed market in the USA has proved the feasibility of the use of this
particular genetic resource for cell wall digestibility improvement of commercial
hybrids, at least for late or medium-late hybrids. But the higher seed costs of bm3
commercial hybrids in the USA have obscured their economic interest. In Europe,
the reputation of bm3 genotypes is still poor, and they are always suspected of a
greater susceptibility to lodging, on top of their lower yields. An experimental
medium-early bm3 hybrid (F7026bm3 � F2bm3) bred at INRA Lusignan (Barriere
et al., 2003b) with a yield close to 13 t/ha, had thus a NDFD close to 59% and an
intake in dairy cows equal to 17.9 kg DM/cow/day, with an acceptable standability,
when normal hybrids of similar earliness yielded about 17 t/ha, with an NDFD
equal or lower than 47%, and an intake nearly equal to 15 kg DM/cow/day.
Improvement in yield, but also in standability, can be expected since the two
parental lines of this bm3 hybrid are representative of nearly 15-year old germ-
plasm. From comparison of bmr6 and bmr12 sorghum in different genetic back-
ground, Oliver et al. (2005a) and Oliver et al. (2005b) observed a reduced lignin
content and an improvement of cell wall digestibility in both bmr6 and bmr12
plants. Moreover, the bmr12 gene had less negative impact on agronomic traits and
greater positive impact on quality traits. The genes bmr12 in sorghum and bm3 in
maize both correspond both to an alteration of the caffeic acid O-methyltransferase
(COMT) gene (Vignols et al., 1995; Bout and Vermerris, 2003). Breeding bm
sorghum with improved feeding value is likely of greater short-term impact than
breeding bm maize, because of the lower feeding value of sorghum compared with
maize. Recent registration of bmr6 and bmr12 sorghum in the USA, simultaneously
with an increasing interest for bmr12 sorghum in France and southern Europe, thus
illustrated the interest of having more drought-tolerant forage cereals, such as
sorghum (Pedersen et al., 2006a, b, c), especially before further improvements of
maize in drought tolerance.
Nevertheless, the choice of using lower-yielding hybrids of higher feeding
value, is a matter of strategy which has yet to be agreed on, especially so in more
friendly environmental conditions of plant cropping and cattle rearing. The water
need of plants is linked to its yield. In C4 grasses, each millimeter of transpired
water allows the biosynthesis of 40 kg DM/ha. Plant yield has to be adjusted to
present and future water availability. A decrease in maize or sorghum yield by
5 t/ha corresponds to a reduced water use equal to 125 mm/ha, that could be
economically compensated by a significantly higher cell wall digestibility and
silage intake in such hybrids.
5 Investigating Quantitative Trait Loci for Cell Wall
Digestibility Improvement
Once lines of different feeding values and/or different genetic background
are identified, different recombinant inbred line (RIL) progenies can be developed
in order to determine the genomic location involved in feeding value traits.
Breeding for Silage Quality Traits in Cereals 379
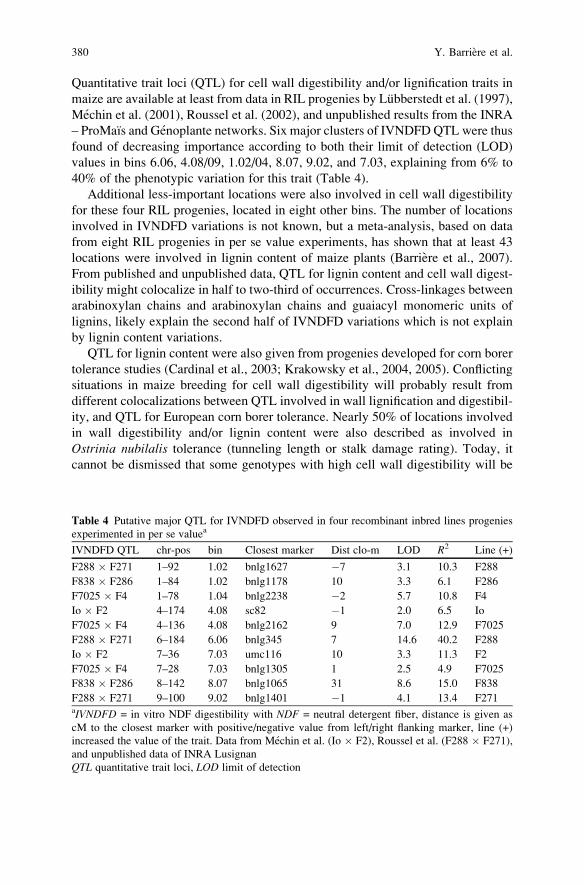
Quantitative trait loci (QTL) for cell wall digestibility and/or lignification traits in
maize are available at least from data in RIL progenies by Lubberstedt et al. (1997),
Mechin et al. (2001), Roussel et al. (2002), and unpublished results from the INRA
– ProMaıs and Genoplante networks. Six major clusters of IVNDFD QTL were thus
found of decreasing importance according to both their limit of detection (LOD)
values in bins 6.06, 4.08/09, 1.02/04, 8.07, 9.02, and 7.03, explaining from 6% to
40% of the phenotypic variation for this trait (Table 4).
Additional less-important locations were also involved in cell wall digestibility
for these four RIL progenies, located in eight other bins. The number of locations
involved in IVNDFD variations is not known, but a meta-analysis, based on data
from eight RIL progenies in per se value experiments, has shown that at least 43
locations were involved in lignin content of maize plants (Barriere et al., 2007).
From published and unpublished data, QTL for lignin content and cell wall digest-
ibility might colocalize in half to two-third of occurrences. Cross-linkages between
arabinoxylan chains and arabinoxylan chains and guaiacyl monomeric units of
lignins, likely explain the second half of IVNDFD variations which is not explain
by lignin content variations.
QTL for lignin content were also given from progenies developed for corn borer
tolerance studies (Cardinal et al., 2003; Krakowsky et al., 2004, 2005). Conflicting
situations in maize breeding for cell wall digestibility will probably result from
different colocalizations between QTL involved in wall lignification and digestibil-
ity, and QTL for European corn borer tolerance. Nearly 50% of locations involved
in wall digestibility and/or lignin content were also described as involved in
Ostrinia nubilalis tolerance (tunneling length or stalk damage rating). Today, it
cannot be dismissed that some genotypes with high cell wall digestibility will be
Table 4 Putative major QTL for IVNDFD observed in four recombinant inbred lines progenies
experimented in per se valuea
IVNDFD QTL chr-pos bin Closest marker Dist clo-m LOD R2 Line (+)
F288 � F271 1–92 1.02 bnlg1627 �7 3.1 10.3 F288
F838 � F286 1–84 1.02 bnlg1178 10 3.3 6.1 F286
F7025 � F4 1–78 1.04 bnlg2238 �2 5.7 10.8 F4
Io � F2 4–174 4.08 sc82 �1 2.0 6.5 Io
F7025 � F4 4–136 4.08 bnlg2162 9 7.0 12.9 F7025
F288 � F271 6–184 6.06 bnlg345 7 14.6 40.2 F288
Io � F2 7–36 7.03 umc116 10 3.3 11.3 F2
F7025 � F4 7–28 7.03 bnlg1305 1 2.5 4.9 F7025
F838 � F286 8–142 8.07 bnlg1065 31 8.6 15.0 F838
F288 � F271 9–100 9.02 bnlg1401 �1 4.1 13.4 F271aIVNDFD = in vitro NDF digestibility with NDF = neutral detergent fiber, distance is given as
cM to the closest marker with positive/negative value from left/right flanking marker, line (+)
increased the value of the trait. Data from Mechin et al. (Io � F2), Roussel et al. (F288 � F271),
and unpublished data of INRA Lusignan
QTL quantitative trait loci, LOD limit of detection
380 Y. Barriere et al.
more susceptible to pest damages, especially if corn borers susceptibility will not be
estimated simultaneously during cell wall digestibility improvement programs.
The genes underlying QTL for cell wall digestibility are not yet really known.
Several known genes of the maize lignin pathway have been found colocalizing
with QTL, but the biological significance is limited by the fact that most of the
genes of this pathway belong to large multigenic families. Except works with bm1
and bm3 mutants, and transgenic COMT antisense constructs (Piquemal et al.,
2002; He et al., 2003; Pichon et al., 2006), no functional analysis with lignin
pathway genes were seemingly published in maize. However, even genes underly-
ing QTL are still unidentified, their marker-assisted introgression based on the two
flanking markers into an elite genetic background is possible as soon as a QTL has
been detected. The efficiency of a breeding scheme based on anonymous markers
depends on the linkage phase between markers and target locus alleles.
6 Targeted Investigations of Genetic Resources for Cell Wall
Digestibility Improvement
Deregulation of gene expression through genetic engineering is an essential way
toward the understanding of lignification and cell wall biosynthesis in plants and,
therefore, of future improvements of cell wall digestibility in plants. Boudet (2000),
Chen et al. (2001), Dixon et al. (2001), and Halpin (2004) have recently published
extensive reviews of genetic engineering of the lignin pathway, with the resulting
consequences on lignin content and structure of altered transgenic plants. Even
most studies have been performed on dicotyledonous plants, including model plants
such as tobacco or Arabidopsis, the efficiency of antisense or silencing strategies inincreasing the cell wall digestibility of plants has been clearly established. Most of
recent significant understanding of the monolignol biosynthesis has been obtained
from both disrupted (transgenic) mutants and down- or upregulated plants (Chen
et al., 2006; Hoffmann et al., 2004; Reddy et al., 2005; Schoch et al., 2001).
Correlatively, the validation of a gene involvement in variation of cell wall digest-
ibility through genetic engineering or transposon tagging strengthens the interest of
investigating its natural allelic variation in available germplasm. Association stud-
ies between single-nucleotide polymorphism (SNP) or insertion–deletion polymor-
phism (INDEL) in cell wall-related genes, and cell wall digestibility, give
functional markers more efficiently used in marker-assisted selection than anony-
mous markers (Andersen and Lubberstedt, 2003).
Lignin pathway in plants and grasses begins after the shikimate pathway with the
deamination of L-phenylalanine into cinnamic acid. Successive steps including
hydroxylation and methylation on the aromatic ring lead to the production of
three monolignols (p-hydroxyphenyl, coniferyl, and syringyl alcohols), which are
polymerized into lignins. Moreover, grass lignins are typified by both the acylation
of the syringyl units by p-coumaric acid, and by numerous cross-linkages between
Breeding for Silage Quality Traits in Cereals 381
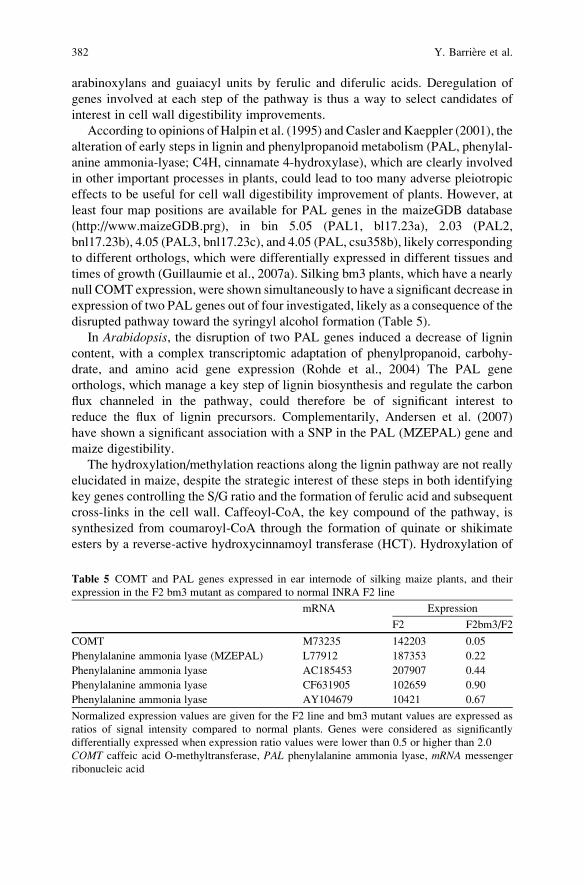
arabinoxylans and guaiacyl units by ferulic and diferulic acids. Deregulation of
genes involved at each step of the pathway is thus a way to select candidates of
interest in cell wall digestibility improvements.
According to opinions of Halpin et al. (1995) and Casler and Kaeppler (2001), the
alteration of early steps in lignin and phenylpropanoid metabolism (PAL, phenylal-
anine ammonia-lyase; C4H, cinnamate 4-hydroxylase), which are clearly involved
in other important processes in plants, could lead to too many adverse pleiotropic
effects to be useful for cell wall digestibility improvement of plants. However, at
least four map positions are available for PAL genes in the maizeGDB database
(http://www.maizeGDB.prg), in bin 5.05 (PAL1, bl17.23a), 2.03 (PAL2,
bnl17.23b), 4.05 (PAL3, bnl17.23c), and 4.05 (PAL, csu358b), likely corresponding
to different orthologs, which were differentially expressed in different tissues and
times of growth (Guillaumie et al., 2007a). Silking bm3 plants, which have a nearly
null COMT expression, were shown simultaneously to have a significant decrease in
expression of two PAL genes out of four investigated, likely as a consequence of the
disrupted pathway toward the syringyl alcohol formation (Table 5).
In Arabidopsis, the disruption of two PAL genes induced a decrease of lignin
content, with a complex transcriptomic adaptation of phenylpropanoid, carbohy-
drate, and amino acid gene expression (Rohde et al., 2004) The PAL gene
orthologs, which manage a key step of lignin biosynthesis and regulate the carbon
flux channeled in the pathway, could therefore be of significant interest to
reduce the flux of lignin precursors. Complementarily, Andersen et al. (2007)
have shown a significant association with a SNP in the PAL (MZEPAL) gene and
maize digestibility.
The hydroxylation/methylation reactions along the lignin pathway are not really
elucidated in maize, despite the strategic interest of these steps in both identifying
key genes controlling the S/G ratio and the formation of ferulic acid and subsequent
cross-links in the cell wall. Caffeoyl-CoA, the key compound of the pathway, is
synthesized from coumaroyl-CoA through the formation of quinate or shikimate
esters by a reverse-active hydroxycinnamoyl transferase (HCT). Hydroxylation of
Table 5 COMT and PAL genes expressed in ear internode of silking maize plants, and their
expression in the F2 bm3 mutant as compared to normal INRA F2 line
mRNA Expression
F2 F2bm3/F2
COMT M73235 142203 0.05
Phenylalanine ammonia lyase (MZEPAL) L77912 187353 0.22
Phenylalanine ammonia lyase AC185453 207907 0.44
Phenylalanine ammonia lyase CF631905 102659 0.90
Phenylalanine ammonia lyase AY104679 10421 0.67
Normalized expression values are given for the F2 line and bm3 mutant values are expressed as
ratios of signal intensity compared to normal plants. Genes were considered as significantly
differentially expressed when expression ratio values were lower than 0.5 or higher than 2.0
COMT caffeic acid O-methyltransferase, PAL phenylalanine ammonia lyase, mRNA messenger
ribonucleic acid
382 Y. Barriere et al.
these esters to caffeoyl analogues is catalyzed by a p-coumaroyl-shikimate/quinate
30-hydroxylase (C30H) (Schoch et al., 2001; Hoffmann et al., 2003; Mahesh et al.,
2007). Disruption of HCT or C30H genes led to stunted plants with H lignins
(Hoffmann et al., 2004; Shadle et al., 2007). HCT or C30H weak alleles are,
therefore, of higher interest in breeding than null alleles. Methylation of caffeoyl-
CoA is driven by caffeoyl-CoA O-methyltransferase (CCoAOMT) enzymes, which
are encoded in maize by at least five genes differentially expressed throughout the
time and plant organs (Guillaumie et al., 2007a). Moreover, the previously de-
scribed CCoAOMT1 and CCoAOMT2 genes (Civardi et al., 1999) were not the
most-expressed genes in numerous cases (Guillaumie et al., 2007a, b), and the
respective roles of each orthologous genes are not known. Downregulations of each
CCoAOMT orthologs, and studies of knocked-out mutants, are thus of interest for
both theoretical and breeding topics. COMT has been extensively studied based on
the bm3 mutant and different downregulations. Among conclusions, COMT is very
likely not involved is the biosynthesis of ferulic acid in maize. Conversely, COMT
appears as a target of interest in breeding for a higher cell wall digestibility, based
on weak alleles or regulation rather than on null expression, in order to avoid or
diminish negative agronomic consequences. Piquemal et al. (2002) thus reported
COMT downregulated maize plants with 30% COMT residual activity and a 9%
point increase in maize cell wall digestibility, a value similar to the one observed in
bm3 isogenic lines. The drawback of COMT downregulation or silencing is the
correlative S/G decrease, because a higher S/G ratio could impact positively the cell
wall digestibility in maize (Mechin et al., 2000), possibly through different linkage
types and stereochemical arrangements of S units compared to G units. CCoAOMT
could be considered a priori as an even better target than COMT, because
CCoAOMT downregulation in plants would logically result in lower lignin con-
tents without a decrease in S/G ratio, as observed in alfalfa (Guo et al., 2001).
However, while the respective involvement of CCoAOMT and (C)OMT genes in S-
unit biosynthesis is not currently understood (Chen et al., 2006; Do et al., 2007), the
most important improvements in cell wall digestibility of cereals have been
obtained today with COMT mutations or downregulations.
CCR (cinnamoyl-CoA reductase) and CAD (cinnamyl-alcohol dehydrogenase),
the last two enzymes involved in monolignol biosynthesis, have been considered as
potentially suitable targets for cell wall digestibility improvement (Halpin et al.,
1995). In maize, the bm1 mutant, which exhibited lower CAD activity (Halpin
et al., 1998), was recently proved to alter in fact the expression of numerous CAD
genes (Guillaumie et al., 2007b). Bm1 lignins thus substantially incorporate con-
iferaldehyde and, to a lower extent, sinapaldehyde and have substantially more
carbon–carbon interunit linkages (Barriere et al., 2004b; Halpin et al., 1998; Kim
et al., 2002). The feeding value of the bm1 mutant was always significantly lower
than the one of bm3 plants (Barriere et al., 1994). In tall fescue, IVDMD was
increased by 7.2–9.5% in CAD downregulated lines (Chen et al., 2003). In maize,
after the description of the CCR1 and CCR2 genes, this later being little involved in
constitutive lignification (Pichon et al., 1998), several CCR or putative CCR were
found differentially expressed in different tissue or stage of development (Table 6).
Breeding for Silage Quality Traits in Cereals 383
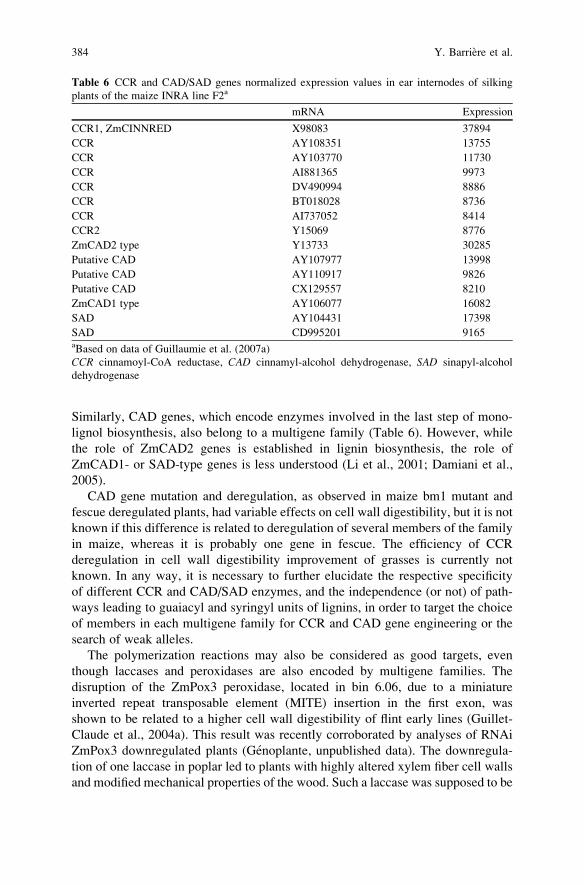
Similarly, CAD genes, which encode enzymes involved in the last step of mono-
lignol biosynthesis, also belong to a multigene family (Table 6). However, while
the role of ZmCAD2 genes is established in lignin biosynthesis, the role of
ZmCAD1- or SAD-type genes is less understood (Li et al., 2001; Damiani et al.,
2005).
CAD gene mutation and deregulation, as observed in maize bm1 mutant and
fescue deregulated plants, had variable effects on cell wall digestibility, but it is not
known if this difference is related to deregulation of several members of the family
in maize, whereas it is probably one gene in fescue. The efficiency of CCR
deregulation in cell wall digestibility improvement of grasses is currently not
known. In any way, it is necessary to further elucidate the respective specificity
of different CCR and CAD/SAD enzymes, and the independence (or not) of path-
ways leading to guaiacyl and syringyl units of lignins, in order to target the choice
of members in each multigene family for CCR and CAD gene engineering or the
search of weak alleles.
The polymerization reactions may also be considered as good targets, even
though laccases and peroxidases are also encoded by multigene families. The
disruption of the ZmPox3 peroxidase, located in bin 6.06, due to a miniature
inverted repeat transposable element (MITE) insertion in the first exon, was
shown to be related to a higher cell wall digestibility of flint early lines (Guillet-
Claude et al., 2004a). This result was recently corroborated by analyses of RNAi
ZmPox3 downregulated plants (Genoplante, unpublished data). The downregula-
tion of one laccase in poplar led to plants with highly altered xylem fiber cell walls
and modified mechanical properties of the wood. Such a laccase was supposed to be
Table 6 CCR and CAD/SAD genes normalized expression values in ear internodes of silking
plants of the maize INRA line F2a
mRNA Expression
CCR1, ZmCINNRED X98083 37894
CCR AY108351 13755
CCR AY103770 11730
CCR AI881365 9973
CCR DV490994 8886
CCR BT018028 8736
CCR AI737052 8414
CCR2 Y15069 8776
ZmCAD2 type Y13733 30285
Putative CAD AY107977 13998
Putative CAD AY110917 9826
Putative CAD CX129557 8210
ZmCAD1 type AY106077 16082
SAD AY104431 17398
SAD CD995201 9165aBased on data of Guillaumie et al. (2007a)
CCR cinnamoyl-CoA reductase, CAD cinnamyl-alcohol dehydrogenase, SAD sinapyl-alcohol
dehydrogenase
384 Y. Barriere et al.
involved in the formation of certain types of phenoxy radicals leading to cross-
linking in xylem fibers (Ranocha et al., 2002). Laccase downregulated plants could,
therefore, be considered as resources of reduced cross-linked fibers, and should be
considered as potential targets in forage digestibility and intake improvements.
Regulatory genes of lignification are also potential targets for cell wall digest-
ibility improvement in plants. Myb transcription factors are involved in regulating
phenylpropanoid metabolism. Lignification was thus heavily reduced in tobacco
plants overexpressing the Antirrhinum Myb 308 transcription factor (Tamagone
et al., 1998), while the overexpression of EgMYB2 in tobacco plants induced a
great increase in secondary wall thickness (Goicoechea et al., 2005). Moreover,
Guillaumie et al. (2007b) have shown that other regulatory genes (Lim factor,
Argonaute, Shatterproof, . . .) have modified expressions in bm mutants and could
thus be new targets in cereal breeding for quality traits. Similarly, genes involved in
regulation of tissue patterning or those involved in the transport of constituents to
the cell wall should be considered as candidate in feeding value improvement of
forage cereals.
While the importance of ferulate cross-linkages in cell wall digestibility and in
forage intake of grasses is now established, the pathway leading from p-coumaric
acid to ferulic acid is still largely unknown. In Arabidopsis, the ref1 mutant, which
has a reduced content in soluble sinapate esters, was shown to be affected in an
aldehyde dehydrogenase (ALDH) gene, and that the REF1 protein exhibited both
sinapaldehyde and coniferaldehyde dehydrogenase activities (Nair et al., 2004).
Sinapic and ferulic acids in Arabidopsis thus derived from oxidation of the
corresponding aldehydes. Whether this sinapate and ferulate ALDH pathway also
exists in grasses is currently not established, even if at least eight ALDH genes have
been described in maize (Skibbe et al., 2002). Correlatively, the bm3/COMT
mutation does not affect ferulate content of maize plants. In alfalfa, ferulic acid
content, which is nearly 100 times lower than in maize, was significantly decreased
in C30H downregulated plants, but not in CCoAOMT downregulated plants (Chen
et al., 2006). However, no information allowed, excluding that one CCoAOMT
specifically devoted to ferulic acid biosynthesis, has escaped to the deregulation.
Complementarily to phenylpropanoid components, reduced cross-linkages in grass
cell walls could be considered based on reduced arabinoxylan availability. Howev-
er, no gene has been proven to be involved in arabinoxylans feruloylation, and only
candidate genes specifically expressed in grasses have been identified for this step
by Mitchell and Shewry (2007), based on a bioinformatics approach on rice, wheat,
and barley ESTs, comparatively to dicotyledons. In any way, the breeding targets
toward a reduced content of ferulic acid in grasses remain currently unknown.
Complementarily, engineering the expression of fungal ferulic acid esterase in
transgenic ryegrass has been investigated as an alternative strategy, with an increase
digestibility of transformed plants compared to normal ones (Buanafina et al., 2006).
Allelic variations resulting from SNP, or INDEL, have been related to variations
in lignin content and/or cell wall digestibility. Allelic variation studies in the
COMT gene have shown that this gene was greatly variable not only with many
SNP and INDEL in its unique intron but also with several variations in exons
Breeding for Silage Quality Traits in Cereals 385
leading to several amino acid changes. Association studies between these allelic
modifications and the cell wall digestibility have shown that one INDEL, located in
the intron, explained 32% (P = 0.0017) of the observed cell wall digestibility
variation (Guillet-Claude et al., 2004b). Similarly, one INDEL polymorphism
within the COMT intron has revealed significant association with stover digestibil-
ity in another set of maize lines (Lubberstedt et al., 2005). A 1-bp deletion in the
second exon of PAL, introducing a premature stop codon, has been also associated
with higher plant digestibility (Andersen et al., 2007). Whether these associations
are related to a causal modification in the candidate gene sequence, or to linkage
disequilibrium with a causal factor closely linked to the favorable SNP, they
illustrated the possibility of breeding for weak alleles in the lignin pathway toward
the improvement of maize and cereal cell wall digestibility.
7 Conclusion
In the search for a forage ideotype in cereals, the breeding effort to be placed,
respectively, on either biomass yield or biomass digestibility is open to debate.
However, a high biomass yield can lead to significant disillusion if dairy cows yield
not much milk because of low intake and digestibility of the silage. A high intake
and digestibility should also allow farmers to provide lower amounts of expensive
concentrates to cattle. Cell wall digestibility is thus, undoubtedly, one of the major
targets for the improvement of feeding value in silage of cereal plants. Because
lignin content is not the only trait involved in cell wall digestibility, breeders should
use a trait directly related to cell wall digestibility, such as IVNDFD or DINAGZ.
Breeding for quality traits in forage cereals should be considered at two different
levels, according forage is, or not, one of the main purpose of the cereal use. Even if
several lines with high feeding traits are available in maize, new investigations of
genetic resources, including lines or germplasm forgotten after decades of breeding
for agronomic value and/or grain yield, are required for a successful breeding of
maize and sorghum for silage quality traits. Available genetic backgrounds are rich
in gene clusters giving good yield and standability, even whole plant yield has been
counter-selected in semidwarf or dwarf grain sorghum varieties. Conversely, origi-
nal alleles giving high feeding value have probably greatly disappeared from
available genetic backgrounds in modern maize, sorghum. In small-grain cereals,
breeding varieties for a specific whole plant or straw uses as forage is likely
economically not possible. However, it should be of interest to have studies of
the genetic variation for cell wall digestibility in best-adapted genotypes, and a
preferential use of them in cropping for forage. These lines should be used first in
further crossing toward breeding new varieties for both grain and forage utilization.
For a given quantity of inputs (nitrogen fertilization, water availability, . . .), aforage ideotype resembling bm3 maize or bmr12 sorghum would maximize the
production of cattle efficient energy with high intake and digestibility, increasing
the profit of productions. Such varieties could be obtained with the use of specific
386 Y. Barriere et al.
normal germplasm. Breeding directly bmr12 sorghum with improved feeding value
is likely more easy than breeding bm3 maize because of sorghum lower feeding
value compared with maize, and likely lower adverse effect in sorghum than in
maize. Recent registration of bmr6 and bmr12 sorghum in the USA thus illustrated
the interest of breeding more digestible sorghum.
QTL analysis, studies of SNP � feeding value traits relationships, studies of
mutants and deregulated plants will contribute to the comprehensive knowledge of
the lignin pathway and cell wall biogenesis. Plant breeders will then be able to
choose the best genetic and genomic targets for the improvement of plant digest-
ibility. Favorable alleles or favorable QTL for cereal cell wall digestibility will thus
be introgressed in elite lines through marker-assisted introgression. Genetic engi-
neering is both an inescapable tool in mechanism understanding and an efficient
way in cereal breeding, but the social acceptability of genetically modified plants is
greatly different according to the country.
Up to now, most of the researches in plant lignification have been done in
dicotyledonous and woody plants. However, grass breeders must consider the
specificity of the grass cell wall, with the importance of cross-linkages by ferulic
acid bridges. Because a great advance in genomic, maize may thus be considered as
a model plant for lignification and digestibility studies in all cereals. At present,
similar research efforts are not being made in cell wall biosynthesis on other annual
or perennial grass forage plants, neither in rice. Because of the synteny between rice
and maize (Wilson et al., 1999), the availability of the rice genome will bring very
valuable complementary information, until the maize genome will be completely
available. Moreover, gene mining and genetic engineering in model plant and
systems (Arabidopsis, Zinnia, Brachypodium, . . .) are also complementary
approaches for improvement of cell wall digestibility in grass and cereal
forage crops.
References
Abou-el-Enin, O.H., Fadel, J.G. and Mackill, D.J. (1999) Differences in chemical composition and
fibre digestion of rice straw with, and without, anhydrous ammonia from 53 rice varieties.
Anim. Feed Sci. Technol. 79:129–136.
Agbagla-Dohnan, A., Noziere, P., Clement, G. and Doreau, M. (2001) In sacco degradability,
chemical and morphological composition of 15 varieties of European rice straw. Anim. Feed
Sci. Technol. 94:15–27.
Akin, D.E., Rigsby, L.L., Hanna, W.W. and Gates, R.N. (1991) Structure and digestibility of
tissues in normal and brown midrib pearl millet (Pennisetum glaucum). J. Sci. Food Agric.
56:523–538.
Andersen, J. and Lubberstedt, T. (2003) Functional markers in plants. Trends Plant Sci. 8:554–560.
Andersen, J.R., Zein, I., Wenzel, G., Krutzfeldt, B., Eder, J., Ouzunova, M. and Lubberstedt,
T. (2007) High levels of linkage disequilibrium and associations with forage quality at a
phenylalanine ammonia-lyase locus in European maize (Zea mays L.) inbreds. Theor. Appl.
Genet. 114:307–319.
Breeding for Silage Quality Traits in Cereals 387
Argillier, O., Barriere, Y. and Hebert, Y. (1995) Genetic variation and selection criteria for
digestibility traits of forage maize. Euphytica 82:175–184.
Argillier, O., Mechin, V. and Barriere, Y. (2000) Genetic variation, selection criteria and utility of
inbred line per se evaluation in hybrid breeding for digestibility related traits in forage maize.
Crop Sci. 40:1596–1600.
Aufrere, J. and Michalet-Doreau, B. (1983) In vivo digestibility and prediction of digestibility of
some by products. EEC seminar, September 26–29, Mlle Gontrode, Belgium.
Aydin, G., Grant, R.J. and O’Rear J. (1999) Brown midrib sorghum in diets of lactating dairy
cows. J. Dairy Sci. 82:2127–2135.
Bal, M.A., Shaver, R.D., Al-Jobeile, H., Coors, J.G. and Lauer, J.G. (2000) Corn silage hybrid
effects on intake, digestion, and milk production by dairy cows. J. Dairy Sci. 83:2849–2858.
Ballard, C.S., Thomas, E.D., Tsang, D.S., Mandevu, P., Sniffen, C.J., Endres, M.I. and Carter,
M.P. (2001) Effect of corn silage hybrid on dry matter yield, nutrient composition, in vitrodigestion, intake by dairy heifers, and milk production by dairy cows. J. Dairy Sci. 84:442–452.
Barnes, R.F., Muller, L.D., Bauman, L.F. and Colenbrander, V.F. (1971) In vitro dry-matter
disappearance of brown midrib mutants. J. Anim. Sci. 33:881–884.
Barriere, Y. and Argillier, O. (1997) In vivo silage feeding value of early maize hybrids released in
France between 1958 and 1994. Euphytica 99:175–182.
Barriere, Y. and Emile, J.C. (1990) Effet des teneurs en grain et de la variabilite genetique sur la
valeur energetique du maıs ensilage mesure par des vaches laitieres. Agronomie 10:201–212.
Barriere, Y., Gallais, A., Derieux M. and Panouille A. (1987) Etude de la valeur agronomique en
plante entiere au stade de recolte ensilage de differentes varietes de maıs grain selectionnees
entre 1950 et 1980. Agronomie 7:73–79.
Barriere, Y., Argillier, O., Chabbert, B., Tollier, M.T. and Monties, B. (1994) Breeding silage
maize with brown-midrib genes. Feeding value and biochemical characteristics 3. Agronomie
14:15–25.
Barriere, Y., Emile, J.C., Traineau, R. and Hebert, Y. (1995a) Genetic variation in the feeding
efficiency of maize genotypes evaluated from experiments with dairy cows. Plant Breed.
114:144–148.
Barriere, Y., Emile, J.C. and Hebert Y. (1995b) Genetic variation in the feeding efficiency of
maize genotypes evaluated from experiments with fattening bulls. Agronomie 15:539–546.
Barriere, Y., Argillier, O., Michalet-Doreau, B., Hebert, Y., Guingo, E., Giauffret, C. and Emile,
J.C. (1997) Relevant traits, genetic variation and breeding strategies in early silage maize.
Agronomie 17:395–411.
Barriere, Y., Guillet, C., Goffner, D. and Pichon, M. (2003a.) Genetic variation and breeding
strategies for improved cell wall digestibility in annual forage crop. A review. Anim. Res.
52:193–186.
Barriere, Y., Emile, J.C. and Surault, F. (2003b) Genetic variation of silage maize ingestibility in
dairy cattle. Anim. Res. 52:489–500.
Barriere, Y., Emile, J.C., Traineau, R., Surault, F., Briand, M. and Gallais, A. (2004a) Genetic
variation for organic matter and cell wall digestibility in silage maize. Lessons from a 34-year
long experiment with sheep in digestibility crates. Maydica 49:115–126.
Barriere, Y., Ralph, J., Mechin, V., Guillaumie, S., Grabber, J.H., Argillier, O., Chabbert, B. and
Lapierre, C. (2004b) Genetic and molecular basis of grass cell wall biosynthesis and degrad-
ability. II. Lessons from brown-midrib mutants. C. R. Biol. 327:847–860.
Barriere, Y., Dias-Goncalves, G., Emile, J.C. and Lefevre, B. (2004c) Higher ingestibility of the
DK265 corn silage in dairy cattle. J. Dairy Sci. 87:1439–1445.
Barriere, Y., Alber, D., Dolstra, O., Lapierre, C., Motto, M., Ordas, A., Van Waes, J., Vlasminkel,
L., Welcker, C. and Monod, J.P. (2005) Past and prospects of forage maize breeding in Europe.
I. The grass cell wall as a basis of genetic variation and future improvements in feeding value.
Maydica 50:259–274.
388 Y. Barriere et al.
Barriere Y., Alber, D., Dolstra, O., Lapierre, C., Motto, M., Ordas, A., Van Waes, J., Vlasminkel,
L., Welcker, C. and Monod, J.P. (2006) Past and prospects of forage maize breeding in Europe.
II. History, germplasm evolution and correlative agronomic changes. Maydica 51:435–449.
Barriere Y., Riboulet C., Mechin V., Maltese S., Pichon M., Cardinal A., Martinant J.P., Lubber-
stedt T. and Lapierre C. (2007) Genetics and genomics of lignification in grass cell walls based
on maize as a model system. Genes, Genomes and Genomics 1:133–156.
Blaxter, K.L., Wainman, F.W. and Wilson, R.S. (1961) The regulation of food intake by sheep.
Anim. Prod. 3:51–61.
Block, E., Muller, L.D., Griel, L.C., Garwood, J.R. and Garwood, D.L. (1981) Brown-midrib3 corn
silage and heat-extruded soybeans for early lactating dairy cows. J. Dairy Sci. 64:1813–1825.
Boudet, A.M. (2000) Lignin and lignification: selected issues. Plant Physiol. Biochem. 38:81–96.
Bout, S. and Vermerris, W. (2003) A candidate-gene approach to clone the sorghum brown midrib
gene encoding caffeic acid O-methyltransferase. Mole. Genet. Genomics 269:205–214.
Buanafina, M.M., Langdon, T., Hauck, B., Dalton, S.J. and Morris, P. (2006) Manipulating the
phenolic acid content and digestibility of Italian ryegrass (Lolium multiflorum) by vacuolar-
targeted expression of a fungal ferulic acid esterase. Appl. Biochem. Biotechnol. 10.1007/978-
1-59745-268-7_34:129–132,416–426.
Burnham, C.R. (1947) Maize genetics. Cooperation Newsletter 21:36.
Burnham, C.R. and Brinks, R.A. (1932) Linkage relations of a second brown-midrib gene (bm2) inmaize. J. Am. Soc. Agric. 24:960–963.
Capper, B.S., Thomson, E.F. and Herbert, F. (1988) Genetic variation in the feeding value of
barley and wheat straw. In: Reed J.D., Capper, B.S. and Neate, J.H. (Eds.), Plant breeding and
the nutritive value of crop residues, Addis Abeba, Ethiopia, International livestock for Africa,
pp. 177–193.
Capper, B.S., Sage, G., Hanson, P.R. and Adamson A.H. (1992) Influence of variety, row type and
time of sowing on the morphology, chemical composition and in vitro digestibility of barley
straw. J. Agric. Sci. 188:165–173.
Cardinal, A.J., Lee, M. and Moore, K.J. (2003) Genetic mapping and analysis of quantitative trait
loci affecting fiber and lignin content in maize. Theor. Appl. Genet. 106:866–874.
Casler, M. and Jung H. (1999) Selection and evaluation of smooth bromegrass clones with
divergent lignin or etherified ferulic acid concentration. Crop Sci. 39:1866–1873.
Casler, M.D. and Kaeppler, H.F. (2001) Molecular breeding for herbage quality in forage crops,
In: Spangenberg G. (Ed.), Molecular breeding of forage crops, pp. 175–188.
Chen, C., Baucher, M., Christensen, J.H. and Boerjan, W. (2001) Biochetchnology in trees:
towards improved paper pulping by lignin engineering. Euphytica 118:185–195.
Chen, F., Srinivasa Reddy, M.S., Temple, S., Jackson, L., Shadle, G. and Dixon, R.A. (2006)
Multi-site genetic modulation of monolignol biosynthesis suggests new routes for formation of
syringyl lignin and wall-bound ferulic acid in alfalfa (Medicago sativa L.). Plant J. 48:113–
124.
Chen, L., Auh, C.K., Dowling, P., Bell, J., Chen, F., Hopkins, A., Dixon, R.A. and Wang, Z.Y.
(2003) Improved forage digestibility of tall fescue (Festuca arundinacea) by transgenic down-regulation of cinnamyl alcohol dehydrogenase. Plant Biotechnol. J. 1:437–449.
Cherney, J.H., Axtell, J.D., Hassen, M.M. and Anliker K.S. (1988) Forage quality characterization
of chemically induced brown-midrib mutant in pearl millet. Crop Sci. 28:783–787.
Cherney, D.J.R., Patterson, J.A. and Johnson K.D. (1990) Digestibility and feeding value of pearl
millet as influenced by the brown-midrib, low lignin trait. J. Anim. Sci. 68:4345–1351.
Ciba-semences. (1990) Valorisation laitiere d’une variete de maıs en ensilage. Synthesis of an
experimentation conducted by the EDE of Vendee during 1988–89–90, 13 p.
Ciba-semences. (1995) Comparaison de la valorisation par des vaches laitieres de deux hybrides
de maıs, Miscellaneous paper, 7 p.
Civardi, L., Rigau, J. and Puigdomenech, P. (1999) Nucleotide sequence of two cDNAs coding for
caffeoyl coenzyme A O-methyltransferase (CCoAOMT) and study of their expression in Zeamays. Plant Physiol. 120:1206.
Breeding for Silage Quality Traits in Cereals 389
Cox, W.J. and Cherney, D.J.R. (2001) Influence of brown midrib, leafy and transgenic hybrids on
corn forage production. Agron. J. 93:790–796.
Cummings, D.G. and McCullough, M.E. (1969) A comparison of the yield and quality of corn and
sorghum silage, University of Georgia, College of agriculture experimental station. Res. Bull.
67:5–19.
Damiani, I., Morreel, K., Danoun, S., Goeminne, G., Yahiaoui, N., Marque, C., Kopka, J.,
Messens, E., Goffner, D., Boerjan, W., Boudet, A.M. and Rochange, S. (2005) Metabolite
profiling reveals a role for atypical cinnamyl alcohol dehydrogenase CAD1 in the synthesis of
coniferyl alcohol in tobacco xylem. Plant Mol. Biol. 59:753–769.
Derieux, M., Darrigand, M., Gallais A., Barriere, Y., Bloc, Y. and Montalant, Y. (1987) Estimation
du progres genetique realise chez le maıs grain en France entre 1950 et 1985. Agronomie
7:1–11.
Dixon, R.A., Chen, F., Guo, D. and Parvathi, K. (2001) The biosynthesis of monolignols, a
“metabolic grid”, or independent pathways to guaiacyl and syringyl units. Phytochem.
57:1069–1084.
Do C.T., Pollet, B., Thevenin, J., Sibout, R., Denoue, D., Barriere, Y., Lapierre, C. and Jouanin, L.
2007 Both caffeoyl coenzyme A 3-O-methyltransferase 1 and caffeic acid O-methyltransferase
1 are involved in redundant functions for lignin, flavonoids and sinapoyl malate biosynthesis in
Arabidopsis. Planta. 226:1117–1129.
Dolstra, O. and Medema, J.H. (1990) An effective screening method for genetic improvement of
cell-wall digestibility in forage maize. In: Proceedings of the 15th congress maize and sorghum
section of Eucarpia, Baden, Austria, June 4–8, pp. 258–270.
Droushiotis, D.N. (1989) Mixtures of annual legumes and small-grained cereals for forage
production under low rainfall. J. Agric. Sci. Camb. 113:249–253.
Emerson, R.A. (1935) Cornell University. Agric. Exp. Stn. Memoir No. 180.
Emile, J.C., Barriere, Y. and Mauries, M. (1996) Effects of maize and alfalfa genotypes on dairy
cow performances. Ann. Zootechn. 45:17–27.
Fernandez, I., Martin, C., Champion, M. and Michalet-Doreau, B. (2004) Effect of corn hybrid and
chop length of whole-plant corn silage on digestion and intake by dairy cows. J. Dairy Sci.
87:1298–1309.
Fontaine, A.S., Bout, S., Barriere, Y. and Vermerris, W. (2003) Variation in cell wall composition
among forage maize (Zea mays L.) inbred lines and its impact on digestibility: analysis of
neutral detergent fiber composition by pyrolysis-gas chromatography-mass spectrometry.
J. Agric. Food Chem. 51:8080–8087.
Frenchick, G.E., Johnson, D.G, Murphy, J.M. and Otterby, D.E. (1976) Brown midrib corn silage
in dairy cattle ration. J. Dairy Sci. 59:2126–2129.
Frey, T.J., Coors, J.G., Shaver, R.D., Lauer J.G., Eilert, D.T. and Flannery, P.J (2004) Selection for
silage quality in the Wisconsin Quality Synthetic and related maize populations. Crop Sci.
44:1200–1208.
Fritz, J.O., Cantrell, R.P., Lechtenberg, V.L., Axtell, J.D. and Hertel, J.M. (1981) Brown midrib
mutants in sudangrass and grain sorghum. Crop Sci. 21:706–709.
Goering, H.K. and van Soest, P.J. (1971) Forage fiber analysis (apparatus, reagents, procedures and
some applications). Agric. Handb. No. 379. US Government Print Office, Washington, DC.
Grabber, J., Ralph J., Lapierre, C. and Barriere, Y. (2004) Genetic and molecular basis of grass
cell-wall degradability. I. Lignin-cell wall matrix interactions. C. R. Biol. 327:455–465.
Grant, R.J., Haddad, S.G., Moore, K.J. and Pederson, J.F. (1995) Brown midrib sorghum silage for
midlactation dairy cows. J. Dairy Sci. 78:1970–1980.
Guillaumie, S., San Clemente, H., Deswarte, C., Martinez, Y., Lapierre, C., Murigneux, A.,
Barriere, Y., Pichon, M. and Goffner, D. (2007a) MAIZEWALL, a database and developmen-
tal gene expression profiling of cell wall biosynthesis and assembly maize genes. Plant Physiol.
143:339–363.
Guillaumie, S., Pichon, M., Martinant, J.P., Bosio, M., Goffner, D. and Barriere, Y. (2007b)
Differential expression of phenylpropanoid and related genes in brown-midrib bm1, bm2, bm3,
and bm4 young isogenic mutant maize plants. Planta 266:235–250.
390 Y. Barriere et al.
Guillet-Claude, C., Birolleau-Touchard, C., Manicacci, D., Rogowsky, P.M., Rigau, J.,
Murigneux, A., Martinant, J.P. and Barriere, Y. (2004a) Nucleotide diversity of the ZmPox3
maize peroxidase gene: relationships between a MITE insertion in exon 2 and variation in
forage maize digestibility. BMC Genet. 5:19.
Guillet-Claude, C., Birolleau-Touchard, C., Manicacci, D., Fourmann, M., Barraud, S., L’Home-
det, J., Carret, V., Martinant, J.P. and Barriere, Y. (2004b) Nucleotide diversity associated in
silage corn digestibility for three O-methyltransferase genes involved in lignin biosynthesis.
Theor. Appl. Genet. 110:126–135.
Goicoechea, M., Lacombe, E., Legay, S., Mihaljevic, S., Rech, P., Jauneau, A., Lapierre, C.,
Pollet, B., Verhaegen, D., Chaubet-Gigot, N. and Grima-Pettenati, J. (2005) EgMYB2, a new
transcriptional activator from Eucalyptus xylem, regulates secondary cell wall formation and
lignin biosynthesis. Plant J. 43:553–597.
Guo, D., Chen, F., Inoue, K., Blount, J.W. and Dixon, R.A. (2001) Downregulation of caffeic acid
3-O-methyltransferase and caffeoyl CoA 3-O-methyltransferase in trangenic alfalfa. Impacts
on lignin structure and implications for the synthesis of G and S lignin. Plant Cell 13:73–88.
Halpin, C. (2004) Re-designing lignin for industry and agriculture. Biotechnol. Genet. Eng. Rev.
21:229–245.
Halpin, C., Foxon, G.A. and Fentem P.A. (1995) Transgenic plants with improved energy
characteristics. In: Chesson A., Wallace R.J. (Eds.), Biotechnology in animal feeds and animal
feeding, VCH Publishers, Weinheim, pp. 279–293.
Halpin, C., Holt, K., Chojecki, J., Olivier, D., Chabbert, B., Monties, B., Edwards, K., Barakate, A.
and Foxon, G.A. (1998) Brown-midrib maize (bm1), a mutation affecting the cinnamyl alcohol
dehydrogenase gene. Plant J. 14:545–553.
Hawkins, G.E., Parr, G.E. and Little, J.A. (1964) Composition, intake, digestibility and prediction
of digestibility of coastal Bermudgrass hay. J. Dairy Sci. 47:865–870.
He, X., Hall, M.B., Gallo-Meagher, M. and Smith, R.L. (2003) Improvement of forage quality by
downregulation of maize O-methylteransferase. Crop Sci. 43:2240–2251.
Hoden, A., Barriere, Y., Gallais, A., Huguet, L., Journet, M. and Mourguet, M. (1985) Le maıs
brown-midrib plante entiere. III Utilisation sous forme d’ensilage par des vaches laitieres. Bull.
Tech. CRZV Theix, INRA 60:43–58.
Hoffmann, L., Maury, S., Martz, F., Geoffroy, P. and Legrand, M. (2003) Purification, cloning, and
properties of an acyltransferase controlling shikimate and quinate ester intermediates in
phenylpropanoid metabolism. J. Biol. Chem. 278:95–103.
Hoffmann, L., Besseau, S., Geoffroy, P., Ritzenthaler, C., Meyer, D., Lapierre, C., Pollet, B. and
Legrand, M. (2004) Silencing of hydroxycinnamoyl coenzyme A shikimate/quinate hydro-
xycinnamolyltransferase affects phenylpropanoid biosynthesis. Plant Cell 16:1446–1465.
Hunt, C.W., Kezar, W., Hinnam, D.D., Combs, J.J., Loesche, J.A. and Moen, T. (1993) Effects of
hybrids and ensiling with and without a microbial inoculant on the nutritional characteristics of
whole-plant corn. J. Anim. Sci. 71:39–43.
Istasse, L., Gielen, M., Dufrasne, L., Clinquart, A., Van Eenaeme, C. and Bienfait, J.M. (1990)
Ensilage de maıs plante entiere, comparaison de 4 varietes. 2. Performances zootechniques.
Landbouwtijdschrift – Revue de l’Agriculture 43:996–1005.
Jorgenson, L.R. (1931) Brown midrib in maize and its lignage relations. J. Am. Soc. Agron.
23:549–557.
Jung, H.G. and Allen M.S. (1995) Characteristics of plant cell wall affecting intake and digestibil-
ity of forages by ruminants. J. Anim. Sci. 73:2774–2790.
Keith, E.A., Colenbrander, V.F., Lechtenberg, V.L. and Bauman, L.F. (1979) Nutritional value of
brown midrib corn silage for lactating dairy cows. J. Dairy Sci. 52:788–792.
Kim, H., Ralph, J., Lu, F., Pilate, G., Leple, J.C., Pollet, B. and Lapierre, C. (2002) Identification of
the structure and origin of thioacidolysis marker compounds for cinnamyl alcohol dehydroge-
nase deficiency in angiosperms. J. Biol. Chem. 277:47412–47419.
Krakowsky, M.D., Lee, M., Woodman-Clikeman, W.L., Long, M.J. and Sharopova, N. (2004)
QTL mapping of resistance to stalk tunneling by the European corn borer in RILs of maize
population B73 x De811. Crop Sci. 44:274–282.
Breeding for Silage Quality Traits in Cereals 391
Krakowsky, M.D., Lee, M. and Coors, J.G. (2005) Quantitative trait loci for cell-wall components
in recombinant inbred lines of maize (Zea mays L.) 1: Stalk tissue. Theor. Appl. Genet.
111:337–346.
Kuc, J. and Nelson, O.E. (1964) The abnormal lignins produced by the brown midrib mutants of
maize. 1. The brown-midrib-1 mutant. Arch. Biochem. Biophys. 105:103–113.
Lauer, J.G., Coors, J.G. and Flannery, P.J. (2001) Forage yield and quality of corn cultivars
developed in different eras. Crop Sci. 41:1441–1455.
Li, L.G., Cheng, X.F., Leshkevich, J., Umezawa, T., Harding, S.A. and Chiang, V.L. (2001) The
last step of syringyl monolignol biosynthesis in angiosperms is regulated by a novel gene
encoding sinapyl alcohol dehydrogenase. Plant Cell 13:1567–1585.
Lubberstedt, T., Melchinger, A.E., Klein, D., Degenhardt, H. and Paul, C. (1997) QTL mapping in
testcrosses of European flint lines of maize: II. Comparison of different testers for forage
quality traits. Crop Sci. 37:1913–1922.
Lubberstedt, T., Zein, I., Andersen, J., Wenzel, G., Krutzfeldt, B., Eder, J., Ouzunova, M. and
Chun, S (2005) Development and application of functional markers in maize. Euphytica
146:101–108.
Lusk, S.W., Karau, P.K., Balogu, D.O. and Gourley L.M. (1984) Brown midrib sorghum or corn
silage for milk production. J. Dairy Sci. 67:1739–1744.
MacAdam, J.W. and Grabber J.H. (2002) Relationship of growth cessation with the formation of
diferulate cross-links and p-coumaroylated lignins in tall fescue leaf blades. Planta 215:785–793.
Mahanta, S.K. and Pachauri, V.C. (2005) Nutritional evaluation of two promising varieties of
forage sorghum in sheep fed as silage. Asian-Aust. J. Anim. Sci. 18:1715–1720.
Mahesh, V., Million-Rousseau, R., Ullmann, P., Chabrillange, N., Bustamante, J., Mondolot, L.,
Morant, M., Noirot, M., Hamon, S., de Kochko, A., Werck-Reichhart, D. and Campa, C. (2007)
Functional characterization of two p-coumaroyl ester 3´-hydroxylase genes from coffee tree:
evidence of a candidate for chlorogenic acid biosynthesis. Plant Mol. Biol. 64:145–159.
Mechin V., Argillier, O., Barriere Y. and Menanteau V. (1998) Genetic variation in stems of
normal and brown-midrib3 maize inbred lines. Towards similarity for in vitro digestibility and
cell-wall composition. Maydica 43:205–210.
Mechin, V., Argillier, O., Barriere, Y., Mila, I., Polet B. and Lapierre C. (2000) Relationships of
cell-wall composition to in vitro cell-wall digestibility of maize inbred line stems. J. Sci. Food
Agric. 80:574–580.
Mechin, V., Argillier, O., Hebert Y., Guingo, E., Moreau, L., Charcosset, A. and Barriere Y.
(2001) QTL mapping and genetic analysis of cell wall digestibility and lignification in silage
maize. Crop Sci. 41:690–697.
Minson, D.J. and Wilson, J.R. (1994) Prediction of intake as an element of forage quality. In:
Fahey G.C. (Ed.), Forage quality, evaluation and utilisation, American Society of Agronomy,
Inc., Crop Science Society of America, Inc., Soil Science Society of America, Inc., Madison,
WI, pp. 533–563.
Mitchell, R.A.C. and Shewry P.R. (2007) A novel bioinformatics approach identifies candidate
genes for the synthesis and feruloylation of arabinoxylan. Plant Physiol. 144:43–53.
Moreira, V.R., Santos, H.S., Satter, L.D. and Sampaio, I.B.M. (2003) Feeding high forage diets to
lactating dairy cows. Arquivo Brasileiro de Medicina Veterinaria e Zootecnia 55:197–202.
Nair, R.B., Bastress, K.L., Ruegger, M.O., Denault, J.W. and Chapple, C. (2004) The Arabidopsisthaliana reduced epidermal fluorescence1 gene encodes an aldehyde dehydrogenase involved
in ferulic acid and sinapic acid biosynthesis. Plant Cell 16:544–554.
Oba, M. and Allen, M.S. (1999) Evaluation of the importance of the digestibility of neutral
detergent fiber from forage. Effects on dry matter intake and milk yield of dairy cows.
J. Dairy Sci. 82:589–596.
Oba, M. and Allen, M.S. (2000) Effect of brown midrib 3 mutation in corn silage on productivity
of dairy cows fed two concentrations of dietary neutral detergent fiber, 1. Feeding behavior
and nutrient utilization. J. Dairy Sci. 83:1333–1341.
392 Y. Barriere et al.
Oliver, A.L., Grant, R.J., Pedersen, J.F. and O’Rear, J. (2004) Comparison of brown-midrib-6 and
-18 forage sorghum with conventional sorghum and corn silage in diets of lactating dairy cows.
J. Dairy Sci. 87:637–644.
Oliver, A.L., Pedersen, J.F., Grant, R.J. and Klopfenstein, T.J. (2005a). Comparative effects of the
sorghum bmr-6 and bmr-12 genes. I. Forage sorghum yield and quality. Crop Sci. 45:2234–
2239.
Oliver, A.L., Pedersen, J.F., Grant, R.J., Klopfenstein, T.J. and Jose, H.D. (2005b). Comparative
effects of the sorghum bmr-6 and bmr-12 genes. I. Grain Yield, stover yield, and stover qualityin grain sorghum. Crop Sci. 45:2240–2245.
Orskov, E.R., Tait, G.A.G., Reid, G.W. and Flachowski, G. (1988) Effect of straw quality and
ammonia treatment on voluntary intake, milk yield and degradation characteristics of faecal
fibre. Anim. Prod. 46:23–27.
Pedersen, J.F., Funnell, D.L., Toy, J.J., Oliver, A.L. and Grant, R.J. (2006a). Registration of Atlas
bmr-12 forage sorghum. Crop Sci. 46:478.
Pedersen, J.F., Funnell, D.L., Toy, J.J., Oliver, A.L. and Grant, R.J. (2006b). Registration of seven
forage sorghum genetic stocks near-isogenic for the brown midrib genes bmr-6 and bmr-12.Crop Sci. 46:490–491.
Pedersen, J.F., Funnell, D.L., Toy, J.J., Oliver, A.L. and Grant, R.J. (2006c). Registration of twelve
forage sorghum genetic stocks near-isogenic for the brown midrib genes bmr-6 and bmr-12.Crop Sci. 46:491–492.
Pichon, M., Courbou, I., Beckert, M., Boudet, A.M. and Grima-Pettenati, J. (1998) Cloning and
characterization of two maize cDNAs encoding cinnamoyl-CoA reductase (CCR) and differ-
ential expression of the corresponding genes. Plant Mol. Biol. 38:671–676.
Pichon, M., Deswarte, C., Gerentes, D., Guillaumie, S, Lapierre, C., Toppan, A., Barriere, Y. and
Goffner, D. (2006) Variation in lignin and cell wall digestibility traits in caffeic acid O-methyl-
transferase down-regulated maize half-sib progenies in field experiments. Mol. Breed.
18:253–261.
Piquemal, J., Chamayou, S., Nadaud, I., Beckert, M., Barriere, Y., Mila, I., Lapierre, C., Rigau, J.,
Puigdomenech P., Jauneau A., Digonnet, C., Boudet, A.M., Goffner, D. and Pichon M. (2002)
Down-regulation of caffeic acid O-methyltransferase in maize revisited using a transgenic
approach. Plant Physiol. 130:1675–1685.
Plenet, D. and Cruz, P. (1997) Diagnosis of the nitrogen status in crops. Maize and Sorghum,
Chap. 5. In: G. Lemaire (Ed.), Springer-Verlag, Berlin, Heidelberg, pp. 93–106.
Porter, K.S., Axtell, J.D., Lechtenberg, V.L. and Colenbrander, V.F. (1978) Phenotype, fiber
composition, and in vitro dry matter disappearance of chemically induced brown midrib
(bmr) mutants of sorghum. Crop Sci. 18:205–208.
Ralph, J., Guillaumie, S., Grabber, J.H., Lapierre, C. and Barriere, Y. (2004) Genetic and
molecular basis of grass cell wall biosynthesis and degradability. III. Towards a forage grass
ideotype. C. R. Biol. 327:467–479.
Ranocha, P., Chabannes, M., Chamayou, S., Danoun, S., Jauneau, A., Boudet, A.M. and Goffner,
D. (2002) Laccase down-regulation causes alterations in phenolic metabolism and cell wall
structure in poplar. Plant Physiol. 129:145–155.
Reddy, M.S., Chen, F., Shadle, G., Jackson, L., Aljoe, H. and Dixon, R.A. (2005) Targeted down-
regulation of cytochrome P450 enzymes for forage quality improvement in alfalfa (Medicagosativa L.). Proc. Natl. Acad. Sci. USA. 102:16573–16578.
Reid, G.W., Orskov, E.R. and Kay, M. (1988) A note on the effect of variety, type of straw and
ammonia treatment an digestibility and on growth rate on steers. Anim. Prod. 47:157–160.
Rohde, A., Morreel, K., Ralph, J., Goeminne, G., Hostyn, V., De Rycke, R., Kushnir, S., Van
Doorsselaere, J., Joseleau, J.P., Vuylsteke, M., Van Driessche, G., Van Beeumen, J, Messens,
E. and Boerjan W. (2004) Molecular phenotyping of the pal1 and pal2 mutants of Arabidopsisthaliana revealed far-reaching consequences on phenylpropanoid, amino acid, and carbohy-
drate metabolism. Plant Cell 16:2749–2771.
Breeding for Silage Quality Traits in Cereals 393
Rook, J.A., Muller, L.D. and Shank, D.B. (1977) Intake and digestibility of brown midrib corn
silage by lactating dairy cows. J. Dairy Sci. 60:1894–1904.
Roussel, V., Gibelin, C., Fontaine, A.S. and Barriere, Y. (2002) Genetic analysis in recombinant
inbred lines of early dent forage maize. II – QTL mapping for cell wall constituents and cell
wall digestibility from per se value and top cross experiments. Maydica 47:9–20.
Russell, W.A. (1984) Agronomic performance of maize cultivars representing different eras of
breeding. Maydica 29:375–390.
Schiere, J.B., Joshi, A.L., Seetharam, A., Oosting, S.J., Goodchild, A.V., Deinum, B. and Van
Keulen, H., (2004) Grain and straw for whole plant value. Implications for crop management
and genetic improvement strategies. Explor. Agric. 40:277–294.
Schoch, G., Goepfert, S., Morant, M., Hehn, A., Meyer, D., Ullmann, P. and Werck-Reichhart, D.
(2001) CYP98A3 from Arabidopsis thaliana is a 3´-hydroxylase of phenolic esters, a missing
link in the phenylpropanoid pathway. J. Biol. Chem. 276:36566–36574.
Shadle, G., Chen, F., Srinivasa Reddy, M.S., Jackson, L., Nakashima, J., Dixon, R.A. (2007)
Down-regulation of hydroxycinnamoyl CoA: Shikimate hydroxycinnamoyl transferase in
transgenic alfalfa affects lignification, development and forage quality. Phytochem.
68:1521–1529.
Skibbe, D., Liu, F., Wen, T., Yandeau, M., Cui, X., Cao, J., Simmons, C. and Schnable, P. (2002)
Characterization of the aldehyde dehydrogenase gene families of Zea mays and Arabidopsis.Plant Mol. Biol. 48:751–764.
Sommerfeldt, J.L., Schingoethe, D.J. and Muller, L.D. (1979) Brown midrib corn silage for
lactating dairy cows. J. Dairy Sci. 62:1611–1618.
Stallings, C.C., Donaldson, B.M., Thomas, J.W. and Rossman, E.C. (1982) In vivo evaluation of
brown-midrib corn silage by sheep and lactating dairy cows. J. Dairy Sci. 65:1945–1949.
Struik, P.C. (1983) Physiology of forage maize (Zea mays L.) in relation to its productivity.
Doctoral thesis, Wageningen, the Netherlands, 97 p.
Tamagone, L., Merida, A., Parr, A., Mackay, S., Culianez-Marcia, F.A., Roberts, K. and Martin, C.
(1998) The AmMYB308 and AmMYB330 transcription factors from Antirrhinum regulate
phenylpropanoid and lignin biosynthesis in transgenic tobacco. Plant Cell 10:135–154.
Taylor, C.C. and Allen, M.S. (2005) Corn grain endosperm type and brown midrib 3 corn silage.
Feeding behaviour and milk yield of lactating dairy cows. J. Dairy Sci. 88:1425–1433.
Tilley, J.M.A. and Terry, R.A. (1963) A two stage technique for the in vitro digestion of forage
crops. J. Br. Grassland Soc. 18:104–111.
Tine, M.A., McLeod, K.R., Erdman, R.A. and Baldwin R.L. (2000) Effects of brown midrib corn
silage on the energy balance of dairy cattle. J. Dairy Sci. 84:885–895.
Tingle, J.N. and Dawley, W.K. (1974) Yield and nutritive value of whole plant cereals at a silage
stage. Can. J. Plant Sci. 54:621–624.
Troyer, A.F. (1999) Background of US hybrid corn. Crop Sci. 39:601–626.
Troyer, A.F. (2002) Germplasm ownership: related corn inbred. Crop Sci. 42:3–11.
Vadiveloo, J. (1992) Varietal differences in the chemical composition and in vitro digestibility of
rice straw. J. Agric. Sci. Camb. 119:27–33.
Vignols, F., Rigau, J., Torres, M.A., Capellades, M. and Puigdomenech, P. (1995) The brownmidrib 3 (bm3) mutation in maize occurs in the gene encoding caffeic acid O-methyltransfer-
ase. Plant Cell 7:407–416.
Watanabe, H. and Kasuga, S. (2000) Effect of brown midrib and water soluble matter content on
digestibility of forage sorghum (Sorghum bicolor Moench, Sorghum sudanense Stapf) foliage.
Grassland Sci. 45:397–403.
Weller, R.F. and Phipps, R.H. (1986) The feeding value of normal and brown midrib-3 maize
silage. J. Agric. Sci. 106:31–35.
Wilson, W.A., Harrington, S.E., Woodman, W.L., Lee, M., Sorrells, M.E. and McCouch, S. (1999)
Inferences on the genome structure of progenitor maize through comparative analysis of rice,
maize and the domesticated panicoids. Genetics 153:453–473.
394 Y. Barriere et al.
Participatory Plant Breeding in Cereals
S. Ceccarelli and S. Grando
Abstract It is widely recognized that conventional plant breeding has been more
beneficial to farmers in high potential environments or those who could profitably
modify their environment to suit new cultivars than to the poorest farmers who could
not afford to modify their environment through the application of additional inputs
and could not risk the replacement of their traditional, well-known, and reliable
varieties. As a consequence, low yields, crop failures, malnutrition, famine, and
eventually poverty still affect a large proportion of humanity. Participatory plant
breeding (PPB) is seen by several scientists as a way to overcome the limitations of
conventional breeding by offering farmers the possibility to decide which varieties
better suit their needs and conditions without exposing the household to any risk
during the selection progress. PPB exploits the potential gains of breeding for
specific adaptation through decentralized selection, defined as selection in the target
environment, and is the ultimate conceptual consequence of a positive interpretation
of genotype � environment interactions. The chapter describes a model of PPB in
which genetic variability is generated by breeders, selection is conducted jointly by
breeders, farmers, and extension specialists in a number of target environments, and
the best selections are used in further cycles of recombination and selection.
Therefore, from a scientific viewpoint, the process is similar to a conventional
breeding program with three main differences, namely (a) testing and selection
take place on-farm rather than on-station, (b) key decisions are made jointly by
farmers and breeder, and (c) the process can be independently implemented in a
large number of locations. Farmers handle the first phases of seed multiplication of
promising breeding material in village-based seed production systems. The model
has the following advantages: the varieties reach the release phase earlier than in
conventional breeding, the release and seed multiplication concentrate on varieties
known to be acceptable by farmers, biodiversity increases because different vari-
eties are selected in different locations, the varieties fit the agronomic management
that farmers are familiar with and can afford, and, therefore, the varieties can be
beneficial to poor farmers. These advantages are particularly relevant to developing
S. Ceccarelli(*)
The International Center for Agricultural Research in the Dry Areas (ICARDA), e-mail:
M.J. Carena (ed.), Cereals,DOI: 10.1007/978-0-387-72297-9, # Springer Science + Business Media, LLC 2009 395
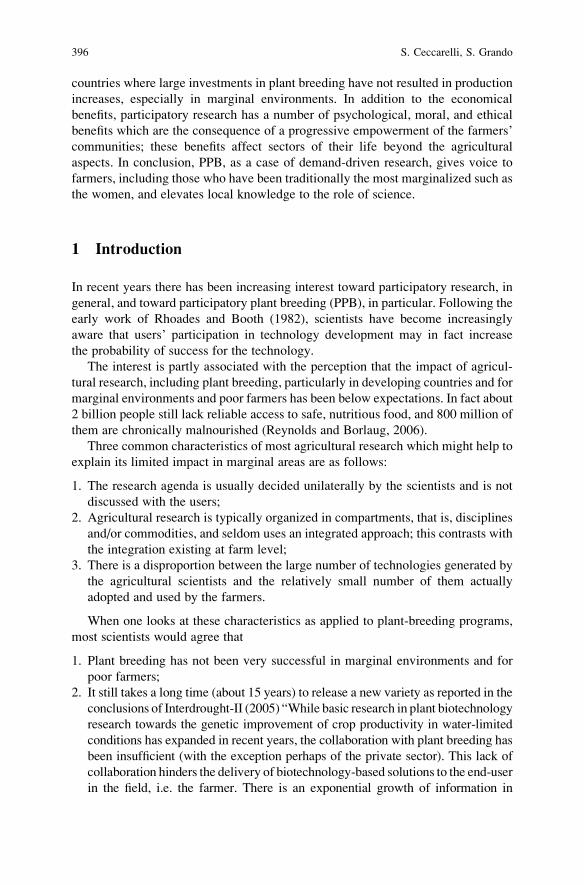
countries where large investments in plant breeding have not resulted in production
increases, especially in marginal environments. In addition to the economical
benefits, participatory research has a number of psychological, moral, and ethical
benefits which are the consequence of a progressive empowerment of the farmers’
communities; these benefits affect sectors of their life beyond the agricultural
aspects. In conclusion, PPB, as a case of demand-driven research, gives voice to
farmers, including those who have been traditionally the most marginalized such as
the women, and elevates local knowledge to the role of science.
1 Introduction
In recent years there has been increasing interest toward participatory research, in
general, and toward participatory plant breeding (PPB), in particular. Following the
early work of Rhoades and Booth (1982), scientists have become increasingly
aware that users’ participation in technology development may in fact increase
the probability of success for the technology.
The interest is partly associated with the perception that the impact of agricul-
tural research, including plant breeding, particularly in developing countries and for
marginal environments and poor farmers has been below expectations. In fact about
2 billion people still lack reliable access to safe, nutritious food, and 800 million of
them are chronically malnourished (Reynolds and Borlaug, 2006).
Three common characteristics of most agricultural research which might help to
explain its limited impact in marginal areas are as follows:
1. The research agenda is usually decided unilaterally by the scientists and is not
discussed with the users;
2. Agricultural research is typically organized in compartments, that is, disciplines
and/or commodities, and seldom uses an integrated approach; this contrasts with
the integration existing at farm level;
3. There is a disproportion between the large number of technologies generated by
the agricultural scientists and the relatively small number of them actually
adopted and used by the farmers.
When one looks at these characteristics as applied to plant-breeding programs,
most scientists would agree that
1. Plant breeding has not been very successful in marginal environments and for
poor farmers;
2. It still takes a long time (about 15 years) to release a new variety as reported in the
conclusions of Interdrought-II (2005) “While basic research in plant biotechnology
research towards the genetic improvement of crop productivity in water-limited
conditions has expanded in recent years, the collaboration with plant breeding has
been insufficient (with the exception perhaps of the private sector). This lack of
collaboration hinders the delivery of biotechnology-based solutions to the end-user
in the field, i.e. the farmer. There is an exponential growth of information in
396 S. Ceccarelli, S. Grando
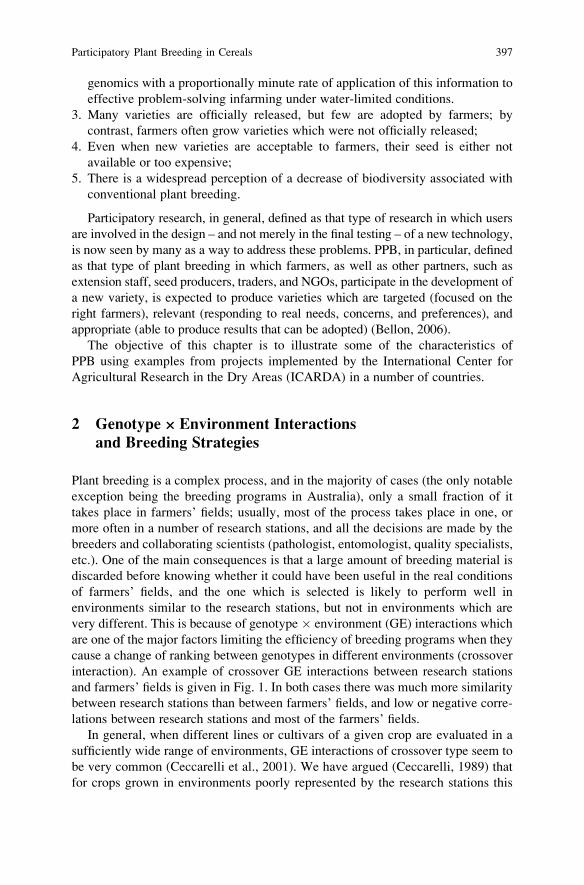
genomics with a proportionally minute rate of application of this information to
effective problem-solving infarming under water-limited conditions.
3. Many varieties are officially released, but few are adopted by farmers; by
contrast, farmers often grow varieties which were not officially released;
4. Even when new varieties are acceptable to farmers, their seed is either not
available or too expensive;
5. There is a widespread perception of a decrease of biodiversity associated with
conventional plant breeding.
Participatory research, in general, defined as that type of research in which users
are involved in the design – and not merely in the final testing – of a new technology,
is now seen by many as a way to address these problems. PPB, in particular, defined
as that type of plant breeding in which farmers, as well as other partners, such as
extension staff, seed producers, traders, and NGOs, participate in the development of
a new variety, is expected to produce varieties which are targeted (focused on the
right farmers), relevant (responding to real needs, concerns, and preferences), and
appropriate (able to produce results that can be adopted) (Bellon, 2006).
The objective of this chapter is to illustrate some of the characteristics of
PPB using examples from projects implemented by the International Center for
Agricultural Research in the Dry Areas (ICARDA) in a number of countries.
2 Genotype · Environment Interactions
and Breeding Strategies
Plant breeding is a complex process, and in the majority of cases (the only notable
exception being the breeding programs in Australia), only a small fraction of it
takes place in farmers’ fields; usually, most of the process takes place in one, or
more often in a number of research stations, and all the decisions are made by the
breeders and collaborating scientists (pathologist, entomologist, quality specialists,
etc.). One of the main consequences is that a large amount of breeding material is
discarded before knowing whether it could have been useful in the real conditions
of farmers’ fields, and the one which is selected is likely to perform well in
environments similar to the research stations, but not in environments which are
very different. This is because of genotype � environment (GE) interactions which
are one of the major factors limiting the efficiency of breeding programs when they
cause a change of ranking between genotypes in different environments (crossover
interaction). An example of crossover GE interactions between research stations
and farmers’ fields is given in Fig. 1. In both cases there was much more similarity
between research stations than between farmers’ fields, and low or negative corre-
lations between research stations and most of the farmers’ fields.
In general, when different lines or cultivars of a given crop are evaluated in a
sufficiently wide range of environments, GE interactions of crossover type seem to
be very common (Ceccarelli et al., 2001). We have argued (Ceccarelli, 1989) that
for crops grown in environments poorly represented by the research stations this
Participatory Plant Breeding in Cereals 397
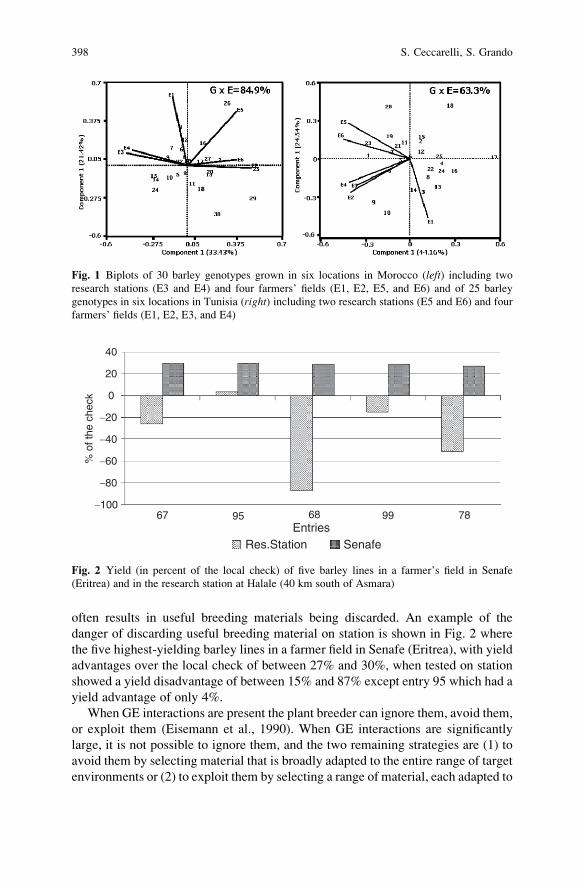
often results in useful breeding materials being discarded. An example of the
danger of discarding useful breeding material on station is shown in Fig. 2 where
the five highest-yielding barley lines in a farmer field in Senafe (Eritrea), with yield
advantages over the local check of between 27% and 30%, when tested on station
showed a yield disadvantage of between 15% and 87% except entry 95 which had a
yield advantage of only 4%.
When GE interactions are present the plant breeder can ignore them, avoid them,
or exploit them (Eisemann et al., 1990). When GE interactions are significantly
large, it is not possible to ignore them, and the two remaining strategies are (1) to
avoid them by selecting material that is broadly adapted to the entire range of target
environments or (2) to exploit them by selecting a range of material, each adapted to
40
20
0
% o
f the
che
ck
−20
−40
−60
−80
−10095 78
SenafeRes.StationEntries
996867
Fig. 2 Yield (in percent of the local check) of five barley lines in a farmer’s field in Senafe
(Eritrea) and in the research station at Halale (40 km south of Asmara)
Fig. 1 Biplots of 30 barley genotypes grown in six locations in Morocco (left) including two
research stations (E3 and E4) and four farmers’ fields (E1, E2, E5, and E6) and of 25 barley
genotypes in six locations in Tunisia (right) including two research stations (E5 and E6) and four
farmers’ fields (E1, E2, E3, and E4)
398 S. Ceccarelli, S. Grando
a specific environment (Ceccarelli, 1989). The choice is based on a separate
analysis of the two components of GE interactions, namely genotype � years
(GY) and genotype � locations (GL), the first of which is largely unpredictable,
while the second, if repeatable over time, identifies distinct target environments
(Annicchiarico et al., 2005, 2006).
Selection for specific adaptation to each of the target environments is particularly
important in breeding crops predominantly grown in unfavorable conditions, because
unfavorable environments tend to be more different from each other than favorable
environments (Ceccarelli and Grando, 1997). An example is shown in Fig. 3 where
the total GE in the case of the two dry locations (left) was nearly 90%, while in
the case of the two high-rainfall locations was less than 50%.
Selecting for specific adaptation has the advantage of adapting cultivars to the
physical environment where they are meant to be cultivated, and, hence, is more
sustainable than other strategies which rely on modifying the environment to fit new
cultivars adapted to more favorable conditions (Ceccarelli and Grando, 2002).
Selection theory shows that selection for specific adaptation is more efficient
because it exploits the larger heritabilities within each specific target environment.
The similarity between research stations observed in Fig. 1 and between high-
rainfall locations and years observed in Fig. 3 are likely to be also associated with
the larger use of inputs (fertilizers, weed control, etc.) common to both research
stations and high-rainfall areas, which tend to smooth out differences between
locations and years.
Selection for specific adaptation is based on direct selection in the target
environment, which has been also defined as decentralized selection (Falconer,
1981; Simmonds, 1984, 1991). These concepts started to be adopted also in relation
with organic agriculture (Murphy et al., 2007).
Fig. 3 Biplots of grain yield of seven barley cultivars grown for 4 years (1995–1998) in two dry
locations, Bouider (BO) and Breda (BR) with a grand mean of 1.3 t/ha (left) and in two locations,
Tel Hadya (TH) and Terbol (TR) with a grand mean of 3.5 t/ha (right)
Participatory Plant Breeding in Cereals 399
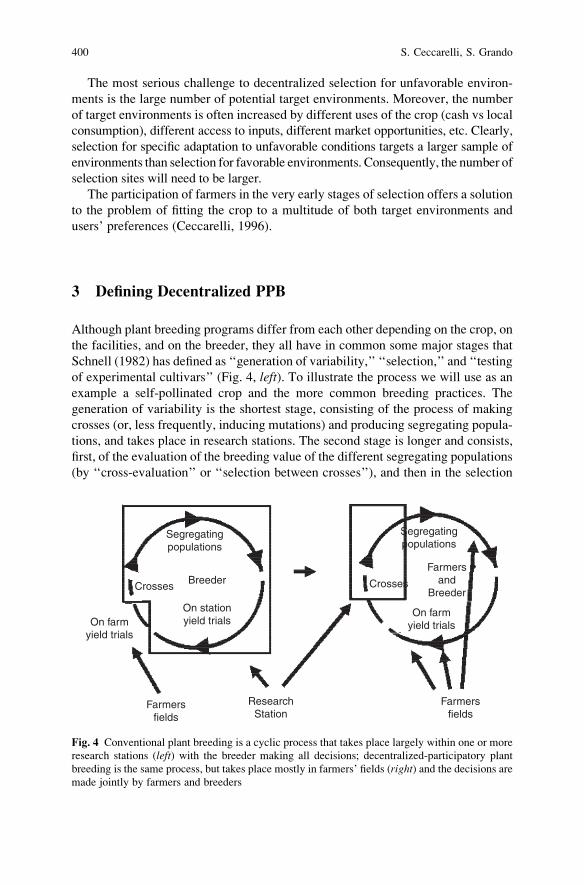
The most serious challenge to decentralized selection for unfavorable environ-
ments is the large number of potential target environments. Moreover, the number
of target environments is often increased by different uses of the crop (cash vs local
consumption), different access to inputs, different market opportunities, etc. Clearly,
selection for specific adaptation to unfavorable conditions targets a larger sample of
environments than selection for favorable environments. Consequently, the number of
selection sites will need to be larger.
The participation of farmers in the very early stages of selection offers a solution
to the problem of fitting the crop to a multitude of both target environments and
users’ preferences (Ceccarelli, 1996).
3 Defining Decentralized PPB
Although plant breeding programs differ from each other depending on the crop, on
the facilities, and on the breeder, they all have in common some major stages that
Schnell (1982) has defined as ‘‘generation of variability,’’ ‘‘selection,’’ and ‘‘testing
of experimental cultivars’’ (Fig. 4, left). To illustrate the process we will use as an
example a self-pollinated crop and the more common breeding practices. The
generation of variability is the shortest stage, consisting of the process of making
crosses (or, less frequently, inducing mutations) and producing segregating popula-
tions, and takes place in research stations. The second stage is longer and consists,
first, of the evaluation of the breeding value of the different segregating populations
(by ‘‘cross-evaluation’’ or ‘‘selection between crosses’’), and then in the selection
ResearchStation
On farmyield trials
Crosses
On stationyield trials
Breeder
Segregatingpopulations
Crosses
On farmyield trials
Farmersand
Breeder
Segregatingpopulations
Farmersfields
Farmersfields
Fig. 4 Conventional plant breeding is a cyclic process that takes place largely within one or more
research stations (left) with the breeder making all decisions; decentralized-participatory plant
breeding is the same process, but takes place mostly in farmers’ fields (right) and the decisions aremade jointly by farmers and breeders
400 S. Ceccarelli, S. Grando
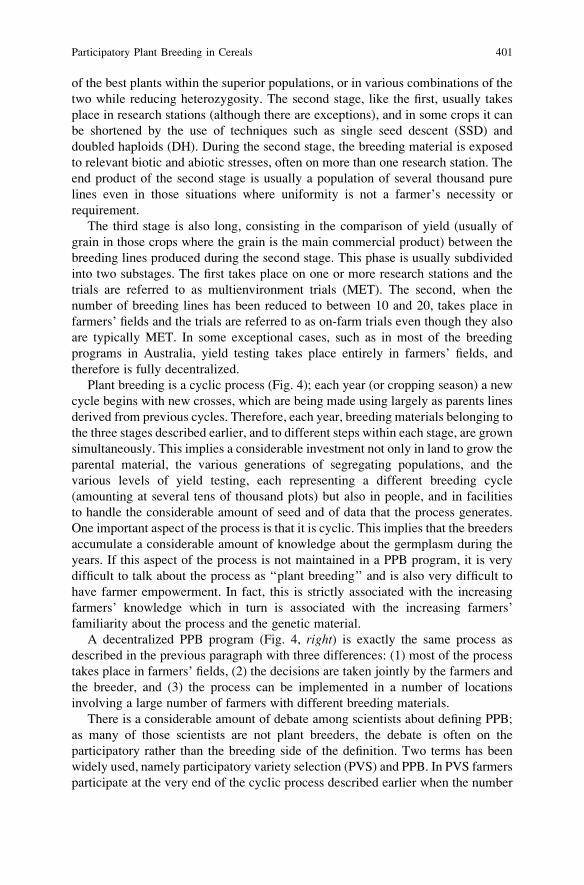
of the best plants within the superior populations, or in various combinations of the
two while reducing heterozygosity. The second stage, like the first, usually takes
place in research stations (although there are exceptions), and in some crops it can
be shortened by the use of techniques such as single seed descent (SSD) and
doubled haploids (DH). During the second stage, the breeding material is exposed
to relevant biotic and abiotic stresses, often on more than one research station. The
end product of the second stage is usually a population of several thousand pure
lines even in those situations where uniformity is not a farmer’s necessity or
requirement.
The third stage is also long, consisting in the comparison of yield (usually of
grain in those crops where the grain is the main commercial product) between the
breeding lines produced during the second stage. This phase is usually subdivided
into two substages. The first takes place on one or more research stations and the
trials are referred to as multienvironment trials (MET). The second, when the
number of breeding lines has been reduced to between 10 and 20, takes place in
farmers’ fields and the trials are referred to as on-farm trials even though they also
are typically MET. In some exceptional cases, such as in most of the breeding
programs in Australia, yield testing takes place entirely in farmers’ fields, and
therefore is fully decentralized.
Plant breeding is a cyclic process (Fig. 4); each year (or cropping season) a new
cycle begins with new crosses, which are being made using largely as parents lines
derived from previous cycles. Therefore, each year, breeding materials belonging to
the three stages described earlier, and to different steps within each stage, are grown
simultaneously. This implies a considerable investment not only in land to grow the
parental material, the various generations of segregating populations, and the
various levels of yield testing, each representing a different breeding cycle
(amounting at several tens of thousand plots) but also in people, and in facilities
to handle the considerable amount of seed and of data that the process generates.
One important aspect of the process is that it is cyclic. This implies that the breeders
accumulate a considerable amount of knowledge about the germplasm during the
years. If this aspect of the process is not maintained in a PPB program, it is very
difficult to talk about the process as ‘‘plant breeding’’ and is also very difficult to
have farmer empowerment. In fact, this is strictly associated with the increasing
farmers’ knowledge which in turn is associated with the increasing farmers’
familiarity about the process and the genetic material.
A decentralized PPB program (Fig. 4, right) is exactly the same process as
described in the previous paragraph with three differences: (1) most of the process
takes place in farmers’ fields, (2) the decisions are taken jointly by the farmers and
the breeder, and (3) the process can be implemented in a number of locations
involving a large number of farmers with different breeding materials.
There is a considerable amount of debate among scientists about defining PPB;
as many of those scientists are not plant breeders, the debate is often on the
participatory rather than the breeding side of the definition. Two terms has been
widely used, namely participatory variety selection (PVS) and PPB. In PVS farmers
participate at the very end of the cyclic process described earlier when the number
Participatory Plant Breeding in Cereals 401
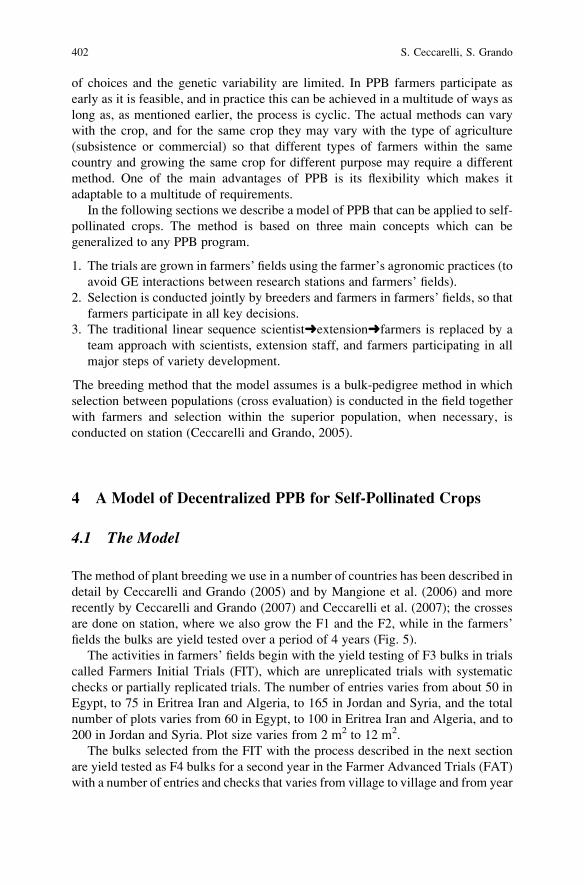
of choices and the genetic variability are limited. In PPB farmers participate as
early as it is feasible, and in practice this can be achieved in a multitude of ways as
long as, as mentioned earlier, the process is cyclic. The actual methods can vary
with the crop, and for the same crop they may vary with the type of agriculture
(subsistence or commercial) so that different types of farmers within the same
country and growing the same crop for different purpose may require a different
method. One of the main advantages of PPB is its flexibility which makes it
adaptable to a multitude of requirements.
In the following sections we describe a model of PPB that can be applied to self-
pollinated crops. The method is based on three main concepts which can be
generalized to any PPB program.
1. The trials are grown in farmers’ fields using the farmer’s agronomic practices (to
avoid GE interactions between research stations and farmers’ fields).
2. Selection is conducted jointly by breeders and farmers in farmers’ fields, so that
farmers participate in all key decisions.
3. The traditional linear sequence scientist�extension�farmers is replaced by a
team approach with scientists, extension staff, and farmers participating in all
major steps of variety development.
The breeding method that the model assumes is a bulk-pedigree method in which
selection between populations (cross evaluation) is conducted in the field together
with farmers and selection within the superior population, when necessary, is
conducted on station (Ceccarelli and Grando, 2005).
4 A Model of Decentralized PPB for Self-Pollinated Crops
4.1 The Model
The method of plant breeding we use in a number of countries has been described in
detail by Ceccarelli and Grando (2005) and by Mangione et al. (2006) and more
recently by Ceccarelli and Grando (2007) and Ceccarelli et al. (2007); the crosses
are done on station, where we also grow the F1 and the F2, while in the farmers’
fields the bulks are yield tested over a period of 4 years (Fig. 5).
The activities in farmers’ fields begin with the yield testing of F3 bulks in trials
called Farmers Initial Trials (FIT), which are unreplicated trials with systematic
checks or partially replicated trials. The number of entries varies from about 50 in
Egypt, to 75 in Eritrea Iran and Algeria, to 165 in Jordan and Syria, and the total
number of plots varies from 60 in Egypt, to 100 in Eritrea Iran and Algeria, and to
200 in Jordan and Syria. Plot size varies from 2 m2 to 12 m2.
The bulks selected from the FIT with the process described in the next section
are yield tested as F4 bulks for a second year in the Farmer Advanced Trials (FAT)
with a number of entries and checks that varies from village to village and from year
402 S. Ceccarelli, S. Grando
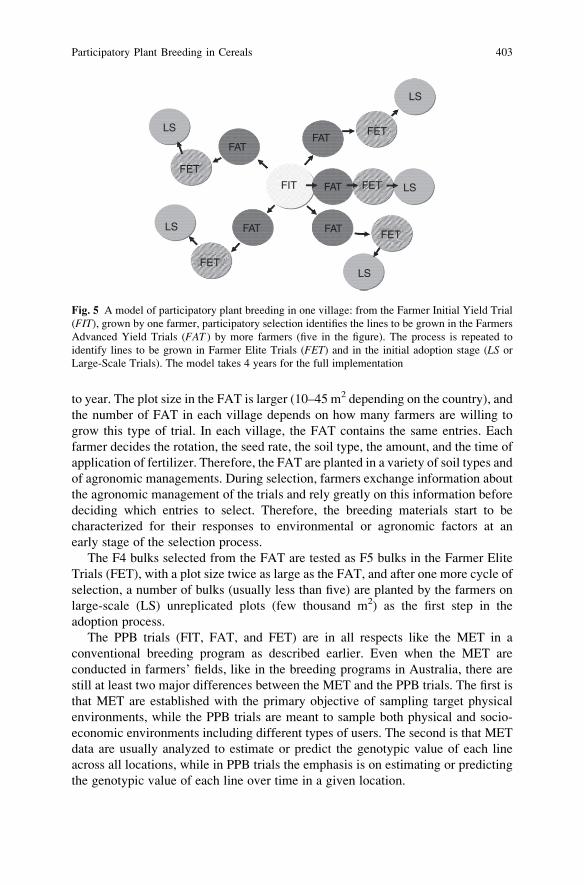
to year. The plot size in the FAT is larger (10–45 m2 depending on the country), and
the number of FAT in each village depends on how many farmers are willing to
grow this type of trial. In each village, the FAT contains the same entries. Each
farmer decides the rotation, the seed rate, the soil type, the amount, and the time of
application of fertilizer. Therefore, the FAT are planted in a variety of soil types and
of agronomic managements. During selection, farmers exchange information about
the agronomic management of the trials and rely greatly on this information before
deciding which entries to select. Therefore, the breeding materials start to be
characterized for their responses to environmental or agronomic factors at an
early stage of the selection process.
The F4 bulks selected from the FAT are tested as F5 bulks in the Farmer Elite
Trials (FET), with a plot size twice as large as the FAT, and after one more cycle of
selection, a number of bulks (usually less than five) are planted by the farmers on
large-scale (LS) unreplicated plots (few thousand m2) as the first step in the
adoption process.
The PPB trials (FIT, FAT, and FET) are in all respects like the MET in a
conventional breeding program as described earlier. Even when the MET are
conducted in farmers’ fields, like in the breeding programs in Australia, there are
still at least two major differences between the MET and the PPB trials. The first is
that MET are established with the primary objective of sampling target physical
environments, while the PPB trials are meant to sample both physical and socio-
economic environments including different types of users. The second is that MET
data are usually analyzed to estimate or predict the genotypic value of each line
across all locations, while in PPB trials the emphasis is on estimating or predicting
the genotypic value of each line over time in a given location.
LS
FAT
FAT
FAT
FATFIT
FAT
FET
FET
FET
FET
FET
LS
LS
LS
LS
Fig. 5 A model of participatory plant breeding in one village: from the Farmer Initial Yield Trial
(FIT), grown by one farmer, participatory selection identifies the lines to be grown in the Farmers
Advanced Yield Trials (FAT ) by more farmers (five in the figure). The process is repeated to
identify lines to be grown in Farmer Elite Trials (FET) and in the initial adoption stage (LS or
Large-Scale Trials). The model takes 4 years for the full implementation
Participatory Plant Breeding in Cereals 403
4.2 Farmers’ Selection and Data Collection
At the time of selection, farmers are provided with field books to register both
qualitative and quantitative observations. Farmers’ preferences are usually
recorded from 0 (discarded) to 4 (most preferred plots) by between 10 and 30
farmers including (in some countries) women, occasionally assisted by scientists
(or literate farmers) to record their scores. Breeders collect quantitative data on a
number of traits indicated by farmers as important selection criteria (such as growth
vigor, plant height, spike length, grain size, tillering, grain yield, biomass yield,
harvest index, resistance to lodging and to diseases and pests, and cold damage), as
usually done in the MET in a conventional breeding program.
The data are processed (see Sect. 4.3) and the final decision of which bulks to
retain for the following season is made jointly by breeders and farmers in a special
meeting and is based on both quantitative data and visual scores.
In parallel to the model shown in Fig. 5, and in those countries where varieties of
self-pollinated crops can be released only if genetically uniform, pure line selection
within selected bulks is conducted on station. The head rows are promoted to a
screening nursery only if farmers select the corresponding bulks. The process is
repeated until there is enough seed to include the lines (as F7) in the yield-testing
phase (Ceccarelli and Grando, 2005). Therefore, when the model is fully imple-
mented, the breeding material which is yield tested in the FIT, FAT, and FET
includes new bulks as well as pure lines extracted from the best bulks of the
previous cycle. If in a given country the requirements for the genetic uniformity
of the varieties to be released are very strict, only the pure lines will be considered
as candidates for release.
4.3 Experimental Designs and Statistical Analysis
An experimental design, which has proven to be suitable in the first stage where
there is one host farmer in each location, is the unreplicated design with systematic
checks every ten or every five entries arranged in rows and columns or a partially
replicated design in which about 20–25% of the entries are replicated twice.
In the second and third level, the trials can be designed as a-lattices with two
replications or as randomized complete blocks with farmers as replicates, or as
standard replicated trials.
The data are subjected to different types of analysis, some of which where
developed at ICARDA, such as the spatial analysis of unreplicated or replicated
trials (Singh et al., 2003). The environmentally standardized best lineal unbiased
predictors (BLUPs) obtained from the analysis are then used to analyze GE interac-
tion using the GGE G¼genotypic main effect plus GE¼genotype�environment
interaction biplot software (Yan et al., 2000).
Therefore, the PPB trials generate the same quantity and quality of data
generated by the MET in a conventional breeding program with the additional
404 S. Ceccarelli, S. Grando
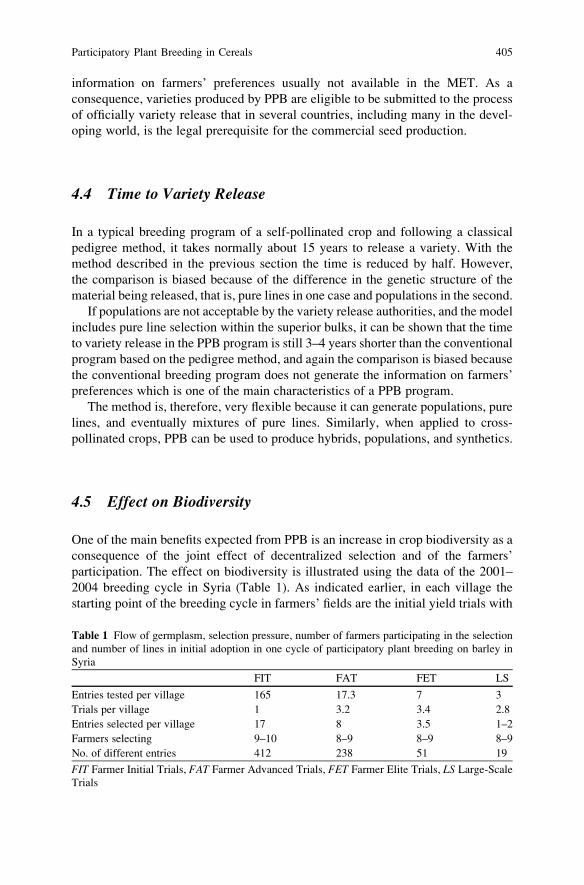
information on farmers’ preferences usually not available in the MET. As a
consequence, varieties produced by PPB are eligible to be submitted to the process
of officially variety release that in several countries, including many in the devel-
oping world, is the legal prerequisite for the commercial seed production.
4.4 Time to Variety Release
In a typical breeding program of a self-pollinated crop and following a classical
pedigree method, it takes normally about 15 years to release a variety. With the
method described in the previous section the time is reduced by half. However,
the comparison is biased because of the difference in the genetic structure of the
material being released, that is, pure lines in one case and populations in the second.
If populations are not acceptable by the variety release authorities, and the model
includes pure line selection within the superior bulks, it can be shown that the time
to variety release in the PPB program is still 3–4 years shorter than the conventional
program based on the pedigree method, and again the comparison is biased because
the conventional breeding program does not generate the information on farmers’
preferences which is one of the main characteristics of a PPB program.
The method is, therefore, very flexible because it can generate populations, pure
lines, and eventually mixtures of pure lines. Similarly, when applied to cross-
pollinated crops, PPB can be used to produce hybrids, populations, and synthetics.
4.5 Effect on Biodiversity
One of the main benefits expected from PPB is an increase in crop biodiversity as a
consequence of the joint effect of decentralized selection and of the farmers’
participation. The effect on biodiversity is illustrated using the data of the 2001–
2004 breeding cycle in Syria (Table 1). As indicated earlier, in each village the
starting point of the breeding cycle in farmers’ fields are the initial yield trials with
Table 1 Flow of germplasm, selection pressure, number of farmers participating in the selection
and number of lines in initial adoption in one cycle of participatory plant breeding on barley in
Syria
FIT FAT FET LS
Entries tested per village 165 17.3 7 3
Trials per village 1 3.2 3.4 2.8
Entries selected per village 17 8 3.5 1–2
Farmers selecting 9–10 8–9 8–9 8–9
No. of different entries 412 238 51 19
FIT Farmer Initial Trials, FAT Farmer Advanced Trials, FET Farmer Elite Trials, LS Large-Scale
Trials
Participatory Plant Breeding in Cereals 405
165 genetically different entries; the number of entries tested in the subsequent
trials decreases to about 17 in the FAT, to 7 in the FET, and to 3 in the LS. The
number of trials per village varies from one in the case of the FIT to about three in
the case of the other trials. The number of lines selected by between eight and ten
farmers per village was on average 17, 8, 3.5, and between 1 and 2.
Because different germplasm is tested in different villages, the total number of
genetically different entries tested in the various trials was 412 in the FIT, 238 in the
FAT, 51 in the FET, and 19 in the LS. In the case of Syria, the number of different
entries at the end of a breeding cycle in farmers’ fields is higher than the number of
lines the Syrian National Program tests at the beginning of its on-farm testing which
usually ends with one or two recommended varieties across the country.
5 Variety Release and Seed Production
The potential advantages of PPB, such as the speed with which new varieties reach
the farmers, the increased adoption rate, and the increased biodiversity within the
crop due to the selection of different varieties in different areas will not be achieved
if the seed of the new varieties does not become available in sufficient amounts to
the entire farmer community. In many countries this is associated with, and depends
on, the official recognition of the new varieties. This process, called variety release,
is usually the responsibility of a committee (the variety release committee) nomi-
nated by the Minister of Agriculture, which decides whether to release varieties
based on a scientific report on the performance, agronomic characteristics, resis-
tance to pests and diseases, and quality characteristics of the new variety. The
process suffers from several drawbacks: (1) it takes a long time, (2) testing sites are
poorly chosen, (3) the trial management is often not representative, (4) the trial
analysis is biased against poor environments, (5) traits important to the farmers are
not included, (6) farmers’ opinion is not considered, (7) there is often lack of
transparency in sharing the information, and (8) the trials are often conducted
using the same methodologies for very many years.
As a consequence, there are several cases of varieties released which have never
been grown by any farmer and also of varieties grown by farmers without being
released. In the former case, the considerable investment made in developing the
new variety and in producing its seed has no benefits.
One of the most important advantages of PPB is associated with reversing the
delivery phase of a plant breeding program (Fig. 6). In a conventional breeding
program, the most promising lines are released as varieties, their seed is produced
under controlled conditions (certified seed) and only then do farmers decide
whether to adopt them or not; therefore, the entire process is supply-driven. As a
consequence, in many developing countries the process results in many varieties
being released and only a small fraction being adopted. With PPB, it is the initial
farmers’ adoption which drives the decision of which variety to release, and,
therefore, the process is demand-driven. Adoption rates are expected to be higher,
406 S. Ceccarelli, S. Grando
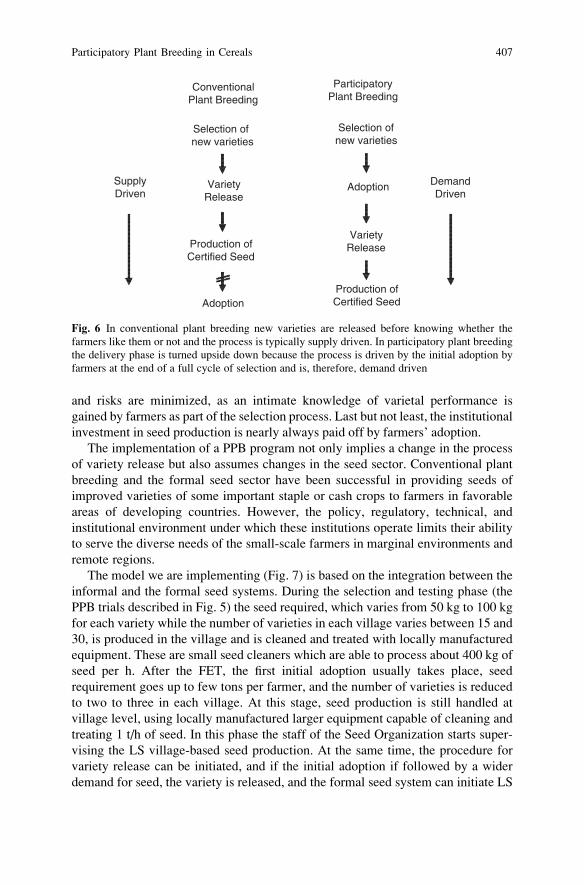
and risks are minimized, as an intimate knowledge of varietal performance is
gained by farmers as part of the selection process. Last but not least, the institutional
investment in seed production is nearly always paid off by farmers’ adoption.
The implementation of a PPB program not only implies a change in the process
of variety release but also assumes changes in the seed sector. Conventional plant
breeding and the formal seed sector have been successful in providing seeds of
improved varieties of some important staple or cash crops to farmers in favorable
areas of developing countries. However, the policy, regulatory, technical, and
institutional environment under which these institutions operate limits their ability
to serve the diverse needs of the small-scale farmers in marginal environments and
remote regions.
The model we are implementing (Fig. 7) is based on the integration between the
informal and the formal seed systems. During the selection and testing phase (the
PPB trials described in Fig. 5) the seed required, which varies from 50 kg to 100 kg
for each variety while the number of varieties in each village varies between 15 and
30, is produced in the village and is cleaned and treated with locally manufactured
equipment. These are small seed cleaners which are able to process about 400 kg of
seed per h. After the FET, the first initial adoption usually takes place, seed
requirement goes up to few tons per farmer, and the number of varieties is reduced
to two to three in each village. At this stage, seed production is still handled at
village level, using locally manufactured larger equipment capable of cleaning and
treating 1 t/h of seed. In this phase the staff of the Seed Organization starts super-
vising the LS village-based seed production. At the same time, the procedure for
variety release can be initiated, and if the initial adoption if followed by a wider
demand for seed, the variety is released, and the formal seed system can initiate LS
SupplyDriven
AdoptionProduction ofCertified Seed
Production ofCertified Seed
VarietyRelease
DemandDriven
AdoptionVarietyRelease
Selection ofnew varieties
Selection of new varieties
ParticipatoryPlant Breeding
ConventionalPlant Breeding
Fig. 6 In conventional plant breeding new varieties are released before knowing whether the
farmers like them or not and the process is typically supply driven. In participatory plant breeding
the delivery phase is turned upside down because the process is driven by the initial adoption by
farmers at the end of a full cycle of selection and is, therefore, demand driven
Participatory Plant Breeding in Cereals 407
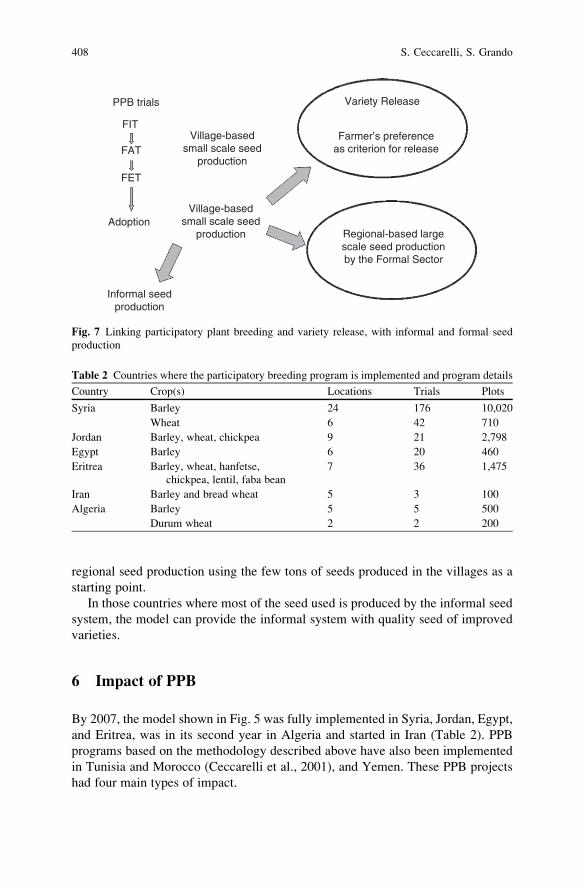
regional seed production using the few tons of seeds produced in the villages as a
starting point.
In those countries where most of the seed used is produced by the informal seed
system, the model can provide the informal system with quality seed of improved
varieties.
6 Impact of PPB
By 2007, the model shown in Fig. 5 was fully implemented in Syria, Jordan, Egypt,
and Eritrea, was in its second year in Algeria and started in Iran (Table 2). PPB
programs based on the methodology described above have also been implemented
in Tunisia and Morocco (Ceccarelli et al., 2001), and Yemen. These PPB projects
had four main types of impact.
PPB trials
Regional-based largescale seed productionby the Formal Sector
Farmer’s preferenceas criterion for release
Variety Release
Informal seedproduction
Village-basedsmall scale seed
production
Village-basedsmall scale seed
production
Adoption
FET
FAT
FIT
Fig. 7 Linking participatory plant breeding and variety release, with informal and formal seed
production
Table 2 Countries where the participatory breeding program is implemented and program details
Country Crop(s) Locations Trials Plots
Syria Barley 24 176 10,020
Wheat 6 42 710
Jordan Barley, wheat, chickpea 9 21 2,798
Egypt Barley 6 20 460
Eritrea Barley, wheat, hanfetse,
chickpea, lentil, faba bean
7 36 1,475
Iran Barley and bread wheat 5 3 100
Algeria Barley 5 5 500
Durum wheat 2 2 200
408 S. Ceccarelli, S. Grando
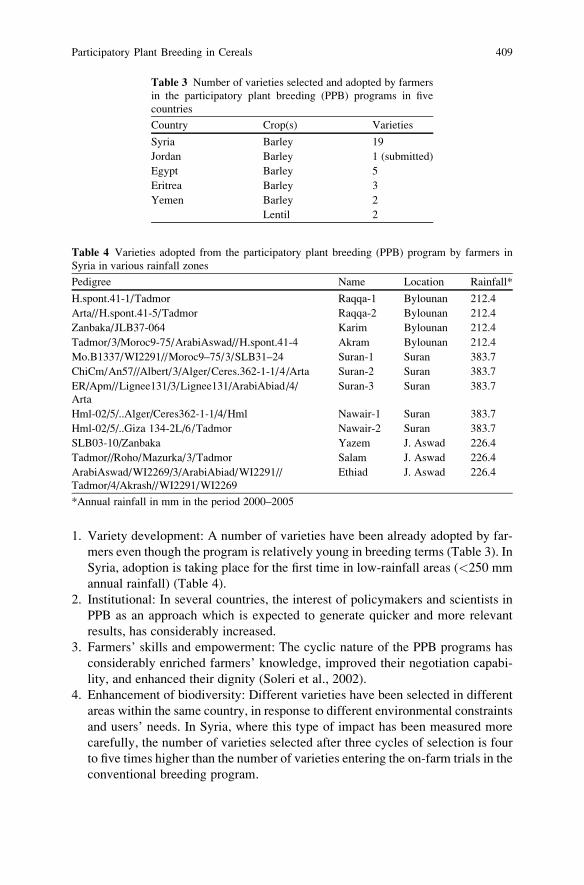
1. Variety development: A number of varieties have been already adopted by far-
mers even though the program is relatively young in breeding terms (Table 3). In
Syria, adoption is taking place for the first time in low-rainfall areas (<250 mm
annual rainfall) (Table 4).
2. Institutional: In several countries, the interest of policymakers and scientists in
PPB as an approach which is expected to generate quicker and more relevant
results, has considerably increased.
3. Farmers’ skills and empowerment: The cyclic nature of the PPB programs has
considerably enriched farmers’ knowledge, improved their negotiation capabi-
lity, and enhanced their dignity (Soleri et al., 2002).
4. Enhancement of biodiversity: Different varieties have been selected in different
areas within the same country, in response to different environmental constraints
and users’ needs. In Syria, where this type of impact has been measured more
carefully, the number of varieties selected after three cycles of selection is four
to five times higher than the number of varieties entering the on-farm trials in the
conventional breeding program.
Table 3 Number of varieties selected and adopted by farmers
in the participatory plant breeding (PPB) programs in five
countries
Country Crop(s) Varieties
Syria Barley 19
Jordan Barley 1 (submitted)
Egypt Barley 5
Eritrea Barley 3
Yemen Barley 2
Lentil 2
Table 4 Varieties adopted from the participatory plant breeding (PPB) program by farmers in
Syria in various rainfall zones
Pedigree Name Location Rainfall*
H.spont.41-1/Tadmor Raqqa-1 Bylounan 212.4
Arta//H.spont.41-5/Tadmor Raqqa-2 Bylounan 212.4
Zanbaka/JLB37-064 Karim Bylounan 212.4
Tadmor/3/Moroc9-75/ArabiAswad//H.spont.41-4 Akram Bylounan 212.4
Mo.B1337/WI2291//Moroc9–75/3/SLB31–24 Suran-1 Suran 383.7
ChiCm/An57//Albert/3/Alger/Ceres.362-1-1/4/Arta Suran-2 Suran 383.7
ER/Apm//Lignee131/3/Lignee131/ArabiAbiad/4/
Arta
Suran-3 Suran 383.7
Hml-02/5/..Alger/Ceres362-1-1/4/Hml Nawair-1 Suran 383.7
Hml-02/5/..Giza 134-2L/6/Tadmor Nawair-2 Suran 383.7
SLB03-10/Zanbaka Yazem J. Aswad 226.4
Tadmor//Roho/Mazurka/3/Tadmor Salam J. Aswad 226.4
ArabiAswad/WI2269/3/ArabiAbiad/WI2291//
Tadmor/4/Akrash//WI2291/WI2269
Ethiad J. Aswad 226.4
*Annual rainfall in mm in the period 2000–2005
Participatory Plant Breeding in Cereals 409
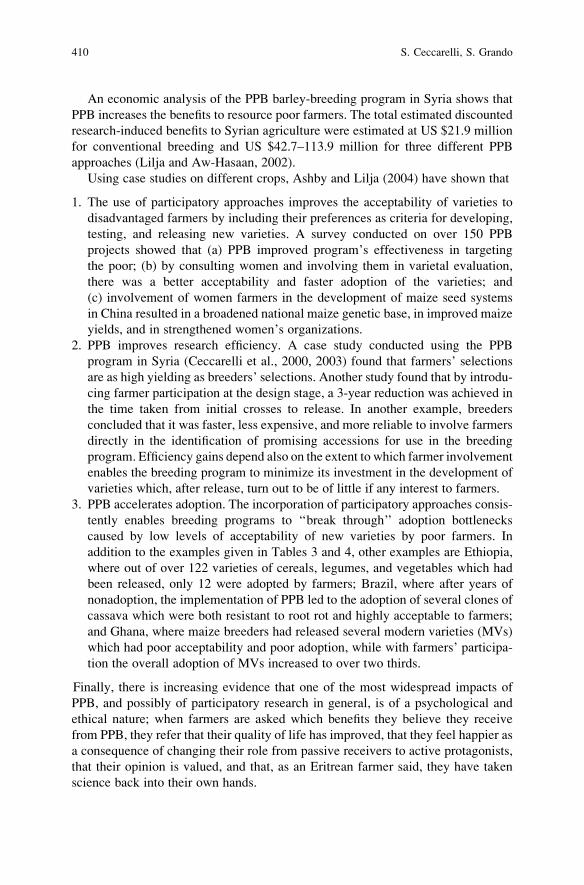
An economic analysis of the PPB barley-breeding program in Syria shows that
PPB increases the benefits to resource poor farmers. The total estimated discounted
research-induced benefits to Syrian agriculture were estimated at US $21.9 million
for conventional breeding and US $42.7–113.9 million for three different PPB
approaches (Lilja and Aw-Hasaan, 2002).
Using case studies on different crops, Ashby and Lilja (2004) have shown that
1. The use of participatory approaches improves the acceptability of varieties to
disadvantaged farmers by including their preferences as criteria for developing,
testing, and releasing new varieties. A survey conducted on over 150 PPB
projects showed that (a) PPB improved program’s effectiveness in targeting
the poor; (b) by consulting women and involving them in varietal evaluation,
there was a better acceptability and faster adoption of the varieties; and
(c) involvement of women farmers in the development of maize seed systems
in China resulted in a broadened national maize genetic base, in improved maize
yields, and in strengthened women’s organizations.
2. PPB improves research efficiency. A case study conducted using the PPB
program in Syria (Ceccarelli et al., 2000, 2003) found that farmers’ selections
are as high yielding as breeders’ selections. Another study found that by introdu-
cing farmer participation at the design stage, a 3-year reduction was achieved in
the time taken from initial crosses to release. In another example, breeders
concluded that it was faster, less expensive, and more reliable to involve farmers
directly in the identification of promising accessions for use in the breeding
program. Efficiency gains depend also on the extent to which farmer involvement
enables the breeding program to minimize its investment in the development of
varieties which, after release, turn out to be of little if any interest to farmers.
3. PPB accelerates adoption. The incorporation of participatory approaches consis-
tently enables breeding programs to ‘‘break through’’ adoption bottlenecks
caused by low levels of acceptability of new varieties by poor farmers. In
addition to the examples given in Tables 3 and 4, other examples are Ethiopia,
where out of over 122 varieties of cereals, legumes, and vegetables which had
been released, only 12 were adopted by farmers; Brazil, where after years of
nonadoption, the implementation of PPB led to the adoption of several clones of
cassava which were both resistant to root rot and highly acceptable to farmers;
and Ghana, where maize breeders had released several modern varieties (MVs)
which had poor acceptability and poor adoption, while with farmers’ participa-
tion the overall adoption of MVs increased to over two thirds.
Finally, there is increasing evidence that one of the most widespread impacts of
PPB, and possibly of participatory research in general, is of a psychological and
ethical nature; when farmers are asked which benefits they believe they receive
from PPB, they refer that their quality of life has improved, that they feel happier as
a consequence of changing their role from passive receivers to active protagonists,
that their opinion is valued, and that, as an Eritrean farmer said, they have taken
science back into their own hands.
410 S. Ceccarelli, S. Grando
7 Conclusions
The results presented in this chapter indicate that is possible to organize a plant
breeding program in a way that addresses not only those plant characteristics that
maximize yield and stability over time in a given physical environment but also the
preferences of the users, by developing varieties which are specifically adapted to
different physical and socioeconomic environments. Such an objective can be
achieved by using a decentralized participatory approach, which needs to be
extended also to seed production aspects. A breeding program organized according
to these principles will have the advantages of producing environmentally friendly
varieties and of maintaining or even enhancing biodiversity.
The main objections to PPB are usually that (1) plant breeding is ‘‘plant
breeder’s business’’, and if plant breeders do their job properly there should not
be the need for PPB, (2) it is not possible for seed companies to cope with the
multitude of varieties generated by PPB, and (3) varieties bred through PPB do not
meet the requirements for official variety release.
With regards to the first objection, circumstantial evidence suggests that while
plant breeding has been a success story in climatically, agronomically, and eco-
nomically favorable areas, and in areas where the agronomic environment could be
modified to create near-optimum growing conditions, it has been much less suc-
cessful in less-favorable areas. In those areas where it has been successful, plant
breeding has raised both environmental concerns due to high levels of chemical
inputs required by MVs and biodiversity concerns because of the narrowing of the
genetic basis of agricultural crops. More recently, there is a widespread concern
about the use of the improperly called genetically modified organisms (GMOs)
which, regardless of other considerations, represent yet another type of top–down
technology. For these reasons, it may be useful to explore alternative avenues of
plant breeding where the same science can be used in a different way.
The objection that seed companies have difficulties in coping with several
varieties assumes implicitly the need to breed taking into account the requirements
of the seed companies rather that the interest of the farmers, the consumers, and the
society at large. It also ignores that in the case of the major food crops and in
developing countries, farmers and not seed companies are the main suppliers of
seed with over 90% of the seed which is currently planted; PPB can introduce new
varieties directly into the most efficient seed system currently operating.
Against the third objection, the chapter has shown that it is possible to organize a
PPB in such a way that it generates the same quantity of information of the same (or
even better) quality than a conventional breeding program. In addition to the usual
data set on agronomic characteristics, a PPB also generates information on farmers
preferences (which is missing in the data set generated in a conventional breeding
program), and, therefore, it makes the process of variety release more efficient and
effective.
The third objection usually addresses also the genetic structure of the varieties
produced by PPB. It assumes that varieties produced by PPB are inevitably
Participatory Plant Breeding in Cereals 411
genetically heterogeneous, unstable and not distinct, and, therefore, not suited for
release. On this issue there are three points to make. First, the majority of cultivars
still grown in marginal environments are genetically heterogeneous, and, in several
cases, their seed is multiplied officially by the same authorities which deny the right
of populations to be released; second, it is disputable how wise it is to replace them
with genetically uniform material, and it has been recently shown (Di Falco and
Chavas, 2006) that crop genetic diversity can increase farm productivity and can
reduce the risk of crop failure; third, we have shown that PPB, like conventional
plant breeding, is flexible and can be used to produce varieties with different
genetic structure including pure lines and hybrids.
Therefore, the most frequent objections to PPB are unfounded; they ignore the
fact that farmers have domesticated the crops that feed the world, and that they have
continued to modify these crops for millennia. In this process they have planted,
harvested, exchanged seed, introduced new crops and new varieties, and fed
themselves and others, and, in doing so, they have accumulated a wealth of
knowledge that modern science tends to ignore. PPB is one way of recognizing
farmers’ science and to merge it with modern science.
Acknowledgments The authors thank the several hundreds farmers who make their knowledge
freely available, and the several researchers extension staff and NGOs who made this work
possible, and several donors who have supported PPB at ICARDA. These include the OPEC
Fund for International Development, the Governments of Italy and Denmark, der Bundesminister
fur Wirtschaftliche Zusammenarbeit (BMZ, Germany), the International Development Research
Centre (IDRC, Canada), the System Wide Program on Participatory Research and Gender
Analysis (SWP PRGA), and the Water and Food Challenge Program of the CGIAR.
References
Annicchiarico, P., Bellah, F. and Chiari, T. (2005) Defining Subregions and Estimating Benefits
for a Specific-Adaptation Strategy by Breeding Programs: A Case study. Crop Science 45,
1741–1749.
Annicchiarico, P., Bellah, F. and Chiari, T. (2006) Repeatable Genotype x Location Interaction
and its Exploitation by Conventional and GIS-Based Cultivar Recommendation for Durum
Wheat in Algeria. European Journal of Agronomy 24, 70–81.Ashby, J. A. and Lilja, N. (2004) Participatory Research: Does it Work? Evidence from Participa-
tory Plant Breeding. In New Directions for a Diverse Planet. Proceedings of the 4th Interna-
tional Crop Science Congress. Brisbane, Australia, 26 September–1 October 2004. Available at
http://www.cropscience.org.au
Bellon, M. R. (2006) Crop Research to Benefit Poor Farmers in Marginal Areas of the Developing
World: A Review of Technical Challenges and Tools. CAB Reviews: Perspectives in Agricul-
ture, Veterinary Science, Nutrition and Natural Resources. Online ISSN 1749-8848.
Ceccarelli, S. (1989) Wide Adaptation. How Wide? Euphytica 40, 197–205.
Ceccarelli, S. (1996) Positive Interpretation of Genotype by Environment Interactions in Relation
to Sustainability and Biodiversity. In: M. Cooper and G. L. Hammers (Eds.), Plant Adaptationand Crop Improvement. CAB International, Wallingford, UK, ICRISAT, Andra Pradesh, India,
IRRI, Manila, Philippines. pp. 467–486.
412 S. Ceccarelli, S. Grando
Ceccarelli, S. and Grando, S. (1997) Increasing the Efficiency of Breeding Through Farmer
Participation. In: Ethics and Equity in Conservation and Use of Genetic Resources forSustainable Food Security. Proceedings of a Workshop to Develop Guidelines for the
CGIAR, April 21–25. Foz de Iguacu, Brazil, IPGRI; Rome, Italy, IPGRI. pp. 116–121.
Ceccarelli, S. and Grando, S. (2002) Plant Breeding with Farmers Requires Testing the Assump-
tions of Conventional Plant Breeding: Lessons from the ICARDA Barley Program. In: D. A.
Cleveland David and D. Soleri (Eds.), Farmers, Scientists and Plant Breeding:Integrating Knowledge and Practice. Wallingford, Oxon, UK: CAB I Publishing International.
pp. 297–332.
Ceccarelli, S. and Grando, S. (2005) Decentralized-Participatory Plant Breeding (pp. 145–156). In:
R. Tuberosa, R. L. Phillips and M. Gale (Eds.), In the Wake of the Double Helix: From theGreen Revolution to the Gene Revolution. Avenue Media, Bologna, Italy. pp. 145–156.
Ceccarelli, S. and Grando, S. (2007) Decentralized-Participatory Plant Breeding: An Example of
Demand Driven Research. Euphytica 155, 349–360.
Ceccarelli, S., Grando, S., Tutwiler, R., Baha, J., Martini, A. M., Salahieh, H., Goodchild, A. and
Michael, M. (2000) A Methodological Study on Participatory Barley Breeding. I. Selection
Phase. Euphytica 111, 91–104.
Ceccarelli, S., Grando, S., Amri, A., Asaad, F. A., Benbelkacem, A., Harrabi, M., Maatougui, M.,
Mekni, M. S., Mimoun, H., El Einen, R. A., El Felah, M., El Sayed, A. F., Shreidi, A. S. and
Yahyaoui, A. (2001) Decentralized and Participatory Plant Breeding for Marginal Environ-
ments. In: D. Cooper, T. Hodgink and C. Spillane (Eds.), Broadening the Genetic Base of CropProduction. CAB International. pp. 115–135.
Ceccarelli, S., Grando, S., Singh, M., Michael, M., Shikho, A., Al Issa, M., Al Saleh, A., Kaleonjy,
G., Al Ghanem, S. M., Al Hasan, A. L., Dalla, H., Basha, S. and Basha, T. (2003) A
Methodological Study on Participatory Barley Breeding. II. Response to Selection. Euphytica133, 185–200.
Ceccarelli, S., Grando, S. and Baum, M. (2007) Participatory Plant Breeding in Water-Limited
Environment. Experimental Agriculture 43, 1–25.Di Falco, S. and Chavas, J. P. (2006) Crop Genetic Diversity, Farm Productivity and the
Management of Environmental Risk in Rainfed Agriculture. European Review of AgriculturalEconomics 33, 289–314.
Eisemann, R. L., Cooper, M. and Woodruff, D. R. (1990) Beyond the Analytical Methodology:
Better Interpretation and Exploitation of Genotype-by-Environment Interaction in Breeding.
In: M. S. Kang (Ed.), Genotype-by-Environment Interaction and Plant Breeding. Department
of Agron. Louisiana State Agric Experiment Stn, Baton Rouge, LA. pp. 108–117.
Falconer, D. S. (1981) Introduction to Quantitative Genetics (2nd Edn.). Longman Group Ltd.,
London.
Interdrought-II. The 2nd International conference on Integrated Approaches to Sustain and
Improve Plant Production Under Drought Stress; Rome, Italy, September 24-28, 2005.
Conference Conclusions and Recommendations (http://www.plantstress.com/ID2/ID2-Report.
pdf, accessed 18 December, 2008).
Lilja, N. and Aw-Hasaan, A. (2002) Benefits and costs of participatory barley breeding in Syria. A
Background Paper to a Poster Presented at the 25th International Conference of IAAE, Durban,
South Africa, August 16–22 2003.
Mangione, D., Senni, S., Puccioni, M., Grando, S. and Ceccarelli, S. (2006) The Cost of Partici-
patory Barley Breeding. Euphytica 150 (3), 289–306.
Murphy, K. M., Campbell, K. G., Lyon, S. R. and Jones, S. S. (2007) Evidence of Varietal
Adaptation to Organic Farming Systems. Field Crops Research 102, 172–177.
Reynolds, M. P. and Borlaug, N. E. (2006) Applying Innovations and New Technologies for
International Collaborative Wheat Improvement. Journal of Agricultural Science 144, 95–110.Rhoades, R. and Booth, R. (1982) Farmer-Back-To-Farmer: A Model for Generating Acceptable
Agricultural Technology. Agricultural Administration 11, 127–137.
Participatory Plant Breeding in Cereals 413
Schnell, F. W. (1982) A Synoptic sSudy of the Methods and Categories of Plant Breeding.
Zeitshrift fur Pflanzenzuchtung 89, 1–18.
Simmonds, N. W. (1984) Decentralized Selection. Sugar Cane 6, 8–10.Simmonds, N. W. (1991) Selection for Local Adaptation in a Plant Breeding Programme.
Theoretical and Applied Genetics 82, 363–367.Singh, M., Malhotra, R. S., Ceccarelli, S., Sarker, A., Grando, S. and Erskine, W. (2003) Spatial
Variability Models to Improve Dryland Field Trials. Experimental Agriculture 39, 1–10.Soleri, D., Cleveland, D. A., Smith, S. E., Ceccarelli, S., Grando, S., Rana, R. B., Rijal, D. and
Labrada, H. R. (2002) Understanding Farmers’ Knowledge as the Basis for Collaboration with
Plant Breeders: Methodological Development and Examples from Ongoing Research in
Mexico, Syria, Cuba, and Nepal. In: D. A. Cleveland David and D. Soleri (Eds.), Farmers,Scientists and Plant Breeding: Integrating Knowledge and Practice. Wallingford, Oxon, UK:
CAB I Publishing International. pp. 19–60.
Yan, W., Hunt, L. A., Qinglai S. and Szlavnics, Z. (2000) Cultivar Evaluation and Mega-
Environment Investigation Based on the GGE Biplot. Crop Science 40, 597–605.
414 S. Ceccarelli, S. Grando
Index
AAdditive main effects and multiplicative
interaction effects model (AMMI)
model, 310–313
Aldehyde dehydrogenase (ALDH) gene, 385
Avena sativa, 344
BBackcrossing selection, wheat breeding
program, 138
Barley
biotechnologies breeding programs
DH production, 242
marker-assisted selection (MAS),
242–243
breeding achivements and goals
abiotic stresses, 236
Bowman genetics, 234
diseases, 234–236
ICARDA-Mexico program, 237
insects resistance and control methods,
235–236
maltsters and brewers, 234
mlo alleles, 233
productivity and market access, 236
breeding methods and techniques
advance yield trial (AYT), 240
American Malting Barley Association,
238
Breeder and Foundation seeds, 241
greenhouse nursery, 238
intermediate yield trial (IYT), 239
NDAES Foundation Seedstocks
Program, 241
ND lines, plant scale evaluation,
240–241
NDSU scheme, 237
off-season nursery, 238
preliminary yield trials (PYTs), 241
quality data, 239–240
spikes selection, 238
varietal yield trial, 240
year 1-10, 227–242
cereal crop, 227
genetic diversity, 228
germplasm choice
malt quality specifications, 232
parameters, 231–232
intellectual property issues
Australia, 243–244
Canada, 244–245
European Union, 245–247
National Variety Trial system, 243
United States, 247
types
growth habit and hull adherence, 230
hulless, 231
malting or non-malting, 228
rachis node, 229
six-rowed and two-rowed, 228–229
spikelet, 229
Best linear unbiased predictors (BLUPs),
297
Breeding strategies, triticale crop
abiotic stresses, 278
double haploid (DH), 280
415
genetic traits, 278
genetic transformation, 281
hybrid type, 279–280
marker-assisted selection (MAS),
280–281
shuttle type, 279
Brown-midrib (bm) mutations
benefits and comparison with normal
type, 377
feeding efficiency, 378
lower-yielding hybrids choice, 379
maize effect, 375–376
CCanadian Food Inspection Agency (CFIA),
244
Canadian Malting and Brewing Technical
Center (CMBTC), 244
Chemometrics
cereal variety testing, 338–340
nondestructive screening, 335–337
QTL analyses, 337–338
wheat genotypes classification, 357–359
CIMMYT Triticale Improvement Program,
273
CINTERACTION-derived dendograms, 305
Clusters of environments (EC), 304–305
Clusters of genotypes (GC), 304–305
Cytoplasmic genic male sterility (CMS), 171
Cytoplasmic male sterility (CMS), hybrid
wheat, 140
DDArT1 markers, 319–322
Decentralized participatory plant breeding
program
multienvironmental trials, 401
PPB program, 402
process, 401–402
self-pollinated crops
biodiversity effects, 405
experimental design and statistical
analysis, 404–405
model, 402–403
selection and data collection, 404
variety release time, 405
single seed descent and doubled haploids,
401
stages, 400
Department of Primary Industries and
Fisheries (DPI&F), grain sorghum
Australia, 186
direct selection, drought resistance
deterimental effects and genetic
diversity, 193
statistical methodologies, 194
target population of environment,
193–194
indirect selection, drought resistance, 190
midge resistance
benefits, 189–190
breeding methods and results, 188–189
genetics, 187
hybrids, 189
mechanisms, 187
sources, 187–188
midge tested rating scheme, 189
oviposition antixenosis and antibiosis,
187
QTL mapping study, 187
stay-green
breeding methodology and results, 192
molecular markers, 191–192
sources, 191
strategies, 190
Disease resistance, rye cereal
collective buffering, 161
diseases, 160–163
ergot resistance, 162
marker-assisted selection, 163
population parameters, 161
Distinct Uniform and Stable (DUS) testing,
European Union, 245
Doubled haploids (DH)
breeding strategies, 280
homozygous genotypes, 59
nonadditive effects, 60
purple marker, 59
wheat breeding program, 140, 148
Durum wheat breeding program
biotechnologies program, 217
foundation seed production and IP issues
breeder and certified seeds, 217–218
416 Index
Cereal Breeders Rights Applications,
218
UPOV Convention, 219
genetic diversity
area, yields and production, 200
CIMMYT and ICARDA international
centres, 201
geographical pattern, 201
germplasm
breeding objectives, 210
variability creation, 202
goals
challenges, 213–214
Global Rust Initiative, 214
MAS and molecular marker
methodologies, 215
monogenic hypersensitive resistance,
214
multi-ovary trait introgression, 214
methods and techniques
pedigree breeding method, 215
uniform regional durum trials, 216
productivity
6B source, 211
gluten strength, 211–212
grain protein concentration, 211
Italy and Spain, 209
lipoxygenase genes, 210
photoperiod insensitivity, 208
semolina colour, 210
varietal groups
CIMMYT pool, 204–205
disease resistant species, 203
Italian pool, 204
North American pool, 204
North Dakota, 207
popular cultivars, 206
winter pool, 208
EEnvironmental genetic male sterility
(EGMS), 106
European Brewing Convention (EBC),
European Union, 246
Expressed sequence tags (ESTs), 131,
149–150
FFactorial regression models, 313
Full time equivalent (FTE)
Africa and Asia, 117
Latin America, 117–118
rice breeding capacity, 117–119
Fusarium head blight (FHB), fungal
diseases, 136–137
GGE. See Genotype by environment
interaction
General combining ability (GCA), 162
Genomic distribution, barley chromosomes,
298
Genotype by environment interaction (GE),
291
Germplasm, rice breeding program
genealogy and end products, 103
iron toxicity tolerence, 104
parental material, 103–104
Gluten, wheat end-uses, 146
Grain sorghum. See Sorghum bicolor (L.)Grains Research and Development
Corporation (GRDC), Australia, 243
HHalf-sib family selection, 31–32
Hard red spring (HRS), USA and Canada,
130, 134
Heterotic groups
Corn Improvement Conference, 69
germplasm sources, 68
molecular markers, 70
Hordeum vulgare, 342–343Hybrids
genetic covariance, 63
heritabilities of testcrosses, 64
homozygosity, 61
marker-assisted selection, 65
parental inbred lines, 61
plot numbers, 62
public breeding programs, 66
Index 417
rice
environmental genetic male sterility,
112
heterosis level, 113
techniques, 112
three-line system, 106
testers, 66
types
open-pollinated cultivars, 66
single-cross hybrids, 66–68
wheat, 139–141
IInbred line development
breeding system, 47
foundation population, 52
grain yield vs. days-to-flower, 50molecular markers, 57–58
pedigree selection, 47–48
product-moment correlation, 55
tissue culture, 56
Integrated breeding tools, quality traits
cereal technology and plant breeding
barley, 342–343
maize, 345–346
oats, 344
rye, 343
sorghum and millets, 347–348
wheat, 341
economy, 361
endosperm mutation breeding, 351–352
NIR technology, endosperm
chemical composition, 356–357
data breeding, 352–355
seed sorting, 360
wheat genotypes classification,
357–359
nutritional quality, 350–351
screening methods
cereal variety testing, 338–340
pattern recognition data analysis,
335–337
QTL analyses, 337–338
technological and physical–chemical
quality, 334–335
upgradation needs, 334
whole crop utilization, nonfood and food
industries
artificial nitrogen fertilizer, fossil
energy, 348–349
maize and self-propelling harvesting
chopper, 349
Intermediate-winter triticale, 271
International Center for Agricultural
Research in the Dry Areas
(ICARDA), 397
International Centre for Tropical Agriculture
(CIAT), 99, 100, 109–111
International Union for the Protection of
New Varieties of Plants (UPOV)
testing, European Union, 245
Interpopulation recurrent selection (RRS),
33
MMaize breeding
allelic combinations, 7
cross-pollinated species, 5
cultivars stability
additive expression, 72
cultivar mean, 73–74
ecovalence analysis, 74
regression model, 73
target environments, 72
doubled haploids
homozygous genotypes development,
59
nonadditive effects, 60
purple marker, 59
features, 5
heterosis
conference, 71
genetic basis, 70
heterotic groups
Corn Improvement Conference, 69
germplasm sources, 68
molecular markers, 70
hybrids
genetic covariance, 63
heritabilities of testcrosses, 64
homozygosity, 63
marker-assisted selection, 65–66
open-pollinated cultivars, 66
418 Index
parental inbred lines, 61
plot numbers, 62
public breeding programs, 66
single-cross hybrids methodology,
66–67
testers, 64–65
types, 66–68
inbred line development
alleles, 57
breeding system, 47
elite line crosses, 49
foundation population, 52
grain yield vs. days-to-flower, 50inbreeding depression estimates, 50
intermated generations, 53
molecular markers, 57–58
pedigree selection, 47–49
product–moment correlation, 55
self-pollination, 49
tissue culture, 56
molecular genetics techonology, 84
mutants, 83
phases, 8
population-hybrid concept, 36, 54
prebreeding
allele frequencies, 9
average linear response, 15
backcrossing, 13
CIMMYT and GEM evaluate program,
20
composites, 17
days-to-flowering and harvest grain
moisture, 18
diallel mating design and testcrosses,
11
ear-to-row selection, 20
GEM project, 20–21
germplasm development, 8
heterotic alignments, 13
inbred–hybrid concept, 8
inbred lines, 9, 10
lack of adaptation, 13
Lancaster Sure Crop heterotic group,
12
marker-assisted selection, 18
mass selection response, 15
open-pollinated cultivars, 9
reciprocal recurrent selection, 11
temperate environments, 14
quantitative traits
components estimation, 40
direct response estimates, 45
estimates of heritability, 43
fertility restoring gene, 39
gene level dominance, 40
generation-mean analysis and factorial
analyses, 41–42
inbred lines, 44
major genes, 38–39
primary theories, 40
progeny-mean basis, 43
recessive waxy allele, 84
recurrent selection
additive genetic effects, 25–26
Compuesto Selecion Precoz
population, 37
cyclical selection, 22
diallel mating scheme, 25
direct responses, 33–35
ear-to-row selection procedure, 30
genetic gain estimates, 27
goals, 24
half-sib family selection, 31
heterosis, 23
heterotic groups, 35–36
inbred progeny selection, 32
interpopulation recurrent selection, 33
intrapopulation, 27
multiple inbred generations, 32
parameters, 27
private–public interactions, 38
quantitative trait loci, 37
specific combining ability (SCA), 26
selection indices
basic features, 74–75
cold tolerance traits, 79
heritability index, 76
information of relatives, 77
multiple traits selection, 74
multiplicative index, 75
rank-summation index, 75–76
Smith–Hazel index, 78
weight-free indices, 79–81
technological advances, 82
US Department of Agriculture, 6
US maize yields average, 6
Index 419
Western hemisphere, 4
Marker-assisted selection (MAS) program,
142–143, 280–281
Mediterranean Environments, GE, 293–300
Mutation breeding
popular mutagen and characteristics, 113
rice varieties and semi-dwarfness, 114
Mutation breeding program, 141
N
Near infrared reflectance spectroscopy
(NIRS) technology, 136, 342–343
chemical composition, 356–357
data breeding
chemical analyses, 352–355
iPLS predictions, 355
PCA classification, 352–355
pleiotropy, 355
seed sorting, 360
wheat genotypes classification
‘‘association genetic’’ aspect, 358
chemometrics, 359
NERICA rice, 107
North Dakota State University (NDSU), 138
OOrytza sativa, 344–345
PParent line development, rye cereal
CMS and maintainer lines, 170–171
pollinator lines, 171–172
Participatory plant breeding (PPB) program
characteristics, 396–397
decentralized nature
biodiversity effect, 405–406
conventional plant breeding, 400
cyclic process, 400
experimental and statistical designs,
404–405
farmer elite trials (FET), 403
farmer initial yield trial (FIT), 403
farmers advanced yield trials (FAT),
403
model, 402–403
multienvironment trials, 401
selection and data collection, 404
self-pollinated crops, 402–406
single seed descent and doubled
haploids, 401
stages, 400
variety release time, 405
definition, 397
genotype, environmental interactions
dry location, 399
Morocco and Tunisia, 398
impacts
economic analysis, 410
types, 408–410
International Center for Agricultural
Research in the Dry Areas, 397
objectives, 411–412
variety release and seed production
adoption rates, 406–407
implementation process, 407–408
participatory plant breeding, 408
setbacks, 406
Pedigree breeding method, durum wheat,
215–216
Pedigree selection
Crop Science Society of America,
108–109
wheat breeding program, 138–139
Pennisetum glaucum, 347–348Phenotype-based analysis, GE
additive model, 300–301
full interaction model, 301–303
linear–bilinear models
AMMI model, 309–312
biplot, 311
correlation coefficients, 312
GGE model, 311–312
phenotypic characterizations, 307–308
reduced interaction model
CINTERACTION-derived
dendograms, 305
clusters of genotypes (GC) and clusters
of environments (EC), 304–305
Plant breeder’s rights (PBR), 152
Plant breeding, 332–333
barley, 342–343
maize, 345–346
oats, 344
420 Index
rye, 343
sorghum and millets, 347–348
wheat, 341
Plant Variety Protection (PVP), 152, 247
Plant Variety Protection Act (PVPA), 262
Population breeding, rye cereal
development, 164
open-pollinated varieties (OPVs),
164–165
panmictic-midparent heterosis, 167
pollen isolation, 166
Prebreeding concept
allele frequencies, 9
average linear response, 15
backcrosses, 13
CIMMYT and GEM, 19–20
diallel mating design and testcrosses, 11
ear-to-row selection, 20
elite inbred lines, 12
germplasm development, 7
heterotic alignments, 13
inbred-hybrid, 9
marker-assisted selection, 18
mass selection, 15
reciprocal recurrent selection, 11
temperate environments, 17
US Corn Belt populations, 11
Principal component analysis (PCA), 300,
352–355
QQuantitative trait loci (QTL), 379–380
analyses, 337–338
model, 317–321
Quantitative traits inheritance
estimates of
components, 42
direct responses, 45
heritability, 43
fertility restoring gene, 39
gene dominance, 40
generation mean analyses, 42
inbred lines, 44
major genes, 38–39
primary theories, 40
progeny-mean basis, 43
RRecurrent selection, wheat breeding
program, 140
Rice breeding
biotechnology
anther culture, 115
golden rice, 116
molecular linkage maps, 115
molecular markers, 115–116
food crop, 99
genetic diversity
categories, 101
cultivated species, 100–102
diseases, 102
genus Oryza, 100International Institute for Tropical
Agriculture, 100
japonicas, 101–102rice gene banks, 100
simple sequence repeat (SSR), 102
germplasm
Ceysvoni variety, 103
end products and genealogy, 103
iron toxicity tolerence, 104
parental material, 102–103
goals, 107–108
green revolution, 104–105
hybrid rice
breeding lines, 112
environmental factors, 106–107
environmental genetic male sterility,
112
heterosis level, 113
techniques, 112
three-line system, 106
ideotype plants, 105–106
methods and techniques
conventional type, 108–109
Crop Science Society of America, 108
mutation breeding, 113–114
NERICA rice, 107
population improvement, recurrent
selection
advantages, 111
crossing method, 110
evaluation studies, 112
features, 110
Index 421
international organizations, 109
Latin America, 110–111
rice green revolution
characteristics, 104–105
harvest index improvement, 104
seed production foundation
objectives, 116
specialists, 117
world capacity
full time rice breeders, 117–119
Global Plant of Action, 117
Rice green revolution, 104–105
Rice varieties
ceysvoni, 103
golden rice, 116
indica, 101, 102IR8, 104
IR36, IR64, 105, 109
japonicas, 101, 102, 105, 116NERICA, 107, 115
Rye European cereal
disease resistance
collective buffering, 161
diseases, 160–161
ergot resistance and general combining
ability, 162
expected selection gain, 162
experimental results, 161
diseases, 160–161
marker-assisted selection, 160
gametophytic self-incompatibility system,
158
germplasm and genetic resources usage
gene bank collections, 159
introgression library, 160
reasons, 159–160
Secale accessions collection, 160growing countries and grain yield,
158–159
hybrid breeding
base materials, 168–169
CMS and maintainer lines, 170–171
combining ability, recurrent
improvement, 172–173
experimental hybrids buildup, 173
genetic structure, 169
integrating strategy, 175–176
productivity, 176–178
molecular fingerprinting, 174
multi-stage procedure, 173
parent line development, 169–172
pollinator lines, development of,
171–172
restorer synthetics, 175
seed-and pollinator-parent stripes, 175
seed-parent line development, 171
seed production, 173–175
Visello vs. Conduct hybrid varieties,
178
population breeding
development, 164
intra-pool values, 167
open-pollinated varieties (OPVs), 164–
165
panmictic-midparent heterosis, 167,
168
pollen isolation, 166
synthetic varieties, 167–168
use and goals, 163–164
winter cereal, 158, 164
SScreening methods, breeding
cereal variety testing
genetic engineering, 338–340
gigantic data network, 339
PCA, 340
pattern recognition data analysis
NIR instruments and predictions,
335–337
NIRS technology, 335–336
QTL analyses, 337–338
technological and physical–chemical
quality, 334–335
Secale cereale, 343Selection indices, maize
cold tolerance traits, 79
features, 75
heritability index, 76
information of relatives, 77
merits, 75
multiplicative index, 75
rank-summation index, 75–76
Smith–Hazel index, 78
weight-free indices, 79
422 Index
Setaria italica, 347Shuttle breeding program, 141–142
Silage quality traits
cell wall digestibility
aldehyde dehydrogenase gene, 385
allelic variation studies, 385–386
Caffeoyl-CoA, 383
CCR and CAD, 383–384
COMT and PAL genes, 382–386
cropping, 372
gene expression deregulation, 381
identification of varieties, 372
monolignol biosynthesis, 381
Myb transcription factors, 385
near infrared reflectance spectroscopy,
369
organic matter digestibility, 370
sorghum and small-grain cereals, 371–
372
Tilley–Terry and enzymatic IVDMD,
368–369
in vitro digestibility, 370
in vivo and in vitro heritability, 371
ZmCAD2 genes role, 384
feeding value traits
agronomic and quality traits, average
values, 375
bm3 maize silage feeding efficiency,
378
brown-midrib mutations, 376–379
forage maize, 374
genetic resources availability, 375–376
lower-yielding hybrids choice, 379
maize bm mutations effects, 376
molecular markers, 376
normal and bm3 hybrids comparison,
377
Wisconsin Quality Synthetic, 375
forage plants and cereals, 368
genetic engineering, 387
nutritional factor
cattle intake regulation, 374
voluntary intake, 373
protein content, 368
quantitative trait loci
maize lignin pathway, 381
recombinant inbred lines progenies,
379
Single seed descent (SSD), wheat breeding
program, 139
Sitopsis sections, secondary gene pool, 132
Soft red winter (SRW) market classes, 254
Soft white winter (SWW) market classes,
254
Sorghum bicolor (L.)breeding in Australia, 186
cytogenetics and nuclear genetics, 185
Department of Primary Industries and
Fisheries, Queensland, 186
direct selection drought resistance
genetic diversity and detrimental
effects, 193
statistical methodologies, 194
target population of environment,
193–194
drought and heat-resistant crop, 183
genetic diversity sources, 185–186
indirect selection drought resistance
perennial crop, 190
stay-green, 191–192
and millets, 347–348
origin, 184
sorghum midge resistance
benefits, 189–190
biological virus spray, 190
breeding methods, 188
chemical control, 186–187
genetics, 187
ICSV745 antibiosis gene, 188
mechanisms, 187
midge tested rating scheme, 189
oviposition antixenosis and antibiosis,
187
sources, 187–188
strategies, drought resistance, 190
taxonomy, 184–185
varieties, 183
Spring wheat breeding program
abiotic stress tolerance
direct and indirect selection, 137, 149
factors, 137
biotic stress resistance
fungal diseases, 136–137
insects and mites, 136
blending, 130
breads and flour noodles, 129–130
Index 423
cereals and bars, 130
cookies and cakes, 130
foundation seed production and IPR
issues
breeder seed, 151–152
pedigreed seed separation, 151
registered seed, 151–152
rights granted, 152
gene pools, 132–133
genetics, 131–132
goals
abiotic stress tolerance, 137
biotic stress resistance, 136–137
grain quality, 135–136
grain yield, 134–135
groups and classes
CIMMYT germplasm, 133
types and categories, 133–134
hexaploid, annual and self-pollinated
cereal, 128
leading countries, 128
main uses of, 129
methods and techniques
backcrossing selection, 138
bulk selection, 139
double haploidy, 140
factors, 138
hybrid wheat production, 140–141
marker-assisted selection, 142–143
mutation breeding, 141
pedigree selection, 138–139
recurrent selection, 140
shuttle breeding, 141–142
single seed descent, 139
optimum growing temperature, 128
productivity
abiotic stress tolerance, 149
disease and pests resistance, 146–148
grain quality, 144–146
grain yield, 143–144
staple food, 128
technologies integration
BAC libraries, 131–132
expressed sequence tags, 149–150
genomics tools, 149
International Wheat Genome
Sequencing Consortium, 151
Statistical analysis, GE
analyses of varience, 302–303
differential genotypic responses, 324–326
explicit environmental characterization
model
factorial regression models, 313
variable selection, 313–316
explicit genotypic information model
co-dominant marker, 317
DArT1 markers, 319–327
genetic covariables, 316–319
QTL model, 317–319
genomic distribution, 296
grain yield, modern barley cultivars
explicit environmental
characterization, 299–300
genotyping, 294–297
phenotyping, 297–299
multi environment trials (METs), 292
partitioning, 315
phenotype-based analysis
additive model, 300–301
full interaction model, 301–303
linear–bilinear models, 308–312
phenotypic characterizations, 307–308
reduced interaction model, 304–306
principal component analysis, 300
QTL main effects and QTL.E effects, 317,
325
regression analysis, 327
simultaneous model incorporation,
324–327
Structure program, 278, 294, 297, 305,
306, 318
Structure program, GE, 278, 294, 297, 298,
305, 306, 318
TTriticale crop
breeding strategies
abiotic stresses, 278
double haploid (DH), 280
genetic traits, 278
genetic transformation, 281
hybrid type, 279–280
marker-assisted selection (MAS),
280–281
424 Index
shuttle type, 279
early breeding, 273–274
future challenges
adaptation, 282
genetic diversity, 283
genomics, 283–284
health issues, 284
uses, 282–283
genetics, 272–273
improvements
adaptation, 275–276
biotic resistance, 277
enhanced quality, 276–277
increased yield, 274–275
types, 267–269
uses
feed grain, 269
food grain, 269–270
forage crop, 270–272
others, 272
Triticum aestivum, 341
UUniform regional durum trials (URDN), 216
UPOV Convention, durum wheat breeding
program, 219
US Department of Agriculture (USDA), 6
VVariable selection, GE, 313–316
Varietal groups, durum wheat
CIMMYT pool, 205
Italian pool, 204
North American pool
North Dakota, 207
popular cultivars, 206
resistant and tolerant, 203
winter pool, 208
Visello and Conduct varities, 177, 178
WWhole plant industrial utilization, 348–349
Winter and specialty wheat
commercial types, 251
foundation seed production, 262–263
genetic diversity and germplasm selection
chromosomes, 252–253
Eastern type, 254–255
genomes and end-use quality, 253
Northern Great Plains, 256–257
PNW type, 255
soft and hard types, 254
SRW and SWW market classes, 254
Southern Great Plains, 256
VPM-1 resistance genes, 255
growth habits, 251
hard wheat quality
bread making, 257–258
generation, 260–261
grain hardness, 259
Great Plains breeding programs, 257
mix and match approach, 260
quality screening procedures, 258
red vs. white types, 258–259regional genotyping laboratories, 261
self-pollinated breeding methods, 259–
260
soft type, 260
intellectual property issues, 262–263
transgenic wheats, 261–262
Wisconsin Quality Synthetic, 375
XX Triticosecale. See Triticale crop
ZZea mays, 345–346
Index 425
Related Documents