Durum Wheat Breeding and Genetics Printed Edition of the Special Issue Published in Agronomy www.mdpi.com/journal/agronomy Pasquale De Vita and Francesca Taranto Edited by

Welcome message from author
This document is posted to help you gain knowledge. Please leave a comment to let me know what you think about it! Share it to your friends and learn new things together.
Transcript
Durum W
heat Breeding and Genetics • Pasquale De Vita and Francesca Taranto
Durum Wheat Breeding and Genetics
Printed Edition of the Special Issue Published in Agronomy
www.mdpi.com/journal/agronomy
Pasquale De Vita and Francesca TarantoEdited by
Durum Wheat Breeding and Genetics

Durum Wheat Breeding and Genetics
Editors
Pasquale De Vita
Francesca Taranto
MDPI • Basel • Beijing • Wuhan • Barcelona • Belgrade • Manchester • Tokyo • Cluj • Tianjin
Francesca Taranto
Research Centre for Cereal and Industrial Crops (CREA-CI) Italy
EditorsPasquale De Vita
Research Centre for Cereal and Industrial Crops (CREA-CI) Italy
Editorial Office
MDPISt. Alban-Anlage 66
4052 Basel, Switzerland
This is a reprint of articles from the Special Issue published online in the open access journal Agronomy
(ISSN 2073-4395) (available at: https://www.mdpi.com/journal/agronomy/special issues/durum
wheat breeding genetics).
For citation purposes, cite each article independently as indicated on the article page online and as
indicated below:
LastName, A.A.; LastName, B.B.; LastName, C.C. Article Title. Journal Name Year, Article Number,
Page Range.
ISBN 978-3-03943-102-1 (Hbk) ISBN 978-3-03943-103-8 (PDF)
Cover image courtesy of Pasquale De Vita.
c© 2020 by the authors. Articles in this book are Open Access and distributed under the Creative
Commons Attribution (CC BY) license, which allows users to download, copy and build upon
published articles, as long as the author and publisher are properly credited, which ensures maximum
dissemination and a wider impact of our publications.
The book as a whole is distributed by MDPI under the terms and conditions of the Creative Commons
license CC BY-NC-ND.
Contents
About the Editors . . . . . . . . . . . . . . . . . . . . . . . . . . . . . . . . . . . . . . . . . . . . . . vii
Preface to ”Durum Wheat Breeding and Genetics” . . . . . . . . . . . . . . . . . . . . . . . . . . ix
Ioannis N. Xynias, Ioannis Mylonas, Evangelos G. Korpetis, Elissavet Ninou, Aphrodite Tsaballa, Ilias D. Avdikos and Athanasios G. Mavromatis
Durum Wheat Breeding in the Mediterranean Region: Current Status and Future ProspectsReprinted from: Agronomy 2020, 10, 432, doi:10.3390/agronomy10030432 . . . . . . . . . . . . . . 1
Amadou Tidiane Sall, Tiberio Chiari, Wasihun Legesse, Kemal Seid-Ahmed, Rodomiro Ortiz, Maarten van Ginkel and Filippo Maria Bassi
Durum Wheat (Triticum durum Desf.): Origin, Cultivation and Potential Expansion in Sub-Saharan AfricaReprinted from: Agronomy 2019, 9, 263, doi:10.3390/agronomy9050263 . . . . . . . . . . . . . . . 29
Khaoula El Hassouni, Bouchra Belkadi, Abdelkarim Filali-Maltouf, Amadou Tidiane-Sall,
Ayed Al-Abdallat, Miloudi Nachit and Filippo M. Bassi
Loci Controlling Adaptation to Heat Stress Occurring at the Reproductive Stage inDurum WheatReprinted from: Agronomy 2019, 9, 414, doi:10.3390/agronomy9080414 . . . . . . . . . . . . . . . 49
Edossa Fikiru Wayima, Ayalew Ligaba-Osena, Kifle Dagne, Kassahun Tesfaye, Eunice Magoma Machuka, Samuel Kilonzo Mutiga and Emmanuel Delhaize
Screening of Diverse Ethiopian Durum Wheat Accessions for Aluminum ToleranceReprinted from: Agronomy 2019, 9, 440, doi:10.3390/agronomy9080440 . . . . . . . . . . . . . . . 69
Alejandro del Pozo, Ivan Matus, Kurt Ruf, Dalma Castillo, Ana Marıa Mendez-Espinoza and
Marıa Dolores Serret
Genetic Advance of Durum Wheat Under High Yielding Conditions: The Case of ChileReprinted from: Agronomy 2019, 9, 454, doi:10.3390/agronomy9080454 . . . . . . . . . . . . . . . 83
Ridha Boudiar, Juan M. Gonzalez, Abdelhamid Mekhlouf, Ana M. Casas and Ernesto Igartua
Durum Wheat Seminal Root Traits within Modern and Landrace Germplasm in AlgeriaReprinted from: Agronomy 2020, 10, 713, doi:10.3390/agronomy10050713 . . . . . . . . . . . . . 97
Anna Gagliardi, Federica Carucci, Stefania Masci, Zina Flagella, Giuseppe Gatta and
Marcella Michela Giuliani
Effects of Genotype, Growing Season and Nitrogen Level on Gluten Protein Assembly ofDurum Wheat Grown under Mediterranean ConditionsReprinted from: Agronomy 2020, 10, 755, doi:10.3390/agronomy10050755 . . . . . . . . . . . . . 113
v

About the Editors
Pasquale De Vita (Ph.D.) is a Senior researcher at CREA Research Centre for Cereal and
Industrial Crops, Foggia, Italy. His main interest is focused on durum wheat breeding and genetics,
including QTL mapping, marker-assisted selection, phenotypic and molecular analysis of germplasm
collections for breeding purposes. His current research includes the evaluation of Triticum ssp. and
their genetic diversity through a multidisciplinary approach, with the objective of identifying new
sources of useful traits/genes to be exploited in breeding programs and varietal improvement. Dr.
De Vita has authored and co-authored more than 80 peer-reviewed journal articles, including review
papers and book chapters. He also holds two industrial patents and has developed six durum wheat
varieties in collaboration with seed companies.
Francesca Taranto (Ph.D.) is a Researcher at the National Research Council of Italy, Institute of
Biosciences and Bioresources (CNR-IBBR), Portici (Napoli), Italy. In 2013, she defended her Ph.D.
thesis in ”Plant breeding and pathology of agricultural and forestry plants” at the University of
Bari, Italy. Her research activity is focused on marker-assisted breeding and genetics of wheat,
legumes, and cultivated trees (mainly olive and grapevine). She employs genetics, molecular biology,
genomics, and bioinformatics techniques to investigate population genetics, biodiversity, and gene
flow and identify key genes involved in the expression of important agronomic traits. Since January
2018, she is a Review Editor in Bioinformatics and Computational Biology for the journal Frontiers in
Genetics and a Review Editor for Plant Breeding, a specialty section of Frontiers in Plant Science. Dr.
Taranto has authored and co-authored more than 30 peer-reviewed journal articles, including review
papers and book chapters.
vii

Preface to ”Durum Wheat Breeding and Genetics”
Durum wheat is grown primarily in the Mediterranean basin, with a total production that varies significantly every year due to unpredictable climatic conditions. The frequency and the intensity of extreme weather events are concomitant with changes in global climate, making the selection of new durum wheat varieties difficult. The Special Issue Book ”Durum Wheat Breeding and Genetics” is based on scientific papers addressing major concerns related to the genetic improvement of durum wheat. Seven chapters including two review papers provide an update on the progress in the genetic improvement of durum wheat, suggesting traits and strategies to maintain productivity and high qualitative standards, despite increasing water scarcity and higher temperatures. It is necessary to exploit the best modern technologies and the entire methodological arsenal currently available to prevent the stagnation of durum wheat production. Understanding the genetic bases of variation for the most important agronomic traits and identifying allelic variants associated with tolerance to abiotic stresses of durum wheat are a priority. To this end, it is necessary to explore the genetic variability existing within durum wheat species, including landraces and traditional varieties. This special issue offers new breeding opportunities for selecting modern varieties adapted to climate change and expanding the durum wheat production.
Pasquale De Vita, Francesca Taranto
Editors
ix

agronomy
Review
Durum Wheat Breeding in the Mediterranean Region:Current Status and Future Prospects
Ioannis N. Xynias 1,*,†, Ioannis Mylonas 2,†, Evangelos G. Korpetis 2, Elissavet Ninou 3,
Aphrodite Tsaballa 2, Ilias D. Avdikos 4 and Athanasios G. Mavromatis 4
1 School of Agricultural Sciences, University of Western Macedonia, Terma Kontopoulou, 53100 Florina,Greece
2 Institute of Plant Breeding and Genetic Resources, Hellenic Agricultural Organization–“Demeter”,57001 Thessaloniki, Greece; [email protected] (I.M.); [email protected] (E.G.K.);[email protected] (A.T.)
3 Institute of Industrial and Fodder Crops, Hellenic Agricultural Organization Demeter–“Demeter”,41335 Larissa, Greece; [email protected]
4 Laboratory of Genetics and Plant Breeding, School of Agriculture, Aristotle University of Thessaloniki,54124 Thessaloniki, Greece; [email protected] (I.D.A.); [email protected] (A.G.M.)
* Correspondence: [email protected] or [email protected]† These authors contributed equally to this work.
Received: 10 January 2020; Accepted: 19 March 2020; Published: 21 March 2020
Abstract: This brief historical review focuses on durum wheat domestication and breeding in theMediterranean region. Important milestones in durum wheat breeding programs across the countriesof the Mediterranean basin before and after the Green Revolution are discussed. Additionally,the main achievements of the classical breeding methodology are presented using a comparisonof old and new cultivars. Furthermore, current breeding goals and challenges are analyzed. Anoverview of classical breeding methods in combination with current molecular techniques and toolsfor cultivar development is presented. Important issues of seed quality are outlined, focusing onprotein and characteristics that affect human health and are connected with the consumption ofwheat end-products.
Keywords: Mediterranean basin; durum wheat; breeding; MAS; biochemical markers; quality
1. Introduction
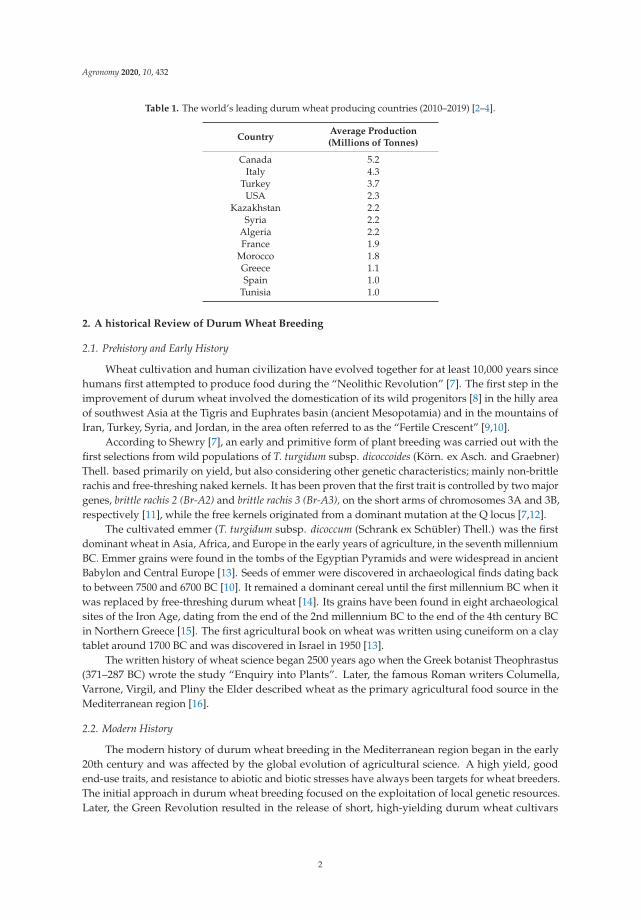
Durum wheat (Triticum turgidum subsp. durum (Desf.) Husnot) is one of the most essential cerealspecies and is cultivated worldwide over almost 17 million ha, with a global production of 38.1 milliontonnes in 2019 [1]. The largest producer is the European Union, with 9 million tonnes in 2018, followedby Canada, Turkey, United States, Algeria, Mexico, Kazakhstan, Syria, and India [2–6]. Durum wheatproduction and cultivation areas are concentrated in the Mediterranean. Moreover, the countries of theMediterranean basin are the largest importers and the largest consumers of durum wheat products(flour, pasta, and semolina). Among European Union (EU) countries, Italy is considered the leader ofdurum wheat production, with an average production of 4.26 million tonnes in the last decade (1.28million ha growing area), followed by France with 1.89 million tonnes (0.37 million ha), Greece with 1.07million tonnes (0.37 million ha), and Spain with 0.98 million tonnes (0.38 million ha) (Table 1) [2]. Sincedurum wheat is mainly grown under rain-fed conditions in the Mediterranean basin, its productivityis profoundly affected by rainfall and biotic (pests and diseases) and abiotic (drought, sunlight, cold,and salinity) stresses.
Agronomy 2020, 10, 432; doi:10.3390/agronomy10030432 www.mdpi.com/journal/agronomy1
Agronomy 2020, 10, 432
Table 1. The world’s leading durum wheat producing countries (2010–2019) [2–4].
CountryAverage Production(Millions of Tonnes)
Canada 5.2Italy 4.3
Turkey 3.7USA 2.3
Kazakhstan 2.2Syria 2.2
Algeria 2.2France 1.9
Morocco 1.8Greece 1.1Spain 1.0
Tunisia 1.0
2. A historical Review of Durum Wheat Breeding
2.1. Prehistory and Early History
Wheat cultivation and human civilization have evolved together for at least 10,000 years sincehumans first attempted to produce food during the “Neolithic Revolution” [7]. The first step in theimprovement of durum wheat involved the domestication of its wild progenitors [8] in the hilly areaof southwest Asia at the Tigris and Euphrates basin (ancient Mesopotamia) and in the mountains ofIran, Turkey, Syria, and Jordan, in the area often referred to as the “Fertile Crescent” [9,10].
According to Shewry [7], an early and primitive form of plant breeding was carried out with thefirst selections from wild populations of T. turgidum subsp. dicoccoides (Körn. ex Asch. and Graebner)Thell. based primarily on yield, but also considering other genetic characteristics; mainly non-brittlerachis and free-threshing naked kernels. It has been proven that the first trait is controlled by two majorgenes, brittle rachis 2 (Br-A2) and brittle rachis 3 (Br-A3), on the short arms of chromosomes 3A and 3B,respectively [11], while the free kernels originated from a dominant mutation at the Q locus [7,12].
The cultivated emmer (T. turgidum subsp. dicoccum (Schrank ex Schübler) Thell.) was the firstdominant wheat in Asia, Africa, and Europe in the early years of agriculture, in the seventh millenniumBC. Emmer grains were found in the tombs of the Egyptian Pyramids and were widespread in ancientBabylon and Central Europe [13]. Seeds of emmer were discovered in archaeological finds dating backto between 7500 and 6700 BC [10]. It remained a dominant cereal until the first millennium BC when itwas replaced by free-threshing durum wheat [14]. Its grains have been found in eight archaeologicalsites of the Iron Age, dating from the end of the 2nd millennium BC to the end of the 4th century BCin Northern Greece [15]. The first agricultural book on wheat was written using cuneiform on a claytablet around 1700 BC and was discovered in Israel in 1950 [13].
The written history of wheat science began 2500 years ago when the Greek botanist Theophrastus(371–287 BC) wrote the study “Enquiry into Plants”. Later, the famous Roman writers Columella,Varrone, Virgil, and Pliny the Elder described wheat as the primary agricultural food source in theMediterranean region [16].
2.2. Modern History
The modern history of durum wheat breeding in the Mediterranean region began in the early20th century and was affected by the global evolution of agricultural science. A high yield, goodend-use traits, and resistance to abiotic and biotic stresses have always been targets for wheat breeders.The initial approach in durum wheat breeding focused on the exploitation of local genetic resources.Later, the Green Revolution resulted in the release of short, high-yielding durum wheat cultivars
2
Agronomy 2020, 10, 432
from International research institutions, which are used extensively in crosses in almost all nationalbreeding programs.
2.3. The Early Period, before the Green Revolution
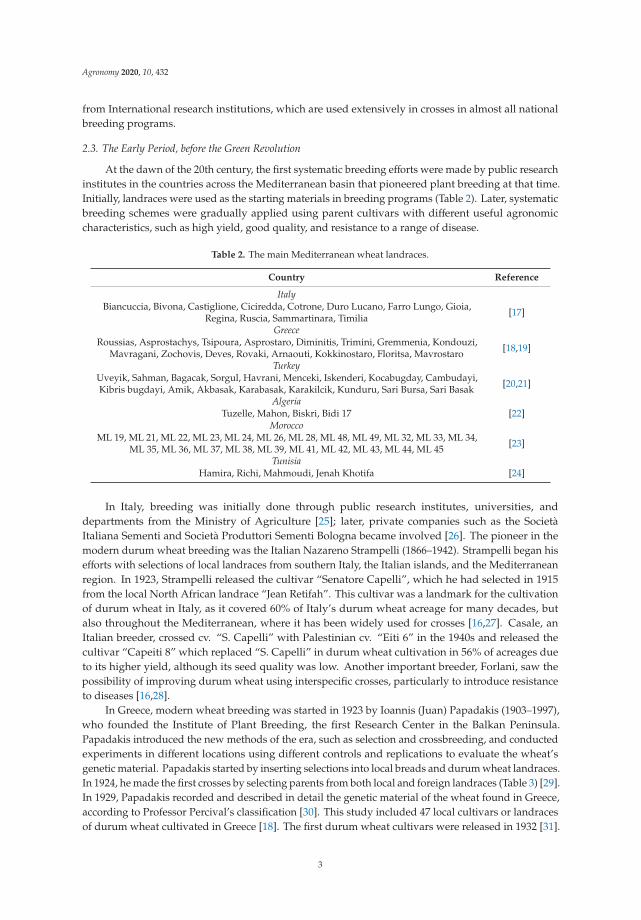
At the dawn of the 20th century, the first systematic breeding efforts were made by public researchinstitutes in the countries across the Mediterranean basin that pioneered plant breeding at that time.Initially, landraces were used as the starting materials in breeding programs (Table 2). Later, systematicbreeding schemes were gradually applied using parent cultivars with different useful agronomiccharacteristics, such as high yield, good quality, and resistance to a range of disease.
Table 2. The main Mediterranean wheat landraces.
Country Reference
ItalyBiancuccia, Bivona, Castiglione, Ciciredda, Cotrone, Duro Lucano, Farro Lungo, Gioia,
Regina, Ruscia, Sammartinara, Timilia [17]
GreeceRoussias, Asprostachys, Tsipoura, Asprostaro, Diminitis, Trimini, Gremmenia, Kondouzi,
Mavragani, Zochovis, Deves, Rovaki, Arnaouti, Kokkinostaro, Floritsa, Mavrostaro [18,19]
TurkeyUveyik, Sahman, Bagacak, Sorgul, Havrani, Menceki, Iskenderi, Kocabugday, Cambudayi,Kibris bugdayi, Amik, Akbasak, Karabasak, Karakilcik, Kunduru, Sari Bursa, Sari Basak [20,21]
AlgeriaTuzelle, Mahon, Biskri, Bidi 17 [22]
MoroccoML 19, ML 21, ML 22, ML 23, ML 24, ML 26, ML 28, ML 48, ML 49, ML 32, ML 33, ML 34,
ML 35, ML 36, ML 37, ML 38, ML 39, ML 41, ML 42, ML 43, ML 44, ML 45 [23]
TunisiaHamira, Richi, Mahmoudi, Jenah Khotifa [24]
In Italy, breeding was initially done through public research institutes, universities, anddepartments from the Ministry of Agriculture [25]; later, private companies such as the SocietàItaliana Sementi and Società Produttori Sementi Bologna became involved [26]. The pioneer in themodern durum wheat breeding was the Italian Nazareno Strampelli (1866–1942). Strampelli began hisefforts with selections of local landraces from southern Italy, the Italian islands, and the Mediterraneanregion. In 1923, Strampelli released the cultivar “Senatore Capelli”, which he had selected in 1915from the local North African landrace “Jean Retifah”. This cultivar was a landmark for the cultivationof durum wheat in Italy, as it covered 60% of Italy’s durum wheat acreage for many decades, butalso throughout the Mediterranean, where it has been widely used for crosses [16,27]. Casale, anItalian breeder, crossed cv. “S. Capelli” with Palestinian cv. “Eiti 6” in the 1940s and released thecultivar “Capeiti 8” which replaced “S. Capelli” in durum wheat cultivation in 56% of acreages dueto its higher yield, although its seed quality was low. Another important breeder, Forlani, saw thepossibility of improving durum wheat using interspecific crosses, particularly to introduce resistanceto diseases [16,28].
In Greece, modern wheat breeding was started in 1923 by Ioannis (Juan) Papadakis (1903–1997),who founded the Institute of Plant Breeding, the first Research Center in the Balkan Peninsula.Papadakis introduced the new methods of the era, such as selection and crossbreeding, and conductedexperiments in different locations using different controls and replications to evaluate the wheat’sgenetic material. Papadakis started by inserting selections into local breads and durum wheat landraces.In 1924, he made the first crosses by selecting parents from both local and foreign landraces (Table 3) [29].In 1929, Papadakis recorded and described in detail the genetic material of the wheat found in Greece,according to Professor Percival’s classification [30]. This study included 47 local cultivars or landracesof durum wheat cultivated in Greece [18]. The first durum wheat cultivars were released in 1932 [31].
3
Agronomy 2020, 10, 432
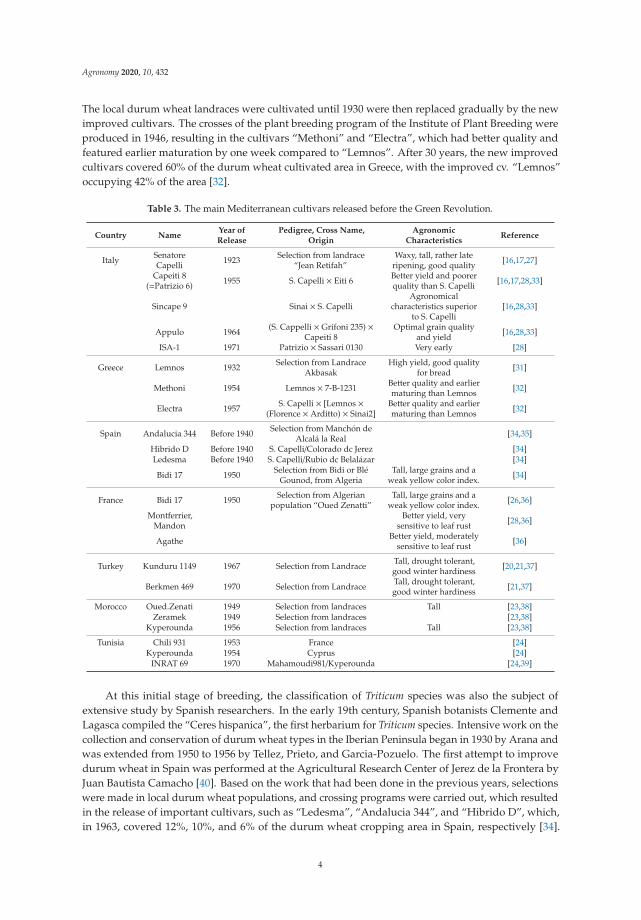
The local durum wheat landraces were cultivated until 1930 were then replaced gradually by the newimproved cultivars. The crosses of the plant breeding program of the Institute of Plant Breeding wereproduced in 1946, resulting in the cultivars “Methoni” and “Electra”, which had better quality andfeatured earlier maturation by one week compared to “Lemnos”. After 30 years, the new improvedcultivars covered 60% of the durum wheat cultivated area in Greece, with the improved cv. “Lemnos”occupying 42% of the area [32].
Table 3. The main Mediterranean cultivars released before the Green Revolution.
Country NameYear ofRelease
Pedigree, Cross Name,Origin
AgronomicCharacteristics
Reference
Italy SenatoreCapelli 1923 Selection from landrace
“Jean Retifah”Waxy, tall, rather late
ripening, good quality [16,17,27]
Capeiti 8(=Patrizio 6) 1955 S. Capelli × Eiti 6 Better yield and poorer
quality than S. Capelli [16,17,28,33]
Sincape 9 Sinai × S. CapelliAgronomical
characteristics superiorto S. Capelli
[16,28,33]
Appulo 1964 (S. Cappelli × Grifoni 235) ×Capeiti 8
Optimal grain qualityand yield [16,28,33]
ISA-1 1971 Patrizio × Sassari 0130 Very early [28]
Greece Lemnos 1932 Selection from LandraceAkbasak
High yield, good qualityfor bread [31]
Methoni 1954 Lemnos × 7-B-1231 Better quality and earliermaturing than Lemnos [32]
Electra 1957 S. Capelli × [Lemnos ×(Florence × Arditto) × Sinai2]
Better quality and earliermaturing than Lemnos [32]
Spain Andalucia 344 Before 1940 Selection from Manchón deAlcalá la Real [34,35]
Hibrido D Before 1940 S. Capelli/Colorado dc Jerez [34]Ledesma Before 1940 S. Capelli/Rubio dc Belalázar [34]
Bidi 17 1950 Selection from Bidi or BléGounod, from Algeria
Tall, large grains and aweak yellow color index. [34]
France Bidi 17 1950 Selection from Algerianpopulation “Oued Zenatti”
Tall, large grains and aweak yellow color index. [26,36]
Montferrier,Mandon
Better yield, verysensitive to leaf rust [28,36]
Agathe Better yield, moderatelysensitive to leaf rust [36]
Turkey Kunduru 1149 1967 Selection from Landrace Tall, drought tolerant,good winter hardiness [20,21,37]
Berkmen 469 1970 Selection from Landrace Tall, drought tolerant,good winter hardiness [21,37]
Morocco Oued.Zenati 1949 Selection from landraces Tall [23,38]Zeramek 1949 Selection from landraces [23,38]
Kyperounda 1956 Selection from landraces Tall [23,38]
Tunisia Chili 931 1953 France [24]Kyperounda 1954 Cyprus [24]
INRAT 69 1970 Mahamoudi981/Kyperounda [24,39]
At this initial stage of breeding, the classification of Triticum species was also the subject ofextensive study by Spanish researchers. In the early 19th century, Spanish botanists Clemente andLagasca compiled the “Ceres hispanica”, the first herbarium for Triticum species. Intensive work on thecollection and conservation of durum wheat types in the Iberian Peninsula began in 1930 by Arana andwas extended from 1950 to 1956 by Tellez, Prieto, and Garcia-Pozuelo. The first attempt to improvedurum wheat in Spain was performed at the Agricultural Research Center of Jerez de la Frontera byJuan Bautista Camacho [40]. Based on the work that had been done in the previous years, selectionswere made in local durum wheat populations, and crossing programs were carried out, which resultedin the release of important cultivars, such as “Ledesma”, “Andalucia 344”, and “Hibrido D”, which,in 1963, covered 12%, 10%, and 6% of the durum wheat cropping area in Spain, respectively [34].
4
Agronomy 2020, 10, 432
The characteristic resistance of local landraces to three types of rust has been studied at the InstitutoNacional de Investigaciones Agrarias since 1954 [40].
Concerning France, until the 1960s, production and research programs have mainly been conductedin Algeria, Morocco, and Tunisia. In 1930, breeding work was conducted in Algeria by Ducellier,who identified 29 local cultivars or populations of durum wheat. Wheat research was performedand coordinated by the Institut National de la Recherche Agronomique (INRA) in Montpellier untilAlgeria’s independence in 1962, and then from The Algerian Center for Agronomic, Scientific, andEconomic Research (CARASE), or INRA, in Algeria. In the early 1970s, the production of durum wheatincreased drastically due to the release of the cultivars “Bidi 17”, “Oued Zenati 368”, “Hedba 3”, and“Mohamed Ben Bachir”, which resulted from selections among local landraces [22]. Accordingly, beforethe 1960s, breeding efforts in Morocco were focused on collecting local durum wheat landraces, fromwhich, after the selection programs, the cultivars “Oued Zenati”, “Zeramek”, and “Kyperounda” werereleased (from 1949 to 1956). The latter cultivars were more productive than the local landraces, buttheir quality was inferior [23]. A similar approach was recorded in Tunisia, where local durum wheatlandraces were mainly cultivated in the country until the 1940s. These were followed by cultivarsproduced from selections within the aforementioned landraces [24].
The Ministry of Agriculture started a breeding program in Libya in the 1950s. Durum wheatlandraces, such as “Jlail-Dib” and “Hmira”, were used to develop improved varieties. During theperiod of 1962–1965, nine durum wheat cultivars were collected and characterized [41]. Simultaneously,breeding work for durum wheat took place in Egypt, another important North African country. In 1914,Egyptian breeders released two cultivars with resistance to high temperatures, “Dakar 49” and “Dakar52”, which were selected from local durum wheat landraces. In the 1920s, these breeders released thecultivars “Hindi D”, “Hindi 62”, and “Tosson” using genetic material imported from India. Since 1942,this breeding program has focused on creating cultivars with resistance to the three aforementionedtypes of rust [42].
In Turkey, initial wheat research began in 1925 with the establishment of the first “SeedImprovement Station” in Eskisehir. The early durum wheat cultivars that were released resulted fromselections within the local durum wheat populations and included “Kunduru 414/44”, “Sari Bursa7113”, “Kunduru 1149”, “Berkmen 496”, “Akbasak 073/44”, and “Karakilcik 1133” [20,43]. Finally,in Israel, the onset of genetic improvement in durum wheat was based on selections within locallandraces. Local wheat landraces, mainly durum wheat that was previously cultivated in Palestine,were described as early as the 1920s. In 1948, Kostrinsky compiled a descriptive list of cultivars andlandraces [44].
2.4. Breeding Work in the Mediterranean during and after Green Revolution
A significant increase in yield was achieved in many national breeding programs through thesecond half of the 20th century [45]. The key to the dramatic increase in wheat yields during the ‘GreenRevolution’ in the 1960s was the introduction of semi-dwarf genes into bread wheat, which resultedin the replacement of tall cultivars with semi-dwarf cultivars characterized by their responsivenessto inputs (e.g., fertilizers) and resistance to lodging. The primary donor of these genes was thesemi-dwarf cultivar “Daruma” from Japan. Initially, the cultivar “Norin 10” was developed as aresult of diallelic crosses between “Daruma” and some American cultivars. Norman Borlaug, atthe Centro Internacional de Mejoramiento de Maiz y Trigo (CIMMYT), used the cross “Norin 10” x“Brevor 14” for the development of initial genetic material that was first shipped to Latin America andSoutheast Asia, where it was rapidly adopted for cultivation with spectacular increases in yield [46].The cultivar “Norin 10” has also been widely used in breeding programs around the world for theintroduction of semi-dwarf genes in durum wheat, which has been recorded since 1956 [47]. This wasan important milestone that affected durum wheat breeding efforts worldwide. The CIMMYT durumwheat germplasm continues to play an essential role in increasing the production and genetic gain ofnational agricultural research systems for developing countries. Indeed, 77% of the cultivars released
5
Agronomy 2020, 10, 432
in developing countries in 1991–1997 originated from crosses between CIMMYT and indigenousgenotypes. Moreover, 19% of these included at least one parent from the CIMMYT collection [48].
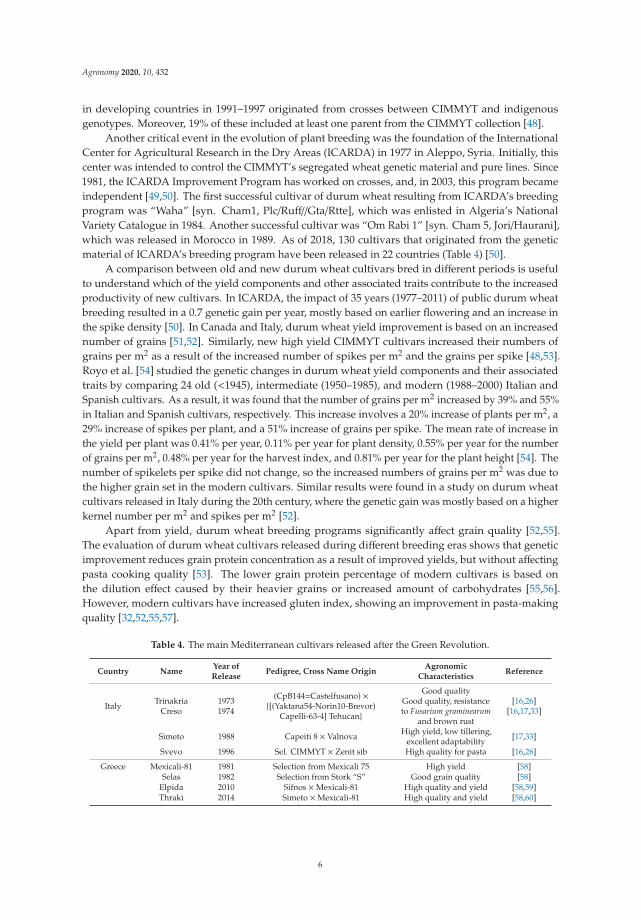
Another critical event in the evolution of plant breeding was the foundation of the InternationalCenter for Agricultural Research in the Dry Areas (ICARDA) in 1977 in Aleppo, Syria. Initially, thiscenter was intended to control the CIMMYT’s segregated wheat genetic material and pure lines. Since1981, the ICARDA Improvement Program has worked on crosses, and, in 2003, this program becameindependent [49,50]. The first successful cultivar of durum wheat resulting from ICARDA’s breedingprogram was “Waha” [syn. Cham1, Plc/Ruff//Gta/Rtte], which was enlisted in Algeria’s NationalVariety Catalogue in 1984. Another successful cultivar was “Om Rabi 1” [syn. Cham 5, Jori/Haurani],which was released in Morocco in 1989. As of 2018, 130 cultivars that originated from the geneticmaterial of ICARDA’s breeding program have been released in 22 countries (Table 4) [50].
A comparison between old and new durum wheat cultivars bred in different periods is usefulto understand which of the yield components and other associated traits contribute to the increasedproductivity of new cultivars. In ICARDA, the impact of 35 years (1977–2011) of public durum wheatbreeding resulted in a 0.7 genetic gain per year, mostly based on earlier flowering and an increase inthe spike density [50]. In Canada and Italy, durum wheat yield improvement is based on an increasednumber of grains [51,52]. Similarly, new high yield CIMMYT cultivars increased their numbers ofgrains per m2 as a result of the increased number of spikes per m2 and the grains per spike [48,53].Royo et al. [54] studied the genetic changes in durum wheat yield components and their associatedtraits by comparing 24 old (<1945), intermediate (1950–1985), and modern (1988–2000) Italian andSpanish cultivars. As a result, it was found that the number of grains per m2 increased by 39% and 55%in Italian and Spanish cultivars, respectively. This increase involves a 20% increase of plants per m2, a29% increase of spikes per plant, and a 51% increase of grains per spike. The mean rate of increase inthe yield per plant was 0.41% per year, 0.11% per year for plant density, 0.55% per year for the numberof grains per m2, 0.48% per year for the harvest index, and 0.81% per year for the plant height [54]. Thenumber of spikelets per spike did not change, so the increased numbers of grains per m2 was due tothe higher grain set in the modern cultivars. Similar results were found in a study on durum wheatcultivars released in Italy during the 20th century, where the genetic gain was mostly based on a higherkernel number per m2 and spikes per m2 [52].
Apart from yield, durum wheat breeding programs significantly affect grain quality [52,55].The evaluation of durum wheat cultivars released during different breeding eras shows that geneticimprovement reduces grain protein concentration as a result of improved yields, but without affectingpasta cooking quality [53]. The lower grain protein percentage of modern cultivars is based onthe dilution effect caused by their heavier grains or increased amount of carbohydrates [55,56].However, modern cultivars have increased gluten index, showing an improvement in pasta-makingquality [32,52,55,57].
Table 4. The main Mediterranean cultivars released after the Green Revolution.
Country NameYear ofRelease
Pedigree, Cross Name OriginAgronomic
CharacteristicsReference
Italy TrinakriaCreso
19731974
(CpB144=Castelfusano) ×{[(Yaktana54-Norin10-Brevor)
Capelli-63-4] Tehucan}
Good qualityGood quality, resistanceto Fusarium graminearum
and brown rust
[16,26][16,17,33]
Simeto 1988 Capeiti 8 × Valnova High yield, low tillering,excellent adaptability [17,33]
Svevo 1996 Sel. CIMMYT × Zenit sib High quality for pasta [16,26]
Greece Mexicali-81 1981 Selection from Mexicali 75 High yield [58]Selas 1982 Selection from Stork “S” Good grain quality [58]
Elpida 2010 Sifnos ×Mexicali-81 High quality and yield [58,59]Thraki 2014 Simeto ×Mexicali-81 High quality and yield [58,60]
6
Agronomy 2020, 10, 432
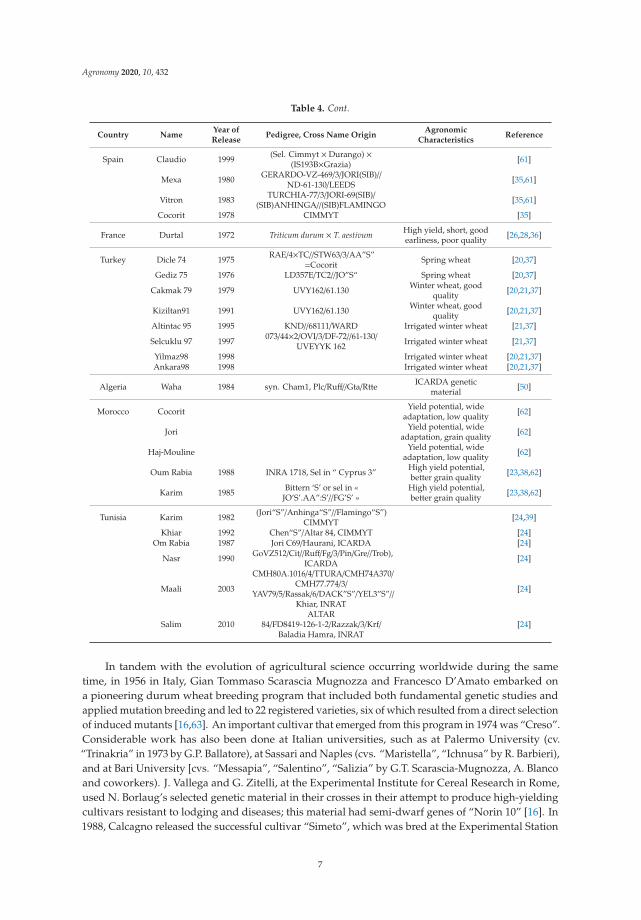
Table 4. Cont.
Country NameYear ofRelease
Pedigree, Cross Name OriginAgronomic
CharacteristicsReference
Spain Claudio 1999 (Sel. Cimmyt × Durango) ×(IS193B×Grazia) [61]
Mexa 1980 GERARDO-VZ-469/3/JORI(SIB)//ND-61-130/LEEDS [35,61]
Vitron 1983 TURCHIA-77/3/JORI-69(SIB)/(SIB)ANHINGA//(SIB)FLAMINGO [35,61]
Cocorit 1978 CIMMYT [35]
France Durtal 1972 Triticum durum × T. aestivum High yield, short, goodearliness, poor quality [26,28,36]
Turkey Dicle 74 1975 RAE/4×TC//STW63/3/AA”S”=Cocorit Spring wheat [20,37]
Gediz 75 1976 LD357E/TC2//JO”S“ Spring wheat [20,37]
Cakmak 79 1979 UVY162/61.130 Winter wheat, goodquality [20,21,37]
Kiziltan91 1991 UVY162/61.130 Winter wheat, goodquality [20,21,37]
Altintac 95 1995 KND//68111/WARD Irrigated winter wheat [21,37]
Selcuklu 97 1997 073/44×2/OVI/3/DF-72//61-130/UVEYYK 162 Irrigated winter wheat [21,37]
Yilmaz98 1998 Irrigated winter wheat [20,21,37]Ankara98 1998 Irrigated winter wheat [20,21,37]
Algeria Waha 1984 syn. Cham1, Plc/Ruff//Gta/Rtte ICARDA geneticmaterial [50]
Morocco Cocorit Yield potential, wideadaptation, low quality [62]
Jori Yield potential, wideadaptation, grain quality [62]
Haj-Mouline Yield potential, wideadaptation, low quality [62]
Oum Rabia 1988 INRA 1718, Sel in “ Cyprus 3” High yield potential,better grain quality [23,38,62]
Karim 1985 Bittern ‘S’ or sel in «JO’S’.AA”:S’//FG’S’ »
High yield potential,better grain quality [23,38,62]
Tunisia Karim 1982 (Jori“S”/Anhinga“S”//Flamingo“S”)CIMMYT [24,39]
Khiar 1992 Chen“S”/Altar 84, CIMMYT [24]Om Rabia 1987 Jori C69/Haurani, ICARDA [24]
Nasr 1990 GoVZ512/Cit//Ruff/Fg/3/Pin/Gre//Trob),ICARDA [24]
Maali 2003
CMH80A.1016/4/TTURA/CMH74A370/CMH77.774/3/
YAV79/5/Rassak/6/DACK”S”/YEL3”S”//Khiar, INRAT
[24]
Salim 2010ALTAR
84/FD8419-126-1-2/Razzak/3/Krf/Baladia Hamra, INRAT
[24]
In tandem with the evolution of agricultural science occurring worldwide during the sametime, in 1956 in Italy, Gian Tommaso Scarascia Mugnozza and Francesco D’Amato embarked ona pioneering durum wheat breeding program that included both fundamental genetic studies andapplied mutation breeding and led to 22 registered varieties, six of which resulted from a direct selectionof induced mutants [16,63]. An important cultivar that emerged from this program in 1974 was “Creso”.Considerable work has also been done at Italian universities, such as at Palermo University (cv.“Trinakria” in 1973 by G.P. Ballatore), at Sassari and Naples (cvs. “Maristella”, “Ichnusa” by R. Barbieri),and at Bari University [cvs. “Messapia”, “Salentino”, “Salizia” by G.T. Scarascia-Mugnozza, A. Blancoand coworkers). J. Vallega and G. Zitelli, at the Experimental Institute for Cereal Research in Rome,used N. Borlaug’s selected genetic material in their crosses in their attempt to produce high-yieldingcultivars resistant to lodging and diseases; this material had semi-dwarf genes of “Norin 10” [16]. In1988, Calcagno released the successful cultivar “Simeto”, which was bred at the Experimental Station
7
Agronomy 2020, 10, 432
for wheat at Caltagirone in Sicily. This cultivar was high yielding, low tillering, and had excellentadaptability across different environments. Thus, it has been widely cultivated in all the countriesof the Mediterranean basin up to present with a large acreage [26] and is often used as a parent incrosses. In the private sector, seed companies have released many notable cultivars, including “Duilio”(Società Italiana Sementi, S.I.S.) and “Svevo” (Società Produttori Sementi), which are cultivated inseveral important durum wheat productive countries offering high-quality pasta products.
In Greece in the late 1960s, E. Skorda induced artificial mutations with gamma rays and thermalneutrons to increase genetic variability [64]. In the early 1980s, the breeder’s team from the CerealInstitute in Thessaloniki released cultivars that were bred from intra-cultivar selections of geneticmaterial from the Mediterranean basin, including “Mexicali 81”, “Kallithea”, “Athos”, and “Selas”.Furthermore, new cultivars selected from CIMMYT segregating germplasm were made available to thefarmers. Among the aforementioned released cultivars, “Selas” had an excellent grain quality and wasused until 2015 by the pasta industry in Greece. The newest durum wheat cultivars released by thebreeders from the Cereal Institute originated either from crossbreeding among different cultivars orfrom selections among CIMMYT segregating material included in the Greek National and the CommonCatalogue of Cultivated Plants [58,60].
At the beginning of the 1960s in France, Pierre Grignac began the first durum wheat breedingprogram, in which the first crossings among Mediterranean landraces were developed at INRAin Montpellier. In the middle of the same decade, cultivars with good qualities, such as a goodyellow-amber color, were imported from North Dakota for cultivation in northern France, andconstituted a second genetic pool for the program [26]. Afterwards, Grignac used interspecific crosseswith bread wheat to select new lines with improved characteristics [28,36].
In Algeria, the Field Crops Development Institute (IDGC) was founded in 1974. This institutewas responsible for durum wheat breeding and has collaborated actively with CIMMYT and ICARDAsince 1980. As a result, more than 60 modern durum wheat cultivars have been released, and the peakyields have been obtained with the cultivars “Hoggar” and “Sahel” [22]. In Tunisia, modern cultivarsdeveloped from CIMMYT and ICARDA genotypes prevailed during the 1970s and were replaced inthe 1980s by more recent cultivars developed at INRAT [24].
In 1970, a result of the collaboration with CIMMYT and, later, with ICARDA was the introductionof foreign durum wheat germplasm into Morocco in an attempt to develop new high-yielding,early-maturing cultivars. The outcome of this program was the release of the cultivars “Marzak”,“Karim”, “Sebou”, and others after 1984 [23]. However, this new germplasm was inferior in quality.
Finally, in Turkey, the agreement between the Turkish government and the Rockefeller Foundationin 1967 resulted in the release of semi-dwarf, high-yielding, and disease-resistant cultivars [20,65].
3. Application of Classical Methodologies of Breeding
3.1. Classical Approaches, New Perspectives, and Tools for Wheat Breeding
The main targets of a durum wheat breeding program established in the Mediterranean basin,where its cultivation is very well adapted, may focus on: (1) grain yield improvement; (2) yieldstability and a better understanding of genotype × environment interactions (G × E) and adaptationmechanisms; (3) responsiveness to inputs and the use efficiency of recourses in different cultivationsystems; (4) resistance to biotic stresses (pests and diseases), and tolerance to abiotic stresses (drought,salinity, etc.); or (5) improving grain quality.
The above parameters are taken into account by durum wheat breeders in the design of a breedingprogram for cultivar development. They use common classical breeding methods, such as pedigree,bulk, single-seed, backcross method, pure line selection, and recurrent selection, to develop cultivarswith the desired characters mentioned above. These methods can be applied with some alterations toincrease efficiency and reduce the duration of the breeding program. As an example, backcross (BC) isa very common method mainly used in durum wheat for the transfer of traits controlled by only one or
8
Agronomy 2020, 10, 432
a few genes, such as resistance to diseases or quality parameters, from one donor parent to an elite line(recurrent parent) [66,67]. Molecular markers can significantly shorten the time needed, compared tothe conventional backcross method, to identify the desired plants that have the target gene/genes andapply negative selection for the donor genome to ensure the maximum recovery of a recurrent-parentgenome [68]. There are successful results in durum wheat breeding programs regarding the increaseddisease resistance or quality characteristics. Marker-assisted backcrossing (MABC) through simplesequence repeat (SSR) markers was shown to improve grain protein content in a wheat cultivar [69];this method can assist the simultaneous selection of multiple stripe rust resistance genes and helpavoid escapees during the selection process. In a previous study, the successful targeting of the genetransfer and reconstitution of the genome were completed in a period of four crop cycles, provingthe practical application of MABC in developing high grain protein lines in the background of anypopular cultivar [69]. In the single-seed descent method (SSD), only one seed from each F2 selectedplant is kept and bulked with all the others to produce an F3 population. The same procedure isrepeated until the F5–F6 generation. Two or more generations grow per year in the greenhouse, inwinter nurseries, or in a growth chamber. The selection of lines takes place in the F6 lines, whichhave increased homozygosity, retaining a large part of the extensive genetic variability from the F2
generation. The single-seed descent method is considered a tool to exploit durum wheat geneticresources [70]. In the bulk breeding method, some plants are selected from the F2 population, and theirseeds are bulked to form the F3 population. The same procedure is repeated until the F5 generation,where the evaluation of lines begins until the F10–F11 generation. This is an easy method to apply, thussaving breeders time and effort. Also, this method can increase the frequency of desirable genotypes ina population, but is not very effective for traits with low heritability. However, a modification of thismethod could be useful in wheat breeding when applied under salinity stress conditions [71]. In thiscase, using molecular markers through a bulk segregant analysis (BSA) will increase the effectivenessand shorten the needed time for all these processes [72].
Finally, the pedigree breeding method (and its modifications) is the most common method usedin breeding programs for the release of durum wheat cultivars. Generally, pedigree breeding includesphenotypic selection in the early generations (until F3-4), and the normal yield test begins in thegenerations with increased homozygosity (~F5). The selection for yield during early generations wasnot very effective when the evaluation was done in normal plant density fields [73–76]; however, it wasfound to be effective when the evaluation was applied in low plant density fields and the experimentalunit involved a single plant, as in the honeycomb methodology [77–80]. Finally, the selected lines fromthe experiments with replications will be evaluated in large plots (drill strips) over ~2 years and ~5–10locations to determine yield, stability across locations, maturity, plant height, semolina, pasta andimportant quality characteristics for cooking [81]. Following a classical approach, a period of 9–12years is needed from the beginning to the end of a breeding program, but this time could be reducedsignificantly by using the Marker Assisted Selection (MAS) procedure [82].
It has been recorded that the effectiveness of breeding on durum wheat’s yield potential hasbeen remarkable in Spain, Morocco, Turkey, and Italy [20,35,62,83]. The improvement of grain yield(GY) during the past decade has been attributed mostly to the increased number of grains m−2 and tothe increased number of spikes m−2 [83]. Thus, further improvements in these characteristics mightimprove yield [83]. Important increases in yield were also achieved by increasing the harvest index,which has almost doubled since the beginning of the 20th century [83,84]. Moreover, a further increasein yield was achieved through an increase in biomass and a subsequent increase in yield, whichexplains the stability of the harvest index over the last three decades [84]. Similarly, an increase inbiomass could result in an increase in yield in the future. Other characteristics that contributed to theincreased yield in the 20th century include a reduction in the heading date and physiological maturityand an increase in the grain filling period [83]. Similar changes in these characteristics in the futurecould result in an increase in yield, based on the results of the reduction of the effects of drought and
9
Agronomy 2020, 10, 432
heat stress. Moreover, an increased yield could be achieved through the release of cultivars with higherwater use efficiency [85].
Apart from the selection for increased yield potential, further improvements could be achievedthrough selection for increased tolerance to abiotic and biotic stresses. Moreover, the importance of traitsthat allow a plant to escape terminal drought and avoid critical stages of seed development (anthesisand seed filling), such as early vigor and an early heading date, has been well recognized [86,87].All the above classical breeding methodologies have succeeded in making considerable progress inthe yield and quality of durum wheat in the Mediterranean basin [24,57,88]. The main problem forthe classical methods is that they are time-consuming, and phenotyping procedures are costly. In aneffort to aid classical breeding methods, molecular genetics and associated technologies have beendeveloped, and they offer important tools for plant breeders.
The parental selection of wheat lines can be based on phenotypic characterization and biochemicaland DNA markers, which can estimate genetic variability even among phenotypically similar genotypes,as identified in several studies undertaken in Mediterranean countries [89–93]. By employing molecularmarkers in parental selection, the genetic diversity of wild and cultivated wheat can be exploited [94–98].As an example, SSR markers were proven to be effective in the selection of genetically diverse genotypeswith phenotypical similarities [90]. A combination of molecular markers and pedigree data could helpin the exploitation of genetic diversity [91,99] and the selection of progenies, significantly increasingthe efficiency and precision of plant breeding programs. Molecular markers supply various advantagesover morphological markers in the linkage mapping of important agronomic traits. They are alsounlimited in number, highly polymorphic, and can be used at any developmental stage without anyenvironmental interference. Molecular markers can increase the precision and speed of selection in adurum wheat program though: (a) selection in the early stages or a simultaneous selection of multipletraits or traits that are difficult or expensive to evaluate; (b) the targeted introgression of useful genesin wide crosses; and (c) accelerated backcrossing. MAS or molecular breeding offers an opportunity toaccelerate classical breeding approaches. MAS requires the establishment of a correlation between adesired trait, such as disease resistance, and molecular marker(s); this can be obtained by phenotypinga genetic mapping population followed by a quantitative trait locus (QTL) analysis [81]. For thispurpose, several markers that are known to be associated with QTL/genes for some major economictraits are being deployed for MAS in wheat breeding programs. Several examples of the successful useof MAS are now available for wheat, and more examples will become available in the future [100–102].Furthermore, molecular allele mining can help in broadening the reduced genetic diversity of cultivatedwheat through the identification of allelic variation and the isolation of new rare alleles capable ofimproving tolerance to abiotic and biotic stresses [103,104]. According to Sehgal et al. [104], by usingnew technologies, unexploited genetic variation can further improve the drought and heat stresstolerance of the elite wheat pool and enrich it with novel drought and heat tolerance genes. This willcontribute to achieve adaptability of the released cultivars to high temperature and drought that is forthe most important emerging problems emerging in the Mediterranean due to climate change.
3.2. Participatory Plant Breeding
Today, it is recognized that agricultural production requires the adoption of environmentallyfriendly solutions, the preservation of crop biodiversity, and the release of varieties suitable for lowinput environments to set new goals for wheat breeding that align with the real needs of farmersand the market that are imprinted in the Mediterranean. Employing a participatory plant breeding(PPB) approach may have many benefits, including increased and more stable productivity, fasterrelease and adoption of wheat varieties, better understanding of farmers’ various criteria, enhancedbiodiversity, the conservation of crop diversity on farms [105,106], increased cost-effectiveness, theability to facilitate the learning of farmers, and the empowerment of farmers [107].
Participatory plant breeding (PPB) methods incorporate the involvement of end users in thebreeding process [108] and the decentralization of selection sites into farmers’ fields [109]. This has been
10
Agronomy 2020, 10, 432
proposed as an alternative to formal plant breeding and is more likely to produce varieties acceptableto farmers in marginal environments [110]. Social studies concerning the related historical and culturaltraditions can assess the needs of both farmers and the market for local products [111–113]. Usually,end users value different traits than plant breeders [114]. Plant breeders contribute their expertise increating genetic variation, in population management, and in designing screening methods that canseparate genetic from environmental effects [110]. Participation provides flexibility in the selectionprogram. The objectives could be reoriented to ensure relevant end products in case some changes arenecessary during the breeding procedure. Moreover, there is a mistrust of modern varieties amongfarmers, bakers, and consumers [81,115], and participatory plant breeding could rebuild client trustwith improved varieties [116]. In many breeding programs where there are G x E interactions duringevaluation, the lines selected under PPB have been found to perform better for farmer priority traitsthan those selected via formal plant breeding methods [117,118]. PPB programs can also reduce thecosts of the breeding process. Cost savings primarily derive from the less frequent testing of advancedlines [119]. Many studies have shown that participatory variety selection (PVS) can improve theadoption of varieties [120–122], and thereby enhance productivity [123].
In Syria, decentralized participatory selection by farmers is significantly more efficient inidentifying the highest yielding entries in farmers’ fields than any other selection strategy [124].Farmer-selected populations are not genetically homogenous, which may lead to higher yield stabilityin varying environments [125]. PPB projects including farmers have resulted in the wider and simpleradoption of new varieties [114,126,127]. Wheat populations after PPB will evolve by adapting graduallyand continuously to climate change [128]. A wheat population developed at ICARDA [129] has beenevolving for five years at a farm in Tuscany (using evolutionary participatory breeding principals);the name of this population is ‘SOLIBAM Tenero Floriddia’ [130]. Thanks to the EU CommissionImplementing Decision (2014/150/EU), which provides specific derogations for the marketing of wheatpopulations, this genetically heterogeneous population is now, for the first time, being marketed as acertified seed [130].
3.3. The Application of Doubled-Haploid Techniques
The introduction of advanced in-vitro tissue culture techniques, such as androgenesis (anther ormicrospore culture), chromosome elimination techniques (wide hybridization), and ovule cultures(gynogenesis), in self-pollinating crop species, has helped breeders to accelerate trait fixation insegregating populations of durum wheat in research conducted in Tunisia and ICARDA [131,132].Of the techniques mentioned above, androgenesis (more precisely, an anther culture) can onlybe incorporated into breeding programs if they ensure the production of a sufficient number ofgenetically stable doubled haploid plants from a wide range of genotypes [133]. An anther culture,despite its effectiveness and convenience, has the serious disadvantage of being firmly genotypedependent [134,135]. Furthermore, durum wheat hardly responds at all to this technique (i.e., itsembryo production is deficient and most of the plants produced are albinos) [136,137]. For thisreason, chromosome elimination techniques are an attractive alternative approach, since they are notgenotype dependent [138] and are not influenced by the dominant Kr wheat crossover genes [139].This technique is mainly used in producing new germplasm, not only in durum but also in bread wheatand triticale. The fourth technique, gynogenesis, is another alternative for producing new germplasm.In gynogenesis, haploid plant development is induced by an unpollinated ovary culture. However,the use of an ovary culture is practiced more rarely in wheat breeding programs [140]. In a recentstudy in Tunisia, Slama-Ayed et al. [132] compared three doubled haploid techniques and found thatgynogenesis is an exciting approach that could be used to produce new durum wheat genotypes as asupplement to maize techniques.
11
Agronomy 2020, 10, 432
4. Breeding Challenges
Durum wheat breeding is considered to be one of the most cost effective and environmentallysafe ways to meet the future challenges that durum wheat productivity will face due to climate change.The durum wheat is cultivated in rain-fed farming systems in Mediterranean basin. This is mainlyconnected with the high temperatures and drought that are expected to become more severe thenext years and affect the cultivation across the Mediterranean [141]. In this context, investment inthe productivity of rain-fed areas that cover a significant portion of Mediterranean countries couldcontribute to food security and rural growth. The UN reports several strategies for agronomic practicesbased on output and productivity in semi-arid areas, including the use of adaptable varieties, which isconsidered a very effective practice [142]. Breeding programs must be even more efficient due to theupcoming climate change effects and increased food demands. The identification of genetic resourcesand the study of genetic variability will provide further information regarding the increased toleranceof durum wheat under abiotic and biotic stresses. This could contribute to the increase and stability ofproduction in future adverse climatic conditions. In this way, genetic studies for the identification ofQTLs/genes that control important agronomic traits [82,143–145] and disease resistance [146] could alsohelp. The identification of genomic regions that affect valuable target traits is known as quantitativetrait locus (QTL) (or linkage) mapping, and it is a useful tool for the exploitation of loci that areco-segregating with traits of interest in a population [147]. QTL studies have been widely conductedon durum wheat for the genetic dissection of important breeding traits using diverse molecularmarkers and detailed genetic maps. Maps were used for the identification of QTLs controlling severalcharacteristics, such as grain yield and kernel characters [82,148], grain-milling traits [149], and qualitytraits like endosperm color [150], grain protein content [151], and other pasta quality traits [152].In extended experiments, including 249 recombinant inbred durum wheat lines evaluated in 16environments, it was found that two major QTLs on chromosomes 2BL and 3BS have consistent effectsacross different environments [82]. Also, a QTL for plant height was identified on chromosomes 1BS,3AL, and 7AS, and three QTLs for heading date were identified on chromosomes 2AS, 2BL, and 7BS.Moreover, 76 QTLs were identified for yield components along with several morpho-physiologicaltraits (peduncle length, the Normalized Difference Vegetation Index (NDVI), and leaf greenness at themilk-grain stage expressed in Single-photon Avalanche Diode (SPAD) units) [143]. In a study undersalinity conditions, four SSR markers were closely linked with grain yield, which could thus be used inthe improvement of durum wheat through MAS under abiotic stress [144].
It is also expected that climate change will affect the vulnerability of durum wheat in differentdiseases [153,154]. Biotic resistance has also been investigated for the identification of QTLs that conferresistance to fungi [155] or pests [156]. Additional QTL studies use even greater genetic diversity,such as multiparental crosses for the identification of yield-related QTLs [157]. Abiotic resistancehas also been under investigation for the identification of QTLs. A genome-wide association studyof a durum wheat core set using 7652 Single Nucleotide Polymorphism (SNP) markers allowed theidentification of major QTLs controlling the adaptation to heat stress [145]. Additionally, 12 loci werefound to control the main heat tolerance traits; among these loci, three activated only when heat stressoccurred. Moreover, two loci validated in a Kompetitive Allele Specific PCR (KASP) marker, areready for deployment via MAS and could result in increased productivity in heat-stressed areas andimproved resilience to climate change. A haplotype analysis of 208 elite lines confirmed that thosewith positive allele at all three QTLs had an 8% higher yield in a heat-stressed field environment [145].
Another important parameter is the durum wheat quality in terms of its protein content, endospermtexture, and glutenin content, which cannot be easily measured phenotypically. However, the methodsfor testing quality are typically costly, time-consuming, and need relatively large amounts of grain,which are available only in the late stages of breeding programs. Thus, markers for wheat qualitytraits can be very useful to enable the screening of a high number of lines and can be used earlyin breeding programs [158,159]. The durum wheat breeding programs carried out over the 20thcentury have focused on an increase of yield in combination with quality characteristics for pasta
12
Agronomy 2020, 10, 432
products [52,160–162] and the achievement of better adaptability under Mediterranean conditions [52].Little attention has been given to increasing other grain health-promoting components and nutritiveconstituents of durum wheat, such as dietary fibre (DF), total and soluble arabinoxylan content, andbeta-glycan in semolina. There are indications that intense breeding either increases or does not affectthese parameters in modern cultivars compared to old cultivars [88], indicating that the breedingprocess may contribute to a further improvement of durum wheat’s nutritive characteristics.
Thus, markers for wheat quality traits can be very useful to enable the screening of a high numberof lines and can be used early in breeding programs [158,159]. Six QTLs explained 49%–56% ofgrain protein variations [163], and seven QTLs explain 62%–91% of the sodium dodecyl sulfate (SDS)volume [160] in durum wheat germplasm. A number of markers targeting different glutenin alleleshave been referenced, including markers for Glu-B1 alleles, based on the sequence variations of Bxtype genes [161]. Further, MAS succeeded in increasing pasta-quality-associated properties throughthe transfer of significant QTLs, such as the Gli-B1 locus containing γ-gliadin 45 and the Glu-B3 locuscontaining Low Molecular Weight (LMW)-2 type glutenins [162].
4.1. Seed Storage Proteins and Quality
Seed storage proteins are prolamins that account for 80% of total grain proteins, and their roleis crucial in determining the technological properties of durum wheat end products [57]. Prolaminsare alcohol-soluble and can be classified according to their electrophoretic mobility in two classes:monomeric gliadins and polymeric glutenins. The former can be further classified as α, β, γ, andω gliadins or as the high and low molecular weight glutenin subunits (HMW-GS and LMW-GSrespectively) [57]. Many reports have discussed the effects of gluten protein composition on durum’send products [164,165]. These effects are either genotypic or environmentally dependent [166,167].It is well established that certain HMW and LMW glutenin subunits affect the end product qualitydifferently in durum wheat. For example, HMW GS 7+8 alleles are associated with better qualitycompared to allelic HMW-GS 20 [110]. For LMW-GS, it has also been demonstrated that certainsubunits encoded by the loci located on chromosome 1B (Glu-) positively (LMW -2 group of subunits)or negatively (LMW-1 group of subunits) affect pasta-making properties [168].
Wheat gliadin is also characterized by high intervarietal polymorphism, and most individualcultivars show unique electrophoretic patterns [169–171]. In durum wheat, the presence of componentsγ-42 and γ-45 encoded by allelic genes on chromosome 1B is reported to affect the viscoelastic propertiesof gluten [172]. Gliadin γ-45 is associated with a group of LMW–GS subunits termed LMW-2, andγ-42 is associated with LMW-1 glutenin subunits. Gliadin γ-45 could be used as a genetic marker forhigh gluten quality, whereas gliadin’s γ-42 component could serve as a genetic marker for poor glutenquality. Also, gliadin alleles were found to be correlated with resistance to cold and stem rust [173].Finally, in breeding programs, knowledge of the allelic composition at each locus is beneficial inidentifying and using the genotypes that carry the most promising qualitative traits.
4.2. Seed Quality Characteristics Connected with Human Health
The durum wheat breeding programs carried out over the 20th century mainly focused onincreasing yield in combination with quality characteristics for pasta products [52,174–176] and theachievement of better adaptability to Mediterranean conditions [52]. Little attention was given toother grain health-promoting components. It has been suggested that intensive breeding has ledto decreased contents of health-promoting components in modern wheat cultivars [177]. Recently,several researchers have investigated, in detail, the other nutritive constituents of durum wheat, suchas dietary fiber (DF), that have many health benefits; it was found that intense breeding has notdecreased DF in the modern cultivars compared to the old ones [88]. It was also observed that thetotal arabinoxylan content in wholemeal or semolina is not differentiated between recent and oldgenotypes, while modern cultivars have higher proportions of soluble arabinoxylan in wholemeals and
13
Agronomy 2020, 10, 432
of beta-glycan in semolina compared to the old genotypes [88]. These results show that the breedingprocess could contribute to further improvements in durum wheat’s nutritive characteristics.
Apart from its value as a source of nutrients, wheat may cause inflammatory immune reactionsand disorders like wheat allergies, celiac disease and non-celiac wheat sensitivity (NCWS), fructosemalabsorption, and irritable bowel syndrome (IBS), highlighting the need for less-reactive wheatproducts that can contribute to quality of life improvements [81,178]. Wheat proteins, includinggluten and non-gluten proteins like amylase/trypsin inhibitors (ATI) and others, are characterized astriggering factors. Recent studies have sought to investigate the underlying causes of these immunereactions [178]. According to the types of reactions caused, wheat-related disorders are classifiedas: (a) allergies, including immunoglobulin E (IgE) and non-IgE mediated allergic reactions; and (b)autoimmune, including celiac disease and herpetiform dermatitis [179]. Several studies have focusedon the factors that affect the immunostimulatory capacity of allergic factors present in cereals, since ithas been reported that short immunotherapy may represent a valid way to treat the disease [179,180].
Recent comparative studies on the nutritional characteristics of old and modern durum wheatgenotypes have found that the breeding process improves durum wheat’s gluten quality both interms of its technological performance in producing high-quality pasta products and its allergenicpotential [57]. More specifically, in modern cultivars, a higher gluten index was found to be connectedto increased glutenin content. Further, the breeding process contributed to the drastic reduction of asignificant allergen in wheat-dependent exercise-induced anaphylaxis (WDEIA), while the old andmodern durum cultivars were not different in their α-type and γ-type gliadin content, the formerbeing considered a factor associated with celiac disease toxicity [57]. Despite the existence of allergensin wheat grain, there is genetic variability within wheat’s genetic resources, and further research isnecessary for the identification and the development of cultivars with lower reactivity and/or highersecondary health-promoting ingredients to meet the different needs of consumers [81,174].
5. Future Prospects
Modern genome-wide association studies (GWASs) offer the advantage of performing associationanalyses using the association of each marker and the phenotype of interest that has been scored acrossa large number of unrelated genetic materials. Furthermore, GWASs take advantage of the highernumber of gene recombinations used within the panel compared to linkage mapping where meioticrecombinations are limited. As a consequence, the aim of a GWAS is to locate important QTLs forcomplex characteristics by employing diverse germplasm collections and modern molecular markers.GWASs are complementary to QTL mapping [181]. GWAS studies have been conducted on breadwheat to analyze important characteristics. A genome-wide association study of a durum wheat coreset using 7,652 single nucleotide polymorphism (SNP) markers facilitated the identification of a majorQTL controlling adaptation to heat stress [145]. Additionally, 12 loci were found to control the mainheat tolerance traits; among them, three were activated only when heat stress occurred. Twenty-nineQTLs for three different yield components were identified by a GWAS in a panel of 233 tetraploid wheataccessions, including durum wheat accessions, using SNP markers [182]. GWAS is a valuable toolfor breeders since broad genetic resources can be screened for market-trait associations. Germplasmcollections that contain a wealth of useful genes for valuable traits such as disease resistance could beused to identify possible sources of resistance.
A GWAS that focuses on drought tolerance and 17 other agronomical traits was conducted for 493durum wheat accessions; this study identified a putative QTL that controls drought tolerance [183].Two QTL hotspots related to stress tolerance and yield were identified on chromosomes 2A and 2Busing 6211 diversity array technology (DArTseq) SNPs on a panel consisting of 208 durum wheatlines [184]. Other GWAS studies have focused on other traits, such as disease resistance [185–188]and important quality traits. Marcotuli et al. [189] identified 37 marker-trait associations and 19QTLs, possibly underlining arabinoxylan content in the grains of 104 tetraploid wheat genotypes.Arabinoxylans have been shown to have various health benefits. Furthermore, the co-migration of
14
Agronomy 2020, 10, 432
QTLs for grain protein content and the candidate genes related to nitrogen metabolism found in astudy of a durum wheat germplasm collection show that such approaches can be applied to MASbreeding schemes [190].
The rapid development of next-generation sequencing (NGS) technologies has facilitated thediscovery of vast numbers of SNPs across genomes. SNP markers are now popular molecular markersbecause they are ubiquitous in plant genomes and are very easy and cheap to score. The high-throughputgenotyping of wheat varieties is now applied routinely, especially after the construction of specificgenotyping arrays and the sequencing of wheat genomes. A recently-developed genotyping array forwheat that includes 90,000 gene-associated SNPs is aiding the fast identification of genetic variation thatunderlines trait variation in wheat genetic materials [191]. This genotyping array contains mostly breadwheat SNPs, but also includes a large number of durum wheat SNPs. A total of 90 k genotyping wheatarrays have also helped in the construction of a detailed SNP-based genetic map based on 140 RILsdeveloped from a cross between a wild emmer wheat population and a durum wheat cultivar [192].More genetic maps are available today for durum wheat [193]. The durum wheat genome was onlyrecently sequenced, revealing more valuable information about the crop’s genome evolution duringdomestication and selection [194]. It is expected that this genome will aid in clarifying marker–traitassociations and facilitate exploration of the genes underlying important characters. Durum wheattranscriptomes have also become increasingly available, thus aiding MAS breeding [195,196]. Genomesequencing is providing breeders with precise info about the nature of the genome changes in theirbreeding lines. Furthermore, genetic information obtained by DNA sequencing and extracted with theuse of advanced bioinformatics tools will help in the application of new DNA-marker platforms andis expected to help enormously in genomics-assisted breeding for yield and quality. NGS has madepossible the development of the first mutant library for wheat, which is now available publicly [197]while plenty of DNA information has been deposited in public databases accessible to scientistsworking on wheat all over the world.
Genotyping-by-sequencing (GBS) identifies genome polymorphism (SNP) NGS technologies,which facilitate the discovery of genetic variation in natural populations of many plants, includingwheat. GBS is a useful tool and has revealed that winter durum wheat lines have significant geneticdiversity, which is crucial for breeding [198]. DArTseq and SNP markers based on GBS technology wereused to survey the genetic variation and the genomic characterization of 91 durum wheat landraces fromTurkey and Syria, revealing extensive mixing of landraces between the two geographical regions [199].The use of GBS in a large wheat accession collection resulted in the discovery of thousands of new SNPvariations for drought and heat stress tolerance [104], which is useful for improving the elite wheatpool and enriching it with novel drought and heat tolerance genes. According to Sehgal et al. [104],this unexploited genetic variation can further improve the drought and heat stress tolerance of the elitewheat pool and enrich it with novel drought and heat tolerance genes. As the ultimate MAS tool, GBScan effectively facilitate breeding.
Furthermore, a very promising modern tool in plant breeding is genomic selection (GS). GS isa strategy used to predict the genetic value of selection candidates based on the estimated genomicbreeding value, which is predicted using high-density molecular markers that are dispersed acrossthe genome [200]. GS bases its success on the use of genome-wide markers to ensure that minor tomedium effect QTLs cannot be left uncaptured unlike MAS, which focuses on the few markers linkedto major genes [201]. GS models have shown high forward prediction accuracies and an enhancedgenetic gain for semolina, as well as grain quality characteristics revealing that a combination of MASand GS can be used effectively to select for quality traits [202].
The development of speed breeding is a very promising technique that could substantially help inthis area. Speed breeding entails the use of specifically controlled-environment plant growth conditionsand extended photoperiods of 22 h light/2 h dark that accelerates plant development. As a result,plant breeding speeds can reach up to 6–8 generations/year for wheat. Therefore, speed breedingaccelerates genetic gain and significantly reduces the length of breeding cycles [203]. Specifically,
15
Agronomy 2020, 10, 432
studies on durum wheat [204] have recently shown that the application of constant light and controlledtemperature greenhouse conditions allow the rapid growth of durum wheat seedlings and the quickphenotyping for five important traits. Early selection in the F2 generation of a bi-parental cross has ledto the significant improvement of traits like crown rot tolerance, root angle, and root number, therebyproving that a combination of speed breeding with early selection can facilitate the time and efficiencyof breeding programs, as recombinant inbred lines can be provided with the desirable alleles [204]. ForGWAS, using speed breeding, 393 durum Recombinant Inbred Lines (RILS) and DArT-seq markershave identified a major QTL for the seminal root angle on chromosome 6A [204]. Speed breedingcoupled with genomics-based technologies and other advances in phenomics could yield significantprogress in the rate of genetic gain in breeding schemes.
Genetically modified wheat has been developed previously [205,206], but today no GMO wheatis cultivated officially in any part of the world. However, new technologies like genome editingand its relevant protocols provide promising tools for the future. Transcription activator-like effectornucleases (TALENs) and clustered regularly interspaced short palindromic repeat (CRISPR)–associatedprotein 9 (Cas9) systems have been used on bread wheat to modify three homoalleles that codefor mildew-resistance locus (MLO) proteins and a TaMLO-A1 allele, respectively, to make thewheat resistant to powdery mildew [207]. Detailed improved protocols for the application ofCRISPR/Cas9-mediated mutagenesis are emerging; these protocols would help achieve fast andefficient gene targeting in wheat [208–210]. Furthermore, gene editing could be used in studying genefunction. Resequencing of 1526 tetraploid and 1200 hexaploid wheat mutants created a database of 10million sequenced mutations which, by more than 90%, result in truncations or deleterious amino acidchanges [211]. More precise mutations can be introduced in wheat by gene editing and this, coupledwith improved transformation technologies now evolving in wheat, would mean that researchers couldbe further helped in their efforts to introduce novel allelic diversity for breeding durum wheat andbetter understand basic gene function. However, since genetic modification in Europe is legally tightlyregulated and gene editing has recently been ruled out as a form of genetic modification, the productionof wheat cultivars based on these techniques has to be carefully considered in the future. Nevertheless,all modern biotechnological approaches (high throughput genome analysis, gene editing, geneticengineering, and proteomics and transcriptomics) are powerful tools to complement the classicalmethods of breeding. It is now proposed that genome assembly, germplasm characterization, genefunction identification, genomic breeding, and gene editing constitute a comprehensive 5G approachin modern breeding that could help develop new varieties with a high yield, good quality, and strongresilience to changing climate conditions [212].
6. Conclusions
Classical breeding approaches will continue to play an important role in durum wheatimprovement for the release of cultivars. Advances in DNA sequencing and other technologies,such as bioinformatics, statistics, and other scientific areas, could help breeders increase the efficiencyand speed of a breeding program to meet humankind’s growing demands for more food that isnutritious and sustainably produced. Ultimately, the use of new molecular biology technologies isessential, but also inexorably coupled with reliable and extensive testing under real field conditions.
Author Contributions: All authors have contributed in writing this review paper. All authors have read andagreed to the published version of the manuscript
Funding: There was no specific funding for this research.
Conflicts of Interest: The authors declare that they have no conflicts of interest.
16
Agronomy 2020, 10, 432
References
1. Agriculture and Agri-Food Canada. Canada: Outlook for Principal Field Crops. 19 July 2019. Availableonline: http://www.agr.gc.ca/eng/industry-markets-and-trade/canadian-agri-food-sector-intelligence/crops/reports-and-statistics-data-for-canadian-principal-field-crops/?id=1378743094676 (accessed on 26September 2019).
2. EUROSTAT. Available online: https://ec.europa.eu/eurostat/data/database (accessed on 27 September 2019).3. Agriculture and Agri-Food Canada. Area, Yield, and Production of Canadian Principal Field Crops Report.
Available online: https://aimis-simia.agr.gc.ca/rp/index-eng.cfm?action=pR&r=243&lang=EN (accessed on26 September 2019).
4. United States Department of Agriculture. Wheat Data. Available online: http://www.ers.usda.gov/data-products/wheat-data.aspx (accessed on 26 September 2019).
5. Tidiane Sall, A.; Chiari, T.; Legesse, W.; Seid-Ahmed, K.; Ortiz, R.; van Ginkel, M.; Bassi, F.M. Durum wheat(Triticum durum Desf.): Origin, cultivation and potential expansion in Sub-Saharan Africa. Agronomy 2019, 9,263. [CrossRef]
6. Tedone, L.; Alhajj Ali, S.; De Mastro, G. Optimization of nitrogen in durum wheat in the Mediterraneanclimate: The agronomical aspect and greenhouse gas (GHG) emissions. In Nitrogen in Agriculture—Updates;Amanullah, K., Fahad, S., Eds.; InTech: London, UK, 2018; Volume 8, pp. 131–162.
7. Shewry, P.R. Wheat. J. Exp. Bot. 2009, 60, 1537–1553. [CrossRef]8. Peng, J.H.; Sun, D.; Nevo, E. Domestication evolution, genetics and genomics in wheat. Mol. Breed. 2011, 28,
281–301. [CrossRef]9. Ozkan, H.; Brandolini, A.; Schafer-Pregl, R.; Salamini, F. AFLP analysis of a collection of tetraploid wheats
indicates the origin of emmer and hard wheat domestication in Southeast Turkey. Mol. Biol. Evol. 2002, 19,1797–1801. [CrossRef] [PubMed]
10. Martínez-Moreno, F.; Solís, I.; Noguero, D.; Blanco, A.; Özberk, I.; Nsarellah, N.; Elias, E.; Mylonas, I.;Soriano, J.M. Durum wheat in the Mediterranean Rim: Historical evolution and genetic resources. Genet.Resour. Crop. Evol. 2020. [CrossRef]
11. Nalam, V.J.; Vales, M.I.; Watson, C.J.W.; Kianian, S.F.; Riera-Lizarazu, O. Map-Based analysis of genesaffecting the brittle rachis character in tetraploid wheat (Triticum turgidum L.). Theor. Appl. Genet. 2006, 112,373–381. [CrossRef]
12. Ben-Abu, Y.; Tzfadia, O.; Maoz, Y.; Kachanovski, D.E.; Melamed-Bessudo, C.; Feldman, M.; Levy, A.A. Durumwheat evolution: A genomic analysis. In Série A Mediterranean Seminars, No 110, Options Méditerranéennes,Proceedings of the International Symposium on Genetics and Breeding of Durum Wheat, Rome, Italy, 27–30 May2013; Porceddu, E., Damania, A.B., Qualset, C.O., Eds.; CIHEAM: Bari, Italy, 2014; pp. 31–45.
13. Christidis, B. Winter Cereals, 2nd ed.; Thessaloniki, Greece, 1963; pp. 43–70. (In Greek)14. Bell, G.D.H. The history of wheat cultivation. In Wheat Breeding: Its Scientific Basis; Lupton, F.G.H., Ed.;
Springer: Dordrecht, The Netherlands, 1987; pp. 31–49.15. Valamoti, S.M.; Gkatzogia, E.; Hristova, I.; Marinova, E. Iron age cultural interactions, plant subsistence
and land use in Southeastern Europe inferred from archaeobotanical evidence of Greece and Bulgaria. InArchaeology Across Frontiers and Borderlands: Fragmentation and Connectivity in the North Aegean and the CentralBalkans from the Bronze Age to the Iron Age; Gimatzidis, S., Pieniazek, M., Mangaloglu-Votruba, S., Eds.;Austrian Academy of Sciences: Vienna, Austria, 2018; pp. 269–290.
16. Scarascia Mugnozza, G.T. The contribution of Italian wheat geneticists: From Nazareno Strampelli toFrancesco D’Amato. In The Wake of the Double Helix: From the Green Revolution to the Gene Revolution,Proceedings of the International Congress, Bologna, Italy, 27–31 May 2003; Tuberosa, R., Phillips, R.L., Gale, M.,Eds.; Avenue Media: Bologna, Italy, 2005; pp. 53–75.
17. Sciacca, F.; Cambrea, M.; Licciardello, S.; Pesce, A.; Sciacca, F.; Cambrea, M.; Licciardello, S.; Pesce, A.;Romano, R.; Spina, A.; et al. Evolution of durum wheat from Sicilian landraces to improved varieties. InSérie A Mediterranean Seminars, No 110, Options Méditerranéennes, Proceedings of the International Symposium onGenetics and Breeding of Durum Wheat, Rome, Italy, 27–30 May 2013; Porceddu, E., Damania, A.B., Qualset, C.O.,Eds.; CIHEAM: Bari, Italy, 2014; pp. 139–145.
17
Agronomy 2020, 10, 432
18. Papadakis, I. Greek types of wheat. In Scientific Bulletin of the “Special Station of Plant Breeding in Thessaloniki”;General Directorate for Settlements of Makedonia: Thessaloniki, Greece, 1929; pp. 6–29. (In Greek andIn French)
19. Melas, T.B. The Finest Varieties of Greek Wheat; Papaspyrou Printing House: Athens, Greece, 1922; pp. 33–46.(In Greek)
20. Ozberk, I.; Ozberk, F.; Atli, A.; Cetin, L.; Aydemir, T.; Keklikci, Z.; Onal, M.A.; Braun, H.J. Durum wheat inTurkey: Yesterday, today and tomorrow. In Durum Wheat Breeding: Current Approaches and Future Strategies;Royo, C., Nachit, M.M., Di Fonzo, N., Araus, J.L., Pfeiffer, W.H., Slafer, G.A., Eds.; The Haworth Press Inc.:Philadelphia, PA, USA, 2005; pp. 981–1010.
21. Palamarchuk, A. Selection strategies for traits relevant for winter and facultative durum wheat. In DurumWheat Breeding: Current Approaches and Future Strategies; Royo, C., Nachit, M.M., Di Fonzo, N., Araus, J.L.,Pfeiffer, W.H., Slafer, G.A., Eds.; The Haworth Press Inc.: Philadelphia, PA, USA, 2005; pp. 599–644.
22. Abdelkader, B. The history of wheat breeding in Algeria. In Série A Mediterranean Seminars, No 110, OptionsMéditerranéennes, Proceedings of the International Symposium on Genetics and Breeding of Durum Wheat, Rome, Italy,27–30 May 2013; Porceddu, E., Damania, A.B., Qualset, C.O., Eds.; CIHEAM: Bari, Italy, 2014; pp. 363–370.
23. Taghouti, M.; Nsarellah, N.; Rhrib, K.; Benbrahim, N.; Amallah, L.; Rochdi, A. Evolution from durum wheatlandraces to recent improved varieties in Morocco in terms of productivity increase to the detriment of grainquality. Rev. Mar. Sci. Agron. Vét. 2017, 5, 351–358.
24. Boukida, F.; Vittadinib, E.; Prandib, B.; Mattarozzid, M.; Marchinib, M.; Sforzab, S.; Sayare, R.; WeonSeof, Y.;Yacoubia, I.; Mejri, M. Insights into a century of breeding of durum wheat in Tunisia: The properties offlours and starches isolated from landraces, old and modern genotypes. Food Sci. Technol. 2018, 97, 743–751.[CrossRef]
25. Kadkol, G.P.; Sissons, M. Durum wheat: Overview. In Encyclopedia of Food Grains, 2nd ed.; Wrigley, C.,Corke, H., Seetharaman, K., Faubion, J., Eds.; Academic Press: Oxford, UK, 2016; pp. 117–124.
26. Clarke, J.M.; De Ambrogio, E.; Hare, R.A.; Roumet, P. Genetics and breeding of durum wheat. In DurumWheat Chemistry and Technology, 2nd ed.; Sissons, M., Abecassis, J., Marchylo, B., Carcea, M., Eds.; AACCInternational: St. Paul, MN, USA, 2012; pp. 15–36.
27. Porceddu, E.; Blanco, A. Evolution of durum wheat breeding in Italy. In Série A Mediterranean Seminars, No110, Options Méditerranéennes, Proceedings of the International Symposium on Genetics and Breeding of DurumWheat, Rome, Italy, 27–30May 2013; Porceddu, E., Damania, A.B., Qualset, C.O., Eds.; CIHEAM: Bari, Italy,2014; pp. 157–173.
28. Bagnara, D.; Scarascia Mugnozza, G.T. Outlook in breeding for yield in durum wheat. In Genetics and Breedingof Durum Wheat, Proceedings of a Symposium on Genetics and Breeding of Durum Wheat, Bari, Italy, 14–18 May1973; Scarascia Mugnozza, G.T., Ed.; Eucarpia: Wageningen, The Netherlands, 1975; pp. 249–273.
29. Papadakis, I. The Plant: Breeding Institute 1923–1933; Bulletin No. 15; Kastrinaki & Georganta: Thessaloniki,Greece, 1933; pp. 1–36. (In Greek)
30. Percival, J. The Wheat Plant; A Monograph; Duckworth: London, UK, 1921; pp. 1–628, A Monograph.31. Papadakis, I. List of Seeds: What Seeds Should We Plant; Central Committee for the Protection of Domestic
Seed Production, Plant Breeding Institute: Thessaloniki, Greece, 1934; pp. 1–10. (In Greek)32. Kokolios, B. Durum wheat in Greece. In Proceedings of Convegno Internationale del Grano Duro; Camera di
Commercio Industria de Agricoltura: Foggia, Italy, 1962.33. Di Fonzo, N.; Blanco, A.; Ravaglia, S.; Troccoli, A.; DeAmbrogio, E. Durum wheat improvement in Italy.
In Durum Wheat Breeding: Current Approaches and Future Strategies; Royo, C., Nachit, M.N., Di Fonzo, N.,Araus, J.L., Pfeiffer, W.H., Slafer, G.A., Eds.; The Haworth Press Inc.: Philadelphia, PA, USA, 2005; pp. 825–881.
34. Royo, C.; Briceño-Félix, G.A. Wheat breeding in Spain. In The World Wheat Book: A History of Wheat Breeding;Angus, W., Bonjean, A., Van Ginkel, M., Eds.; Lavoisier Publishing Inc.: Paris, France, 2011; Volume 2,pp. 121–154.
35. Royo, C. Durum wheat improvement in Spain. In Durum Wheat Breeding: Current Approaches and FutureStrategies; Royo, C., Nachit, M.N., Di Fonzo, N., Araus, J.L., Pfeiffer, W.H., Slafer, G.A., Eds.; The HaworthPress Inc.: Philadelphia, PA, USA, 2005; pp. 883–906.
18
Agronomy 2020, 10, 432
36. Grignac, P. Action of leaf rust (Puccinia recondita f. sp. Tritici) on durum wheat yield and breedingfor rust resistance. In Genetics and Breeding of Durum Wheat, Proceedings of a Symposium on Genetics andBreeding of Durum Wheat, Bari, Italy, 14–18 May 1973; Scarascia Mugnozza, G.T., Ed.; Eucarpia: Wageningen,The Netherlands, 1975; pp. 489–496.
37. Braun, H.J.; Zencirci, N.; Altay, F.; Atli, A.; Avci, M.; Eser, V.; Kambertay, M.; Payne, T.S. Turkish wheatpool. In The World Wheat Book: A History of Wheat Breeding; Bonjean, A.P., Angus, W.J., Eds.; Lavoisier: Paris,France, 2001; pp. 851–879.
38. Taghouti, M.; Nsarellah, N.; Gaboun, F.; Rochdi, A. Multi-Environment assessment of the impact of geneticimprovement on agronomic performance and on grain quality traits in Moroccan durum wheat varieties of1949 to 2017. Glob. J. Plant Breed. Genet. 2017, 4, 394–404.
39. Byerlee, D.; Moya, P. Impacts of International Wheat Breeding Research in the Developing World, 1966–1990; TheInternational Maize and Wheat Improvement Center (CIMMYT): Mexico City, Mexico, 1993; pp. 69–70.
40. Salazar, J.; Branas, M.; Ziteli, G.; Vallega, J. Old Iberian durum wheats as an important source of resistanceto stem and leaf rusts. In Genetics and Breeding of Durum Wheat, Proceedings of a Symposium on Genetics andBreeding of Durum Wheat, Bari, Italy, 14–18May 1973; Scarascia Mugnozza, G.T., Ed.; Eucarpia: Wageningen,The Netherlands, 1975; pp. 497–508.
41. Al-Idrissi, M.; Sbeita, A.; Jebriel, S.; Zintani, A.; Shreidi, A.; Ghawawi, H.; Tazi, M. Libya: Country Report to theFAO International Technical Conference on Plant Genetic Resources; The Food and Agriculture Organization ofthe United Nations(FAO): Leipzig, Germany, 1996.
42. Ghanem, E.H. Wheat improvement in Egypt with emphasis on heat tolerance. In Wheat in Heat-StressedEnvironments: Irrigated, Dry Areas and Rice-Wheat Farming Systems; Saunders, D.A., Hettel, G.P., Eds.; TheInternational Maize and Wheat Improvement Center(CIMMYT): Mexico City, Mexico, 1994.
43. Zencirci, N.; Kinaci, E.; Atli, A.; Kalayci, M.; Avci, M. Wheat research in Turkey. In Wheat: Prospects for GlobalImprovement. Developments in Plant Breeding; Braun, H.J., Altay, F., Kronstad, W.E., Beniwal, S.P.S., McNab, A.,Eds.; Springer: Dordrech, The Netherlands, 1997; Volume 6, pp. 11–16.
44. Poiarkova, H.; Blum, A. Land-Races of wheat from the northern Negev in Israel. Euphytica 1983, 32, 257–271.[CrossRef]
45. Isidro, J.; Álvaro, F.; Royo, C.; Villegas, D.; Miralles, D.J.; García del Moral, L.F. Changes in Duration ofDevelopmental Phases of Durum Wheat Caused by Breeding in Spain and Italy during the 20th Century andIts Impact on Yield. Ann. Bot. 2011, 107, 1355–1366. [CrossRef] [PubMed]
46. Hedden, P. The genes of the Green Revolution. Trends Genet. 2003, 19, 5–9. [CrossRef]47. Lebsock, K.L. Transfer of Norin 10 genes for dwarfness to durum wheat. Crop Sci. 1963, 3, 450–451. [CrossRef]48. Pfeiffer, W.H.; Sayre, K.D.; Reynolds, M.P. Enhancing genetic grain yield potential and yield stability in durum
wheat. In Durum Wheat Improvement in the Mediterranean Region: New Challenges; Royo, C., Nachit, M., DiFonzo, N., Araus, J.L., Eds.; International Centre for Advanced Mediterranean Agronomic Studies(CIHEAM):Zaragoza, Spain, 2000; pp. 83–93.
49. The International Center for Agriculture Research in the Dry Areas(ICARDA). Available online: https://www.icarda.org/ (accessed on 30 August 2019).
50. Bassi, F.M.; Nachit, M.M. Genetic gain for yield and allelic diversity over 35 years of durum wheat breedingat ICARDA. Crop Breed. Genet. Genom. 2019, 1, 1–19.
51. McCaig, T.N.; Clarke, J.M. Breeding durum wheat in western Canada: Historical trends in yield and relatedvariables. Can. J. Plant Sci. 1995, 75, 55–60. [CrossRef]
52. De Vita, P.; Matteu, L.; Mastrangelo, A.M.; Di Fonzo, N.; Cattivelli, L. Effects of breeding activity on durumwheat traits breed in Italy during the 20th century. Ital. J. Agron. 2007, 451–462. [CrossRef]
53. Waddington, S.R.; Osmanzai, M.; Yoshida, M.; Ransom, J.K. The Yield of durum wheats released in Mexicobetween 1960 and 1984. J. Agric. Sci. 1987, 108, 469–477. [CrossRef]
54. Royo, C.; Álvaro, F.; Martos, V.; Ramdani, A.; Isidro, J.; Villegas, D.; García del Moral, L.F. Genetic changes indurum wheat yield components and associated traits in Italian and Spanish varieties during the 20th century.Euphytica 2007, 155, 259–270. [CrossRef]
55. Motzo, R.; Fois, S.; Giunta, F. Relationship between grain yield and quality of durum wheats from differenteras of breeding. Euphytica 2004, 140, 147–154. [CrossRef]
19
Agronomy 2020, 10, 432
56. Guarda, G.; Padovan, S.; Delogu, G. Grain yield, nitrogen-use efficiency and baking quality of old andmodern Italian bread-wheat cultivars grown at different nitrogen levels. Eur. J. Agron. 2004, 21, 181–192.[CrossRef]
57. De Santis, M.A.; Giuliani, M.M.; Giuzio, L.; De Vita, P.; Lovegrove, A.; Shewry, P.R.; Flagella, Z. Differencesin gluten protein composition between old and modern durum wheat genotypes in relation to 20th centurybreeding in Italy. Eur. J. Agron. 2017, 87, 19–29. [CrossRef] [PubMed]
58. Institute of Plant Breeding and Genetic Resources. Available online: http://http://www.ipgrb.gr/index.php/antikeimena/sitiron (accessed on 27 October 2019).
59. Kotzamanidis, S. Three new cultivars of durum wheat with very high yield potential, quality and excellentadaptation to Greek conditions. ETHIAGE 2011, 43, 14–15. (In Greek)
60. Korpetis, E.; Bladenopoulos, K.; Kotzamanidis, S. Two new Greek cultivars of Cereal Institute: THRAKI(durum wheat) and ALKMINI (triticale). In Proceedings of the 15th National Conference of Hellenic ScientificSociety for Genetics and Plant Breeding, Larisa, Greece, 15–17 October 2014; p. 157. (In Greek)
61. Chairi, F.; Vergara-Diaz, O.; Vatter, T.; Aparicio, N.; Nieto-Taladriz, M.T.; Kefauver, S.C.; Bort, J.; Serret, M.D.;Araus, J.L. Post-Green revolution genetic advance in durum wheat: The case of Spain. Field Crop. Res. 2018,228, 158–169. [CrossRef]
62. Nsarellah, N.; Amri, A. Durum wheat genetic improvement in Morocco. In Durum Wheat Breeding: CurrentApproaches and Future Strategies; Royo, C., Nachit, M.N., Di Fonzo, N., Araus, J.L., Pfeiffer, W.H., Slafer, G.A.,Eds.; The Haworth Press Inc.: Philadelphia, PA, USA, 2005; pp. 963–980.
63. Scarascia-Mugnozza, G.T.; D’Amato, F.; Avanzi, S.; Bagnara, D.; Belli, M.L.; Bozzini, A.; Brunori, A.;Cervigni, T.; Devreux, M.; Donini, B.; et al. Mutation breeding for durum wheat (Triticum turgidum ssp.durum Desf.) improvement in Italy. Mut. Breed. Rev. 1993, 10, 1–28.
64. Skorda, E. The Mutability of Some Greek Varieties of the Genus Triticum. Ph.D. Thesis, AgriculturalUniversity of Athens, Athens, Greece, 1971.
65. Klatt, A.R.; Dincer, N.; Yakar, K. Problems associated with breeding spring and winter durums in Turkey. InGenetics and Breeding of Durum Wheat, Proceedings of a Symposium on Genetics and Breeding of Durum Wheat,Bari, Italy, 14–18May 1973; Scarascia Mugnozza, G.T., Ed.; Eucarpia: Wageningen, The Netherlands, 1975;pp. 327–337.
66. Yaniv, E.; Raats, D.; Ronin, Y.; Korol, A.B.; Grama, A.; Bariana, H.; Dubcovsky, J.; Schulman, A.H. Evaluationof marker-assisted selection for the stripe rust resistance gene Yr15, introgressed from wild emmer wheat.Mol. Breed. 2015, 35. [CrossRef]
67. Phan, H.T.T.; Rybak, K.; Bertazzoni, S.; Furuki, E.; Dinglasan, E.; Hickey, L.T.; Oliver, R.P.; Tan, K.C. Novelsources of resistance to septoria nodorum blotch in the vavilov wheat collection identified by genome-wideassociation studies. Theor. Appl. Genet. 2018, 131, 1223–1238. [CrossRef]
68. Vishwakarma, M.K.; Mishra, V.K.; Gupta, P.K.; Yadav, P.S.; Kumar, H.; Joshi, A.K. Introgression of the highgrain protein gene Gpc-B1 in an elite wheat variety of indo-gangetic plains through marker assisted backcrossbreeding. Curr. Plant Biol. 2014, 1, 60–67. [CrossRef]
69. Yildirim, A.; Sonmezoglu, O.A.; Sayaslan, A.; Koyuncu, M.; Gulec, T.E.; Kanderim, N. Marker-Assistedbreeding of a durum wheat cultivar for γ-gliadin and LMW-glutenin proteins affecting pasta quality. Turk. J.Agric. For. 2013, 37, 527–533. [CrossRef]
70. Pignone, D.; De Paola, D.; Rapanà, N.; Janni, M. Single seed descent: A tool to exploit durum wheat (Triticumdurum Desf.) genetic resources. Genet. Resour. Crop Evol. 2015, 62, 1029–1035. [CrossRef]
71. Farag, H.I.A. Efficiency of three methods of selection in wheat breeding under saline stress conditions. Egypt.J. Plant Breed. 2013, 17, 85–95. [CrossRef]
72. Aoun, M.; Kolmer, J.A.; Rouse, M.N.; Elias, E.M.; Breiland, M.; Bulbula, W.D.; Chao, S.; Acevedo, M. Mappingof novel leaf rust and stem rust resistance genes in the Portuguese durum wheat landrace. G3 Genes GenomesGenet. 2019, 9, 2535–2547. [CrossRef] [PubMed]
73. Atkins, R.E.; Murphy, H.C. Evaluation of yield potentialities of oat crosses from bulk hybrid tests. Agron. J.1949, 41. [CrossRef]
74. Fowler, W.L.; Heyne, E.G. Evaluation of bulk hybrid tests for predicting performance of pure line selectionsin hard red winter wheat. Agron. J. 1955, 47, 430–434. [CrossRef]
75. Lupton, F.G.H. Studies in the breeding of self-pollinating cereals. Euphytica 1961, 10, 209–224.
20
Agronomy 2020, 10, 432
76. Schut, J.W.; Dourleijn, C.J.; Bos, I. Cross and Line Prediction in Barley Using F4Small-Plot Yield Trials. Ph.D.Thesis, Wageningen Agricultural University (WAU), Wageningen, The Netherlands, 1998; pp. 21–43.
77. Mitchell, J.W.; Baker, R.J.; Knott, D.R. Evaluation of honeycomb selection for single plant yield in durumwheat. Crop Sci. 1982, 22, 840–843. [CrossRef]
78. Kotzamanidis, S.T.; Lithourgidis, A.S.; Mavromatis, A.G.; Chasioti, D.I.; Roupakias, D.G. Prediction criteriaof promising F3 populations in durum wheat: A comparative study. Field Crop. Res. 2008, 107, 257–264.[CrossRef]
79. Lungu, D.M.; Kaltsikes, P.J.; Larter, E.N. Honeycomb selection for yield in early generations of spring wheat.Euphytica 1987, 36, 831–839. [CrossRef]
80. Mylonas, I. Experimentation of the Maximization of Yield Potential in Barley (Hordeum vulgare L.) Cultivars.Ph.D. Thesis, School of Agriculture, Aristotle University of Thessaloniki, Thessaloniki, Greece, 2012.
81. Kissing Kucek, L.; Veenstra, L.D.; Amnuaycheewa, P.; Sorrells, M.E. A Grounded Guide to Gluten: HowModern Genotypes and Processing Impact Wheat Sensitivity. Compr. Rev. Food Sci. Food Saf. 2015, 14,285–302. [CrossRef]
82. Maccaferri, M.; Sanguineti, M.C.; Corneti, S. Quantitative trait loci for grain yield and adaptation of durumwheat (Triticum durum Desf.) across a wide range of water availability. Genetics 2008, 178, 489–511. [CrossRef]
83. De Vita, P.; Nicosia, O.L.D.; Nigro, F.; Platani, C.; Riefolo, C.; Di Fonzo, N.; Cattivelli, L. Breeding progress inmorpho-physiological, agronomical and qualitative traits of durum wheat cultivars released in Italy duringthe 20th century. Eur. J. Agron. 2007, 26, 39–53. [CrossRef]
84. Garcia del Moral, L.F.; Royo, C.; Slafer, G.A. Genetic improvement effects on durum wheat yield physiology.In Durum Wheat Breeding: Current Approaches and Future Strategies; Royo, C., Nachit, M.N., Di Fonzo, N.,Araus, J.L., Pfeiffer, W.H., Slafer, G.A., Eds.; The Haworth Press Inc.: Philadelphia, PA, USA, 2005; pp. 379–396.
85. Araus, J.L.; Slafer, G.A.; Reynolds, M.P.; Royo, C. Plant breeding and drought in C3 cereals: What to breedfor? Ann. Bot. 2002, 89, 925–940. [CrossRef] [PubMed]
86. Richards, R.A. Selectable traits to increase crop photosynthesis and yield of grain crops. J. Exp. Bot. 2000, 51,447–458. [CrossRef] [PubMed]
87. Spielmeyer, W.; Hyles, J.; Joaquim, P.; Azanza, F.; Bonnett, D.; Ellis, M.E.; Moore, C.; Richards, R.A. A QTL onchromosome 6A in bread wheat (Triticum aestivum) is associated with longer coleoptiles, greater seedlingvigour and final plant height. Theor. Appl. Genet. 2007, 115, 59–66. [CrossRef] [PubMed]
88. De Santis, M.A.; Kozik, O.; Passmore, D.; Flagella, Z.; Shwewry, P.R. Comparison of the dietary fibrecomposition of old and modern durum wheat (Triticum turgidum spp. durum) genotypes. Food Chem. 2018,244, 304–310. [CrossRef]
89. Achtar, S.; Moualla, M.Y.; Kalhout, A.; Röder, M.S.; MirAli, N. Assessment of genetic diversity among syriandurum (Triticum ssp. durum) and bread wheat (Triticum aestivum L.) using SSR markers. Russ. J. Genet. 2010,46, 1320–1326. [CrossRef]
90. Casassola, A.; Brammer, S.P.; Chaves, M.S.; Wiethölter, P.; Caierão, E. Parental selection of wheat lines basedon phenotypic characterization and genetic diversity. Crop Breed. Appl. Biotechnol. 2013, 13, 49–58. [CrossRef]
91. Marzario, S.; Logozzo, G.; David, J.L.; Zeuli, P.S.; Gioia, T. Molecular genotyping (SSR) and agronomicphenotyping for utilization of durum wheat (Triticum Durum Desf.) ex situ collection from Southern Italy: Acombined approach including pedigreed varieties. Genes 2018, 9, 465. [CrossRef]
92. Soriano, J.M.; Villegas, D.; Sorrells, M.E.; Royo, C. Durum wheat landraces from east and west regions of themediterranean basin are genetically distinct for yield components and phenology. Front. Plant Sci. 2018, 9,80. [CrossRef]
93. Abu-Zaitoun, S.Y.; Chandrasekhar, K.; Assili, S.; Shtaya, M.J.; Jamous, R.M.; Mallah, O.B.; Nashef, K.; Sela, H.;Distelfeld, A.; Alhajaj, N.; et al. Unlocking the genetic diversity within a Middle-East panel of durum wheatlandraces for adaptation to semi-arid climate. Agronomy 2018, 8, 233. [CrossRef]
94. Dograr, N.; Akin-Yalin, S.; Akkaya, M. Discriminating durum wheat cultivars using highly polymorphicsimple sequence repeat DNA markers. Plant Breed. 2000, 119, 360–362. [CrossRef]
95. Eujayl, I.; Sorrells, M.; Baum, M.; Wolters, P.; Powell, W. Isolation of EST-derived microsatellite markers forgenotyping the A and B genomes of wheat. Theor. Appl. Genet. 2002, 104, 399–407. [CrossRef] [PubMed]
96. Incirli, A.; Akkaya, M.S. Assessment of genetic relationships in durum wheat cultivars using AFLP markers.Genet. Resour. Crop Evol. 2001, 48, 233–238. [CrossRef]
21
Agronomy 2020, 10, 432
97. Pujar, S.; Tamhankar, S.; Rao, V.; Gupta, V.; Naik, S.; Ranjekar, P. Arbitrarily primed-PCR based diversityassessment reflects hierarchical groupings of Indian tetraploid wheat genotypes. Theor. Appl. Genet. 1999, 99,868–876. [CrossRef]
98. Soleimani, V.; Baum, B.; Johnson, D. AFLP and pedigree-based genetic diversity estimates in modern cultivarsof durum wheat (Triticum turgidum L. subsp. durum (Desf.) Husn.). Theor. Appl. Genet. 2002, 104, 350–357.[CrossRef] [PubMed]
99. Babay, E.; Mnasri, S.R.; Mzid, R.; Naceur, M.B.; Hanana, M. Quality selection and genetic diversity of tunisiandurum wheat varieties using SSR markers. Biosci. J. 2019, 35. [CrossRef]
100. Bonnett, D.G.; Rebetzke, G.J.; Spielmeyer, W. Strategies for efficient implementation of molecular markers inwheat breeding. Mol. Breed. 2005, 15, 75–85. [CrossRef]
101. Kuchel, H.; Fox, R.; Hollamby, G.; Reinheimer, J.L.; Jefferies, S.P. The challenges of integrating newtechnologies into a wheat breeding programme. In Proceedings of the 11th International Wheat GenetSymposium, Brisbane, Australia, 24–29 August 2008; Appels, R., Eastwood, R., Lagudah, E., Langridge, P.,Mackay, M., McIntyre, L., Sharp, P., Eds.; Sydney University Press: Sydney, Australia, 2008; pp. 1–5.
102. Jia, Z.; Liu, Y.; Gruber, B.D.; Neumann, K.; Kilian, B.; Graner, A.; von Wirén, N. Genetic dissection of rootsystem architectural traits in spring barley. Front. Plant Sci. 2019, 10, 400. [CrossRef]
103. Bhullar, N.K.; Zhang, Z.; Wicker, T.; Keller, B. Wheat gene bank accessions as a source of new alleles of thepowdery mildew resistance gene Pm3: A large scale allele mining project. BMC Plant Biol. 2010, 10, 88.[CrossRef]
104. Sehgal, D.; Vikram, P.; Sansaloni, C.P.; Ortiz, C.; Pierre, C.S.; Payne, T.; Ellis, M.; Amri, A.; Petroli, C.D.;Wenzl, P.; et al. Exploring and mobilizing the gene bank biodiversity for wheat improvement. PLoS ONE2015, 10, e0132112. [CrossRef]
105. Cleveland, D.A.; Soleri, D.; Smith, S.E. Do folk crop varieties have a role in sustainable agriculture?Incorporating folk varieties into the development of locally based agriculture may be the best approach.Bioscience 1994, 44, 740–751. [CrossRef]
106. Love, B.; Spaner, D. Agrobiodiversity: Its value, measurement, and conservation in the context of sustainableagriculture. J. Sustain. Agric. 2007, 31, 53–82. [CrossRef]
107. Sperling, L.; Ashby, J.A.; Smith, M.E.; Weltzien, E.R.; McGuire, S. A framework for analyzing participatoryplant breeding approaches and results. Euphytica 2001, 136, 21–35.
108. Witcombe, J.R.; Joshi, K.D.; Gyawali, S.; Musa, A.M.; Johansen, C.; Virk, D.S.; Sthapit, B.R. Participatory plantbreeding is better described as highly client-oriented plant breeding. I. Four indicators of client-orientationin plant breeding. Exp. Agric. 2005, 41, 299–319. [CrossRef]
109. Ceccarelli, S. Efficiency of plant breeding. Crop Sci. 2015, 55, 87–97. [CrossRef]110. Atlin, G.N.; Cooper, M.; Bjornstad, A. A comparison of formal and participatory breeding approaches using
selection theory. Euphytica 2001, 122, 463–475. [CrossRef]111. Pretty, J.; Vodouhê, S.D. Using rapid or participatory rural appraisal. In Improving Agricultural Extension; A
Reference Manual; The Food and Agriculture Organization of the United Nations (FAO): Rome, Italy, 1997.112. Soleri, D.; Cleveland, D. Breeding for quantitative variables, Part 1: Farmers’ and scientists’ knowledge
and practice in variety choice and plant selection. In Plant Breeding and Farmer Participation; Ceccarelli, S.,Guimarães, E.P., Weltzien, E., Eds.; The Food and Agriculture Organization of the United Nations (FAO):Rome, Italy, 2009; pp. 324–366.
113. Organic Seed Alliance (OSA). Participatory Plant Breeding Toolkit; Organic Seed Alliance (OSA): Port Townsend,WA, USA, 2012.
114. Ashby, J.A. The impact of participatory plant breeding. In Plant Breeding and Farmer Participation; Ceccarelli, S.,Guimarães, E.P., Weltzien, E., Eds.; The Food and Agriculture Organization of the United Nations (FAO):Rome, Italy, 2009; pp. 649–671.
115. Davis, W. Wheat Belly: Lose the Wheat, Lose the Weight, and Find: Your Path Back to Health; Emmaus, P.A., Ed.;Rodale Press: Emmaus, PA, USA, 2011.
116. Kissing Kucek, L.; Darby, H.; Mallory, E.; Dawson, J.; Davis, M.; Dyck, E.; Lazor, J.; O’Donnell, S.; Mudge, S.;Kimball, M.; et al. Participatory breeding of wheat for organic production. In Proceedings of the OrganicAgriculture Research Symposium, LaCrosse, WI, USA, 25–26 February 2015; pp. 25–26.
22
Agronomy 2020, 10, 432
117. Goldringer, I. Co-Constructiuon of a French program for participatory breeding of wheat cultivars adapted toorganic cultivation and transformation. In Proceedings of the EGOSGN Conference, Montreal, QC, Canada,4–6 July 2014.
118. Kirk, A.P.; Fox, S.L.; Entz, M.H. Comparison of organic and conventional selection environments for springwheat. Plant Breed. 2012, 131, 687–694. [CrossRef]
119. Mangione, D.; Senni, S.; Puccioni, M.; Grando, S.; Ceccarelli, S. The cost of participatory barley breeding.Euphytica 2006, 150, 289–306. [CrossRef]
120. Ceccarelli, S. Specific adaptation and breeding for marginal conditions. Euphytica 1994, 77, 205–219. [CrossRef]121. Ceccarelli, S. Adaptation to low/high input cultivation. Euphytica 1996, 92, 203–214. [CrossRef]122. Ceccarelli, S.; Erskine, W.; Hamblin, J.; Grando, S. Genotype by environment interaction and international
breeding programmes. Exp. Agric. 1994, 30, 177–187. [CrossRef]123. Ceccarelli, S.; Grando, S.; Baum, M. Participatory plant breeding in water-limited environments. Exp. Agric.
2007, 43, 411–435. [CrossRef]124. Ceccarelli, S.; Grando, S.; Bailey, E.; Amri, A.; El-Felah, M.; Nassif, F. Farmer participation in barley breeding
in Syria, Morocco and Tunisia. Euphytica 2001, 122, 521–536. [CrossRef]125. Entz, M.H.; Kirk, A.P.; Carkner, M.; Vaisman, I.; Fox, S.L. Evaluation of lines from a farmer participatory
organic wheat breeding program. Crop Sci. 2018, 58, 2433. [CrossRef]126. Ortiz-Perez, R.; Rios-Labrada, H.; Miranda-Lorigados, S.; Ponce-Brito, M.; Quintero-Fernandez, E.;
Chaveco-Perez, O. Avances del mejoramiento genetico participativo del frijol en Cuba. Agron. Mesoam. 2006,17, 337–346. [CrossRef]
127. Mustafa, Y.; Grando, S.; Ceccarelli, S. Assessing the Benefits and Costs of Participatory and Conventional BarleyBreeding Programs in Syria; The International Development Research: Ottawa, ON, Canada, 2006.
128. Ceccarelli, S. Drought. In Plant Genetic Resources and Climate Change; Jackson, M., Ford-Lloyd, B.V., Parry, M.L.,Eds.; CAB International: Boston, MA, USA, 2014; pp. 221–235.
129. Ceccarelli, S. Landraces: Importance and use in breeding and environmentally friendly agronomic systems.In Agrobiodiversity Conservation: Securing the Diversity of Crop Wild Relatives and Landraces; Maxted, N.,Dulloo, M.E., Ford-Lloyd, B.V., Frese, L., Iriondo, J., Pinheiro de Carvalho, M.A.A., Eds.; CABI Publishing:New York, NY, USA, 2012; pp. 103–117.
130. Petitti, M.; Bocci, R.; Bussi, B.; Ceccarelli, S.; Spillane, C.; McKeown, P. Future proofing decentralisedevolutionary wheat populations’ seed systems in Italy using a climate analogues approach: The exampleof Tuscany. In Proceedings of the EUCARPIA Symposium on Breeding for Diversification, Witzenhausen,Germany, 19–21 February 2018.
131. Tasesse, W.; Sanchez-Garcia, M.; Tawkaz, S.; Baum, M. Doubled haploid production in wheat. In Advances inBreeding Techinques for Cereal Crops; Ordon, F., Friedt, W., Eds.; Burleigh Dodds Science Publishing: Cambridge,UK, 2019; pp. 93–116.
132. Slama-Ayed, O.; Bouhaouel, I.; Ayed, S.; Jacques De Buyser, J.; Picard, E.; Hajer Slim Amara, H.S. Efficiencyof three haplomethods in durum wheat (Triticum turgidum subsp. durum Desf.): Isolated microspore culture,gynogenesis and wheat ×maize crosses. Czech J. Genet. Plant Breed. 2019, 55. [CrossRef]
133. Snape, J.; Simpson, E. The genetical expectations of doubled haploid lines derived from different filialgenerations. Theor. Appl. Genet. 1981, 60, 123–128. [CrossRef]
134. Almouslem, A.B.; Jauhar, P.P.; Peterson, T.S.; Bommineni, V.R.; Rao, M.B. Haploid durum wheat productionvia hybridization with maize. Crop Sci. 1998, 38, 1080–1087. [CrossRef]
135. Niroula, R.K.; Bimb, H.P. Overview of wheat x maize system of crosses for dihaploid induction in wheat.World Appl. Sci. J. 2009, 7, 1037–1045.
136. Foroughi-Wehr, B.; Zeller, F.J. In-Vitro microspore reaction of different German wheat cultivars. Theor. Appl.Genet. 1990, 79, 77–80. [CrossRef]
137. Loschenberger, F.; Hansel, H.; Heberle-Bors, E. Plant formation from pollen of tetraploid wheat species andTriticum tauschii. Cereal Res. Commun. 1993, 21, 133–139.
138. Hussain, M.; Niaz, M.; Iqbal, M.; Iftikhar, T.; Ahmad, J. Emasculation techniques and detached tiller culturein wheat x maize crosses. J. Agric. Res. 2012, 50, 1–19.
139. Laurie, D.A. Factors affecting fertilization frequency in crosses of Triticum aestivum cv. “Highbury” x Zeamays cv. “Seneca 60”. PlantBreed. 1989, 103, 133–140. [CrossRef]
23

Agronomy 2020, 10, 432
140. Sibi, M.L.; Kobaissi, A.; Shekafandeh, A. Green haploid plants from unpollinated ovary culture in tetraploidwheat (Triticum durum Defs.). Euphytica 2001, 122, 351–359. [CrossRef]
141. Gibbon, D. Rainfed farming systems in the Mediterranean region. Plant Soil 1981, 58, 59–80. [CrossRef]142. United Nations (UN). Global Drylands: A UN System-Wide Response; United Nations (UN): New York, NY,
USA, 2011.143. Graziani, M.; Maccaferri, M.; Royo, C.; Salvatorelli, F.; Tuberosa, R. QTL dissection of yield components and
morpho-physiological traits in a durum wheat elite population tested in contrasting thermo-pluviometricconditions. Crop Pasture Sci. 2014, 65, 80–95. [CrossRef]
144. Dura, S.; Duwayri, M.; Nachit, M.; Sheyaboudi, F.A. Detection of molecular markers associated with yieldand yield components in durum wheat (Triticum turgidum L. Var. durumDesf.) under drought conditions.Crop Pasture Sci. 2013, 64, 957–964. [CrossRef]
145. Hassouni, K.E.; Belkadi, B.; Sall, A.T.; Filali-Maltouf, A.; Al-Abdallat, A.; Nachit, M.M.; Bassi, F.M. Locicontrolling adaptation to heat stress occurring at the reproductive stage in durum wheat. Agronomy 2019, 9,414. [CrossRef]
146. Kthiri, D.; Loladze, A.; MacLachlan, P.R.; N’Diaye, A.; Walkowiak, S.; Nilsen, K.; Dreisigacker, S.; Ammar, K.;Pozniak, C.J. Characterization and mapping of leaf rust resistance in four durum wheat cultivars. PLoS ONE2018, 13, e0197317. [CrossRef]
147. Alqudah, A.M.; Sallam, A.; Baenziger, P.S.; Börner, A. GWAS: Fast-Forwarding gene identification andcharacterization in temperate Cereals: Lessons from Barley—A review. J. Adv. Res. 2020, 22, 119–135.[CrossRef]
148. Patil, R.M.; Tamhankar, S.A.; Oak, M.D.; Raut, A.L.; Honrao, B.K.; Rao, V.S.; Misra, S.C. Mapping of QTL foragronomic traits and kernel characters in durum wheat (Triticum durum Desf.). Euphytica 2013, 190, 117–129.[CrossRef]
149. Elouafi, I.; Nachit, M.M. A genetic linkage map of the durum×triticum dicoccoides backcross populationbased on SSRs and AFLP markers, and QTL analysis for milling traits. Theor. Appl. Genet. 2004, 108, 401–413.[CrossRef] [PubMed]
150. Pozniak, C.J.; Knox, R.E.; Clarke, F.R.; Clarke, J.M. Identification of QTL and association of a phytoenesynthase gene with endosperm colour in durum wheat. Theor. Appl. Genet. 2007, 114, 525–537. [CrossRef][PubMed]
151. Peleg, Z.; Cakmak, I.; Ozturk, L.; Yazici, A.; Jun, Y.; Budak, H.; Saranga, Y. Quantitative trait loci conferringgrain mineral nutrient concentrations in durum wheat×wild emmer wheat RIL population. Theor. Appl.Genet. 2009, 119, 353–369. [CrossRef] [PubMed]
152. Zhang, W.; Chao, S.; Manthey, F.; Chicaiza, O.; Brevis, J.C.; Echenique, V.; Dubcovsky, J. QTL analysis ofpasta quality using a composite microsatellite and SNP map of durum wheat. Theor. Appl. Genet. 2008, 117,1361–1377. [CrossRef] [PubMed]
153. Royo, C.; Soriano, J.M.; Alvaro, F. Wheat: A crop in the bottom of the Mediterranean diet pyramid. Mediterr.Identities Environ. Soc. Cult. 2017, 381–399. [CrossRef]
154. Nachit, M.M.; Elouafi, I. Durum wheat adaptation in the Mediterranean dryland: Breeding, stress physiology,and molecular markers. In Challenges and Strategies of Dryland Agriculture; Rao, S.C., Ryan, J., Eds.; CSSASpecial Publication: Madison, WI, USA, 2004; pp. 203–218.
155. Prat, N.; Guilbert, C.; Prah, U.; Wachter, E.; Steiner, B.; Langin, T.; Buerstmayr, H. QTL mapping of Fusariumhead blight resistance in three related durum wheat populations. Theor. Appl. Genet. 2017, 130, 13–27.[CrossRef]
156. Varella, A.C.; Zhang, H.; Weaver, D.K.; Cook, J.P.; Hofland, M.L.; Lamb, P.; Talbert, L.E. A novel QTL indurum wheat for resistance to the wheat stem sawfly associated with early expression of stem solidness. G3Genes Genomes Genet. 2019, 9, 1999–2006. [CrossRef]
157. Milner, S.G.; Maccaferri, M.; Huang, B.E.; Mantovani, P.; Massi, A.; Frascaroli, E.; Salvi, S. A multiparentalcross population for mapping QTL for agronomic traits in durum wheat (Triticum turgidum ssp. durum).Plant Biotechnol. J. 2016, 14, 735–748. [CrossRef]
158. Peña, R.J. Wheat for bread and other foods. In Bread Wheat Improvement and Production; Curtis, B.C.,Rajaram, S., Gómez Macpherson, H., Eds.; The Food and Agriculture Organization of the United Nations(FAO): Rome, Italy, 2002; pp. 483–542.
159. Gale, K.R. Diagnostic DNA markers for quality traits in wheat. J. Cereal Sci. 2005, 41, 181–192. [CrossRef]
24
Agronomy 2020, 10, 432
160. Blanco, A.; Bellomo, M.P.; Lotti, C.; Maniglio, T.; Pasqualone, A.; Simeone, R.; Troccoli, A.; Fonzo, N.D.Genetic mapping of sedimentation volume across environments using recombinant inbred lines of durumwheat. Plant Breed. 1998, 117, 413–417. [CrossRef]
161. Ma, W.; Zhang, W.; Gale, K.R. Multiplex-PCR typing of high molecular weight glutenin alleles in wheat.Euphytica 2003, 134, 51–60. [CrossRef]
162. Yıldırım, A.; Sönmezoglu, Ö.A.; Sayaslan, A.; Kandemir, N.; Gökmen, S. Molecular breeding of durum wheatcultivars for pasta quality. Qual. Assur. Saf. Crop. 2019, 11, 15–21. [CrossRef]
163. Blanco, A.; de Giovanni, C.; Laddomada, B.; Sciancalepore, A.; Simeone, R.; Devos, K.M.; Gale, M.D.Quantitative trait loci influencing grain protein content in tetraploid wheats. Plant Breed. 1996, 115, 310–316.[CrossRef]
164. Edwards, N.M.; Gianibelli, M.C.; McCaig, T.N.; Clarke, J.M.; Ames, N.P.; Larrique, O.R.; Dexter, G.E.Relationship between gluten strength, polymeric protein quantity and composition for diverse durum wheatgenotypes g. Cereal Sci. 2007, 45, 140–149. [CrossRef]
165. Sissons, M. Role of durum wheat composition on the quality of pasta and bread. Food 2008, 2, 75–90.166. Giuliani, M.M.; De Santis, M.A.; Pompa, M.; Giuzio, I.; Flagella, Z. Analysis of gluten proteins composition
during grain filling in two durum wheat cultivars submitted to two water regoms. Ital. J. Agron. 2014, 9, 558.167. Giuliani, M.M.; Palermo, C.; De Santis, M.A.; Mentana, A.; Pompa, M.; Giuzio, I.; Masci, S.; Centonze, D.;
Flagella, Z. Differential expression of durum wheat glutenproteome under water stress during grain filling.J. Agric. Food Chem. 2015, 63, 6501–6512. [CrossRef]
168. D’Ovidio, R.; Masci, S. The wheat low-molecular-weight glutenin subunits. J. Cereal Sci. 2004, 39, 321–339.[CrossRef]
169. Sosinov, A.A.; Poperelya, F.A. Prolamin polymorphism and plant breeding. Bull. Agric. Sci. 1979, 10, 21–34.170. Wrigley, C.W.; Autran, J.C.; Bushuk, W. Identification of cereal varieties by gel electrophoresis of grain
proteins. Adv. Cereal Sci. Technol. 1982, 5, 211–259.171. Melnikova, N.V.; Kudryavtseva, A.V.; Kudryatsev, A.M. Catalogue of alleles of gliadin-coding loci in durum
wheat (Triticum durum Desg.). Biochimie 2011, 94, 551–557. [CrossRef] [PubMed]172. Damideaux, R.; Autran, J.C.; Grignak, P.; Feillet, P. Mise en evidence de relations applicables en selection 921
entre l’ electrophoregramme des gliadines et les properties viscoelastiques du gluten de Triticum durum 922Desf. C. R. Acad. Sci. 1978, 287, 701–704.
173. Poperelya, F.A.; Babayants, I.G. Gliadin component block Gld-183 as a marker of gene determining stem rustresistance. Dokl. Vaskhnil 1978, 6, 6–7.
174. Raciti, C.N.; Doust, M.A.; Lombardo, G.M.; Boggini, G.; Pecetti, L. Characterization of durum wheatmediterranean germplasm for high and low molecular weight glutenin subunits in relation with quality. Eur.J. Agron. 2003, 19, 373–382. [CrossRef]
175. Rossini, F.; Provenzano, M.E.; Sestili, F.; Ruggeri, R. Synergistic effect of sulfur and nitrogen in the organicand mineral fertilization of durum wheat: grain yield and quality traits in the Mediterranean environment.Agronomy 2018, 8, 189. [CrossRef]
176. Li, L.; Niu, Y.; Ruan, Y.; DePauw, R.M.; Singh, A.K.; Gan, Y. Agronomic advancement in tillage, crop rotation,soil health, and genetic gain in durum wheat cultivation: A 17-year Canadian story. Agronomy 2018, 8, 193.[CrossRef]
177. Morris, C.E.; Sands, D.C. The breeder’s dilemma-yield or nutrition? Nat. Biotechnol. 2006, 24, 1078–1080.[CrossRef]
178. Scherf, K.A. Immunoreactive cereal proteins in wheat allergy, non-celiac gluten/wheat sensitivity (NCGS)and celiac disease. Curr. Opin. Food Sci. 2019, 25, 35–41. [CrossRef]
179. Ziegler, K.; Neumann, J.; Liu, F.; Fröhlich-Nowoisky, J.; Cremer, C.; Saloga, J.; Reinmuth-Selzle, K.; Pöschl, U.;Schuppan, D.; Bellinghausen, I.; et al. Nitration of wheat amylase trypsin inhibitors increases their innateand adaptive immunostimulatory potential In Vitro. Front. Immunol. 2019, 9, 3174–3184. [CrossRef]
180. Cianferoni, A. Wheat allergy: Diagnosis and management. J. Asthma Allergy 2016, 9, 13–25. [CrossRef]181. Korte, A.; Farlow, A. the advantages and limitations of trait analysis with gwas: A review. Plant Methods
2013, 9, 29. [CrossRef] [PubMed]
25
Agronomy 2020, 10, 432
182. Mangini, G.; Gadaleta, A.; Colasuonno, P.; Marcotuli, I.; Signorile, A.M.; Simeone, R.; De Vita, P.;Mastrangelo, A.M.; Laidò, G.; Pecchioni, N.; et al. Genetic dissection of the relationships between grain yieldcomponents by genome-wide association mapping in a collection of tetraploid wheats. PLoS ONE 2018, 13,e0190162. [CrossRef] [PubMed]
183. Wang, S.; Xu, S.; Chao, S.; Sun, Q.; Liu, S.; Xia, G. A genome-wide association study of highly heritableagronomic traits in durum wheat. Front. Plant Sci. 2019, 10, 919. [CrossRef] [PubMed]
184. Sivakumar, S.; Matthew, P.R.; Sansaloni, C. Genome-Wide association analyses identify QTL hotspots for yieldand component traits in durum wheat grown under yield potential, drought, and heat stress environments.Front. Plant Sci. 2018, 81. [CrossRef]
185. Aoun, M.; Breiland, M.; Turner, K.M.; Loladze, A.; Chao, S.; Xu, S.; Acevedo, M. Genome-Wide associationmapping of leaf rust response in a durum wheat worldwide germplasm collection. Plant Genome 2016, 9.[CrossRef]
186. Liu, W.; Maccaferri, M.; Bulli, P.; Rynearson, S.; Tuberosa, R.; Chen, X.; Pumphrey, M. Genome-Wideassociation mapping for seedling and field resistance to Puccinia striiformis f. sp. tritici in elite durum wheat.Theor. Appl. Genet. 2017, 130, 649–667. [CrossRef]
187. Liu, W.; Maccaferri, M.; Rynearson, S.; Letta, T.; Zegeye, H.; Tuberosa, R.; Pumphrey, M. Novel sources ofstripe rust resistance identified by genome-wide association mapping in Ethiopian durum wheat (Triticumturgidum ssp. durum). Front. Plant Sci. 2017, 8, 774. [CrossRef]
188. Kidane, Y.G.; Hailemariam, B.N.; Mengistu, D.K.; Fadda, C.; Pè, M.E.; Dell’Acqua, M. Genome-Wideassociation study of septoria tritici blotch resistance in ethiopian durum wheat landraces. Front. Plant Sci.2017, 8, 1586. [CrossRef]
189. Marcotuli, I.; Houston, K.; Waugh, R.; Fincher, G.B.; Burton, R.A.; Blanco, A.; Gadaleta, A. Genome wideassociation mapping for arabinoxylan content in a collection of tetraploid wheats. PLoS ONE 2015, 10,e0132787. [CrossRef]
190. Nigro, D.; Gadaleta, A.; Mangini, G.; Colasuonno, P.; Marcotuli, I.; Giancaspro, A.; Blanco, A. Candidategenes and genome-wide association study of grain protein content and protein deviation in durum wheat.Planta 2019, 249, 1157–1175. [CrossRef]
191. Wang, S.; Wong, D.; Forrest, K.; Allen, A.; Chao, S.; Huang, B.E.; Mastrangelo, A.M. Characterization ofpolyploid wheat genomic diversity using a high-density 90,000 single nucleotide polymorphism array. PlantBiotechnol. J. 2014, 12, 787–796. [CrossRef] [PubMed]
192. Avni, R.; Nave, M.; Eilam, T.; Sela, H.; Alekperov, C.; Peleg, Z.; Distelfeld, A. Ultra-Dense genetic map ofdurum wheat× wild emmer wheat developed using the 90K iSelect SNP genotyping assay. Mol. Breed. 2014,34, 1549–1562. [CrossRef]
193. Maccaferri, M.; Ricci, A.; Salvi, S.; Milner, S.G.; Noli, E.; Martelli, P.L.; Ammar, K. A high-density, SNP-basedconsensus map of tetraploid wheat as a bridge to integrate durum and bread wheat genomics and breeding.Plant Biotechnol. J. 2015, 13, 648–663. [CrossRef] [PubMed]
194. Maccaferri, M.; Harris, N.S.; Twardziok, S.O.; Pasam, R.K.; Gundlach, H.; Spannagl, M.; Himmelbach, A.Durum wheat genome highlights past domestication signatures and future improvement targets. NatureGenet. 2019, 51, 885. [CrossRef]
195. Krasileva, K.V.; Buffalo, V.; Bailey, P.; Pearce, S.; Ayling, S.; Tabbita, F.; Dubcovsky, J. Separating homeologsby phasing in the tetraploid wheat transcriptome. Genome Biol. 2013, 14, R66. [CrossRef] [PubMed]
196. Vendramin, V.; Ormanbekova, D.; Scalabrin, S.; Scaglione, D.; Maccaferri, M.; Martelli, P.; Tuberosa, R.Genomic tools for durum wheat breeding: De novo assembly of Svevo transcriptome and SNP discovery inelite germplasm. BMC Genom. 2019, 20, 278. [CrossRef] [PubMed]
197. Krasileva, K.V.; Vasquez-Gross, H.A.; Howell, T.; Bailey, P.; Paraiso, F.; Clissold, L.; Fosker, C. Uncoveringhidden variation in polyploid wheat. Proc. Natl. Acad. Sci. USA 2017, 114, 913–921. [CrossRef]
198. Sieber, A.N.; Longin, C.F.H.; Würschum, T. Molecular characterization of winter durum wheat (Triticumdurum)based on a genotyping-by-sequencing approach. Plant Genet. Res. 2017, 15, 36–44. [CrossRef]
199. Baloch, F.S.; Alsaleh, A.; Shahid, M.Q.; Çiftçi, V.; de Miera, L.E.S.; Aasim, M.; Hatipoglu, R. A whole genomeDArTseq and SNP analysis for genetic diversity assessment in durum wheat from central fertile crescent.PLoS ONE 2017, 12, e0167821. [CrossRef]
200. Newell, M.A.; Jannink, J.L. Genomic selection in plant breeding. In Crop Breed; Humana Press: New York,NY, USA, 2014; pp. 117–130.
26
Agronomy 2020, 10, 432
201. Hayes, B.J.; Goddard, M.E. Prediction of total genetic value using genome-wide dense marker maps. Genetics2001, 157, 1819–1829.
202. Fiedler, J.D.; Salsman, E.; Liu, Y.; Michalak de Jiménez, M.; Hegstad, J.B.; Chen, B.; Li, X. Genome-Wideassociation and prediction of grain and semolina quality traits in durum wheat breeding populations. PlantGenome 2017, 10. [CrossRef] [PubMed]
203. Watson, A.; Ghosh, S.; Williams, M.J.; Cuddy, W.S.; Simmonds, J.; Rey, M.D.; Adamski, N.M. Speed breedingis a powerful tool to accelerate crop research and breeding. Nat. Plants 2018, 4, 23. [CrossRef] [PubMed]
204. Alahmad, S.; Dinglasan, E.; Leung, K.M.; Riaz, A.; Derbal, N.; Voss-Fels, K.P.; Hickey, L.T. Speed breeding formultiple quantitative traits in durum wheat. Plant Methods 2018, 14, 36. [CrossRef] [PubMed]
205. Altpeter, F.; Vasil, V.; Srivastava, V.; Vasil, I.K. Integration and expression of the high-molecular-weightglutenin subunit 1Ax1 into wheat. Nat. Biotechnol. 1996, 14, 1155–1159. [CrossRef] [PubMed]
206. He, G.Y.; Rooke, L.; Steele, S.; Bekes, F.; Gras, P.; Tatham, A.S.; Fido, R.; Barcelo, P.; Shewry, P.R.; Lazzeri, P.A.Transformation of pasta wheat (Triticum durum L. var. durum) with high-molecular-weight glutenin subunitgenes and modification of dough functionality. Mol. Breed. 1999, 5, 377–396. [CrossRef]
207. Wang, H.; Yang, H.; Shivalila, C.S.; Dawlaty, M.M.; Cheng, A.W.; Zhang, F.; Jaenisch, R. One-Step generationof mice carrying mutations in multiple genes by CRISPR/Cas-mediated genome engineering. Cell 2013, 153,910–918. [CrossRef]
208. Shan, Q.; Wang, Y.; Li, J.; Gao, C. Genome editing in rice and wheat using the CRISPR/Cas system. Nat.Protoc. 2014, 9, 2395–2410. [CrossRef]
209. Gil-Humanes, J.; Wang, Y.; Liang, Z.; Shan, Q.; Ozuna, C.V.; Sánchez-León, S.; Baltes, N.J.; Starker, C.; Barro, F.;Gao, C.; et al. High-Efficiency gene targeting in hexaploid wheat using DNA replicons and CRISPR/Cas9.Plant J. 2017, 89, 1251–1262. [CrossRef]
210. Zhang, Y.; Liang, Z.; Zong, Y.; Wang, Y.; Liu, J.; Chen, K.; Qiu, J.-L.; Gao, C. Efficient and transgene-freegenome editing in wheat through transient expression of CRISPR/Cas9 DNA or RNA. Nat. Commun. 2016, 7,1–8. [CrossRef]
211. Uauy, C.; Paraiso, F.; Colasuonno, P.; Tran, R.K.; Tsai, H.; Berardi, S.; Comai, L.; Dubcovsky, J. A modifiedTILLING approach to detect induced mutations in tetraploid and hexaploid wheat. BMC Plant Biol. 2009, 9,115. [CrossRef]
212. Varshney, R.K.; Sinha, P.; Singh, V.K.; Kumar, A.; Zhang, Q.; Bennetzen, J.L. 5Gs for crop genetic improvement.Curr. Opin. Plant Biol. 2020. [CrossRef] [PubMed]
© 2020 by the authors. Licensee MDPI, Basel, Switzerland. This article is an open accessarticle distributed under the terms and conditions of the Creative Commons Attribution(CC BY) license (http://creativecommons.org/licenses/by/4.0/).
27

agronomy
Review
Durum Wheat (Triticum durum Desf.): Origin, Cultivation and Potential Expansion inSub-Saharan Africa
Amadou Tidiane Sall 1,2, Tiberio Chiari 3, Wasihun Legesse 4, Kemal Seid-Ahmed 2, Rodomiro Ortiz 5, Maarten van Ginkel 6 and Filippo Maria Bassi 2,*
1 Institut Sénégalais de Recherches Agricoles (ISRA), Saint-Louis 46024, Senegal; [email protected] International Center for Agricultural Research in the Dry Areas (ICARDA), Rabat 10000, Morocco;
[email protected] Italian Agency for Development Cooperation (AICS), Addis Ababa 1000, Ethiopia; [email protected] Ethiopian Institute Agricultural Research (EIAR), Agricultural Research Center, Debre Zeit 1000, Ethiopia;
[email protected] Sveriges lantbruksuniversitet (SLU), Institutionen för Växtförädling (VF), 23053 Alnarp, Sweden;
[email protected] International Center for Agricultural Research in the Dry Areas (ICARDA), Amman 1118, Jordan;
[email protected]* Correspondence: [email protected]; Tel.: +212-614-402-717
Received: 11 April 2019; Accepted: 13 May 2019; Published: 24 May 2019
Abstract: Durum wheat is an important food crop in the world and an endemic species of sub-SaharanAfrica (SSA). In the highlands of Ethiopia and the oases of the Sahara this crop has been cultivated forthousands of years. Today, smallholder farmers still grow it on marginal lands to assure productionfor their own consumption. However, durum wheat is no longer just a staple crop for food securitybut has become a major cash crop. In fact, the pasta, burghul and couscous industry currentlypurchase durum grain at prices 10 to 20% higher than that of bread wheat. Africa as a whole importsover €4 billion per year of durum grain to provide the raw material for its food industry. Hence,African farmers could obtain a substantial share of this large market by turning their productionto this crop. Here, the achievements of the durum breeding program of Ethiopia are revised toreveal a steep acceleration in variety release and adoption over the last decade. Furthermore, thevariety release for Mauritania and Senegal is described to show how modern breeding methods couldbe used to deliver grain yields above 3 t ha−1 in seasons of just 92 days of length and in daytimetemperatures always above 32 ◦C. This review describes the potential of releasing durum wheatvarieties adapted to all growing conditions of SSA, from the oases of the Sahara to the highlands ofEthiopia. This indicates that the new breeding technologies offer great promise for expanding thearea of durum wheat production in SSA but that this achievement remains primarily dependent onthe market ability to purchase these grains at a higher price to stimulate farmer adoption. The criticalimportance of connecting all actors along the semolina value chain is presented in the example ofOromia, Ethiopia and that success story is then used to prompt a wider discussion on the potential ofdurum wheat as a crop for poverty reduction in Africa.
Keywords: Agro-industry; Ethiopia; oasis wheat; pasta wheat; Senegal River; value chain
1. Introduction
Durum wheat (Triticum durum Desf.) is an important food crop of the world, with an estimated36 million t of annual global production [1]. The largest producing countries are Turkey and Canadawith estimated 2 million ha each [2,3], followed by Algeria, Italy and India, each cultivating over
Agronomy 2019, 9, 263; doi:10.3390/agronomy9050263 www.mdpi.com/journal/agronomy29
Agronomy 2019, 9, 263
1.5 million ha [4–6]. Syria belonged to this group of large producers but the recent unrest has stronglyreduced crop production. France, Greece, Morocco, Pakistan, Portugal, Kazakhstan, Russia, Spainand Tunisia cultivate durum wheat on between 0.5 and 0.8 million ha annually [3]. Azerbaijan, Iraqand Iran combined grow durum wheat on over 0.7 million ha [6]. In addition, Egypt, Jordan andLebanon grow it on relatively large areas [7–9]. The Sonora desert and other small areas of Mexicoalso target the production of this crop for the export market on approximately 0.2 million ha [10].Australia is similarly exploring the cultivation of this crop with 0.1 million ha allocated annually to itsproduction [11]. In sub-Saharan Africa (SSA), Ethiopia is the largest producer of durum wheat, withapproximately 0.6 million ha [12].
A very large amount of genetic diversity exists for this crop and that diversity also extends tothe many traditional ways of consuming it, including several unique dishes that represent with pridethe national identities: pasta, couscous, bourghul, freekeh, gofio and unleavened breads, just to namea few [13]. Regardless of its tight connection to the dishes of the tradition, durum wheat today iscultivated in developed countries mainly as a cash crop to feed the booming food industry. The annualproduction of pasta was estimated at 14.3 million t in 2013, with a global market approximated at€14.9 billion and average global price of 1045 € t−1 [14]. On a global scale, most of its consumption andproduction are in Europe, South America and the United States of America. Africa accounts only for5.6% of total pasta production, mainly in Egypt, South Africa and Tunisia [14] and Asia consumption isalso on the raise. Detailed data for SSA are hard to obtain, as most statistics combine durum wheat withbread wheat into single “wheat” data points but the estimations that could be gathered from severalsources suggest an import market of €337 million and an export market mostly within the continent of€40 million (Table 1). Reliable data on the size of the internal market were not found. In this review,the developing couscous and bourghul industrial markets are not included, as data are not readilyavailable. Italy, North African, South Africa and Turkey are the largest exporters of pasta to SSA [15].However, the total area dedicated to durum wheat in SSA is limited to 630,000 ha, of which 90% iscultivated in Ethiopia. Therefore, this is the only country capable of producing pasta using locallygrown grain, while for all other SSA countries the bulk of pasta production required the import of€483 million worth of durum grain from Canada, Turkey and the USA (Table 1). It must be mentionedthat the pasta industry in SSA often utilizes bread wheat flour for its production and typically onlyproducts from North Africa and developed countries meet the international standard definition of‘pasta’ by using 100% durum semolina [14]. Clearly, there is huge agricultural and commercial scopefor expanding domestic production and marketing of durum wheat in SSA countries.
Durum wheat and rice are the most lucrative among the cereals, with prices usually 20 to 40%higher than common wheat, millet, maize and sorghum [16]. While durum wheat remains a criticalstaple food for smallholder farmers in marginal lands, thanks to its exceptional adaptation to climaticstresses, its large-scale production is tightly linked to its greater monetary return. In the absence ofgovernmental subsidies that push toward the cultivation of other crops, farmers tend to prefer durumwheat as long as the market continues to guarantee additional profits. In this regard, the existence of astrong value chain for the pasta, couscous and bourghul industry is quintessential to the success ofdurum wheat cropping.
30
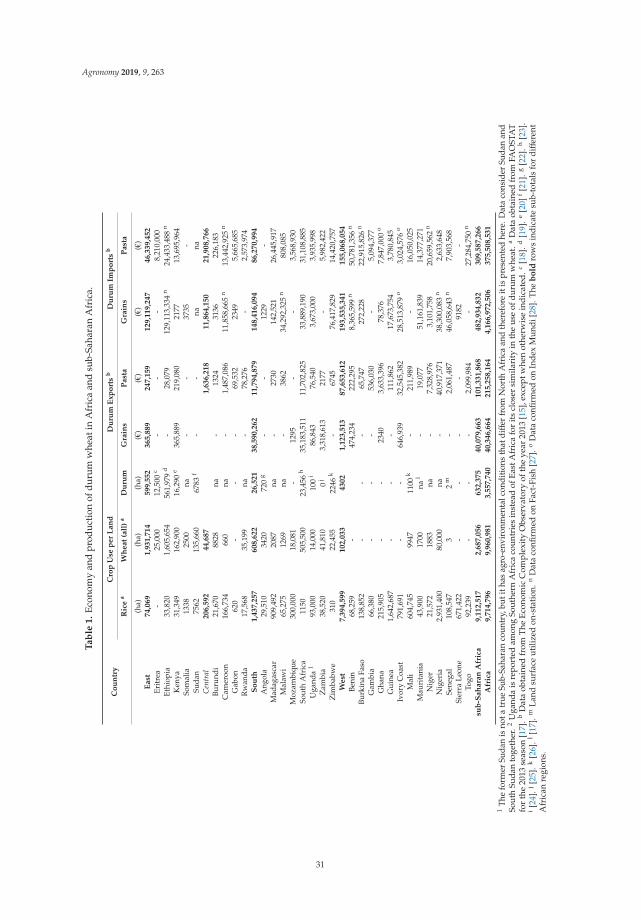
Agronomy 2019, 9, 263
Ta
ble
1.
Econ
omy
and
prod
ucti
onof
duru
mw
heat
inA
fric
aan
dsu
b-Sa
hara
nA
fric
a.
Co
un
try
Cro
pU
sep
er
La
nd
Du
rum
Ex
po
rts
bD
uru
mIm
po
rts
b
Ric
ea
Wh
ea
t(a
ll)
aD
uru
mG
rain
sP
ast
aG
rain
sP
ast
a
(ha)
(ha)
(ha)
(€)
(€)
(€)
(€)
Ea
st7
4,0
69
1,9
31
,71
45
99
,55
23
65
,88
92
47
,15
91
29
,11
9,2
47
46
,33
9,4
52
Erit
rea
-25
,000
12,5
00c
--
-8,
210,
000
Ethi
opia
33,8
201,
605,
654
561,
979
d-
28,0
7912
9,11
3,33
4n
24,4
33,4
88n
Ken
ya31
,349
162,
900
16,2
90e
365,
889
219,
080
2177
13,6
95,9
64So
mal
ia13
3825
00na
--
3735
-Su
dan
7562
135,
660
6783
f-
-na
naC
entr
al2
06
,59
24
4,6
87
1,6
36
,21
81
1,8
64
,15
02
1,9
08
,76
6
Buru
ndi
21,6
7088
28na
-13
2431
3622
6,18
3C
amer
oon
166,
734
660
na-
1,48
7,08
611
,858
,665
n13
,442
,925
n
Gab
on62
0-
--
69,5
3223
495,
665,
685
Rw
anda
17,5
6835
,199
na-
78,2
76-
2,57
3,97
4S
ou
th1
,43
7,2
57
60
8,6
22
26
,52
13
8,5
90
,26
21
1,7
94
,87
91
48
,41
6,0
94
86
,27
0,9
94
Ang
ola
29,5
1034
2072
0g
--
1229
-M
adag
asca
r90
9,49
220
87na
-27
3014
2,52
126
,445
,917
Mal
awi
65,2
7512
69na
-38
6234
,292
,325
n80
8,08
5M
ozam
biqu
e30
0,00
018
,081
-12
95-
-3,
568,
930
Sout
hA
fric
a11
5050
5,50
023
,456
h35
,183
,511
11,7
02,8
2533
,889
,190
31,1
08,8
85U
gand
a1
93,0
0014
,000
100
i86
,843
76,5
403,
673,
000
3,93
5,99
8Z
ambi
a38
,520
41,8
100
j3,
318,
613
2177
-5,
982,
422
Zim
babw
e31
022
,455
2246
k-
6745
76,4
17,8
2914
,420
,757
We
st7
,39
4,5
99
10
2,0
33
43
02
1,1
23
,51
38
7,6
53
,61
21
93
,53
5,3
41
15
5,0
68
,05
4
Beni
n68
,259
-47
4,23
422
2,29
58,
365,
599
n50
,781
,356
n
Burk
ina
Faso
138,
852
--
-65
,747
272,
228
22,9
15,8
26n
Gam
bia
66,3
80-
--
536,
030
-5,
094,
377
Gha
na21
5,90
5-
-23
403,
633,
396
78,3
767,
847,
000
o
Gui
nea
1,64
2,68
7-
--
111,
862
17,6
73,7
543,
780,
845
Ivor
yC
oast
791,
691
--
646,
939
32,5
45,3
8228
,513
,879
o3,
024,
576
o
Mal
i60
4,74
599
4711
00k
-21
1,98
9-
16,0
50,0
25M
auri
tani
a43
,900
1700
nal
-19
,077
51,1
61,8
3914
,377
,271
Nig
er21
,572
1883
na-
7,32
8,97
63,
101,
758
20,6
59,5
62n
Nig
eria
2,93
1,40
080
,000
na-
40,9
17,3
7138
,300
,083
n2,
633,
648
Sene
gal
108,
547
32
m-
2,06
1,48
746
,058
,643
n7,
903,
568
Sier
raLe
one
671,
422
--
--
9182
-To
go92
,239
--
-2,
099,
984
-27
,284
,750
n
sub
-Sa
ha
ran
Afr
ica
9,1
12
,51
72
,68
7,0
56
63
2,3
75
40
,07
9,6
63
10
1,3
31
,86
84
82
,93
4,8
32
30
9,5
87
,26
6
Afr
ica
9,7
14
,79
69
,96
0,9
81
3,5
57
,74
04
0,3
46
,66
42
15
,25
8,1
64
4,1
66
,97
2,5
06
37
5,5
08
,53
1
1Th
efo
rmer
Suda
nis
nota
true
Sub-
Saha
ran
coun
try,
buti
thas
agro
-env
iron
men
talc
ondi
tions
that
diff
erfr
omN
orth
Afr
ica
and
ther
efor
eit
ispr
esen
ted
here
.Dat
aco
nsid
erSu
dan
and
Sout
hSu
dan
toge
ther
.2U
gand
ais
repo
rted
amon
gSo
uthe
rnA
fric
aco
untr
ies
inst
ead
ofEa
stA
fric
afo
rit
scl
oser
sim
ilari
tyin
the
use
ofdu
rum
whe
at.a
Dat
aob
tain
edfr
omFA
OST
AT
for
the
2013
seas
on[1
7].b
Dat
aob
tain
edfr
omT
heE
cono
mic
Com
plex
ity
Obs
erva
tory
ofth
eye
ar20
13[1
5],e
xcep
twhe
not
herw
ise
ind
icat
ed.c
[18]
.d[1
9].e
[20]
f[2
1].g
[22]
.h[2
3].
i[2
4].j
[25]
.k[2
6].l
[17]
.mLa
ndsu
rfac
eut
ilize
don
-sta
tion.
nD
ata
confi
rmed
onFa
ct-F
ish
[27]
.oD
ata
confi
rmed
onIn
dex
Mun
di[2
8].T
heb
old
row
sin
dica
tesu
b-to
tals
for
diff
eren
tA
fric
anre
gion
s.
31
Agronomy 2019, 9, 263
In this review, the current status of durum wheat production in SSA is discussed in comparison tothe needs of the local pasta industry to better understand the potential of its expansion through thedeployment of novel adapted varieties. Because of its industrial nature, durum wheat has often beendisregarded by SSA policy makers in favour of bread wheat as a more direct “food security” approach.However, among the sustainable development goals set by the United Nations, “poverty reduction” isconsidered as a strategic way to tackle famine, without causing nutritional deficits due to mono-fooddiets. In this sense, durum wheat is at least as well suited as bread wheat in improving livelihoods.Both aspects of durum wheat, as a “food security” staple food for smallholder farmers, as well as a“poverty reduction” industrial crop will be considered here.
2. An Endemic Crop of SSA: Durum Wheat Second Centre of Origin in Ethiopia
Durum wheat originated from the domesticated form of a wild species named emmer wheat(Triticum dicoccum Koern.) between 12,000 and 10,000 years ago, in the West Levantine [29]. Phoenicianshave traded it along the Mediterranean shores since historical times and throughout the rise ofcivilizations this crop has encountered several waves of expansion until today’s global importance [30].However, durum wheat did not originate solely in West Asia. Archaeological evidence suggeststhat naked emmer reached Ethiopia approximately 5000 years ago [31], probably arriving from theLevantine, through Egypt, along the Silk Road [32]. Today emmer wheat occupies approximately 7% ofthe wheat production in Ethiopia under the local name of aja. Recent molecular data [33] indicated thatEthiopian farmers repeated what had been achieved already in West Asia before, by deriving durumwheat anew through the further domestication of emmer. This new origin of the same crop gave rise toa subspecies known as T. turgidum ssp. aethiopicum or abyssinicum. Until relatively recently, landracesbelonging to this subspecies were widely cultivated by smallholder farmers in Ethiopia, with up to 80%of the total durum land farmed with these unique biotypes [34]. The highlands of Ethiopia are knownareas of rich biodiversity and durum wheat is no exception [35,36]. For instance, one of the uniquecharacteristics identified among T. aethiopicum landraces is the purple colour of the grains, particularlyrich in anthocyanins [37]. Anthocyanins act as anti-oxidants and provide other health benefits, hencethese could be potentially exploited by the pasta industry to develop extra nutritious food products.Morphological and molecular characterization of these landraces has only just begun and alreadyseveral traits such as resistance to diseases (e.g., stem rust, powdery mildew), drought tolerance,long coleoptile, high tillering and resistance sources to Hessian fly have been identified [38,39]. Thisbiodiversity has already started attracting strong interest by the international community for utilization,pushing the Ethiopian Government to protect it under strict germplasm exchange policy [18]. In orderto conserve these resources, the Ethiopian Biodiversity Institute (EBI) has established a holding of over7000 accessions collected from different parts of Ethiopia [34]. These collections have been extensivelyinvestigated for their morphological and molecular diversity by many researchers and useful traitswere identified and are now utilized by breeders and plant genetic conservationists in Ethiopia andbeyond [40–48]. In the past two decades, the acreage of traditional tetraploid wheat has drasticallydiminished due to displacement by improved bread wheat varieties, extensive cultivation of Tef andKabuli chickpea, farmland fragmentation, policies favouring bread wheat and the absence of a strongseed supply system [49]. To reduce this genetic erosion, EBI has established in situ conservation sites toconserve the agro-biodiversity at the farm level in different parts of Ethiopia. Community biodiversitypractices were established in East Shoa and South Wollo zones with the aim of establishing communityseed banks, participatory variety selection and the re-introduction of local durum wheat biotypes,food legumes and sorghum into the cropping system [50,51]. Regardless of their specific uses, theselandraces represent a treasure chest of potentially new and useful traits that breeders could be able toexploit to deliver superior varieties with added market values.
32
Agronomy 2019, 9, 263
3. Durum Wheat in East Africa as a Staple and Cash Crop
East African countries cultivate almost 2 million ha of wheat, of which only 630,000 ha are farmedwith durum wheat (Table 2). Eritrea, Kenya, Somalia and Sudan combined harvested as little as37,000 ha of durum wheat in 2014. Yet, these countries have maintained in their culinary taste theinfluence of the past Italian presence in the region, with pasta imports reaching 40 million USD in2017 in Ethiopia only. In the case of Kenya, national production is sufficient to support the export of€0.5 million worth of pasta and durum grains.
Table 2. Durum wheat varieties currently cultivated in Sub-Saharan Africa.
Country Variety Name Adoption Pedigree Origin
Ethiopia ‘Cocorit71’ Old variety, still cultivated Enano/4*Tehuacan60//Stewart63/3/Anhinga CIMMYT
Ethiopia ‘Langdon(LD)357’ Old variety, still cultivated LD308/Nugget USA
Ethiopia ‘Gerardo’ Old variety, still cultivated GerardoVZ466/3/ND61130/Leeds//Grulla CIMMYT
Ethiopia ‘Ejersa’ Variety utilized by farmers inOromia Labud/Nigris3// Gan CIMMYT
Ethiopia ‘Bakalcha’Widely cultivated variety, now
replaced due to susceptibility tostem rust
Gedirfa/Gwerou15 CIMMYT
Ethiopia ‘Ude’ Variety that replaced Bakalcha inmost zones Chen/Altar// Jori69 CIMMYT
Ethiopia ‘Mangudo’ Covers several districts in Oromia Omruf1/Stojocri2/3/1718/BeadWheat24//Karim ICARDA
Ethiopia ‘Asasa’ Low moisture area in Rift Valley Cho/Taurus//Yav/3/Fg/4/Cra/5/Fg/Dom/6/Hui national
Ethiopia ‘Utuba’ New favorite by farmers,cultivated already on 10,000 ha
Omruf1/Stojocri2/3/1718/BeadWheat24//Karim ICARDA
Ethiopia ‘Sinana1’ 18,000 ha Emmer selection fromlandraces national
Ethiopia ‘Lemesso’ 18,000 ha Emmer selection fromlandraces national
Mauritania ‘Karim’ Cultivated by farmers along theSenegal river and in oasis Jori/Anhinga//Flamingo CIMMYT
Mauritania,Senegal ‘Haby’ New release under fats-track
multiplicationMrb5/T.dico Aleppo
Col//Cham1 ICARDA
Mauritania,Senegal ‘Elwaha’ New release under fats-track
multiplicationOslks/5/Azn/4/BezHF/3/SD19539//Cham1/Gdr2 ICARDA
Mauritania,Senegal ‘Bani Suef 5’ New release under fats-track
multiplication Dipperz/Bushen3 CIMMYT
Senegal ‘Amina’ New release under fats-trackmultiplication
Korifla/AegSpeltoidesSyr//Loukos ICARDA
Mali ‘Biskri-Bouteille’ Old variety, still cultivated. Onlyavailable recorded release Biskri/Bouteille national
South Africa ‘Kronos’ Most cultivated variety APB MSFRS pop selection USAKenya ‘Mwewe’ Old variety, still cultivated Flamingo/Leads CIMMYT
Sudan ‘Sham1’ Old variety, still cultivated Plc/Ruff// Gta/Rtte CIMMYTICARDA
Eritrea ‘Mindum XA10’ Old variety, still cultivated Mindum/Asmara10 USANigeria ‘Anser8’ Holds potential for adoption Altar84/Alondra//Sula CIMMYT
The durum varieties used for production are old bred-lines from Centro Internacional deMejoramiento de Maíz y Trigo (CIMMYT) and International Centre for Agricultural Research in theDry Areas (ICARDA) such as ‘Mwewe’ (Flamingo/Leads), Mindum XA10 (Mindum/Asmara 10) andSham 1 (Plc/Ruff//Gta/Rtte), in Eritrea, Kenya and Sudan, respectively (Table 2). The most critical traitsof these varieties are earliness and tolerance to heat in irrigated Sudan and resistance to rust diseasesunder rainfed cultivation in Eritrea and Kenya. Information from Somalia is scarce and hard to obtain.Considering that the most cultivated durum varieties listed above are more than 30 years old, there is asignificant genetic yield gap that could be filled through the release and commercialization of moremodern varieties.
33
Agronomy 2019, 9, 263
The Ethiopian case is presented in some detail, including critical historical steps, as it providesvaluable lessons for other SSA countries planning to grow their durum wheat sector. In Ethiopia,durum wheat is produced predominantly in the Gojam, Gonder, Shewa, Tigrai and Wollo regions [52].The main growers are smallholder farmers in the highlands, where the environmental characteristicsare relatively low temperatures and high rainfall on black swelling/shrinking vertisol soils, with waterlogging as a common problem. The crop is planted late in the growing season to avoid early waterlogging and it continues to grow during the dry period on residual moisture at altitudes between1800 and 2800 m.a.s.l. [44]. Due to late planting, it forfeits some of its additional potential yield infavour of higher protein content. The crop is consumed in several different forms such as unleavenedbreads, pancakes, macaroni, spaghetti, biscuits and pastries. The most common of the Ethiopian andEritrean recipes include dabo (Ethiopian home-made bread), hambasha (bread from northern Ethiopia),kitta (unleavened bread), injera (thin bread normally made with Tef ), nifro (boiled whole grains), kolo(roasted whole grains), dabo kolo (round and seasoned dough) and kinche (crushed kernels, cooked withmilk or water and mixed with spiced butter). Besides the role of grain in traditional food and processedproducts, durum wheat straw is also greatly appreciated for its high palatability for livestock in themixed farming systems of the highlands of Ethiopia [53]. Ethiopia today cultivates 562,000 ha of durumwheat [12], accounting for the vast majority of the cultivation of this crop in SSA (Table 2). Still, today’svalue represents just half of the land that was dedicated to durum wheat in 1967 [54] and this reductioncontinues in favour of more extensive farming of bread wheat [23]. This is the combined result ofpolitical will, the introduction of modern bread wheat cultivars that have replaced the traditionaldurum wheat landraces and the absence until now of vocal local industry demand of high qualitypasta made from durum semolina. Ethiopia’s push toward bread self-sufficiency has resulted in amonoculture of bread wheat (as well as maize), often cultivated in both the long (meher) and short(belg) rainy seasons, which in turn created a favourable environment of continuous host presence forthe spread of damaging rust diseases and for the surge of tenacious weeds [55,56]. Tef, the largestcultivated crop in Ethiopia, also contributes to an expansion of monoculture in Ethiopian agriculture.
Durum wheat research in Ethiopia started back in 1949 at the Paradiso Experimental Station nearAsmara [57]. Among several local durum landrace collections tested for productivity and stem andleaf rust resistance, four selections (A10, H23, P20 and R18) were developed and released to farmersin Eritrea in 1952. In 1956 and 1957, several crosses were made between local and exotic varietiesmainly for the purpose of transferring the stem and leaf rust resistance of A10 and R18 to cv. ‘Mindum’from the USA (Table 2). This resulted in two new varieties, which unfortunately had to be rapidlyretracted due to susceptibility to new leaf rust races [58]. In the 1980s, the wheat research activitiesat the Paradiso station were discontinued and durum wheat breeding was transferred to the DebreZeit Agricultural Research Centre [42]. At the Centre, many cultivars were developed and released,derived from landrace selections, local crosses and introductions from the international durum wheatbreeding programs at CIMMYT and ICARDA. For clarity, in this review the word ‘cultivar’ has beenused to define germplasm cultivated on large amounts of land, while the word ‘variety’ is reserved todefine germplasm officially registered in the variety catalogue of one country. The first durum cultivarsreleased from local breeding selections were ‘Arendeto’ (DZ04-118) and ‘Marou’ (DZ04-688), obtainedby mass selection [59]. These were followed by the varieties ‘Cocorit-71′, ‘LD-357′ and ‘Gerardo’obtained from the international agricultural research centres. Since 1982, a formal variety releasesystem has been put in place, which also rationalized the previous work into a variety catalogue,which accounts today for 40 durum wheat cultivars (Figure 1). In the last two decades, many federaland regional agricultural research centres have become involved in durum wheat improvement torespond to the demand by 300 local flour and pasta manufacturers as well as the local consumers. Thispush by the national food industry, combined with a stronger presence in the region of internationaldevelopment agencies involved in breeding against the emerging Ug99 stem rust race threat [60],has resulted in an increase in the release of durum cultivars, with 20 varieties inscribed in the last10 years [61]. These new varieties are more responsive to chemical inputs, resistant to diseases and can
34
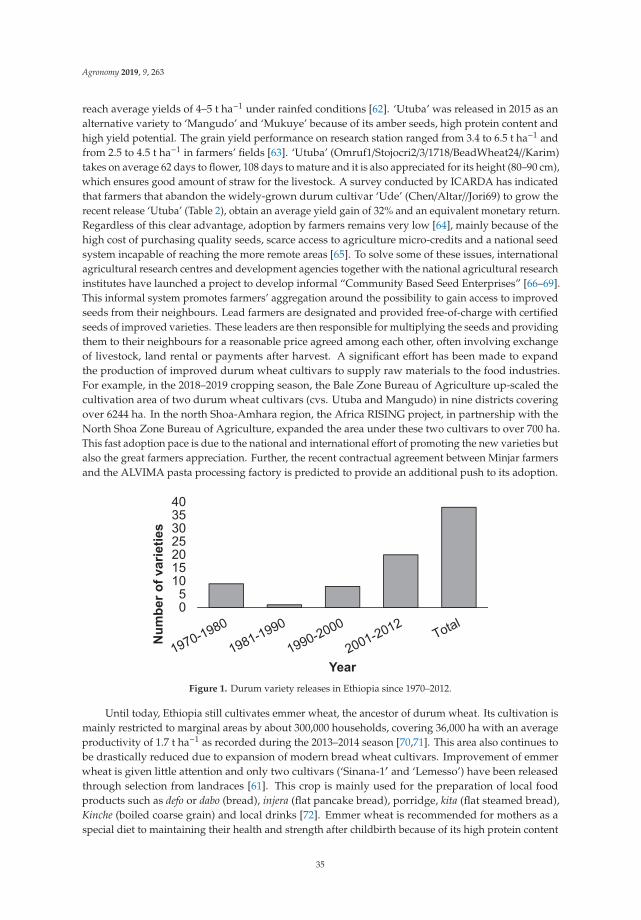
Agronomy 2019, 9, 263
reach average yields of 4–5 t ha−1 under rainfed conditions [62]. ‘Utuba’ was released in 2015 as analternative variety to ‘Mangudo’ and ‘Mukuye’ because of its amber seeds, high protein content andhigh yield potential. The grain yield performance on research station ranged from 3.4 to 6.5 t ha−1 andfrom 2.5 to 4.5 t ha−1 in farmers’ fields [63]. ‘Utuba’ (Omruf1/Stojocri2/3/1718/BeadWheat24//Karim)takes on average 62 days to flower, 108 days to mature and it is also appreciated for its height (80–90 cm),which ensures good amount of straw for the livestock. A survey conducted by ICARDA has indicatedthat farmers that abandon the widely-grown durum cultivar ‘Ude’ (Chen/Altar//Jori69) to grow therecent release ‘Utuba’ (Table 2), obtain an average yield gain of 32% and an equivalent monetary return.Regardless of this clear advantage, adoption by farmers remains very low [64], mainly because of thehigh cost of purchasing quality seeds, scarce access to agriculture micro-credits and a national seedsystem incapable of reaching the more remote areas [65]. To solve some of these issues, internationalagricultural research centres and development agencies together with the national agricultural researchinstitutes have launched a project to develop informal “Community Based Seed Enterprises” [66–69].This informal system promotes farmers’ aggregation around the possibility to gain access to improvedseeds from their neighbours. Lead farmers are designated and provided free-of-charge with certifiedseeds of improved varieties. These leaders are then responsible for multiplying the seeds and providingthem to their neighbours for a reasonable price agreed among each other, often involving exchangeof livestock, land rental or payments after harvest. A significant effort has been made to expandthe production of improved durum wheat cultivars to supply raw materials to the food industries.For example, in the 2018–2019 cropping season, the Bale Zone Bureau of Agriculture up-scaled thecultivation area of two durum wheat cultivars (cvs. Utuba and Mangudo) in nine districts coveringover 6244 ha. In the north Shoa-Amhara region, the Africa RISING project, in partnership with theNorth Shoa Zone Bureau of Agriculture, expanded the area under these two cultivars to over 700 ha.This fast adoption pace is due to the national and international effort of promoting the new varieties butalso the great farmers appreciation. Further, the recent contractual agreement between Minjar farmersand the ALVIMA pasta processing factory is predicted to provide an additional push to its adoption.
Figure 1. Durum variety releases in Ethiopia since 1970–2012.
Until today, Ethiopia still cultivates emmer wheat, the ancestor of durum wheat. Its cultivation ismainly restricted to marginal areas by about 300,000 households, covering 36,000 ha with an averageproductivity of 1.7 t ha−1 as recorded during the 2013–2014 season [70,71]. This area also continues tobe drastically reduced due to expansion of modern bread wheat cultivars. Improvement of emmerwheat is given little attention and only two cultivars (‘Sinana-1′ and ‘Lemesso’) have been releasedthrough selection from landraces [61]. This crop is mainly used for the preparation of local foodproducts such as defo or dabo (bread), injera (flat pancake bread), porridge, kita (flat steamed bread),Kinche (boiled coarse grain) and local drinks [72]. Emmer wheat is recommended for mothers as aspecial diet to maintaining their health and strength after childbirth because of its high protein content
35
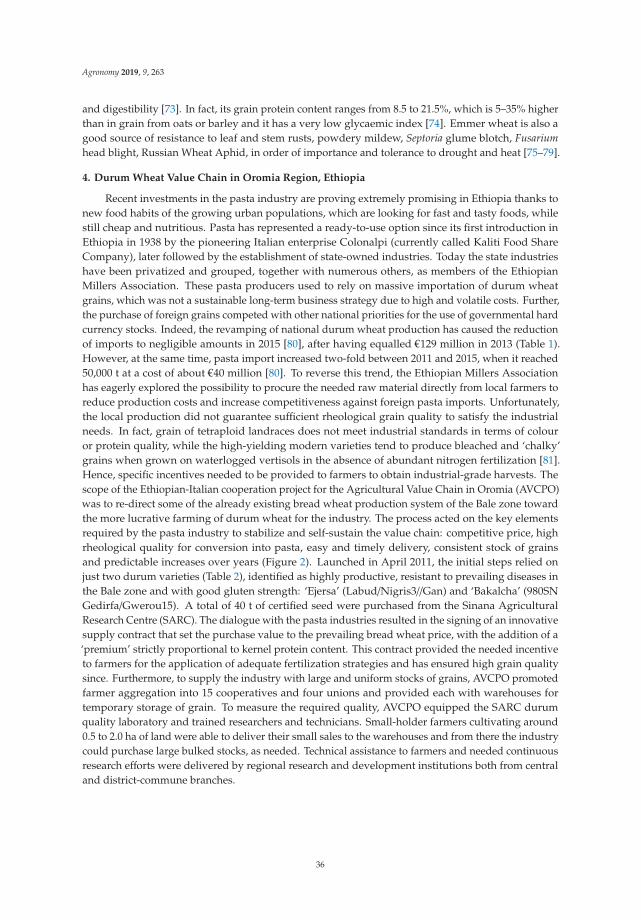
Agronomy 2019, 9, 263
and digestibility [73]. In fact, its grain protein content ranges from 8.5 to 21.5%, which is 5–35% higherthan in grain from oats or barley and it has a very low glycaemic index [74]. Emmer wheat is also agood source of resistance to leaf and stem rusts, powdery mildew, Septoria glume blotch, Fusariumhead blight, Russian Wheat Aphid, in order of importance and tolerance to drought and heat [75–79].
4. Durum Wheat Value Chain in Oromia Region, Ethiopia
Recent investments in the pasta industry are proving extremely promising in Ethiopia thanks tonew food habits of the growing urban populations, which are looking for fast and tasty foods, whilestill cheap and nutritious. Pasta has represented a ready-to-use option since its first introduction inEthiopia in 1938 by the pioneering Italian enterprise Colonalpi (currently called Kaliti Food ShareCompany), later followed by the establishment of state-owned industries. Today the state industrieshave been privatized and grouped, together with numerous others, as members of the EthiopianMillers Association. These pasta producers used to rely on massive importation of durum wheatgrains, which was not a sustainable long-term business strategy due to high and volatile costs. Further,the purchase of foreign grains competed with other national priorities for the use of governmental hardcurrency stocks. Indeed, the revamping of national durum wheat production has caused the reductionof imports to negligible amounts in 2015 [80], after having equalled €129 million in 2013 (Table 1).However, at the same time, pasta import increased two-fold between 2011 and 2015, when it reached50,000 t at a cost of about €40 million [80]. To reverse this trend, the Ethiopian Millers Associationhas eagerly explored the possibility to procure the needed raw material directly from local farmers toreduce production costs and increase competitiveness against foreign pasta imports. Unfortunately,the local production did not guarantee sufficient rheological grain quality to satisfy the industrialneeds. In fact, grain of tetraploid landraces does not meet industrial standards in terms of colouror protein quality, while the high-yielding modern varieties tend to produce bleached and ‘chalky’grains when grown on waterlogged vertisols in the absence of abundant nitrogen fertilization [81].Hence, specific incentives needed to be provided to farmers to obtain industrial-grade harvests. Thescope of the Ethiopian-Italian cooperation project for the Agricultural Value Chain in Oromia (AVCPO)was to re-direct some of the already existing bread wheat production system of the Bale zone towardthe more lucrative farming of durum wheat for the industry. The process acted on the key elementsrequired by the pasta industry to stabilize and self-sustain the value chain: competitive price, highrheological quality for conversion into pasta, easy and timely delivery, consistent stock of grainsand predictable increases over years (Figure 2). Launched in April 2011, the initial steps relied onjust two durum varieties (Table 2), identified as highly productive, resistant to prevailing diseases inthe Bale zone and with good gluten strength: ‘Ejersa’ (Labud/Nigris3//Gan) and ‘Bakalcha’ (980SNGedirfa/Gwerou15). A total of 40 t of certified seed were purchased from the Sinana AgriculturalResearch Centre (SARC). The dialogue with the pasta industries resulted in the signing of an innovativesupply contract that set the purchase value to the prevailing bread wheat price, with the addition of a‘premium’ strictly proportional to kernel protein content. This contract provided the needed incentiveto farmers for the application of adequate fertilization strategies and has ensured high grain qualitysince. Furthermore, to supply the industry with large and uniform stocks of grains, AVCPO promotedfarmer aggregation into 15 cooperatives and four unions and provided each with warehouses fortemporary storage of grain. To measure the required quality, AVCPO equipped the SARC durumquality laboratory and trained researchers and technicians. Small-holder farmers cultivating around0.5 to 2.0 ha of land were able to deliver their small sales to the warehouses and from there the industrycould purchase large bulked stocks, as needed. Technical assistance to farmers and needed continuousresearch efforts were delivered by regional research and development institutions both from centraland district-commune branches.
36
Agronomy 2019, 9, 263
Figure 2. Durum wheat value chain in Oromia, Ethiopia. (a) Schematic of the intervention and valuechain key actor relationships: to promote increased income in rural areas, the industrial requirements(market 2) were recorded and used to first promote contractual agreements for the sale of industrial-gradeseeds and to assemble the farmers into cooperatives around grain storages and second to drive theresearch agenda with the release of superior cultivars and their multiplication via community-basedseed enterprises; (b) Success indicator measured as the amount of durum grain sold to the food industryfrom the Oromia region since the inception of the project. SARC refers to the Sinana AgriculturalResearch Centre.
Highly innovative contractual relationships were created among farmer cooperatives andindustries, pushing the surrounding authorities and public institutions to provide support andsurveillance on proper accomplishment of duties. Among these, SARC formally acted as neutral thirdparty for measuring the protein content and determining the final price. The emphasis on the highestlevel of participation and ownership by all involved stakeholders was considered as the key elementfor the success and sustainability of the development process [82]. Since the first harvest, durumwheat provided to farmers a significant monetary gain per ha of 25 to 30% over concurrent breadwheat and the industries were greatly satisfied with good rheological quality and reduced prices overimports. The availability of seed stocks of the two selected varieties enabled for prompt expansionof area planted through newly adopting farmers and cooperatives. Over time, the self-sufficientnature of the AVCPO’s complex of cooperatives and institutions has created the premises for a vibrantmarket-oriented community eager to absorb and valorise new varieties and technologies developed bytheir research partners. Especially in the current situation of evolving rust races dramatically affectingbread wheat in the Bale and other wheat belts, farmers attribute to durum wheat the role of a rescuecrop. By the convergence of all these factors, durum wheat production has exponentially increasedfrom 500 t in 2011–2012, to a record harvest of 4.6 million t in 2017 due mainly to the ‘Utuba’ recentrelease and cultivation on large scale. ‘Utuba’ was christened and released as Ethiopian durum wheatvariety in 2015 [83]. In the meantime, the value chain is already expanding to nearby Arsi and Shewazones. The example of Oromia can be considered a successful approach on integration of the wholedurum wheat value chain [84], with a proven rapid and sustainable impact. Hence, it provides a goodexample to follow for other SSA countries that rely today on durum wheat and pasta imports.
5. Durum Wheat in West Africa as a Future Cash Crop
West African countries cultivate over 7 million ha of irrigated rice but only 100,000 ha of wheat(mainly bread wheat) and mostly in Nigeria. A recent steep increase of wheat area has been reported
37
Agronomy 2019, 9, 263
for Nigeria but these data are not yet available from FAO statistics, the main source used for compilingTable 1. Still, all West African countries are importers of wheat grain and its derived products. A totalof €155 million worth of pasta and €193 million worth of durum grains were imported in 2013 (Table 1).Benin is the largest importer of pasta in West Africa with almost €51 million worth imported in 2013,followed by Niger, Burkina Faso and Togo, which are also among the largest importers in Africa with€20, €22 and €27 million worth, respectively. Interestingly, €87 million worth of pasta are re-exportedeach year, mostly by Côte d’ Ivoire and Nigeria. Since national durum production is close to zero, itmeans that large quantities of durum wheat grain are imported internationally, converted by the localindustry into pasta products and then sold locally and to neighbouring countries. Hence, as was thecase for the Oromia region in Ethiopia, there is potential for national durum cultivation to supportthis strong local industry, while sharing the €180 million worth per year of the current import marketwith the local growers. In Nigeria, initial steps have already been undertaken to identify suitabledurum varieties at the Kadawa Kano field station. Here, 12 candidate varieties from CIMMYT’sbreeding program were assessed over two seasons. Trials revealed that grain yields exceeding 6.2 t ha−1
could be achieved in 100 days by the top performer ‘Anser8′ (Altar84/Alondra//Sula) under gravityirrigation [85].
Mauritania is the largest importer of durum grain in West Africa with over €51 million spentevery year. This country has one of the most challenging agro-environments in West Africa, withfarming substantially restricted to the narrow band along the Senegal River, where rainfall of up to600 mm per year and irrigation water from the river sustain crop production (Agriculture in Mauritania,2009). The Senegal River basin has a potential of irrigating 135,000 ha [86], of which less than 20%are currently utilized. The main crops are rice, pearl millet and cowpea. Wheat cultivation along theriver is estimated at 8200 ha, of which approximately 5000 ha are grown with durum wheat. The onlycultivated durum variety is ‘Karim’ (syn: ‘Yavaros79′, Jori/Anhinga//Flamingo), a widely adapted+35 years old CIMMYT-derived variety. Wheat is cultivated during the winter season in rotationwith rice and cowpea under gravity irrigation. The window for growing wheat is rather narrowto avoid interfering with the cultivation of the two seasons of rice. Sowing has to occur betweenthe end of November and the middle of December. The harvest is just 80 to 100 days later in earlyMarch. Regardless of this short season, two recent projects carried on at the experimental stations ofDaara and Kaedi (U-Forsk2013 and SARD-SC) have revealed that yields of 3 t ha−1 could be reachedalong the Senegal River Valley. In response to these results, three new durum wheat varieties (‘Haby’[Mrb5/T.dico Aleppo Col//Cham1], ‘Elwaha’ [Oslks/5/Azn/4/BezHF/3/SD19539//Cham1/Gdr2] and‘Bezater’ [Ossl1/Stj5/5/Bicrederaa1/4/BEZAIZSHF//SD19539/Waha/3/Stj/Mrb3/6/Stj3//Bcr/Lks4/3/Ter3])were released in 2016 (Table 2) and their seed multiplication has begun [87]. On the opposite shore ofthe river, the field station of Fanaye in Senegal obtained yields as high as 6 t ha−1, when early plantingtowards the end of November was achieved. The irrigable agricultural land of Senegal is dividedalong three rivers, (in order of importance): Senegal, Faleme and Casamance, thus providing a totalestimated irrigable land of 350,000 ha [88]. The Senegal River valley alone accounts for 240,000 haof potential arable land [89], of which 110,000 ha are currently used for rice cultivation. Since 2017small-holder farmers started growing improved heat tolerant durum wheat varieties after completionof the rice harvest, during the winter season, which is typically left at fallow. This research achievement,if sustained by polices and market demand, could help replace the €46 million worth of annual durumimport by the national pasta industry. Furthermore, if the total rice area was to be converted to durumwheat instead of the fallow period, then this would be sufficient to generate an overproduction ofdurum grains to be exported to neighbouring countries for an interesting price. Just as the wheat-ricerotation system has been the cornerstone of India’s food self-sufficiency with over 10 million ha stillcultivated today [90], it can also become a new boost for the West African agriculture. In addition, theintegration of a legume crop in the rotation with durum wheat and rice would be desirable to alsoincrease long-term soil health and agro-ecosystem stability. In this regard, a suggestion is made toreplace one rice season with cowpea, an excellent source of food and feed, with very high market
38
Agronomy 2019, 9, 263
value. The cropping model suggested would then become rice-durum wheat-cowpea. This expansioninto considering a pulse such as cowpea as part of the durum wheat production system is, however,beyond the scope of this review and shall not be discussed further.
A third country relying on the Senegal River for irrigation is Mali, whose production is concentratedalong this and the Niger River. The total irrigable land is estimated at 340,000 ha [91] with a potentialto further expand. The vast majority of the land is utilized for the production of rice and maize duringthe warm months. Wheat is cultivated during winter on just 10,000 ha, of which a very small portionis durum wheat (Table 1). The old variety ‘Biskri-Bouteille’ (Biskri/Bouteille) is the only reportedrelease for Mali [92]. It is likely that the breeding activities and import from neighbouring countrieshave resulted in more modern releases but no document could be located. Similar to its neighbours,Mali imports large quantities of pasta (€14 million) and part of it is further exported (€0.2 million).Hence, local production of durum wheat is a viable option for all three countries along the SenegalRiver. Their total area currently cultivated with rice reaches 754,000 ha. Assuming the same conditionsapply to the whole surface, cultivation of durum wheat during the short winter fallow season has thepotential to generate additional food, without reducing the current production of their main staplefood. The newly identified super-early and heat tolerant durum varieties released in Mauritania andSenegal (‘Haby’, ‘Elwaha’, ‘Bezater’ and ‘Amina’: Korifla/AegSpeltoidesSyr//Loukos) can providegood industrial grain for the national industry and hold the potential to generate more than 1 million tof additional food in Sub-Saharan Africa [87].
The situation in Nigeria is no different than that observed for the Senegal River countries, eventhough, with over 80,000 ha farmed to wheat in 2013, it is already the largest bread wheat producer inWest Africa (Table 1). A recent push by the Nigerian government, such as the removal of subsidiesfor the imported grains, has incentivized farmers to increase their wheat production and 2018/19area harvested and production are estimated at 60,000 hectares and 60,000 tons, respectively [93].Wheat is typically planted in November or December and harvested around April. The land usedfor wheat production is then rotated for other rainfed crops during the rainy season, which lasts innorthern Nigeria from April to September. Rice is sometimes grown after wheat. The amount ofland occupied by durum wheat is not declared in any of the available documents. Certainly, Nigeriaimports €38 million per year of durum wheat grain to be converted into pasta for the national andexport market (€41 million worth). Hence, the local industry could certainly benefit from an increasein national production. Considering that the area cultivated with rice exceeds 2.9 million ha and thatirrigation water is readily available in many parts of the countries, it certainly suggests great potentialfor expansion.
Similarly, Guinea is a large importer of durum grain (for €17 million EUR) but none is currentlyproduced on the 1.6 million ha of rice cultivation. Côte d’Ivoire is the largest exporter of pasta(€32 million worth per year) but also one of the largest importers of durum grain (€28 million worth),with no production of wheat recorded on the 790,000 ha of rice cultivation (Table 1).
In summary, West African countries have the potential to convert their off-season of their 7.2 millionha of rice fields into durum wheat cultivation, instead of having an unproductive winter fallow. New,super-early and heat tolerant varieties have been developed, tested and confirmed along the SenegalRiver [87] and their seed is readily available through the CGIAR WHEAT program. Their cultivationcould turn an annual import market of €185 million worth of grain and almost €200 million worth ofpasta into a national income to improve industrialization, create jobs and reduce poverty in rural areas.
6. Southern and Central Africa Durum Wheat Use in the Industry with Limited Cultivation
Southern and Central African countries cultivate 1.6 million ha of rice and 0.65 million ha of wheat.Unfortunately, data on wheat cultivation in Central Africa are few and unsubstantial. Among SouthernAfrican countries, durum wheat is cultivated on just 26,500 ha, mostly in South Africa and Zimbabwe.The most widely cultivated varieties are the ‘Desert’ durum developed in Arizona and California, with“Kronos” (Arizona Plant Breeders male sterile-facilitated recurrent selection population selection) as
39
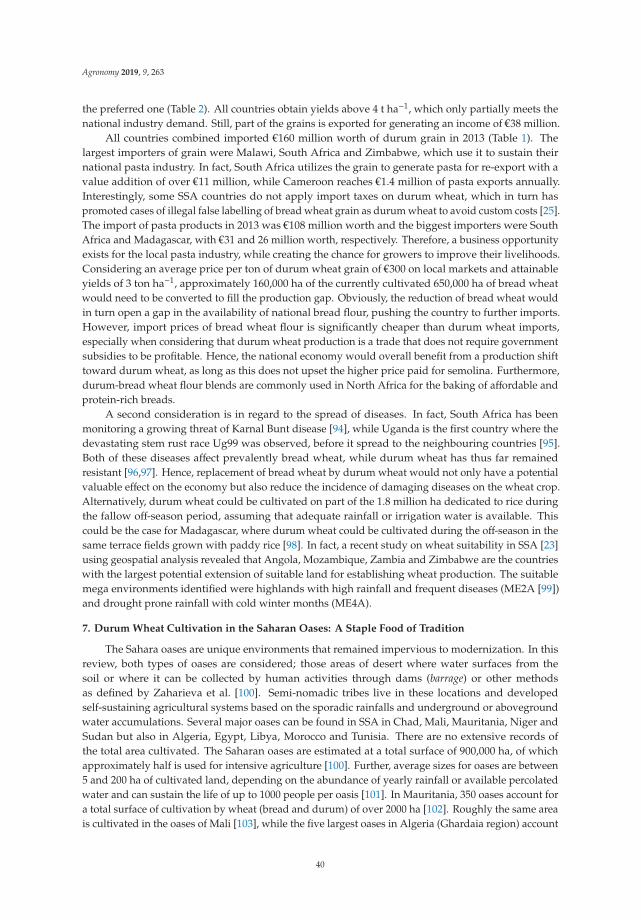
Agronomy 2019, 9, 263
the preferred one (Table 2). All countries obtain yields above 4 t ha−1, which only partially meets thenational industry demand. Still, part of the grains is exported for generating an income of €38 million.
All countries combined imported €160 million worth of durum grain in 2013 (Table 1). Thelargest importers of grain were Malawi, South Africa and Zimbabwe, which use it to sustain theirnational pasta industry. In fact, South Africa utilizes the grain to generate pasta for re-export with avalue addition of over €11 million, while Cameroon reaches €1.4 million of pasta exports annually.Interestingly, some SSA countries do not apply import taxes on durum wheat, which in turn haspromoted cases of illegal false labelling of bread wheat grain as durum wheat to avoid custom costs [25].The import of pasta products in 2013 was €108 million worth and the biggest importers were SouthAfrica and Madagascar, with €31 and 26 million worth, respectively. Therefore, a business opportunityexists for the local pasta industry, while creating the chance for growers to improve their livelihoods.Considering an average price per ton of durum wheat grain of €300 on local markets and attainableyields of 3 ton ha−1, approximately 160,000 ha of the currently cultivated 650,000 ha of bread wheatwould need to be converted to fill the production gap. Obviously, the reduction of bread wheat wouldin turn open a gap in the availability of national bread flour, pushing the country to further imports.However, import prices of bread wheat flour is significantly cheaper than durum wheat imports,especially when considering that durum wheat production is a trade that does not require governmentsubsidies to be profitable. Hence, the national economy would overall benefit from a production shifttoward durum wheat, as long as this does not upset the higher price paid for semolina. Furthermore,durum-bread wheat flour blends are commonly used in North Africa for the baking of affordable andprotein-rich breads.
A second consideration is in regard to the spread of diseases. In fact, South Africa has beenmonitoring a growing threat of Karnal Bunt disease [94], while Uganda is the first country where thedevastating stem rust race Ug99 was observed, before it spread to the neighbouring countries [95].Both of these diseases affect prevalently bread wheat, while durum wheat has thus far remainedresistant [96,97]. Hence, replacement of bread wheat by durum wheat would not only have a potentialvaluable effect on the economy but also reduce the incidence of damaging diseases on the wheat crop.Alternatively, durum wheat could be cultivated on part of the 1.8 million ha dedicated to rice duringthe fallow off-season period, assuming that adequate rainfall or irrigation water is available. Thiscould be the case for Madagascar, where durum wheat could be cultivated during the off-season in thesame terrace fields grown with paddy rice [98]. In fact, a recent study on wheat suitability in SSA [23]using geospatial analysis revealed that Angola, Mozambique, Zambia and Zimbabwe are the countrieswith the largest potential extension of suitable land for establishing wheat production. The suitablemega environments identified were highlands with high rainfall and frequent diseases (ME2A [99])and drought prone rainfall with cold winter months (ME4A).
7. Durum Wheat Cultivation in the Saharan Oases: A Staple Food of Tradition
The Sahara oases are unique environments that remained impervious to modernization. In thisreview, both types of oases are considered; those areas of desert where water surfaces from thesoil or where it can be collected by human activities through dams (barrage) or other methodsas defined by Zaharieva et al. [100]. Semi-nomadic tribes live in these locations and developedself-sustaining agricultural systems based on the sporadic rainfalls and underground or abovegroundwater accumulations. Several major oases can be found in SSA in Chad, Mali, Mauritania, Niger andSudan but also in Algeria, Egypt, Libya, Morocco and Tunisia. There are no extensive records ofthe total area cultivated. The Saharan oases are estimated at a total surface of 900,000 ha, of whichapproximately half is used for intensive agriculture [100]. Further, average sizes for oases are between5 and 200 ha of cultivated land, depending on the abundance of yearly rainfall or available percolatedwater and can sustain the life of up to 1000 people per oasis [101]. In Mauritania, 350 oases account fora total surface of cultivation by wheat (bread and durum) of over 2000 ha [102]. Roughly the same areais cultivated in the oases of Mali [103], while the five largest oases in Algeria (Ghardaia region) account
40
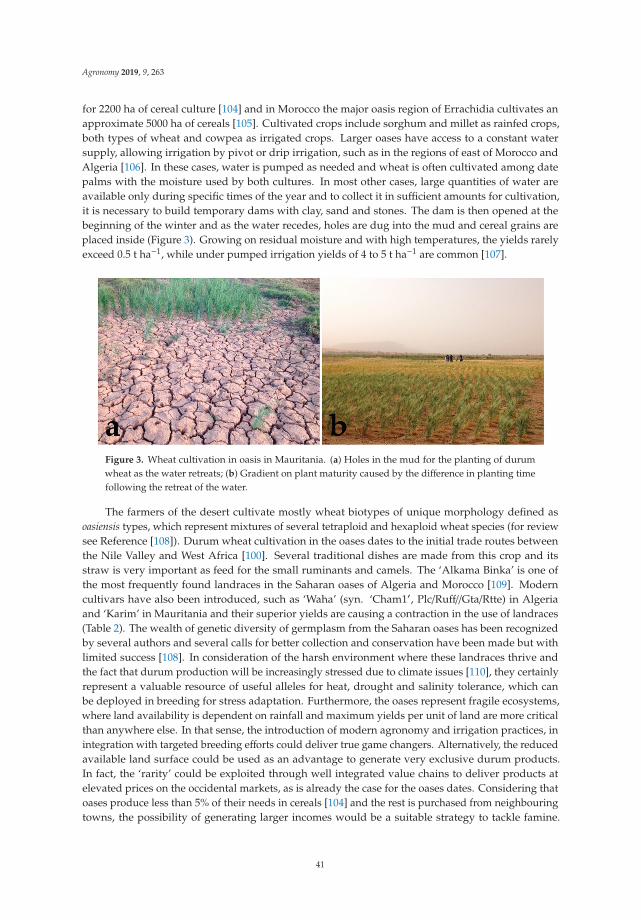
Agronomy 2019, 9, 263
for 2200 ha of cereal culture [104] and in Morocco the major oasis region of Errachidia cultivates anapproximate 5000 ha of cereals [105]. Cultivated crops include sorghum and millet as rainfed crops,both types of wheat and cowpea as irrigated crops. Larger oases have access to a constant watersupply, allowing irrigation by pivot or drip irrigation, such as in the regions of east of Morocco andAlgeria [106]. In these cases, water is pumped as needed and wheat is often cultivated among datepalms with the moisture used by both cultures. In most other cases, large quantities of water areavailable only during specific times of the year and to collect it in sufficient amounts for cultivation,it is necessary to build temporary dams with clay, sand and stones. The dam is then opened at thebeginning of the winter and as the water recedes, holes are dug into the mud and cereal grains areplaced inside (Figure 3). Growing on residual moisture and with high temperatures, the yields rarelyexceed 0.5 t ha−1, while under pumped irrigation yields of 4 to 5 t ha−1 are common [107].
Figure 3. Wheat cultivation in oasis in Mauritania. (a) Holes in the mud for the planting of durumwheat as the water retreats; (b) Gradient on plant maturity caused by the difference in planting timefollowing the retreat of the water.
The farmers of the desert cultivate mostly wheat biotypes of unique morphology defined asoasiensis types, which represent mixtures of several tetraploid and hexaploid wheat species (for reviewsee Reference [108]). Durum wheat cultivation in the oases dates to the initial trade routes betweenthe Nile Valley and West Africa [100]. Several traditional dishes are made from this crop and itsstraw is very important as feed for the small ruminants and camels. The ‘Alkama Binka’ is one ofthe most frequently found landraces in the Saharan oases of Algeria and Morocco [109]. Moderncultivars have also been introduced, such as ‘Waha’ (syn. ‘Cham1′, Plc/Ruff//Gta/Rtte) in Algeriaand ‘Karim’ in Mauritania and their superior yields are causing a contraction in the use of landraces(Table 2). The wealth of genetic diversity of germplasm from the Saharan oases has been recognizedby several authors and several calls for better collection and conservation have been made but withlimited success [108]. In consideration of the harsh environment where these landraces thrive andthe fact that durum production will be increasingly stressed due to climate issues [110], they certainlyrepresent a valuable resource of useful alleles for heat, drought and salinity tolerance, which canbe deployed in breeding for stress adaptation. Furthermore, the oases represent fragile ecosystems,where land availability is dependent on rainfall and maximum yields per unit of land are more criticalthan anywhere else. In that sense, the introduction of modern agronomy and irrigation practices, inintegration with targeted breeding efforts could deliver true game changers. Alternatively, the reducedavailable land surface could be used as an advantage to generate very exclusive durum products.In fact, the ‘rarity’ could be exploited through well integrated value chains to deliver products atelevated prices on the occidental markets, as is already the case for the oases dates. Considering thatoases produce less than 5% of their needs in cereals [104] and the rest is purchased from neighbouringtowns, the possibility of generating larger incomes would be a suitable strategy to tackle famine.
41
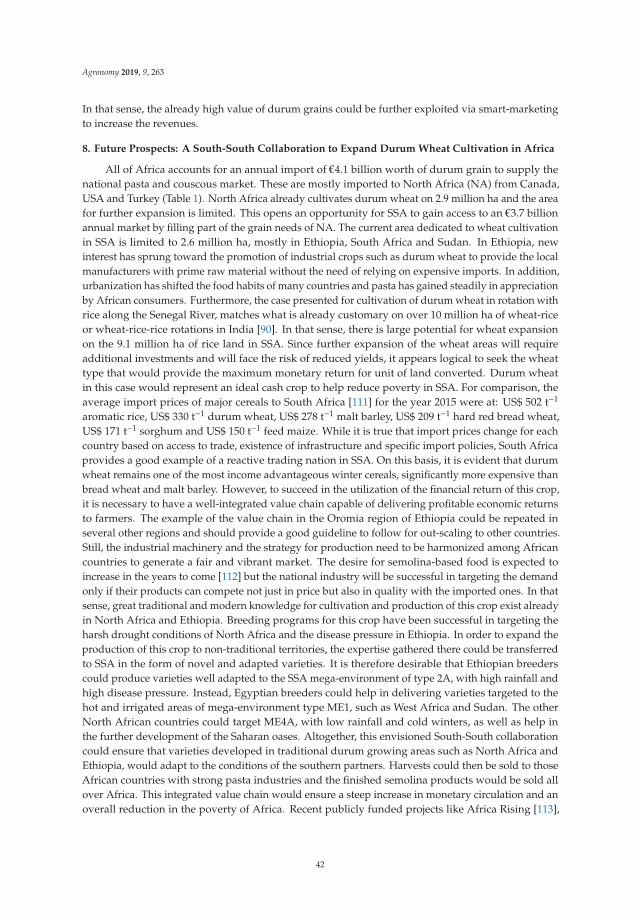
Agronomy 2019, 9, 263
In that sense, the already high value of durum grains could be further exploited via smart-marketingto increase the revenues.
8. Future Prospects: A South-South Collaboration to Expand Durum Wheat Cultivation in Africa
All of Africa accounts for an annual import of €4.1 billion worth of durum grain to supply thenational pasta and couscous market. These are mostly imported to North Africa (NA) from Canada,USA and Turkey (Table 1). North Africa already cultivates durum wheat on 2.9 million ha and the areafor further expansion is limited. This opens an opportunity for SSA to gain access to an €3.7 billionannual market by filling part of the grain needs of NA. The current area dedicated to wheat cultivationin SSA is limited to 2.6 million ha, mostly in Ethiopia, South Africa and Sudan. In Ethiopia, newinterest has sprung toward the promotion of industrial crops such as durum wheat to provide the localmanufacturers with prime raw material without the need of relying on expensive imports. In addition,urbanization has shifted the food habits of many countries and pasta has gained steadily in appreciationby African consumers. Furthermore, the case presented for cultivation of durum wheat in rotation withrice along the Senegal River, matches what is already customary on over 10 million ha of wheat-riceor wheat-rice-rice rotations in India [90]. In that sense, there is large potential for wheat expansionon the 9.1 million ha of rice land in SSA. Since further expansion of the wheat areas will requireadditional investments and will face the risk of reduced yields, it appears logical to seek the wheattype that would provide the maximum monetary return for unit of land converted. Durum wheatin this case would represent an ideal cash crop to help reduce poverty in SSA. For comparison, theaverage import prices of major cereals to South Africa [111] for the year 2015 were at: US$ 502 t−1
aromatic rice, US$ 330 t−1 durum wheat, US$ 278 t−1 malt barley, US$ 209 t−1 hard red bread wheat,US$ 171 t−1 sorghum and US$ 150 t−1 feed maize. While it is true that import prices change for eachcountry based on access to trade, existence of infrastructure and specific import policies, South Africaprovides a good example of a reactive trading nation in SSA. On this basis, it is evident that durumwheat remains one of the most income advantageous winter cereals, significantly more expensive thanbread wheat and malt barley. However, to succeed in the utilization of the financial return of this crop,it is necessary to have a well-integrated value chain capable of delivering profitable economic returnsto farmers. The example of the value chain in the Oromia region of Ethiopia could be repeated inseveral other regions and should provide a good guideline to follow for out-scaling to other countries.Still, the industrial machinery and the strategy for production need to be harmonized among Africancountries to generate a fair and vibrant market. The desire for semolina-based food is expected toincrease in the years to come [112] but the national industry will be successful in targeting the demandonly if their products can compete not just in price but also in quality with the imported ones. In thatsense, great traditional and modern knowledge for cultivation and production of this crop exist alreadyin North Africa and Ethiopia. Breeding programs for this crop have been successful in targeting theharsh drought conditions of North Africa and the disease pressure in Ethiopia. In order to expand theproduction of this crop to non-traditional territories, the expertise gathered there could be transferredto SSA in the form of novel and adapted varieties. It is therefore desirable that Ethiopian breederscould produce varieties well adapted to the SSA mega-environment of type 2A, with high rainfall andhigh disease pressure. Instead, Egyptian breeders could help in delivering varieties targeted to thehot and irrigated areas of mega-environment type ME1, such as West Africa and Sudan. The otherNorth African countries could target ME4A, with low rainfall and cold winters, as well as help inthe further development of the Saharan oases. Altogether, this envisioned South-South collaborationcould ensure that varieties developed in traditional durum growing areas such as North Africa andEthiopia, would adapt to the conditions of the southern partners. Harvests could then be sold to thoseAfrican countries with strong pasta industries and the finished semolina products would be sold allover Africa. This integrated value chain would ensure a steep increase in monetary circulation and anoverall reduction in the poverty of Africa. Recent publicly funded projects like Africa Rising [113],
42
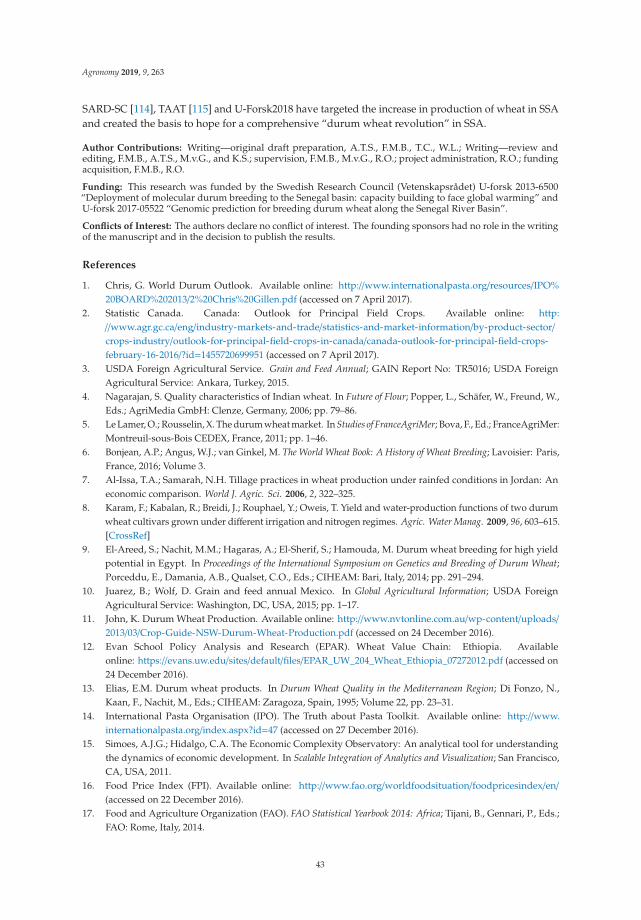
Agronomy 2019, 9, 263
SARD-SC [114], TAAT [115] and U-Forsk2018 have targeted the increase in production of wheat in SSAand created the basis to hope for a comprehensive “durum wheat revolution” in SSA.
Author Contributions: Writing—original draft preparation, A.T.S., F.M.B., T.C., W.L.; Writing—review andediting, F.M.B., A.T.S., M.v.G., and K.S.; supervision, F.M.B., M.v.G., R.O.; project administration, R.O.; fundingacquisition, F.M.B., R.O.
Funding: This research was funded by the Swedish Research Council (Vetenskapsrådet) U-forsk 2013-6500“Deployment of molecular durum breeding to the Senegal basin: capacity building to face global warming” andU-forsk 2017-05522 “Genomic prediction for breeding durum wheat along the Senegal River Basin”.
Conflicts of Interest: The authors declare no conflict of interest. The founding sponsors had no role in the writingof the manuscript and in the decision to publish the results.
References
1. Chris, G. World Durum Outlook. Available online: http://www.internationalpasta.org/resources/IPO%20BOARD%202013/2%20Chris%20Gillen.pdf (accessed on 7 April 2017).
2. Statistic Canada. Canada: Outlook for Principal Field Crops. Available online: http://www.agr.gc.ca/eng/industry-markets-and-trade/statistics-and-market-information/by-product-sector/crops-industry/outlook-for-principal-field-crops-in-canada/canada-outlook-for-principal-field-crops-february-16-2016/?id=1455720699951 (accessed on 7 April 2017).
3. USDA Foreign Agricultural Service. Grain and Feed Annual; GAIN Report No: TR5016; USDA ForeignAgricultural Service: Ankara, Turkey, 2015.
4. Nagarajan, S. Quality characteristics of Indian wheat. In Future of Flour; Popper, L., Schäfer, W., Freund, W.,Eds.; AgriMedia GmbH: Clenze, Germany, 2006; pp. 79–86.
5. Le Lamer, O.; Rousselin, X. The durum wheat market. In Studies of FranceAgriMer; Bova, F., Ed.; FranceAgriMer:Montreuil-sous-Bois CEDEX, France, 2011; pp. 1–46.
6. Bonjean, A.P.; Angus, W.J.; van Ginkel, M. The World Wheat Book: A History of Wheat Breeding; Lavoisier: Paris,France, 2016; Volume 3.
7. Al-Issa, T.A.; Samarah, N.H. Tillage practices in wheat production under rainfed conditions in Jordan: Aneconomic comparison. World J. Agric. Sci. 2006, 2, 322–325.
8. Karam, F.; Kabalan, R.; Breidi, J.; Rouphael, Y.; Oweis, T. Yield and water-production functions of two durumwheat cultivars grown under different irrigation and nitrogen regimes. Agric. Water Manag. 2009, 96, 603–615.[CrossRef]
9. El-Areed, S.; Nachit, M.M.; Hagaras, A.; El-Sherif, S.; Hamouda, M. Durum wheat breeding for high yieldpotential in Egypt. In Proceedings of the International Symposium on Genetics and Breeding of Durum Wheat;Porceddu, E., Damania, A.B., Qualset, C.O., Eds.; CIHEAM: Bari, Italy, 2014; pp. 291–294.
10. Juarez, B.; Wolf, D. Grain and feed annual Mexico. In Global Agricultural Information; USDA ForeignAgricultural Service: Washington, DC, USA, 2015; pp. 1–17.
11. John, K. Durum Wheat Production. Available online: http://www.nvtonline.com.au/wp-content/uploads/2013/03/Crop-Guide-NSW-Durum-Wheat-Production.pdf (accessed on 24 December 2016).
12. Evan School Policy Analysis and Research (EPAR). Wheat Value Chain: Ethiopia. Availableonline: https://evans.uw.edu/sites/default/files/EPAR_UW_204_Wheat_Ethiopia_07272012.pdf (accessed on24 December 2016).
13. Elias, E.M. Durum wheat products. In Durum Wheat Quality in the Mediterranean Region; Di Fonzo, N.,Kaan, F., Nachit, M., Eds.; CIHEAM: Zaragoza, Spain, 1995; Volume 22, pp. 23–31.
14. International Pasta Organisation (IPO). The Truth about Pasta Toolkit. Available online: http://www.internationalpasta.org/index.aspx?id=47 (accessed on 27 December 2016).
15. Simoes, A.J.G.; Hidalgo, C.A. The Economic Complexity Observatory: An analytical tool for understandingthe dynamics of economic development. In Scalable Integration of Analytics and Visualization; San Francisco,CA, USA, 2011.
16. Food Price Index (FPI). Available online: http://www.fao.org/worldfoodsituation/foodpricesindex/en/(accessed on 22 December 2016).
17. Food and Agriculture Organization (FAO). FAO Statistical Yearbook 2014: Africa; Tijani, B., Gennari, P., Eds.;FAO: Rome, Italy, 2014.
43
Agronomy 2019, 9, 263
18. Food and Agriculture Organization (FAO). Eritrea: Country Report. In Proceedings of the FAO InternationalTechnical Conference on Plant Genetics, Leipzig, Germany, 17–23 June 1996.
19. Bill and Melinda Gates Foundation (BMGF). Multi Crop Value Chain Phase II: Wheat Ethiopia. Availableonline: https://agriknowledge.org/files/8k71nh141 (accessed on 10 January 2017).
20. What Farming in Kenya. Available online: https://informationcradle.com/kenya/wheat-in-kenya/ (accessedon 15 May 2019).
21. Saunders, D.A.; Hettel, G.P. Wheat in Heat-Stressed Environments: Irrigated, Dry Areas and Rice-Wheat FarmingSystems; UNDP; ARC; BARI; CIMMYT: Mexico, 1993; ISBN 968-6127-87-9.
22. Mistretta, G. Angola: Alcune caratteristiche del mercato della pasta. Ricadute sul Prodotto Italiano.Ambassador letter on 06 November 2013 to InfoMercatiEsteri.it. Available online: http://www.infomercatiesteri.it/public/images/paesi/4/files/PASTA%20di%20grano.doc (accessed on 15 May 2019).
23. Negassa, A.; Shiferaw, B.; Koo, J.; Sonder, K.; Smale, M.; Braun, H.J.; Gbegbelegbe, S.; Guo, Z.; Hodson, D.;Wood, S.; et al. The Potential for Wheat Production in Africa: Analysis of Biophysical Suitability and EconomicProfitability; CIMMYT: DF, Mexico, 2013.
24. Ssekitoleko, G.W.; Vogel, W.O. Wheat marketing and pricing policy in Uganda: A critical assessment.In Proceedings of Theninth Regional Wheat Workshop for Eastern, Central and Southern Africa, Addis Abeba, Ethiopia,2–6 October 1995; Tanner, D.G., Payne, T.S., Abdalla, O.S., Eds.; CIMMYT: Mexico City, Mexico, 1995.
25. United States Agency for International Development (USAID). Staple Foods Value Chain Analysis: CountryReport Zambia; Chemonics International Inc.: Washington, DC, USA, 2009.
26. Kayoed-Anglade, S.; Aaron, R. Projet du Moulin Modern du Mali. Available online:https://www.afdb.org/fileadmin/uploads/afdb/Documents/Environmental-and-Social-Assessments/Mali_-_Projet_du_moulin_moderne_du_Mali_-_R%c3%a9sum%c3%a9_PGES.pdf (accessed on 4 January 2017).
27. Factfish: Research Made Simple. Available online: www.factfish.com (accessed on 15 May 2019).28. Index Mundi. Available online: www.indexmundi.com (accessed on 15 May 2019).29. Hakan, O.; Willcox, G.; Graner, A.; Salamini, F.; Kilian, B. Geographic distribution and domestication of wild
emmer wheat (Triticum dicoccoides). Genet. Resour. Crop Evol. 2010, 58, 11–53.30. Benbelkacem, A.; Khaldounl, A.; Djenadi, C. The history of wheat breeding in Algeria. In World Wheat Book:
A History of Wheat Breeding; Bonjean, A.P., Angus, W.J., van Ginkel, M., Eds.; Lavoisier: Paris, France, 2016;Volume 3, pp. 477–495.
31. National Research Council. Lost Crops of Africa: Volume I: Grains; The National Academies Press: Washington,DC, USA, 1996.
32. Luo, M.C.; Yang, Z.L.; You, F.M. The structure of wild and domesticated emmer wheat populations, geneflow between them and the site of emmer domestication. Theor. Appl. Genet. 2007, 114, 947–959. [CrossRef]
33. Kabbaj, H.; Sall, A.T.; Al-Abdallat, A.; Geleta, M.; Amri, A.; Filali-Maltouf, A.; Belkadi, B.; Ortiz, R.; Bassi, F.M.Genetic Diversity within a Global Panel of Durum Wheat (Triticum durum) Landraces and Modern GermplasmReveals the History of Alleles Exchange. Front. Plant Sci. 2017, 8, 1277. [CrossRef] [PubMed]
34. Mengistu, D.K.; Kirosa, Y.A.Y.; Pè, M.E. Phenotypic diversity in Ethiopian durum wheat (Triticum turgidumvar. durum) landraces. Crop J. 2015, 3, 190–199. [CrossRef]
35. Vavilov, N.I. The origin, variation, immunity and breeding of cultivated plants, trans from the Russian byStarr Chester, K., Waltham, Mass.: Chronica Botanica. Science 1951, 115, 364.
36. Pecetti, L.; Annicchiarico, P.; Damania, A.B. Biodiversity in a germplasm collection of durum wheat. Euphytica1992, 60, 229–238.
37. Ficco, D.B.M.; Mastrangelo, A.M.; Trono, D.; Borrelli, G.M.; De Vita, P.; Fares, C.; Beleggia, R.; Platani, C.;Papa, R. The colors of durum wheat: A review. Crop Pasture Sci. 2014, 65, 1–15. [CrossRef]
38. Mass, F.B.; Paterson, F.L.; Foster, J.E.; Ohm, H.W. Expression and inheritance of resistance of ELS 6404-160durum wheat to Hessian Fly. Crop Sci. 1989, 29, 23–28. [CrossRef]
39. Belay, G.; Merker, A.; Tesfaye, T. Cytogenetic studies in Ethiopian landraces of tetraploid wheat(Tritium turgidum L.), spike morphology and ploidy level and karyomorphology. Hereditas 1994, 121,45–52. [CrossRef]
40. Bekele, E. Analysis of regional patterns of phenotypic diversity in the Ethiopian tetraploid and hexaploidwheats. Hereditas 1984, 100, 131–154. [CrossRef]
41. Negassa, M. Estimates of phenotypic diversity and breeding potential of Ethiopian wheats. Hereditas 1986,104, 41–48. [CrossRef]
44
Agronomy 2019, 9, 263
42. Tesemma, T.; Belay, G. Aspects of Ethiopian tetraploid wheats with emphasis on durum wheat genetics andbreeding research. In Wheat Research in Ethiopia: A Historical Perspective; Hailu, G., Tanner, D.G., Mengistu, H.,Eds.; CIMMYT: El Batan, Mexico, 1991; pp. 47–72.
43. Belay, G.; Tesfaye, T.; Becker, H.C.; Merker, A. Variation and interrelationships of agronomic traits in Ethiopiantetraploid wheat landraces. Euphytica 1993, 71, 181–188. [CrossRef]
44. Bechere, E.; Belay, G.; Mitiku, D.; Merker, A. Phenotypic diversity of tetraploid wheat landraces from northernand north-central regions of Ethiopia. Hereditas 1996, 124, 165–172. [CrossRef]
45. Tsegaye, S.; Tesemma, T.; Belay, G. Relationships among tetraploid wheat (Triticum turgidum L.) landracepopulations revealed by isozyme markers and agronomic traits. Theor. Appl. Genet. 1996, 93, 600–605.[CrossRef]
46. Eticha, F.; Bekele, E.; Belay, G.; Börner, A. Phenotypic diversity in tetraploid wheats collected from Bale andWello regions of Ethiopia. Plant Genet. Resour. 2005, 3, 35–43. [CrossRef]
47. Mengistu, D.K.; Kidane, Y.G.; Catellani, M.; Frascaroli, E.; Fadda, C.; Pe, M.E.; Dell’Acqua, M. High-densitymolecular characterization and association mapping in Ethiopian durum wheat landraces reveals highdiversity and potential for wheat breeding. Plant Biotechnol. J. 2016, 14, 1800–1812. [CrossRef] [PubMed]
48. Mengistu, D.K.; Kidane, Y.G.; Fadda, C.; Pè, M.E. Genetic diversity in Ethiopian Durum Wheat(Triticum turgidum var durum) inferred from phenotypic variations. Plant Genet. Resour. 2016, 16, 39–49.[CrossRef]
49. Tsegaye, B.; Berg, T. Utilization of durum wheat landraces in East Shewa, central Ethiopia: Are home uses anincentive for on-farm conservation? Agric. Hum. Values 2007, 24, 219–230. [CrossRef]
50. Fassil, K.; Sehaye, Y.T.; McNeilly, T. Diversity of durum wheat (Triticum durum Desf.) at in situ conservationsites in North Shewa and Bale, Ethiopia. J. Agric. Sci. 2001, 136, 383–392.
51. Israel, O.K.; Bhandari, B.; Guilherme de Azevedo, S.; Natarajan, K.; Gezu, G.; Gashu, S.; Desalegn, T.Global Study on CBM and Empowerment, Ethiopia Exchange Report; Wageningen University: Wageningen,The Netherlands, 2010; p. 42.
52. Tesemma, T.; Belay, G.; Worede, M. Morphological diversity in tetraploid wheat landrace populations fromthe central highlands of Ethiopia. Hereditas 1991, 114, 171–176.
53. Tolera, A.; Tsegaye, B.; Berg, T. Effects of variety, cropping year, location and fertilizer application on nutritivevalue of durum wheat straw. J. Anim. Physiol. Anim. Nutr. 2007, 92, 121–130. [CrossRef]
54. Bezabeh, E.; Haregewoin, T.; Giorgis, D.H.; Daniel, F.; Belay, B. Change and growth rate analysis in area,yield and production of wheat in Ethiopia. Res. J. Agric. Environ. Manag. 2015, 4, 189–191.
55. Bassi, F.M.; Chiari, T.; Verma, R.P.S.; Kumar, S. Crop Diversification: The ‘Old’ Weapon in theHands of Ethiopian Farmers, Borlaug Global Rust Initiative. Available online: http://www.globalrust.org/blog/crop-diversification-%E2%80%98old%E2%80%99-weapon-hands-ethiopian-farmers (accessed on10 January 2017).
56. Global Milling. Ethiopia Battles Wheat Rust Disease Outbreak in Critical Wheat-Growing Regions. Availableonline: http://globalmilling.com/ethiopia-battles-wheat-rust-disease-outbreak-in-critical-wheat-growing-regions/ (accessed on 27 December 2016).
57. Tesemma, T.; Mohammed, J. Review of wheat breeding in Ethiopia. Ethiopian J. Agric. Sci. 1982, 1, 11–24.58. Nastasi, V. Wheat Production in Ethiopia; Information Bulletin on the Near East Wheat and Barley Improvement
and Production Project; FAO: Rome, Italy, 1964; Volume 1, pp. 13–24.59. Tesemma, T. Durum wheat breeding in Ethiopia. In Fifth Regional Wheat Workshop for Eastern, Central and
Southern Africa and the Indian Ocean; van Ginkel, M., Tanner, D.G., Eds.; CIMMYT: El Batan, Mexico, 1988;pp. 18–22.
60. Consultative Group on International Agricultural Research (CGIAR). Virulent new strains of Ug99 stem rust,a deadly wheat pathogen. Science Daily, 28 May 2010.
61. Ministry of Agriculture (MoA). Plant Variety Release, Protection and Seed Quality Control Directorate.Crop Var. Regist. 2013, 16, 301.
62. Leta, G.; Belay, G.; Walelign, W. Nitrogen fertilization effects on grain quality of durum wheat(Triticum turgidum L. var. durum) varieties in central Ethiopia. Agric. Sci. 2013, 4, 123–130.
63. Mekuria, T.; Wasihun, L.; Shitaye, H.; Asenafi, G. Durum wheat (Triticum durum Desf) Variety “Utuba”Performance in Ethiopia. Agric. Res. Technol. Open Access J. 2018, 18, 556063. [CrossRef]
45
Agronomy 2019, 9, 263
64. De Groote, H.; Gitonga, Z.; Mugo, S.; Walker, T.S. Assessing the effectiveness of maize and wheat improvementfrom the perspectives of varietal output adoption in east and southern Africa. In Crop Improvement, Adoptionand Impact of Improved Varieties in Food Crops in Sub Saharan Africa; Walker, T.S., Alwang, J., Eds.; CABI: Egham,UK, 2015; pp. 207–227.
65. Dawit, A. Farmer-Based Seed Multiplication in the Ethiopian Seed System: Approaches, Priorities and Performance;FAC Working Paper 36; Future Agricultures Consortium: Brighton, UK, 2011.
66. Bishaw, Z. Wheat and Barley Seed Systems in Ethiopia and Syria. Ph.D. Thesis, Wageningen University,Wageningen, The Netherlands, 2004; pp. 1–401.
67. Joshi, A.K.; Azab, M.; Mosaad, M.; Braun, H.J. Delivering rust resistant wheat to farmers: A step towardsincreased food security. Euphytica 2011, 179, 187–196. [CrossRef]
68. Ojiewo, C.O.; Kugbei, S.; Bishaw, Z.; Rubyogo, J.C. Community seed production. FAO & ICRISAT: 2015.In Workshop Proceedings, 9–11 December 2013; FAO: Rome, Italy; ICRISAT: Addis Ababa, Ethiopia, 2013; 176p.
69. Bishaw, Z.; Niane, A.A. Are farmer-based seed enterprises profitable and sustainable? Experiences of VBSEsfrom Afghanistan. In Proceedings of the Community Seed Production, Rome, Italy, 9–11 December 2013;FAO: Rome, Italy; ICRISAT: Addis Ababa, Ethiopia, 2013; pp. 55–64.
70. Board on Science and Technology for International Development (BOSTID). Lost Crops of Africa, Vol. I Grains;National Academic Press: Washington, DC, USA, 1996.
71. Central Statistical Agency (CSA). Agricultural Sample Survey 2013/2014, Statistical Bulletin No 536; FederalDemocratic Republic of Ethiopia Central Statistical Agency: Addis Ababa, Ethiopia, 2014; pp. 1–121.
72. D’Andrea, C.A.; Haile, M. Traditional emmer processing in highland Ethiopia. J. Ethnobiol. 2002, 22, 179–217.73. Cooper, R. Re-discovering ancient wheat varieties as functional foods. J. Tradit. Complement. Med. 2015, 5,
138–143. [CrossRef] [PubMed]74. Stallknecht, G.F.; Gilbertson, K.M.; Romey, J.E. Alternative wheat cereals as good grains: Einkorn, emmer,
spelt, kamut and triticale. In Progress in New Crops; Janick, J., Ed.; ASHS Press: Alexandria, VA, USA, 1997;pp. 156–170.
75. Negassa, M. Possible new genes for resistance to powdery mildew, septoria glume blotch and leaf rust ofwheat. Plant Breed. 1987, 98, 37–46. [CrossRef]
76. Damania, A.B.; Hakim, S.; Moualla, M.Y. Evaluation of variation in T. dicoccum for wheat improvement instress environment. Hereditas 1992, 116, 163–166. [CrossRef]
77. Robinson, J.; Skovmand, B. Evaluation of emmer wheat and other Triticeae for resistance to Russian wheataphid. Genet. Resour. Crop Evol. 1992, 39, 159–163.
78. Naod, B.; Fininsa, C.; Badebo, A. Sources of stem rust resistance in Ethiopian tetraploid wheat accessions.Afr. Crop Sci. J. 2007, 15, 51–57.
79. Oliver, R.E.; Cai, X.; Friesen, T.L.; Halley, S.; Stack, R.W.; Xu, S.S. Evaluation of Fusarium head blightresistance in tetraploid wheat (Triticum turgidum L.). Crop Sci. 2008, 48, 213–222. [CrossRef]
80. Ethiopian Revenues and Customs Authority (ERCA). 2014. Available online: http://www.erca.gov.et/index.php (accessed on 5 January 2017).
81. Geleto, T.; Tanner, D.G.; Mamo, T.; Gebeyehu, G. Response of rainfed bread and durum wheat to source, leveland timing of nitrogen fertilizer on two Ethiopian vertisols: N uptake, recovery and efficiency. Fertil. Res.1996, 44, 195–204. [CrossRef]
82. Biggeri, M.; Ciani, F.; Ferrannini, A. Aid effectiveness and multilevel governance: The case of a value chaindevelopment project in rural Ethiopia. Eur. J. Dev. Res. 2016, 29, 843–865. [CrossRef]
83. Ministry of Agriculture (MOA). Plant Variety Release, Protection and Seed Quality Control Directorate.Crop Var. Regist. 2015, 17, 330.
84. Biggeri, M.; Burchi, F.; Ciani, F.; Herrmann, R. Linking small-scale farmers to the durum value chain inEthiopia: Assessing the effects on production and wellbeing. Food Policy 2018, 79, 77–91. [CrossRef]
85. Falaki, A.M.; Mohammed, I.B. Performance of some durum wheat varieties at Kadawa, Kano state of Nigeria.Bayero J. Pure Appl. Sci. 2011, 4, 48–51. [CrossRef]
86. Agriculture in Mauritania. Encyclopedia of the Nations—Information about Countries of the World, UnitedNations and World Leaders. Available online: http://www.nationsencyclopedia.com/Africa/Mauritania-AGRICULTURE.html (accessed on 15 December 2016).
46
Agronomy 2019, 9, 263
87. Sall, A.T.; Kabbaj, H.; Cisse, M.; Gueye, H.; Ndoye, I.; Maltouf, A.F.; El-Mourid, M.; Ortiz, R.; Bassi, F.M.Heat Tolerance of Durum Wheat (Tritcum durum Desf.) Elite Germplasm Tested along the Senegal River.J. Agric. Sci. 2018, 10, 217–233. [CrossRef]
88. Food and Agriculture Organization (FAO). Senegal: Irrigation Market Brief ; Report No. 26; FAO: Rome, Italy,January 2016.
89. Manikowski, S.; Strapasson, A. Sustainability Assessment of Large Irrigation Dams in Senegal: A Cost-BenefitAnalysis for the Senegal River Valley. Front. Environ. Sci. 2016, 4, 18. [CrossRef]
90. Mahajan, A.; Gupta, R.D. Integrated Nutrient Management (INM) in a Sustainable Rice-Wheat Cropping System;Springer: Heidelberg, Germany, 2009; p. 268.
91. Club du Sahel (CILSS). Development of Irrigated Agriculture in Upper Volta: Proposals for a Second Programme1980-85; Permanent Interstate Committee for Drought Control in the Sahel: Niamey, Republic of Niger, 1979.
92. Chabrolin, R. Programme pour les Recherches Concernant le blé au Mali; Fonds IRD: B22431. 1967.93. USDA Foreign Agricultural Service. 2018 Grain and Feed Annual Nigeria-USDA GAIN Reports. Available
online: https://gain.fas.usda.gov/Recent%20GAIN%20Publications/Grain%20and%20Feed%20Annual_Lagos_Nigeria_4-12-2018.pdf (accessed on 5 March 2019).
94. Stansbury, C.D.; Pretorius, Z.A. Modelling the potential distribution of Karnal bunt of wheat in South Africa.S. Afr. J. Plant Soil 2001, 18, 159–168. [CrossRef]
95. Singh, R.P.; Hodson, D.P.; Huerta-Espino, J.; Jin, Y.; Bhavani, S.; Njau, P.; Herrera-Foessel, S.; Singh, P.K.;Singh, S.; Govindan, V. The emergence of Ug99 races of the stem rust fungus is a threat to World wheatproduction. Annu. Rev. Phytopathol. 2011, 49, 465–481. [CrossRef]
96. Duveiller, E.; Mezzalama, M. Karnal Bunt: Screening for Resistance and Distributing KB Free Seed; CIMMYT:El Batan, Mexico, 2009.
97. Letta, T.; Olivera, P.; Maccaferri, M.; Jin, Y.; Ammar, K.; Badebo, A.; Noli, E.; Crossa, J.; Tuberosa, R.Genome-wide search of stem rust resistance loci at the seedling stage in durum wheat. Plant Genome 2014, 7,1–13. [CrossRef]
98. Ravelomamtsoa, S.H.; Randrianaivoarivony, J.M.; Ramalanjaona, V.L. Overview of wheat in Madagascar.In Proceedings of the Wheat for Food Security in Africa, Addis-Ababa, Ethiopia, 8–12 October 2012.
99. Rajaram, S.; van Ginkel, M.; Fischer, R.A. CIMMYT’s wheat breeding mega-environments (ME). In Proceedingsof the 8th International Wheat Genetics Symposium, Beijing, China, 19–24 July 1994.
100. Zaharieva, M.; Bonjean, A.; Monneveux, P. Alert: Saharan Oases wheat genetic resources in danger. In WorldWheat Book: A History of Wheat Breeding; Bonjean, A.P., Angus, W.J., van Ginkel, M., Eds.; Lavoisier: Paris,France, 2016; Volume 3, pp. 543–588.
101. Saharan Development. Agriculture and Farming. Available online: http://www.sahara-developpement.com/Western-Sahara/AgricultureEtElevage--117.aspx (accessed on 26 December 2016).
102. Food and Agriculture Organization (FAO). La Mauritanie et la FAO: Partenariat pour Améliorer la Résilienceet Renforcer la Sécurité Alimentaire et Nutritionnelle. Available online: http://www.fao.org/3/a-au199f.pdf(accessed on 25 December 2016).
103. Food and Agriculture Organization (FAO)-ISESCO. In Proceedings of the International Workshop on GloballyImportant Agriculture Heritage Systems (GIAHS) for the Islamic Countries, Rome, Italy, 4–5 November 2014.
104. Houichiti, R.; Bissati, S.; Bouammar, B. Oasis agriculture and food insecurity in Algeria: The case of Ghardaiaregion. Pensee J. 2014, 76, 1–7.
105. Ait, H. Systemes de production et stratégies des agriculteurs dans les oasis de la region d’Errachidia auMaroc. New Medit. 2003, 2, 37–43.
106. El Abbass, S. Systèmes d’irrigation dans les oasis de Mauritanie: Problèmes de pompage et tentatives deréalimentation des nappes phréatiques. In Proceedings of the Journées Internationales sur l’Agriculture et laGastronomie des Oasis, Elche, Spain, 14–15 October 2009.
107. Merouche, A.; Debaeke, P.; Messahel, M.; Kelkouli, M. Response of Durum wheat varieties to water insemi-arid Algeria. Af. J. Agric. Res. 2014, 9, 2880–2893.
108. Zaharieva, M.; Bonjean, A.; Monneveux, P. Saharan wheats: Before they disappear. Genet. Resour. Crop Evol.2014, 61, 1065–1084. [CrossRef]
109. Benlaghlid, M.; Bouattoura, N.; Monneveux, P.; Borries, C. Etude de la diversité génétique et de la physiologiede l’adaptation au milieu. Options Méditerranéennes 1990, 11, 171–194.
47
Agronomy 2019, 9, 263
110. Constantinidou, K.; Zittis, G.; Hadjinicolaou, P. Variations in the Simulation of Climate Change ImpactIndices due to Different Land Surface Schemes over the Mediterranean, Middle East and Northern Africa.Atmosphere 2019, 10, 26. [CrossRef]
111. South African Revenue Service. Available online: www.sagis.org.za/sars.html (accessed on 7 February 2017).112. William, A.R. Market Trends Category Analysis: A Look into the Pasta. Available online: www.preparedfoods.
com/articles/103693-market-trends-category-analysis-a-look-into-the-pasta (accessed on 5 January 2017).113. Karaimu, P. Africa Research in Sustainable Intensification for the Next Generation. Available online:
https://africa-rising.net/ (accessed on 15 May 2019).114. Hauser, J.F. Support to Agricultural Research for Development of Strategic Crops in Africa. Available online:
http://sard-sc.org/ (accessed on 15 May 2019).115. IITA. TAAT Launch Signifies New Day for African Agriculture. Available online: https://www.iita.org/news-
item/taat-launch-signifies-new-day-african-agriculture/ (accessed on 15 May 2019).
© 2019 by the authors. Licensee MDPI, Basel, Switzerland. This article is an open accessarticle distributed under the terms and conditions of the Creative Commons Attribution(CC BY) license (http://creativecommons.org/licenses/by/4.0/).
48
agronomy
Article
Loci Controlling Adaptation to Heat Stress Occurringat the Reproductive Stage in Durum Wheat
Khaoula El Hassouni 1,2, Bouchra Belkadi 2, Abdelkarim Filali-Maltouf 2,
Amadou Tidiane-Sall 1,3, Ayed Al-Abdallat 4, Miloudi Nachit 1,2 and Filippo M. Bassi 1,*
1 International Center for the Agricultural Research in Dry Area (ICARDA), Rabat 10000, Morocco2 Faculty of sciences, University of Mohammed V, Rabat 10000, Morocco3 Institut Sénégalais de Recherches Agricoles (ISRA), Saint-Louis 46024, Senegal4 Faculty of Agriculture, The University of Jordan, Amman 11942, Jordan* Correspondence: [email protected]; Tel.: +212614402717
Received: 27 June 2019; Accepted: 23 July 2019; Published: 30 July 2019
Abstract: Heat stress occurring during the reproductive stage of wheat has a detrimental effect onproductivity. A durum wheat core set was exposed to simulated terminal heat stress by applyingplastic tunnels at the time of flowering over two seasons. Mean grain yield was reduced by 54%compared to control conditions, and grain number was the most critical trait for tolerance to thisstress. The combined use of tolerance indices and grain yield identified five top performing elitelines: Kunmiki, Berghouata1, Margherita2, IDON37-141, and Ourgh. The core set was also subjectedto genome wide association study using 7652 polymorphic single nucleotide polymorphism (SNPs)markers. The most significant genomic regions were identified in association with spike fertilityand tolerance indices on chromosomes 1A, 5B, and 6B. Haplotype analysis on a set of 208 elite linesconfirmed that lines that carried the positive allele at all three quantitative trait loci (QTLs) had a yieldadvantage of 8% when field tested under daily temperatures above 31◦ C. Three of the QTLs weresuccessfully validated into Kompetitive Allele Specific PCR (KASP) markers and explained >10% ofthe phenotypic variation for an independent elite germplasm set. These genomic regions can now bereadily deployed via breeding to improve resilience to climate change and increase productivity inheat-stressed areas.
Keywords: heat stress; durum wheat; yield; tolerance; fertility; climate change; resilience
1. Introduction
Heat stress is a major environmental constraint to crop production. Terminal heat stress is definedas a rise in temperature that occurs between heading and maturity. When this stress matches with thereproductive phase of the wheat plant, it affects anthesis and grain filling, resulting in a severe reductionin yield [1]. High temperatures at the time of flowering cause floret sterility via pollen dehiscence [2],decrease photosynthetic capacity by drying the green tissues, and reduce starch biosynthesis [1,3].These in turn result in a negative effect on grain number and weight [4–7]. The optimum growingtemperature for wheat during pollination and grain filling phases is 21 ◦C [8,9], and for each increaseof 1 ◦C above it is estimated a decline of 4.1% to 6.4% in yield [10]. Environmental temperatureshave been increasing over the last century and more frequent heat waves are predicted in the nextdecades [11–13]. Therefore, breeding for tolerance to chronic as well as short term heat stress is a majorobjective worldwide [14–19]. Breeding selection would benefit by a better understanding of traitsassociated with tolerance to high temperatures, as well as the identification of the genomic regionscontrolling these traits.
In wheat, a large number of quantitative trait loci (QTLs) has been identified under heat stressvia linkage analysis and genome-wide association study (GWAS) for yield, yield related traits,
Agronomy 2019, 9, 414; doi:10.3390/agronomy9080414 www.mdpi.com/journal/agronomy49
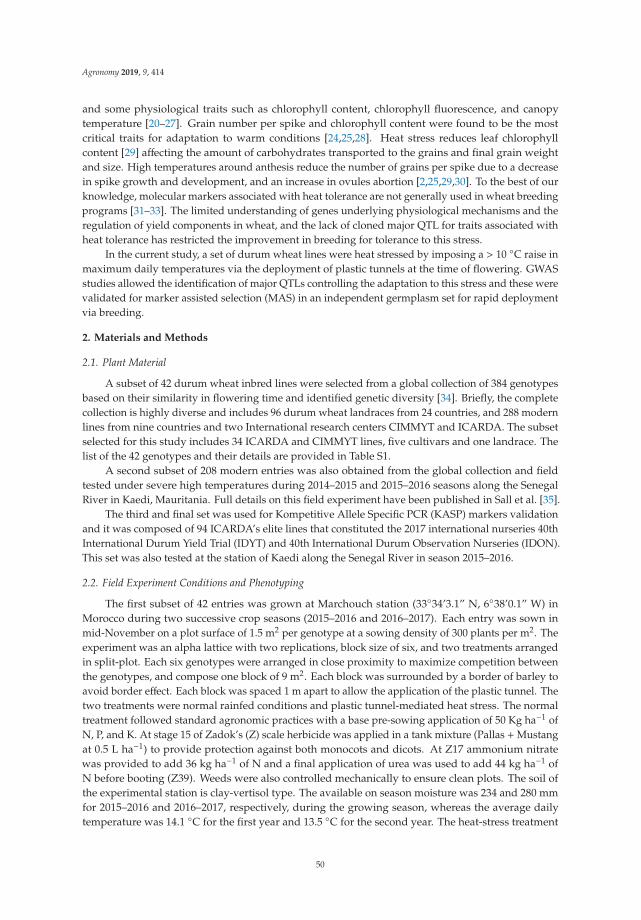
Agronomy 2019, 9, 414
and some physiological traits such as chlorophyll content, chlorophyll fluorescence, and canopytemperature [20–27]. Grain number per spike and chlorophyll content were found to be the mostcritical traits for adaptation to warm conditions [24,25,28]. Heat stress reduces leaf chlorophyllcontent [29] affecting the amount of carbohydrates transported to the grains and final grain weightand size. High temperatures around anthesis reduce the number of grains per spike due to a decreasein spike growth and development, and an increase in ovules abortion [2,25,29,30]. To the best of ourknowledge, molecular markers associated with heat tolerance are not generally used in wheat breedingprograms [31–33]. The limited understanding of genes underlying physiological mechanisms and theregulation of yield components in wheat, and the lack of cloned major QTL for traits associated withheat tolerance has restricted the improvement in breeding for tolerance to this stress.
In the current study, a set of durum wheat lines were heat stressed by imposing a > 10 ◦C raise inmaximum daily temperatures via the deployment of plastic tunnels at the time of flowering. GWASstudies allowed the identification of major QTLs controlling the adaptation to this stress and these werevalidated for marker assisted selection (MAS) in an independent germplasm set for rapid deploymentvia breeding.
2. Materials and Methods
2.1. Plant Material
A subset of 42 durum wheat inbred lines were selected from a global collection of 384 genotypesbased on their similarity in flowering time and identified genetic diversity [34]. Briefly, the completecollection is highly diverse and includes 96 durum wheat landraces from 24 countries, and 288 modernlines from nine countries and two International research centers CIMMYT and ICARDA. The subsetselected for this study includes 34 ICARDA and CIMMYT lines, five cultivars and one landrace. Thelist of the 42 genotypes and their details are provided in Table S1.
A second subset of 208 modern entries was also obtained from the global collection and fieldtested under severe high temperatures during 2014–2015 and 2015–2016 seasons along the SenegalRiver in Kaedi, Mauritania. Full details on this field experiment have been published in Sall et al. [35].
The third and final set was used for Kompetitive Allele Specific PCR (KASP) markers validationand it was composed of 94 ICARDA’s elite lines that constituted the 2017 international nurseries 40thInternational Durum Yield Trial (IDYT) and 40th International Durum Observation Nurseries (IDON).This set was also tested at the station of Kaedi along the Senegal River in season 2015–2016.
2.2. Field Experiment Conditions and Phenotyping
The first subset of 42 entries was grown at Marchouch station (33◦34’3.1” N, 6◦38’0.1” W) inMorocco during two successive crop seasons (2015–2016 and 2016–2017). Each entry was sown inmid-November on a plot surface of 1.5 m2 per genotype at a sowing density of 300 plants per m2. Theexperiment was an alpha lattice with two replications, block size of six, and two treatments arrangedin split-plot. Each six genotypes were arranged in close proximity to maximize competition betweenthe genotypes, and compose one block of 9 m2. Each block was surrounded by a border of barley toavoid border effect. Each block was spaced 1 m apart to allow the application of the plastic tunnel. Thetwo treatments were normal rainfed conditions and plastic tunnel-mediated heat stress. The normaltreatment followed standard agronomic practices with a base pre-sowing application of 50 Kg ha−1 ofN, P, and K. At stage 15 of Zadok’s (Z) scale herbicide was applied in a tank mixture (Pallas +Mustangat 0.5 L ha−1) to provide protection against both monocots and dicots. At Z17 ammonium nitratewas provided to add 36 kg ha−1 of N and a final application of urea was used to add 44 kg ha−1 ofN before booting (Z39). Weeds were also controlled mechanically to ensure clean plots. The soil ofthe experimental station is clay-vertisol type. The available on season moisture was 234 and 280 mmfor 2015–2016 and 2016–2017, respectively, during the growing season, whereas the average dailytemperature was 14.1 ◦C for the first year and 13.5 ◦C for the second year. The heat-stress treatment
50
Agronomy 2019, 9, 414
followed the same agronomic practices, with the difference that at the time of booting (Z45) a 10 m2
and 1.5 m high plastic tunnel was placed over each block (Figure 1) and left there until early doughstage (Z83). An electronic thermometer (temperature data logger) was placed in the middle of eachblock (normal and heat stressed) to reveal that the temperatures were up to 16◦ C higher inside theplastic tunnels, to reach a maximum of 49 ◦C (Figure 1). Marchouch is a drought prone site, and norainfall occurred after Z45 in any of the two field seasons.
Figure 1. Mean temperature difference of 18 days over two seasons between the plastic tunnel-mediatedheat stress and normal field conditions between 8 a.m. and 8 p.m., and a picture of the plastic tunnel at9 a.m.
The following traits were recorded: days to heading (DTH) measured at the moment when theawns became visible, plant height (PH) measured from the ground to the top of the highest spikeexcluding the awns, and the number of fertile spikes per meter square (Spkm2) was counted in a0.25 m2 area. The whole plot was harvested by hand and the dry biomass (Biom) was weighed beforethreshing. Grain yield (GY) was weighed for each plot and expressed as kg ha−1. The weight of athousand kernels (TKW) was expressed in grams. The harvest index (HI) was calculated as the ratiobetween GY and Biom. The grain number per spike (GNSpk) was derived from dividing grain numberper meter square by Spkm2 as follows:
Grain number/m2 =Grain weight of the plot
1.5m2 × TKW1000
(1)
GNSpk =Grain number/m2
Spkm2 (2)
The second and third sets were field tested in Kaedi, Mauritania (16◦14” N; 13◦46” W) duringseason 2014–2015 and 2015–2016 where the temperature reached a maximum of 41 ◦C and an averagemaximum daily temperature of 34 ◦C throughout the season. The trial was carried out under augmenteddesign with a plot surface of 4.5 m2. Standard agronomic management practices were adopted. Fulldetails for this experiment are published elsewhere [35].
2.3. Data Analysis
A mixed linear model was run using the lme4 package [36] in R [37] to obtain best linear unbiasedestimates (BLUEs) of the normally distributed traits. For count traits (DTH, Spkm2, GNSpk), thegeneralized mixed linear model was used to get the BLUEs by Proc GLIMMIX in SAS. In both models,genotype, treatment, year, and replication were considered as fixed effects and block as random effect
51
Agronomy 2019, 9, 414
nested in treatment and year. Broad-sense heritability was calculated based on variance componentsfrom random model using the method suggested by DeLacy et al. [38]:
H2 =σ2g
σ2g + σ2GxTt + σ2GxY
y + σ2GxTxYty + σ2e
tyr
(3)
where: σ2G×T = genotype × treatment variance, σ2
G×Y = genotype × year variance, σ2G×Y×T = genotype ×
treatment × year variance, σ2e = residual variance, r is the number of replications per treatment, t is the
number of treatments, and y is the number of years.Box-and-whisker plots where constructed by ggplot2 package [39] using the BLUEs combined over
year per each treatment. The relationship between the target trait GY and yield components (GNSpk,TKW, Biom, HI) was studied using the Pearson correlation coefficient and the additive regressionmodel. The critical value of the correlation significance was determined at 0.30 for p < 0.05 and 0.39for p < 0.01 for 40 df using the corrplot package [40]. The additive model incorporates flexible forms(i.e., splines) of the functions to account for non-linear relationship contrary to linear regression modelestimated via ordinary least squares [41]. For the additive model, the effective degree of freedom termdetermines the nature of the relationship between the predictor and the response variables where EDF= 1 indicates linearity and EDF > 1 the non-linearity. The additive regression analysis was performedusing the mgcv package [42].
Two stress tolerance indices were calculated to identify the heat tolerant genotypes. The stresssusceptibility index (SSI) [43,44] was calculated as follows:
SSI =[1− (Ys)/(Yp)]
[1− (Ys)/(Yp)](4)
where Ys and Yp are yield values of the genotypes evaluated under heat stress and normal conditions,respectively, and Ys and Yp are the mean yields of the lines evaluated under heat stress and normalconditions, respectively.
The stress tolerance (TOL) [45] was calculated as follows:
TOL = Yp − Ys. (5)
The classInt package [46] was used to identify the possible number of class intervals of the indicesfor the frequency distribution of the subset.
The cut-off value for tolerant vs. susceptible genotypes for SSI was equal to 1, with lines havingSSI < 1 being stress tolerant. Regarding the TOL index, the smaller TOL values indicate the genotypeswith low yield depression and hence more tolerant. The experiment-wide TOL mean (1608 kg ha−1)was identified as the cut-off value for tolerant vs. susceptible. The emmeans package [47] based onANOVA model was used to discriminate among the grain yield means of haplotypes.
2.4. Genotyping and Marker-Trait Associations
Details of the genotyping step of the core set and panel have been previously discussed inKabbaj et al. [34] and Sall et al. [35]. Briefly, 7652 high-fidelity polymorphic single nucleotidepolymorphism (SNPs) were obtained, showing less than 1% missing data, minor allele frequency(MAF) higher than 5%, and heterozygosity less than 5%. The sequences of these markers werealigned with a cut-off of 98% identity to the durum wheat reference genome [48] (available at:http://www.interomics.eu/durum-wheat-genome), to reveal their physical position. The average lengthof the Axiom probe is of 75 bp, hence the 2% allowed miss-match was set to account for the existence of1 SNP within each sequence. A sub-set of 500 highly polymorphic SNPs were selected on the basis ofeven spread along the genome, and used to identify the existence of population sub-structure, whichrevealed the existence of 10 main sub-groups [34]. To avoid bias, these 500 markers were then removed
52
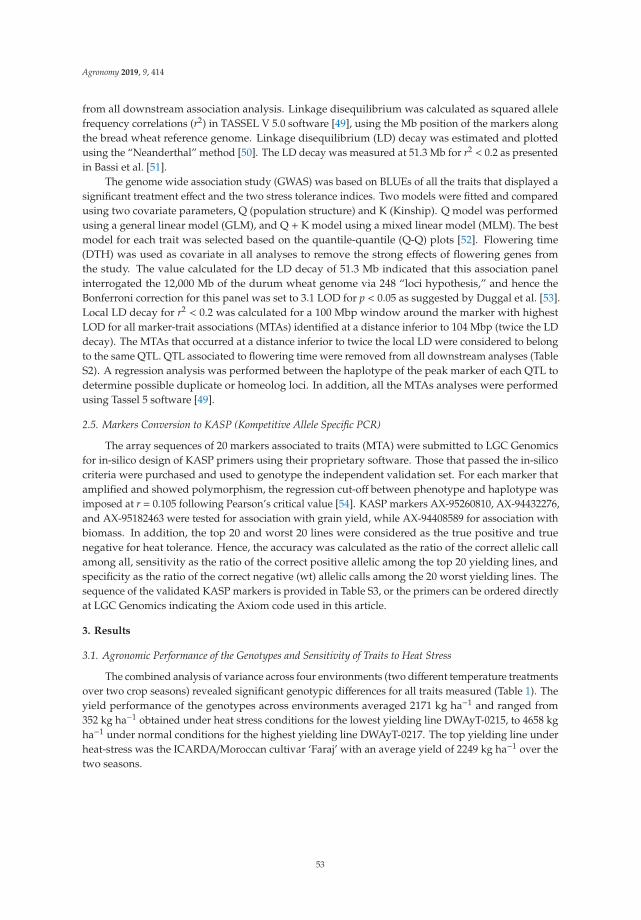
Agronomy 2019, 9, 414
from all downstream association analysis. Linkage disequilibrium was calculated as squared allelefrequency correlations (r2) in TASSEL V 5.0 software [49], using the Mb position of the markers alongthe bread wheat reference genome. Linkage disequilibrium (LD) decay was estimated and plottedusing the “Neanderthal” method [50]. The LD decay was measured at 51.3 Mb for r2 < 0.2 as presentedin Bassi et al. [51].
The genome wide association study (GWAS) was based on BLUEs of all the traits that displayed asignificant treatment effect and the two stress tolerance indices. Two models were fitted and comparedusing two covariate parameters, Q (population structure) and K (Kinship). Q model was performedusing a general linear model (GLM), and Q + K model using a mixed linear model (MLM). The bestmodel for each trait was selected based on the quantile-quantile (Q-Q) plots [52]. Flowering time(DTH) was used as covariate in all analyses to remove the strong effects of flowering genes fromthe study. The value calculated for the LD decay of 51.3 Mb indicated that this association panelinterrogated the 12,000 Mb of the durum wheat genome via 248 “loci hypothesis,” and hence theBonferroni correction for this panel was set to 3.1 LOD for p < 0.05 as suggested by Duggal et al. [53].Local LD decay for r2 < 0.2 was calculated for a 100 Mbp window around the marker with highestLOD for all marker-trait associations (MTAs) identified at a distance inferior to 104 Mbp (twice the LDdecay). The MTAs that occurred at a distance inferior to twice the local LD were considered to belongto the same QTL. QTL associated to flowering time were removed from all downstream analyses (TableS2). A regression analysis was performed between the haplotype of the peak marker of each QTL todetermine possible duplicate or homeolog loci. In addition, all the MTAs analyses were performedusing Tassel 5 software [49].
2.5. Markers Conversion to KASP (Kompetitive Allele Specific PCR)
The array sequences of 20 markers associated to traits (MTA) were submitted to LGC Genomicsfor in-silico design of KASP primers using their proprietary software. Those that passed the in-silicocriteria were purchased and used to genotype the independent validation set. For each marker thatamplified and showed polymorphism, the regression cut-off between phenotype and haplotype wasimposed at r = 0.105 following Pearson’s critical value [54]. KASP markers AX-95260810, AX-94432276,and AX-95182463 were tested for association with grain yield, while AX-94408589 for association withbiomass. In addition, the top 20 and worst 20 lines were considered as the true positive and truenegative for heat tolerance. Hence, the accuracy was calculated as the ratio of the correct allelic callamong all, sensitivity as the ratio of the correct positive allelic among the top 20 yielding lines, andspecificity as the ratio of the correct negative (wt) allelic calls among the 20 worst yielding lines. Thesequence of the validated KASP markers is provided in Table S3, or the primers can be ordered directlyat LGC Genomics indicating the Axiom code used in this article.
3. Results
3.1. Agronomic Performance of the Genotypes and Sensitivity of Traits to Heat Stress
The combined analysis of variance across four environments (two different temperature treatmentsover two crop seasons) revealed significant genotypic differences for all traits measured (Table 1). Theyield performance of the genotypes across environments averaged 2171 kg ha−1 and ranged from352 kg ha−1 obtained under heat stress conditions for the lowest yielding line DWAyT-0215, to 4658 kgha−1 under normal conditions for the highest yielding line DWAyT-0217. The top yielding line underheat-stress was the ICARDA/Moroccan cultivar ‘Faraj’ with an average yield of 2249 kg ha−1 over thetwo seasons.
53
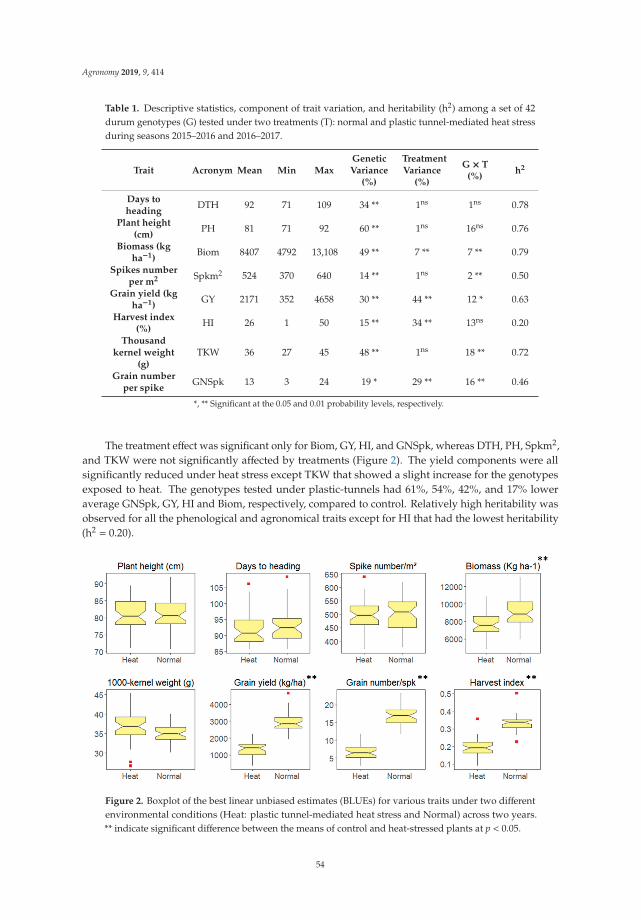
Agronomy 2019, 9, 414
Table 1. Descriptive statistics, component of trait variation, and heritability (h2) among a set of 42durum genotypes (G) tested under two treatments (T): normal and plastic tunnel-mediated heat stressduring seasons 2015–2016 and 2016–2017.
Trait Acronym Mean Min MaxGeneticVariance
(%)
TreatmentVariance
(%)
G × T(%)
h2
Days toheading
DTH 92 71 109 34 ** 1ns 1ns 0.78
Plant height(cm)
PH 81 71 92 60 ** 1ns 16ns 0.76
Biomass (kgha−1)
Biom 8407 4792 13,108 49 ** 7 ** 7 ** 0.79
Spikes numberper m2 Spkm2 524 370 640 14 ** 1ns 2 ** 0.50
Grain yield (kgha−1)
GY 2171 352 4658 30 ** 44 ** 12 * 0.63
Harvest index(%)
HI 26 1 50 15 ** 34 ** 13ns 0.20
Thousandkernel weight
(g)TKW 36 27 45 48 ** 1ns 18 ** 0.72
Grain numberper spike
GNSpk 13 3 24 19 * 29 ** 16 ** 0.46
*, ** Significant at the 0.05 and 0.01 probability levels, respectively.
The treatment effect was significant only for Biom, GY, HI, and GNSpk, whereas DTH, PH, Spkm2,and TKW were not significantly affected by treatments (Figure 2). The yield components were allsignificantly reduced under heat stress except TKW that showed a slight increase for the genotypesexposed to heat. The genotypes tested under plastic-tunnels had 61%, 54%, 42%, and 17% loweraverage GNSpk, GY, HI and Biom, respectively, compared to control. Relatively high heritability wasobserved for all the phenological and agronomical traits except for HI that had the lowest heritability(h2 = 0.20).
Figure 2. Boxplot of the best linear unbiased estimates (BLUEs) for various traits under two differentenvironmental conditions (Heat: plastic tunnel-mediated heat stress and Normal) across two years.** indicate significant difference between the means of control and heat-stressed plants at p < 0.05.
54
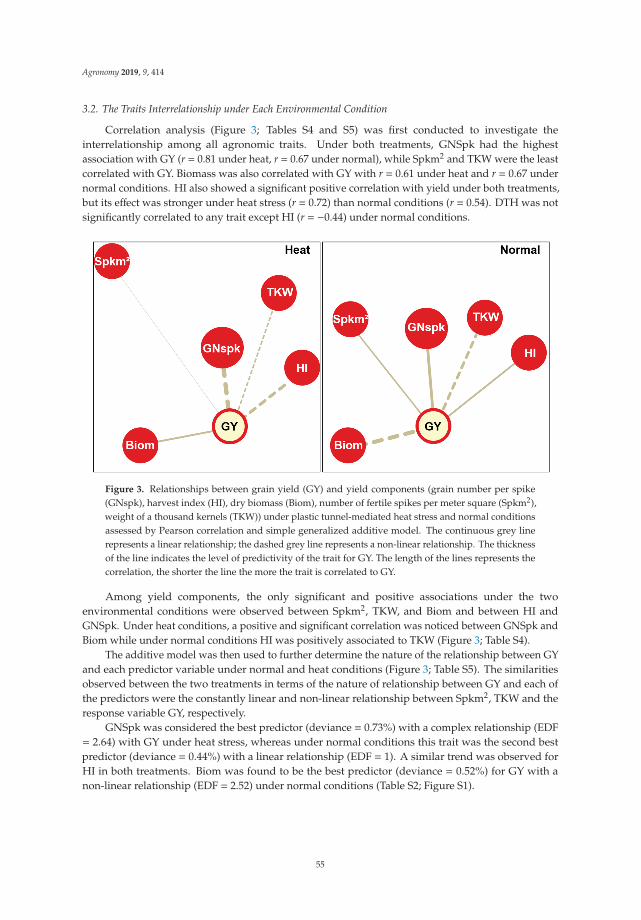
Agronomy 2019, 9, 414
3.2. The Traits Interrelationship under Each Environmental Condition
Correlation analysis (Figure 3; Tables S4 and S5) was first conducted to investigate theinterrelationship among all agronomic traits. Under both treatments, GNSpk had the highestassociation with GY (r = 0.81 under heat, r = 0.67 under normal), while Spkm2 and TKW were the leastcorrelated with GY. Biomass was also correlated with GY with r = 0.61 under heat and r = 0.67 undernormal conditions. HI also showed a significant positive correlation with yield under both treatments,but its effect was stronger under heat stress (r = 0.72) than normal conditions (r = 0.54). DTH was notsignificantly correlated to any trait except HI (r = −0.44) under normal conditions.
Figure 3. Relationships between grain yield (GY) and yield components (grain number per spike(GNspk), harvest index (HI), dry biomass (Biom), number of fertile spikes per meter square (Spkm2),weight of a thousand kernels (TKW)) under plastic tunnel-mediated heat stress and normal conditionsassessed by Pearson correlation and simple generalized additive model. The continuous grey linerepresents a linear relationship; the dashed grey line represents a non-linear relationship. The thicknessof the line indicates the level of predictivity of the trait for GY. The length of the lines represents thecorrelation, the shorter the line the more the trait is correlated to GY.
Among yield components, the only significant and positive associations under the twoenvironmental conditions were observed between Spkm2, TKW, and Biom and between HI andGNSpk. Under heat conditions, a positive and significant correlation was noticed between GNSpk andBiom while under normal conditions HI was positively associated to TKW (Figure 3; Table S4).
The additive model was then used to further determine the nature of the relationship between GYand each predictor variable under normal and heat conditions (Figure 3; Table S5). The similaritiesobserved between the two treatments in terms of the nature of relationship between GY and each ofthe predictors were the constantly linear and non-linear relationship between Spkm2, TKW and theresponse variable GY, respectively.
GNSpk was considered the best predictor (deviance = 0.73%) with a complex relationship (EDF= 2.64) with GY under heat stress, whereas under normal conditions this trait was the second bestpredictor (deviance = 0.44%) with a linear relationship (EDF = 1). A similar trend was observed forHI in both treatments. Biom was found to be the best predictor (deviance = 0.52%) for GY with anon-linear relationship (EDF = 2.52) under normal conditions (Table S2; Figure S1).
55
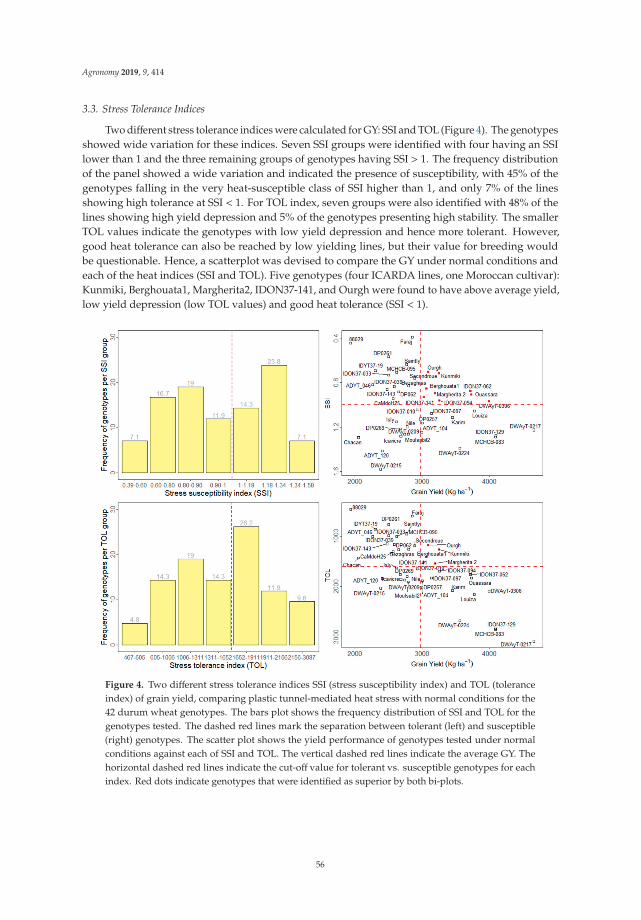
Agronomy 2019, 9, 414
3.3. Stress Tolerance Indices
Two different stress tolerance indices were calculated for GY: SSI and TOL (Figure 4). The genotypesshowed wide variation for these indices. Seven SSI groups were identified with four having an SSIlower than 1 and the three remaining groups of genotypes having SSI > 1. The frequency distributionof the panel showed a wide variation and indicated the presence of susceptibility, with 45% of thegenotypes falling in the very heat-susceptible class of SSI higher than 1, and only 7% of the linesshowing high tolerance at SSI < 1. For TOL index, seven groups were also identified with 48% of thelines showing high yield depression and 5% of the genotypes presenting high stability. The smallerTOL values indicate the genotypes with low yield depression and hence more tolerant. However,good heat tolerance can also be reached by low yielding lines, but their value for breeding wouldbe questionable. Hence, a scatterplot was devised to compare the GY under normal conditions andeach of the heat indices (SSI and TOL). Five genotypes (four ICARDA lines, one Moroccan cultivar):Kunmiki, Berghouata1, Margherita2, IDON37-141, and Ourgh were found to have above average yield,low yield depression (low TOL values) and good heat tolerance (SSI < 1).
Figure 4. Two different stress tolerance indices SSI (stress susceptibility index) and TOL (toleranceindex) of grain yield, comparing plastic tunnel-mediated heat stress with normal conditions for the42 durum wheat genotypes. The bars plot shows the frequency distribution of SSI and TOL for thegenotypes tested. The dashed red lines mark the separation between tolerant (left) and susceptible(right) genotypes. The scatter plot shows the yield performance of genotypes tested under normalconditions against each of SSI and TOL. The vertical dashed red lines indicate the average GY. Thehorizontal dashed red lines indicate the cut-off value for tolerant vs. susceptible genotypes for eachindex. Red dots indicate genotypes that were identified as superior by both bi-plots.
56
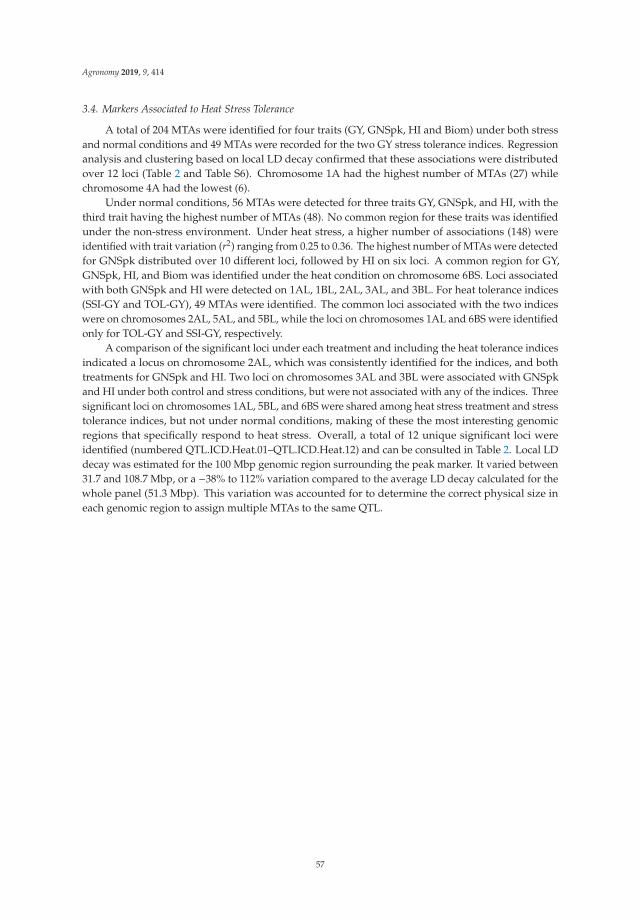
Agronomy 2019, 9, 414
3.4. Markers Associated to Heat Stress Tolerance
A total of 204 MTAs were identified for four traits (GY, GNSpk, HI and Biom) under both stressand normal conditions and 49 MTAs were recorded for the two GY stress tolerance indices. Regressionanalysis and clustering based on local LD decay confirmed that these associations were distributedover 12 loci (Table 2 and Table S6). Chromosome 1A had the highest number of MTAs (27) whilechromosome 4A had the lowest (6).
Under normal conditions, 56 MTAs were detected for three traits GY, GNSpk, and HI, with thethird trait having the highest number of MTAs (48). No common region for these traits was identifiedunder the non-stress environment. Under heat stress, a higher number of associations (148) wereidentified with trait variation (r2) ranging from 0.25 to 0.36. The highest number of MTAs were detectedfor GNSpk distributed over 10 different loci, followed by HI on six loci. A common region for GY,GNSpk, HI, and Biom was identified under the heat condition on chromosome 6BS. Loci associatedwith both GNSpk and HI were detected on 1AL, 1BL, 2AL, 3AL, and 3BL. For heat tolerance indices(SSI-GY and TOL-GY), 49 MTAs were identified. The common loci associated with the two indiceswere on chromosomes 2AL, 5AL, and 5BL, while the loci on chromosomes 1AL and 6BS were identifiedonly for TOL-GY and SSI-GY, respectively.
A comparison of the significant loci under each treatment and including the heat tolerance indicesindicated a locus on chromosome 2AL, which was consistently identified for the indices, and bothtreatments for GNSpk and HI. Two loci on chromosomes 3AL and 3BL were associated with GNSpkand HI under both control and stress conditions, but were not associated with any of the indices. Threesignificant loci on chromosomes 1AL, 5BL, and 6BS were shared among heat stress treatment and stresstolerance indices, but not under normal conditions, making of these the most interesting genomicregions that specifically respond to heat stress. Overall, a total of 12 unique significant loci wereidentified (numbered QTL.ICD.Heat.01–QTL.ICD.Heat.12) and can be consulted in Table 2. Local LDdecay was estimated for the 100 Mbp genomic region surrounding the peak marker. It varied between31.7 and 108.7 Mbp, or a −38% to 112% variation compared to the average LD decay calculated for thewhole panel (51.3 Mbp). This variation was accounted for to determine the correct physical size ineach genomic region to assign multiple MTAs to the same QTL.
57
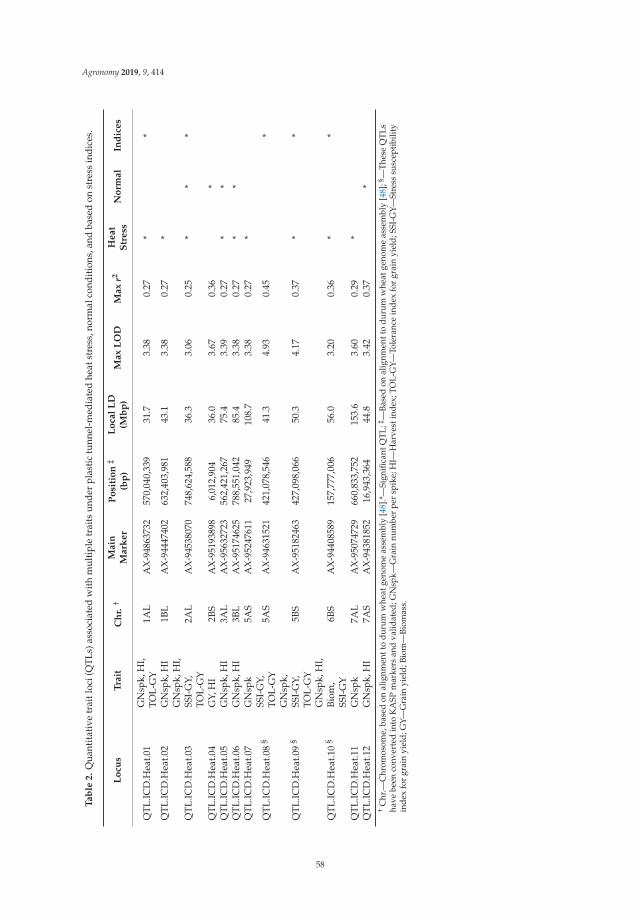
Agronomy 2019, 9, 414
Ta
ble
2.
Qua
ntit
ativ
etr
aitl
oci(
QTL
s)as
soci
ated
wit
hm
ulti
ple
trai
tsun
der
plas
tic
tunn
el-m
edia
ted
heat
stre
ss,n
orm
alco
ndit
ions
,and
base
don
stre
ssin
dice
s.
Lo
cus
Tra
itC
hr.†
Ma
inM
ark
er
Po
siti
on‡
(bp
)
Lo
cal
LD
(Mb
p)
Ma
xL
OD
Ma
xr2
He
at
Str
ess
No
rma
lIn
dic
es
QTL
.ICD
.Hea
t.01
GN
spk,
HI,
TOL-
GY
1AL
AX
-948
6373
257
0,04
0,33
931
.73.
380.
27*
*
QTL
.ICD
.Hea
t.02
GN
spk,
HI
1BL
AX
-944
4740
263
2,40
3,98
143
.13.
380.
27*
QTL
.ICD
.Hea
t.03
GN
spk,
HI,
SSI-
GY,
TOL-
GY
2AL
AX
-945
3807
074
8,62
4,58
836
.33.
060.
25*
**
QTL
.ICD
.Hea
t.04
GY,
HI
2BS
AX
-951
9389
86,
012,
904
36.0
3.67
0.36
*Q
TL.IC
D.H
eat.0
5G
Nsp
k,H
I3A
LA
X-9
5632
723
562,
421,
267
75.4
3.39
0.27
**
QTL
.ICD
.Hea
t.06
GN
spk,
HI
3BL
AX
-951
7462
578
8,55
1,04
285
.43.
380.
27*
*Q
TL.IC
D.H
eat.0
7G
Nsp
k5A
SA
X-9
5247
611
27,9
23,9
4910
8.7
3.38
0.27
*
QTL
.ICD
.Hea
t.08
§SS
I-G
Y,TO
L-G
Y5A
SA
X-9
4631
521
421,
078,
546
41.3
4.93
0.45
*
QTL
.ICD
.Hea
t.09
§G
Nsp
k,SS
I-G
Y,TO
L-G
Y5B
SA
X-9
5182
463
427,
098,
066
50.3
4.17
0.37
**
QTL
.ICD
.Hea
t.10
§G
Nsp
k,H
I,Bi
om,
SSI-
GY
6BS
AX
-944
0858
915
7,77
7,00
656
.03.
200.
36*
*
QTL
.ICD
.Hea
t.11
GN
spk
7AL
AX
-950
7472
966
0,83
3,75
215
3.6
3.60
0.29
*Q
TL.IC
D.H
eat.1
2G
Nsp
k,H
I7A
SA
X-9
4381
852
16,9
43,3
6444
.83.
420.
37*
† Chr
.—C
hrom
osom
e,ba
sed
onal
ignm
entt
odu
rum
whe
atge
nom
eas
sem
bly
[48]
.*—
Sign
ifica
ntQ
TL;‡
—Ba
sed
onal
ignm
entt
odu
rum
whe
atge
nom
eas
sem
bly
[48]
;§ —T
hese
QT
Lsha
vebe
enco
nver
ted
into
KA
SPm
arke
rsan
dva
lidat
ed;G
Nsp
k—G
rain
num
ber
per
spik
e;H
I—H
arve
stin
dex;
TOL-
GY—
Tole
ranc
ein
dex
for
grai
nyi
eld;
SSI-
GY—
Stre
sssu
scep
tibi
lity
inde
xfo
rgr
ain
yiel
d;G
Y—G
rain
yiel
d;Bi
om—
Biom
ass.
58
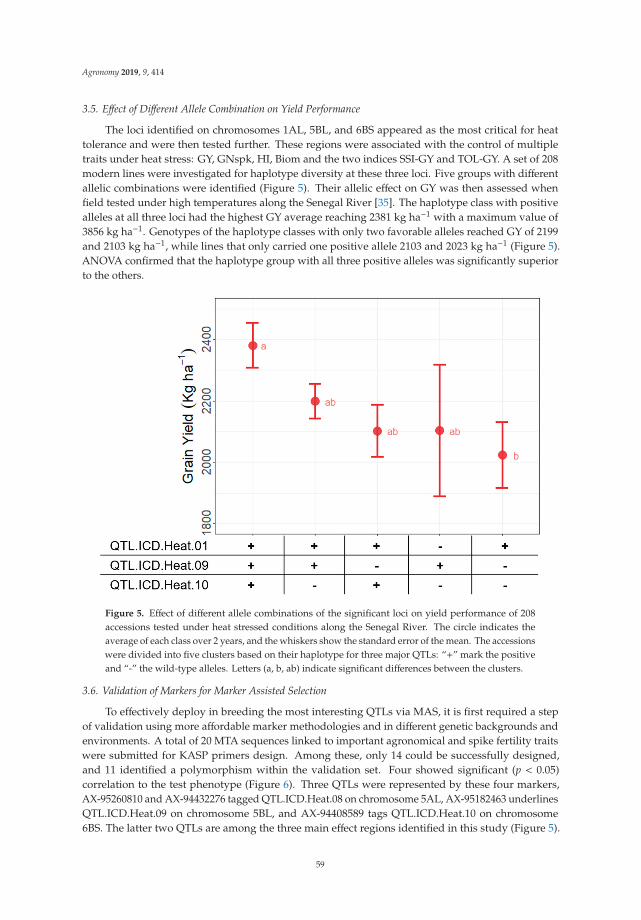
Agronomy 2019, 9, 414
3.5. Effect of Different Allele Combination on Yield Performance
The loci identified on chromosomes 1AL, 5BL, and 6BS appeared as the most critical for heattolerance and were then tested further. These regions were associated with the control of multipletraits under heat stress: GY, GNspk, HI, Biom and the two indices SSI-GY and TOL-GY. A set of 208modern lines were investigated for haplotype diversity at these three loci. Five groups with differentallelic combinations were identified (Figure 5). Their allelic effect on GY was then assessed whenfield tested under high temperatures along the Senegal River [35]. The haplotype class with positivealleles at all three loci had the highest GY average reaching 2381 kg ha−1 with a maximum value of3856 kg ha−1. Genotypes of the haplotype classes with only two favorable alleles reached GY of 2199and 2103 kg ha−1, while lines that only carried one positive allele 2103 and 2023 kg ha−1 (Figure 5).ANOVA confirmed that the haplotype group with all three positive alleles was significantly superiorto the others.
Figure 5. Effect of different allele combinations of the significant loci on yield performance of 208accessions tested under heat stressed conditions along the Senegal River. The circle indicates theaverage of each class over 2 years, and the whiskers show the standard error of the mean. The accessionswere divided into five clusters based on their haplotype for three major QTLs: “+” mark the positiveand “-” the wild-type alleles. Letters (a, b, ab) indicate significant differences between the clusters.
3.6. Validation of Markers for Marker Assisted Selection
To effectively deploy in breeding the most interesting QTLs via MAS, it is first required a stepof validation using more affordable marker methodologies and in different genetic backgrounds andenvironments. A total of 20 MTA sequences linked to important agronomical and spike fertility traitswere submitted for KASP primers design. Among these, only 14 could be successfully designed,and 11 identified a polymorphism within the validation set. Four showed significant (p < 0.05)correlation to the test phenotype (Figure 6). Three QTLs were represented by these four markers,AX-95260810 and AX-94432276 tagged QTL.ICD.Heat.08 on chromosome 5AL, AX-95182463 underlinesQTL.ICD.Heat.09 on chromosome 5BL, and AX-94408589 tags QTL.ICD.Heat.10 on chromosome6BS. The latter two QTLs are among the three main effect regions identified in this study (Figure 5).
59
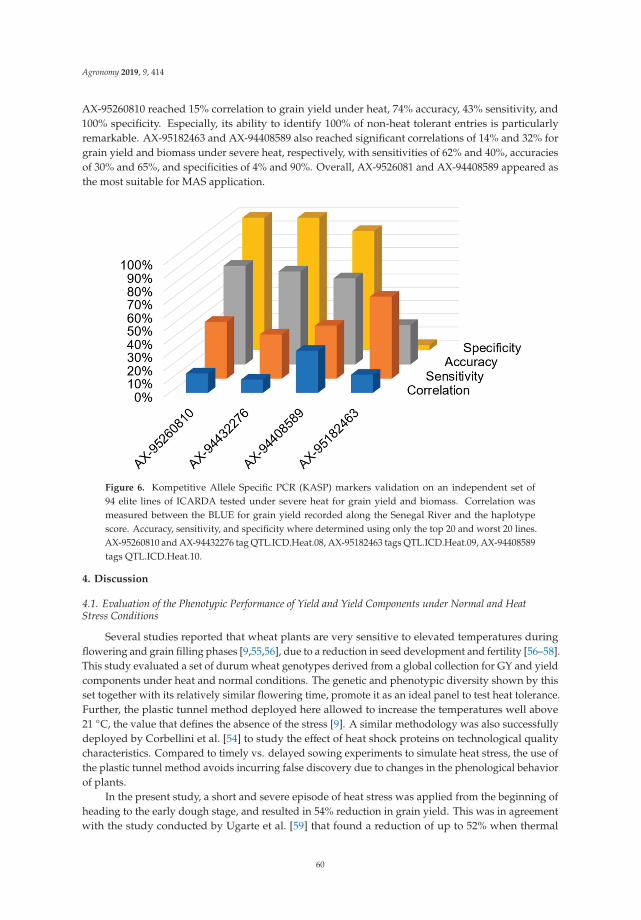
Agronomy 2019, 9, 414
AX-95260810 reached 15% correlation to grain yield under heat, 74% accuracy, 43% sensitivity, and100% specificity. Especially, its ability to identify 100% of non-heat tolerant entries is particularlyremarkable. AX-95182463 and AX-94408589 also reached significant correlations of 14% and 32% forgrain yield and biomass under severe heat, respectively, with sensitivities of 62% and 40%, accuraciesof 30% and 65%, and specificities of 4% and 90%. Overall, AX-9526081 and AX-94408589 appeared asthe most suitable for MAS application.
Figure 6. Kompetitive Allele Specific PCR (KASP) markers validation on an independent set of94 elite lines of ICARDA tested under severe heat for grain yield and biomass. Correlation wasmeasured between the BLUE for grain yield recorded along the Senegal River and the haplotypescore. Accuracy, sensitivity, and specificity where determined using only the top 20 and worst 20 lines.AX-95260810 and AX-94432276 tag QTL.ICD.Heat.08, AX-95182463 tags QTL.ICD.Heat.09, AX-94408589tags QTL.ICD.Heat.10.
4. Discussion
4.1. Evaluation of the Phenotypic Performance of Yield and Yield Components under Normal and HeatStress Conditions
Several studies reported that wheat plants are very sensitive to elevated temperatures duringflowering and grain filling phases [9,55,56], due to a reduction in seed development and fertility [56–58].This study evaluated a set of durum wheat genotypes derived from a global collection for GY and yieldcomponents under heat and normal conditions. The genetic and phenotypic diversity shown by thisset together with its relatively similar flowering time, promote it as an ideal panel to test heat tolerance.Further, the plastic tunnel method deployed here allowed to increase the temperatures well above21 ◦C, the value that defines the absence of the stress [9]. A similar methodology was also successfullydeployed by Corbellini et al. [54] to study the effect of heat shock proteins on technological qualitycharacteristics. Compared to timely vs. delayed sowing experiments to simulate heat stress, the use ofthe plastic tunnel method avoids incurring false discovery due to changes in the phenological behaviorof plants.
In the present study, a short and severe episode of heat stress was applied from the beginning ofheading to the early dough stage, and resulted in 54% reduction in grain yield. This was in agreementwith the study conducted by Ugarte et al. [59] that found a reduction of up to 52% when thermal
60
Agronomy 2019, 9, 414
treatment was applied via transparent chambers. Interestingly, our stress treatment caused an averagetemperature increase of 10 ◦C, which caused an average GY reduction of 5.4% for each 1 ◦C raise. Thisvalue is well within the 4.1% to 6.4% interval suggested by Liu et al. [10] for 1 ◦C raise in temperatures.GNSpk was the most affected trait (−61%) with the highest positive correlation to GY. This is in goodagreement with previous studies that have shown that seed setting is the most sensitive parameter toheat stress, with a noticeable influence on yield [28,60–62]. Still, its non-linear relationship to yieldconfirms the complexity of the trait. Biom and HI were also found to have an influence on yield [63,64]with different relationships based on the occurrence of the stress. The presence of dissimilaritiesof the associations between the two treatments indicates clearly that there is a trade-off among theyield components as previously reported by Sukumaran et al. [65] for grain weight and grain number.Variation of one of the yield components affect the others positively or negatively. Compared to thesimple regression, the additive model allowed to reveal the complexity of the relationship between GYand yield related traits.
The stress index SSI was developed by Fisher and Maurer [43] and modified by Nachit andOuassou [44] as a useful indicator and a good parameter for selection. It measures the severity of theheat stress [66,67] and was also used in earlier studies in wheat to seek heat tolerant genotypes [23,68,69].The TOL index is instead useful for selecting against yield depression, and it was used in severalstudies for heat or drought tolerance in wheat [27,44,67,70]. Improving heat tolerance should not bebased on the use of these criterions alone as was suggested by Clarke et al. [71]. It is important to selectsimultaneously for good yield performance coupled with good adaptability (SSI < 1) and stability(low TOL) [44]. In that sense, the accessions Kunmiki, Berghouata1, Margherita2, and IDON37-141originated from ICARDA durum wheat program, and Ourgh, a Moroccan cultivar, have been identifiedas high yielding genotypes that also show good heat stress tolerance based on the two indices.
4.2. Dissection of Heat-Specific QTLs Associated with Yield-Related Traits and Stress Tolerance Indices
The significant correlation identified between yield and its components were not linear in nature,and tend to change their mode of action based on the occurrence of the stress. Therefore, severalphysiological processes are simultaneously involved in protecting the wheat plant from the heatstress [72], and there is value in dissecting it into its genetic components. In this study GWAS was usedto identify the genetic regions controlling the response of the various traits. To prevent the confoundingeffect that phenology-related loci might have [73], MTAs were identified for DTH and removed fromdownstream analysis. Additionally, flowering time was used as covariate in all analyses for the othertraits. Very few MTAs for DTH were observed either in normal or stressed conditions due to thesynchronized flowering of the entries used in this study. This indicated the absence of confoundingeffects between the two trials. i.e., almost all the accessions were exposed to the same conditions ineach developmental phase [74] before imposing the stress.
Out of 12 QTLs identified, three occurred only when the heat stress was imposed, including indices.These three main genomic regions occurred on chromosomes 1AL, 5BL, and 6BS, and were consideredas QTLs controlling heat tolerance. These three loci were confirmed by mean of haplotype analysison a larger panel of modern lines (208 entries) field tested under severe heat along the Senegal Rivervalley [35], to confirm that the presence of the positive alleles at all three loci provided a significant GYadvantage of +182 kg ha−1 (+8%). The QTL on the long arm of chromosome 1A controlled GNSpk, HI,and TOL-GY, and it explained up to 27% of the phenotypic variation. In a study with double haploidpopulation of bread wheat, Heidari et al. [75] identified a major QTL on the same chromosome (1A),influencing grain number per spike, grain weight per spike, and spikes/m2. However, their phenotypicassessment was not performed under heat stress, the marker systems used was different comparedto our study and the locus was identified in the short arm of chromosome 1A. Therefore, it is quitedifficult to align the results from that study to the current one. Another study had previously reportedmany MTAs on chromosome 1A detected for yield components under heat stress, but all were found tohave a pleiotropic relationship with days to heading and were also located on the short arm of 1A [26],
61
Agronomy 2019, 9, 414
instead of 1AL found here. A heat-specific QTL was also detected on the same chromosome in the shortarm for spikelet compactness and leaf rolling in bread wheat [76]. An earlier study identified a QTL on1AS for yield but associated with different stress conditions [77]. To the best of our knowledge, this isthe first time that this region on 1AL is presented as associated to GNSpk, HI, and TOL-GY in durumwheat under heat stress conditions. The second major QTL region was detected on the long arm ofchromosome 5B and found to be associated with GNSpk and the two indices SSI-GY and TOL-GY,contributing to 37% of the phenotypic variation. A region in the short arm of the same chromosomehas been previously reported to be associated with grain number per square meter in bread wheat [76],and controlling thousand grain weight in durum wheat [27] under combined drought and heat stress.Shirdelmoghanloo et al. [25] and Acuna-Galindo et al. [78] reported loci for grain weight and otherimportant traits on chromosome 5B under heat and non-heat conditions in hexaploid wheat. Onthe other hand, the same chromosome has been previously suggested to carry heat-specific QTLsfor yield per se in bread wheat [26]. Sukumaran et al. [27] identified markers for heat susceptibility(HSI or SSI) and tolerance (TOL) indices for yield and grain number per square meter on the shortarm of the chromosome 5B. Mason et al. [64] also detected QTL for HSI for kernel number on 5BLin bread wheat. The genomic region identified in this study on 5BL is likely to be a new QTL sinceno information has been reported earlier for this locus associated to GNSpk, SSI-GY, and TOL-GYin durum wheat and specific to heat stress, but we cannot exclude that it overlaps with previouslyreported QTLs. A third heat-responsive locus was identified on the short arm of chromosome 6Brelated to GY, SSI-GY, GNspk, HI, and Biom accounting for 36% of the phenotypic variance. An earlierstudy on bread wheat identified a locus on chromosome 6BS underpinning chlorophyll loss rates andheat susceptibility index for grain weight and chlorophyll loss rates under heat-stress conditions [25].Under post-anthesis high temperatures stress, Vijayalakshmi et al. [20] reported a QTL on the shortarm of chromosome 6B for senescence related traits in hexaploid wheat. McIntyre et al. [79] and Pintoet al. [21] reported QTLs on chromosome 6BL that were associated with many important traits (grainnumber per square meter and grain yield and water-soluble carbohydrate content) related to droughtand heat tolerance. Ogbonnaya et al. [26] found a locus on the short arm of chromosome 6B for grainyield under heat stress in bread wheat. These previously reported QTLs in 6B could overlap with theone identified in this study, but they were either identified not in association with heat tolerance ordetected in hexaploidy wheat. Therefore, this region is also assumed to have been reported for thefirst time here in relationship to heat tolerance for durum wheat. This locus affects multiple traits(GY, GNspk, HI, Biom, and two heat susceptibility indexes) and hence it is of good importance fordeployment in breeding. The principal breeding objective is to develop varieties with high grain yieldand stability when exposed to different stresses. However, grain yield is a complex trait controlled bymany genes and strongly influenced by the environment [80–86]. Therefore, a good understanding oftraits and underlying loci associated with tolerance to elevated temperatures is of a great importancefor breeding new heat tolerant cultivars [87].
4.3. Pyramiding Heat-Tolerant QTLS via MAS
Three loci on chromosomes 1AL, 5BS, and 6BS showed an additive nature by means of haplotypeanalysis (Figure 5), revealing that only the combination of all three positive alleles generated a trueyield advantage. Among the most heat tolerant elite lines identified here ‘Kunmiki’, ‘Berghouata1’,and ‘Ourgh’ confirmed to harbor the positive alleles for all three loci. This prompts their use incrossing schemes to pyramid the positive alleles, as well as the deployment of simple marker system toconduct MAS.
Axiom to KASP marker conversion and validation was attempted for 20 MTAs. Eleven KASPmarkers generated polymorphic haplotypes in an independent set of ICARDA elite lines. Four revealeda significant (p < 0.05) correlation to GY and biomass assessed under severe heat along the SenegalRiver Valley (Figure 6). In particular, AX-95182463 tags QTL.ICD.Heat.09 located on chromosome 5Band it revealed good correlation and sensitivity, but lacks in accuracy and specificity, and it is hence
62
Agronomy 2019, 9, 414
protected from Type II errors, but prone to Type I, with several elite lines wrongly identified as carryingthe positive alleles. AX-95260810 tags QTL.ICD.Heat.08, linked to the two stress tolerance indices forGY (SSI-GY and TOL-GY) located on chromosome 5A. AX-94408589 tags QTL.ICD.Heat.10 locatedon chromosome 6B, and associated to several traits GNspk, HI, Biom, SSI-GY. In these two cases, theKASP markers explained 15% and 33% of the phenotypic variation of an independent validation set,with 100% and 90% specificity, and 74% and 65% accuracy, but medium sensitivity (43% and 40%). Assuch, these markers are protected against Type I errors (no false positive), but prone to Type II errors,with several elite lines identified as not carrying the positive allele while instead being tolerant to heat.Hence, while all converted KASP markers are prone to different types of errors, these three markerscan be considered as validated and ready to be deployed in breeding. The combination of the threemight represent a more stringent approach to protect against both types of errors. An additional nineQTLs were identified in this study, and their KASP conversion and validation are still ongoing andwill require better targeted efforts to be achieved.
5. Conclusions
Heat stress causes a complex cascade of negative effects on the wheat plant, resulting in drasticreductions in grain yield. The deployment of heat tolerant varieties that will benefit greatly farmersrequires first to enhance our understanding of this mechanism and loci governing it. Our studycombined a discovery phase with a core set tested over two field seasons in Morocco under artificialheat-treatment with plastic tunnels, followed by a different confirmation set of germplasm grown fortwo seasons in Kaedi, Mauritania under severe natural heat, and completed with one final validationset tested one season in Kaedi. Our results confirmed that spike fertility (GNSpk) and maintenanceof green leaves (Biom) are the most critical traits to drive tolerance to this stress, and hence shouldbe the primary targets of durum wheat breeders. Further, the deployment of plastic tunnels provedto be a strategic methodology to study this stress and reveal its mechanisms without affecting thephenology of the plant. In addition, 12 loci were identified as responsible for controlling the mainheat tolerance traits. Among these, three were activated only when the stress occurred and hencerepresent ideal targets for breeding. Two of these were validated into a KASP marker and are nowready for deployment via MAS, especially if associated with a third, also validated, KASP. Finally,three ICARDA elite lines and one Moroccan cultivar were confirmed as tolerant to heat, with highgrain yield, and carrying positive alleles for three main QTLs. These are freely available and should beincorporated as crossing parents by other breeding programs. Altogether, this study has confirmed thekey traits for heat tolerance as well as a new methodology to study it in durum wheat, it has revealedthe main loci controlling these traits and proceeded to validate three of them for MAS, and it has alsoprovided freely available elite lines to breed new cultivars better adapted to the stress.
Supplementary Materials: Table S1: List of durum wheat genotypes evaluated under plastic tunnel-mediatedheat stress in the present study, Table S2: Markers associated with days to heading (DTH) under heat stress andnormal conditions, Table S3: Sequence information of the KASP markers, Table S4: Pearson correlation matrixbetween all the measured traits under heat conditions (upper part) and normal (lower part) conditions. GY—Grainyield; Biom—Biomass; HI—Harvest index; Spkm2—Spikes per square meter: GNspk—Grain number per spike;TKW—Thousand kernel weight; DTH—Days to heading. *, ** Significant at the 0.05 and 0.01 probability levels,respectively, Table S5: Correlation (r), linear regression estimated via ordinary least squares (OLS) and flexibleregression estimated via regression additive model. (a) Under heat stress. (b) Under normal conditions, TableS6: Regression matrix between the haplotype of the peak markers for the 13 identified QTLs. *, significant locisimilarity at p < 0.05 consistent with homeologous relationship; **, significant loci identity (p < 0.01) consistentwith wrongly assigned genomic position, Figure S1: Plots of the additive regression model showing GNspk, biom,TKW, spkm2 and HI as the spline function of the target trait grain yield (GY). (a) Under heat stress. (b) Undernormal conditions
Author Contributions: F.M.B., M.N. and K.E.H. conceived and designed the study. K.E.H. and F.M.B. performedthe field experiment. A.T.S. performed the field experiment in the Senegal river. A.A. contributed in the genotyping.K.E.H. and F.M.B. analyzed the data. K.E.H. Wrote the original draft. K.E.H., B.B., A.F.M., A.A., M.N., and F.M.B.wrote or reviewed the manuscript. All authors read and approved the final manuscript.
63
Agronomy 2019, 9, 414
Funding: This study was funded by the Australian Grains Research and Development Corporation (GRDC)project ICA00012: Focused improvement of ICARDA/Australia durum germplasm for abiotic tolerance, while thefield work along the Senegal River was funded by the Swedish Research Council (Vetenskapsradet) U-Forsk2013project 2013-6500, “Deployment of molecular durum breeding to the Senegal Basin: capacity building to faceglobal warming” and U-Forsk2018 project 2017-05522, “Genomic prediction to deliver heat tolerant wheat to theSenegal River basin: phase II.” The marker conversion work was covered by the International Treaty on PlantGenetic Resources for Food and Agriculture 2014-2015-2B-PR-02-Jordan: “An Integrated Approach to Identifyand Characterize Climate Resilient Wheat for the West Asia and North Africa.”
Acknowledgments: The authors wish to acknowledge the technical assistance provided by A. Rached and allICARDA durum wheat program staff in handling field activities.
Conflicts of Interest: The authors declare no conflict of interest.
References
1. Hays, D.; Mason, E.; Hwa, D.J.; Menz, M.; Reynolds, M. Expression quantitative trait loci mapping heattolerance during reproductive development in wheat (T. aestivum L.). In Wheat Production in StressedEnvironment; Buck, H.T., Nisi, J.E., Salomon, N., Eds.; Springer: Amsterdam, The Netherlands, 2007;pp. 373–382.
2. Saini, H.; Aspinall, D. Abnormal sporogenesis in wheat (Triticum aestivum L.) induced by short periods ofhigh temperature. Ann. Bot. 1982, 49, 835–846. [CrossRef]
3. Plaut, Z.; Butow, B.J.; Blumenthal, C.S.; Wrigley, C.W. Transport of dry matter into developing wheat kernelsand its contribution to grain yield under post-anthesis water deficit and elevated temperature. Field CropsRes. 2004, 86, 185–198. [CrossRef]
4. Hunt, L.A.; van der Poorten, G.; Pararajasingham, S. Post-anthesis temperature effects on duration and rateof grain filling in some winter and spring wheats. Can. J. Plant Sci. 1991, 71, 609–617. [CrossRef]
5. Wollenweber, B.; Porter, J.R.; Schellberg, J. Lack of interaction between extreme high-temperature events atvegetative and reproductive growth stages in wheat. J. Agron. Crop Sci. 2003, 189, 142–150. [CrossRef]
6. Dias, A.S.; Lidon, F.C. Bread and durum wheat tolerance under heat stress: A synoptical overview. J. FoodAgric. 2010, 22, 412–436. [CrossRef]
7. Dolferus, R.; Ji, X.; Richards, R.A. Abiotic stress and control of grain number in cereals. Plant Sci. 2011, 181,331–341. [CrossRef] [PubMed]
8. Porter, J.R.; Gawith, M. Temperatures and the growth and development of wheat: A review. Eur. J. Agron.1999, 10, 23–36. [CrossRef]
9. Farooq, M.; Bramley, H.; Palta, J.A.; Siddique, K.H.M. Heat stress in wheat during reproductive andgrain-filling phases. Crit. Rev. Plant Sci. 2011, 30, 1–17. [CrossRef]
10. Liu, B.; Asseng, S.; Muller, C.; Ewert, F.; Elliott, J.; Lobell, D.B.; Rosenzweig, C. Similar estimates oftemperature impacts on global wheat yield by three independent methods. Nat. Clim. Chang. 2016, 6,1130–1136. [CrossRef]
11. Lillemo, M.; van Ginkel, M.; Trethowan, R.M.; Hernandez, E.; Crossa, J. Differential adaptation of CIMMYTbread wheat to global high temperature environments. Crop Sci. 2005, 45, 2443–2453. [CrossRef]
12. Hansen, J.; Sato, M.; Ruedy, R. Perception of climate change. Proc. Natl. Acad. Sci. USA 2012, 109, 2415–2423.[CrossRef] [PubMed]
13. United Nations Economic and Social Commission for Western Asia (ESCWA). Arab Climate ChangeAssessment Report—Main Report; E/ESCWA/SDPD/2017/RICCAR/Report; United Nations Publication: Beirut,Lebanon, 2017.
14. Ayeneh, A.; van Ginkel, M.; Reynolds, M.P.; Ammar, K. Comparison of leaf, spike, peduncle, and canopytemperature depression in wheat under heat stress. Field Crops Res. 2002, 79, 173–184. [CrossRef]
15. Yang, J.; Sears, R.G.; Gill, B.S.; Paulsen, G.M. Quantitative and molecular characterization of heat tolerance inhexaploid wheat. Euphytica 2002, 126, 275–282. [CrossRef]
16. Nachit, M.M.; Elouafi, I. Durum adaptation in the Mediterranean dryland breeding: Breeding, stressphysiology, and molecular markers. Crop Sci. Soc. Am. Am. Soc. Agron. CSSA 2004, 32, 203–218.
17. Reynolds, M.P.; Hobbs, P.R.; Braun, H.J. Challenges to international wheat improvement. J. Agric. Sci. 2007,145, 223–227. [CrossRef]
64
Agronomy 2019, 9, 414
18. Tuberosa, R. Phenotyping for drought tolerance of crops in the genomics era. Front. Physiol. 2012, 3, 347.[CrossRef] [PubMed]
19. Reynolds, M.; Langridge, P. Physiological breeding. Curr. Opin. Plant Biol. 2016, 31, 162–171. [CrossRef][PubMed]
20. Vijayalakshmi, K.; Fritz, A.K.; Paulsen, G.M.; Bai, G.; Pandravada, S.; Gill, B.S. Modeling and mappingQTL for senescence-related traits in winter wheat under high temperature. Mol. Breed. 2010, 26, 163–175.[CrossRef]
21. Pinto, R.S.; Reynolds, M.P.; Mathews, K.L.; McIntyre, C.L.; Olivares-Villegas, J.J.; Chapman, S.C. Heat anddrought adaptive QTL in a wheat population designed to minimize confounding agronomic effects. Theor.Appl. Genet. 2010, 121, 1001–1021. [CrossRef]
22. Bennett, D.; Reynolds, M.; Mullan, D.; Izanloo, A.; Kuchel, H.; Langridge, P.; Schnurbusch, T. Detection oftwo major grain yield QTL in bread wheat (Triticum aestivum L.) under heat, drought and high yield potentialenvironments. Theor. Appl. Genet. 2012, 125, 1473–1485. [CrossRef]
23. Paliwal, R.; Röder, M.S.; Kumar, U.; Srivastava, J.P.; Joshi, A.K. QTL mapping of terminal heat tolerance inhexaploid wheat (T. aestivum L.). Theor. Appl. Genet. 2012, 125, 561–575. [CrossRef] [PubMed]
24. Talukder, S.K.; Babar, M.A.; Vijayalakshmi, K.; Poland, J.; Prasad, P.V.V.; Bowden, R.; Fritz, A. MappingQTL for the traits associated with heat tolerance in wheat (Triticum aestivum L.). BMC Genet. 2014, 15, 97.[CrossRef] [PubMed]
25. Shirdelmoghanloo, H.; Taylor, J.D.; Lohraseb, I.; Rabie, H.; Brien, C.; Timmins, A.; Martin, P.; Mather, D.E.;Emebiri, L.; Collins, N.C. A QTL on the short arm of wheat (Triticum aestivum L.) chromosome 3B affects thestability of grain weight in plants exposed to a brief heat shock early in grain filling. BMC Plant Biol. 2016,16, 100. [CrossRef] [PubMed]
26. Ogbonnaya, F.C.; Rasheed, A.; Okechukwu, E.C.; Jighly, A.; Makdis, F.; Wuletaw, T.; Hagras, A.; Uguru, M.I.;Agbo, C.U. Genome-wide association study for agronomic and physiological traits in spring wheat evaluatedin a range of heat prone environments. Theor. Appl. Genet. 2017, 130, 1819–1835. [CrossRef] [PubMed]
27. Sukumaran, S.; Reynolds, M.P.; Sansaloni, C. Genome-Wide Association Analyses Identify QTL Hotspotsfor Yield and Component Traits in Durum Wheat Grown under Yield Potential, Drought, and Heat StressEnvironments. Front. Plant Sci. 2018, 9, 81. [CrossRef] [PubMed]
28. Sall, A.T.; Cisse, M.; Gueye, H.; Kabbaj, H.; Ndoye, I.; Maltouf, A.F.; El-Mourid, M.; Ortiz, R.; Bassi, F.M. Heattolerance of durum wheat (triticum durum desf.) elite germplasm tested along the Senegal river. J. Agric. Sci.2018, 10, 217–233. [CrossRef]
29. Pradhan, G.P.; Prasad, P.V.V.; Fritz, A.; Kirkham, M.B.; Gill, B.S. Effects of drought and high temperaturestress on synthetic hexaploid wheat. Funct. Plant Biol. 2012, 39, 190–198. [CrossRef]
30. Weldearegay, D.F.; Yan, F.; Jiang, D.; Liu, F. Independent and combined effects of soil warming and droughtstress during anthesis on seed set and grain yield in two spring wheat varieties. J. Agron. Crop Sci. 2012, 198,245–253. [CrossRef]
31. Jha, U.C.; Bohra, A.; Singh, N.P. Heat stress in crop plants: Its nature, impacts and integrated breedingstrategies to improve heat tolerance. Plant Breed. 2014, 133, 679–701. [CrossRef]
32. Mishra, S.C.; Singh, S.K.; Patil, R.; Bhusal, N.; Malik, A.; Sareen, S. Breeding for heat tolerance in wheat. InRecent Trends on Production Strategies of Wheat in India; Shukla, R.S., Mishra, P.C., Chatrath, R., Gupta, R.K.,Tomar, S.S., Sharma, I., Eds.; JNKVV, Jabalpur & ICAR-IIWBR: Karnal, Indi, 2014; pp. 15–29.
33. Ni, A.; Li, H.; Zhao, Y.; Peng, H.; Hu, Z.; Xin, M.; Sun, Q. Genetic improvement of heat tolerance in wheat:Recent progress in understanding the underlying molecular mechanisms. Crop J. 2017, 6, 32–41. [CrossRef]
34. Kabbaj, H.; Sall, A.T.; Al-Abdallat, A.; Geleta, M.; Amri, A.; Filali-Maltouf, A.; Bassi, F.M. Genetic diversitywithin a global panel of durum wheat (Triticum durum L.) landraces and modern germplasm reveals thehistory of alleles exchange. Front. Plant Sci. 2017, 8, 1277. [CrossRef] [PubMed]
35. Sall, A.T.; Bassi, F.M.; Cisse, M.; Gueye, H.; Ndoye, I.; Filali-Maltouf, A.; Ortiz, R. Durum wheat breeding: Inthe heat of the Senegal river. Agriculture 2018, 8, 99. [CrossRef]
36. Bates, D.; Maechler, M.; Bolker, B.; Walker, S. Fitting linear mixed-effects models using lme4. J. Stat. Softw.2015, 67, 1–48. [CrossRef]
37. R Development Core Team. R: A Language and Environment for Statistical Computing; R Foundation ForStatistical Computing: Vienna, Austria, 2016.
65
Agronomy 2019, 9, 414
38. DeLacy, I.H.; Basford, K.E.; Cooper, M.; Bull, J.K.; McLaren, C.G. Analysis of multi-environment trials: Anhistorical perspective. In Plant Adaptation and Crop Improvement; Cooper, M., Hammer, G.L., Eds.; CABInternational: Oxfordshire, UK, 1996.
39. Wickham, H. ggplot2: Elegant Graphics for Data Analysis; Springer: New York, NY, USA, 2009.40. Wei, T.; Simko, V. R package “corrplot”: Visualization of a Correlation Matrix (Version 0.84); R Foundation for
Statistical Computing: Vienna, Austria, 2017.41. Wood, S.N. Generalized Additive Models: An Introduction with R, 2nd ed.; Chapman & Hall, CRC: Boca Raton,
Florida, 2017; ISBN 9781498728331.42. Wood, S.N.; Pya, N.; Saefken, B. Smoothing parameter and model selection for general smooth models. J. Am.
Stat. Assoc. 2016, 111, 1548–1575. [CrossRef]43. Fisher, R.A.; Maurer, R. Drought resistance in spring wheat cultivars I. grain yield responses. Aust. J. Agric.
Res. 1978, 29, 897–917. [CrossRef]44. Nachit, M.M.; Ouassou, A. Association of yield potential, drought tolerance and stability of yield in Triticum
turgidum var durum. In Proceedings of the 7th International Wheat Symposium, Cambridge, UK, 13–19 July1988; pp. 867–870.
45. Rosielle, A.A.; Hamblin, J. Theoretical aspects of selection for yield in stress and non-stress environments.Crop Sci. 1981, 21, 943–946. [CrossRef]
46. Bivand, R.; Ono, H.; Dunlap, R.; Stigler, M. R Package Classint: Choose Univariate Class Intervals. 2018.Available online: http://cran.r-project.org/package=classInt (accessed on 10 September 2019).
47. Lenth, R.; Love, J.; Maxime, H. Estimated Marginal Means, aka Least-Squares Means. 2017. Available online:http://cran.r-project.org/package=emmeans (accessed on 14 June 2019).
48. Maccaferri, M.; Harris, N.S.; Twardziok, S.O.; Pasam, R.K.; Gundlach, H.; Spannagl, M.; Himmelbach, A.Durum wheat genome highlights past domestication signatures and future improvement targets. Nat. Genet.2019, 51, 885–895. [CrossRef] [PubMed]
49. Bradbury, P.J.; Zhang, Z.; Kroon, D.E.; Casstevens, T.M.; Ramdoss, Y.; Buckler, E.S. TASSEL: Software forassociation mapping of complex traits in diverse samples. Bioinformatics 2007, 23, 2633–2635. [CrossRef]
50. Jujumaan. Estimating and Plotting the Decay of Linkage Disequilibrium. Available online: https://jujumaan.com/2017/07/15/linkage-disequilibrium-decay-plot/ (accessed on 15 July 2017).
51. Bassi, F.; Brahmi, H.; Sabraoui, A.; Amri, A.; Nsarellah, N.; Nachit, M.M.; Al-Abdallat, A.; Chen, M.S.;Lazraq, A.; El Bouhssini, M. Genetic identification of loci for Hessian fly resistance in durum wheat. Mol.Breed. 2019, 39, 24. [CrossRef]
52. Sukumaran, S.; Xiang, W.; Bean, S.R.; Pedersen, J.F.; Kresovich, S.; Tuinstra, M.R.; Yu, J. Association mappingfor grain quality in a diverse sorghum collection. Plant Genom. J. 2012, 5, 126–135. [CrossRef]
53. Duggal, P.; Gillanders, E.M.; Holmes, T.N.; Bailey-Wilson, J.E. Establishing an adjusted p-value thresholdto control the family-wide type 1 error in genome wide association studies. BMC Genom. 2008, 9, 516.[CrossRef] [PubMed]
54. Pearson, K. Notes on regression and inheritance in the case of two parents. Proc. R. Soc. Lond. 1985, 58,240–242.
55. Sofield, I.; Evans, L.T.; Cook, M.G.; Wardlaw, I.F. Factors influencing the rate and duration of grain filling inwheat. Aust. J. Plant Physiol. 1977, 4, 785–797. [CrossRef]
56. Gooding, M.J.; Ellis, R.H.; Shewry, P.R.; Schofield, J.D. Effects of restricted water availability and increasedtemperature on the grain filling, drying and quality of winter wheat. J. Cereal Sci. 2003, 37, 295–309.[CrossRef]
57. Corbellini, M.; Canevara, M.G.; Mazza, L.; Ciaffi, M.; Lafiandra, D.; Tozzi, L.; Borghi, B. Effect of the durationand intensity of heat shock during grain filling on dry matter and protein accumulation, technological qualityand protein composition in bread and durum wheat. Aust. J. Plant Physiol. 1997, 24, 245–250. [CrossRef]
58. Corbellini, M.; Mazza, L.; Ciaffi, M.; Lafiandra, D.; Borghi, B. Effect of heat shock during grain filling onprotein composition and technological quality of wheats. Euphytica 1998, 100, 147–154. [CrossRef]
59. Ugarte, C.; Calderini, D.F.; Slafer, G.A. Grain weight and grain number responsiveness to pre-anthesistemperature in wheat, barley and triticale. Field Crops Res. 2006, 100, 240–248. [CrossRef]
60. Nachit, M.M. Durum breeding for Mediterranean drylands of North Africa and West Asia. In Durum Wheat:Challenges and Opportunities; Rajaram, S., Saari, E., Hettel, G.P., Eds.; Wheat Special Report; CIMMYT: CiudadObregon, Mexico, 1992; Volume 9.
66
Agronomy 2019, 9, 414
61. Barnabas, B.; Jager, K.; Feher, A. The effect of drought and heat stress on reproductive processes in cereals.Plant Cell Environ. 2008, 31, 11–38. [CrossRef]
62. Reynolds, M.; Foulkes, J.; Furbank, R.; Griffiths, S.; King, J.; Murchie, E.; Parry, M.; Slafer, G. Achieving yieldgains in wheat. Plant Cell Environ. 2012, 35, 1799–1823. [CrossRef]
63. Masoni, A.; Ercoli, L.; Mariotti, M.; Arduini, I. Post-anthesis accumulation and remobilization of dry matter,nitrogen and phosphorus in durum wheat as affected by soil type. Eur. J. Agron. 2007, 26, 179–186. [CrossRef]
64. Prasad, P.V.V.; Pisipati, S.R.; Mutava, R.N.; Tuinstra, M.R. Sensitivity of grain sorghum to high temperaturestress during reproductive development. Crop Sci. 2008, 48, 1911–1917. [CrossRef]
65. Sukumaran, S.; Lopes, M.; Dreisigacker, S.; Reynolds, M. Genetic analysis of multi-environmental springwheat trials identifies genomic regions for locus-specific trade-offs for grain weight and grain number. Theor.Appl. Genet 2017, 131, 1–14. [CrossRef]
66. Sio-Se Mardeh, A.; Ahmadi, A.; Poustini, K.; Mohammadi, V. Evaluation of drought resistance indices undervarious environmental conditions. Field Crops Res. 2006, 98, 222–229. [CrossRef]
67. Dodig, D.; Zoric, M.; Kandic, V.; Perovic, D.; Surlan-Momirovic, G. Comparison of responses to drought stressof 100 wheat accessions and landraces to identify opportunities for improving wheat drought resistance.Plant Breed. 2012, 131, 369–379. [CrossRef]
68. Mason, R.E.; Mondal, S.; Beecher, F.W.; Pacheco, A.; Jampala, B.; Ibrahim, A.M.H.; Hays, D.B. QTL associatedwith heat susceptibility index in wheat (Triticum aestivum L.) under short-term reproductive stage heat stress.Euphytica 2010, 174, 423–436. [CrossRef]
69. Mason, R.E.; Mondal, S.; Beecher, F.W.; Hays, D.B. Genetic loci linking improved heat tolerance in wheat(Triticum aestivum L.) to lower leaf and spike temperature under controlled conditions. Euphytica 2011, 180,181–194. [CrossRef]
70. Orcen, N.; Altinbas, M. Use of some stress tolerance indices for late drought in spring wheat. FreseniusEnviron. Bull. 2014, 24.
71. Clarke, J.M.; Depauw, R.M.; Townley-Smith, T.F. Evaluation of methods for quantification of droughttolerance in wheat. Crop Sci. 1992, 32, 723–728. [CrossRef]
72. Rekika, D.; Kara, Y.; Souyris, I.; Nachit, M.M.; Asbati, A.; Monneveux, P. The tolerance of PSII to hightemperatures in durum wheat (T. Turgidum conv. Durum): Genetic variation and relationship with yieldunder heat stress. Cereal Res. Commun. 2000, 28, 395–402.
73. Lopes, M.S.; Reynolds, M.P.; Jalal-Kamali, M.R.; Moussa, M.; Feltaous, Y.; Tahir, I.S.A.; Barma, N.; Vargas, M.;Mannes, Y.; Baum, M. The yield correlations of selectable physiological traits in a population of advancedspring wheat lines grown in warm and drought environments. Field Crops. Res. 2012, 128, 129–136. [CrossRef]
74. Reynolds, M.; Tuberosa, R. Translational research impacting on crop productivity in drought-proneenvironments. Curr. Opin. Plant Biol. 2008, 11, 171–179. [CrossRef] [PubMed]
75. Heidari, B.; Sayed-Tabatabaei, B.E.; Saeidi, G.; Kearsey, M.; Suenaga, K. Mapping QTL for grain yield, yieldcomponents, and spike features in a doubled haploid population of bread wheat. Genome 2011, 54, 517–527.[CrossRef] [PubMed]
76. Tahmasebi, S.; Heidari, B.; Pakniyat, H.; McIntyre, C.L. Mapping QTLs associated with agronomic andphysiological traits under terminal drought and heat stress conditions in wheat (Triticum aestivum L.). Genome2017, 60, 26–45. [CrossRef] [PubMed]
77. Quarrie, S.A.; Steed, A.; Calestani, C.; Semikhodskii, A.; Lebreton, C.; Chinoy, C.; Schondelmaier, J.A high-density genetic map of hexaploid wheat (Triticum aestivum L.) from the cross Chinese Spring x SQ1and its use to compare QTL for grain yield across a range of environments. Theor. Appl. Genet. 2005, 110,865–880. [CrossRef] [PubMed]
78. Acuna-Galindo, M.A.; Mason, R.E.; Subrahmanyam, N.K.; Hays, D. Meta-analysis of wheat QTL regionsassociated with adaptation to drought and heat stress. Crop Sci. 2014, 55, 477–492. [CrossRef]
79. McIntyre, C.L.; Mathews, K.L.; Rattey, A.; Drenth, J.; Ghaderi, M.; Reynolds, M.; Chapman, C.S.; Shorter, R.Molecular detection of genomic regions associated with grain yield and yield components in an elite breadwheat cross evaluated under irrigated and rainfed conditions. Theor. Appl. Genet. 2010, 120, 527–541.[CrossRef] [PubMed]
80. Araus, J.L.; Bort, J.; Steduto, P.; Villegas, D.; Royo, C. Breeding cereals for Mediterranean conditions:Ecophysiological clues for biotechnology application. Ann. Appl. Biol. 2003, 142, 129–141. [CrossRef]
67
Agronomy 2019, 9, 414
81. Slafer, G.A.; Araus, J.L.; Royo, C.; García Del Moral, L.F. Promising eco-physiological traits for geneticimprovement of cereal yields in Mediterranean environments. Ann. Appl. Biol. 2005, 146, 61–70. [CrossRef]
82. McCartney, C.A.; Somers, D.J.; Humphreys, D.G.; Lukow, O.; Ames, N.; Noll, J.; Cloutier, S.; McCallum, B.D.Mapping quantitative trait loci controlling agronomic traits in the spring wheat cross RL4452 9 ‘AC Domain’.Genome 2005, 48, 870–883. [CrossRef]
83. Collins, N.C.; Tardieu, F.; Tuberosa, R. Quantitative trait loci and crop performance under abiotic stress:Where do we stand? Plant Physiol. 2008, 147, 469–486. [CrossRef]
84. Rebetzke, G.J.; van Herwaarden, A.F.; Jenkins, C.; Weiss, M.; Lewis, D.; Ruuska, S.; Tabe, L.; Fettell, N.A.;Richards, R.A. Quantitative trait loci for water soluble carbohydrates and associations with agronomic traitsin wheat. Aust. J. Agric. Res. 2008, 59, 891–905. [CrossRef]
85. Zaim, M.; El Hassouni, K.; Gamba, F.; Filali-Maltouf, A.; Belkadi, B.; Ayed, S.; Amri, A.; Nachit, M.;Taghouti, M.; Bassi, F. Wide crosses of durum wheat (Triticum durum Desf.) reveal good disease resistance,yield stability, and industrial quality across Mediterranean sites. Field Crops Res. 2017, 214, 219–227.[CrossRef]
86. Bassi, F.; Sanchez-Garcia, M. Adaptation and stability analysis of ICARDA durum wheat elites across 18countries. Crop Sci. 2017, 57, 2419–2430. [CrossRef]
87. Graziani, M.; Maccaferri, M.; Royo, C.; Salvatorelli, F.; Tuberosa, R. QTL dissection of yield components andmorpho-physiological traits in a durum wheat elite population tested in contrasting thermo-pluviometricconditions. Crop Pasture Sci. 2014, 65, 80–95. [CrossRef]
© 2019 by the authors. Licensee MDPI, Basel, Switzerland. This article is an open accessarticle distributed under the terms and conditions of the Creative Commons Attribution(CC BY) license (http://creativecommons.org/licenses/by/4.0/).
68
agronomy
Article
Screening of Diverse Ethiopian Durum WheatAccessions for Aluminum Tolerance
Edossa Fikiru Wayima 1, Ayalew Ligaba-Osena 2, Kifle Dagne 3, Kassahun Tesfaye 3,
Eunice Magoma Machuka 4, Samuel Kilonzo Mutiga 4 and Emmanuel Delhaize 5,*
1 Department of Plant Sciences, College of Agriculture and Natural Resources, Madda Walabu University,Bale-Robe P.O. Box 247, Ethiopia
2 Laboratory of Molecular Biology and Biotechnology, The University of North Carolina at Greensboro,321 McIver St., 308 Sullivan Science Building, Greensboro, NC 27412, USA
3 Cellular and Molecular Biology Department, College of Natural Sciences, Addis Ababa University,Addis Ababa P.O. Box 1176, Ethiopia
4 Biosciences Eastern and Central Africa-International Livestock Research Institute (BecA-ILRI) Hub, NairobiP.O. Box 30709-00100, Kenya
5 CSIRO Agriculture and Food, GPO Box 1700, Canberra 2601, Australia* Correspondence: [email protected]
Received: 15 July 2019; Accepted: 7 August 2019; Published: 9 August 2019
Abstract: Acid soils and associated Al3+ toxicity are prevalent in Ethiopia where normallyAl3+-sensitive durum wheat (Triticum turgidum ssp durum Desf.) is an important crop. To identifya source of Al3+ tolerance, we screened diverse Ethiopian durum germplasm. As a center of diversityfor durum wheat coupled with the strong selection pressure imposed by extensive acid soils, it wasconceivable that Al3+ tolerance had evolved in Ethiopian germplasm. We used a rapid methodon seedlings to rate Al3+ tolerance according to the length of seminal roots. From 595 accessionsscreened using the rapid method, we identified 21 tolerant, 180 intermediate, and 394 sensitiveaccessions. When assessed in the field the accessions had tolerance rankings consistent with the rapidscreen. However, a molecular marker specific for the D-genome showed that all accessions ratedas Al3+-tolerant or of intermediate tolerance were hexaploid wheat (Triticum aestivum L.) that hadcontaminated the durum grain stocks. The absence of Al3+ tolerance in durum has implications forhow Al3+ tolerance evolved in bread wheat. There remains a need for a source of Al3+-tolerancegenes for durum wheat and previous work that introgressed genes from bread wheat into durumwheat is discussed as a potential source for enhancing the Al3+ tolerance of durum germplasm.
Keywords: aluminum; resistance; Ethiopia; durum; hydroponics; soil acidity; Triticum turgidum ssp.durum Desf.
1. Introduction
Durum (Triticum turgidum ssp durum Desf.) wheat and bread wheat (Triticum aestivum L.) providethe Ethiopian population with a large proportion of its caloric intake [1,2]. Despite a general increasein production and productivity of wheat during the last two decades (1998–2016), Ethiopia importsa substantial amount of both durum and bread wheat. Durum production as a proportion of the totalwheat produced in Ethiopia has declined over the past few decades from about 80% in the 1980s toan estimated current proportion of only about 20%. Despite a reduction in the proportion of grainproduced in Ethiopia, durum constitutes 50% to 80% of the wheat grain imported in any given year [1],indicating that demand for durum remains strong. One of the abiotic stresses that may be contributingto the decline in durum production is the prevalence of acid soils in Ethiopia. Durum wheat is verysensitive of the toxic Al3+ found in acid soil and is the most sensitive of the small-grained crops to Al3+
Agronomy 2019, 9, 440; doi:10.3390/agronomy9080440 www.mdpi.com/journal/agronomy69
Agronomy 2019, 9, 440
toxicity [3]. By contrast, bread wheat has Al3+-tolerant alleles of TaALMT1 [4] and TaMATE1B [5] alongwith other yet to be cloned Al3+-tolerance genes [6].
Worldwide, acidic soils are one of the most important limitations to agricultural production [7].In Ethiopia, acid soils account for about 34% of agricultural land area that range from slight to stronglyacidic soils [8]. Acid soils generally occupy the western part of the country extending from southwestto northwest, although strongly acidic soils occur mainly in the western part of the country includingthe lowlands. Acid soils are particularly prevalent in the highlands of Ethiopia [9] and the applicationof lime commonly results in improved yields of various crops [10,11]. The productivity of wheatover acidic areas of Ethiopia is low as compared to parts of the country where soil acidity is absent.For instance, in areas with strongly acidic soils, which occur widely in the western and southwesternparts of the country, the productivity of wheat is as low as 0.8–2.0 t/ha. These areas include WestWallaga, Illu-Ababora, Jimma, Gamo Gofa, Asosa, and Metekel zones. On the other hand, a relativelyhigher grain yield, ranging from 2.5 to 3.1 t/ha, is obtained in regions with near neutral soil pHincluding West Arsi, Arsi, Siltie, East Shewa, and Bale zones (Supplementary Materials file, Table S1).
Aluminum is solubilized in acid soils into the toxic Al3+ which in sensitive plants typicallyaffects the viability of the root apex. Al3+ inhibits root growth resulting in reduced uptake of waterand nutrients ultimately hindering plant growth and development [12]. In addition to its toxic effectson plant tissues, Al3+ affects nutrient availability within the soil. All of these effects significantly reducecrop yield. While management, primarily by application of lime, is important for neutralizing acidsoils, this can be costly and it can take years to correct acidity at depth. A complementary strategy forimproving crop production on acid soils is the use of Al3+-tolerant germplasm developed throughbreeding or genetic modification along with liming practices. In several crop species, variation inAl3+ tolerance has been identified and selective breeding programs can be implemented to increaseproduction on acid soils [13–15]. However as noted above, durum wheat is one of the most Al3+
sensitive of the small-grained crops and shows little variation in Al3+ tolerance [16]. Bread wheat ishexaploid and possesses the A-, B-, and D-genomes whereas durum wheat is tetraploid possessingonly the A- and B-genomes. Although, as noted below, a major gene for Al3+ tolerance is foundon the D-genome of bread wheat, there are other genes for Al3+ tolerance in bread wheat found onthe A- and B-genomes [6]. Early reports that identified Al3+-tolerant durum genotypes with a level oftolerance similar to that of bread wheat [17] can now be attributed to misidentification or contaminationof durum grain stocks with bread wheat [18], highlighting the importance of verifying the geneticidentity of germplasm. Bread wheat, in contrast to durum, shows a large variation in Al3+ toleranceand much of this is conditioned by alleles of the TaALMT1 gene located on chromosome 4D [19]and TaMATE1B located on chromosome 4B. TaALMT1 encodes an Al3+-activated membrane channelpermeable to malate with the malate exuded by root apices binding toxic Al3+ to protect the developingroots. Another Al3+ tolerance gene in bread wheat is TaMATE1B that encodes a citrate transporterin the plasma membrane and in some bread wheat genotypes confers a lower level of tolerance thanTaALMT1 [20] whereas in other genotypes TaMATE1B appears to be the predominant Al3+ tolerancegene [21]. Both TaALMT1 and TaMATE1B have been introgressed from bread wheat into durum wheat.This required use of the pairing homeologous (ph1c) mutant to enable TaALMT1 to be transferred fromchromosome 4D in bread wheat to chromosome 4B in durum wheat [20]. In contrast to bread wheat,for durum seedlings grown on acid soil, TaMATE1B appears to provide a greater level of Al3+ tolerancethan TaALMT1 for reasons that are not understood.
Ethiopia has been considered as a center of diversity for durum germplasm and landraces grownby farmers are a potential source of agronomically important genes [22,23]. A 90 K single nucleotidepolymorphism (SNP) chip analysis supports the notion that durum wheat in Ethiopia is particularlydiverse [24]. Furthermore, others undertaking similar phylogenetic analyses based on SNP markershave suggested that Ethiopia is a second center of origin for durum wheat [25]. We speculated thatbecause of the diversity of the durum germplasm coupled with a strong selection pressure imposed byextensive areas of acid soils in Ethiopia useful levels of Al3+ tolerance could have evolved in Ethiopian
70
Agronomy 2019, 9, 440
durum landraces. Cultivated durum genotypes sourced from various countries were found to beall Al3+ sensitive [16] whereas others [26] identified relatively tolerant lines in a similar population.The Ethiopian landraces are likely to be more diverse in their genetic makeup than the populationspreviously screened for tolerance and provide an opportunity to identify unique genes that confertolerance of acid soils and Al3+ toxicity in particular. As an initial strategy it would be preferable toidentify Al3+ tolerance in germplasm already adapted to Ethiopian conditions instead of introgressinggenes from other sources. In this study we screened a diverse set of Ethiopian durum germplasmfor Al3+ tolerance using a rapid hydroponic screen and then assessed selected lines more thoroughlyin the hydroponic screen and finally in field trials on acid soil. Despite Ethiopia having conditionsthat would favor the evolution of Al3+ tolerance, the diverse durum germplasm was found to be Al3+
sensitive and highlighted the importance of verifying the identity of grain stocks. The absence of Al3+
tolerance genes in diverse durum germplasm suggests that genes encoding Al3+ tolerance found onthe A- and B-genomes of bread wheat arose subsequent to the hybridization with the D-genome thatproduced hexaploid wheat.
2. Materials and Methods
2.1. Germplasm
A total of 595 durum wheat accessions obtained from the Ethiopian Biodiversity Institute(EBI: www.ibc.gov.et; Supplementary Materials file, Table S2), were screened in a series of non-replicatedtrials for their Al3+ tolerance using a rapid hydroponic screen. Based on their performance at thispreliminary stage, accessions were classified as Al3+-tolerant, -intermediate, or -sensitive (see below).Subsequently all the tolerant as well as selected accessions of the intermediate and sensitive classes,totaling 150 accessions, were evaluated in a replicated hydroponic experiment and a field trial.For the experiments that screened previously identified Al3+-tolerant lines of durum the selected linesare described by Raman et al. [26]. A durum line (Langdon 4D (4B)) that has the 4B chromosomesubstituted by the 4D chromosome of bread wheat [27] was included as a positive control of a confirmedAl3+-tolerant durum line [18].
2.2. Hydroponic Culture
A rapid hydroponic screening was undertaken using an apparatus comprised of a plastic basin(for holding nutrient solution), a plate that held seed of different wheat accessions separately submergedin nutrient solution and an aeration system (Supplementary Materials file, Figure S1). The method isbased on one described previously [16]. Seedlings grown submerged in the aerated nutrient solutionremained viable and could be transplanted to soil when required to bulk up grain. Grain harvestedfrom single plants of selected seedlings from this “preliminary” screen was then used in a replicatedhydroponic experiment using the same growth conditions. For the replicated experiment, the averageperformance of 10 seedlings for each accession was determined and the experiment repeated three times.
The nutrient solution comprised of 500 μM KNO3, 500 μM CaCl2, 500 μM NH4NO3, 150 μMMgSO4, 10 μM KH2PO4, 2 μM FeCl3, and 5 μM of Al2SO4.18H2O as described previously [28]. The pHof the solution was adjusted to about 4.3 with 1 M HCl. Dry grain was immersed in the solutionand seedlings allowed to grow submerged for 5 days in the solution culture with the nutrient solutionchanged every day to maintain pH and Al3+ concentration relatively constant. After 5 days seedlingshad typically developed three seminal roots and the total root length was recorded to the nearest 0.1 cm.
We used conventional hydroponics with the same nutrient solution composition as describedabove to compare the Al3+ tolerance of a set of durum and bread wheat genotypes in a range of AlCl3concentrations. Relative root length for the various genotypes was calculated after 3 days growthas root length in solution that contained Al3+ relative to root length in control solution that lacked Al3+.Errors associated with relative root length were calculated as described previously [29].
71
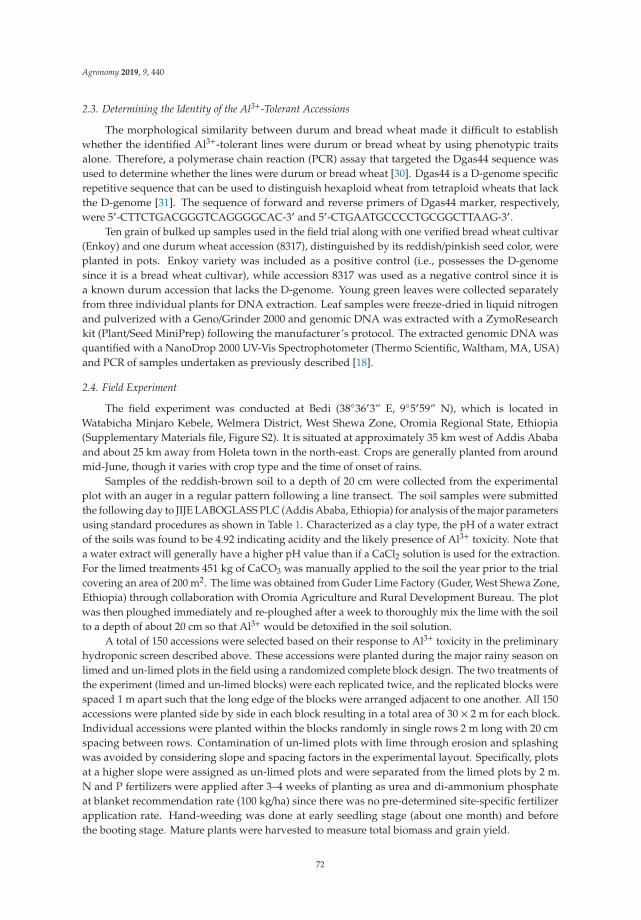
Agronomy 2019, 9, 440
2.3. Determining the Identity of the Al3+-Tolerant Accessions
The morphological similarity between durum and bread wheat made it difficult to establishwhether the identified Al3+-tolerant lines were durum or bread wheat by using phenotypic traitsalone. Therefore, a polymerase chain reaction (PCR) assay that targeted the Dgas44 sequence wasused to determine whether the lines were durum or bread wheat [30]. Dgas44 is a D-genome specificrepetitive sequence that can be used to distinguish hexaploid wheat from tetraploid wheats that lackthe D-genome [31]. The sequence of forward and reverse primers of Dgas44 marker, respectively,were 5′-CTTCTGACGGGTCAGGGGCAC-3′ and 5′-CTGAATGCCCCTGCGGCTTAAG-3′.
Ten grain of bulked up samples used in the field trial along with one verified bread wheat cultivar(Enkoy) and one durum wheat accession (8317), distinguished by its reddish/pinkish seed color, wereplanted in pots. Enkoy variety was included as a positive control (i.e., possesses the D-genomesince it is a bread wheat cultivar), while accession 8317 was used as a negative control since it isa known durum accession that lacks the D-genome. Young green leaves were collected separatelyfrom three individual plants for DNA extraction. Leaf samples were freeze-dried in liquid nitrogenand pulverized with a Geno/Grinder 2000 and genomic DNA was extracted with a ZymoResearchkit (Plant/Seed MiniPrep) following the manufacturer’s protocol. The extracted genomic DNA wasquantified with a NanoDrop 2000 UV-Vis Spectrophotometer (Thermo Scientific, Waltham, MA, USA)and PCR of samples undertaken as previously described [18].
2.4. Field Experiment
The field experiment was conducted at Bedi (38◦36′3” E, 9◦5′59” N), which is located inWatabicha Minjaro Kebele, Welmera District, West Shewa Zone, Oromia Regional State, Ethiopia(Supplementary Materials file, Figure S2). It is situated at approximately 35 km west of Addis Ababaand about 25 km away from Holeta town in the north-east. Crops are generally planted from aroundmid-June, though it varies with crop type and the time of onset of rains.
Samples of the reddish-brown soil to a depth of 20 cm were collected from the experimentalplot with an auger in a regular pattern following a line transect. The soil samples were submittedthe following day to JIJE LABOGLASS PLC (Addis Ababa, Ethiopia) for analysis of the major parametersusing standard procedures as shown in Table 1. Characterized as a clay type, the pH of a water extractof the soils was found to be 4.92 indicating acidity and the likely presence of Al3+ toxicity. Note thata water extract will generally have a higher pH value than if a CaCl2 solution is used for the extraction.For the limed treatments 451 kg of CaCO3 was manually applied to the soil the year prior to the trialcovering an area of 200 m2. The lime was obtained from Guder Lime Factory (Guder, West Shewa Zone,Ethiopia) through collaboration with Oromia Agriculture and Rural Development Bureau. The plotwas then ploughed immediately and re-ploughed after a week to thoroughly mix the lime with the soilto a depth of about 20 cm so that Al3+ would be detoxified in the soil solution.
A total of 150 accessions were selected based on their response to Al3+ toxicity in the preliminaryhydroponic screen described above. These accessions were planted during the major rainy season onlimed and un-limed plots in the field using a randomized complete block design. The two treatments ofthe experiment (limed and un-limed blocks) were each replicated twice, and the replicated blocks werespaced 1 m apart such that the long edge of the blocks were arranged adjacent to one another. All 150accessions were planted side by side in each block resulting in a total area of 30 × 2 m for each block.Individual accessions were planted within the blocks randomly in single rows 2 m long with 20 cmspacing between rows. Contamination of un-limed plots with lime through erosion and splashingwas avoided by considering slope and spacing factors in the experimental layout. Specifically, plotsat a higher slope were assigned as un-limed plots and were separated from the limed plots by 2 m.N and P fertilizers were applied after 3–4 weeks of planting as urea and di-ammonium phosphateat blanket recommendation rate (100 kg/ha) since there was no pre-determined site-specific fertilizerapplication rate. Hand-weeding was done at early seedling stage (about one month) and beforethe booting stage. Mature plants were harvested to measure total biomass and grain yield.
72
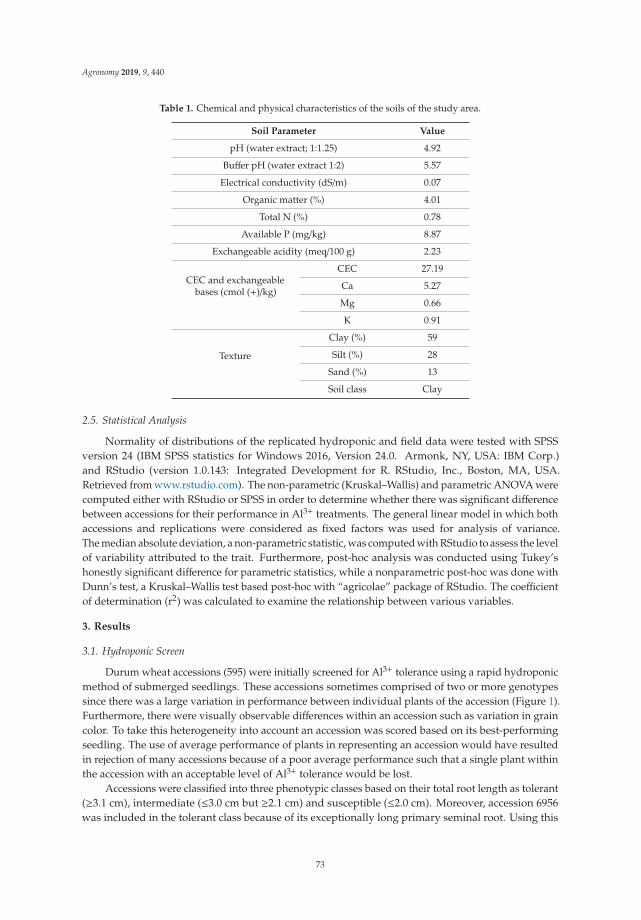
Agronomy 2019, 9, 440
Table 1. Chemical and physical characteristics of the soils of the study area.
Soil Parameter Value
pH (water extract; 1:1.25) 4.92
Buffer pH (water extract 1:2) 5.57
Electrical conductivity (dS/m) 0.07
Organic matter (%) 4.01
Total N (%) 0.78
Available P (mg/kg) 8.87
Exchangeable acidity (meq/100 g) 2.23
CEC and exchangeablebases (cmol (+)/kg)
CEC 27.19
Ca 5.27
Mg 0.66
K 0.91
Texture
Clay (%) 59
Silt (%) 28
Sand (%) 13
Soil class Clay
2.5. Statistical Analysis
Normality of distributions of the replicated hydroponic and field data were tested with SPSSversion 24 (IBM SPSS statistics for Windows 2016, Version 24.0. Armonk, NY, USA: IBM Corp.)and RStudio (version 1.0.143: Integrated Development for R. RStudio, Inc., Boston, MA, USA.Retrieved from www.rstudio.com). The non-parametric (Kruskal–Wallis) and parametric ANOVA werecomputed either with RStudio or SPSS in order to determine whether there was significant differencebetween accessions for their performance in Al3+ treatments. The general linear model in which bothaccessions and replications were considered as fixed factors was used for analysis of variance.The median absolute deviation, a non-parametric statistic, was computed with RStudio to assess the levelof variability attributed to the trait. Furthermore, post-hoc analysis was conducted using Tukey’shonestly significant difference for parametric statistics, while a nonparametric post-hoc was done withDunn’s test, a Kruskal–Wallis test based post-hoc with “agricolae” package of RStudio. The coefficientof determination (r2) was calculated to examine the relationship between various variables.
3. Results
3.1. Hydroponic Screen
Durum wheat accessions (595) were initially screened for Al3+ tolerance using a rapid hydroponicmethod of submerged seedlings. These accessions sometimes comprised of two or more genotypessince there was a large variation in performance between individual plants of the accession (Figure 1).Furthermore, there were visually observable differences within an accession such as variation in graincolor. To take this heterogeneity into account an accession was scored based on its best-performingseedling. The use of average performance of plants in representing an accession would have resultedin rejection of many accessions because of a poor average performance such that a single plant withinthe accession with an acceptable level of Al3+ tolerance would be lost.
Accessions were classified into three phenotypic classes based on their total root length as tolerant(≥3.1 cm), intermediate (≤3.0 cm but ≥2.1 cm) and susceptible (≤2.0 cm). Moreover, accession 6956was included in the tolerant class because of its exceptionally long primary seminal root. Using this
73
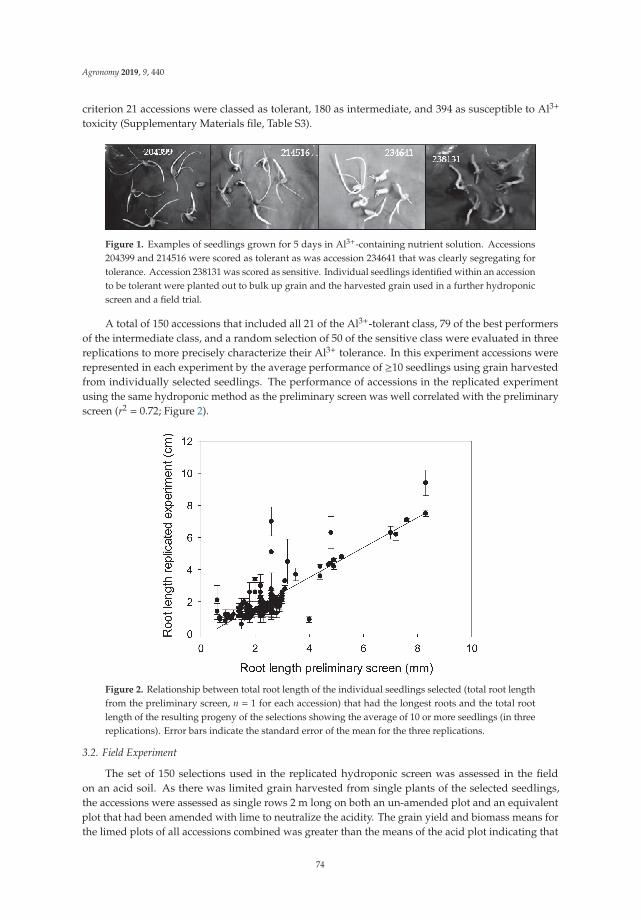
Agronomy 2019, 9, 440
criterion 21 accessions were classed as tolerant, 180 as intermediate, and 394 as susceptible to Al3+
toxicity (Supplementary Materials file, Table S3).
Figure 1. Examples of seedlings grown for 5 days in Al3+-containing nutrient solution. Accessions204399 and 214516 were scored as tolerant as was accession 234641 that was clearly segregating fortolerance. Accession 238131 was scored as sensitive. Individual seedlings identified within an accessionto be tolerant were planted out to bulk up grain and the harvested grain used in a further hydroponicscreen and a field trial.
A total of 150 accessions that included all 21 of the Al3+-tolerant class, 79 of the best performersof the intermediate class, and a random selection of 50 of the sensitive class were evaluated in threereplications to more precisely characterize their Al3+ tolerance. In this experiment accessions wererepresented in each experiment by the average performance of ≥10 seedlings using grain harvestedfrom individually selected seedlings. The performance of accessions in the replicated experimentusing the same hydroponic method as the preliminary screen was well correlated with the preliminaryscreen (r2 = 0.72; Figure 2).
Figure 2. Relationship between total root length of the individual seedlings selected (total root lengthfrom the preliminary screen, n = 1 for each accession) that had the longest roots and the total rootlength of the resulting progeny of the selections showing the average of 10 or more seedlings (in threereplications). Error bars indicate the standard error of the mean for the three replications.
3.2. Field Experiment
The set of 150 selections used in the replicated hydroponic screen was assessed in the fieldon an acid soil. As there was limited grain harvested from single plants of the selected seedlings,the accessions were assessed as single rows 2 m long on both an un-amended plot and an equivalentplot that had been amended with lime to neutralize the acidity. The grain yield and biomass means forthe limed plots of all accessions combined was greater than the means of the acid plot indicating that
74
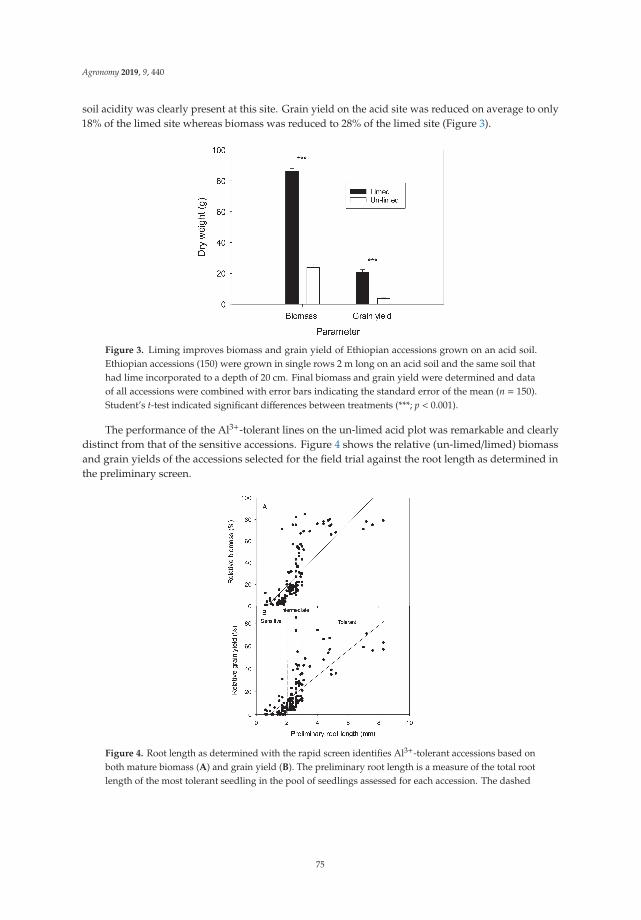
Agronomy 2019, 9, 440
soil acidity was clearly present at this site. Grain yield on the acid site was reduced on average to only18% of the limed site whereas biomass was reduced to 28% of the limed site (Figure 3).
Figure 3. Liming improves biomass and grain yield of Ethiopian accessions grown on an acid soil.Ethiopian accessions (150) were grown in single rows 2 m long on an acid soil and the same soil thathad lime incorporated to a depth of 20 cm. Final biomass and grain yield were determined and dataof all accessions were combined with error bars indicating the standard error of the mean (n = 150).Student’s t-test indicated significant differences between treatments (***; p < 0.001).
The performance of the Al3+-tolerant lines on the un-limed acid plot was remarkable and clearlydistinct from that of the sensitive accessions. Figure 4 shows the relative (un-limed/limed) biomassand grain yields of the accessions selected for the field trial against the root length as determined inthe preliminary screen.
Figure 4. Root length as determined with the rapid screen identifies Al3+-tolerant accessions based onboth mature biomass (A) and grain yield (B). The preliminary root length is a measure of the total rootlength of the most tolerant seedling in the pool of seedlings assessed for each accession. The dashed
75
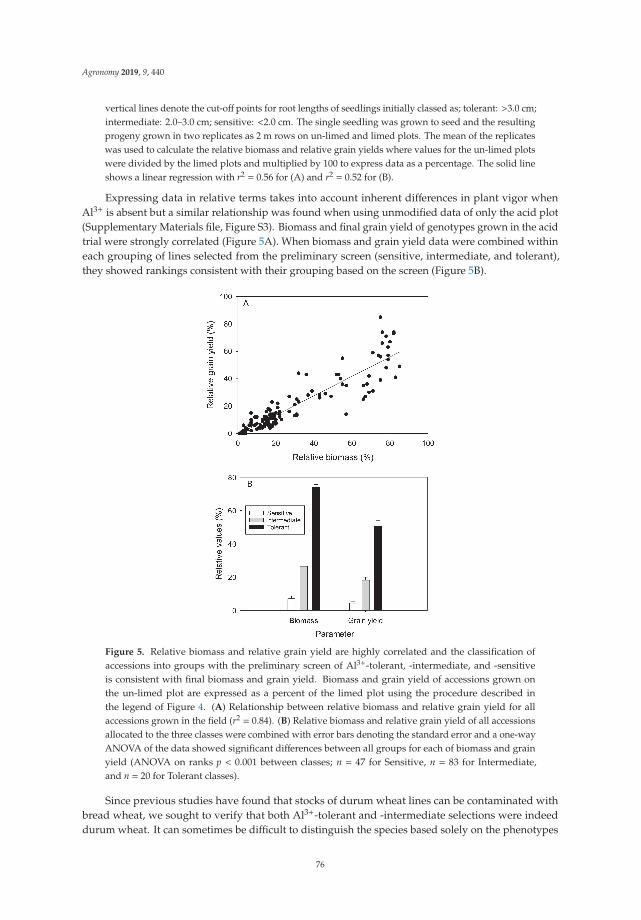
Agronomy 2019, 9, 440
vertical lines denote the cut-off points for root lengths of seedlings initially classed as; tolerant: >3.0 cm;intermediate: 2.0–3.0 cm; sensitive: <2.0 cm. The single seedling was grown to seed and the resultingprogeny grown in two replicates as 2 m rows on un-limed and limed plots. The mean of the replicateswas used to calculate the relative biomass and relative grain yields where values for the un-limed plotswere divided by the limed plots and multiplied by 100 to express data as a percentage. The solid lineshows a linear regression with r2 = 0.56 for (A) and r2 = 0.52 for (B).
Expressing data in relative terms takes into account inherent differences in plant vigor whenAl3+ is absent but a similar relationship was found when using unmodified data of only the acid plot(Supplementary Materials file, Figure S3). Biomass and final grain yield of genotypes grown in the acidtrial were strongly correlated (Figure 5A). When biomass and grain yield data were combined withineach grouping of lines selected from the preliminary screen (sensitive, intermediate, and tolerant),they showed rankings consistent with their grouping based on the screen (Figure 5B).
Figure 5. Relative biomass and relative grain yield are highly correlated and the classification ofaccessions into groups with the preliminary screen of Al3+-tolerant, -intermediate, and -sensitiveis consistent with final biomass and grain yield. Biomass and grain yield of accessions grown onthe un-limed plot are expressed as a percent of the limed plot using the procedure described inthe legend of Figure 4. (A) Relationship between relative biomass and relative grain yield for allaccessions grown in the field (r2 = 0.84). (B) Relative biomass and relative grain yield of all accessionsallocated to the three classes were combined with error bars denoting the standard error and a one-wayANOVA of the data showed significant differences between all groups for each of biomass and grainyield (ANOVA on ranks p < 0.001 between classes; n = 47 for Sensitive, n = 83 for Intermediate,and n = 20 for Tolerant classes).
Since previous studies have found that stocks of durum wheat lines can be contaminated withbread wheat, we sought to verify that both Al3+-tolerant and -intermediate selections were indeeddurum wheat. It can sometimes be difficult to distinguish the species based solely on the phenotypes
76
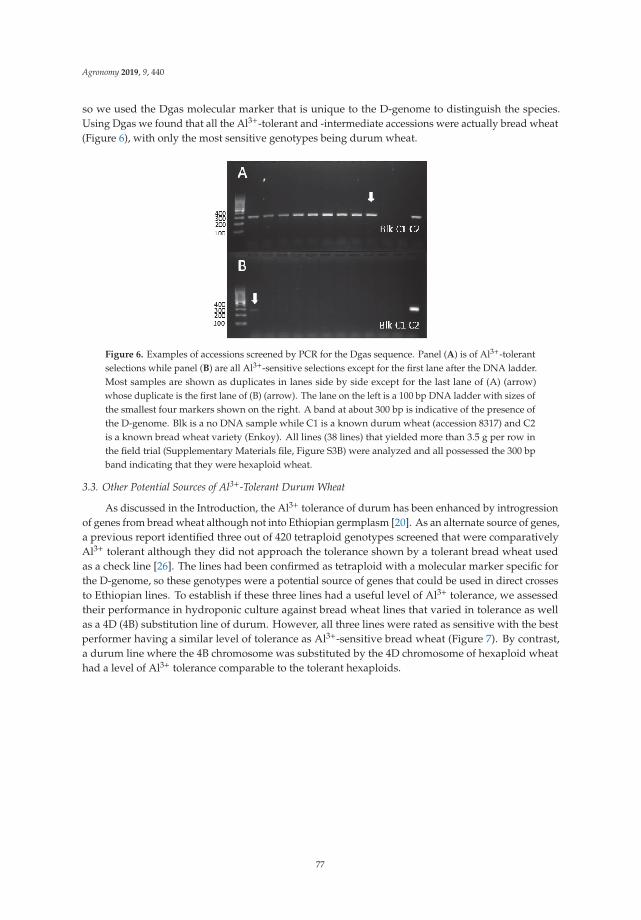
Agronomy 2019, 9, 440
so we used the Dgas molecular marker that is unique to the D-genome to distinguish the species.Using Dgas we found that all the Al3+-tolerant and -intermediate accessions were actually bread wheat(Figure 6), with only the most sensitive genotypes being durum wheat.
Figure 6. Examples of accessions screened by PCR for the Dgas sequence. Panel (A) is of Al3+-tolerantselections while panel (B) are all Al3+-sensitive selections except for the first lane after the DNA ladder.Most samples are shown as duplicates in lanes side by side except for the last lane of (A) (arrow)whose duplicate is the first lane of (B) (arrow). The lane on the left is a 100 bp DNA ladder with sizes ofthe smallest four markers shown on the right. A band at about 300 bp is indicative of the presence ofthe D-genome. Blk is a no DNA sample while C1 is a known durum wheat (accession 8317) and C2is a known bread wheat variety (Enkoy). All lines (38 lines) that yielded more than 3.5 g per row inthe field trial (Supplementary Materials file, Figure S3B) were analyzed and all possessed the 300 bpband indicating that they were hexaploid wheat.
3.3. Other Potential Sources of Al3+-Tolerant Durum Wheat
As discussed in the Introduction, the Al3+ tolerance of durum has been enhanced by introgressionof genes from bread wheat although not into Ethiopian germplasm [20]. As an alternate source of genes,a previous report identified three out of 420 tetraploid genotypes screened that were comparativelyAl3+ tolerant although they did not approach the tolerance shown by a tolerant bread wheat usedas a check line [26]. The lines had been confirmed as tetraploid with a molecular marker specific forthe D-genome, so these genotypes were a potential source of genes that could be used in direct crossesto Ethiopian lines. To establish if these three lines had a useful level of Al3+ tolerance, we assessedtheir performance in hydroponic culture against bread wheat lines that varied in tolerance as wellas a 4D (4B) substitution line of durum. However, all three lines were rated as sensitive with the bestperformer having a similar level of tolerance as Al3+-sensitive bread wheat (Figure 7). By contrast,a durum line where the 4B chromosome was substituted by the 4D chromosome of hexaploid wheathad a level of Al3+ tolerance comparable to the tolerant hexaploids.
77
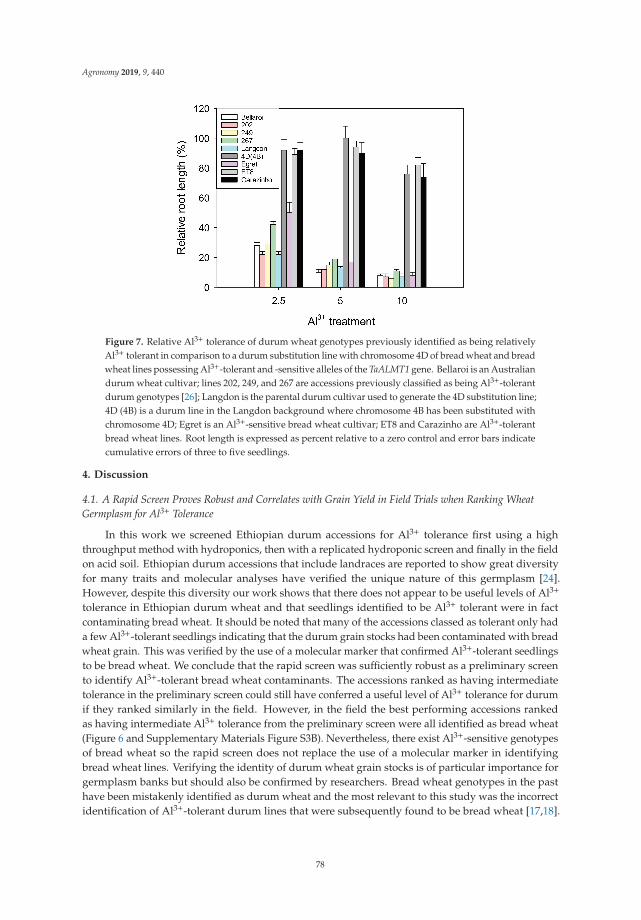
Agronomy 2019, 9, 440
Figure 7. Relative Al3+ tolerance of durum wheat genotypes previously identified as being relativelyAl3+ tolerant in comparison to a durum substitution line with chromosome 4D of bread wheat and breadwheat lines possessing Al3+-tolerant and -sensitive alleles of the TaALMT1 gene. Bellaroi is an Australiandurum wheat cultivar; lines 202, 249, and 267 are accessions previously classified as being Al3+-tolerantdurum genotypes [26]; Langdon is the parental durum cultivar used to generate the 4D substitution line;4D (4B) is a durum line in the Langdon background where chromosome 4B has been substituted withchromosome 4D; Egret is an Al3+-sensitive bread wheat cultivar; ET8 and Carazinho are Al3+-tolerantbread wheat lines. Root length is expressed as percent relative to a zero control and error bars indicatecumulative errors of three to five seedlings.
4. Discussion
4.1. A Rapid Screen Proves Robust and Correlates with Grain Yield in Field Trials when Ranking WheatGermplasm for Al3+ Tolerance
In this work we screened Ethiopian durum accessions for Al3+ tolerance first using a highthroughput method with hydroponics, then with a replicated hydroponic screen and finally in the fieldon acid soil. Ethiopian durum accessions that include landraces are reported to show great diversityfor many traits and molecular analyses have verified the unique nature of this germplasm [24].However, despite this diversity our work shows that there does not appear to be useful levels of Al3+
tolerance in Ethiopian durum wheat and that seedlings identified to be Al3+ tolerant were in factcontaminating bread wheat. It should be noted that many of the accessions classed as tolerant only hada few Al3+-tolerant seedlings indicating that the durum grain stocks had been contaminated with breadwheat grain. This was verified by the use of a molecular marker that confirmed Al3+-tolerant seedlingsto be bread wheat. We conclude that the rapid screen was sufficiently robust as a preliminary screento identify Al3+-tolerant bread wheat contaminants. The accessions ranked as having intermediatetolerance in the preliminary screen could still have conferred a useful level of Al3+ tolerance for durumif they ranked similarly in the field. However, in the field the best performing accessions rankedas having intermediate Al3+ tolerance from the preliminary screen were all identified as bread wheat(Figure 6 and Supplementary Materials Figure S3B). Nevertheless, there exist Al3+-sensitive genotypesof bread wheat so the rapid screen does not replace the use of a molecular marker in identifyingbread wheat lines. Verifying the identity of durum wheat grain stocks is of particular importance forgermplasm banks but should also be confirmed by researchers. Bread wheat genotypes in the pasthave been mistakenly identified as durum wheat and the most relevant to this study was the incorrectidentification of Al3+-tolerant durum lines that were subsequently found to be bread wheat [17,18].
78
Agronomy 2019, 9, 440
In some cases, bread wheat has morphological characteristics in the field that are similar to durumwheat emphasizing the need for molecular analysis to establish the species identity [32].
The absence of Al3+ tolerance in unmodified Triticum turgidum ssp durum Desf. is consistentwith previous studies that screened durum cultivars with presumably a lower level of diversity thanthe Ethiopian germplasm and also showed no or only a comparatively low level of Al3+ tolerance [16].The simple and rapid screen undertaken with minimal equipment over only 5 days growth withseedlings submerged in nutrient solution showed a remarkable consistency in classifying the relativetolerance of germplasm grown in the field and measured for mature biomass and even grain yield(Figure 5B). Although there was a good general agreement of the hydroponic screens with performanceof accessions in the field, there were exceptions. For instance, several accessions rated as havingintermediate tolerance with the preliminary screen were the best or amongst the best for grain yield inthe field (Figure 4B). This finding emphasizes the importance of verifying selections on acid soil whetherin the field or in pots and that while hydroponic screens allow for rapid assessment of germplasm,the relative tolerance of genotypes can differ when grown in soil. For instance, a durum line carryingthe TaMATE1B gene introgressed from hexaploid wheat (see below) shows marginal Al3+-tolerance inhydroponics that is considerably less than a line carrying TaALMT1, whereas the situation is reversedwhen the lines are grown on acid soil, with TaMATE1B lines outperforming TaALMT1 lines [20].
4.2. The Evolution of Al3+ Tolerance in Bread Wheat Occurred Subsequent to the Hybridization ofthe D-Genome
Here we show that durum lines previously reported to be relatively Al3+-tolerant [26] had a levelof tolerance similar to sensitive wheat (Figure 7), confirming the absence of useful Al3+ tolerance indurum wheat germplasm (excluding lines where genes from hexaploid wheat have been introgressedas discussed below). This observation is puzzling given reports of the presence of Al3+ tolerance geneson the A- and B-genomes of bread wheat. Although TaALMT1, the major gene for Al3+ tolerance inbread wheat, is located on chromosome 4D, there are several loci on the A- and B-genomes reported toconfer Al3+ tolerance [6]. For example, TaMATE1B the only Al3+ tolerance gene other than TaALMT1that has been cloned from bread wheat, is located on chromosome 4B [33]. We surmise that the absenceof Al3+ tolerance genes in diverse durum germplasm suggests that the multiple Al3+ tolerance genesfound in bread wheat arose subsequent to the hybridization of the D-genome with the A- and B-genomessome 10,000 years ago. Transposable elements have been shown to enhance the level of expression ofgenes encoding transport proteins such as those of the MATE family [34] that confer Al3+ tolerance.The event of polyploidization commonly results in genome instability including the activation oftransposable elements [35]. It is conceivable that activation of transposons when the hexaploid wasformed has been key in enabling bread wheat to evolve Al3+ tolerance.
4.3. Strategies to Enhance the Al3+ Tolerance of Ethiopian Durum Wheat
To date the only durum germplasm verified to be Al3+ tolerant are those that were developedby introgression of Al3+ tolerance genes from bread wheat into durum wheat [20]. In those cases,the ph1c mutant was used to introgress the TaALMT1 gene located on chromosome 4D of bread wheatand steps taken to avoid the hybrid necrosis that can occur when crossing bread to durum wheat tointrogress the TaMATE1B gene on chromosome 4B. This germplasm is not considered to be geneticallymodified since it was developed by so-called natural means and can therefore be used in the fieldwithout restrictions. The germplasm is a source of Al3+ tolerance genes in a durum background thatcould be used to introgress one or both genes derived from bread wheat into selected Ethiopian durumgermplasm. Many of the farms that grow durum wheat in Ethiopia are small holdings and it hasbeen found that landraces otherwise known as “farmer’s varieties” perform better than “improved”germplasm under many situations [36]. With this in mind it may be useful to cross the Al3+-tolerantgermplasm described above into selected landraces adapted to local regions. Using local landracesas recurrent parents in multiple backcrosses while tracking the presence of Al3+ tolerance genes using
79
Agronomy 2019, 9, 440
molecular markers should maintain the germplasm with various valuable landrace traits that couldotherwise be lost [37]. The TaMATE1B gene seems a preferred candidate at this stage since it appearsto be more effective than TaALMT1 in a durum background and there exists a co-dominant markerthat can be used to track the tolerant allele [20]. A recent publication has shown that the TaMATE1Bgene introgressed into a durum genetic background confers a marked ability of roots from matureplants to withstand Al3+ toxicity when grown in an acid soil [38]. A simple backcrossing programwhere a single gene is introgressed into landraces could be useful in establishing whether or notTaMATE1B can improve durum grain production of landraces on acid soils of Ethiopia. We speculatethat introgressing both TaALMT1 with TaMATE1B may provide the greatest level of Al3+ tolerance todurum wheat as has been found for some bread wheat genotypes.
5. Conclusions
Here we show that despite the diversity of Ethiopian durum germplasm and large regions of acidsoils, conditions conducive for the evolution of Al3+ tolerance, a useful level of Al3+ tolerance wasnot detected. A high throughput screen identified Al3+-tolerant seedlings within accessions but all ofthem were shown to be contaminating bread wheat. This finding highlights the importance of correctidentification of germplasm and confirmation of species identity with molecular markers particularlyfor closely-related species. The finding that Ethiopian durum germplasm is Al3+ sensitive is consistentwith Al3+ tolerance having evolved in bread wheat subsequent to the hybridization of the D-genomewith the A- and B-genomes. A field trial on acid soil showed biomass and grain yields that correlatedwith classifications based on a high throughput screen, confirming the utility of the rapid screen forpreliminary assessment of germplasm.
Supplementary Materials: The following are available online at http://www.mdpi.com/2073-4395/9/8/440/s1,Figure S1: Photographs of the components of the hydroponic system. (A) The plastic cups to which dry grain wasadded. The holes allowed aeration of grain while the cups themselves separated the accessions from one another.The slots in the plastic stands at the end of a series of cups enabled the long air stone to be inserted and heldfirm. (B) Top view showing air stones and pumps along with the plastic basin used to hold the nutrient solution.(C) Top view of assembled equipment showing plastic cups with a partitioning plate inserted within each cup sothat two accessions could be placed into each cup and separated from one another. Nutrient solution was added tothe basin to fill and cover the cups that held the grain. The holes in the cups allowed sufficient aeration for growthof seedlings. Nutrient solution was changed every day to maintain pH at about 4.3 and Al2SO4 at 5 μM. Figure S2:Location of the study area in Ethiopia. Figure S3: Relationships between Al3+ tolerance determined with a rapidscreen and (A) biomass or (B) grain yield for durum accessions grown on an acid plot in the field. Table S1:Wheat production across zones and special districts of Ethiopia showing yields averaged over 5 years. Table S2:Passport data of durum accessions used in hydroponics screening for Al3+ tolerance. Table S3: Preliminary screenof Al3+ tolerance of 594 Ethiopian durum wheat accessions grown in Al3+-containing nutrient solution wheretotal root length after 5 days growth was used to classify genotypes.
Author Contributions: Conceptualization, E.F.W.; methodology, E.F.W. and E.D.; formal analysis, E.F.W. and E.D.;investigation, E.F.W., E.D., A.L.O.; resources, E.F.W., A.L.O., K.T., E.M.M.; data curation, E.F.W.; writing—originaldraft preparation, E.F.W. and E.D.; writing—review and editing, A.L.O., and K.D.; supervision, E.D., A.L.O., K.D.,K.T. and S.K.M.; project administration, K.T. and E.M.M.; funding acquisition, E.F.W., A.L.O. and K.T.
Funding: The hydroponic and field experiments were sponsored by Addis Ababa University and the EasternAfrica Agricultural Productivity Program, respectively, while the Dgas analysis was financed by the BecA-ILRI Hubthrough the Africa Biosciences Challenge Fund (ABCF) program. The ABCF Program is funded by the AustralianDepartment for Foreign Affairs and Trade (DFAT) through the BecA-CSIRO partnership; the Syngenta Foundationfor Sustainable Agriculture (SFSA); the Bill & Melinda Gates Foundation (BMGF); the UK Department forInternational Development (DFID) and; the Swedish International Development Cooperation Agency (SIDA).
Conflicts of Interest: The authors declare no conflict of interest. The funders had no role in the design of the study;in the collection, analyses, or interpretation of data; in the writing of the manuscript, or in the decision to publishthe results.
80
Agronomy 2019, 9, 440
References
1. Minot, N.; Warner, J.; Lemma, S.; Kasa, L.; Gashaw, A.; Rashid, S. The Wheat Supply Chain in Ethiopia: Patterns,Trends, and Policy Options; International Food Policy Research Institute (IFPRI): Washington, DC, USA, 2015.
2. Sall, A.T.; Chiari, T.; Legesse, W.; Seid-Ahmed, K.; Ortiz, R.; van Ginkel, M.; Bassi, M.F. Durum wheat(Triticum durum Desf.): Origin, cultivation and potential expansion in sub-Saharan Africa. Agronomy 2019,9, 263. [CrossRef]
3. Bona, L.; Wright, R.J.; Baligar, V.C. A rapid method for screening cereals for acid soil tolerance. Cereal Res.Commun. 1991, 19, 465–468.
4. Raman, H.; Ryan, P.R.; Raman, R.; Stodart, B.J.; Zhang, K.; Martin, P.; Wood, R.; Sasaki, T.; Yamamoto, Y.;Mackay, M.; et al. Analysis of TaALMT1 traces the transmission of aluminum resistance in cultivated commonwheat (Triticum aestivum L.). Theor. Appl. Genet. 2008, 116, 343–354. [CrossRef] [PubMed]
5. Aguilera, J.G.; Minozzo, J.A.D.; Barichello, D.; Fogaca, C.M.; da Silva, J.P.; Consoli, L.; Pereira, J.F. Alleles oforganic acid transporter genes are highly correlated with wheat resistance to acidic soil in field conditions.Theor. Appl. Genet. 2016, 129, 1317–1331. [CrossRef] [PubMed]
6. Raman, H.; Stodart, B.; Ryan, P.R.; Delhaize, E.; Emebiri, L.; Raman, R.; Coombes, N.; Milgate, A. Genome-wideassociation analyses of common wheat (Triticum aestivum L.) germplasm identifies multiple loci for aluminiumresistance. Genome 2010, 53, 957–966. [CrossRef] [PubMed]
7. Von Uexküll, H.R.; Mutert, E. Global extent, development and economic impact of acid soils. Plant Soil 1995,171, 1–15. [CrossRef]
8. Wayima, E.F. Classification of Ethiopian soils with pH. J. Soil Sci. Environ. Manag. 2019, in press.9. Kidanemariam, A.; Gebrekidan, H.; Mamo, T.; Kibret, K. Impact of altitude and land use type on some
physical and chemical properties of acidic soils in Tsegede highlands, northern Ethiopia. Open J. Soil Sci.2012, 2, 223–233. [CrossRef]
10. Kidanemariam, A.; Gebrekidan, H.; Mamo, T.; Tesfaye, K. Wheat crop response to liming materials and Nand P fertilizers in acidic soils of Tsegede highlands, northern Ethiopia. Agric. For. Fish. 2013, 2, 126–135.[CrossRef]
11. Mosissa, F. Progress of soil acidity management research in Ethiopia. Greener J. Soil Sci. Plant Nutr. 2018,5, 9–22. [CrossRef]
12. Kochian, L.V.; Pineros, M.A.; Liu, J.P.; Magalhaes, J.V. Plant adaptation to acid soils: The molecular basis forcrop aluminum resistance. Ann. Rev. Plant Biol. 2015, 66, 571–598. [CrossRef] [PubMed]
13. Magalhaes, J.V.; Garvin, D.F.; Wang, Y.H.; Sorrells, M.E.; Klein, P.E.; Schaffert, R.E.; Li, L.; Kochian, L.V.Comparative mapping of a major aluminum tolerance gene in sorghum and other species in the Poaceae.Genetics 2004, 167, 1905–1914. [CrossRef] [PubMed]
14. Bian, M.; Waters, I.; Broughton, S.; Zhang, X.Q.; Zhou, M.X.; Lance, R.; Sun, D.F.; Li, C.D. Development ofgene-specific markers for acid soil/aluminium tolerance in barley (Hordeum vulgare L.). Mol. Breed. 2013,32, 155–164. [CrossRef]
15. Ma, J.F.; Nagao, S.; Sato, K.; Ito, H.; Furukawa, J.; Takeda, K. Molecular mapping of a gene responsible forAl-activated secretion of citrate in barley. J. Exp. Bot. 2004, 55, 1335–1341. [CrossRef] [PubMed]
16. Ryan, P.R.; Raman, H.; Gupta, S.; Sasaki, T.; Yamamoto, Y.; Delhaize, E. The multiple origins of aluminiumresistance in hexaploid wheat include Aegilops tauschii and more recent cis mutations to TaALMT1. Plant J.2010, 64, 446–455. [CrossRef] [PubMed]
17. Foy, C.D. Tolerance of durum wheat lines to an acid, aluminum-toxic subsoil. J. Plant Nutr. 1996, 19, 1381–1394.[CrossRef]
18. Han, C.; Ryan, P.R.; Yan, Z.; Delhaize, E. Introgression of a 4D chromosomal fragment into durum wheatconfers aluminium tolerance. Ann. Bot. 2014, 114, 135–144. [CrossRef]
19. Delhaize, E.; Ma, J.F.; Ryan, P.R. Transcriptional regulation of aluminium tolerance genes. Trends Plant Sci.2012, 17, 341–348. [CrossRef]
20. Han, C.; Zhang, P.; Ryan, P.R.; Rathjen, T.M.; Yan, Z.H.; Delhaize, E. Introgression of genes from bread wheatenhances the aluminium tolerance of durum wheat. Theor. Appl. Genet. 2016, 129, 729–739. [CrossRef]
21. Garcia-Oliveira, A.L.; Martins-Lopes, P.; Tolra, R.; Poschenrieder, C.; Guedes-Pinto, H.; Benito, C. Differentialphysiological responses of Portuguese bread wheat (Triticum aestivum L.) genotypes under aluminium stress.Diversity 2016, 8, 26. [CrossRef]
81
Agronomy 2019, 9, 440
22. Mengistu, D.K.; Kidane, Y.G.; Fadda, C.; Pe, M.E. Genetic diversity in Ethiopian durum wheat(Triticum turgidum var durum) inferred from phenotypic variations. Plant Genet. Res. Charact. Util.2018, 16, 39–49. [CrossRef]
23. Mengistu, D.K.; Kiros, A.Y.; Pe, M.E. Phenotypic diversity in Ethiopian durum wheat (Triticum turgidum var.durum) landraces. Crop J. 2015, 3, 190–199. [CrossRef]
24. Mengistu, D.K.; Kidane, Y.G.; Catellani, M.; Frascaroli, E.; Fadda, C.; Pe, M.E.; Dell’Acqua, M. High-densitymolecular characterization and association mapping in Ethiopian durum wheat landraces reveals highdiversity and potential for wheat breeding. Plant Biotechnol. J. 2016, 14, 1800–1812. [CrossRef] [PubMed]
25. Kabbaj, H.; Sall, A.T.; Al-Abdallat, A.; Geleta, M.; Amri, A.; Filali-Maltouf, A.; Belkadi, B.; Ortiz, R.; Bassi, F.M.Genetic diversity within a global panel of durum wheat (Triticum durum) landraces and modern germplasmreveals the history of alleles exchange. Front. Plant Sci. 2017, 8, 1277. [CrossRef] [PubMed]
26. Raman, H.; Hare, R.; Graham, K.; Coombes, N.; Raman, R. Characterisation of durum germplasm foraluminium resistance using nutrient solution culture. In International Wheat Genetics Symposium; Appels, R.,Lagudah, R.E.E., Langridge, P., Mackay, M., McIntyre, L., Sharp, P., Eds.; Sydney University Press: Brisbane,Australia, 2008; pp. 1–3.
27. Joppa, L.R.; Williams, N.D. Langdon durum disomic substitution lines and aneuploid analysis in tetraploidwheat. Genome 1988, 30, 222–228. [CrossRef]
28. Delhaize, E.; Ryan, P.R.; Hebb, D.M.; Yamamoto, Y.; Sasaki, T.; Matsumoto, H. Engineering high-levelaluminum tolerance in barley with the ALMT1 gene. Proc. Natl. Acad. Sci. USA 2004, 101, 15249–15254.[CrossRef] [PubMed]
29. Zhou, G.F.; Delhaize, E.; Zhou, M.X.; Ryan, P.R. The barley MATE gene, HvAACT1, increases citrate effluxand Al+3 tolerance when expressed in wheat and barley. Ann. Bot. 2013, 112, 603–612. [CrossRef] [PubMed]
30. Bryan, G.J.; Dixon, A.; Gale, M.D.; Wiseman, G. A PCR-based method for the detection of hexaploid breadwheat adulteration of durum wheat and pasta. J. Cereal Sci. 1998, 28, 135–145. [CrossRef]
31. McNeil, D.; Lagudah, E.S.; Hohmann, U.; Appels, R. Amplification of DNA-sequences in wheat and itsrelatives—the Dgas44 and R350 families of repetitive sequences. Genome 1994, 37, 320–327. [CrossRef]
32. Zeven, A.C.; Waninge, J. The presence of 3 groups of Scalavatis and other hexaploid bread wheat plantscontaminating durum-wheat fields in Cyprus. Euphytica 1989, 43, 117–124. [CrossRef]
33. Tovkach, A.; Ryan, P.R.; Richardson, A.E.; Lewis, D.C.; Rathjen, T.M.; Ramesh, S.; Tyerman, S.D.; Delhaize, E.Transposon-mediated alteration of TaMATE1B expression in wheat confers constitutive citrate efflux fromroot apices. Plant Physiol. 2013, 161, 880–892. [CrossRef]
34. Pereira, J.F.; Ryan, P.R. The role of transposable elements in the evolution of aluminium resistance in plants.J. Exp. Bot. 2019, 70, 41–54. [CrossRef] [PubMed]
35. Madlung, A.; Tyagi, A.P.; Watson, B.; Jiang, H.; Kagochi, T.; Doerge, R.W.; Martienssen, R.; Comai, L. Genomicchanges in synthetic Arabidopsis polyploids. Plant J. 2005, 41, 221–230. [CrossRef] [PubMed]
36. Kidane, Y.G.; Mancini, C.; Mengistu, D.K.; Frascaroli, E.; Fadda, C.; Pe, M.E.; Dell’Acqua, M. Genome wideassociation study to identify the genetic base of smallholder farmer preferences of durum wheat traits.Front. Plant Sci. 2017, 8, 1230. [CrossRef] [PubMed]
37. Tsegaye, B.; Berg, T. Genetic erosion of Ethiopian tetraploid wheat landraces in Eastern Shewa, CentralEthiopia. Genet. Resour. Crop Evol. 2007, 54, 715–726. [CrossRef]
38. Pooniya, V.; Palta, J.A.; Chen, Y.; Delhaize, E.; Siddique, K.H. Impact of the TaMATE1B gene on aboveand below-ground growth of durum wheat grown on an acid and Al3+-toxic soil. Plant Soil 2019, 1–12.[CrossRef]
© 2019 by the authors. Licensee MDPI, Basel, Switzerland. This article is an open accessarticle distributed under the terms and conditions of the Creative Commons Attribution(CC BY) license (http://creativecommons.org/licenses/by/4.0/).
82
agronomy
Article
Genetic Advance of Durum Wheat Under HighYielding Conditions: The Case of Chile
Alejandro del Pozo 1,*, Iván Matus 2, Kurt Ruf 1,2, Dalma Castillo 2,
Ana María Méndez-Espinoza 1 and María Dolores Serret 3
1 Centro de Mejoramiento Genético y Fenómica Vegetal, Facultad de Ciencias Agrarias, Universidad de Talca,3460000 Talca, Chile
2 CRI-Quilamapu, Instituto de Investigaciones Agropecuarias, 3800062 Chillán, Chile3 Centre de Recerca en Agrotecnologia (AGROTECNIO), 2519825198 Lleida, Spain* Correspondence: [email protected]; Tel.: +56712200223
Received: 22 June 2019; Accepted: 13 August 2019; Published: 15 August 2019
Abstract: In Chile, durum wheat is cultivated in high-yielding Mediterranean environments, thereforebreeding programs have selected cultivars with high yield potential in addition to grain quality.The genetic progress in grain yield (GY) between 1964 and 2010 was 72.8 kg ha−1 per year. GYshowed a positive and significant correlation with days to heading, kernels per unit ground area andthousand kernel weight. The gluten and protein content tended to decrease with the year of cultivarrelease. The correlation between the δ13C of kernels and GY was negative and significant (−0.62,p < 0.05, for all cultivars; and −0.97, p < 0.001, excluding the two oldest cultivars). The yield progress(genetic plus agronomic improvements) of a set of 40–46 advanced lines evaluated between 2006 and2015 was 569 kg ha−1 per year. Unlike other Mediterranean agro-environments, a longer growingcycle together with taller plants seems to be related to the increase in the GY of Chilean durum wheatduring recent decades.
Keywords: agronomic traits; carbon isotope; days to heading; grain quality; yield components
1. Introduction
Durum wheat (Triticum turgidum L. ssp. durum) covers ~17 million hectares worldwide, which isless than 10% of the total wheat area. However, its importance for human consumption is very highbecause it is used for making pasta, couscous, burghul and firik [1]. According to the InternationalGrain Council, the largest producers of wheat in the world are the European Union, Canada, the UnitedStates, Turkey and Algeria.
For the production of high-quality durum wheat, dry environments are necessary, with warm daysand cold nights during the growing season so that large grains are obtained with yellow color, vitreouskernels (more than 95%), hard texture and high test weight (about 82 kg hL−1), alongside high proteincontent (greater than 10%) and strong gluten (greater than 30% wet gluten), which gives elasticity todough for industrial use [2]. In Chile, durum wheat is grown in Mediterranean climate environmentsfrom the Valparaíso Region (32 ◦S) to the Biobio Region (37 ◦S), but mostly under irrigation conditionsor in areas where rainfall is sufficient to satisfy most or all of the crop potential evapotranspiration.The sowing area has increased from 9600 ha in 2001 to 27,000 ha in 2015, and the average yield for2011–2015 was 6.7 Mg ha−1 [3].
Wheat yields in different regions of the world have increased greatly since the 1960s as a result ofgenetic improvement and better agronomic practices [4]. With the Green Revolution, breeding programshave seen the introduction of semi-dwarfing genes that interfere with the action or production ofgibberellin [5], leading to a reduction in plant size and an increase in the partitioning of the above-groundbiomass towards spikes and grains [6,7]. In bread wheat, the genetic gain in grain yield (GY) was
Agronomy 2019, 9, 454; doi:10.3390/agronomy9080454 www.mdpi.com/journal/agronomy83
Agronomy 2019, 9, 454
positively correlated with harvest index and the number of grains per spike and per m2 [6,8]. In durumwheat, a Spanish study conducted with 12 cultivars from Italy and 12 from Spain released between1930 and 2000 showed that the changes in grain yield were also associated with increases in the harvestindex and number of grains per m2 [9]. Another study carried out on 14 cultivars released in Italybetween 1900 and 2000 indicated that the total aerial biomass had not changed and that the increasein yield was associated with a reduction in plant height and an increase in the harvest index andnumber of grains per m2 [10]. These studies in durum wheat have been conducted under rain fedconditions and yields were below 6 Mg ha−1, however, there is no information about the geneticprogress in durum wheat in high yield potential environments (>10 Mg ha−1) and how grain qualitytraits have been affected. Moreover, these works have not focused on studying exclusively the trendsin breeding advances of post-Green-Revolution (i.e., semi-dwarf) durum wheat cultivars during thelast half-century. This is despite the importance of this issue in the context of climate change and thefact that at least for bread wheat, there are studies reporting a stagnation in yields (or at least a drasticdecrease in genetic advance) during the last decade [11].
In bread wheat, grain protein content, sedimentation value and wet gluten have increased inmodern cultivars [8,12–14]. In durum wheat, modern dwarf and semi-dwarf cultivars have a highergluten index compared to landraces or traditional Mediterranean cultivars [15]. Subira et al. [16] alsoreported significant changes in grain quality traits in a historical series of 24 durum wheat cultivarsreleased in Italy and Spain in different periods of the 20th Century, particularly in gluten strength,sedimentation index and yellow color index. High protein content and ‘strong’ gluten are necessary toprocess semolina into a suitable final pasta product.
Physiological changes associated with breeding advances have also been reported for bread anddurum wheat. For instance, modern bread wheat presented higher stomatal conductance (on an areabasis) and carbon isotope discrimination (Δ13C; or a lower carbon isotope composition, δ13C), andlower oxygen isotope composition (δ18O) than older varieties [8,17–19]. In durum wheat, modernvarieties have higher Δ13C (or lower δ13C) compared to landraces [20–22], although no clear differenceswere found for δ18O [21]. However, no information exists for durum wheat growing in a high-yieldingMediterranean environment.
The aim of this work was to analyze a) the changes in agronomic traits, grain quality and isotopecomposition in a set of ten durum wheat cultivars released in Chile between 1964 and 2010; and b) theprogress in grain yield, plant height and test weight in selected advanced lines from the Instituto deInvestigaciones Agropecuarias (INIA)-Chile breeding program. The experiments were conducted in ahigh-yielding Mediterranean environment between 2006 and 2015.
2. Materials and Methods
2.1. Experimental Site, Plant Material and Growing Conditions
The experiments were conducted at the Santa Rosa experimental field station (36◦32′ S, 71◦55′ W;220 m.a.s.l.) of the Centro Regional de Investigación (CRI)-Quilamapu, Instituto de InvestigacionesAgropecuarias (INIA). The climate corresponds to a humid Mediterranean type. During theexperimental period (2006–2015), the monthly minimum average temperature was 3.1 ◦C (July)and the maximum 29.6 ◦C (January), and the average annual precipitation was 903 mm (SupplementalTable S1). The soil was a sandy loam, humic haploxerands (Andisol). Soil chemical characteristics ofthe top 10 cm were: pH 6.0, 8.87 mg kg−1 of N-N03; 17.05 mg kg−1 of P (Olsen), 0.45% of N-total, 4.5%of C and 0.33, 5.75, 0.65 and 0.48, cmol kg−1 of available K, Ca, Mg and Na, respectively [23].
Two different experiments were conducted. In the first experiment, ten cultivars released by theINIA breeding wheat program from 1964 to 2010 (Table 1) were evaluated during three consecutiveseasons (2010 to 2012). The INIA cultivars derive from germplasm introduced from the InternationalMaize and Wheat Improvement Center (CIMMYT) and probably all of them have the Rht-B1 gene.
84
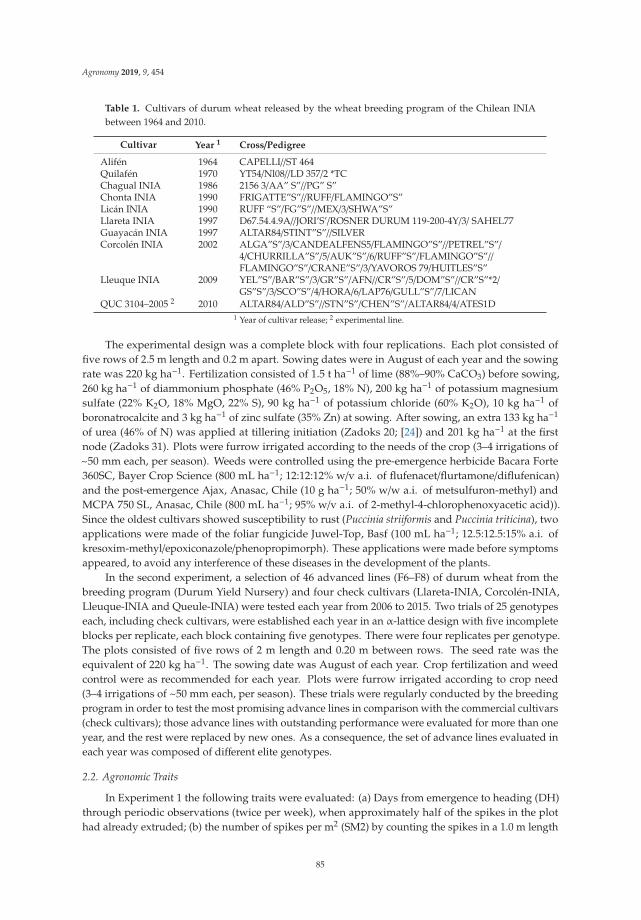
Agronomy 2019, 9, 454
Table 1. Cultivars of durum wheat released by the wheat breeding program of the Chilean INIAbetween 1964 and 2010.
Cultivar Year 1 Cross/Pedigree
Alifén 1964 CAPELLI//ST 464Quilafén 1970 YT54/Nl08//LD 357/2 *TCChagual INIA 1986 2156 3/AA” S”//PG” S”Chonta INIA 1990 FRIGATTE”S”//RUFF/FLAMINGO”S”Licán INIA 1990 RUFF “S”/FG”S”//MEX/3/SHWA”S”Llareta INIA 1997 D67.54.4.9A//JORI’S’/ROSNER DURUM 119-200-4Y/3/ SAHEL77Guayacán INIA 1997 ALTAR84/STINT”S”//SILVERCorcolén INIA 2002 ALGA”S”/3/CANDEALFENS5/FLAMINGO”S”//PETREL”S”/
4/CHURRILLA”S”/5/AUK”S”/6/RUFF”S”/FLAMINGO”S”//FLAMINGO”S”/CRANE”S”/3/YAVOROS 79/HUITLES”S”
Lleuque INIA 2009 YEL”S”/BAR”S”/3/GR”S”/AFN//CR”S”/5/DOM”S”//CR”S”*2/GS”S”/3/SCO”S”/4/HORA/6/LAP76/GULL”S”/7/LICAN
QUC 3104–2005 2 2010 ALTAR84/ALD”S”//STN”S”/CHEN”S”/ALTAR84/4/ATES1D1 Year of cultivar release; 2 experimental line.
The experimental design was a complete block with four replications. Each plot consisted offive rows of 2.5 m length and 0.2 m apart. Sowing dates were in August of each year and the sowingrate was 220 kg ha−1. Fertilization consisted of 1.5 t ha−1 of lime (88%–90% CaCO3) before sowing,260 kg ha−1 of diammonium phosphate (46% P2O5, 18% N), 200 kg ha−1 of potassium magnesiumsulfate (22% K2O, 18% MgO, 22% S), 90 kg ha−1 of potassium chloride (60% K2O), 10 kg ha−1 ofboronatrocalcite and 3 kg ha−1 of zinc sulfate (35% Zn) at sowing. After sowing, an extra 133 kg ha−1
of urea (46% of N) was applied at tillering initiation (Zadoks 20; [24]) and 201 kg ha−1 at the firstnode (Zadoks 31). Plots were furrow irrigated according to the needs of the crop (3–4 irrigations of~50 mm each, per season). Weeds were controlled using the pre-emergence herbicide Bacara Forte360SC, Bayer Crop Science (800 mL ha−1; 12:12:12% w/v a.i. of flufenacet/flurtamone/diflufenican)and the post-emergence Ajax, Anasac, Chile (10 g ha−1; 50% w/w a.i. of metsulfuron-methyl) andMCPA 750 SL, Anasac, Chile (800 mL ha−1; 95% w/v a.i. of 2-methyl-4-chlorophenoxyacetic acid)).Since the oldest cultivars showed susceptibility to rust (Puccinia striiformis and Puccinia triticina), twoapplications were made of the foliar fungicide Juwel-Top, Basf (100 mL ha−1; 12.5:12.5:15% a.i. ofkresoxim-methyl/epoxiconazole/phenopropimorph). These applications were made before symptomsappeared, to avoid any interference of these diseases in the development of the plants.
In the second experiment, a selection of 46 advanced lines (F6–F8) of durum wheat from thebreeding program (Durum Yield Nursery) and four check cultivars (Llareta-INIA, Corcolén-INIA,Lleuque-INIA and Queule-INIA) were tested each year from 2006 to 2015. Two trials of 25 genotypeseach, including check cultivars, were established each year in an α-lattice design with five incompleteblocks per replicate, each block containing five genotypes. There were four replicates per genotype.The plots consisted of five rows of 2 m length and 0.20 m between rows. The seed rate was theequivalent of 220 kg ha−1. The sowing date was August of each year. Crop fertilization and weedcontrol were as recommended for each year. Plots were furrow irrigated according to crop need(3–4 irrigations of ~50 mm each, per season). These trials were regularly conducted by the breedingprogram in order to test the most promising advance lines in comparison with the commercial cultivars(check cultivars); those advance lines with outstanding performance were evaluated for more than oneyear, and the rest were replaced by new ones. As a consequence, the set of advance lines evaluated ineach year was composed of different elite genotypes.
2.2. Agronomic Traits
In Experiment 1 the following traits were evaluated: (a) Days from emergence to heading (DH)through periodic observations (twice per week), when approximately half of the spikes in the plothad already extruded; (b) the number of spikes per m2 (SM2) by counting the spikes in a 1.0 m length
85
Agronomy 2019, 9, 454
of a row; (c) the harvest index (HI), determined from a sample from the 1.0 m row at maturity andcalculated as the ratio of grain dry weight to total above ground dry weight; (d) the number of kernelsper spike (KS) and thousand kernel weight (TKW) from 25 spikes taken at random from each plot and(e) the number of kernels per m2 (KM2) calculated as SM2 × KS. In Experiments 1 and 2, plant height(PH) from the ground to the top of the spike, excluding awns, was measured at maturity, and GY wasassessed by harvesting 2 m2 (five rows, 2 m long).
2.3. Grain Quality
The test weight was evaluated in Experiments 1 (2010) and 2 (2006 to 2015), in samples of wheatfree of impurities (obtained from each genotype and replicate) using a 250 cc Schopper scale (LouisSchopper, Germany). In addition, grain samples obtained from the genotypes and replicates evaluatedin Experiment 1 (in 2010) were ground in mill for wet gluten and protein content determination.Wet gluten content was determined according to the International Approved Methods of Analysis(AACCI Method 38–12.02) in 10 g of pure flour mixed with 5.5 mL of a 2% saline solution, whichwas homogenized and then placed in a gluten washer (Glutomatic® 2200, Perten Instruments, USA)for 5 min; then the wet gluten was weighed and expressed as a percentage of the amount of pureflour. Protein content (%) was also determined in ground grain samples placed in a quartz cuvette andthe reflectance spectrum between 800 and 2500 nm was determined using near infrared reflectancespectroscopy (NIRS), Bruker, USA. Yellow berry incidence was assessed on 100 g of kernels, separatingand weighing the affected grains and then expressed in percentage.
2.4. Total N Content and C and N Isotope Analyses
Measurements were performed in mature grains harvested in 2011 (Experiment 1). The totalN content was analyzed using an elemental analyzer (Flash 1112 EA; ThermoFinnigan, Bremen,Germany). The stable carbon (13C/12C) and nitrogen (15N/14N) isotope ratios of the same mature grainswere determined in the same elemental analyzer coupled with an isotope ratio mass spectrometer(Delta C IRMS, ThermoFinnigan, Bremen, Germany). Nitrogen was expressed as a concentration (g Nper g of dry weight) and atropine was used as a system check in the elemental analyses of nitrogen.The 13C/12C ratios of plant material were expressed in δ notation: δ13C = (13C/12C) sample/(13C/12C)standard – 1, where ‘sample’ refers to plant material and ‘standard’ of known 13C/12C ratios. The15N/14N ratios were also expressed in δ notation (δ15N) using international secondary standards ofknown 15N/14N ratios. More details are described in del Pozo et al. [8]. Measurements were performedat the Scientific Facilities of the University of Barcelona.
2.5. Data Analysis
Complete block analysis of variance (ANOVA) were performed for the set of cultivars evaluated inExperiment 1 using IBM SPSS Statistics software (SPSS Inc, USA). In addition, correlation analyses wereperformed between the year of cultivar release and agronomic, grain quality and isotope compositiontraits, and among the different traits. Trends for grain yield, plant height and test weight of 46 advancedlines and cultivars evaluated from 2005 to 2015 in Experiment 2 are also presented.
3. Results
3.1. Agronomic Traits in Cultivars Released During the Past Six Decades
Days to heading differed significantly among cultivars and also the year × cultivar interactionwas significant (Table 2); it reduced in the 1990s, but then increased in the 2000s (Figure 1A). Plantheight was significantly (p < 0.001) reduced from 108 cm in the 1960s to 90 cm in the 1970s, with aslight increase in 2010 (Table 2; Figure 1B).
86
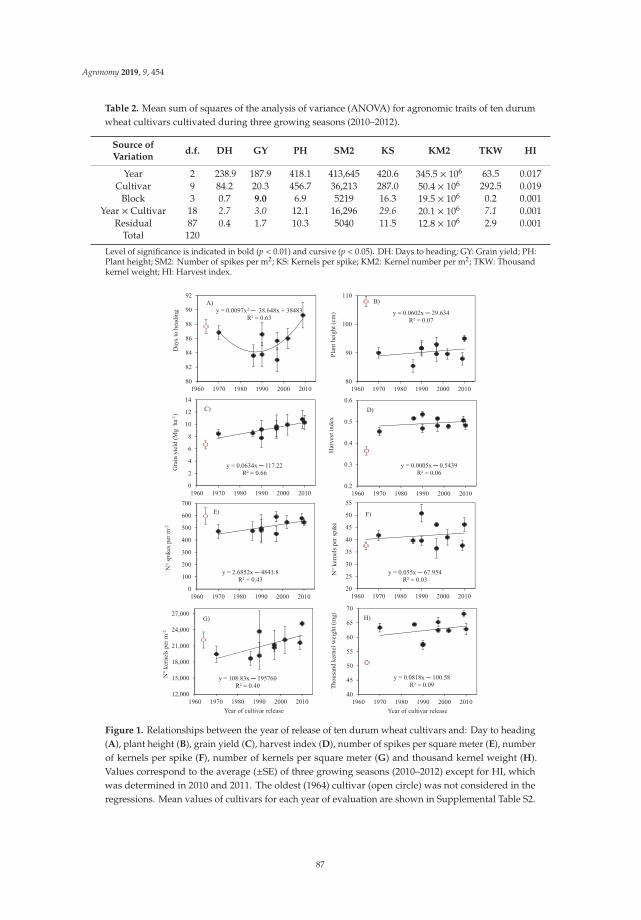
Agronomy 2019, 9, 454
Table 2. Mean sum of squares of the analysis of variance (ANOVA) for agronomic traits of ten durumwheat cultivars cultivated during three growing seasons (2010–2012).
Source ofVariation
d.f. DH GY PH SM2 KS KM2 TKW HI
Year 2 238.9 187.9 418.1 413,645 420.6 345.5 × 10⁶ 63.5 0.017Cultivar 9 84.2 20.3 456.7 36,213 287.0 50.4 × 10⁶ 292.5 0.019
Block 3 0.7 9.0 6.9 5219 16.3 19.5 × 10⁶ 0.2 0.001Year × Cultivar 18 2.7 3.0 12.1 16,296 29.6 20.1 × 10⁶ 7.1 0.001
Residual 87 0.4 1.7 10.3 5040 11.5 12.8 × 10⁶ 2.9 0.001Total 120
Level of significance is indicated in bold (p < 0.01) and cursive (p < 0.05). DH: Days to heading; GY: Grain yield; PH:Plant height; SM2: Number of spikes per m2; KS: Kernels per spike; KM2: Kernel number per m2; TKW: Thousandkernel weight; HI: Harvest index.
Figure 1. Relationships between the year of release of ten durum wheat cultivars and: Day to heading(A), plant height (B), grain yield (C), harvest index (D), number of spikes per square meter (E), numberof kernels per spike (F), number of kernels per square meter (G) and thousand kernel weight (H).Values correspond to the average (±SE) of three growing seasons (2010–2012) except for HI, whichwas determined in 2010 and 2011. The oldest (1964) cultivar (open circle) was not considered in theregressions. Mean values of cultivars for each year of evaluation are shown in Supplemental Table S2.
87
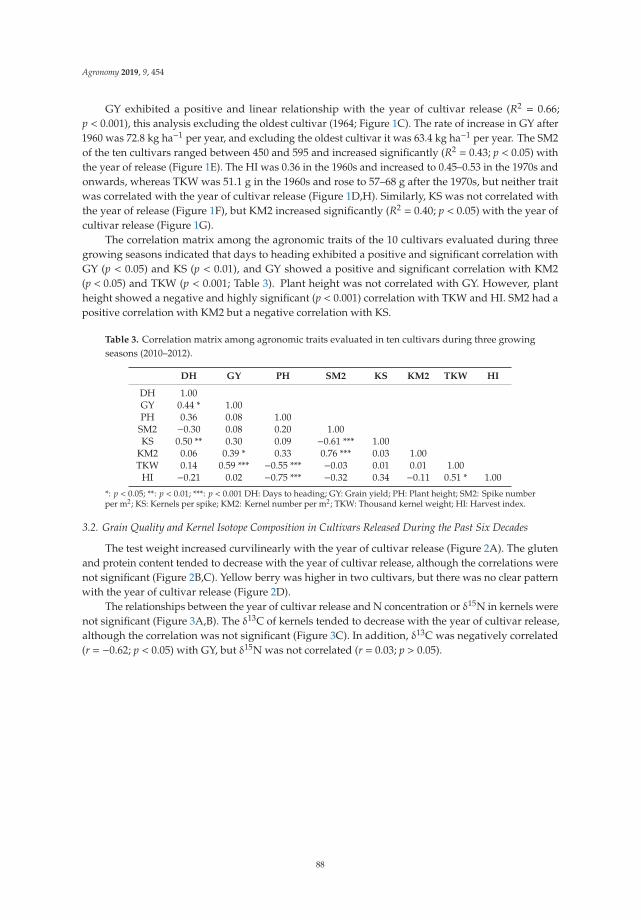
Agronomy 2019, 9, 454
GY exhibited a positive and linear relationship with the year of cultivar release (R2 = 0.66;p < 0.001), this analysis excluding the oldest cultivar (1964; Figure 1C). The rate of increase in GY after1960 was 72.8 kg ha−1 per year, and excluding the oldest cultivar it was 63.4 kg ha−1 per year. The SM2of the ten cultivars ranged between 450 and 595 and increased significantly (R2 = 0.43; p < 0.05) withthe year of release (Figure 1E). The HI was 0.36 in the 1960s and increased to 0.45–0.53 in the 1970s andonwards, whereas TKW was 51.1 g in the 1960s and rose to 57–68 g after the 1970s, but neither traitwas correlated with the year of cultivar release (Figure 1D,H). Similarly, KS was not correlated withthe year of release (Figure 1F), but KM2 increased significantly (R2 = 0.40; p < 0.05) with the year ofcultivar release (Figure 1G).
The correlation matrix among the agronomic traits of the 10 cultivars evaluated during threegrowing seasons indicated that days to heading exhibited a positive and significant correlation withGY (p < 0.05) and KS (p < 0.01), and GY showed a positive and significant correlation with KM2(p < 0.05) and TKW (p < 0.001; Table 3). Plant height was not correlated with GY. However, plantheight showed a negative and highly significant (p < 0.001) correlation with TKW and HI. SM2 had apositive correlation with KM2 but a negative correlation with KS.
Table 3. Correlation matrix among agronomic traits evaluated in ten cultivars during three growingseasons (2010–2012).
DH GY PH SM2 KS KM2 TKW HI
DH 1.00GY 0.44 * 1.00PH 0.36 0.08 1.00
SM2 −0.30 0.08 0.20 1.00KS 0.50 ** 0.30 0.09 −0.61 *** 1.00
KM2 0.06 0.39 * 0.33 0.76 *** 0.03 1.00TKW 0.14 0.59 *** −0.55 *** −0.03 0.01 0.01 1.00
HI −0.21 0.02 −0.75 *** −0.32 0.34 −0.11 0.51 * 1.00
*: p < 0.05; **: p < 0.01; ***: p < 0.001 DH: Days to heading; GY: Grain yield; PH: Plant height; SM2: Spike numberper m2; KS: Kernels per spike; KM2: Kernel number per m2; TKW: Thousand kernel weight; HI: Harvest index.
3.2. Grain Quality and Kernel Isotope Composition in Cultivars Released During the Past Six Decades
The test weight increased curvilinearly with the year of cultivar release (Figure 2A). The glutenand protein content tended to decrease with the year of cultivar release, although the correlations werenot significant (Figure 2B,C). Yellow berry was higher in two cultivars, but there was no clear patternwith the year of cultivar release (Figure 2D).
The relationships between the year of cultivar release and N concentration or δ15N in kernels werenot significant (Figure 3A,B). The δ13C of kernels tended to decrease with the year of cultivar release,although the correlation was not significant (Figure 3C). In addition, δ13C was negatively correlated(r = −0.62; p < 0.05) with GY, but δ15N was not correlated (r = 0.03; p > 0.05).
88
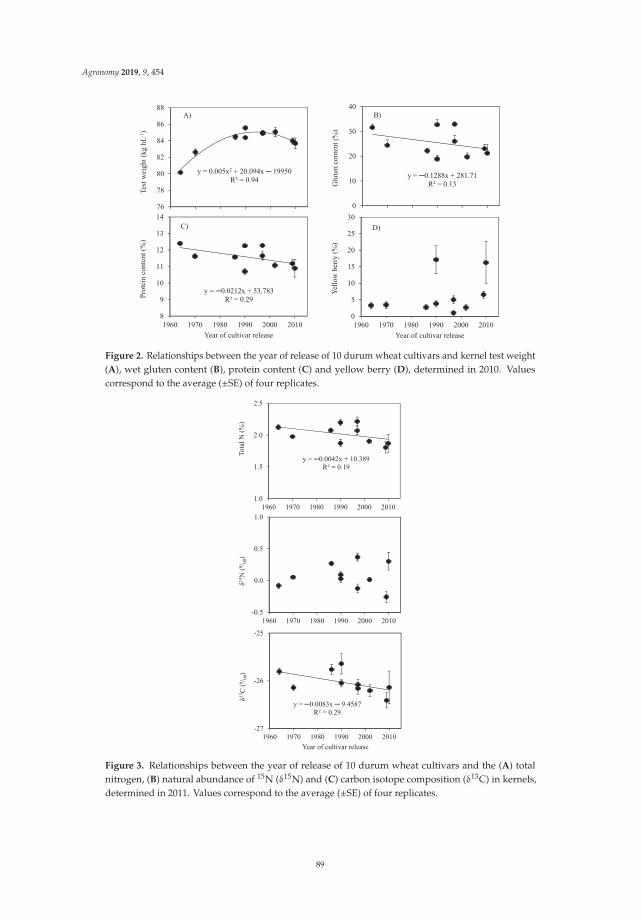
Agronomy 2019, 9, 454
Figure 2. Relationships between the year of release of 10 durum wheat cultivars and kernel test weight(A), wet gluten content (B), protein content (C) and yellow berry (D), determined in 2010. Valuescorrespond to the average (±SE) of four replicates.
Figure 3. Relationships between the year of release of 10 durum wheat cultivars and the (A) totalnitrogen, (B) natural abundance of 15N (δ15N) and (C) carbon isotope composition (δ13C) in kernels,determined in 2011. Values correspond to the average (±SE) of four replicates.
89
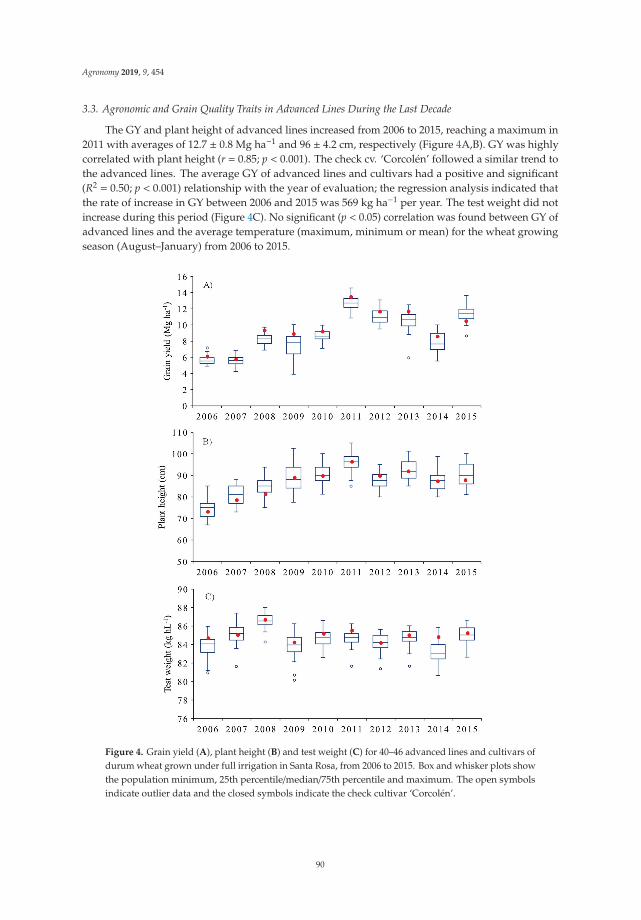
Agronomy 2019, 9, 454
3.3. Agronomic and Grain Quality Traits in Advanced Lines During the Last Decade
The GY and plant height of advanced lines increased from 2006 to 2015, reaching a maximum in2011 with averages of 12.7 ± 0.8 Mg ha−1 and 96 ± 4.2 cm, respectively (Figure 4A,B). GY was highlycorrelated with plant height (r = 0.85; p < 0.001). The check cv. ‘Corcolén’ followed a similar trend tothe advanced lines. The average GY of advanced lines and cultivars had a positive and significant(R2 = 0.50; p < 0.001) relationship with the year of evaluation; the regression analysis indicated thatthe rate of increase in GY between 2006 and 2015 was 569 kg ha−1 per year. The test weight did notincrease during this period (Figure 4C). No significant (p < 0.05) correlation was found between GY ofadvanced lines and the average temperature (maximum, minimum or mean) for the wheat growingseason (August–January) from 2006 to 2015.
Figure 4. Grain yield (A), plant height (B) and test weight (C) for 40–46 advanced lines and cultivars ofdurum wheat grown under full irrigation in Santa Rosa, from 2006 to 2015. Box and whisker plots showthe population minimum, 25th percentile/median/75th percentile and maximum. The open symbolsindicate outlier data and the closed symbols indicate the check cultivar ‘Corcolén’.
90
Agronomy 2019, 9, 454
4. Discussion
4.1. Agronomic Traits
Modern cultivars of spring durum wheat from Chile have a very high yield potential (~13 Mg ha−1)in a Mediterranean environment, under fully irrigated conditions. The yield potential achieved inChile is clearly higher than values recorded in the Mediterranean basin. For example, high-yieldingconditions in Spain usually do not surpass 8 Mg ha−1 [25,26], which is clearly lower than thoseachieved in the Mediterranean conditions of Chile. The high-yielding conditions in Spain usuallyimply several irrigations per season, particularly during the critical period from stem elongation to themiddle grain filling, which alongside natural rainfall aims to balance the water lost due to accumulatedevapotranspiration. Even so, the potential yields achieved in Spain are lower than in Chile due to anumber of factors, such as Spain’s shorter crop cycle duration, its higher night temperatures and thehigher temperatures during the reproductive stage. The genetic advance in GY of spring durum wheatin the high-yielding environment of central Chile was 72.8 kg ha−1 per year (0.73% per year) for theperiod 1964–2010, and 63.4 kg ha−1 per year when the cultivar released in 1964 was excluded from theanalysis (Figure 1). This is higher than the findings for spring bread wheat (43.5 kg ha−1 per year or0.51% per year) for a similar period (1964–2008) and in the same Mediterranean environment [8]. It isalso clearly higher than the increase reported for durum wheat in Spain (24 kg ha−1 y−1; 0.44% y−1)from 1980 to 2003, with no clear additional improvements occurring thereafter [26]. In northwestMexico, under fully irrigated conditions, the genetic progress of spring durum and bread wheatvarieties developed by CIMMYT was 0.49% and 0.41% per year, respectively, between 1966 and2003 [27], and 0.88% per year when comparing eight bread wheat cultivars released between 1962 and1988 [28]. A more recent study conducted at the same site in Mexico indicated that the GY progresswas 30 kg ha−1 per year (0.59%) for spring bread wheat cultivars developed from 1966 to 2019 [29].In Spain, under moderately irrigated conditions, the genetic progress of GY was 0.36% and 0.44%for Italian and Spanish cultivars of durum wheat, respectively, for cultivars released between 1920and 2000 [9]. In South Australia, under rain fed conditions, the annual rate of increase in GY was25 kg ha−1 for 13 cultivars released between 1958 and 2007 [30]. In North China, the annual geneticprogress of spring bread wheat ranged from 0.48% (32.0 kg ha−1) for cultivars released between the1960s and the 1990s [31], and in Henan Province values of 51.3 kg ha−1 per year have been reported forthe last three decades [32].
The yield progress observed in advanced lines of the INIA-Chile breeding program (Experiment 2),which includes genetic and agronomic progress, has been much higher (569 kg ha−1 per year) than inall the studies discussed above. This large increase in GY is explained partly by the genetic progress,but overall the improvements have derived from better agronomic management of durum wheat in thecentral-south of Chile, and this has included modifications to irrigation and particularly adjustmentsin fertilization practices conducted during the first three years of the program. In winter bread wheat,the yield progress was 246 kg ha−1 per year (2.6%) between 1976 and 1998 in central Chile under fullyirrigated conditions [14]. Clearly, fine tuning of crop management can have large impacts on GY inhigh-yielding environments when lines or cultivars of high yield potential are available.
Plant height was reduced from 107 cm in 1964 to an average of 90 cm for the period 1970–2010(Figure 1A), and this was the consequence of the introduction of semi-dwarfing genes in Chile in thelate 1950s [33]. Plant height was negatively correlated with the year of release in Australia, in cultivarsdeveloped between 1958 and 1973, but not in cultivars released after 1973 [30], and in China, in cultivarsreleased between 1960 and 2000 [34]. A negative correlation between plant height and GY was alsoreported in the study of Zhou et al. [34]. However, the comparison of advanced lines produced duringthe last decade (Figure 2) showed a positive correlation between plant height and GY. These resultssuggest that plant height of semi-dwarf wheat below 70–80 cm may limit light interception and thuscanopy photosynthesis and yield potential in high-yielding environments.
91
Agronomy 2019, 9, 454
The HI increased between 1964 and 1970, but after that there were no changes. Furthermore,the correlation between GY and HI was not significant. The maximum values of harvest index (0.53)found in the current work were higher than those reported by Royo et al. [9] in a set of Italian andSpanish cultivars of durum wheat released between 1920 and 2000 and tested in Spain. In studieswhere cultivars released before and after the green revolution were evaluated, HI and the year ofcultivar release were positively correlated (e.g., [9] for durum; [6,8,31] for bread wheat), but there wasno correlation in cultivars released after 1970 (Figure 1C; see also [29]).
The increase in GY was positively associated with days to heading and KM2 and TKW (Table 3).The increase in the crop cycle in an irrigated Mediterranean environment contrasts with the breedingtrend observed in rain fed Mediterranean areas, where early flowering, shorter duration cultivars areselected to escape post anthesis drought [9,35,36].
TKW increased significantly from 1964 to 1970, but the correlation with the year of cultivar releasewas not significant for the period 1970–2000 (Figure 1F). Genetic progress in TKW can be positive,negative or null depending on whether kernel weight has been a selection target for breeders andwhether there have been changes in the number of grains per year (the trade-off between seed sizeand number in crops; [37]). For instance, in durum wheat growing in Mediterranean environments,kernel weight was superior in modern cultivars in Turkey [38], but remained unchanged in Italian andSpanish cultivars from the 20th century [9]. In bread wheat, kernel weight has been reduced [8,14,39]or has not changed [31] with genetic improvement.
4.2. Grain Quality and Kernel Isotope Composition
The test weight increased in modern cultivars and was positively correlated with TKW (r = 0.44;p < 0.05). The values of test weight obtained in this work are higher than those found in durumwheat genotypes grown under rain fed conditions in different zones of Spain [40,41]. Unfortunately,gluten and protein content did not improve between 1964 and 2010. Other studies comparing oldercultivars or landraces to modern cultivars of durum wheat from Mediterranean countries have revealedlower grain nitrogen or protein content in the more modern cultivars [15,16,20,21,42]. In addition,the presence of Rht dwarfing genes in bread and durum wheat seems to reduce the concentration ofZn, Fe, Mn and Mg in kernels [43].
A number of studies have reported a negative correlation between grain protein concentration andGY in durum wheat [44] and in bread wheat [45,46]. It is probable that the lack of genetic progress inprotein content is related to the strong increase in GY of the Chilean cultivars. However, this negativerelationship should not be a limitation for genetic improvement in quality traits in grains of durumwheat because protein composition seems to be more important than the concentration [16,47].
The relationship between kernel δ13C and GY was negative, suggesting that genotypesexhibiting higher water use are the most productive [21,48]. In bread wheat under fully irrigatedconditions, modern and more productive cultivars showed lower δ18O and δ13C, and higher stomatalconductance [8,18,21,25]. This negative relationship between δ13C and GY (or positive relationshipbetween Δ13C and GY) has also been found in rain fed Mediterranean conditions ([21] for durumwheat; [49,50] for bread wheat), suggesting that the most productive lines are those able to maintainhigher stomatal conductance and use more water [51]. In addition, the stomatal conductance of postgreen revolution wheat cultivars in Australia seem to show a lower sensitivity to vapor pressure deficitabove 2 kPa compared to older cultivars [52], and this can be associated with lower (more negative)δ13C values.
In summary, changes in a number of traits have occurred in durum wheat cultivars selected forhigh-yielding environments in Chile. The large genetic progress in grain yield was associated withincreases in days to heading, KM2 and TKW. The test weight has also increased with the year of cultivarrelease, but the gluten and protein content have not improved between 1964 and 2010. Interestingly,the increase in yield potential seems related to longer duration and somewhat taller plants that areable to use more water.
92
Agronomy 2019, 9, 454
5. Conclusions
This study provided evidence that a high genetic advance in GY for durum wheat is feasibleunder high yielding conditions. The increase in GY was a consequence of a greater number of kernelsper m2 and higher kernel weight in the more modern cultivars. The test weight was lower in the1960s and increased curvilinearly with year of cultivar release. The gluten and protein content didnot improve between 1964 and 2010. GY was negatively correlated with kernel δ13C, suggestingthat genotypes exhibiting higher water use are the most productive. The yield progress of a set ofadvanced lines evaluated between 2006 and 2015 was very high, due to genetic progress, but this wasalso due to management improvements, particularly adjustment of fertilization practices conductedduring the first three years. Unlike other Mediterranean agro-environments, a longer growing cycletogether with taller plants seems to be related to the increase in the GY of Chilean durum wheat duringrecent decades.
Supplementary Materials: The following are available online at http://www.mdpi.com/2073-4395/9/8/454/s1,Table S1: Monthly minimum (T min) and maximum (T max) temperatures and precipitation (PP) at Santa Rosa,Table S2: Mean values of cultivar traits according to the year of evaluation.
Author Contributions: I.M. designed the experiment and selected the germplasm. D.C. and K.R. were in chargeof the management of the experiment and evaluation of agronomic traits. M.D.S. contributed to the isotopeanalysis. A.M.M.-E. contributed to data analysis. A.d.P. performed the data analysis and was in charge of writingthe text but all the authors contributed to the manuscript.
Funding: This work was supported by the research CONICYT grant FONDECYT N◦ 1180252, Chile, and thecontribution of Maria Dolores Serret was supported in part by the AGL2016-76527-R project from MINECO, Spain.
Acknowledgments: We thank Alejandro Castro for technical assistance with the field experiments.
Conflicts of Interest: The autors declare no conflict of interest.
References
1. Elias, E.M.; Manthey, F.A. End products: Present and future uses. In Durum Wheat Breeding Current Approachesand Future Strategies; Royo, C., Nachit, M.M., di Fonzo, N., Araus, J.L., Pfeiffer, W.H., Slafer, G.A., Eds.; FoodProducts Press: New York, NY, USA, 2005; pp. 63–86.
2. Acevedo, E.; Silva, P. Trigo candeal: Calidad, mercado y zonas de cultivo. In Serie Ciencias Agronómicas N◦12;Universidad de Chile, Facultad de Ciencias Agronómicas: Santiago, Chile, 2007. (In Spanish)
3. ODEPA. Estadísticas Productivas. 2017. Available online: http://www.odepa.gob.cl/estadisticas/productivas/(accessed on 23 November 2018). (In Spanish).
4. Miralles, D.J.; Slafer, G.A. Sink limitations to yield in wheat: How could it be reduced? J. Agric. Sci. 2007,145, 139–149. [CrossRef]
5. Hedden, P. The genes of the Green Revolution. Trends Genet. 2003, 19, 5–9. [CrossRef]6. Shearman, V.J.; Sylvester-Bradley, R.; Scott, R.K.; Foulkes, M.J. Physiological processes associated with wheat
yield progress in the UK. Crop Sci. 2005, 45, 175–185.7. Del Pozo, A.; Matus, I.; Araus, J.L.; Serret, D. Agronomic and physiological traits associated with breeding
advances of wheat under high-productive Mediterranean conditions. The case of Chile. Environ. Exp. Bot.2014, 103, 180–189. [CrossRef]
8. Trethowan, R.M.; Reynolds, M.P.; Ortiz-Monasterio, J.I.; Ortiz, R. The genetic basis of the green revolution inwheat production. Plant Breed. Rev. 2007, 8, 39–58.
9. Royo, C.; Álvaro, F.; Martos, V.; Ramdani, A.; Isidro, J.; Villegas, D.; García del Moral, L.F. Genetic changes indurum wheat yield components and associated traits in Italian and Spanish varieties during the 20th century.Euphytica 2007, 155, 259–270. [CrossRef]
10. De Vita, P.; Li Destri Nicosia, O.; Nigro, F.; Platani, C.; Riefolo, C.; di Fonzo, N.; Cattivelli, L. Breedingprogress in morpho-physiological, agronomical and qualitative traits of durum wheat cultivars released inItaly during the 20th century. Eur. J. Agron. 2007, 26, 39–53. [CrossRef]
11. Lo Valvo, P.J.; Miralles, D.J.; Serrago, R.A. Genetic progress in Argentine bread wheat varieties releasedbetween 1918 and 2011: Changes in physiological and numerical yield components. Field Crop Res. 2018, 221,314–321. [CrossRef]
93
Agronomy 2019, 9, 454
12. Ortiz-Monasterio, J.I.; Peña, R.J.; Sayre, K.D.; Rajaram, S. CIMMYT’s Genetic Progress in Wheat grain qualityunder four nitrogen rates. Crop Sci. 1997, 37, 892–898. [CrossRef]
13. Dencic, S.; Kobiljski, B.; Mladenov, N.; Hristov, N.; Pavlovic, M. Long-term breeding for bread making qualityin wheat. In Wheat Production in Stressed Environments; Buck, H.T., Nisi, J.E., Salomon, N., Eds.; Springer:New York, NY, USA, 2005; pp. 495–501.
14. Matus, I.; Mellado, M.; Pinares, M.; Madariaga, R.; del Pozo, A. Genetic progress in winter wheat cultivarsreleased in Chile from 1920 and 2000. Child. J. Agric. Res. 2012, 72, 303–308. [CrossRef]
15. Motzo, R.; Fois, S.; Giunta, F. Relationship between grain yield and quality of durum wheats from differenteras of breeding. Euphytica 2004, 140, 147–154. [CrossRef]
16. Subira, J.; Peña, R.J.; Álvaro, F.; Ammar, K.; Ramdani, A.; Royo, C. Breeding progress in the pasta-makingquality of durum wheat cultivars released in Italy and Spain during the 20th Century. Crop Pasture Sci. 2014,65, 16–26. [CrossRef]
17. Fischer, R.A.D.; Rees, K.D.; Sayre, Z.M.; Lu, A.G.; Condon, A. Larqué-Saavedra, Wheat yield progressassociated with higher stomatal conductance and photosynthetic rate, and cooler canopies. Crop Sci. 1998,38, 1467–1475. [CrossRef]
18. Barbour, M.M.; Fischer, R.A.; Sayre, K.D.; Farquhar, G.D. Oxygen isotope ratio of leaf and grain materialcorrelates with stomatal conductance and grain yield in irrigated wheat. Aust. J. Plant Physiol. 2000, 27,625–637. [CrossRef]
19. Foulkes, M.J.; de Silva, J.; Gaju, O.; Carvalho, P. Relationships between δ13C, δ18O and grain yield in breadwheat genotypes under favourable irrigated and rain-fed conditions. Field Crop Res. 2016, 196, 237–250.[CrossRef]
20. Araus, J.L.; Ferrio, J.P.; Buxó, R.; Voltas, J. The historical perspective of dryland agriculture: Lessons learnedfrom 10,000 years of wheat cultivation. J. Exp. Bot. 2007, 58, 131–145. [CrossRef] [PubMed]
21. Araus, J.L.; Cabrera-Bosquet, L.; Serret, M.D.; Bort, J.; Nieto-Taladriz, M.T. Comparative performance ofδ13C, δ18O and δ15N for phenotyping durum wheat adaptation to a dryland environment. Funct. Plant Biol.2013, 40, 595–608. [CrossRef]
22. Royo, C.; Martos, V.; Ramdani, A.; Villegas, D.; Rharrabti, Y.; García del Moral, L.F. Changes in yield andcarbon isotope discrimination of Italian and Spanish durum wheat during the 20th century. Agron. J. 2008,100, 352–360. [CrossRef]
23. Zagal, E.; Rodríguez, N.; Vidal, I.; Quezada, L. Actividad microbiana en un suelo de origen volcánico bajodistinto manejo agronómico. Agric. Técnica 2002, 62, 297–309. (In Spanish) [CrossRef]
24. Zadoks, J.C.; Chang, T.T.; Konzak, C.F. A decimal code for the growth stages of cereals. Weed Res. 1974, 14,415–421. [CrossRef]
25. Araus, J.L.; Villegas, D.; Aparicio, N.; García del Moral, L.F.; El Hani, S.; Rharrabti, Y.; Ferrio, J.P.;Royo, C. Environmental factors determining carbon isotope discrimination and yield in durum wheatunder Mediterranean conditions. Crop Sci. 2003, 43, 170–180. [CrossRef]
26. Chairi, F.; Vergara Diaz, O.; Vatter, T.; Aparicio, N.; Nieto-Taladriz, M.T.; Kefauver, S.C.; Bort, J.; Serret, M.D.;Araus, J.L. Post-Green Revolution genetic advance in durum wheat: The case of Spain. Field Crop Res. 2018,228, 158–169. [CrossRef]
27. Fischer, R.A. Understanding the physiological basis of yield potential in wheat. J. Agric. Sci. 2007, 145,99–113. [CrossRef]
28. Sayre, K.D.; Rajaram, S.; Fischer, R.A. Yield progress in short bread wheats in northwest Mexico. Crop Sci.1997, 37, 36–42. [CrossRef]
29. Aisawi, K.A.B.; Reynolds, M.P.; Singh, R.P.; Foulkes, M.J. The physiological basis of the genetic progressin yield potential of CIMMYT spring wheat cultivars from 1966 to 2009. Crop Sci. 2015, 55, 1749–1764.[CrossRef]
30. Sadras, V.; Lawson, C. Genetic gain in yield and associated changes in phenotype, trait plasticity andcompetitive ability of South Australian wheat varieties released between 1958 and 2007. Crop Pasture Sci.2011, 62, 533–549. [CrossRef]
31. Zhou, Y.; He, Z.H.; Chen, X.M.; Wang, D.S.; Yan, J.; Xia, X.C.; Zhang, Y. Genetic improvement of wheat yieldpotential in North China. In Wheat Production in Stressed Environments; Buck, H.T., Nisi, J.E., Salomón, N., Eds.;Springer: New York, NY, USA, 2007; pp. 583–589.
94
Agronomy 2019, 9, 454
32. Zheng, T.C.; Zhang, X.K.; Yin, G.H.; Wang, L.N.; Han, Y.L.; Chen, L.; Huang, F.; Tang, J.W.; Xia, X.C.; He, Z.H.Genetic gains in grain yield, net photosynthesis and stomatal conductance achieved in Henan Province ofChina between 1981 and 2008. Field Crop Res. 2011, 122, 225–233. [CrossRef]
33. Zapata, C.; Silva, P.; Acevedo, E. Comportamiento de isolíneas de altura en relación con el rendimiento ydistribución de asimilados en trigo. Agric. Técnica 2004, 64, 139–155. (In Spanish) [CrossRef]
34. Zhou, B.; Elazab, A.; Bort, J.; Sanz-Sáez, A.; Nieto-Taladriz, M.T.; Serret, M.D.; Araus, J.L. Agronomic andphysiological responses of Chinese facultative wheat genotypes to high-yielding Mediterranean conditions.J. Agric. Sci. 2016, 154, 870–889. [CrossRef]
35. Perry MWD’Antuono, M.F. Yield improvement and associated characteristics of some Australian springwheat cultivars introduced between 1860 and 1982. Aust. J. Agric. Res. 1989, 40, 457–472.
36. Loss, S.P.; Kirby, E.J.M.; Siddique, K.H.M.; Perry, M.W. Grain growth and development of old and modernAustralian wheats. Field Crop Res. 1989, 21, 131–146. [CrossRef]
37. Sadras, V.O. Evolutionary aspects of the trade-off between seed size and number in crops. Field Crop Res.2007, 100, 125–138. [CrossRef]
38. Koç, M.; Celaleddin, B.; Genç, I. Photosynthesis and productivity of old and modern durum wheats in aMediterranean environment. Crop Sci. 2003, 43, 2089–2098. [CrossRef]
39. Guarda, G.; Padovan, S.; Delogu, G. Grain yield, nitrogen-use efficiency and baking quality of old andmodern Italian bread-wheat cultivars grown at different nitrogen levels. Eur. J. Agron. 2004, 21, 181–192.[CrossRef]
40. Rharrabti, Y.; Royo, C.; Villegas, D.; Paricio, N.; García del Moral, L.F. Durum wheat quality in Mediterraneanenvironments: I. Quality expression under different zones, latitudes and water regimes across Spain.Field Crop Res. 2003, 80, 123–131. [CrossRef]
41. Garrido-Lestache, E.; López-Bellido, R.J.; López-Bellido, L. Durum wheat quality under Mediterraneanconditions as affected by N rate, timing and splitting, N form and S fertilization. Eur. J. Agron. 2005, 23,265–278. [CrossRef]
42. Acreche, M.M.; Slafer, G.A. Variation of grain nitrogen content in relation with grain yield in old and modernSpanish wheats grown under a wide range of agronomic conditions in a Mediterranean region. J. Agric. Sci.2009, 147, 657–667. [CrossRef]
43. Velu, G.; Singh, R.P.; Huerta, J.; Guzmán, C. Genetic impact of Rht dwarfing genes on grain micronutrientsconcentration in wheat. Field Crop Res. 2017, 214, 373–377. [CrossRef]
44. Blanco, A.; Mangini, G.; Giancaspro, A.; Giove, S.; Colasuonno, P.; Simeone, R.; Signorile, A.; De Vita, P.;Mastrangelo, A.M.; Cattivelli, L. Relationships between grain protein content and grain yield componentsthrough quantitative trait locus analyses in a recombinant inbred line population derived from two elitedurum wheat cultivars. Mol. Breed. 2012, 30, 79–92. [CrossRef]
45. Oury, F.X.; Godin, C. Yield and grain protein concentration in bread wheat: How to use the negativerelationship between the two characters to identify favourable genotypes? Euphytica 2007, 157, 45–57.[CrossRef]
46. Bogard, M.; Allard, V.; Brancourt-Hulmel, M.; Heumez, E.; Machet, J.M.; Jeuffroy, M.-H.; Gate, P.; Martre, P.;Le Gouis, J. Deviation from the grain protein concentration–grain yield negative relationship is highlycorrelated to post-anthesis N uptake in winter wheat. J. Exp. Bot. 2010, 61, 4303–4312. [CrossRef] [PubMed]
47. De Santis, M.A.; Giuliani, M.M.; Giuzio, L.; de Vita, P.; Lovegrove, A.; Shewry, P.R.; Flagella, Z. Differences ingluten protein composition between old and modern durum wheat genotypes in relation to 20th centurybreeding in Italy. Eur. J. Agron. 2017, 87, 19–29. [CrossRef] [PubMed]
48. Blum, A. Effective use of water (EUW) and not water-use efficiency (WUE) is the target of crop yieldimprovement under drought stress. Field Crop Res. 2009, 112, 119–123. [CrossRef]
49. Rebetzke, G.J.; Condon, A.G.; Farquhar, G.D.; Appels, R.; Richards, R.A. Quantitative trait loci for carbonisotope discrimination are repeatable across environments and wheat mapping populations. Appl. Genet.2008, 118, 123–137. [CrossRef] [PubMed]
50. Del Pozo, A.; Yáñez, A.; Matus, I.; Tapia, G.; Castillo, D.; Araus, J.L.; Sanchez-Jardón, L. Physiological traitsassociated with wheat yield potential and performance under water-stress in a Mediterranean environment.Front. Plant Sci. 2016, 7, 987. [CrossRef] [PubMed]
95
Agronomy 2019, 9, 454
51. Roche, D. Stomatal conductance is essential for higher yield potential of C3 crops. Crit. Rev. Plant Sci. 2015,34, 429–453. [CrossRef]
52. Schoppach, R.; Fleury, D.; Sinclair, T.R.; Sadok, W. Transpiration sensitivity to evaporative demand across120 years of breeding of Australian wheat cultivars. J. Agric. Crop Sci. 2017, 203, 219–226. [CrossRef]
© 2019 by the authors. Licensee MDPI, Basel, Switzerland. This article is an open accessarticle distributed under the terms and conditions of the Creative Commons Attribution(CC BY) license (http://creativecommons.org/licenses/by/4.0/).
96
agronomy
Article
Durum Wheat Seminal Root Traits within Modernand Landrace Germplasm in Algeria
Ridha Boudiar 1,2,*, Juan M. González 3, Abdelhamid Mekhlouf 1, Ana M. Casas 4 and
Ernesto Igartua 4,*
1 Laboratoire d’Amélioration et de Développement de la Production Végétale et Animale (LADPVA),University of Ferhat ABBAS (UFAS-Sétif1), Setif 19000, Algeria; [email protected]
2 Biotechnology Research Center (CRBt), UV 03 BP E73, Nouvelle Ville Ali Mendjli, Constantine 25016, Algeria3 Department of Biomedicine and Biotechnology, University of Alcalá, 28805 Alcalá de Henares, Spain;
[email protected] Estación Experimental de Aula Dei, EEAD-CSIC, Avenida Montañana 1005, 50059 Zaragoza, Spain;
[email protected]* Correspondence: [email protected] (R.B.); [email protected] (E.I.);
Tel.: +213-(31)-775037/39 (R.B.); +34-976716092 (E.I.)
Received: 11 March 2020; Accepted: 14 May 2020; Published: 16 May 2020
Abstract: Seminal roots are known to play an important role in crop performance, particularlyunder drought conditions. A set of 37 durum wheat cultivars and local landraces was screenedfor variation in architecture and size of seminal roots using a laboratory setting, with a filter papermethod combined with image processing by SmartRoot software. Significant genetic variability wasdetected for all root and shoot traits assessed. Four rooting patterns were identified, with landracesshowing overall steeper angle and higher root length, in comparison with cultivars, which presenteda wider root angle and shorter root length. Some traits revealed trends dependent on the genotypes’year of release, like increased seminal root angle and reduced root size (length, surface, and volume)over time. We confirm the presence of a remarkable diversity of root traits in durum wheat whoserelationship with adult root features and agronomic performance should be explored.
Keywords: proxy traits; genetic resources; root screening; root architecture
1. Introduction
The root system of wheat includes two main types, seminal (embryonic) and nodal roots,also known as the crown or adventitious roots [1,2]. Both types of roots play a crucial role in plantgrowth and are active throughout the whole plant life. Seminal roots, however, could be moreimportant under specific circumstances, like drought conditions, as they penetrate deeper into the soillayers than nodal roots, making water in deep layers accessible to the plant [3–5]. Seminal roots alsoplay a capital role during crop establishment, as they are the only roots existing before the emergenceof the fourth leaf. Seminal roots include one primary root, two pairs of symmetric roots at each side,and, at times, a sixth central root [6].
The main features of root systems are encompassed under two categories, root system architecture(RSA) and morphology. RSA is related to the whole, or a large subset, of the root system, and may bedescribed as topological or geometric measures of the root shape. Root morphology, as defined byJ. Lynch, refers to “the surface features of a single root axis as an organ, including characteristics ofthe epidermis such as root hairs, root diameter, the root cap, the pattern of appearance of daughterroots, undulations of the root axis, and cortical senescence” [7]. The traits often used to describewheat roots are total root length, root surface area, root volume, root angle, number of roots, and rootdiameter [8–10].
Agronomy 2020, 10, 713; doi:10.3390/agronomy10050713 www.mdpi.com/journal/agronomy97
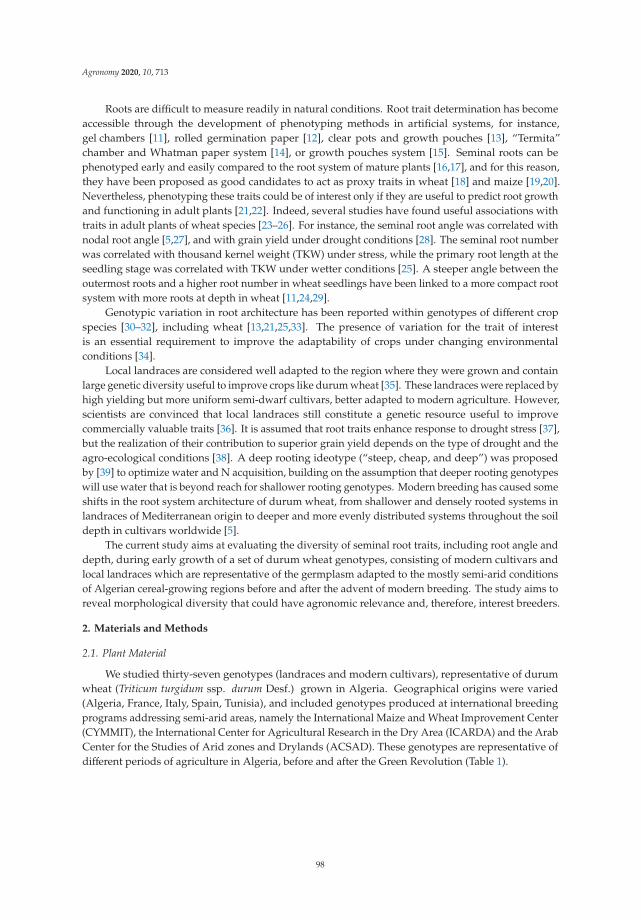
Agronomy 2020, 10, 713
Roots are difficult to measure readily in natural conditions. Root trait determination has becomeaccessible through the development of phenotyping methods in artificial systems, for instance,gel chambers [11], rolled germination paper [12], clear pots and growth pouches [13], “Termita”chamber and Whatman paper system [14], or growth pouches system [15]. Seminal roots can bephenotyped early and easily compared to the root system of mature plants [16,17], and for this reason,they have been proposed as good candidates to act as proxy traits in wheat [18] and maize [19,20].Nevertheless, phenotyping these traits could be of interest only if they are useful to predict root growthand functioning in adult plants [21,22]. Indeed, several studies have found useful associations withtraits in adult plants of wheat species [23–26]. For instance, the seminal root angle was correlated withnodal root angle [5,27], and with grain yield under drought conditions [28]. The seminal root numberwas correlated with thousand kernel weight (TKW) under stress, while the primary root length at theseedling stage was correlated with TKW under wetter conditions [25]. A steeper angle between theoutermost roots and a higher root number in wheat seedlings have been linked to a more compact rootsystem with more roots at depth in wheat [11,24,29].
Genotypic variation in root architecture has been reported within genotypes of different cropspecies [30–32], including wheat [13,21,25,33]. The presence of variation for the trait of interestis an essential requirement to improve the adaptability of crops under changing environmentalconditions [34].
Local landraces are considered well adapted to the region where they were grown and containlarge genetic diversity useful to improve crops like durum wheat [35]. These landraces were replaced byhigh yielding but more uniform semi-dwarf cultivars, better adapted to modern agriculture. However,scientists are convinced that local landraces still constitute a genetic resource useful to improvecommercially valuable traits [36]. It is assumed that root traits enhance response to drought stress [37],but the realization of their contribution to superior grain yield depends on the type of drought and theagro-ecological conditions [38]. A deep rooting ideotype (“steep, cheap, and deep”) was proposedby [39] to optimize water and N acquisition, building on the assumption that deeper rooting genotypeswill use water that is beyond reach for shallower rooting genotypes. Modern breeding has caused someshifts in the root system architecture of durum wheat, from shallower and densely rooted systems inlandraces of Mediterranean origin to deeper and more evenly distributed systems throughout the soildepth in cultivars worldwide [5].
The current study aims at evaluating the diversity of seminal root traits, including root angle anddepth, during early growth of a set of durum wheat genotypes, consisting of modern cultivars andlocal landraces which are representative of the germplasm adapted to the mostly semi-arid conditionsof Algerian cereal-growing regions before and after the advent of modern breeding. The study aims toreveal morphological diversity that could have agronomic relevance and, therefore, interest breeders.
2. Materials and Methods
2.1. Plant Material
We studied thirty-seven genotypes (landraces and modern cultivars), representative of durumwheat (Triticum turgidum ssp. durum Desf.) grown in Algeria. Geographical origins were varied(Algeria, France, Italy, Spain, Tunisia), and included genotypes produced at international breedingprograms addressing semi-arid areas, namely the International Maize and Wheat Improvement Center(CYMMIT), the International Center for Agricultural Research in the Dry Area (ICARDA) and the ArabCenter for the Studies of Arid zones and Drylands (ACSAD). These genotypes are representative ofdifferent periods of agriculture in Algeria, before and after the Green Revolution (Table 1).
98
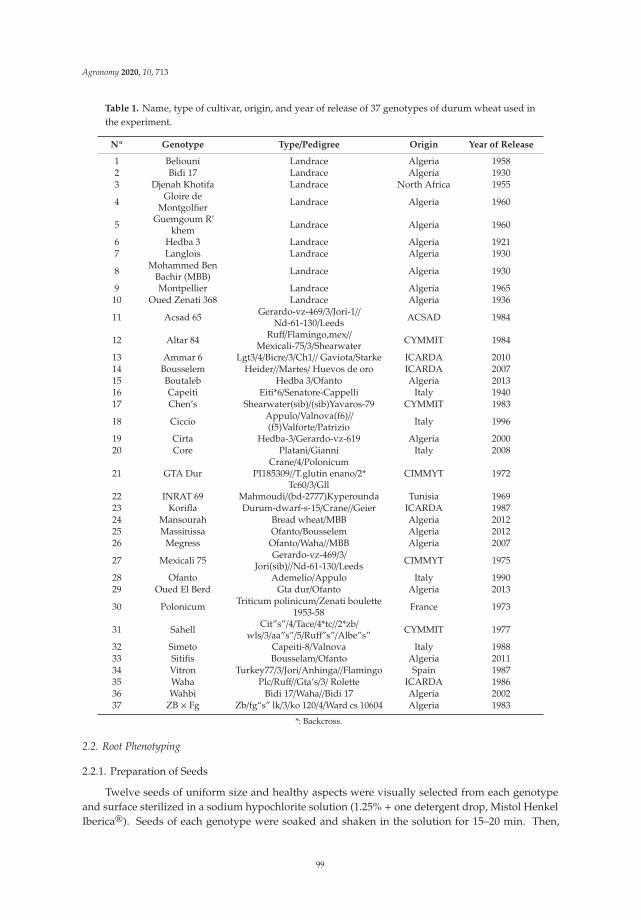
Agronomy 2020, 10, 713
Table 1. Name, type of cultivar, origin, and year of release of 37 genotypes of durum wheat used inthe experiment.
Nº Genotype Type/Pedigree Origin Year of Release
1 Beliouni Landrace Algeria 19582 Bidi 17 Landrace Algeria 19303 Djenah Khotifa Landrace North Africa 1955
4 Gloire deMontgolfier Landrace Algeria 1960
5 Guemgoum R’khem Landrace Algeria 1960
6 Hedba 3 Landrace Algeria 19217 Langlois Landrace Algeria 1930
8 Mohammed BenBachir (MBB) Landrace Algeria 1930
9 Montpellier Landrace Algeria 196510 Oued Zenati 368 Landrace Algeria 1936
11 Acsad 65 Gerardo-vz-469/3/Jori-1//Nd-61-130/Leeds ACSAD 1984
12 Altar 84 Ruff/Flamingo,mex//Mexicali-75/3/Shearwater CYMMIT 1984
13 Ammar 6 Lgt3/4/Bicre/3/Ch1// Gaviota/Starke ICARDA 201014 Bousselem Heider//Martes/ Huevos de oro ICARDA 200715 Boutaleb Hedba 3/Ofanto Algeria 201316 Capeiti Eiti*6/Senatore-Cappelli Italy 194017 Chen’s Shearwater(sib)/(sib)Yavaros-79 CYMMIT 1983
18 Ciccio Appulo/Valnova(f6)//(f5)Valforte/Patrizio Italy 1996
19 Cirta Hedba-3/Gerardo-vz-619 Algeria 200020 Core Platani/Gianni Italy 2008
21 GTA DurCrane/4/Polonicum
PI185309//T.glutin enano/2*Tc60/3/Gll
CIMMYT 1972
22 INRAT 69 Mahmoudi/(bd-2777)Kyperounda Tunisia 196923 Korifla Durum-dwarf-s-15/Crane//Geier ICARDA 198724 Mansourah Bread wheat/MBB Algeria 201225 Massinissa Ofanto/Bousselem Algeria 201226 Megress Ofanto/Waha//MBB Algeria 2007
27 Mexicali 75 Gerardo-vz-469/3/Jori(sib)//Nd-61-130/Leeds CIMMYT 1975
28 Ofanto Ademelio/Appulo Italy 199029 Oued El Berd Gta dur/Ofanto Algeria 2013
30 Polonicum Triticum polinicum/Zenati boulette1953-58 France 1973
31 Sahell Cit”s”/4/Tace/4*tc//2*zb/wls/3/aa”s”/5/Ruff”s”/Albe”s” CYMMIT 1977
32 Simeto Capeiti-8/Valnova Italy 198833 Sitifis Bousselam/Ofanto Algeria 201134 Vitron Turkey77/3/Jori/Anhinga//Flamingo Spain 198735 Waha Plc/Ruff//Gta’s/3/ Rolette ICARDA 198636 Wahbi Bidi 17/Waha//Bidi 17 Algeria 200237 ZB × Fg Zb/fg“s” lk/3/ko 120/4/Ward cs 10604 Algeria 1983
*: Backcross.
2.2. Root Phenotyping
2.2.1. Preparation of Seeds
Twelve seeds of uniform size and healthy aspects were visually selected from each genotypeand surface sterilized in a sodium hypochlorite solution (1.25% + one detergent drop, Mistol HenkelIberica®). Seeds of each genotype were soaked and shaken in the solution for 15–20 min. Then,
99
Agronomy 2020, 10, 713
they were rinsed four times with sterile deionized water, in sterile conditions. Twelve seeds of eachgenotype were placed in Petri dishes, each with two filter papers soaked with 4 mL of sterile water.Then the Petri dishes were placed in a dark room at 4 ◦C for four days, and then at 22 ◦C/18 ◦C in agrowth chamber with a 12 h light/darkness photoperiod for about 16 h.
Finally, the pre-germinated grains were transferred to the rhizo-slide system, described in detailin the next section and Figure S1. The experiment was carried out at the Laboratory of Cellular Biologyand Genetics, Department of Biomedicine and Biotechnology of the University of Alcalá, Spain.
2.2.2. The Rhizo-Slide System
The rhizo-slide system was constructed as a sandwich made with glass plate, black cardboard,filter paper, and a black plastic sheet. Sheets of A4-size black cardboard (180 g/m2, www.liderpapel.com)and filter papers were previously sterilized in an autoclave and then soaked in the nutritive solutionAniol [40]. The nutritive solution was prepared by dissolving 0.5550 g of Ca Cl2, 0.8215 g of KNO3,0.6352 g of MgCl2·6H2O, 0.0165 g of (NH4)2SO, 0.0400 g of NH4NO3 in 100 mL of distilled water,to which 500 μL/L of Plant Preservative Mixture (PPMTM, Plant Cell Technology) at pH 5.8 was added.Each 8 mL was used to prepare 1 L of nutritive solution. Black cardboard with a nick made at thetop center was placed on a glass plate with the same dimensions; then the pre-germinated grain(with embryonic part downward) was positioned just below the nick and covered by a filter paper.A black plastic sheet was used to cover the filter paper to ensure obscurity for roots, shifted ~2 cmupwards to allow better contact of the cardboard, and filter paper sheets with the nutritive solution.Two rhizo-slides were confronted to each other by the glass plate side, and the set was placed verticallyin a glass box (internal dimensions of 32.2, 22, and 16 cm, length, width, and height) with two liters ofthe nutritive solution at the bottom, and then secured with two paper clips. Each glass box held 6 glassplates with two rhizoslides each, for a total of 12 seedlings, consisting of two genotypes, 6 seedlings foreach (Figure S1). In total, each genotype was replicated 12 times. More details on the system are foundin Ruiz et al. (2018) [25].
Once placed in the rhizoslides and the glass boxes, the seedlings were grown in a growth chamberfor 7 days at 22/18 ◦C and 12/12 h photoperiod, day/night. The 37 genotypes were processed in batchesof 6. Pre-germinated seeds of each 6 genotypes were placed into six glass boxes, each holding 6 seedsof two different genotypes. A complete batch comprised six boxes, three glass boxes prepared eachMonday, and three each Thursday, every week. In total, 7 batches (14 runs) were performed untilthe experiment was completed (accounting for some seedlings that had to be replicated for variousreasons). The set of genotypes for each run was selected randomly.
During the experiment, the boxes were replenished with distilled water every two days, to refillto the initial solution level. At the same time, to minimize seedling failure, each single seedlingreceived 10 mL of the nutritive solution, applied with a pipette, near each seed. On the eighth day,the rhizo-slides were opened and shoots were immediately collected. The fresh roots were scannedusing a Canon “LiDE210” scanner at 300 ppi to capture the first image then overlapped roots weremanually separated and a second scan was done. The individual plant shoot dry weight (SDW) wasobtained after oven-drying at 80 ◦C for six hours.
2.2.3. Image Analysis
The two images of a rhizo-slide were analyzed using SmartRoot software v.3.32 [41] plugin forImageJ1.46R (http://imagej.nih.gov/ij/download.html). The first image was used to measure onlyroot angles and the second one to assess the other root traits using manual and semi-automaticSmartRoot procedures. Each root of the seedling was traced, semi-automatically, and then SmartRootautomatically generated the corresponding traits. In total, ten variables from the Smartroot outputwere recorded for each seedling: total root length (TRL), primary root length (PRL), mean length of theother seminal roots (MRL), total root surface area (Surface), mean root diameter (Diameter), total rootvolume (Volume), root number (RN), and shoot dry weight (SDW). The root angle was determined
100
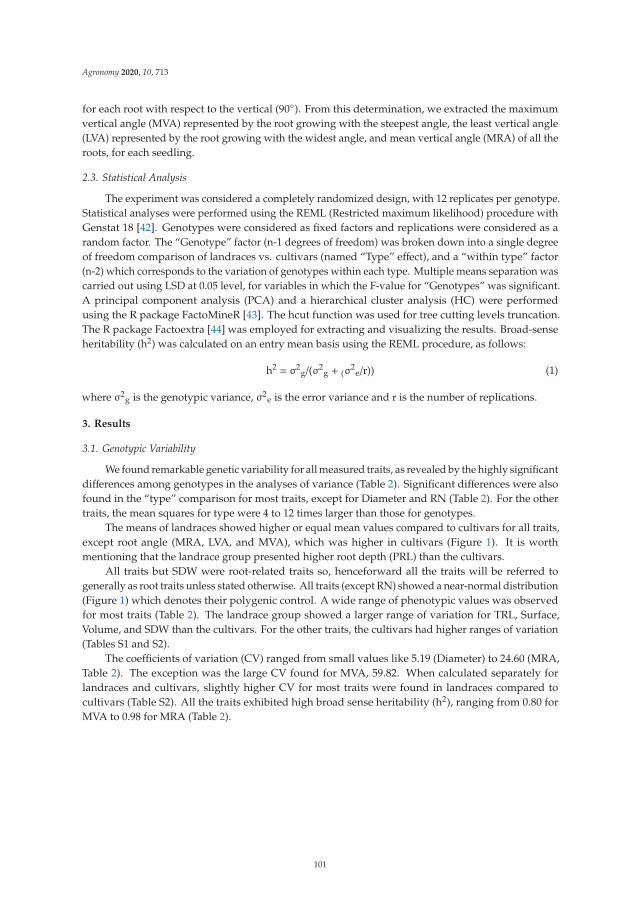
Agronomy 2020, 10, 713
for each root with respect to the vertical (90◦). From this determination, we extracted the maximumvertical angle (MVA) represented by the root growing with the steepest angle, the least vertical angle(LVA) represented by the root growing with the widest angle, and mean vertical angle (MRA) of all theroots, for each seedling.
2.3. Statistical Analysis
The experiment was considered a completely randomized design, with 12 replicates per genotype.Statistical analyses were performed using the REML (Restricted maximum likelihood) procedure withGenstat 18 [42]. Genotypes were considered as fixed factors and replications were considered as arandom factor. The “Genotype” factor (n-1 degrees of freedom) was broken down into a single degreeof freedom comparison of landraces vs. cultivars (named “Type” effect), and a “within type” factor(n-2) which corresponds to the variation of genotypes within each type. Multiple means separation wascarried out using LSD at 0.05 level, for variables in which the F-value for “Genotypes” was significant.A principal component analysis (PCA) and a hierarchical cluster analysis (HC) were performedusing the R package FactoMineR [43]. The hcut function was used for tree cutting levels truncation.The R package Factoextra [44] was employed for extracting and visualizing the results. Broad-senseheritability (h2) was calculated on an entry mean basis using the REML procedure, as follows:
h2 = σ2g/(σ2
g + (σ2
e/r)) (1)
where σ2g is the genotypic variance, σ2
e is the error variance and r is the number of replications.
3. Results
3.1. Genotypic Variability
We found remarkable genetic variability for all measured traits, as revealed by the highly significantdifferences among genotypes in the analyses of variance (Table 2). Significant differences were alsofound in the “type” comparison for most traits, except for Diameter and RN (Table 2). For the othertraits, the mean squares for type were 4 to 12 times larger than those for genotypes.
The means of landraces showed higher or equal mean values compared to cultivars for all traits,except root angle (MRA, LVA, and MVA), which was higher in cultivars (Figure 1). It is worthmentioning that the landrace group presented higher root depth (PRL) than the cultivars.
All traits but SDW were root-related traits so, henceforward all the traits will be referred togenerally as root traits unless stated otherwise. All traits (except RN) showed a near-normal distribution(Figure 1) which denotes their polygenic control. A wide range of phenotypic values was observedfor most traits (Table 2). The landrace group showed a larger range of variation for TRL, Surface,Volume, and SDW than the cultivars. For the other traits, the cultivars had higher ranges of variation(Tables S1 and S2).
The coefficients of variation (CV) ranged from small values like 5.19 (Diameter) to 24.60 (MRA,Table 2). The exception was the large CV found for MVA, 59.82. When calculated separately forlandraces and cultivars, slightly higher CV for most traits were found in landraces compared tocultivars (Table S2). All the traits exhibited high broad sense heritability (h2), ranging from 0.80 forMVA to 0.98 for MRA (Table 2).
101
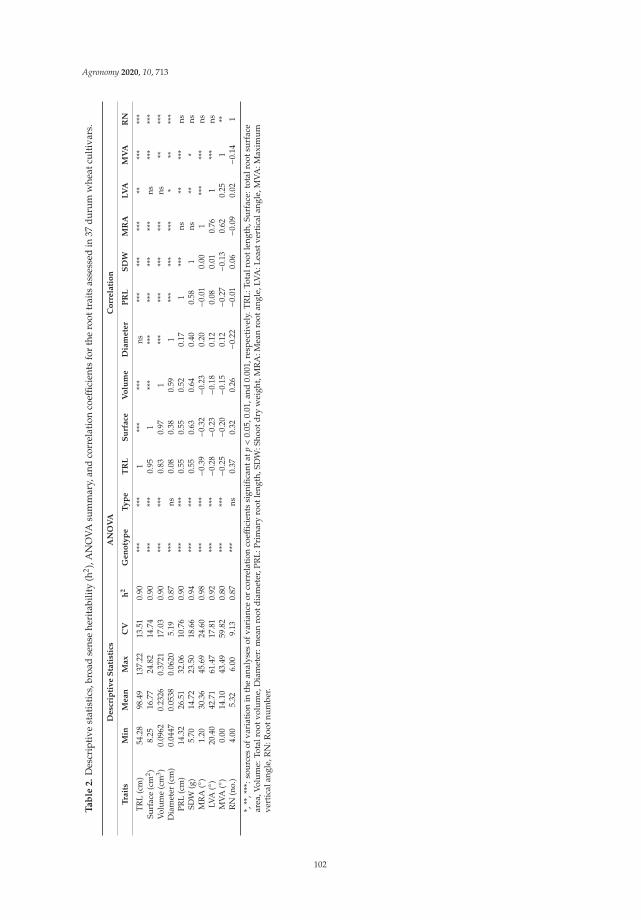
Agronomy 2020, 10, 713
Ta
ble
2.
Des
crip
tive
stat
isti
cs,b
road
sens
ehe
rita
bilit
y(h
2 ),A
NO
VAsu
mm
ary,
and
corr
elat
ion
coeffi
cien
tsfo
rth
ero
ottr
aits
asse
ssed
in37
duru
mw
heat
cult
ivar
s.
De
scri
pti
ve
Sta
tist
ics
AN
OV
AC
orr
ela
tio
n
Tra
its
Min
Me
an
Ma
xC
Vh
2G
en
oty
pe
Ty
pe
TR
LS
urf
ace
Vo
lum
eD
iam
ete
rP
RL
SD
WM
RA
LV
AM
VA
RN
TRL
(cm
)54
.28
98.4
913
7.22
13.5
10.
90**
***
*1
***
***
ns**
***
***
***
***
***
Surf
ace
(cm
2 )8.
2516
.77
24.8
214
.74
0.90
***
***
0.95
1**
***
***
***
***
*ns
***
***
Volu
me
(cm
3 )0.
0962
0.23
260.
3721
17.0
30.
90**
***
*0.
830.
971
***
***
***
***
ns**
***
Dia
met
er(c
m)
0.04
470.
0538
0.06
205.
190.
87**
*ns
0.08
0.38
0.59
1**
***
***
**
****
*PR
L(c
m)
14.3
226
.51
32.0
610
.76
0.90
***
***
0.55
0.55
0.52
0.17
1**
*ns
****
*ns
SDW
(g)
5.70
14.7
223
.50
18.6
60.
94**
***
*0.
550.
630.
640.
400.
581
ns**
*ns
MR
A(◦
)1.
2030
.36
45.6
924
.60
0.98
***
***
−0.3
9−0
.32
−0.2
30.
20−0
.01
0.00
1**
***
*ns
LVA
(◦)
20.4
042
.71
61.4
717
.81
0.92
***
***
−0.2
8−0
.23
−0.1
80.
120.
080.
010.
761
***
nsM
VA(◦
)0.
0014
.10
43.4
959
.82
0.80
***
***
−0.2
5−0
.20
−0.1
50.
12−0
.27
−0.1
30.
620.
251
**R
N(n
o.)
4.00
5.32
6.00
9.13
0.87
***
ns0.
370.
320.
26−0
.22
−0.0
10.
06−0
.09
0.02
−0.1
41
*,**
,***
:sou
rces
ofva
riat
ion
inth
ean
alys
esof
vari
ance
orco
rrel
atio
nco
effici
ents
sign
ifica
ntat
p<
0.05
,0.0
1,an
d0.
001,
resp
ecti
vely
.TR
L:To
talr
ootl
engt
h,Su
rfac
e:to
talr
oots
urfa
cear
ea,V
olum
e:To
talr
ootv
olum
e,D
iam
eter
:mea
nro
otdi
amet
er,P
RL:
Prim
ary
root
leng
th,S
DW
:Sho
otdr
yw
eigh
t,M
RA
:Mea
nro
otan
gle,
LVA
:Lea
stve
rtic
alan
gle,
MVA
:Max
imum
vert
ical
angl
e,R
N:R
ootn
umbe
r.
102
Agronomy 2020, 10, 713
Figure 1. Boxplots for root traits for the cultivar (red) and landrace (blue) groups. Horizontal linessplitting the boxes indicate the median values; box limits indicate the 25th and 75th percentiles; whiskersextend 1.5 times the interquartile range from the 25th and 75th percentiles; outliers are represented bydots. Variable names coded as in Table 2. Genotype mean values are in Table S1.
3.2. Relationships between Traits
Highly significant correlations were found between most traits (Table 2). TRL, Surface and Volumewere highly and positively correlated among them. There were moderate positive correlations betweenTRL, surface, and Volume, with PRL, SDW, RN, and negative ones with root angle variables (seedlingswith higher TRL, Surface, and Volume tended to have steeper root angles). Seedlings with higherRN tended to have roots with thinner root diameter, indicating that there could be some kind ofcompensation between these traits (more roots with a finer diameter and vice versa). Interestingly,seedlings with higher primary root length produced more shoot biomass. Performing correlationsbetween traits within each group (cultivars and landraces) showed, in general, similar patterns to thecorrelations performed for the entire dataset (Table S2). The moderate relationship of PRL with MVAand RN disappeared in the landrace group, compared to the cultivars and the whole dataset (Table S2).
3.3. Time Trends of Root Traits
When the genotypic means were plotted against year of release of the genotypes, differenttrends were observed (Figure 2 and Figure S2), in which, all the traits presented significant regressioncoefficients except Diameter, RN and PRL (Table S3). This trend was largely influenced by thecomparison of landraces vs. cultivars because landraces are older. The trend was positive or negativedepending on the trait. Overall, cultivars reduced their seminal root length and developed a shallowerroot angle compared to landraces (Figure 2). The root surface and volume of root presented the sametrend as root length, as they were highly correlated, as mentioned above. MVA and LVA showed thesame trend as MRA. No substantial variation was observed for RN, Diameter, and PRL. Regarding theshoot, a remarkable and steady reduction in SDW over the years was detected (Figure 1 and Figure S2).
103
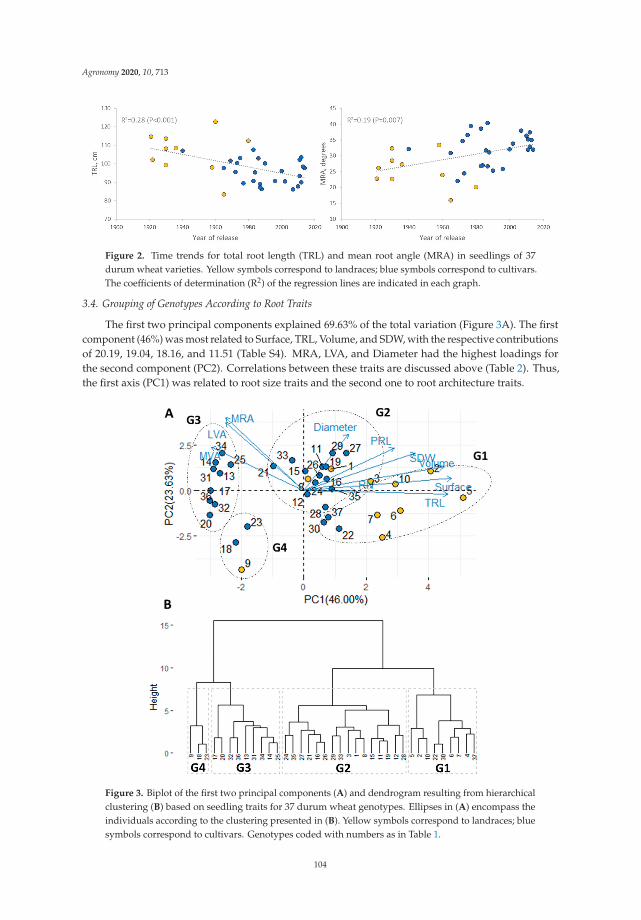
Agronomy 2020, 10, 713
Figure 2. Time trends for total root length (TRL) and mean root angle (MRA) in seedlings of 37durum wheat varieties. Yellow symbols correspond to landraces; blue symbols correspond to cultivars.The coefficients of determination (R2) of the regression lines are indicated in each graph.
3.4. Grouping of Genotypes According to Root Traits
The first two principal components explained 69.63% of the total variation (Figure 3A). The firstcomponent (46%) was most related to Surface, TRL, Volume, and SDW, with the respective contributionsof 20.19, 19.04, 18.16, and 11.51 (Table S4). MRA, LVA, and Diameter had the highest loadings forthe second component (PC2). Correlations between these traits are discussed above (Table 2). Thus,the first axis (PC1) was related to root size traits and the second one to root architecture traits.
Figure 3. Biplot of the first two principal components (A) and dendrogram resulting from hierarchicalclustering (B) based on seedling traits for 37 durum wheat genotypes. Ellipses in (A) encompass theindividuals according to the clustering presented in (B). Yellow symbols correspond to landraces; bluesymbols correspond to cultivars. Genotypes coded with numbers as in Table 1.
104
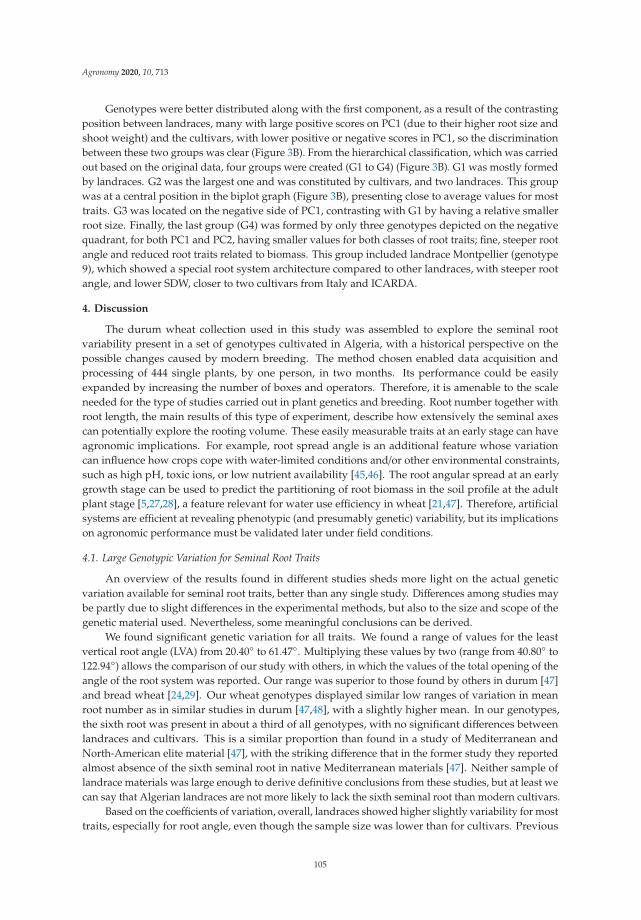
Agronomy 2020, 10, 713
Genotypes were better distributed along with the first component, as a result of the contrastingposition between landraces, many with large positive scores on PC1 (due to their higher root size andshoot weight) and the cultivars, with lower positive or negative scores in PC1, so the discriminationbetween these two groups was clear (Figure 3B). From the hierarchical classification, which was carriedout based on the original data, four groups were created (G1 to G4) (Figure 3B). G1 was mostly formedby landraces. G2 was the largest one and was constituted by cultivars, and two landraces. This groupwas at a central position in the biplot graph (Figure 3B), presenting close to average values for mosttraits. G3 was located on the negative side of PC1, contrasting with G1 by having a relative smallerroot size. Finally, the last group (G4) was formed by only three genotypes depicted on the negativequadrant, for both PC1 and PC2, having smaller values for both classes of root traits; fine, steeper rootangle and reduced root traits related to biomass. This group included landrace Montpellier (genotype9), which showed a special root system architecture compared to other landraces, with steeper rootangle, and lower SDW, closer to two cultivars from Italy and ICARDA.
4. Discussion
The durum wheat collection used in this study was assembled to explore the seminal rootvariability present in a set of genotypes cultivated in Algeria, with a historical perspective on thepossible changes caused by modern breeding. The method chosen enabled data acquisition andprocessing of 444 single plants, by one person, in two months. Its performance could be easilyexpanded by increasing the number of boxes and operators. Therefore, it is amenable to the scaleneeded for the type of studies carried out in plant genetics and breeding. Root number together withroot length, the main results of this type of experiment, describe how extensively the seminal axescan potentially explore the rooting volume. These easily measurable traits at an early stage can haveagronomic implications. For example, root spread angle is an additional feature whose variationcan influence how crops cope with water-limited conditions and/or other environmental constraints,such as high pH, toxic ions, or low nutrient availability [45,46]. The root angular spread at an earlygrowth stage can be used to predict the partitioning of root biomass in the soil profile at the adultplant stage [5,27,28], a feature relevant for water use efficiency in wheat [21,47]. Therefore, artificialsystems are efficient at revealing phenotypic (and presumably genetic) variability, but its implicationson agronomic performance must be validated later under field conditions.
4.1. Large Genotypic Variation for Seminal Root Traits
An overview of the results found in different studies sheds more light on the actual geneticvariation available for seminal root traits, better than any single study. Differences among studies maybe partly due to slight differences in the experimental methods, but also to the size and scope of thegenetic material used. Nevertheless, some meaningful conclusions can be derived.
We found significant genetic variation for all traits. We found a range of values for the leastvertical root angle (LVA) from 20.40◦ to 61.47◦. Multiplying these values by two (range from 40.80◦ to122.94◦) allows the comparison of our study with others, in which the values of the total opening of theangle of the root system was reported. Our range was superior to those found by others in durum [47]and bread wheat [24,29]. Our wheat genotypes displayed similar low ranges of variation in meanroot number as in similar studies in durum [47,48], with a slightly higher mean. In our genotypes,the sixth root was present in about a third of all genotypes, with no significant differences betweenlandraces and cultivars. This is a similar proportion than found in a study of Mediterranean andNorth-American elite material [47], with the striking difference that in the former study they reportedalmost absence of the sixth seminal root in native Mediterranean materials [47]. Neither sample oflandrace materials was large enough to derive definitive conclusions from these studies, but at least wecan say that Algerian landraces are not more likely to lack the sixth seminal root than modern cultivars.
Based on the coefficients of variation, overall, landraces showed higher slightly variability for mosttraits, especially for root angle, even though the sample size was lower than for cultivars. Previous
105
Agronomy 2020, 10, 713
reports indicate that native Mediterranean landraces are likely to provide additional genetic variabilityfor root architecture [46], particularly in wheat accessions that experienced long-term natural selectionin drought-prone environments [49], and in barley [50]. Overall, the Algerian landraces showedsizeable genetic variation for most traits, indicating that they harbor relevant root morphology variationthat should be further investigated by geneticists and breeders.
4.2. Classification of Durum Wheat Genotypes According to Root Morphology
Overall, genotypes with higher root length tended to have larger root number, as found in aprevious study [47], and a narrower root angle. Other authors [24,51] found no correlation betweenroot angle and root number. Sanguinetti et al. [47] also found no correlation of root angle with othertraits and suggested that the root angle was controlled by an independent set of genes. In our study,however, given the negative correlation between MRA and root size traits, we cannot rule out thatthese two traits are controlled by the same set of genes.
We found that higher root length and Diameter were associated with higher SDW (r of 0.55and 0.40, respectively, Table 2), suggesting a size effect that affected the whole plant. Rather similarobservations were done in the Spanish core collection of tetraploid wheat, but the plant size effect wasvisible for subsp. dicoccon and turgidum, but not for durum [25]. Correlation between root length andvolume and SDW was also found in hexaploid wheat [52]. We found no correlation between RN andMRA, in agreement with previous studies [24,51]. It seems that an overall plant size effect that affectsharmonically roots and shoots is common in wheat species.
Our genotypes displayed different seminal root system patterns, from vigorous and steep to asmall and shallow root system. These root patterns may be related to phylogenetic relationships,regional origin, and functional plant adaptation to different environments, as indicated in previousstudies [53]. There were differences in the length of the seminal roots of single plants. This was madeevident by calculating the difference between the length of the primary root (PRL), and the averageof the rest (MRL). G2 and G3 had a higher difference between PRL and the mean length of otherroots (MRL), compared to groups G1 and G4, which had roots with more similar lengths (Table S5).G2 genotypes combined a significantly longer primary root (Table S5) with the largest differencebetween it and the other seminal roots (together with G3). This rooting pattern, based on dissimilargrowth of the roots, could have an impact on overall soil exploring capacity that should be exploredfurther, particularly its usefulness in semi-arid environments, to access to stored water at deep layersat critical periods (flowering and grain filling), while keeping enough shallow roots to take advantageof in-season precipitations.
Two groups (G1 and G3) showed the highest contrast in the multivariate analysis (Figure 3).G1, with a majority of landraces, displayed a vigorous seminal root system, in contrast with G3,formed entirely by cultivars with small root systems. Our finding was in agreement with the studyof a collection of 160-durum wheat landraces [33] in terms of larger seminal root size. This studyfound that landraces coming from the eastern Mediterranean region (Turkey), the driest and warmestareas considered in the study, showed the largest seminal root size and widest root angle compared tolandraces from eastern Balkan countries. The authors claimed that these differences were due to theadaptations of landraces to the contrasting environmental conditions of these two regions. The largerroot size and wider root angle from Turkish landraces would allow better exploration of the fullsoil profile and better water capture. Among the four groups found in this study, no one combinedthe highest MRA and TRL, comparable to Turkish landraces. Therefore, there could be room forimprovement for the root systems of durum wheat for Algeria. Crosses to combine these traits ina single genotype should be devised, and Turkish landraces could be tested in Algerian conditions,to assess their potential.
In our germplasm, the landraces showed on an average narrower angle and higher root size.Previous studies on Mediterranean durum wheat [33] found that the genotypes with the narrowestangle came from the western Mediterranean region and that they also had heavier grains [54,55].
106
Agronomy 2020, 10, 713
Additionally, it was reported that Triticum turgidum subsp. dicoccon landraces coming from coolerand wetter zones had shallower seminal root systems than those from warmer and drier areas [25].The subsp. durum landraces, developed in warmer and drier areas, tended to have larger and steeperroot patterns than landraces coming from cooler and wetter zones. Accordingly, the root systemarchitecture of the Algerian landraces would indicate adaptation to a warm and dry environment.Other studies have found different root morphologies in apparent adaptation to stressful conditions.For instance, the drought-tolerant bread wheat cv. SeriM82 has a compact root system [21], associatedwith a limited water use early in the season, facilitating access to stored water later in the reproductivephase. Contrary to our landraces, SeriM82 exhibited less vigorous shoot growth. In contrast withour findings, a study of bread wheat germplasm grown historically in the semi-arid northwestern ofChina [56] found that breeding caused a narrowing of the seminal root angle, reduced root number,and increase of primary seminal root length. In that study “newer cultivars produced higher yieldsthan older ones only at the higher sowing density, showing that increased yield results from changesin competitive behavior.” This view was confirmed and expanded later [57], confirming that theadvantage of new Chinese wheat cultivars came from the attenuation of inter-plant competition andincreased plasticity in root morphology. A seminal root architecture with fewer, longer seminal rootswith narrower root angle, would overlap less with neighbors, leading to less competition betweenindividuals [58], and these trends agree with the hypothesis of weakening of “selfish” traits [59].
The shift in root morphology observed in Algeria in the step from landraces to modern cultivarsdoes not conform to the scenario described in those works. There was a reduction of overall rootlength and volume after the advent of modern breeding, which could be consistent with the reductionof inter-plant competition but combined with the widening of the root angle, which does not bodewell with that hypothesis. It seems that wheat breeding may have resulted in different trends for rootmorphology in different parts of the world. This could be the result of the adaptation of Algerianlandraces to agronomic conditions different from current agriculture. The difference in rootingpatterns between landraces from different geographical areas and cultivars may lie in the agronomicenvironments in which they were developed. In general, modern durum wheat cultivars were bredunder high plant densities [57], whereas landraces were grown in stands with density adapted to theenvironment. The morphology of Algerian landraces (long seminal roots growing in steep angles)conforms to the “steep, cheap, and deep root ideotype” [60], and could be the result of adaptation toaccessing water in deep soil layers. Further studies with adult plants are needed to evaluate if rootfeatures of seedlings are maintained when the competition between individuals for root growth isincreased (as the seminal and nodal roots require more space and resources than just the seminal rootsof the seedlings). A shovelomics experiment is being carried out with the same genotypes, whichcould elucidate this issue at least for some measurable traits like root angle.
The high SDW of our durum landraces compared to cultivars could be related to the lack ofdwarfing genes in the landraces. This hypothesis was already confirmed previously for bread anddurum wheat for some height reducing genes [61], which reduced the first seedling leaf growth in Rhtgenotypes compared with the corresponding tall wheat lines.
4.3. Conclusions and Perspectives
We have found wide genetic variability in a collection of durum wheat genotypes cultivated inAlgeria and unraveled a possible historic trend that sheds light on the outcomes of modern breeding.An important issue is to what extent this variability found at the seedling stage can reflect the variabilityin the field with the same genetic material, more precisely, which traits can be consistent across plantphases (seedling and adult plant), enabling the selection at the early seedling stage. If this relationshipis not found, then the room for the testing of seminal root traits is very limited. Experiments to evaluatethis relationship are ongoing.
Overall, landraces showed a larger root size and steeper root angle. These two traits could beinvolved in the adaptation of landraces to water-stressed environments. The dwarfing genes seem to
107
Agronomy 2020, 10, 713
influence biomass partitioning; screening the current germplasm for these genes would elucidate thisissue. The root size and shape in our data indicated some independence that would open opportunitiesto design cultivars with the desired combinations of traits.
Overall, the current genotypes present a diverse root system architecture, from compactdeep-rooting to wide shallow one. This opens the opportunity to test the four different root ideotypesfound (G1–G4) for functional implications under water and nutrient-limited environments. Based onthe above results, we hypothesize that root architecture difference between cultivars, landraces (orsteep deep vs. shallow root systems) may result in different strategies of adaptation to the availabilityof water and nutrients over the soil profile.
Supplementary Materials: The following are available online at http://www.mdpi.com/2073-4395/10/5/713/s1,Table S1. Mean values and standard errors (12 replications) of the seminal root traits for the 37 durum wheatgenotypes. Table S2: Descriptive statistics and correlation coefficients for seedling traits, calculated separately forthe cultivar and landrace groups. Table S3: Results of linear regressions of traits over years of release. Table S4:Contribution (%) of the traits to the first two principal components (PC1, PC2), as represented in Figure 3A.Table S5: Means comparison between groups formed by hierarchical clustering for the traits assessed. Figure S1.(A) One-week-old durum wheat seedlings in the rhizoslide system; (B) pictures of two genotypes contrasting forroot angle, landrace Gloire de Montgolfier (left) and cultivar Oued El Berd (right); (C) schematic representation ofa glass box, holding 6 glass plates, each holding two rhizoslides. Figure S2: Time trend of seminal root traits overthe year of release.
Author Contributions: Conceptualization, E.I.; methodology, J.M.G.; formal analysis, R.B. and E.I.; investigation,R.B. and E.I.; resources, A.M.; software, J.M.G.; supervision, J.M.G., A.M., and E.I.; data curation, R.B.; visualization,J.M.G.; writing—original draft preparation, R.B. and J.M.G.; writing—review and editing, R.B., J.M.G., A.M.,A.M.C., and E.I.; project administration, A.M.C.; funding acquisition, R.B.; A.M.; A.M.C., and E.I. All authors haveread and agreed to the published version of the manuscript.
Funding: This study was funded by University of Alcalá Project CCGP2017-EXP/007. E.I. and A.M.C. acknowledgefunding from the Spanish Ministry of Economy and Competitiveness and the Agencia Estatal de Investigación(Project AGL2016–80967-R), and the European Regional Development Fund.
Acknowledgments: R.B. is a recipient a PhD grant in the framework of Programme National Exceptionel(PNE 2018/2019) funded by Algerian Ministry of Higher Education and Scientific Research.
Conflicts of Interest: The authors declare no conflict of interest.
References
1. Chochois, V.; Vogel, J.P.; Rebetzke, G.J.; Watt, M. Variation in adult plant phenotypes and partitioningamong seed and stem-borne roots across Brachypodium distachyon accessions to exploit in breeding cereals forwell-watered and drought environments. Plant Physiol. 2015, 168, 953–967. [CrossRef]
2. Sinha, S.K.; Rani, M.; Kumar, A.; Kumar, S.; Venkatesh, K.; Mandal, P.K. Natural variation in root systemarchitecture in diverse wheat genotypes grown under different nitrate conditions and root growth media.Theor. Exp. Plant Physiol. 2018, 30, 223–234. [CrossRef]
3. Araki, H.; Iijima, M. Deep rooting in winter wheat: Rooting nodes of deep roots in two cultivars with deepand shallow root systems. Plant Prod. Sci. 2001, 4, 215–219. [CrossRef] [PubMed]
4. Manske, G.G.B.; Vlek, P.L.G. Root Architecture-Wheat as a Model Plant. In Plant Roots: The Hidden Half,3rd ed.; Waisel, Y., Eshel, A., Beeckman, T., Kafkafi, U., Eds.; Marcel Dekker: New York, NY, USA, 2002;pp. 249–259.
5. Maccaferri, M.; El-Feki, W.; Nazemi, G.; Salvi, S.; Canè, M.A.; Colalongo, M.C.; Stefanelli, S.; Tuberosa, R.Prioritizing quantitative trait loci for root system architecture in tetraploid wheat. J. Exp. Bot. 2016, 67,1161–1178. [CrossRef] [PubMed]
6. Esau, K. Plant Anatomy, 2nd ed.; John Wiley: New York, NY, USA, 1965; 767p.7. Lynch, J. Root architecture and plant productivity. Plant Physiol. 1995, 109, 7–13. [CrossRef] [PubMed]8. Ahmadi, J.; Pour-Aboughadareh, A.; Fabriki-Ourang, S.; Mehrabi, A.A.; Siddique, K.H.M. Screening wheat
germplasm for seedling root architectural traits under contrasting water regimes: Potential sources ofvariability for drought adaptation. Arch. Agron. Soil Sci. 2018, 64, 1351–1365. [CrossRef]
9. York, L.M.; Slack, S.; Bennett, M.J.; Foulkes, M.J. Wheat shovelomics I: A field phenotyping approach forcharacterizing the structure and function of root systems in tillering species. BioRxiv 2018, 280875. [CrossRef]
108
Agronomy 2020, 10, 713
10. Nguyen, V.L.; Stangoulis, J. Variation in root system architecture and morphology of two wheat genotypes isa predictor of their tolerance to phosphorus deficiency. Acta Physiol. Plant. 2019, 41, 109. [CrossRef]
11. Bengough, A.G.; Gordon, D.C.; Al-Menaie, H.; Ellis, R.P.; Allan, D.; Keith, R.; Thomas, W.T.B.; Forster, B.P.Gel observation chamber for rapid screening of root traits in cereal seedlings. Plant Soil 2004, 262, 63–70.[CrossRef]
12. Watt, M.; Moosavi, S.; Cunningham, S.C.; Kirkegaard, J.A.; Rebetzke, G.J.; Richards, R.A. A rapid,controlled-environment seedling root screen for wheat correlates well with rooting depths at vegetative, butnot reproductive, stages at two field sites. Ann. Bot. 2013, 112, 447–455. [CrossRef]
13. Richard, C.A.; Hickey, L.T.; Fletcher, S.; Jennings, R.; Chenu, K.; Christopher, J.T. High-throughputphenotyping of seminal root traits in wheat. Plant Methods 2015, 11, 13. [CrossRef] [PubMed]
14. González, J.M.; Friero, E.; Selfa, L.; Froilán, S.; Jouve, N.A. Comparative study of root system architecture inseedlings of Brachypodium spp. using three plant growth supports. Cereal Res. Commun. 2016, 44, 69–78.[CrossRef]
15. Adeleke, E.; Millas, R.; McNeal, W.; Faris, J.; Taheri, A. Variation analysis of root system development inwheat seedlings using root phenotyping system. Agronomy 2020, 10, 206. [CrossRef]
16. Richard, C.; Christopher, J.; Chenu, K.; Borrell, A.; Christopher, M.; Hickey, L. Selection in early generationsto shift allele frequency for seminal root angle in wheat. Plant Genome 2018, 11, 170071. [CrossRef] [PubMed]
17. El Hassouni, K.; Alahmad, S.; Belkadi, B.; Filali-Maltouf, A.; Hickey, L.T.; Bassi, F.M. Root system architectureand its association with yield under different water regimes in durum wheat. Crop Sci. 2018, 58, 2331–2346.[CrossRef]
18. Bai, C.; Liang, Y.; Hawkesford, M.J. Identification of QTLs associated with seedling root traits and theircorrelation with plant height in wheat. J. Exp. Bot. 2013, 64, 1745–1753. [CrossRef]
19. Tuberosa, R.; Salvi, S.; Sanguineti, M.C.; Landi, P.; Maccaferri, M.; Conti, S. Mapping QTLs regulatingmorpho-physiological traits and yield: Case studies, shortcomings and perspectives in drought-stressedmaize. Ann. Bot. 2002, 89, 941–963. [CrossRef]
20. Tuberosa, R.; Sanguineti, M.C.; Landi, P.; Giuliani, M.M.; Salvi, S.; Conti, S. Identification of QTLs for rootcharacteristics in maize grown in hydroponics and analysis of their overlap with QTLs for grain yield in thefield at two water regimes. Plant Mol. Biol. 2002, 48, 697–712. [CrossRef]
21. Manschadi, A.M.; Christopher, J.; De Voil, P.; Hammer, G.L. The role of root architectural traits in adaptationof wheat to water-limited environments. Funct. Plant Biol. 2006, 33, 823–837. [CrossRef]
22. Paez-Garcia, A.; Motes, C.M.; Scheible, W.R.; Chen, R.; Blancaflor, E.B.; Monteros, M.J. Root traits andphenotyping strategies for plant improvement. Plants 2015, 4, 334–355. [CrossRef]
23. Løes, A.K.; Gahoonia, T.S. Genetic variation in specific root length in Scandinavian wheat and barleyaccessions. Euphytica 2004, 137, 243–249. [CrossRef]
24. Manschadi, A.M.; Hammer, G.L.; Christopher, J.T.; Devoil, P. Genotypic variation in seedling root architecturaltraits and implications for drought adaptation in wheat (Triticum aestivum L.). Plant Soil 2008, 303, 115–129.[CrossRef]
25. Ruiz, M.; Giraldo, P.; González, J.M. Phenotypic variation in root architecture traits and their relationshipwith eco-geographical and agronomic features in a core collection of tetraploid wheat landraces (Triticumturgidum L.). Euphytica 2018, 214, 54. [CrossRef]
26. Li, T.; Ma, J.; Zou, Y.; Chen, G.; Ding, P.; Zhang, H.; Yang, C.; Mu, Y.; Tang, H.; Liu, Y.; et al. Quantitativetrait loci for seeding root traits and the relationships between root and agronomic traits in common wheat.Genome 2020, 63, 27–36. [CrossRef] [PubMed]
27. Alahmad, S.; El Hassouni, K.; Bassi, F.M.; Dinglasan, E.; Youssef, C.; Quarry, G.; Able, J.A.; Christopher, J.A.Major root architecture QTL responding to water limitation in durum wheat. Front. Plant Sci. 2019, 10, 436.[CrossRef]
28. Ali, M.L.; Luetchens, J.; Nascimento, J.; Shaver, T.M.; Kruger, G.R.; Lorenz, A.J. Genetic variation in seminaland nodal root angle and their association with grain yield of maize under water-stressed field conditions.Plant Soil 2015, 397, 213–225. [CrossRef]
29. Nakamoto, T.; Oyanagi, A. The direction of growth of seminal roots of Triticum aestivum L. and experimentalmodification thereof. Ann. Bot. 1994, 73, 363–367. [CrossRef]
30. Masi, C.E.A.; Maranville, J.W. Evaluation of sorghum root branching using fractals. J. Agric. Sci. 1998, 131,259–265. [CrossRef]
109
Agronomy 2020, 10, 713
31. Liao, H.; Rubio, G.; Yan, X.; Cao, A.; Brown, K.M.; Lynch, J.P. Effect of phosphorus availability on basal rootshallowness in common bean. Plant Soil 2001, 232, 69–79. [CrossRef]
32. Lynch, J.P.; Brown, K.M. Topsoil foraging–an architectural adaptation of plants to low phosphorus availability.Plant Soil 2001, 237, 225–237. [CrossRef]
33. Roselló, M.; Royo, C.; Sanchez-Garcia, M.; Soriano, J.M. Genetic dissection of the seminal root systemarchitecture in Mediterranean durum wheat landraces by genome-wide association study. Agronomy 2019, 9,364. [CrossRef]
34. El-Beltagy, A.; Madkour, M. Impact of climate change on arid lands agriculture. Agric. Food Secur. 2012, 1, 3.[CrossRef]
35. Nazco, R.; Villegas, D.; Ammar, K.; Pena, R.J.; Moragues, M.; Royo, C. Can Mediterranean durum wheatlandraces contribute to improved grain quality attributes in modern cultivars? Euphytica 2012, 185, 1–17.[CrossRef]
36. Lopes, M.S.; El-Basyoni, I.; Baenziger, P.S.; Singh, S.; Royo, C.; Ozbek, K.; Aktas, H.; Ozer, E.; Ozdemir, F.;Manickavelu, A.; et al. Exploiting genetic diversity from landraces in wheat breeding for adaptation toclimate change. J. Exp. Bot. 2015, 66, 3477–3486. [CrossRef]
37. Araujo, S.S.; Beebe, S.; Crespi, M.; Delbreil, B.; González, E.M.; Gruber, V.; Lejeune-Henaut, I.; Link, W.;Monteros, M.J.; Prats, E.; et al. Abiotic stress responses in legumes: Strategies used to cope with environmentalchallenges. Crit. Rev. Plant Sci. 2015, 34, 237–280. [CrossRef]
38. Rao, I.M.; Beebe, S.E.; Polania, J.; Grajales, M.; Cajiao, C.; Ricaurte, J.; García, R.; Rivera, M. Evidence forgenotypic differences among elite lines of common bean in the ability to remobilize photosynthate to increaseyield under drought. J. Agric. Sci. 2017, 155, 857–875. [CrossRef]
39. Lynch, J.P. Steep, cheap and deep: An ideotype to optimize water and N acquisition by maize root systems.Ann. Bot. 2013, 112, 347–357. [CrossRef]
40. Aniol, A. Induction of aluminum tolerance in wheat seedlings by low doses of aluminum in the nutrientsolution. Plant Physiol. 1984, 75, 551–555. [CrossRef]
41. Lobet, G.; Pagès, L.; Draye, X. A novel image-analysis toolbox enabling quantitative analysis of root systemarchitecture. Plant Physiol. 2011, 157, 29–39. [CrossRef]
42. Payne, R.W.; Murray, D.A.; Harding, S.A.; Baird, D.B.; Soutar, D.M. GenStat for Windows Introduction, 12th ed.;VSN International: Hemel Hempstead, UK, 2009.
43. Le, S.; Josse, J.; Husson, F. FactoMineR: An R Package for Multivariate Analysis. J. Stat. 2008, 25, 18.44. Kassambara, A.; Mundt, F. Package ‘factoextra’. Extr. Vis. Results Multivar. Data Anal. 2017, 76. Available
online: http://www.sthda.com/english/rpkgs/factoextra (accessed on 2 March 2020).45. Devaiah, B.N.; Nagarajan, V.K.; Raghothama, K.G. Phosphate homeostasis and root development in
Arabidopsis is synchronized by the zinc finger transcription factor ZAT6. Plant Physiol. 2007, 145, 147–159.[CrossRef] [PubMed]
46. Da Silva, A.; Bruno, I.P.; Franzini, V.I.; Marcante, N.C.; Benitiz, L.; Muraoka, T. Phosphorus uptake efficiency,root morphology and architecture in Brazilian wheat cultivars. J. Radioanal. Nucl. Chem. 2016, 307, 1055–1063.[CrossRef]
47. Sanguineti, M.C.; Li, S.; Maccaferri, M.; Corneti, S.; Rotondo, F.; Chiari, T.; Tuberosa, R. Genetic dissection ofseminal root architecture in elite durum wheat germplasm. Ann. Appl. Biol. 2007, 151, 291–305. [CrossRef]
48. Cane, M.A.; Maccaferri, M.; Nazemi, G.; Salvi, S.; Francia, R.; Colalongo, C.; Tuberosa, R. Associationmapping for root architectural traits in durum wheat seedlings as related to agronomic performance. Mol.Breed. 2014, 34, 1629–1645. [CrossRef]
49. Robertson, B.M.; Waines, J.G.; Gill, B.S. Genetic variability for seedling root number in wild and domesticatedwheats. Crop Sci. 1979, 19, 843–847. [CrossRef]
50. Grando, S.; Ceccarelli, S. Seminal root morphology and coleoptile length in wild (Hordeum vulgare ssp.spontaneum) and cultivated (Hordeum vulgare ssp. vulgare) barley. Euphytica 1995, 86, 73–80.
51. O’Brien, L. Genetic variability of root growth in wheat (Triticum aestivum L.). Aust. J. Agric. Res. 1979, 30,587–595. [CrossRef]
52. Narayanan, S.; Mohan, A.; Gill, K.S.; Prasad, P.V. Variability of root traits in spring wheat germplasm.PLoS ONE 2014, 9, e100317. [CrossRef]
53. Bodner, G.; Leitner, D.; Nakhforoosh, A.; Sobotik, M.; Moder, K.; Kaul, H.P. A statistical approach to rootsystem classification. Front. Plant Sci. 2013, 4, 292. [CrossRef]
110
Agronomy 2020, 10, 713
54. Royo, C.; Nazco, R.; Villegas, D. The climate of the zone of origin of Mediterranean durum wheat (Triticumdurum Desf.) landraces affects their agronomic performance. Genet. Resour. Crop Evol. 2014, 61, 1345–1358.[CrossRef]
55. Soriano, J.M.; Villegas, D.; Aranzana, M.J.; Del Moral, L.F.G.; Royo, C. Genetic structure of modern durumwheat cultivars and Mediterranean landraces matches with their agronomic performance. PLoS ONE 2016,11, e0160983. [CrossRef] [PubMed]
56. Zhu, Y.H.; Weiner, J.; Yu, M.X.; Li, F.M. Evolutionary agroecology: Trends in root architecture during wheatbreeding. Evol. Appl. 2019, 12, 733–743. [CrossRef] [PubMed]
57. Song, L.; Zhang, D.W.; Li, F.M.; Fan, X.W.; Ma, Q.; Turner, N.C. Drought stress: Soil water availability altersthe inter- and intra-cultivar competition of three spring wheat cultivars bred in different eras. J. Agron. CropSci. 2010, 196, 323–335. [CrossRef]
58. De Parseval, H.; Barot, S.; Gignoux, J.; Lata, J.; Raynaud, X. Modelling facilitation or competition withina root system: Importance of the overlap of root depletion and accumulation zones. Plant Soil 2017, 419,97–111. [CrossRef]
59. Weiner, J.; Du, Y.L.; Zhang, C.; Qin, X.L.; Li, F.M. Evolutionary agroecology: Individual fitness and populationyield in wheat (Triticum aestivum). Ecology 2017, 98, 2261–2266. [CrossRef]
60. Kembel, S.W.; Cahill, J.F. Independent evolution of leaf and root traits within and among temperate grasslandplant communities. PLoS ONE 2011, 6, e19992. [CrossRef]
61. Ellis, M.H.; Rebetzke, G.J.; Chandler, P.; Bonnett, D.; Spielmeyer, W.; Richards, R.A. The effect of differentheight reducing genes on the early growth of wheat. Funct. Plant Biol. 2004, 31, 583–589. [CrossRef]
© 2020 by the authors. Licensee MDPI, Basel, Switzerland. This article is an open accessarticle distributed under the terms and conditions of the Creative Commons Attribution(CC BY) license (http://creativecommons.org/licenses/by/4.0/).
111

agronomy
Article
Effects of Genotype, Growing Season and NitrogenLevel on Gluten Protein Assembly of Durum WheatGrown under Mediterranean Conditions
Anna Gagliardi 1, Federica Carucci 1, Stefania Masci 2, Zina Flagella 1, Giuseppe Gatta 1,* and
Marcella Michela Giuliani 1,*
1 Department of Agricultural Food and Environmental Science, University of Foggia, 71122 Foggia FG, Italy;[email protected] (A.G.); [email protected] (F.C.); [email protected] (Z.F.)
2 Department of Agricultural and Forest Sciences, University of Tuscia, 01100 Viterbo, Italy; [email protected]* Correspondence: [email protected] (G.G.); [email protected] (M.M.G.)
Received: 24 March 2020; Accepted: 21 May 2020; Published: 25 May 2020
Abstract: Water deficit and high temperatures are the main environmental factors which affectboth wheat yield and technological quality in the Mediterranean climate. The aim of the studywas to evaluate the variation in the gluten protein assembly of four durum wheat genotypes inrelation to growing seasons and different nitrogen levels. The genotypes, Marco Aurelio, Quadrato,Pietrafitta and Redidenari, were grown under three nitrogen levels (36, 90 and 120 kg ha−1) duringtwo growing seasons in Southern Italy. Significant lower yield and a higher protein concentrationwere observed in the year characterized by a higher temperature at the end of the crop cycle. The effectof the high temperatures on protein assembly was different for the genotypes in relation to theirearliness. Based on PCA, in the warmer year, only the medium-early genotype Quadrato showedpositive values along the “protein polymerization degree” factor, while the medium and medium-lategenotypes, Marco Aurelio and Pietrafitta showed negative values along the “proteins assembly”factor. No clear separation along the two factors was observed for the early genotype Redidenari.The variation in gluten protein assembly observed in the four genotypes in relation to the growingseason might help breeding programs to select genotypes suitable for facing the ongoing climatechanges in Mediterranean area.
Keywords: durum wheat; glutenin polymers; gluten quality; high temperature; nitrogen fertilization
1. Introduction
Durum wheat (Triticum turgidum L., subsp. durum Desf.) is the most widespread cereal crop inMediterranean countries and is grown in various climatic conditions [1].
Water deficit and high temperatures are the main environmental factors which affect both wheatyield and technological quality in the Mediterranean climate [2,3]. According to studies performed bythe Intergovernmental Panel on Climate Change (IPCC), further increase in temperatures is predictedin Europe, especially in the Southern and Central parts [4,5]. In this context, the maintenance ofadequate yield and quality standards is of particular interest, since the annual variability of productquality cannot be acceptable, especially for dry pasta production [6].
The wheat grain quality mainly depends on the quantity and type of gluten proteins, as well ason their aggregation/polymerization level [7,8]. In particular, gliadins, which are monomeric proteins,are mainly responsible for the viscous nature of the dough, and interact mostly via non-covalentlinks, while glutenin, which are polymeric proteins stabilized by disulphide bonds, determine itselasticity [9–12].
Agronomy 2020, 10, 755; doi:10.3390/agronomy10050755 www.mdpi.com/journal/agronomy113
Agronomy 2020, 10, 755
In the literature [13–22], conflicting results on the effect of high temperatures on the qualityof the gluten proteins have been reported. Studies made on bread wheat suggest that when hightemperatures occur in the middle of grain filling, they positively affect dough strength [13], while veryhigh temperatures near physiological maturity can have a negative effect [14]. Ciaffi et al. [15] reportedthat in bread wheat, high temperatures increased the accumulation of glutenins compared to gliadins.On the contrary, O’Leary et al. [16] reported that water or thermal stress conditions throughout thegrain filling period determine a delay in the synthesis of glutenins while the synthesis of gliadins is notaltered. Furthermore, for common wheat, it is reported that short periods of very high temperaturescan significantly reduce the proportion of SDS-insoluble polymers (UPP) [15,17], which in breadwheat (Triticum aestivum L.) have been positively correlated with dough viscoelasticity [7,8]. On thecontrary, some authors have reported that short periods of very high temperatures can lead to anincrease in the size of glutenin polymers in both soft and durum wheat [18,19]. While numerous arethe studies available in the literature on the effect of high temperatures on gluten protein concentration,composition and on polymeric proteins size and distribution in common wheat [20–22], very few arethe studies relative to durum wheat and to its pasta-making quality [8]. Moreover, pasta-makingquality in durum wheat is mostly determined by low-molecular-weight glutenin subunits (LMW-GS),especially the B-type [23], whereas in bread wheat high molecular weight glutenin subunits (HMW-GS)play the major role in determining dough technological properties [24].
In the Mediterranean areas, after climate conditions, the nitrogen (N) availability represents themain constraint in obtaining adequate yield and quality in durum wheat [25]. Some studies on breadwheat have suggested that high doses of N tend to increase the amount of monomer proteins [26,27]and to reduce the percentage of UPP causing an increase in the extensibility of the dough [28–31].Moreover, some authors have highlighted that the effect of nitrogen on gluten proteins compositionand on polymers organization may vary according to the genotype [26,30,32]. Finally, for the sameparameters, significant effect of the interaction between the high temperatures and N availability hasbeen reported [29,33]. Malik et al. [33] highlighted that the combinations of cultivars, nitrogen andtemperature were needed to explain the variation in the quantity and size distribution of the polymerproteins and their effects on the quality of the end-product. To the best of our knowledge, for durumwheat, this type of information is still lacking.
Thus, the aim of the present study was to evaluate the variation in gluten proteins quality, in termsof their capacity to assembly in a visco-elastic structure, of four durum wheat genotypes in relation tothe growing season and different nitrogen levels, including a low input rate.
2. Materials and Methods
2.1. Field Trials
Four durum wheat cultivars, Marco Aurelio, Quadrato, Pietrafitta and Redidenari, that are usedin an important Italian pasta supply chain, (Table 1), were grown in two rain-fed field experimentscarried out at Foggia (latitude 41◦46′ N and longitude 15◦54′ E, 74 m a.s.l.) during two growing seasons(2016–2017 and 2017–2018, hereafter indicated as 2017 and 2018, respectively) in a clay loam soil.
Table 1. Main characteristics of the genotypes under study.
Genotype Year of Release Pedigree Earliness
Pietrafitta 1999 Grazia x Isa medium-lateQuadrato 1999 Creso x Trinakria medium early
Marco Aurelio 2010 Orobel//Arcobaleno/Svevo mediumRedidenari 2015 Kofa x N185 early
The main chemical and physical soil characteristics in the two experimental year, 2017 and 2018,are reported in Table 2.
114
Agronomy 2020, 10, 755
Table 2. Soil physical and chemical characteristics in the two experimental years.
Soil Characteristics 2017 2018
Sand % 21.5 25.2Silt % 39.8 36.2
Clay % 38.7 38.6pH 8.1 8.2
Organic Matter * % 1.9 1.9Total Nitrogen ** %� 1.3 1.3
Assimilable Phosphorus√
mg kg−1 80 64Exchangeable Potassium ♦ mg kg−1 461 422Field Capacity (−0.03 MPa) % 37.3 33.13
Wilting Point (−1.5 MPa) % 19.7 18.5Bulk Density Mgm3 1.15 1.10
* Walkley-Black method; ** Kjeldhal method;√
Olsen method; ♦Ammonium acetate method.
The four cultivars were sown on November 17 in 2016 and November 25 in 2017, at a seeding rateof 240 kg ha−1. In both years, the experiment was in a field where the previous crop was durum wheat.
Three different nitrogen levels were adopted corresponding to 36, 90 and 120 kg ha−1 (N36, N90 andN120, respectively). The fertilizers used were Yara Mila Supersemina (18% nitrogen) at pre-sowingfertilization and Yara Bela Sulfan (24% nitrogen) at tillering, stem elongation and inflorescenceemergence fertilization.
Each year, the experiment was arranged in a split-plot design with two factors (genotype in plotsand nitrogen levels in sub-plots) and three replications; each sub-plot was 20.4 m2.
The grain harvest was carried out at physiological maturity on 13 June 2017 and on 22 June2018. During the experimental period, the daily climatic parameters of rainfall and temperature wererecorded by a weather station near the experimental area.
2.2. Yield and Technological Quality Parameters
At harvest, grain yield (t ha−1) and thousand kernel weight (TKW) were determined.Moreover, grain protein content (GPC) was performed by NIR System Infratec 1241 Analyzer (Foss,Hillerod, Denmark).
Semolina flours have been obtained from kernels milled by Bona mill 4 cylinders (sieve 180 μm).The gluten index (GI), an indicator of the gluten strength, was determined on semolina samples
using the Glutomatic system according to ICC standard 155 [34].
2.3. Calculation of %UPP and Analysis of Gluten Protein Molecular Size Distribution
The percentage of Unextractable Polymeric Proteins (%UPP) was measured trough the SE-HPLCprocedure according to the method reported in Tosi et al. [35] with minor modifications. The SDS-solublefraction was obtained by adding to the semolina a solution consisting of 0.5% (w/v) SDS in 0.05 Msodium phosphate buffer, pH 6.9 to a final concentration of 10 mg/mL (0.3 g semolina on 30 mL buffer).The mixture was stirred for 30 min at room temperature and then centrifuged at 20.000 g for 20 minat 15 ◦C. The supernatant was filtered through 0.45 μm PVDF filters and 20 μl were injected into aBiobasic Thermo Scientific SEC-300 Columns (300 mm × 7.8 mm; flow rate: 0.7 mL/min) and run for40 min, with an eluent consisting of 0.05 M sodium phosphate buffer pH 6.9, containing 0.08 M NaCland 0.1 % (w/v) SDS, using the UHPLC Ultimate 3000 Thermo scientific. Detection was at 214 nm.The SDS soluble fraction profiles were divided into four areas, corresponding to HPLC fractions F1, F2,F3 and F4 (Figure S2a). The first two areas correspond to large and medium size polymers, with bothbeing enriched in HMW-GS (mainly F1) and B-type LMW-GS (mainly F2) of glutenin. F3 correspondsto ω-gliadins and small oligomers enriched in C-type and D-type LMW-GS subunits [23], while F4corresponds to monomeric gliadins (α-type and β-type) and non-gluten proteins [35].
115
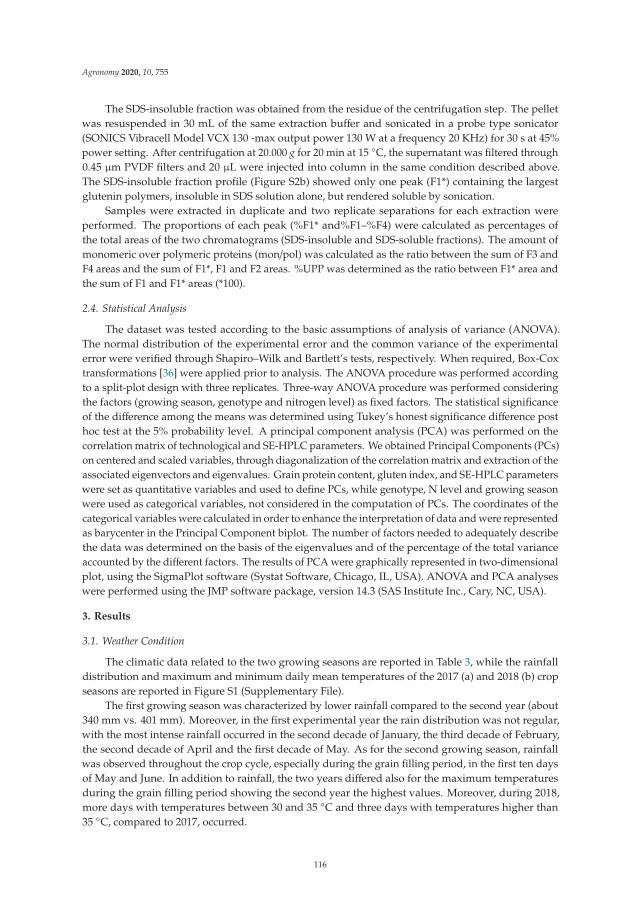
Agronomy 2020, 10, 755
The SDS-insoluble fraction was obtained from the residue of the centrifugation step. The pelletwas resuspended in 30 mL of the same extraction buffer and sonicated in a probe type sonicator(SONICS Vibracell Model VCX 130 -max output power 130 W at a frequency 20 KHz) for 30 s at 45%power setting. After centrifugation at 20.000 g for 20 min at 15 ◦C, the supernatant was filtered through0.45 μm PVDF filters and 20 μL were injected into column in the same condition described above.The SDS-insoluble fraction profile (Figure S2b) showed only one peak (F1*) containing the largestglutenin polymers, insoluble in SDS solution alone, but rendered soluble by sonication.
Samples were extracted in duplicate and two replicate separations for each extraction wereperformed. The proportions of each peak (%F1* and%F1–%F4) were calculated as percentages ofthe total areas of the two chromatograms (SDS-insoluble and SDS-soluble fractions). The amount ofmonomeric over polymeric proteins (mon/pol) was calculated as the ratio between the sum of F3 andF4 areas and the sum of F1*, F1 and F2 areas. %UPP was determined as the ratio between F1* area andthe sum of F1 and F1* areas (*100).
2.4. Statistical Analysis
The dataset was tested according to the basic assumptions of analysis of variance (ANOVA).The normal distribution of the experimental error and the common variance of the experimentalerror were verified through Shapiro–Wilk and Bartlett’s tests, respectively. When required, Box-Coxtransformations [36] were applied prior to analysis. The ANOVA procedure was performed accordingto a split-plot design with three replicates. Three-way ANOVA procedure was performed consideringthe factors (growing season, genotype and nitrogen level) as fixed factors. The statistical significanceof the difference among the means was determined using Tukey’s honest significance difference posthoc test at the 5% probability level. A principal component analysis (PCA) was performed on thecorrelation matrix of technological and SE-HPLC parameters. We obtained Principal Components (PCs)on centered and scaled variables, through diagonalization of the correlation matrix and extraction of theassociated eigenvectors and eigenvalues. Grain protein content, gluten index, and SE-HPLC parameterswere set as quantitative variables and used to define PCs, while genotype, N level and growing seasonwere used as categorical variables, not considered in the computation of PCs. The coordinates of thecategorical variables were calculated in order to enhance the interpretation of data and were representedas barycenter in the Principal Component biplot. The number of factors needed to adequately describethe data was determined on the basis of the eigenvalues and of the percentage of the total varianceaccounted by the different factors. The results of PCA were graphically represented in two-dimensionalplot, using the SigmaPlot software (Systat Software, Chicago, IL, USA). ANOVA and PCA analyseswere performed using the JMP software package, version 14.3 (SAS Institute Inc., Cary, NC, USA).
3. Results
3.1. Weather Condition
The climatic data related to the two growing seasons are reported in Table 3, while the rainfalldistribution and maximum and minimum daily mean temperatures of the 2017 (a) and 2018 (b) cropseasons are reported in Figure S1 (Supplementary File).
The first growing season was characterized by lower rainfall compared to the second year (about340 mm vs. 401 mm). Moreover, in the first experimental year the rain distribution was not regular,with the most intense rainfall occurred in the second decade of January, the third decade of February,the second decade of April and the first decade of May. As for the second growing season, rainfallwas observed throughout the crop cycle, especially during the grain filling period, in the first ten daysof May and June. In addition to rainfall, the two years differed also for the maximum temperaturesduring the grain filling period showing the second year the highest values. Moreover, during 2018,more days with temperatures between 30 and 35 ◦C and three days with temperatures higher than35 ◦C, compared to 2017, occurred.
116
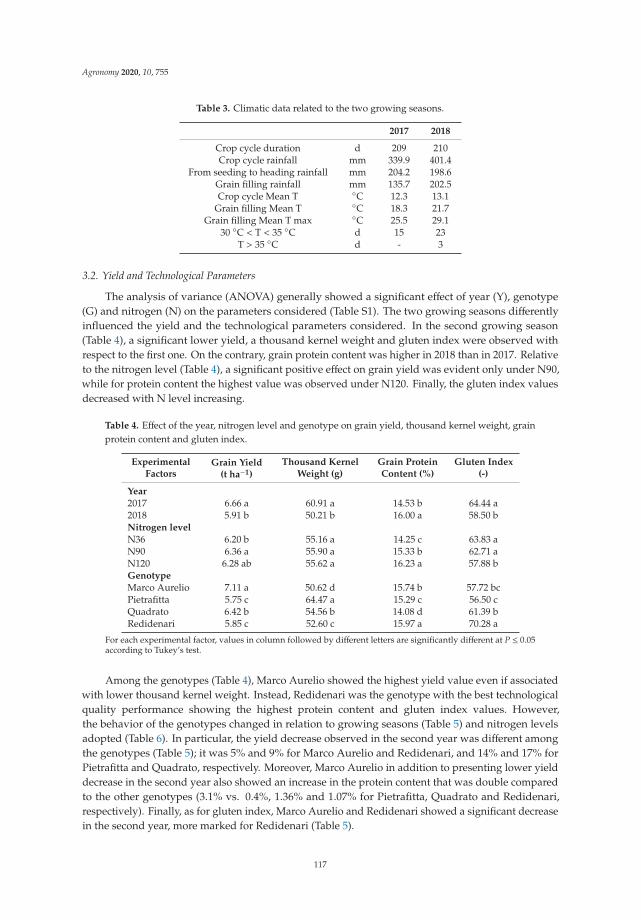
Agronomy 2020, 10, 755
Table 3. Climatic data related to the two growing seasons.
2017 2018
Crop cycle duration d 209 210Crop cycle rainfall mm 339.9 401.4
From seeding to heading rainfall mm 204.2 198.6Grain filling rainfall mm 135.7 202.5Crop cycle Mean T ◦C 12.3 13.1
Grain filling Mean T ◦C 18.3 21.7Grain filling Mean T max ◦C 25.5 29.1
30 ◦C < T < 35 ◦C d 15 23T > 35 ◦C d - 3
3.2. Yield and Technological Parameters
The analysis of variance (ANOVA) generally showed a significant effect of year (Y), genotype(G) and nitrogen (N) on the parameters considered (Table S1). The two growing seasons differentlyinfluenced the yield and the technological parameters considered. In the second growing season(Table 4), a significant lower yield, a thousand kernel weight and gluten index were observed withrespect to the first one. On the contrary, grain protein content was higher in 2018 than in 2017. Relativeto the nitrogen level (Table 4), a significant positive effect on grain yield was evident only under N90,while for protein content the highest value was observed under N120. Finally, the gluten index valuesdecreased with N level increasing.
Table 4. Effect of the year, nitrogen level and genotype on grain yield, thousand kernel weight, grainprotein content and gluten index.
ExperimentalFactors
Grain Yield(t ha−1)
Thousand KernelWeight (g)
Grain ProteinContent (%)
Gluten Index(-)
Year
2017 6.66 a 60.91 a 14.53 b 64.44 a2018 5.91 b 50.21 b 16.00 a 58.50 bNitrogen level
N36 6.20 b 55.16 a 14.25 c 63.83 aN90 6.36 a 55.90 a 15.33 b 62.71 aN120 6.28 ab 55.62 a 16.23 a 57.88 bGenotype
Marco Aurelio 7.11 a 50.62 d 15.74 b 57.72 bcPietrafitta 5.75 c 64.47 a 15.29 c 56.50 cQuadrato 6.42 b 54.56 b 14.08 d 61.39 bRedidenari 5.85 c 52.60 c 15.97 a 70.28 a
For each experimental factor, values in column followed by different letters are significantly different at P ≤ 0.05according to Tukey’s test.
Among the genotypes (Table 4), Marco Aurelio showed the highest yield value even if associatedwith lower thousand kernel weight. Instead, Redidenari was the genotype with the best technologicalquality performance showing the highest protein content and gluten index values. However,the behavior of the genotypes changed in relation to growing seasons (Table 5) and nitrogen levelsadopted (Table 6). In particular, the yield decrease observed in the second year was different amongthe genotypes (Table 5); it was 5% and 9% for Marco Aurelio and Redidenari, and 14% and 17% forPietrafitta and Quadrato, respectively. Moreover, Marco Aurelio in addition to presenting lower yielddecrease in the second year also showed an increase in the protein content that was double comparedto the other genotypes (3.1% vs. 0.4%, 1.36% and 1.07% for Pietrafitta, Quadrato and Redidenari,respectively). Finally, as for gluten index, Marco Aurelio and Redidenari showed a significant decreasein the second year, more marked for Redidenari (Table 5).
117
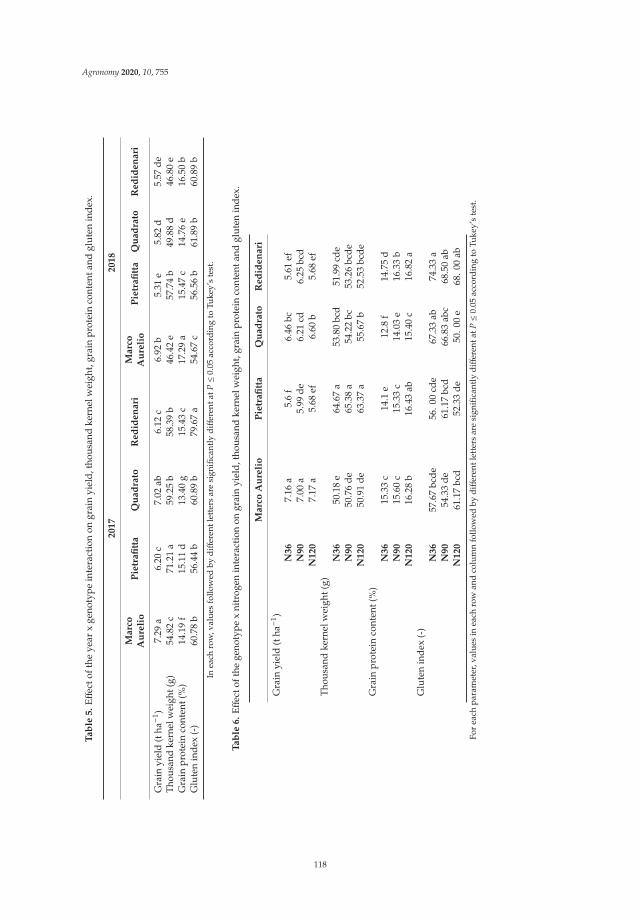
Agronomy 2020, 10, 755
Ta
ble
5.
Effec
toft
heye
arx
geno
type
inte
ract
ion
ongr
ain
yiel
d,th
ousa
ndke
rnel
wei
ght,
grai
npr
otei
nco
nten
tand
glut
enin
dex.
20
17
20
18
Ma
rco
Au
reli
oP
ietr
afi
tta
Qu
ad
rato
Re
did
en
ari
Ma
rco
Au
reli
oP
ietr
afi
tta
Qu
ad
rato
Re
did
en
ari
Gra
inyi
eld
(tha−1
)7.
29a
6.20
c7.
02ab
6.12
c6.
92b
5.31
e5.
82d
5.57
deTh
ousa
ndke
rnel
wei
ght(
g)54
.82
c71
.21
a59
.25
b58
.39
b46
.42
e57
.74
b49
.88
d46
.80
eG
rain
prot
ein
cont
ent(
%)
14.1
9f
15.1
1d
13.4
0g
15.4
3c
17.2
9a
15.4
7c
14.7
6e
16.5
0b
Glu
ten
inde
x(-
)60
.78
b56
.44
b60
.89
b79
.67
a54
.67
c56
.56
b61
.89
b60
.89
b
Inea
chro
w,v
alue
sfo
llow
edby
diff
eren
tlet
ters
are
sign
ifica
ntly
diff
eren
tatP≤0
.05
acco
rdin
gto
Tuke
y’s
test
.
Ta
ble
6.
Effec
toft
hege
noty
pex
nitr
ogen
inte
ract
ion
ongr
ain
yiel
d,th
ousa
ndke
rnel
wei
ght,
grai
npr
otei
nco
nten
tand
glut
enin
dex.
Ma
rco
Au
reli
oP
ietr
afi
tta
Qu
ad
rato
Re
did
en
ari
Gra
inyi
eld
(tha−1
)N
36
7.16
a5.
6f
6.46
bc5.
61ef
N9
07.
00a
5.99
de6.
21cd
6.25
bcd
N1
20
7.17
a5.
68ef
6.60
b5.
68ef
Thou
sand
kern
elw
eigh
t(g)
N3
650
.18
e64
.67
a53
.80
bcd
51.9
9cd
eN
90
50.7
6de
65.3
8a
54.2
2bc
53.2
6bc
deN
12
050
.91
de63
.37
a55
.67
b52
.53
bcde
Gra
inpr
otei
nco
nten
t(%
)N
36
15.3
3c
14.1
e12
.8f
14.7
5d
N9
015
.60
c15
.33
c14
.03
e16
.33
bN
12
016
.28
b16
.43
ab15
.40
c16
.82
aG
lute
nin
dex
(-)
N3
657
.67
bcde
56.0
0cd
e67
.33
ab74
.33
aN
90
54.3
3de
61.1
7bc
d66
.83
abc
68.5
0ab
N1
20
61.1
7bc
d52
.33
de50
.00
e68
.00
ab
For
each
para
met
er,v
alue
sin
each
row
and
colu
mn
follo
wed
bydiff
eren
tlet
ters
are
sign
ifica
ntly
diff
eren
tatP≤0
.05
acco
rdin
gto
Tuke
y’s
test
.
118
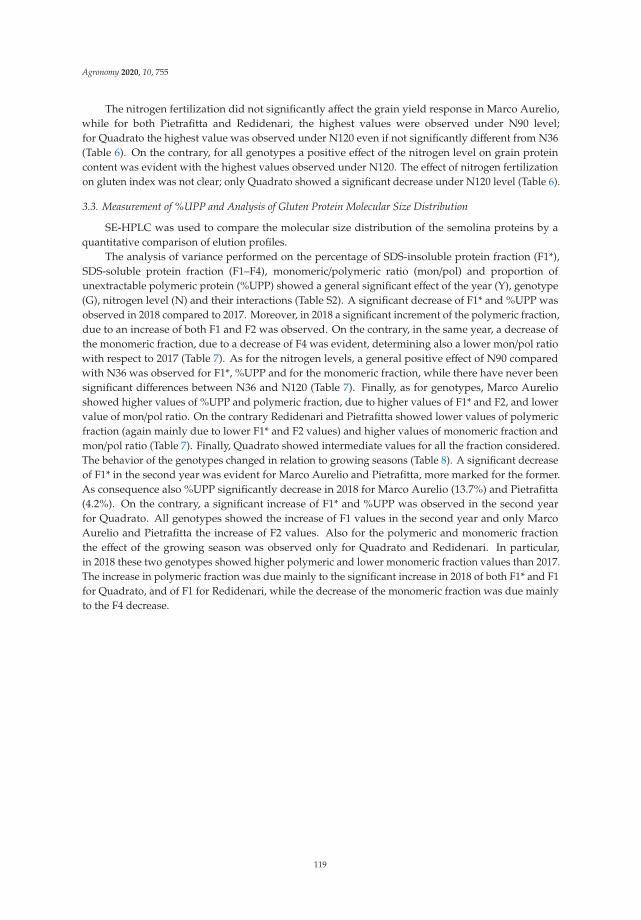
Agronomy 2020, 10, 755
The nitrogen fertilization did not significantly affect the grain yield response in Marco Aurelio,while for both Pietrafitta and Redidenari, the highest values were observed under N90 level;for Quadrato the highest value was observed under N120 even if not significantly different from N36(Table 6). On the contrary, for all genotypes a positive effect of the nitrogen level on grain proteincontent was evident with the highest values observed under N120. The effect of nitrogen fertilizationon gluten index was not clear; only Quadrato showed a significant decrease under N120 level (Table 6).
3.3. Measurement of %UPP and Analysis of Gluten Protein Molecular Size Distribution
SE-HPLC was used to compare the molecular size distribution of the semolina proteins by aquantitative comparison of elution profiles.
The analysis of variance performed on the percentage of SDS-insoluble protein fraction (F1*),SDS-soluble protein fraction (F1–F4), monomeric/polymeric ratio (mon/pol) and proportion ofunextractable polymeric protein (%UPP) showed a general significant effect of the year (Y), genotype(G), nitrogen level (N) and their interactions (Table S2). A significant decrease of F1* and %UPP wasobserved in 2018 compared to 2017. Moreover, in 2018 a significant increment of the polymeric fraction,due to an increase of both F1 and F2 was observed. On the contrary, in the same year, a decrease ofthe monomeric fraction, due to a decrease of F4 was evident, determining also a lower mon/pol ratiowith respect to 2017 (Table 7). As for the nitrogen levels, a general positive effect of N90 comparedwith N36 was observed for F1*, %UPP and for the monomeric fraction, while there have never beensignificant differences between N36 and N120 (Table 7). Finally, as for genotypes, Marco Aurelioshowed higher values of %UPP and polymeric fraction, due to higher values of F1* and F2, and lowervalue of mon/pol ratio. On the contrary Redidenari and Pietrafitta showed lower values of polymericfraction (again mainly due to lower F1* and F2 values) and higher values of monomeric fraction andmon/pol ratio (Table 7). Finally, Quadrato showed intermediate values for all the fraction considered.The behavior of the genotypes changed in relation to growing seasons (Table 8). A significant decreaseof F1* in the second year was evident for Marco Aurelio and Pietrafitta, more marked for the former.As consequence also %UPP significantly decrease in 2018 for Marco Aurelio (13.7%) and Pietrafitta(4.2%). On the contrary, a significant increase of F1* and %UPP was observed in the second yearfor Quadrato. All genotypes showed the increase of F1 values in the second year and only MarcoAurelio and Pietrafitta the increase of F2 values. Also for the polymeric and monomeric fractionthe effect of the growing season was observed only for Quadrato and Redidenari. In particular,in 2018 these two genotypes showed higher polymeric and lower monomeric fraction values than 2017.The increase in polymeric fraction was due mainly to the significant increase in 2018 of both F1* and F1for Quadrato, and of F1 for Redidenari, while the decrease of the monomeric fraction was due mainlyto the F4 decrease.
119
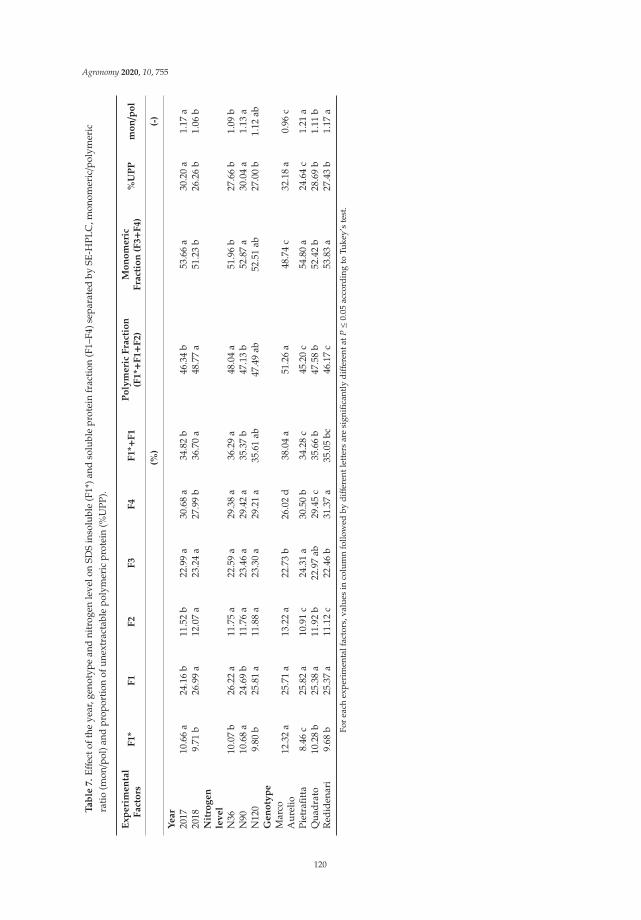
Agronomy 2020, 10, 755
Ta
ble
7.
Eff
ecto
fthe
year
,gen
otyp
ean
dni
trog
enle
velo
nSD
Sin
solu
ble
(F1*
)and
solu
ble
prot
ein
frac
tion
(F1–
F4)s
epar
ated
bySE
-HPL
C,m
onom
eric/p
olym
eric
rati
o(m
on/p
ol)a
ndpr
opor
tion
ofun
extr
acta
ble
poly
mer
icpr
otei
n(%
UPP
).
Ex
pe
rim
en
tal
Fa
cto
rsF
1*
F1
F2
F3
F4
F1
*+F
1P
oly
me
ric
Fra
ctio
n(F
1*+
F1+
F2
)M
on
om
eri
cF
ract
ion
(F3+
F4
)%
UP
Pm
on/p
ol
(%)
(-)
Ye
ar
2017
10.6
6a
24.1
6b
11.5
2b
22.9
9a
30.6
8a
34.8
2b
46.3
4b
53.6
6a
30.2
0a
1.17
a20
189.
71b
26.9
9a
12.0
7a
23.2
4a
27.9
9b
36.7
0a
48.7
7a
51.2
3b
26.2
6b
1.06
bN
itro
ge
nle
ve
lN
3610
.07
b26
.22
a11
.75
a22
.59
a29
.38
a36
.29
a48
.04
a51
.96
b27
.66
b1.
09b
N90
10.6
8a
24.6
9b
11.7
6a
23.4
6a
29.4
2a
35.3
7b
47.1
3b
52.8
7a
30.0
4a
1.13
aN
120
9.80
b25
.81
a11
.88
a23
.30
a29
.21
a35
.61
ab47
.49
ab52
.51
ab27
.00
b1.
12ab
Ge
no
typ
e
Mar
coA
urel
io12
.32
a25
.71
a13
.22
a22
.73
b26
.02
d38
.04
a51
.26
a48
.74
c32
.18
a0.
96c
Piet
rafit
ta8.
46c
25.8
2a
10.9
1c
24.3
1a
30.5
0b
34.2
8c
45.2
0c
54.8
0a
24.6
4c
1.21
aQ
uadr
ato
10.2
8b
25.3
8a
11.9
2b
22.9
7ab
29.4
5c
35.6
6b
47.5
8b
52.4
2b
28.6
9b
1.11
bR
edid
enar
i9.
68b
25.3
7a
11.1
2c
22.4
6b
31.3
7a
35.0
5bc
46.1
7c
53.8
3a
27.4
3b
1.17
a
For
each
expe
rim
enta
lfac
tors
,val
ues
inco
lum
nfo
llow
edby
diff
eren
tlet
ters
are
sign
ifica
ntly
diff
eren
tatP≤0
.05
acco
rdin
gto
Tuke
y’s
test
.
120
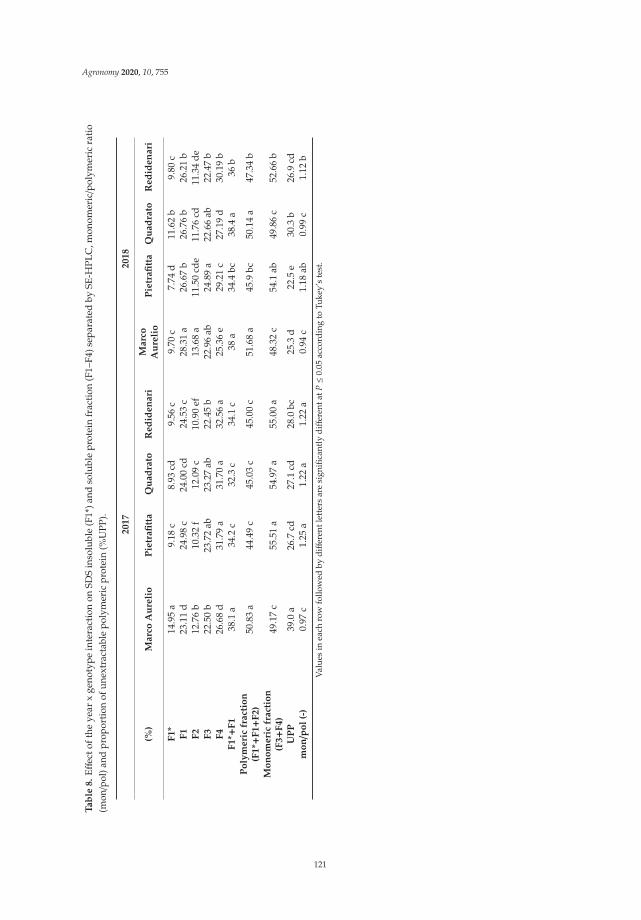
Agronomy 2020, 10, 755
Ta
ble
8.
Eff
ecto
fthe
year
xge
noty
pein
tera
ctio
non
SDS
inso
lubl
e(F
1*)a
ndso
lubl
epr
otei
nfr
acti
on(F
1–F4
)sep
arat
edby
SE-H
PLC
,mon
omer
ic/p
olym
eric
rati
o(m
on/p
ol)a
ndpr
opor
tion
ofun
extr
acta
ble
poly
mer
icpr
otei
n(%
UPP
).
20
17
20
18
(%)
Ma
rco
Au
reli
oP
ietr
afi
tta
Qu
ad
rato
Re
did
en
ari
Ma
rco
Au
reli
oP
ietr
afi
tta
Qu
ad
rato
Re
did
en
ari
F1
*14
.95
a9.
18c
8.93
cd9.
56c
9.70
c7.
74d
11.6
2b
9.80
cF
123
.11
d24
.98
c24
.00
cd24
.53
c28
.31
a26
.67
b26
.76
b26
.21
bF
212
.76
b10
.32
f12
.09
c10
.90
ef13
.68
a11
.50
cde
11.7
6cd
11.3
4de
F3
22.5
0b
23.7
2ab
23.2
7ab
22.4
5b
22.9
6ab
24.8
9a
22.6
6ab
22.4
7b
F4
26.6
8d
31.7
9a
31.7
0a
32.5
6a
25.3
6e
29.2
1c
27.1
9d
30.1
9b
F1
*+F
138
.1a
34.2
c32
.3c
34.1
c38
a34
.4bc
38.4
a36
bP
oly
me
ric
fra
ctio
n(F
1*+
F1+
F2
)50
.83
a44
.49
c45
.03
c45
.00
c51
.68
a45
.9bc
50.1
4a
47.3
4b
Mo
no
me
ric
fra
ctio
n(F
3+
F4
)49
.17
c55
.51
a54
.97
a55
.00
a48
.32
c54
.1ab
49.8
6c
52.6
6b
UP
P39
.0a
26.7
cd27
.1cd
28.0
bc25
.3d
22.5
e30
.3b
26.9
cdm
on/p
ol
(-)
0.97
c1.
25a
1.22
a1.
22a
0.94
c1.
18ab
0.99
c1.
12b
Val
ues
inea
chro
wfo
llow
edby
diff
eren
tlet
ters
are
sign
ifica
ntly
diff
eren
tatP≤0
.05
acco
rdin
gto
Tuke
y’s
test
.
121
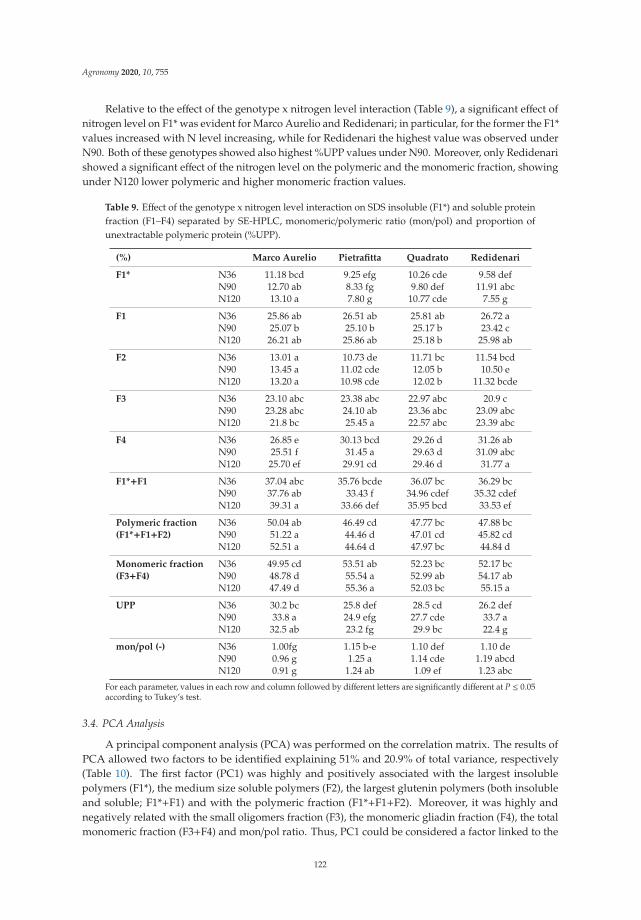
Agronomy 2020, 10, 755
Relative to the effect of the genotype x nitrogen level interaction (Table 9), a significant effect ofnitrogen level on F1* was evident for Marco Aurelio and Redidenari; in particular, for the former the F1*values increased with N level increasing, while for Redidenari the highest value was observed underN90. Both of these genotypes showed also highest %UPP values under N90. Moreover, only Redidenarishowed a significant effect of the nitrogen level on the polymeric and the monomeric fraction, showingunder N120 lower polymeric and higher monomeric fraction values.
Table 9. Effect of the genotype x nitrogen level interaction on SDS insoluble (F1*) and soluble proteinfraction (F1–F4) separated by SE-HPLC, monomeric/polymeric ratio (mon/pol) and proportion ofunextractable polymeric protein (%UPP).
(%) Marco Aurelio Pietrafitta Quadrato Redidenari
F1* N36 11.18 bcd 9.25 efg 10.26 cde 9.58 defN90 12.70 ab 8.33 fg 9.80 def 11.91 abcN120 13.10 a 7.80 g 10.77 cde 7.55 g
F1 N36 25.86 ab 26.51 ab 25.81 ab 26.72 aN90 25.07 b 25.10 b 25.17 b 23.42 cN120 26.21 ab 25.86 ab 25.18 b 25.98 ab
F2 N36 13.01 a 10.73 de 11.71 bc 11.54 bcdN90 13.45 a 11.02 cde 12.05 b 10.50 eN120 13.20 a 10.98 cde 12.02 b 11.32 bcde
F3 N36 23.10 abc 23.38 abc 22.97 abc 20.9 cN90 23.28 abc 24.10 ab 23.36 abc 23.09 abcN120 21.8 bc 25.45 a 22.57 abc 23.39 abc
F4 N36 26.85 e 30.13 bcd 29.26 d 31.26 abN90 25.51 f 31.45 a 29.63 d 31.09 abcN120 25.70 ef 29.91 cd 29.46 d 31.77 a
F1*+F1 N36 37.04 abc 35.76 bcde 36.07 bc 36.29 bcN90 37.76 ab 33.43 f 34.96 cdef 35.32 cdefN120 39.31 a 33.66 def 35.95 bcd 33.53 ef
Polymeric fraction N36 50.04 ab 46.49 cd 47.77 bc 47.88 bc(F1*+F1+F2) N90 51.22 a 44.46 d 47.01 cd 45.82 cd
N120 52.51 a 44.64 d 47.97 bc 44.84 d
Monomeric fraction N36 49.95 cd 53.51 ab 52.23 bc 52.17 bc(F3+F4) N90 48.78 d 55.54 a 52.99 ab 54.17 ab
N120 47.49 d 55.36 a 52.03 bc 55.15 a
UPP N36 30.2 bc 25.8 def 28.5 cd 26.2 defN90 33.8 a 24.9 efg 27.7 cde 33.7 aN120 32.5 ab 23.2 fg 29.9 bc 22.4 g
mon/pol (-) N36 1.00fg 1.15 b-e 1.10 def 1.10 deN90 0.96 g 1.25 a 1.14 cde 1.19 abcdN120 0.91 g 1.24 ab 1.09 ef 1.23 abc
For each parameter, values in each row and column followed by different letters are significantly different at P ≤ 0.05according to Tukey’s test.
3.4. PCA Analysis
A principal component analysis (PCA) was performed on the correlation matrix. The results ofPCA allowed two factors to be identified explaining 51% and 20.9% of total variance, respectively(Table 10). The first factor (PC1) was highly and positively associated with the largest insolublepolymers (F1*), the medium size soluble polymers (F2), the largest glutenin polymers (both insolubleand soluble; F1*+F1) and with the polymeric fraction (F1*+F1+F2). Moreover, it was highly andnegatively related with the small oligomers fraction (F3), the monomeric gliadin fraction (F4), the totalmonomeric fraction (F3+F4) and mon/pol ratio. Thus, PC1 could be considered a factor linked to the
122
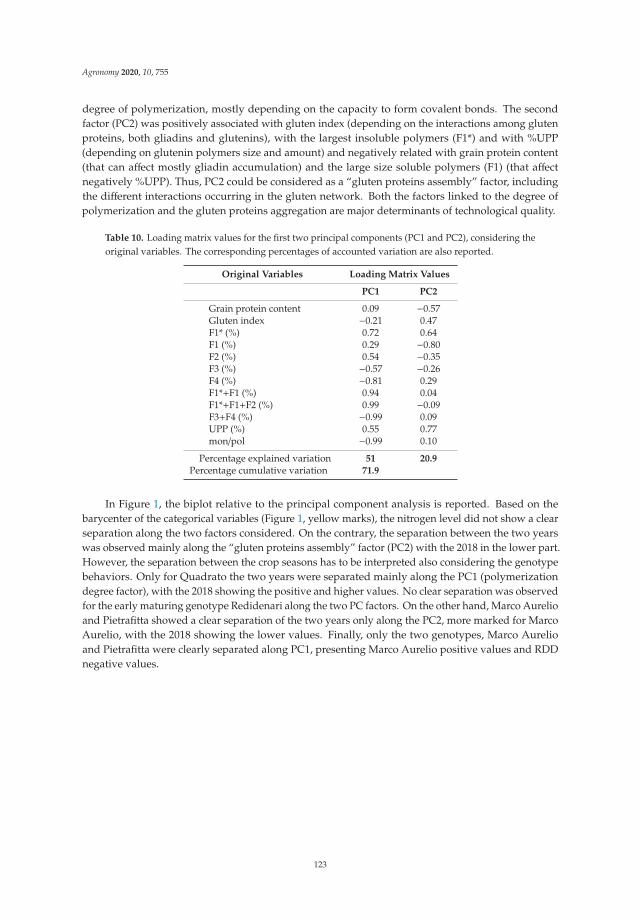
Agronomy 2020, 10, 755
degree of polymerization, mostly depending on the capacity to form covalent bonds. The secondfactor (PC2) was positively associated with gluten index (depending on the interactions among glutenproteins, both gliadins and glutenins), with the largest insoluble polymers (F1*) and with %UPP(depending on glutenin polymers size and amount) and negatively related with grain protein content(that can affect mostly gliadin accumulation) and the large size soluble polymers (F1) (that affectnegatively %UPP). Thus, PC2 could be considered as a “gluten proteins assembly” factor, includingthe different interactions occurring in the gluten network. Both the factors linked to the degree ofpolymerization and the gluten proteins aggregation are major determinants of technological quality.
Table 10. Loading matrix values for the first two principal components (PC1 and PC2), considering theoriginal variables. The corresponding percentages of accounted variation are also reported.
Original Variables Loading Matrix Values
PC1 PC2
Grain protein content 0.09 −0.57Gluten index −0.21 0.47F1* (%) 0.72 0.64F1 (%) 0.29 −0.80F2 (%) 0.54 −0.35F3 (%) −0.57 −0.26F4 (%) −0.81 0.29F1*+F1 (%) 0.94 0.04F1*+F1+F2 (%) 0.99 −0.09F3+F4 (%) −0.99 0.09UPP (%) 0.55 0.77mon/pol −0.99 0.10
Percentage explained variation 51 20.9
Percentage cumulative variation 71.9
In Figure 1, the biplot relative to the principal component analysis is reported. Based on thebarycenter of the categorical variables (Figure 1, yellow marks), the nitrogen level did not show a clearseparation along the two factors considered. On the contrary, the separation between the two yearswas observed mainly along the “gluten proteins assembly” factor (PC2) with the 2018 in the lower part.However, the separation between the crop seasons has to be interpreted also considering the genotypebehaviors. Only for Quadrato the two years were separated mainly along the PC1 (polymerizationdegree factor), with the 2018 showing the positive and higher values. No clear separation was observedfor the early maturing genotype Redidenari along the two PC factors. On the other hand, Marco Aurelioand Pietrafitta showed a clear separation of the two years only along the PC2, more marked for MarcoAurelio, with the 2018 showing the lower values. Finally, only the two genotypes, Marco Aurelioand Pietrafitta were clearly separated along PC1, presenting Marco Aurelio positive values and RDDnegative values.
123
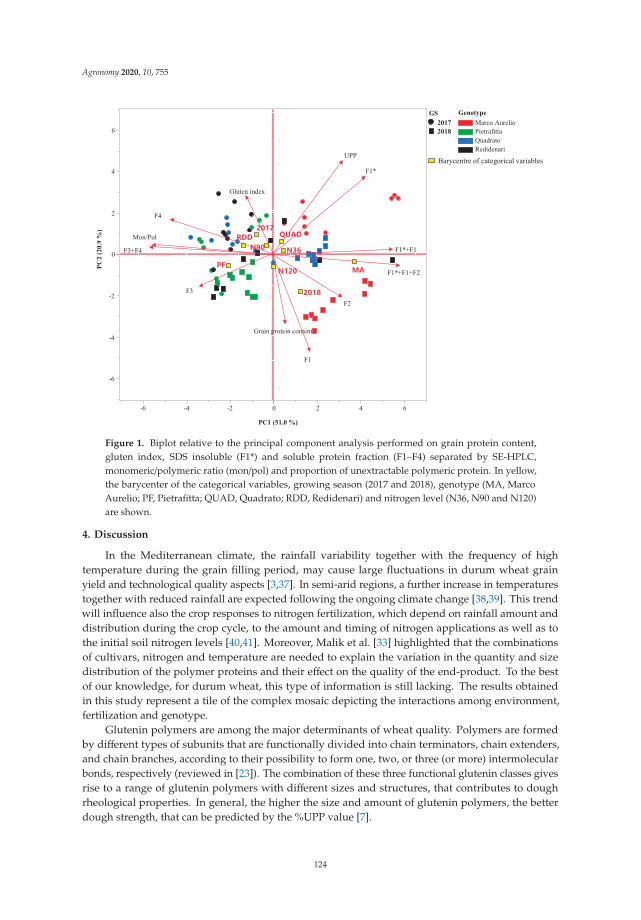
Agronomy 2020, 10, 755
Figure 1. Biplot relative to the principal component analysis performed on grain protein content,gluten index, SDS insoluble (F1*) and soluble protein fraction (F1–F4) separated by SE-HPLC,monomeric/polymeric ratio (mon/pol) and proportion of unextractable polymeric protein. In yellow,the barycenter of the categorical variables, growing season (2017 and 2018), genotype (MA, MarcoAurelio; PF, Pietrafitta; QUAD, Quadrato; RDD, Redidenari) and nitrogen level (N36, N90 and N120)are shown.
4. Discussion
In the Mediterranean climate, the rainfall variability together with the frequency of hightemperature during the grain filling period, may cause large fluctuations in durum wheat grainyield and technological quality aspects [3,37]. In semi-arid regions, a further increase in temperaturestogether with reduced rainfall are expected following the ongoing climate change [38,39]. This trendwill influence also the crop responses to nitrogen fertilization, which depend on rainfall amount anddistribution during the crop cycle, to the amount and timing of nitrogen applications as well as tothe initial soil nitrogen levels [40,41]. Moreover, Malik et al. [33] highlighted that the combinationsof cultivars, nitrogen and temperature are needed to explain the variation in the quantity and sizedistribution of the polymer proteins and their effect on the quality of the end-product. To the bestof our knowledge, for durum wheat, this type of information is still lacking. The results obtainedin this study represent a tile of the complex mosaic depicting the interactions among environment,fertilization and genotype.
Glutenin polymers are among the major determinants of wheat quality. Polymers are formedby different types of subunits that are functionally divided into chain terminators, chain extenders,and chain branches, according to their possibility to form one, two, or three (or more) intermolecularbonds, respectively (reviewed in [23]). The combination of these three functional glutenin classes givesrise to a range of glutenin polymers with different sizes and structures, that contributes to doughrheological properties. In general, the higher the size and amount of glutenin polymers, the betterdough strength, that can be predicted by the %UPP value [7].
124
Agronomy 2020, 10, 755
In our experimental condition, the two growing seasons showed a different climatic trend interms of rainfall distribution and temperatures. Significant lower yield and thousand kernel weight,together with higher protein concentration were observed for all the genotypes in 2018, characterizedby higher temperatures during the grain filling with respect to the first growing season. Moderatehigh temperature during grain filling, between 25 ◦C and 35 ◦C, and short periods of very hightemperature (>35 ◦C) at the end of grain filling phase, as those we observed in the second growingseason, are frequently associated with a decrease in grain yield and an increase in grain proteinconcentration [8,42]. However, the genotypes Marco Aurelio and Redidenari (released in 2010 and2015, respectively) were less influenced by the growing season with respect to Quadrato and Pietrafitta(both released in 1999). The positive effect of nitrogen fertilization was clearer for the protein contentthan for grain yield as also reported in literature under Mediterranean climate [43–46]. However,the high yield response observed for Redidenari under N90 level was particularly interesting, indicatingthe possibility of limiting nitrogen inputs by adopting genotypes capable to optimize the use of nitrogen.
The growing season differently affected the gluten index, an indicator of gluten strength for durumwheat, in relation to the genotypes, showing only Marco Aurelio and Redidenari lower values in thewarmer year. In bread and soft wheat, dough strength has been often positively correlated with theproportion of UPP [15,18,47–49]. As for durum wheat, the relation between %UPP and gluten indexhas been less investigated. In our experimental condition, this relation was genotype dependent, sinceonly Marco Aurelio and Redidenari showed simultaneous decrease of gluten index and %UPP in thesecond year.
The composition and functionality of storage proteins have been significantly affected by growingseason and genotype, while the effect of N fertilization level was rather small (Table S2) [50] as alsoresulted by PCA analysis. Several studies reported an increase in the proportions of the monomericgliadins with increasing N availability [26,27]. In our experimental conditions, this was true only forthe genotype Redidenari due to an increase of F4 component represented mainly by α/β type gliadin.An interesting result was the increase of %UPP for both Marco Aurelio and Redidenari under N90 leveldue to the increase of the F1*. The significant decrease of the larger insoluble polymers fraction (F1*)and %UPP observed in the second growing season for Marco Aurelio and Pietrafitta has to be discussedin relation to their earliness. Indeed, the very high temperature recorded at the end of the crop cycle(3 days with T > 35 ◦C) could have negatively influenced these two genotypes that are medium andmedium-late maturing genotypes. This result is probably due to the fact that the assembly of the storageproteins takes place at the end of the grain filling phase [10,51,52]. Shewry et al. [53] proposed that atthe end of the cycle, the loss of water favors the polymer chains contact inducing the assembly throughdisulphide crosslinking or through inter-chain hydrogen bonding. The effect of the temperatures ongluten protein assembly, have been studied mostly in bread wheat and only few studies are available fordurum wheat. In common wheat, several research studies suggested that moderate high temperatureor few days of very high temperature resulted in a significant reduction in the proportion of theSDS-insoluble protein fraction [15,17,47]. Other studies showed that the size of the glutenin polymersincreased in response to short periods of very high temperature [18]. Ferreira et al. [8], in durumwheat, reported also a positive effect of the high temperature during the whole grain filling periodon gluten protein assembly. Thus, the relationship between the gluten protein assembly and hightemperatures is still not clear and needs more investigation. In our experimental conditions, in thesecond growing season, the two late maturing genotypes (Marco Aurelio and Pietrafitta), togetherwith the decrease in F1* and %UPP showed an increase of both F2 and F1 fraction, the latter togetherwith the other genotypes, confirming that the synthesis of the SDS soluble polymers continued alsounder high temperature condition [14,47]. Due to the concurrent decrease in F1* and increase in F1and F2 fractions, Marco Aurelio and Pietrafitta did not significantly change their polymeric fractionbetween the two years. The increase of both %UPP and polymeric fraction observed in Quadratoand only of polymeric fraction observed in Redidenari in the second growing seasons is also linkedto their earliness. Indeed, it seems like that on these genotypes, which are medium-early and early
125
Agronomy 2020, 10, 755
maturing, respectively, only the moderately high temperatures occurring during the grain filling acted,but not the extreme ones recorded at the end of the crop cycle. Indeed, also the results of the PCAhighlighted the negative effect of the extreme temperatures on the gluten proteins assembly properties(PC2) only for Marco Aurelio and Pietrafitta, while for Quadrato a separation of the values only alongthe polymerization degree factor (PC1) was observed, with the warmer year showing the positive andhigher values.
Because %UPP depends on protein distributions among the four areas typically used for itscalculation, with the chain branchers and extenders mostly present in the fractions F1 (in particularF1*) and F2, it is important not only to select durum wheat varieties with proper glutenin compositionsable to give rise to polymers of adequate size and amounts, but also that are synthetized in periodsless susceptible to environmental changes, such it has occurred here for the medium early and earlymaturing varieties.
5. Conclusions
In the two growing seasons, the four durum wheat genotypes showed different capacities of thegluten proteins to assembly in a visco-elastic structure in relation to their earliness. In particular, in thesecond warmer year the late maturing genotype, Marco Aurelio and Pietrafitta showed a significantdecrease of larger insoluble polymers fraction (F1*) and %UPP with a negative effect on their proteinassembly level, despite Marco Aurelio always showed higher degree of polymerization. On thecontrary, the medium-early and early maturing genotypes Quadrato and Redidenari, probably due totheir earliness, did not change their “protein assembly level” in relation to the growing season.
The effect of N fertilization on the gluten protein polymerization and assembly was rather small,but among the N levels utilized the increase of F1*, %UPP and monomeric fraction under N90 wasobserved. Moreover, also the highest yield and gluten index values were obtained under N90. This wastrue especially for Redidenari.
In general, the effect of the growing season on the parameters evaluated was more evident thanthose of genotype and nitrogen level.
The results obtained in this study regarding four durum wheat genotypes clearly indicate differentpatterns of protein assembly in relation to the growing season, a factor that has a great influenceon quality characteristics, thus contributing to the rational selection of the durum wheat genotypes,in particular those to include in supply chains, suitable for facing the ongoing climate changes inMediterranean area.
Supplementary Materials: The following are available online at http://www.mdpi.com/2073-4395/10/5/755/s1:Table S1. Mean square of effects (year, Y; genotype, G; nitrogen level, N) resulting from analysis of variance(ANOVA) performed on yield and technological parameters. Table S2: Mean square of effects (year, Y; genotype,G; nitrogen level, N) resulting from analysis of variance (ANOVA) performed on sonicated protein fraction (F1*)and SDS-soluble protein fraction (F1–F4) separated by SE-HPLC, monomeric/polymeric ratio (mon/pol) andproportion of unextractable polymeric protein (UPP). Figure S1. Rainfall distribution and maximum and minimummean temperatures for the two growing seasons 2017 (a) and 2018 (b). Figure S2. SE-HPLC chromatograms ofSDS-extractable protein fraction (a) and of SDS-unextractable protein fraction (b).
Author Contributions: Conceptualization, M.M.G. Methodology, M.M.G. and G.G. Validation, M.M.G., G.G.,S.M., Z.F. Formal analysis, A.G., G.G. and M.M.G.. Investigation, A.G., F.C. Writing—original draft preparation,A.G., F.C. Writing—review and editing, M.M.G., G.G., S.M. and Z.F. Visualization, A.G. and F.C. Supervision,M.M.G., G.G. Project administration, M.M.G. and G.G. All authors have read and agreed to the published versionof the manuscript.
Funding: This research received no external funding.
Acknowledgments: We would like to show our gratitude to Luigi Toriaco (Syngenta Italia) and to Damiana Tozzifor their skilful technical assistance during the experimental trials and in the SE-HPLC analysis, respectively.
Conflicts of Interest: The authors declare no conflict of interest.
126
Agronomy 2020, 10, 755
References
1. Ayadi, S.; Karmous, C.; Hammami, Z.; Trifa, Y.; Rezgui, S. Variation of durum wheat yield and nitrogen useefficiency under Mediterranean rainfed environment. Int. J. Agric. Crop Sci. 2016, 7, 693–699. [CrossRef]
2. Fagnano, M.; Fiorentino, N.; D’Egidio, M.G.; Quaranta, F.; Ritieni, A.; Ferracane, R.; Raimondi, G. Durumwheat in conventional and organic farming: Yield amount and pasta quality in southern Italy. Sci. World J.2012. [CrossRef] [PubMed]
3. Ercoli, L.; Lulli, L.; Mariotti, M.; Masoni, A.; Arduini, I. Post-anthesis dry matter and nitrogen supply andsoil water availability. Eur. J. Agron. 2008, 28, 138–147. [CrossRef]
4. ICCP, Climatic Change 2011. IPCC Special Report on Renewable Energy Sources and Climate ChangeMitigation. Summary for Policymakers. In Proceedings of the 11th Session of Working Group III of the IPCC,Abu Dhabi, UAE, 5–8 May 2011.
5. Bita, C.; Gerats, T. Plant tolerance to high temperature in a changing environment: Scientific fundamentalsand production of heat stress-tolerant crops. Front. Plant Sci. 2013, 4, 273. [CrossRef] [PubMed]
6. Marchylo, B.A.; Dexter, J.E.; Clarke, F.R.; Clarke, J.M.; Preston, K.R. Relationships among bread-makingquality, gluten strength, physical dough properties, and pasta cooking quality for some Canadian durumwheat genotypes. Can. J. Plant Sci. 2011, 81, 611–620. [CrossRef]
7. Gupta, R.B.; Popineau, Y.; Lefebvre, J.; Cornec, M.; Lawrence, G.J.; MacRitchie, F. Biochemical basis offlour properties in bread wheats. II. Changes in polymeric protein formation and dough/gluten propertiesassociated with the loss of low Mr or high Mr glutenin subunits. J. Cereal Sci. 1995, 21, 103–116. [CrossRef]
8. Ferreira, M.S.L.; Martre, P.; Mangavel, C.; Girousse, C.; Rosa, N.N.; Samson, M.F.; Morel, M.H. Physicochemicalcontrol of durum wheat grain filling and glutenin polymer assembly under different temperature regimes.J. Cereal Sci. 2012, 56, 58–66. [CrossRef]
9. Gras, P.W.; Anderssen, R.S.; Keentok, M.; Békés, F.; Appels, R. Gluten protein functionality in wheat flourprocessing: A review. Aust. J. Agric. Res. 2001, 52, 1311–1323. [CrossRef]
10. Shewry, P.; Halford, N.G. Cereal seed storage proteins: Structure, properties and role in grain utilization.J. Exp. Bot. 2002, 53, 947–958. [CrossRef]
11. Triboï, E.; Martre, P.; Triboi-Blondel, A. Environmentally-induced changes in protein composition indeveloping grains of wheat are related to changes in total protein content. J. Exp. Bot. 2003, 54, 1731–1742.[CrossRef]
12. Anjum, F.M.; Khan, M.R.; Din, A.; Saeed, M.; Pasha, I.; Arshad, M.U. Wheat gluten: High molecular weightglutenin subunits-structure, genetics, and relation to dough elasticity. J. Food Sci. 2007, 72, 56–63. [CrossRef][PubMed]
13. Stone, P.J.; Gras, P.W.; Nicolas, M.E. The influence of recovery temperature on the effects of a brief heat shockon wheat. III. Grain protein composition and dough properties. J. Cereal Sci. 1997, 25, 129–141. [CrossRef]
14. Stone, P.J.; Nicolas, M.E. Effect of timing of heat stress during grain filling on two wheat varieties differing inheat tolerance. II. Fractional protein accumulation. Aust. J. Plant Physiol. 1996, 23, 739–749. [CrossRef]
15. Ciaffi, M.; Tozzi, L.; Borghi, B.; Corbellini, M.; Lafiandra, D. Effect of heat shock during grain filling on thegluten protein composition of bread wheat. J. Cereal Sci. 1996, 24, 91–100. [CrossRef]
16. O’Leary, G.; Walker, C.; Panozzo, J.; Thayalakumaran, T.; McCaskill, M.; Nuttall, J.; Barlow, K.;Christy, B.; Asseng, S. Linking wheat grain quality to environmental processes. In Proceedings of the2019 Agronomy Australia Conference, Wagga Wagga, Australia, 25–29 August 2019. Available online:www.agronomyaustralia.org/conference-proceedings (accessed on 24 February 2020).
17. Corbellini, M.; Canevar, M.G.; Mazza, L.; Ciaffi, M.; Lafiandra, D.; Borghi, B. Effect of the duration andintensity of heat shock during grain filling on dry matter and protein accumulation, technological qualityand protein composition in bread and durum wheat. Aust. J. Plant Physiol. 1997, 24, 245–260. [CrossRef]
18. Don, C.; Lookhart, G.; Naeem, H.; MacRitchie, F.; Hamer, R.J. Heat stress and genotype affect the gluteninparticles of the glutenin macropolymer-gel fraction. J. Cereal Sci. 2005, 42, 69–80. [CrossRef]
19. Flagella, Z.; Giuliani, M.M.; Giuzio, L.; Volpi, C.; Masci, S. Influence of water deficit on durum wheat storageprotein composition and technological quality. Eur. J. Agron. 2010, 33, 197–207. [CrossRef]
20. Edwards, N.M.; Gianibelli, M.C.; McCaig, T.N.; Clarke, J.M.; Ames, N.P.; Larroque, O.R.; Dexter, J.E.Relationships between dough strength, polymeric protein quantity and composition for diverse durumwheat genotypes. J. Cereal Sci. 2007, 45, 140–149. [CrossRef]
127
Agronomy 2020, 10, 755
21. Ohm, J.B.; Hareland, G.; Simsek, S.; Seabourn, B. Size-exclusion HPLC of protein using a narrow-bore columnfor evaluation of breadmaking quality of hard spring wheat flours. Cereal Chem. 2009, 86, 463–469. [CrossRef]
22. Malalgoda, M.; Ohm, J.B.; Meinhardt, S.; Simsek, S. Association between gluten protein composition andbreadmaking quality characteristics in historical and modern spring wheat. Cereal Chem. 2018, 95, 226–238.[CrossRef]
23. D’Ovidio, R.; Masci, S. The low-molecular-weight glutenin subunits of wheat gluten. J. Cereal Sci. 2004, 39,321–339. [CrossRef]
24. Shewry, P.R.; Gilbert, S.M.; Savage, A.W.J.; Tatham, S.; Wan, Y.F.; Belton, P.S.; Wellner, N.; D’Ovidio, R.;Bekes, F.; Halford, N.G. Sequence and properties of HMW subunit 1Bx20 from pasta wheat (Triticum durum)which is associated with poor end use properties. Theor. Appl. Genet. 2003, 106, 744–750. [CrossRef][PubMed]
25. Ryan, J.; Masri, S.; Pala, M.; Singh, M. Nutrient Dynamics in a Long-Term Cereal-Based Rotation Trial in aMediterranean Environment: Nitrogen Forms. Commun. Soil Sci. Plant 2009, 40, 931–946. [CrossRef]
26. Zhu, J.; Khan, K. Effects of genotype and environment on glutenin polymers and breadmaking quality. CerealChem. 2001, 78, 125–130. [CrossRef]
27. Kindred, D.R.; Verhoeven, T.M.O.; Weightman, R.M.; Swanston, J.S.; Agu, R.C.; Brosnan, J.M.;Sylvester-Bradley, R. Effects of variety and fertiliser nitrogen on alcohol yield, grain yield, starch andprotein content, and protein composition of winter wheat. J. Cereal Sci. 2008, 48, 46–57. [CrossRef]
28. Johansson, E.; Prieto-Linde, M.L.; Svensson, G. Influence of nitrogen applicationrate and timing on grainprotein composition and gluten strength in Swedishwheat cultivars. J. Plant Nutr. Soil Sci. 2004, 167, 345–350.[CrossRef]
29. Johansson, E.; Kuktaite, R.; Andersson, A.; Prieto-Linde, M.L. Protein polymer build-up during wheat graindevelopment: Influences of temperature andnitrogen timing. J. Sci. Food Agric. 2005, 85, 473–479. [CrossRef]
30. Godfrey, D.; Hawkesford, M.; Powers, S.; Millar, S.; Shewry, P.R. Effects of Crop Nutrition on Wheat GrainComposition and End Use Quality. J. Agric. Food Chem. 2010, 58, 3012–3021. [CrossRef]
31. Ferrise, R.; Bindi, M.; Martre, P. Grain filling duration and glutenin polymerization under variable nitrogensupply and environmental conditions for durum wheat. Field Crops Res. 2015, 171, 23–31. [CrossRef]
32. Peckanek, U.; Karger, A.; Groger, S.; Charvat, B.; Schoggl, G.; Lelley, T. Effect of nitrogen fertilization onquantity of flour protein components, dough properties and breadmaking quality of wheat. Cereal Chem.1997, 74, 800–805. [CrossRef]
33. Malik, A.H.; Prieto-Linde, M.L.; Kuktaite, R.; Andersson, A.; Johansson, E. Individual and interactive effectsof cultivar maturation time, nitrogen regime and temperature level on accumulation of wheat grain proteins.J. Sci. Food Agric. 2011, 91, 2192–2200. [CrossRef] [PubMed]
34. International Association of Cereal Chemistry (ICC). Standard Methods of the ICC; ICC: Vienna, Austria, 1986.35. Tosi, P.; Masci, S.; Giovangrossi, A.; D’Ovidio, R.; Bekes, F.; Larroque, O.; Napier, J.; Shewry, P. Modification
of the low molecular weight (LMW) glutenin composition of transgenic durum wheat: Effects on gluteninpolymer size and gluten functionality. Mol Breed. 2005, 16, 113–126. [CrossRef]
36. Box, G.; Cox, D. An analysis of transformations. J. R. Stati. Soc. Ser. B Methodol. 1964, 26, 211–252. [CrossRef]37. Ierna, A.; Lombardo, G.M.; Mauromicale, G. Yield, nitrogen use efficiency and grain quality in durum wheat
as affected by nitrogen fertilization under a Mediterranean environment. Expl. Agric. 2016, 52, 314–329.[CrossRef]
38. ICCP, Climatic Change 2012. Managing the Risks of Extreme Events and Disasters to Advance Climate ChangeAdaptation; A Special Report of Working Groups I and II of the Intergovernmental Panel on Climate Change;Field, C.B., V. Barros, T.F., Stocker, D., Qin, D.J., Dokken, K.L., Ebi, M.D., Mastrandrea, K.J., Mach, G.K.,Plattner, S.K., Allen, M., Eds.; Cambridge University Press: Cambridge, UK, 2012.
39. Nuttall, J.G.; O’Leary, G.J.; Panozzo, J.F.; Walker, C.K.; Barlow, K.M.; Fitzgerald, G.J. Models of grain qualityin wheat—A review. Field Crop Res. 2015, 202, 136–145. [CrossRef]
40. Cossani, C.M.; Slafer, G.A.; Savina, R. Nitrogen and water use efficiencies of wheat and barley under aMediterranean environment in Catalonia. Field Crops Res. 2012, 128, 109–118. [CrossRef]
41. López-Bellido, L.; Muˇnoz-Romero, V.; Benítez-Vega, J.; Fernández-García, P.; Redondo, R.; López-Bellido, R.J.Wheat response to nitrogen splitting applied to a vertisols in different tillage systems and cropping rotationsunder typical Mediterranean climatic conditions. Eur. J. Agron. 2012, 43, 24–32. [CrossRef]
128
Agronomy 2020, 10, 755
42. Triboï, E.; Martre, P.; Girousse, C.; Ravel, C.; Triboï-Blondel, A.M. Unravelling environmental and geneticrelationships between grain yield and nitrogen concentration for wheat. Eur. J. Agron. 2006, 25, 108–118.[CrossRef]
43. Giuliani, M.M.; Giuzio, L.; De Caro, A.; Flagella, Z. Relationships between Nitrogen Utilization and GrainTechnological Quality in Durum Wheat: II. grain yield and quality. Agron J. 2011, 103, 1668–1675. [CrossRef]
44. Li, Y.; Yin, Y.P.; Zhao, Q.; Wang, Z.L. Changes of glutenin subunits due to water-nitrogen interaction influencesize and distribution of glutenin macropolymer particles and flour quality. Crop Sci. 2011, 51, 2809–2819.[CrossRef]
45. Malik, A.H.; Kuktaite, R.; Johansson, E. Combined effect of genetic and environmental factors on theaccumulation of proteins in the wheat grain and their relationship to bread-making quality. J. Cereal Sci.2013, 57, 170–174. [CrossRef]
46. Bouacha, O.D.; Rhazi, L.; Aussenac, T.; Rezgui, S.; Nouaigui, S. Molecular characterization of storage proteinsfor selected durum wheat varieties grown in different environments. J. Cereal Sci. 2015, 61, 97–104. [CrossRef]
47. Labuschagne, M.T.; Elago, O.; Koen, E. Influence of extreme temperatures during grain filling on proteinfractions, and its relationship to some quality characteristics in bread, biscuit, and durum wheat. Cereal Chem.2009, 86, 61–66. [CrossRef]
48. Corbellini, M.; Mazza, L.; Ciaffi, M.; Lafiandra, D.; Borghi, B. Effect of heat shock during grain filling on proteincomposition and technological quality of wheats. In Wheat, Prospects for Global Improvement, Proceedingsof the 5th International Wheat Conference, Ankara, Turkey, 10–14 June 1996; Springer: Berlin/Heidelberg,Germany, 1998.
49. Wardlaw, I.F.; Blumenthal, C.S.; Larroqu, O.; Wrigley, C.W. Contrasting effects of chronic heat stress and heatshock on kernel weight and flour quality in wheat. Funct. Plant Biol. 2002, 29, 25–34. [CrossRef]
50. Rossmann, A.; Buchner, P.; Savill, G.P.; Hawkesford, M.J.; Scherf, K.A.; Mühling, K.H. Foliar N application atanthesis alters grain protein composition and enhances baking quality in winter wheat only under a low Nfertiliser regimen. Eur. J. Agron. 2019, 109. [CrossRef]
51. Loussert, C.; Popineau, Y.; Mangavel, C. Protein bodies ontogeny and localization of prolamin componentsin the developing endosperm of wheat caryopses. J. Cereal Sci. 2008, 47, 445–456. [CrossRef]
52. Koga, S.; Aamot, H.U.; Uhlen, A.K.; Seehusen, T.; Veiseth-Kent, E.; Hofgaard, I.S.; Moldestad, A.; Böcker, U.Environmental factors associated with glutenin polymer assembly during grain maturation. J. Cereal Sci.2020, 91. [CrossRef]
53. Shewry, P.R.; Toscano Underwood, C.; Wan, Y.; Lovegrove, A.; Bhandari, D.; Toole, G.; Mills, E.N.; Denyer, K.;Mitchell, R. Storage product synthesis and accumulation in developing grains of wheat. J. Cereal Sci. 2009,50, 106–112. [CrossRef]
© 2020 by the authors. Licensee MDPI, Basel, Switzerland. This article is an open accessarticle distributed under the terms and conditions of the Creative Commons Attribution(CC BY) license (http://creativecommons.org/licenses/by/4.0/).
129

MDPISt. Alban-Anlage 66
4052 BaselSwitzerland
Tel. +41 61 683 77 34Fax +41 61 302 89 18
www.mdpi.com
Agronomy Editorial OfficeE-mail: [email protected]
www.mdpi.com/journal/agronomy


MDPI St. Alban-Anlage 66 4052 Basel Switzerland
Tel: +41 61 683 77 34 Fax: +41 61 302 89 18
www.mdpi.com ISBN 978-3-03943-103-8
Related Documents


![Single Marker and Haplotype-Based Association Analysis … · Association Analysis of Semolina and Pasta Colour in Elite Durum Wheat Breeding Lines ... Pozniak et al. [86], Zhang](https://static.cupdf.com/doc/110x72/5b8528b97f8b9a784a8dc5ff/single-marker-and-haplotype-based-association-analysis-association-analysis.jpg)


