LONDON SPRING 2019

Welcome message from author
This document is posted to help you gain knowledge. Please leave a comment to let me know what you think about it! Share it to your friends and learn new things together.
Transcript

LONDONSPRING 2019

DRIVERS OF GROWTHLondon continues to be a story of growth. The population of Greater London has risen by more than a million people over the last decade alone, and this has been matched by its increase in employment. It has been a major driver of the UK’s economic growth, with output rising at a rate of around 2.8% pa over the last five years, well above the UK average (2.2% pa).
Population growth continues to be strong, with more than 100,000 net additional residents projected during 2019. Its recent high rate of employment growth is likely reduce, reflecting the national trend, although more than 40,000 net additional workforce jobs are still forecast to be created across the capital (Experian).
Brexit remains a key concern, although the initial concerning predictions of a flood of jobs leaving the UK currently appear unlikely to materialise. Where specific employment does move away, areas such as the vibrant technology sector (and specific sub-subsectors such as fintech) will be important in maintaining growth. However the technology sector relies heavily on attracting the right global talent, which Brexit has the potential to disrupt if immigration controls become more restrictive.
London’s growth is also one of its greatest challenges, with the need to accelerate the rate of housebuilding and new infrastructure to accommodate its growing population. House prices are clearly out of step with average incomes with the average house price in the Greater London currently at £473,800 (Land Registry, December 2018), more than twice the national average. London’s strategic housing market assessment (2017) identified a need for 66,000 new homes per annum across London. This compares with a less than 24,000 completed in 2017/18.
London’s transport infrastructure has seen several significant enhancements completed in recent years, including the north-south Thameslink rail upgrade, the London Overground network, various tube upgrades and the new night tube service. Cycling has also been encouraged through TfL’s expanded bike hire scheme and the ongoing development of the “Central London Grid” cycle network.
The Elizabeth Line is the most high profile project, and will be a real ‘game changer’ for the capital, providing much-needed additional east-west capacity, and linking together central London’s established and emerging business
OUTLOOK SUMMARY• Greater London’s population
growth is continuing at pace, but this is also one of the city’s greatest challenges, given the need to accelerate the rate of housebuilding and infrastructure provision.
• Although delayed, the opening of the Elizabeth Line will accelerate the trend of office occupiers becoming more footloose across the capital’s submarkets. The take-up of co-working space will continue at a robust rate, and demand is likely to move up the size curve.
• There is a mixed picture for office rental growth in central London this year. Those locations underpinned by low vacancy should see prime rents plateau, but where vacancy is higher we are likely to see a modest decline in rents until confidence improves next year.
• The central London retail market remains resilient, with strong demand from high-end international retailers in the West End’s prime streets. Outside of central London, the market is more subdued and influenced to a greater extent by the broader challenges facing the UK high street.
• We see no let-up in demand for large industrial units in 2019, but there is a severe shortage of distribution and last mile delivery sites. It will remain hugely challenging to satisfy occupier demand, and rental growth will continue to be above inflation.
• London’s commercial property investment market has remained resilient. Investment volumes in 2018 continued at the same strong rate as 2017, and are being held back by a lack of quality supply rather than demand, with overseas buyers dominating.
districts of Stratford, Docklands, City of London, Midtown and West End.
Work on the Northern Line extension is well under way, linking the regeneration area of Vauxhall, Nine Elms and Battersea to the existing underground network at Kennington. This will support the significant commercial and residential development opportunities in this part of London.
Looking ahead, the proposed Crossrail 2 line would link the national rail networks in Surrey and Hertfordshire via a new route through Tottenham Court Road, Euston, St. Pancras, Victoria and Clapham Junction, although the timescale is uncertain.
The Elizabeth Line will provide a new direct link to Heathrow Airport, which is the Government’s chosen option for a much-needed increase in London’s airport capacity with an additional runway. Further public consultation is currently under way, and consent is not likely to be granted until at least 2020.
Clearly, Brexit is creating a heightened amount of uncertainty for businesses and consumers across the capital. However, London has proved resilient since the EU referendum in June 2016, with strong levels of activity in the commercial property leasing and investment markets. London has a wealth of intrinsic advantages on the global stage, including its diverse and highly educated workforce, the UK’s legal system, high market transparency, cultural vibrancy and a favourable time zone for financial markets. As the UK continues the process of leaving the European Union, London will evolve and thrive.
GREATER LONDON KEY ECONOMIC AND BUSINESS STATISTICS
ECONOMIC GROWTH LAST 5 YEARS 2.8% pa 2.2% pa
OUTPUT PER HEAD £29,800 £26,600
UNEMPLOYMENT RATE (ILO) 5.1% 4.2%
GCSE AND EQUIVALENTAVERAGE ATTAINMENT8 SCORE
49.2 44.3*
BUSINESS BIRTHS PER 1,000 PEOPLE 2017
10.2 5.7
ULTRAFAST BROADBAND COVERAGE (OVER 100 MBPS) % OF PREMISES
74.3% 56.2%
AVERAGE HOUSE PRICE £473,800 £230,776
AVERAGE HOUSE PRICE GROWTH, 2018 -0.6% 2.5%
Source: Experian, ONS, Thinkbroadband, Land Registry *England
GREATER LONDON UK
Figure 1 Greater London’s population Source: Experian
10.0
9.0
8.0
7.0
6.0
5.0
4.0
3.0
2.0
Population (millions)
1999
2001
2003
2005
2007
2009
2011
2013
2015
2017
2019
2021
2023
carterjonas.co.uk 32
OFFICE MARKET
PRIME RENT, MAYFAIR £105 PSF
PRIME RENT, CITY £65.00 PSF
Although we are unlikely to see the benefits until 2020, the opening of the Elizabeth Line will revolutionise east-west transport across London and relieve pressure on the existing underground network. Occupiers are becoming increasingly footloose and the Elizabeth Line will serve to accelerate this trend, and generate further rental growth in the areas is connects.
The new International Financial Reporting Standard 16 became effective at the beginning of this year and requires businesses to declare the extent of real estate liabilities on their balance sheets. This will reinforce a continued shift towards a smaller property ‘footprint’, the adoption of more efficient operating practices, and a preference for shorter leases. The co-working/serviced office accommodation model is therefore well placed to benefit.
The take-up of co-working space is therefore likely to continue at a robust rate this year, and demand is likely to move up the size curve. Indeed, large corporates including Centrica and Network Rail have recently opted to house some significant parts of their operations in co-working space. Conventional landlords are responding to this change in the pattern of demand, and a number of major London property owners have recently announced plans to develop their own flexible ‘plug in and go’ office brands to compete, although they are not yet offering the full suite of services that operators such as WeWork provide.
Occupiers are shifting their focus from cost to quality, and real estate is increasingly being used as a tool to attract and retain a high quality workforce, and to promote wellness in the work environment. Transport connectivity, attractive design, good build quality, and the quality and vibrancy of the surrounding public realm are therefore key factors.
The increasing influence of ‘millennials’ and ‘Generation Zs’ is driving this ‘flight to quality’ in order to attract the best and the brightest in an increasingly competitive labour market. As a consequence, a two-tier leasing market is emerging. The market for prime located new and refitted grade A space has proved to be remarkably resilient since the 2016 EU referendum. Landlords are securing pre-practical completion of construction lettings at record rents as tenants compete to secure the best space in a market where vacancy is at historic lows and declining.
By contrast, the second-hand market has fared less well since the EU referendum, as tenants trade up into new/refitted space and in so doing, increase the stock of available second-hand space.
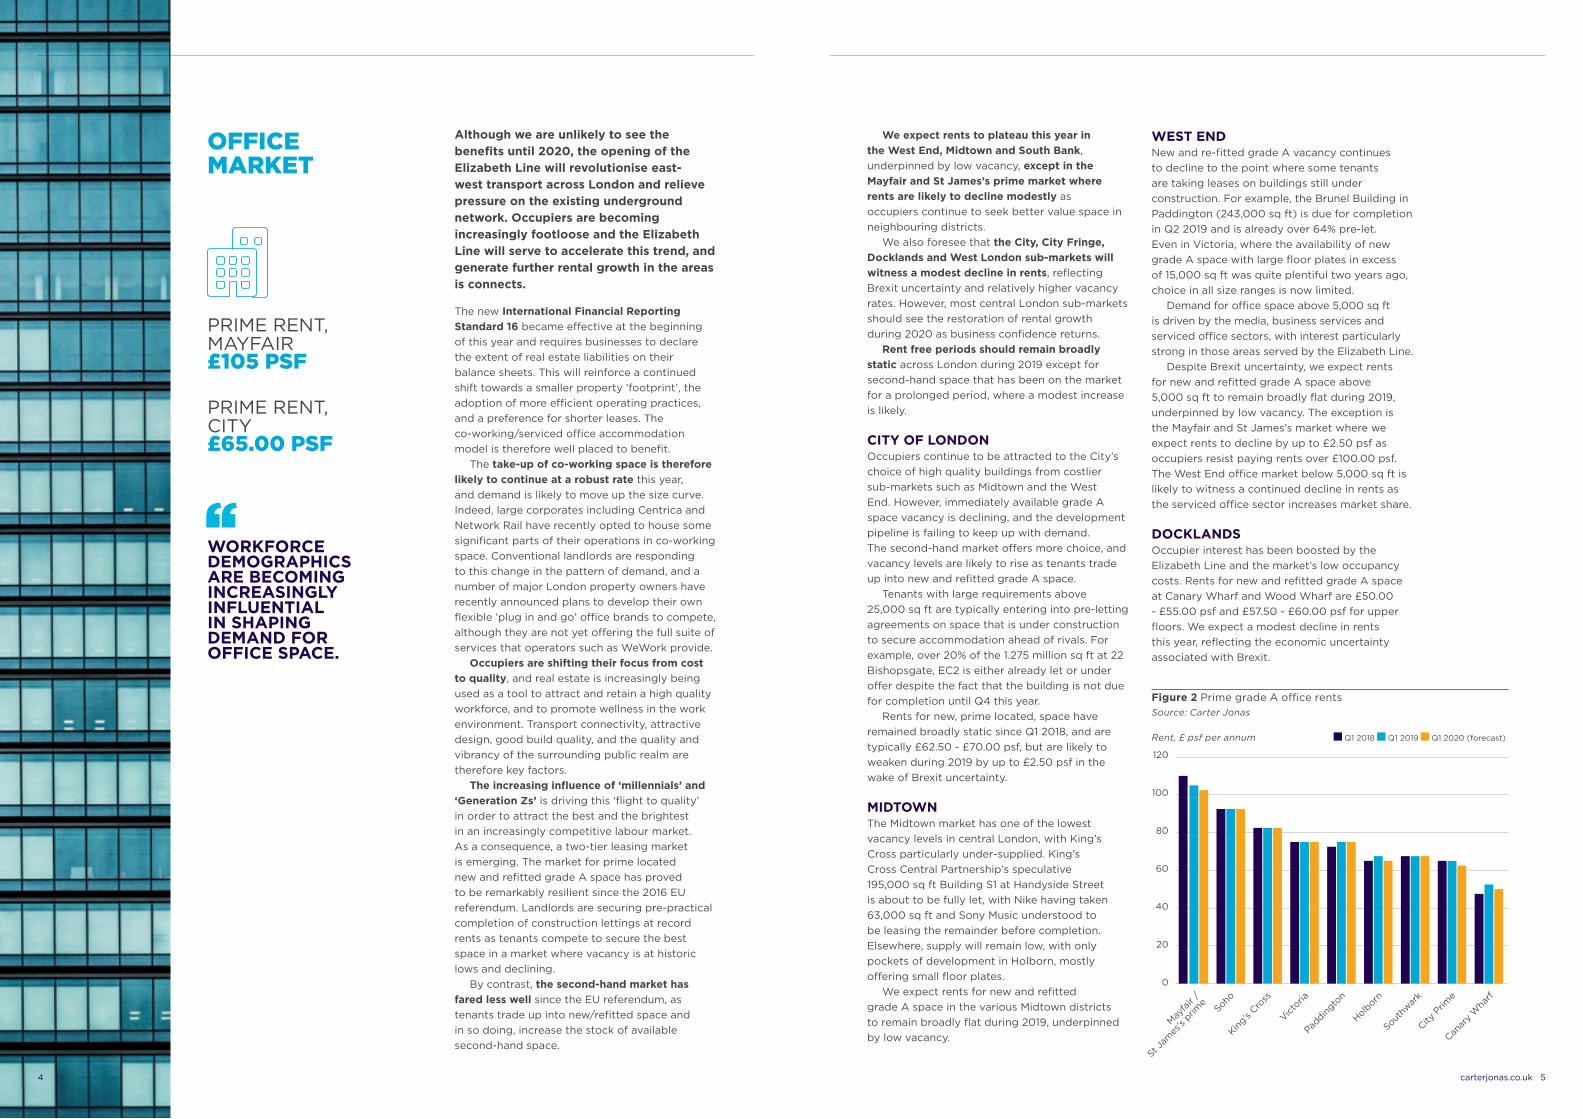
We expect rents to plateau this year in the West End, Midtown and South Bank, underpinned by low vacancy, except in the Mayfair and St James’s prime market where rents are likely to decline modestly as occupiers continue to seek better value space in neighbouring districts.
We also foresee that the City, City Fringe, Docklands and West London sub-markets will witness a modest decline in rents, reflecting Brexit uncertainty and relatively higher vacancy rates. However, most central London sub-markets should see the restoration of rental growth during 2020 as business confidence returns.
Rent free periods should remain broadly static across London during 2019 except for second-hand space that has been on the market for a prolonged period, where a modest increase is likely.
CITY OF LONDONOccupiers continue to be attracted to the City’s choice of high quality buildings from costlier sub-markets such as Midtown and the West End. However, immediately available grade A space vacancy is declining, and the development pipeline is failing to keep up with demand. The second-hand market offers more choice, and vacancy levels are likely to rise as tenants trade up into new and refitted grade A space.
Tenants with large requirements above 25,000 sq ft are typically entering into pre-letting agreements on space that is under construction to secure accommodation ahead of rivals. For example, over 20% of the 1.275 million sq ft at 22 Bishopsgate, EC2 is either already let or under offer despite the fact that the building is not due for completion until Q4 this year.
Rents for new, prime located, space have remained broadly static since Q1 2018, and are typically £62.50 - £70.00 psf, but are likely to weaken during 2019 by up to £2.50 psf in the wake of Brexit uncertainty.
MIDTOWNThe Midtown market has one of the lowest vacancy levels in central London, with King’s Cross particularly under-supplied. King’s Cross Central Partnership’s speculative 195,000 sq ft Building S1 at Handyside Street is about to be fully let, with Nike having taken 63,000 sq ft and Sony Music understood to be leasing the remainder before completion. Elsewhere, supply will remain low, with only pockets of development in Holborn, mostly offering small floor plates.
We expect rents for new and refitted grade A space in the various Midtown districts to remain broadly flat during 2019, underpinned by low vacancy.
WEST ENDNew and re-fitted grade A vacancy continues to decline to the point where some tenants are taking leases on buildings still under construction. For example, the Brunel Building in Paddington (243,000 sq ft) is due for completion in Q2 2019 and is already over 64% pre-let. Even in Victoria, where the availability of new grade A space with large floor plates in excess of 15,000 sq ft was quite plentiful two years ago, choice in all size ranges is now limited.
Demand for office space above 5,000 sq ft is driven by the media, business services and serviced office sectors, with interest particularly strong in those areas served by the Elizabeth Line.
Despite Brexit uncertainty, we expect rents for new and refitted grade A space above 5,000 sq ft to remain broadly flat during 2019, underpinned by low vacancy. The exception is the Mayfair and St James’s market where we expect rents to decline by up to £2.50 psf as occupiers resist paying rents over £100.00 psf. The West End office market below 5,000 sq ft is likely to witness a continued decline in rents as the serviced office sector increases market share.
DOCKLANDSOccupier interest has been boosted by the Elizabeth Line and the market’s low occupancy costs. Rents for new and refitted grade A space at Canary Wharf and Wood Wharf are £50.00 - £55.00 psf and £57.50 - £60.00 psf for upper floors. We expect a modest decline in rents this year, reflecting the economic uncertainty associated with Brexit.
Figure 2 Prime grade A office rents Source: Carter Jonas
WORKFORCE DEMOGRAPHICS ARE BECOMING INCREASINGLY INFLUENTIAL IN SHAPING DEMAND FOR OFFICE SPACE.
120
100
80
60
40
20
0
Rent, £ psf per annum
Mayfa
ir /
St Ja
mes
’s prim
eSoho
King’s
Cross
Victoria
Paddin
gton
Holborn
Southw
ark
City P
rime
Canar
y W
harf
Q1 2018 Q1 2019 Q1 2020 (forecast)
carterjonas.co.uk 54

INDUSTRIAL MARKET
Industrial take-up remains buoyant as retailers and their third party logistics partners adapt to growing online demand. Indeed, online sales reached 21.5% of total sales for the first time in the run-up to Christmas, up from 15.5% three years ago. We see no let-up in demand for large industrial units in 2019.
The scarcity and cost of land for industrial uses is especially acute in London and there is a shortage of well-located sites for distribution use around the capital. There is also a severe shortage of urban sites suitable for last mile delivery, waste recycling, open storage and parking uses, particularly as sites are taken out for higher value residential uses.
With this strong pressure, land values within the M25 increased sharply by 23% in 2018, well above the (still very strong) national increase of 8.2%, and further rises are likely this year.
PRIME RENT (PARK ROYAL) £18.75 PSF
GREATER LONDON PRIME RENTAL INCREASE IN 2018 4.3%
With sites in such short supply, developers are becoming increasingly creative. We think the multi-storey concept, and in particular the convergence of urban logistics with residential, could gain more traction in 2019. The open storage sector is often overlooked but is evolving into an asset class in its own right, and can attract strong rents in the London market.
Overall, it will remain hugely challenging to satisfy occupier demand, and this is creating strong upward pressure on values. Our prime industrial rental index reflects this, revealing strong rental growth inside the M25 of 4.3%, well ahead of the national figure of 2.8% and CPI inflation of 2.1%.
The prime rent at Park Royal is £18.75 psf up from £17.50 psf a year ago. Figure 3 shows a comparison of prime rents.
Figure 3 Prime industrial rents Source: Carter Jonas
20
18
16
14
12
10
8
6
4
2
0
Prime rent, £ psf
Park R
oyal
Heath
row
Croyd
on
Enfield
Barkin
g and
Dagen
ham
Q1 2018 Q1 2019
carterjonas.co.uk 76

RETAIL MARKET
The central London retail market remains resilient, helped by the tourism sector and the devaluation of Sterling. Vacancy rates are low in the West End’s prime streets, with continued strong demand from high-end international retailers, and a number of leisure operators are also taking space.
The reversal of the decision to close the House of Fraser store following the retailer’s purchase by Sports Direct has given a boost to Oxford Street, whilst Bond Street, Regent Street and Covent Garden have all seen new retailers take space. This includes Microsoft announcing a flagship store on Regent Street, part of a growing trend for global technology firms to open prime city centre retail stores.
2018 also saw the opening of Argent’s Coal Drops Yard at King’s Cross, with its emphasis on providing a unique tenant mix and distinctive shopping environment.
Outside of central London, the market is more subdued and influenced to a greater extent by the broader challenges facing the UK high street. Vacancy rates have risen a little, not helped by the failure of retailers such as Maplin, Poundworld and Toys R Us, and a number of other national chains entering into CVAs or downsizing their portfolios. However, some retailers are still expanding, with the discounters Aldi and Lidl still acquisitive. The consolidation of some national restaurant chains is creating space for more unique independent food and beverage offerings, which are increasingly popular with consumers.
Consumer expenditure has held up well in London, with growth of around 1.8% in 2018 compared with 1.1% nationally. London is forecast to comfortably outperform again this year at 2% compared with 1.4% for the UK (Experian).
The prime zone A rent on New Bond Street is unchanged over the year at approximately £2,200 psf (we understand that a recent lease re-gear has exceeded this figure, but is not representative of current market conditions). The prime rent on Oxford Street is approximately £925 psf (zone A).
carterjonas.co.uk 98

COMMERCIAL PROPERTY TRENDS AND VALUES
INVESTMENT IN GREATER LONDON, 2018 £27 BILLION
INVESTMENT IN CENTRAL LONDON OFFICES, 2018 £14 BILLION
OVERSEAS % OF TOTAL INVESTMENT 63%
PRIME OFFICE YIELD (MAYFAIR) 3.5%
OVERSEAS INVESTORS CONTINUE TO SEE THE BENEFITS OF LONDON’S SAFE HAVEN STATUS AND FAVOURABLE EXCHANGE RATE
The London investment market has remained resilient and investment volumes in 2018 were almost identical to 2017 at £27 billion across Greater London. The central London office market accounted for just over £14 billion, 52% of the total commercial property investment for London as a whole, and again a similar total to 2017.
Overseas investors continue to see the benefits of London’s ‘safe haven’ status and favourable exchange rate, despite the uncertainty caused by Brexit. Overseas investment accounted for 63% of the value of purchases in Greater London in 2018. UK institutional investors have also been increasingly active over the last year.
The central London office market is even more dominated by overseas buyers, who accounted for 74% of the value of purchases in 2018 (although down a little from a record 82% in 2017), supported by continued healthy take-up in the occupation market. Far Eastern buyers (notably South Korean) are particularly active, accounting for nearly 60% of the total overseas money.
Prime central London retail yields have remained keen for the best locations, with the prime yield on Bond Street at around 2.5%, and there is also good investor interest in locations outside of central London that will benefit from the opening of the Elizabeth Line.
Occupational demand in the industrial and distribution sector is driven by structural change and is relatively ‘Brexit-proof’. This, together with a limited supply pipeline, means a continuing strong rental growth story, and has continued to push industrial yields lower. The volume of deals across London decreased in 2018 compared with the previous year, but this reflects a lack of stock.
LONDON RENTS AND YIELDS SUMMARY
PRIME RENT
(£ PSF)
CHANGE OVER 2018
FORECAST NEXT 12 MONTHS
PRIME YIELD
OFFICE CITY £65.00 4.25%
OFFICE WEST END £105 3.5%
INDUSTRIAL PARK ROYAL
£18.75 3.75%
RETAIL (ZONE A) £2,200 2.5%
Figure 4 Greater London commercial property investment Source: Property Data, Carter Jonas
35,000
30,000
25,000
20,000
15,000
10,000
5,000
0
Value of investment, £ million
2010
2011
2012
2013
2014
2015
2016
2017
2018
UK Overseas
carterjonas.co.uk 1110
© Carter Jonas 2019. The information given in this publication is believed to be correct at the time of going to press. We do not however accept any liability for any decisions taken following this publication. We recommend that professional advice is taken.
Find out more at carterjonas.co.uk/commercial
CARTER JONAS
020 7518 3200One Chapel Place, London W1G [email protected]
Carter Jonas LLP is a leading UK property consultancy working across commercial property, residential sales and lettings, rural, planning, development and national infrastructure. Supported by a national network of 33 offices and 700 property professionals, our commercial team is renowned for their quality of service, expertise and the simply better advice they offer their clients.
Follow us on Twitter, LinkedIn & Instagram
To download a copy of the full reports, please visit: carterjonas.co.uk/commercialedge
THIS PUBLICATION IS PART OF THE 2019 COMMERCIAL EDGE RESEARCH SERIES.
Contacts:
Scott Harkness Head of Commercial 020 7518 3236 | [email protected]
Daniel Francis Head of Research 020 7518 3301 | [email protected]
CAMBRIDGESPRING 2019
Related Documents
![arXiv:2003.08907v1 [cs.LG] 19 Mar 2020 · 2020-03-20 · Overinterpretation reveals image classification model pathologies Brandon Carter MIT CSAIL Siddhartha Jain MIT CSAIL Jonas](https://static.cupdf.com/doc/110x72/5fa595bcf412c61d016b10ab/arxiv200308907v1-cslg-19-mar-2020-2020-03-20-overinterpretation-reveals-image.jpg)