Speleothem record of the last 180 ka in Villars cave (SW France): Investigation of a large d 18 O shift between MIS6 and MIS5 K. Wainer a, b, * , D. Genty a , D. Blamart c , M. Daëron c , M. Bar-Matthews d , H. Vonhof e , Y. Dublyansky f , E. Pons-Branchu a , L. Thomas g , P. van Calsteren g , Yves Quinif h , N. Caillon c a Laboratoire des Sciences du Climat et de l’Environnement, UMR CEA/CNRS/UVSQ1572 Bat 701, L’Orme des Merisiers CEA Saclay, 91191 Gif sur Yvette cedex, France b Geoazur, Université de Nice-Sophia-Antipolis, UMR6526, La Darse, B.P. 48, 06235 Villefranche/Mer, France c Laboratoire des Sciences du Climat et de l’Environnement, UMR CEA/CNRS/UVSQ1572 Bat 12, avenue de la Terrasse, 91198 Gif sur Yvette cedex, France d Geological Survey of Israël, 30 Malchei Israel St, Jerusalem 95501, Israel e Departement of Sedimentology and Marine Geology Faculty of Earth and life sciences, Vrije Universiteit Amsterdam, De Boelelaan 1085, 1081HV Amsterdam, The Netherlands f Institut für Geologie und Paläontologie, Leopold-Franzens-Universität Innsbruck, Innrain 52, 6020 Innsbruck, Austria g Department of Earth and Environmental Sciences, The Open University, Milton Keynes MK7 6AA, UK h Institut Jules Cornet (Géologie), Faculté Polytechnique de Mons, Rue de Houdain, 9, 7000 Mons, Belgium article info Article history: Received 8 January 2010 Received in revised form 30 June 2010 Accepted 1 July 2010 abstract The Vil-car-1 flowstone core from Villars cave (SW France) provides one of the first European speleothem records extending back to 180 ka, based on UeTh TIMS and MC-ICP-MS measurements. The core offers a continuous record of Termination II and the Last Interglacial. The penultimate deglaciation is charac- terized by a prominent 5& depletion in calcite d 18 O. Determining which specific environmental factors controlled such a large oxygen isotopic shift offers the opportunity to assess the impact of various factors influencing d 18 O variations in speleothem calcite. Oxygen isotope analyses of fluid inclusions indicate that drip water d 18 O remained within a very narrow range of 1& from Late MIS6 to the MIS5 d 18 O optimum. The possibility of such a stable behaviour is supported by simple calculations of various effects influencing seepage water d 18 O. Although this could suggest that the isotopic shift in calcite is mainly driven by temperature increase, attempts to quantify the temperature shift from Late MIS6 to the MIS5 d 18 O optimum by assuming an equilibrium relationship between calcite and fluid inclusion d 18 O yield unreasonably high estimates of w20 C warming and Late MIS6 cave temperatures below 0 C; this suggests that the flowstone calcite precipitated out of thermodynamic equilibrium at this site. Using a method proposed by Guo et al. (submitted for publication) combining clumped isotope measurements, fluid inclusion and modern calcite d 18 O analyses, it is possible to quantitatively correct for isotopic disequilibrium and estimate absolute paleotemperatures. Although the precision of these absolute temperature reconstructions is limited by analytical uncertainties, the temperature rise between Late MIS6 and the MIS5 optimum can be robustly constrained between 13.2 2.6 and 14.6 2.6 C (1s), consistent with existing estimates from Western Europe pollen and sea-surface temperature records. Ó 2010 Elsevier Ltd. All rights reserved. 1. Introduction Climate variations are driven by a complex combination of factors such as orbital parameters, interactions between atmo- spheric and ocean circulation, greenhouse gas effects, and system feedbacks. Physically deciphering these various influences is one of the main goals for climatologists. The penultimate deglaciation (Termination II, or TII; a period between 135 and 125 ka before present) one of the closest termi- nation to the present day interglacial, occurred under orbital parameters different from the more recent Termination I (TI). Thus, * Corresponding author at: Laboratoire des Sciences du Climat et de l’Envir- onnement, UMR CEA/CNRS/UVSQ1572 Bat 701, L’Orme des Merisiers CEA Saclay, 91 191 Gif sur Yvette cedex, France. Tel.: þ33 1 69082866; fax: þ33 1 69087716. E-mail addresses: [email protected] (K. Wainer), Dominique.genty@ lsce.ipsl.fr (D. Genty), [email protected] (D. Blamart), mathieu@ daeron.fr (M. Daëron), [email protected] (M. Bar-Matthews), [email protected] (H. Vonhof), [email protected] (Y. Dublyansky), Edwige.pons-branchu@ lsce.ispl.fr (E. Pons-Branchu), [email protected] (L. Thomas), P.V.calsteren@ open.ac.uk (P. van Calsteren), [email protected] (Y. Quinif), nicolas.caillon@ lsce.ispl.fr (N. Caillon). Contents lists available at ScienceDirect Quaternary Science Reviews journal homepage: www.elsevier.com/locate/quascirev 0277-3791/$ e see front matter Ó 2010 Elsevier Ltd. All rights reserved. doi:10.1016/j.quascirev.2010.07.004 Quaternary Science Reviews 30 (2011) 130e146

Welcome message from author
This document is posted to help you gain knowledge. Please leave a comment to let me know what you think about it! Share it to your friends and learn new things together.
Transcript

lable at ScienceDirect
Quaternary Science Reviews 30 (2011) 130e146
Contents lists avai
Quaternary Science Reviews
journal homepage: www.elsevier .com/locate/quascirev
Speleothem record of the last 180 ka in Villars cave (SW France): Investigationof a large d18O shift between MIS6 and MIS5
K. Wainer a,b,*, D. Genty a, D. Blamart c, M. Daëron c, M. Bar-Matthews d, H. Vonhof e, Y. Dublyansky f,E. Pons-Branchu a, L. Thomas g, P. van Calsteren g, Yves Quinif h, N. Caillon c
a Laboratoire des Sciences du Climat et de l’Environnement, UMR CEA/CNRS/UVSQ1572 Bat 701, L’Orme des Merisiers CEA Saclay, 91 191 Gif sur Yvette cedex, FrancebGeoazur, Université de Nice-Sophia-Antipolis, UMR6526, La Darse, B.P. 48, 06235 Villefranche/Mer, Francec Laboratoire des Sciences du Climat et de l’Environnement, UMR CEA/CNRS/UVSQ1572 Bat 12, avenue de la Terrasse, 91 198 Gif sur Yvette cedex, FrancedGeological Survey of Israël, 30 Malchei Israel St, Jerusalem 95501, IsraeleDepartement of Sedimentology and Marine Geology Faculty of Earth and life sciences, Vrije Universiteit Amsterdam, De Boelelaan 1085, 1081HV Amsterdam, The Netherlandsf Institut für Geologie und Paläontologie, Leopold-Franzens-Universität Innsbruck, Innrain 52, 6020 Innsbruck, AustriagDepartment of Earth and Environmental Sciences, The Open University, Milton Keynes MK7 6AA, UKh Institut Jules Cornet (Géologie), Faculté Polytechnique de Mons, Rue de Houdain, 9, 7000 Mons, Belgium
a r t i c l e i n f o
Article history:Received 8 January 2010Received in revised form30 June 2010Accepted 1 July 2010
* Corresponding author at: Laboratoire des Scienonnement, UMR CEA/CNRS/UVSQ1572 Bat 701, L’Orme191 Gif sur Yvette cedex, France. Tel.: þ33 1 6908286
E-mail addresses: [email protected] (K.lsce.ipsl.fr (D. Genty), [email protected] (M. Daëron), [email protected] (M. Bar-(H. Vonhof), [email protected] (Y. Dublyanlsce.ispl.fr (E. Pons-Branchu), [email protected] (P. van Calsteren), [email protected] (N. Caillon).
0277-3791/$ e see front matter � 2010 Elsevier Ltd.doi:10.1016/j.quascirev.2010.07.004
a b s t r a c t
The Vil-car-1 flowstone core from Villars cave (SW France) provides one of the first European speleothemrecords extending back to 180 ka, based on UeTh TIMS and MC-ICP-MS measurements. The core offersa continuous record of Termination II and the Last Interglacial. The penultimate deglaciation is charac-terized by a prominent 5& depletion in calcite d18O. Determining which specific environmental factorscontrolled such a large oxygen isotopic shift offers the opportunity to assess the impact of various factorsinfluencing d18O variations in speleothem calcite.
Oxygen isotope analyses of fluid inclusions indicate that drip water d18O remained within a verynarrow range of �1& from Late MIS6 to the MIS5 d18O optimum. The possibility of such a stablebehaviour is supported by simple calculations of various effects influencing seepage water d18O.
Although this could suggest that the isotopic shift in calcite is mainly driven by temperature increase,attempts to quantify the temperature shift from Late MIS6 to the MIS5 d18O optimum by assuming anequilibrium relationship between calcite and fluid inclusion d18O yield unreasonably high estimates ofw20 �C warming and Late MIS6 cave temperatures below 0 �C; this suggests that the flowstone calciteprecipitated out of thermodynamic equilibrium at this site.
Using a method proposed by Guo et al. (submitted for publication) combining clumped isotopemeasurements, fluid inclusion and modern calcite d18O analyses, it is possible to quantitatively correct forisotopic disequilibrium and estimate absolute paleotemperatures. Although the precision of theseabsolute temperature reconstructions is limited by analytical uncertainties, the temperature risebetween Late MIS6 and the MIS5 optimum can be robustly constrained between 13.2 � 2.6 and14.6 � 2.6 �C (1s), consistent with existing estimates from Western Europe pollen and sea-surfacetemperature records.
� 2010 Elsevier Ltd. All rights reserved.
ces du Climat et de l’Envir-des Merisiers CEA Saclay, 916; fax: þ33 1 69087716.Wainer), [email protected] (D. Blamart), mathieu@Matthews), [email protected]), Edwige.pons-branchu@(L. Thomas), P.V.calsteren@(Y. Quinif), nicolas.caillon@
All rights reserved.
1. Introduction
Climate variations are driven by a complex combination offactors such as orbital parameters, interactions between atmo-spheric and ocean circulation, greenhouse gas effects, and systemfeedbacks. Physically deciphering these various influences is one ofthe main goals for climatologists.
The penultimate deglaciation (Termination II, or TII; a periodbetween 135 and 125 ka before present) one of the closest termi-nation to the present day interglacial, occurred under orbitalparameters different from the more recent Termination I (TI). Thus,

K. Wainer et al. / Quaternary Science Reviews 30 (2011) 130e146 131
characterizing this deglaciation is of first importance in order tobetter constrain the influence of orbital parameters on majorclimatic variations. Several studies based on different archivescover the TII period but few provide quantitative climatic data.Antarctic records such as the Vostok ice core cover several climaticcycles but their temporal resolution is low and the associated agemodels suffer from significant uncertainties. Nevertheless, deute-rium excess records from such core can be used to quantify localtemperature variations, including during Termination II (Vimeuxet al., 2002). At lower latitudes, studies of Chinese speleothemsprovide a record of East-Asian monsoon strength with a well con-strained chronology but these studies do not provide temperatureestimates (e.g. Yuan et al., 2004; Cheng et al., 2006). In WesternEurope, several sea-surface temperature (SST) records covering thiskey period were recovered from the Alboran sea and the IberianMargin (mean annual SST derived from the U37
k’ alkenone index:(Shackleton et al., 2002; Martrat et al., 2004, 2007)), the Bay ofBiscay and offshore West Ireland (seasonal SST deduced fromforaminifera assemblages (Kandiano et al., 2004; Sánchez Goñiet al., 2008)). Quantified paleo-climate reconstructions of conti-nental settings for TII exist but they remain scarce and often entaillarge uncertainties. The longest high resolution and continuouscontinental record in the area of interest (Western Europe andMediterranean basin) was obtained from speleothems in Soreqcave (Israel), and covers the last 177 ka. According to several studiesinvolving fluid inclusion dD, clumped isotope analyses and nearbymarine cores (SST estimates from d18OG.ruber and alkenones),carbonate d18O variations through time in Soreq Cave reflecta combination of source isotopic composition, temperature andamount effect variations (Matthews et al., 2000; Bar-Matthewset al., 2003; McGarry et al., 2004; Affek et al., 2008; Almogi-Labinet al., 2009). Among other important results, these studies esti-mates the glacial/interglacial temperature rise in the region atw7 �C (Affek et al., 2008). The Corchia cave in Italy provides spe-leothem records of the penultimate deglaciation with a well con-strained UeTh chronology, allowing precise tuning with IberianMargin marine records (Drysdale et al., 2005, 2009); these studiesdate the inception of TII at 141.0� 2.5 ka and abrupt warming of thedeglaciation at 133 � 2.5 ka (mid-point). Over continental WesternEurope, only a few quantified climate reconstructions have beenestablished for the last climate cycle. Among them, the MonticchioMaar multiproxy record from South Italy (Brauer et al., 2007; Allenand Huntley, 2009) has a well constrained chronology based onradiometric dating and varve counting, covering the last 132 ka.Alternatively, the Velay lake record from southern France providesquantified estimates of temperature and rainfall over the last four
Fig. 1. Sites locations.
glacial cycles, although its chronology is not as well constrained asthat of the Monticchio record, and is the closest to our study site(w300 km east from Villars, (Beaulieu et al., 1991; Cheddadi et al.,2005)). Pollen assemblages recovered from marine cores aroundWestern Europe also allow reconstructions of terrestrial climate(e.g. Combourieu-Nebout et al., 2002; Sánchez Goñi et al., 2005). Insummary, there is currently very limited quantitative data coveringthe penultimate deglaciation in Western Europe.
We present here a speleothem stable isotope profile (d13Cc andd18Oc) recovered from a flowstone drill core in Villars cave (SWFrance), which provides a discontinuous record of the last 180 ka.The oxygen profile exhibits a striking �5& drop in calcite d18Ocoeval with the penultimate deglaciation, similar to the Soreq caverecord. The present study focuses on this major climatic transition,aiming to characterize it quantitatively through the use of variousanalytical techniques: measurements of calcite stable isotopiccompositions (CeO), trace elements relative concentrations (e.g.,Mg, Sr), stable isotopic compositions of fluid inclusions (HeO), andcalcite clumped isotopes (D47). Combination of these methodsenables us to estimate the amplitude of the temperature risebetween the end of the penultimate glacial and the last interglacialoptimum and to understand the sharp drop of the calcite d18Ocvalues during Termination II. The consequences in terms of paleo-dripwater oxygen isotopic composition (d18Ow) and the differentcontrols on the oxygen isotopic composition of the calcite (d18Oc) inVillars Cave will be discussed.
2. Site and sample description
2.1. Villars cave site
Villars cave is located in south-west France, about 200 km inlandfrom the Atlantic coast (45�300N, 0�500E, 175 masl; Fig. 1 ). The localclimate is oceanic temperate with mild and humid winters. Thesurface atmosphericmean annual temperature is 12.1�0.7 �C (Sept.1984eAug. 2007, data from Nontron meteorological station (Gentyet al., 2006; Wainer et al., 2009)) with average temperatures of6.4 � 1.3 �C in the winter (JanuaryeMarch) and 18.8 � 1.1 �C in thesummer (JulyeSeptember). Total annual rainfall (1020 � 206 mm)varies from year to year but is distributed rather uniformlythroughout each year. Because the soil cover is thin (0e20 cm) andthe karstic network is densely fissured, stalactite drip rates slowdown during the summer, but infiltration persists even whenmonthly theoretical evapotranspiration estimates exceed monthlyamounts of rainfall (Genty et al., 2006; Genty, 2008). However, inspite of the seasonal variability of stalactite drip rates, the d18Ovalues of the dripwater remain fairly stable and closely approximatethe (amount-weighted) average d18O composition of meteoricwaters (e�6.33 � 0.18&); (Genty et al., 2006; Genty, 2008). Localvegetation cover consists of a deciduous forest comprising juniper,oak and hornbeam trees (C3 type vegetation).
The Villars cave system lies within a BathonianeBajocianoolithic limestone, at depths of 10e40mdepth. The cave network is10 km long and organized into two levels (upper and lower), con-sisting of small galleries with a few larger chambers. The meantemperature in the upper galleries is 12.4 � 0.4 �C, oscillatingseasonally with a time lag of a more than a month relative to thesurface temperature. The lower galleries, by contrast, do notexperience any significant seasonal variation in temperature,remaining at 11.6 � 0.1 �C (Genty, 2008).
2.2. Flowstone core Vil-car-1
The flowstone core Vil-car-1 (7.5 cm diameter, 114.2 cm long)was drilled by Y. Quinif and D. Genty in 1998 in a decametric large
K. Wainer et al. / Quaternary Science Reviews 30 (2011) 130e146132
chamber (“chambre du Blacon”) about 150 m from the nearestentrance, at a depth of w25 m below ground. This chamber lies atthe junction of the lower and upper galleries. Temperaturemeasurements between July and October 2007 at the sampling siteindicate a temperature of 12.8 � 0.4 �C (n ¼ 3). The (w5 m2)flowstone surrounds and gently slopes away from a large pillar.Local slope at the drill location is w20�. The flowstone surface wasvisibly wet at the time of sampling, which suggests that the spe-leothem was still active at that time.
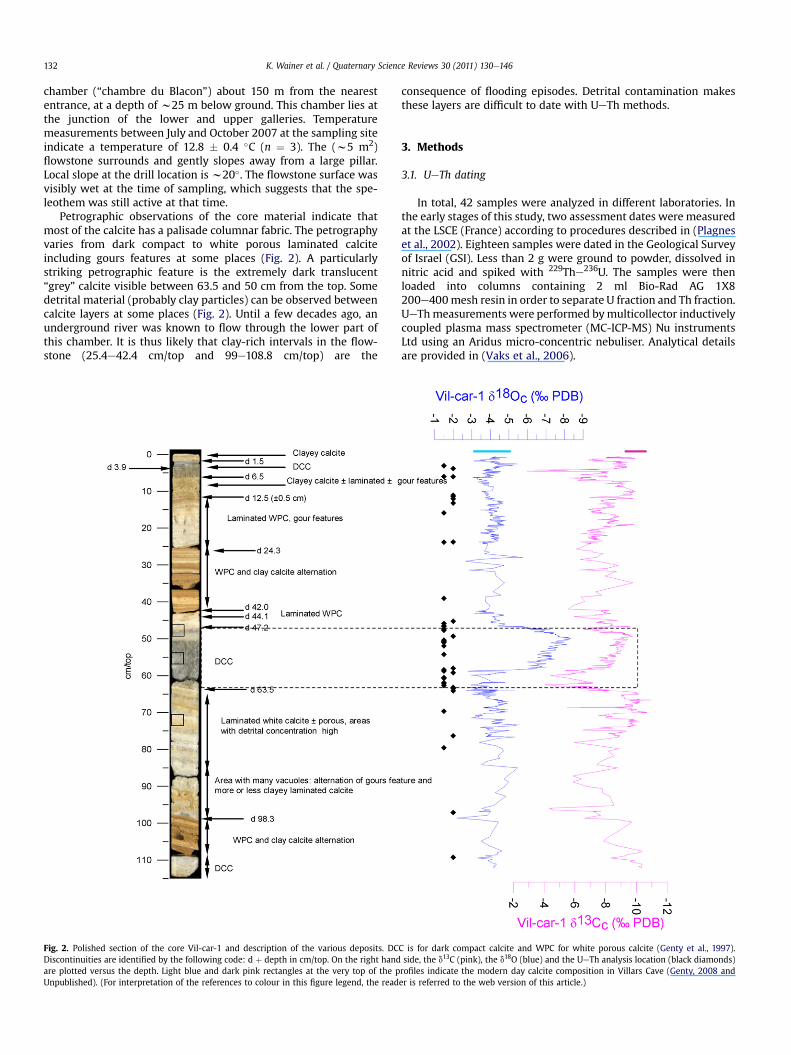
Petrographic observations of the core material indicate thatmost of the calcite has a palisade columnar fabric. The petrographyvaries from dark compact to white porous laminated calciteincluding gours features at some places (Fig. 2). A particularlystriking petrographic feature is the extremely dark translucent“grey” calcite visible between 63.5 and 50 cm from the top. Somedetrital material (probably clay particles) can be observed betweencalcite layers at some places (Fig. 2). Until a few decades ago, anunderground river was known to flow through the lower part ofthis chamber. It is thus likely that clay-rich intervals in the flow-stone (25.4e42.4 cm/top and 99e108.8 cm/top) are the
Fig. 2. Polished section of the core Vil-car-1 and description of the various deposits. DCDiscontinuities are identified by the following code: d þ depth in cm/top. On the right handare plotted versus the depth. Light blue and dark pink rectangles at the very top of the pUnpublished). (For interpretation of the references to colour in this figure legend, the read
consequence of flooding episodes. Detrital contamination makesthese layers are difficult to date with UeTh methods.
3. Methods
3.1. UeTh dating
In total, 42 samples were analyzed in different laboratories. Inthe early stages of this study, two assessment dates were measuredat the LSCE (France) according to procedures described in (Plagneset al., 2002). Eighteen samples were dated in the Geological Surveyof Israel (GSI). Less than 2 g were ground to powder, dissolved innitric acid and spiked with 229The236U. The samples were thenloaded into columns containing 2 ml Bio-Rad AG 1X8200e400mesh resin in order to separate U fraction and Th fraction.UeThmeasurements were performed bymulticollector inductivelycoupled plasma mass spectrometer (MC-ICP-MS) Nu instrumentsLtd using an Aridus micro-concentric nebuliser. Analytical detailsare provided in (Vaks et al., 2006).
C is for dark compact calcite and WPC for white porous calcite (Genty et al., 1997).side, the d13C (pink), the d18O (blue) and the UeTh analysis location (black diamonds)rofiles indicate the modern day calcite composition in Villars Cave (Genty, 2008 ander is referred to the web version of this article.)
K. Wainer et al. / Quaternary Science Reviews 30 (2011) 130e146 133
Fourteen samples were dated at the GEOTOP-UQAM, Canada.Samples of 2e5 g of calcite were dissolved in nitric acid and spikedwith 229The236Ue233U. Uranium and thorium were separated inthe anion exchange columns, as described in (Marshall et al., 2009).Both uranium and thorium fractions were loaded on pre-out-gassed single rhenium filaments with graphite coating. Themeasurements were made on a VG sector thermo-ionisation massspectrometer fitted with an electrostatic filter and a Daly ioncounter. U and Th isotopes were measured on the Daly detector.
Five samples were dated at the Open University (OU), UK.Fragments of 0.8e3 g were dissolved and spiked with 229The236Uas described in (Edwards et al., 1987). Uraniumwas analyzed usingsingle Re filament on thermo-ionization Finnigan MAT 262-RPQ-IImass spectrometer (McDermott et al., 1993; van Calsteren andSchwieters, 1995). Thorium was measured using bracketing tech-nique on Nu plasma MC-ICP-MS (Turner et al., 2001).
3.2. Calcite stable isotopes measurements
Approximately 650 sub-samples were extracted along thegrowth direction of the flowstone using a 0.7 mm-diameter hand-held dental drill. In addition, samples were taken along 5 indi-vidual laminae at 11.55, 31.4, 47.45, 63.65, 97.45 cm/top to test forisotopic equilibrium, (“Hendy tests”; (Hendy, 1971; Schwarcz,1986)). Resolution of sampling ranges from 0.5 to 5 mm. Most ofthe calcite isotope measurements d18Oc and d13Cc were made ona VG OPTIMA mass spectrometer at LSCE. Calcite was converted toCO2 through reaction with orthophosphoric acid at 90 �C. Fewerthan 10% of measurements were made on a Finnigan Dþ massspectrometer (LSCE). Details of this technique are provided in(Govin et al., 2009).
Oxygen and carbon isotopic composition are normalized toVPDB standard. Analytical errors are 0.08& for d18Oc and 0.05& ford13Cc (2s).
3.3. Fluid inclusions stable isotope (HeO) analyses
The isotopic composition of percolating water from which theflowstone calcite precipitated can be determined by analyzingwater released from fluid inclusions (FI) trapped within thecarbonate matrix. Analyses were performed in two laboratories atFaculty of Earth and Life Sciences, Vrije Universiteit (VU) inAmsterdam and at the Institute for Geology and Palaeontology,Innsbruck University (IU). Both lines are based on the concept ofSharp et al. (2001) but employ slightly different techniques.Aliquots of calcite are crushed in a heated crusher (120e130 �C)under helium flow. Water released from inclusions and entrainedby the helium flow is collected in a cryogenic trap. Uponcompletion of collection, water is released by flash-heating thetrap and admitted into the high-temperature reactor of the stan-dard thermal combustion/elemental analyzer (TC/EA) unit(Thermo Fisher Scientific). Molecular hydrogen and carbonmonoxide evolved fromwater through reaction with glassy carbonat 1400 �C in the TC/EA reactor are separated in a chromatographiccolumn and admitted, via a ConFlow II interface (Thermo FisherScientific), to an isotope-ratio mass spectrometer (Delta XP orDelta V Advantage; Thermo Fisher Scientific). Hydrogen isanalyzed first, and, following a peak jump, the oxygen isotopiccomposition of carbon monoxide is determined subsequently inthe same acquisition. Analytical uncertainties are w1.5& for dDand w0.5& for d18O (1s). More detailed descriptions of bothmethods are given in (Vonhof et al., 2006, 2007) and (Dublyanskyand Spötl, 2009).
Twelve samples were collected between 65 and 50 cm/top fromtwelve calcite layers. The masses of crushed sub-sample ranged
between 0.3 and 1.3 g; each layer was characterized by severalreplicate analyses. Analyses at VU were performed during threeanalytical periods (2006, 2007 and 2008), and measurements at IUwere performed in one period (2009).
3.4. Trace element measurements
Between 72.20 and 43.20 cm/top from the top of the core, 103analyses of trace elements were performed. Powder from samplesdrilled for stable isotope analyses was used for trace elementstudies. Some 30e60 mg were dissolved in nitric acid (0.1 mol .l�1)at 20 or 40 ppm of calcium and measured on a Varian Vista Pro AXsimultaneous inductively coupled plasma atomic emission spec-trometer (ICP-AES) at the LSCE. Relative (normalized to Ca)concentrations of Mg, Sr, Ba, K, Na, Zn, Fe, Mn and Al were deter-mined because they are most frequently found in the carbonates(e.g. Fairchild et al., 2000; Verheyden, 2001; Borsato et al., 2007)and have the potential to record paleo-hydrological conditions,speleothems growth rate, and processes such as prior calciteprecipitation (Fairchild et al., 2006). For details of the method see(Cleroux et al., 2008; Greaves et al., 2008).
Concentrations of 238U and 232Th isotopes were measured in thecourse of the UeTh analyses. Because these isotopes are dominantin natural samples, their concentrations give a good approximationof the respective elemental contents.
4. Results
4.1. Stable isotopic composition of calcite
4.1.1. Hendy testThe Hendy test is one of the most widely used tool to test
whether calcite from a given stalagmite was deposited out ofisotopic equilibrium (Hendy, 1971; Schwarcz, 1986). In this testboth d18Oc and d13Cc are measured along an individual lamina, andusually plotted against the distance from the apex of the stalagmite.
Samples precipitated under thermodynamic equilibriumconditions are expected to display the following criteria: (a) nocorrelation between d18Oc and d13Cc along a single growth layer and(b) d18Oc remains constant along a single growth layer while d13Ccmay vary irregularly.
The Hendy test is usually applied to stalagmites, eventually tostalactites (Vaks et al., 2006) but not on flowstone where theflowing path from a drop impact to the edge of the speleothem isdifficult to define and, consequently, the possible isotopic enrich-ment difficult to constrain. However, we have applied it to fivedifferent flowstone laminae to check the isotopic compositionbehaviour laterally (Fig. 3a and b). The only lamina where weobserved an arguably significant positive correlation between d18Ocand d13Cc (first Hendy criterion) is that located at 47.45 cm/top(Fig. 3a, R2 ¼ 0.8). The d18Oc and d13Cc variations along laminae(second Hendy criterion) are shown in Fig. 3b: both d18Oc and d13Ccexhibit small variation along each lamina, varying within 0.7&(oxygen) and 0.6& (carbon).
4.1.2. Oxygen isotope variationsCalcite oxygen isotopic composition fluctuates between �5.5
and �2.2& VPDB along the length of the core, except between 47and 59 cm/top where d18Oc values drop sharply by about �5&between the extrema (Figs. 2 and 4). This large shift can be dividedin two stages:
(1) an abrupt depletion (from�2.9 to�6.5&) with a short reversal(þ2& amplitude) centered on 59.1 cm/top (Figs. 2 and 4).

Fig. 3. Hendy test results a) d13Cc vs d18Oc for single laminae. b) d18Oc and d13Cc variability along single laminae versus distance from sampling axis.
K. Wainer et al. / Quaternary Science Reviews 30 (2011) 130e146134

40 50 60 70cm/top
-2
-4
-6
-8
δ18O(‰PDB)
-4
-6
-8
-10
δ13C(‰PDB)
21.61.20.80.4
Mg/Ca
0.030.020.010
Sr/Ca
00.40.81.2
Al/Ca
0
20
40
60
K/Ca
020406080
Na/Ca
00.40.81.2
Zn/Ca
00.020.040.060.08
U (p
pm)
0.981
1.021.041.061.081.1
AR
(234
U/2
38U
)i
0100200300
AR
(230
Th/2
32Th
)
d63.5
Fig. 4. Comparison between Vil-car-1 carbon and oxygen isotopic composition withtrace elements concentration (mmol/mol Ca), U concentration (ppm), (234U/238U)i and(230Th/232Th) activity ratios between 75 and 40 cm/top. Dotted lines indicate d63.5discontinuity located at 63.5 cm/top and the trace elements concentration peak.
K. Wainer et al. / Quaternary Science Reviews 30 (2011) 130e146 135
(2) a more progressive depletion between 58.5 and 50.2 cm/top,culminating with the lightest overall d18Oc value (�8.34& at50.15 cm/top). This progressive depletion is punctuated bysecond-order wiggles (w0.8& amplitude).
The subsequent enrichment is regular until �7.4& at 48.8 cm/top and then both noisier andmore abrupt to�4.4& at 46.7 cm/top(Fig. 4).
4.1.3. Carbon isotope variationsThe overall d13Cc record is much more variable along the core
ranging between �11 and �4& (Figs. 2 and 4). In contrast to d18Oc,the d13Cc curve does not show a single peak but several ones.A negative peak between 59 and 47 cm/top corresponds to themain d18Oc peak, but it does not stand out uniquely because otherd13Cc negative peaks exist, which do not correlate well with d18Ocand display similar or even more depleted values (e.g. at w70 and10 cm/top).
Calcite carbon isotopic variations appear positively correlatedwith d18Oc variations during the oxygen excursion interval(59e47 cm/top): the abrupt depletion is between ‑4.4& at60.25 cm/top and ‑8.4& at 58.45 cm/top for d13Cc values and theprogressive depletion leads to �9.76& at 49.5 cm/top. This latterphase is also punctuated by second-order d13Cc variations but theseare less regular in frequency and amplitude (from 1.3 to 0.3&) thanthe second-order oxygen oscillations in the same interval.
In summary, the Vil-car-1 isotopic record is characterized bya prominent and unique d18Oc negative peak from 59 to 47 cm/topwhile the d13Cc displays a more variable pattern.
4.2. Trace elements
The aim of the trace element measurements is to help theunderstanding of local hydrology at the transition from MIS 6 toMIS 5 and to detect disturbances in the geochemical system thatcould be associated to age inversions (see below). We will focus onMg, Sr, K, Na, Zn and Al concentrations because they give the mostsignificative results.
The Ca-normalized K, Na, Zn and Al concentration vary slightlyapart for shorts peaks (Fig. 4). The largest concentration peakcentered at 59.35 cm/top, coincides with an isotopic event. Inter-estingly, concentrations in Sr, Mg and U, which are associated withthe calcite lattice, do not display coeval major concentrationchanges, implying that aforementioned element concentrationpeak (K, Na, Al), which are not necessary directly associated to thecalcite lattice is probably related to the presence of detrital matterbrought via colloïdes and detrital particles (Borsato et al., 2007).
Strontium and magnesium concentrations show significantvariability with relatively long term periods, the Mg concentrationshowing a close resemblance to the pattern of the d13Cc variation.
Magnesium and strontium concentration are not correlated,attesting that no prior calcite precipitation has occurred (Fig. 4(Fairchild et al., 2000)).
The Mg concentration peak centered at 62.85 cm/top is locatedjust above a visual discontinuity, marked by a clay-rich layer anda petrographic change from white, porous to dark, dense calcite.This peak thus probably corresponds to a flushing episode occur-ring after a dry period (d63.5; Fig. 4).
4.3. Dating results and age model
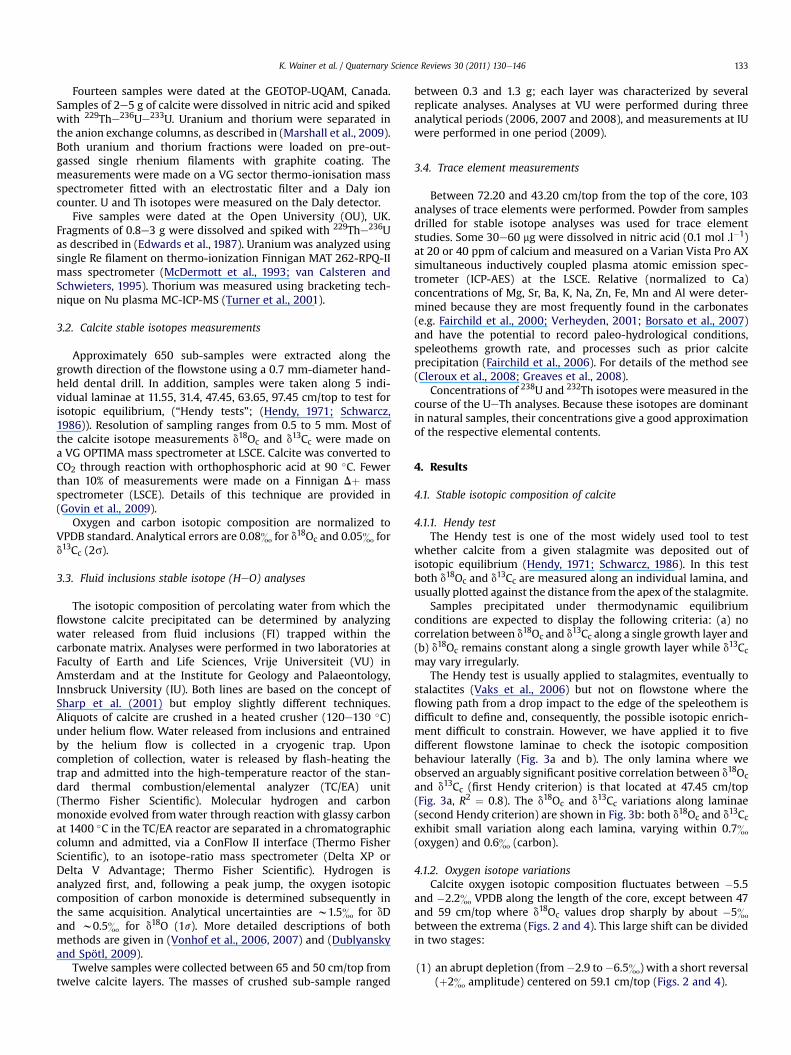
All U-series activity ratios presented in this paper are calculatedusing the decay constants published in (Cheng et al., 2000;Begemann et al., 2001) (Table 1). Uranium concentrations instudied sub-samples range from 18 to 74 ng/g. Twenty sevensamples yield a relatively high detrital content (230Th/232Th) < 100(brackets denote activity ratio). Thus all ages were corrected forinitial 230Th using a detrital activity ratio (230Th/232Th) ¼ 0.9 � 0.45measured in “modern” Villars cave clay (Wainer et al., 2009). Thiscorrection results in ages younger by 0.3e15% (depending on the232Th concentration) compared to their uncorrected values(Table 1).
The corrected ages are in stratigraphic order within uncertaintyexcept during three intervals: (1) 6 to 5 cm/top; (2) 24 to 15 cm/top;and (3) 65 to 42 cm/top (Fig. 5 and Table 1). Samples from theseintervals were analyzed independently in different laboratoriesusing different techniques, which all yielded similar ages. We thusconsider it unlikely that these apparent age reversals were causedby analytical artefacts (e.g. Th adsorption).
Our final age model was built upon the following assumptions:
� The detrital component has an activity ratio (230Th/232Th)¼ 0.9,and remained constant through time (this correction beingsignificant for 27 samples);
� The oldest ages for each depth are due to uranium leaching, inparticular at the edge of discontinuities d63.5, d47.2, d42, d12.5(Figs. 1 and 4), as proposed by (Lundberg and Ford, 1994).
The focus of the present study is on the interval between 65 and42 cm/top. In some places within this interval, U concentrationvaries significantly within short intervals (for example, 32e50 ng/g
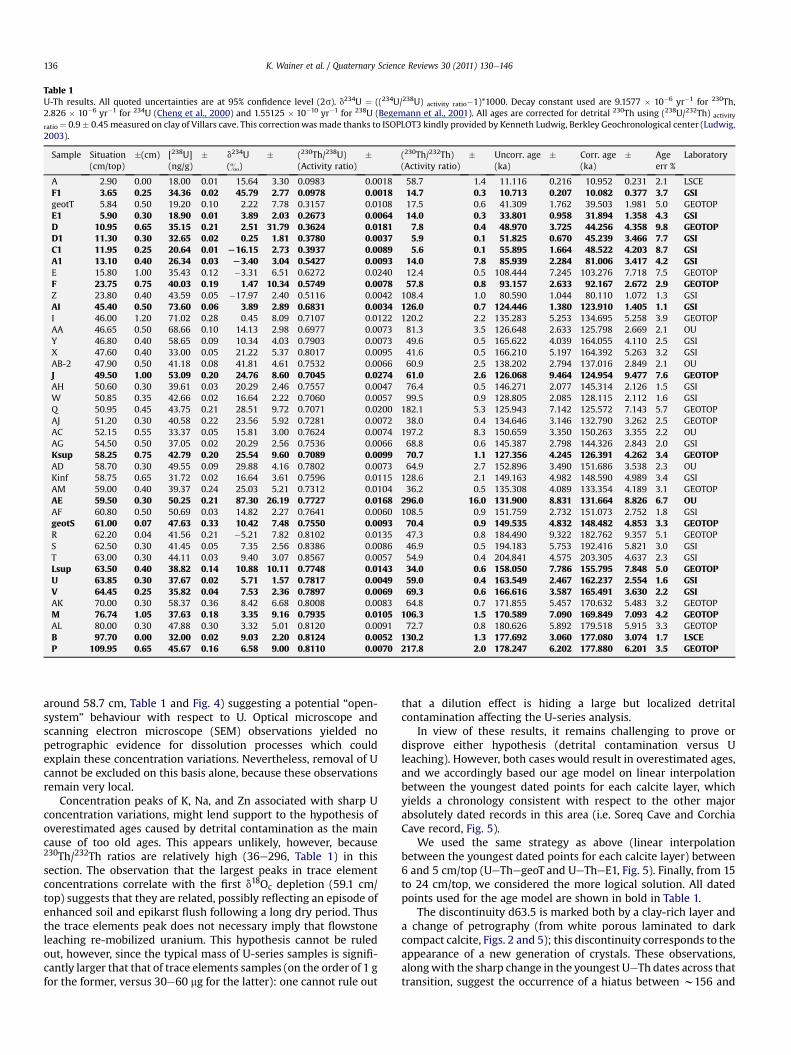
Table 1U-Th results. All quoted uncertainties are at 95% confidence level (2s). d234U ¼ ((234U/238U) activity ratio�1)*1000. Decay constant used are 9.1577 � 10�6 yr�1 for 230Th,2.826 � 10�6 yr�1 for 234U (Cheng et al., 2000) and 1.55125 � 10�10 yr�1 for 238U (Begemann et al., 2001). All ages are corrected for detrital 230Th using (238U/232Th) activity
ratio¼ 0.9� 0.45 measured on clay of Villars cave. This correctionwas made thanks to ISOPLOT3 kindly provided by Kenneth Ludwig, Berkley Geochronological center (Ludwig,2003).
Sample Situation(cm/top)
�(cm) [238U](ng/g)
� d234U(&)
� (230Th/238U)(Activity ratio)
� (230Th/232Th)(Activity ratio)
� Uncorr. age(ka)
� Corr. age(ka)
� Ageerr %
Laboratory
A 2.90 0.00 18.00 0.01 15.64 3.30 0.0983 0.0018 58.7 1.4 11.116 0.216 10.952 0.231 2.1 LSCEF1 3.65 0.25 34.36 0.02 45.79 2.77 0.0978 0.0018 14.7 0.3 10.713 0.207 10.082 0.377 3.7 GSIgeotT 5.84 0.50 19.20 0.10 2.22 7.78 0.3157 0.0108 17.5 0.6 41.309 1.762 39.503 1.981 5.0 GEOTOPE1 5.90 0.30 18.90 0.01 3.89 2.03 0.2673 0.0064 14.0 0.3 33.801 0.958 31.894 1.358 4.3 GSID 10.95 0.65 35.15 0.21 2.51 31.79 0.3624 0.0181 7.8 0.4 48.970 3.725 44.256 4.358 9.8 GEOTOPD1 11.30 0.30 32.65 0.02 0.25 1.81 0.3780 0.0037 5.9 0.1 51.825 0.670 45.239 3.466 7.7 GSIC1 11.95 0.25 20.64 0.01 L16.15 2.73 0.3937 0.0089 5.6 0.1 55.895 1.664 48.522 4.203 8.7 GSIA1 13.10 0.40 26.34 0.03 L3.40 3.04 0.5427 0.0093 14.0 7.8 85.939 2.284 81.006 3.417 4.2 GSIE 15.80 1.00 35.43 0.12 �3.31 6.51 0.6272 0.0240 12.4 0.5 108.444 7.245 103.276 7.718 7.5 GEOTOPF 23.75 0.75 40.03 0.19 1.47 10.34 0.5749 0.0078 57.8 0.8 93.157 2.633 92.167 2.672 2.9 GEOTOPZ 23.80 0.40 43.59 0.05 �17.97 2.40 0.5116 0.0042 108.4 1.0 80.590 1.044 80.110 1.072 1.3 GSIAI 45.40 0.50 73.60 0.06 3.89 2.89 0.6831 0.0034 126.0 0.7 124.446 1.380 123.910 1.405 1.1 GSII 46.00 1.20 71.02 0.28 0.45 8.09 0.7107 0.0122 120.2 2.2 135.283 5.253 134.695 5.258 3.9 GEOTOPAA 46.65 0.50 68.66 0.10 14.13 2.98 0.6977 0.0073 81.3 3.5 126.648 2.633 125.798 2.669 2.1 OUY 46.80 0.40 58.65 0.09 10.34 4.03 0.7903 0.0073 49.6 0.5 165.622 4.039 164.055 4.110 2.5 GSIX 47.60 0.40 33.00 0.05 21.22 5.37 0.8017 0.0095 41.6 0.5 166.210 5.197 164.392 5.263 3.2 GSIAB-2 47.90 0.50 41.18 0.08 41.81 4.61 0.7532 0.0066 60.9 2.5 138.202 2.794 137.016 2.849 2.1 OUJ 49.50 1.00 53.09 0.20 24.76 8.60 0.7045 0.0274 61.0 2.6 126.068 9.464 124.954 9.477 7.6 GEOTOPAH 50.60 0.30 39.61 0.03 20.29 2.46 0.7557 0.0047 76.4 0.5 146.271 2.077 145.314 2.126 1.5 GSIW 50.85 0.35 42.66 0.02 16.64 2.22 0.7060 0.0057 99.5 0.9 128.805 2.085 128.115 2.112 1.6 GSIQ 50.95 0.45 43.75 0.21 28.51 9.72 0.7071 0.0200 182.1 5.3 125.943 7.142 125.572 7.143 5.7 GEOTOPAJ 51.20 0.30 40.58 0.22 23.56 5.92 0.7281 0.0072 38.0 0.4 134.646 3.146 132.790 3.262 2.5 GEOTOPAC 52.15 0.55 33.37 0.05 15.81 3.00 0.7624 0.0074 197.2 8.3 150.659 3.350 150.263 3.355 2.2 OUAG 54.50 0.50 37.05 0.02 20.29 2.56 0.7536 0.0066 68.8 0.6 145.387 2.798 144.326 2.843 2.0 GSIKsup 58.25 0.75 42.79 0.20 25.54 9.60 0.7089 0.0099 70.7 1.1 127.356 4.245 126.391 4.262 3.4 GEOTOPAD 58.70 0.30 49.55 0.09 29.88 4.16 0.7802 0.0073 64.9 2.7 152.896 3.490 151.686 3.538 2.3 OUKinf 58.75 0.65 31.72 0.02 16.64 3.61 0.7596 0.0115 128.6 2.1 149.163 4.982 148.590 4.989 3.4 GSIAM 59.00 0.40 39.37 0.24 25.03 5.21 0.7312 0.0104 36.2 0.5 135.308 4.089 133.354 4.189 3.1 GEOTOPAE 59.50 0.30 50.25 0.21 87.30 26.19 0.7727 0.0168 296.0 16.0 131.900 8.831 131.664 8.826 6.7 OUAF 60.80 0.50 50.69 0.03 14.82 2.27 0.7641 0.0060 108.5 0.9 151.759 2.732 151.073 2.752 1.8 GSIgeotS 61.00 0.07 47.63 0.33 10.42 7.48 0.7550 0.0093 70.4 0.9 149.535 4.832 148.482 4.853 3.3 GEOTOPR 62.20 0.04 41.56 0.21 �5.21 7.82 0.8102 0.0135 47.3 0.8 184.490 9.322 182.762 9.357 5.1 GEOTOPS 62.50 0.30 41.45 0.05 7.35 2.56 0.8386 0.0086 46.9 0.5 194.183 5.753 192.416 5.821 3.0 GSIT 63.00 0.30 44.11 0.03 9.40 3.07 0.8567 0.0057 54.9 0.4 204.841 4.575 203.305 4.637 2.3 GSILsup 63.50 0.40 38.82 0.14 10.88 10.11 0.7748 0.0143 34.0 0.6 158.050 7.786 155.795 7.848 5.0 GEOTOPU 63.85 0.30 37.67 0.02 5.71 1.57 0.7817 0.0049 59.0 0.4 163.549 2.467 162.237 2.554 1.6 GSIV 64.45 0.25 35.82 0.04 7.53 2.36 0.7897 0.0069 69.3 0.6 166.616 3.587 165.491 3.630 2.2 GSIAK 70.00 0.30 58.37 0.36 8.42 6.68 0.8008 0.0083 64.8 0.7 171.855 5.457 170.632 5.483 3.2 GEOTOPM 76.74 1.05 37.63 0.18 3.35 9.16 0.7935 0.0105 106.3 1.5 170.589 7.090 169.849 7.093 4.2 GEOTOPAL 80.00 0.30 47.88 0.30 3.32 5.01 0.8120 0.0091 72.7 0.8 180.626 5.892 179.518 5.915 3.3 GEOTOPB 97.70 0.00 32.00 0.02 9.03 2.20 0.8124 0.0052 130.2 1.3 177.692 3.060 177.080 3.074 1.7 LSCEP 109.95 0.65 45.67 0.16 6.58 9.00 0.8110 0.0070 217.8 2.0 178.247 6.202 177.880 6.201 3.5 GEOTOP
K. Wainer et al. / Quaternary Science Reviews 30 (2011) 130e146136
around 58.7 cm, Table 1 and Fig. 4) suggesting a potential “open-system” behaviour with respect to U. Optical microscope andscanning electron microscope (SEM) observations yielded nopetrographic evidence for dissolution processes which couldexplain these concentration variations. Nevertheless, removal of Ucannot be excluded on this basis alone, because these observationsremain very local.
Concentration peaks of K, Na, and Zn associated with sharp Uconcentration variations, might lend support to the hypothesis ofoverestimated ages caused by detrital contamination as the maincause of too old ages. This appears unlikely, however, because230Th/232Th ratios are relatively high (36e296, Table 1) in thissection. The observation that the largest peaks in trace elementconcentrations correlate with the first d18Oc depletion (59.1 cm/top) suggests that they are related, possibly reflecting an episode ofenhanced soil and epikarst flush following a long dry period. Thusthe trace elements peak does not necessary imply that flowstoneleaching re-mobilized uranium. This hypothesis cannot be ruledout, however, since the typical mass of U-series samples is signifi-cantly larger that that of trace elements samples (on the order of 1 gfor the former, versus 30e60 mg for the latter): one cannot rule out
that a dilution effect is hiding a large but localized detritalcontamination affecting the U-series analysis.
In view of these results, it remains challenging to prove ordisprove either hypothesis (detrital contamination versus Uleaching). However, both cases would result in overestimated ages,and we accordingly based our age model on linear interpolationbetween the youngest dated points for each calcite layer, whichyields a chronology consistent with respect to the other majorabsolutely dated records in this area (i.e. Soreq Cave and CorchiaCave record, Fig. 5).
We used the same strategy as above (linear interpolationbetween the youngest dated points for each calcite layer) between6 and 5 cm/top (UeThegeoT and UeTheE1, Fig. 5). Finally, from 15to 24 cm/top, we considered the more logical solution. All datedpoints used for the age model are shown in bold in Table 1.
The discontinuity d63.5 is marked both by a clay-rich layer anda change of petrography (from white porous laminated to darkcompact calcite, Figs. 2 and 5); this discontinuity corresponds to theappearance of a new generation of crystals. These observations,alongwith the sharp change in the youngest UeTh dates across thattransition, suggest the occurrence of a hiatus between w156 and
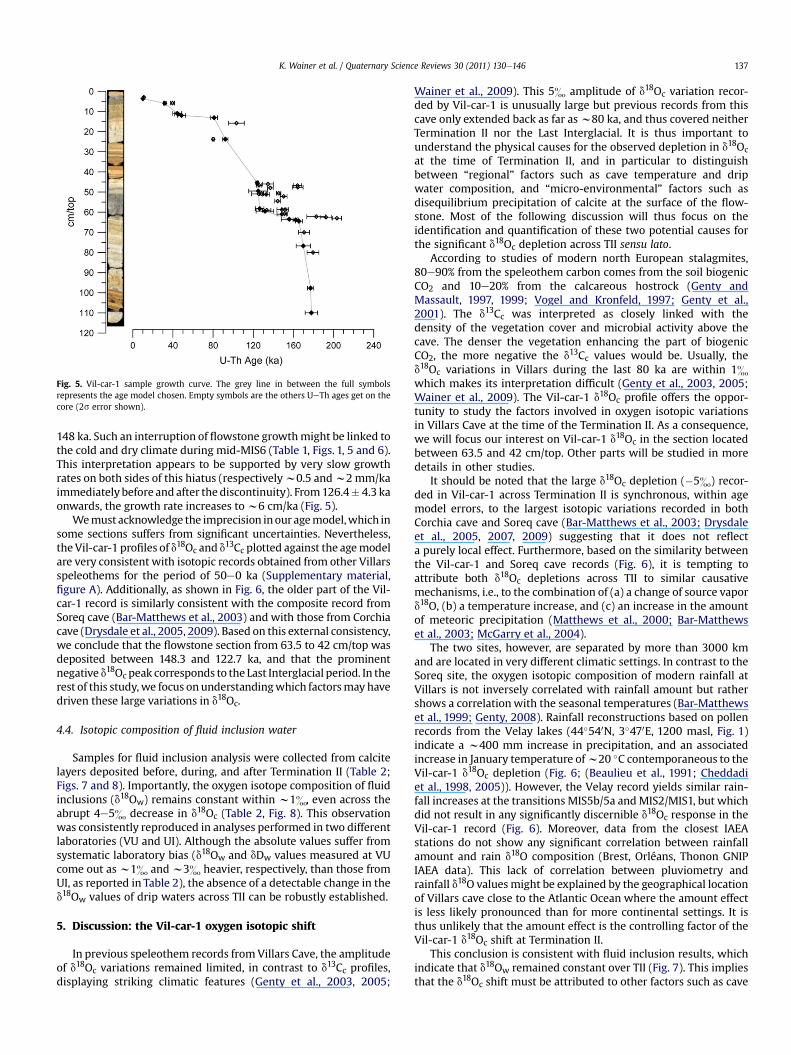
Fig. 5. Vil-car-1 sample growth curve. The grey line in between the full symbolsrepresents the age model chosen. Empty symbols are the others UeTh ages get on thecore (2s error shown).
K. Wainer et al. / Quaternary Science Reviews 30 (2011) 130e146 137
148 ka. Such an interruption of flowstone growthmight be linked tothe cold and dry climate during mid-MIS6 (Table 1, Figs. 1, 5 and 6).This interpretation appears to be supported by very slow growthrates on both sides of this hiatus (respectivelyw0.5 andw2mm/kaimmediately before and after the discontinuity). From126.4� 4.3 kaonwards, the growth rate increases tow6 cm/ka (Fig. 5).
Wemust acknowledge the imprecision inouragemodel,which insome sections suffers from significant uncertainties. Nevertheless,the Vil-car-1 profiles of d18Oc and d13Cc plotted against the agemodelare very consistent with isotopic records obtained from other Villarsspeleothems for the period of 50e0 ka (Supplementary material,figure A). Additionally, as shown in Fig. 6, the older part of the Vil-car-1 record is similarly consistent with the composite record fromSoreq cave (Bar-Matthews et al., 2003) and with those from Corchiacave (Drysdale et al., 2005, 2009). Based on this external consistency,we conclude that the flowstone section from 63.5 to 42 cm/top wasdeposited between 148.3 and 122.7 ka, and that the prominentnegative d18Oc peak corresponds to the Last Interglacial period. In therest of this study,we focus on understandingwhich factorsmay havedriven these large variations in d18Oc.
4.4. Isotopic composition of fluid inclusion water
Samples for fluid inclusion analysis were collected from calcitelayers deposited before, during, and after Termination II (Table 2;Figs. 7 and 8). Importantly, the oxygen isotope composition of fluidinclusions (d18Ow) remains constant within w1&, even across theabrupt 4e5& decrease in d18Oc (Table 2, Fig. 8). This observationwas consistently reproduced in analyses performed in two differentlaboratories (VU and UI). Although the absolute values suffer fromsystematic laboratory bias (d18Ow and dDw values measured at VUcome out as w1& and w3& heavier, respectively, than those fromUI, as reported in Table 2), the absence of a detectable change in thed18Ow values of drip waters across TII can be robustly established.
5. Discussion: the Vil-car-1 oxygen isotopic shift
In previous speleothem records from Villars Cave, the amplitudeof d18Oc variations remained limited, in contrast to d13Cc profiles,displaying striking climatic features (Genty et al., 2003, 2005;
Wainer et al., 2009). This 5& amplitude of d18Oc variation recor-ded by Vil-car-1 is unusually large but previous records from thiscave only extended back as far asw80 ka, and thus covered neitherTermination II nor the Last Interglacial. It is thus important tounderstand the physical causes for the observed depletion in d18Ocat the time of Termination II, and in particular to distinguishbetween “regional” factors such as cave temperature and dripwater composition, and “micro-environmental” factors such asdisequilibrium precipitation of calcite at the surface of the flow-stone. Most of the following discussion will thus focus on theidentification and quantification of these two potential causes forthe significant d18Oc depletion across TII sensu lato.
According to studies of modern north European stalagmites,80e90% from the speleothem carbon comes from the soil biogenicCO2 and 10e20% from the calcareous hostrock (Genty andMassault, 1997, 1999; Vogel and Kronfeld, 1997; Genty et al.,2001). The d13Cc was interpreted as closely linked with thedensity of the vegetation cover and microbial activity above thecave. The denser the vegetation enhancing the part of biogenicCO2, the more negative the d13Cc values would be. Usually, thed18Oc variations in Villars during the last 80 ka are within 1&which makes its interpretation difficult (Genty et al., 2003, 2005;Wainer et al., 2009). The Vil-car-1 d18Oc profile offers the oppor-tunity to study the factors involved in oxygen isotopic variationsin Villars Cave at the time of the Termination II. As a consequence,we will focus our interest on Vil-car-1 d18Oc in the section locatedbetween 63.5 and 42 cm/top. Other parts will be studied in moredetails in other studies.
It should be noted that the large d18Oc depletion (�5&) recor-ded in Vil-car-1 across Termination II is synchronous, within agemodel errors, to the largest isotopic variations recorded in bothCorchia cave and Soreq cave (Bar-Matthews et al., 2003; Drysdaleet al., 2005, 2007, 2009) suggesting that it does not reflecta purely local effect. Furthermore, based on the similarity betweenthe Vil-car-1 and Soreq cave records (Fig. 6), it is tempting toattribute both d18Oc depletions across TII to similar causativemechanisms, i.e., to the combination of (a) a change of source vapord18O, (b) a temperature increase, and (c) an increase in the amountof meteoric precipitation (Matthews et al., 2000; Bar-Matthewset al., 2003; McGarry et al., 2004).
The two sites, however, are separated by more than 3000 kmand are located in very different climatic settings. In contrast to theSoreq site, the oxygen isotopic composition of modern rainfall atVillars is not inversely correlated with rainfall amount but rathershows a correlationwith the seasonal temperatures (Bar-Matthewset al., 1999; Genty, 2008). Rainfall reconstructions based on pollenrecords from the Velay lakes (44�540N, 3�470E, 1200 masl, Fig. 1)indicate a w400 mm increase in precipitation, and an associatedincrease in January temperature ofw20 �C contemporaneous to theVil-car-1 d18Oc depletion (Fig. 6; (Beaulieu et al., 1991; Cheddadiet al., 1998, 2005)). However, the Velay record yields similar rain-fall increases at the transitions MIS5b/5a andMIS2/MIS1, but whichdid not result in any significantly discernible d18Oc response in theVil-car-1 record (Fig. 6). Moreover, data from the closest IAEAstations do not show any significant correlation between rainfallamount and rain d18O composition (Brest, Orléans, Thonon GNIPIAEA data). This lack of correlation between pluviometry andrainfall d18O valuesmight be explained by the geographical locationof Villars cave close to the Atlantic Ocean where the amount effectis less likely pronounced than for more continental settings. It isthus unlikely that the amount effect is the controlling factor of theVil-car-1 d18Oc shift at Termination II.
This conclusion is consistent with fluid inclusion results, whichindicate that d18Ow remained constant over TII (Fig. 7). This impliesthat the d18Oc shift must be attributed to other factors such as cave

0 40000 80000 120000 160000Age (a)
0
8
16
Win
ter S
ST
M23
414
(°C
)
0
-2
-4
-6
-8
-10
δ18O
c Sor
eq (‰
PD
B)-2
-4
-6
δ18O
c CC
5 (‰
PD
B)
-2
-4
-6
-8
-10
δ18 O
c Vil-
car-1
(‰ P
DB
)
-2
-4
-6
-8
-10
-12
δ13 C
c Vil-
car-1
(‰ P
DB
)
200400600800
10001200
Plu
viom
etry
Vel
ay (m
m/a
) -20-15-10-50510
T ja
nuar
y V
elay
(°C
)
0
8
16
Win
ter S
ST
MD
04-2
845
(°C
)
8
16
24A
nnua
l SS
T O
DP
977
(°C
)
Fig. 6. Comparison between Vil-car-1 d18Oc and d13Cc with Soreq d18Oc (modified from Bar-Matthews et al., 2003) Corchia Cave CC5 d18Oc (Drysdale et al., 2005) and Velay plateaurainfall annual quantity and January temperature estimations (Beaulieu et al., 1991; Cheddadi et al., 2005), mean annual SST temperature calculated thanks to the U37
k’ alkenonesindex ODP977 core (Martrat et al., 2004), winter SST deduced from foraminifers assemblages of MD04-2845 (Bay of Biscay, Sánchez Goñi et al., 2008) and M23414 Northern Atlantic(Kandiano et al., 2004) marine cores.
K. Wainer et al. / Quaternary Science Reviews 30 (2011) 130e146138
temperature rise and possibly variable amounts of out-of-equilib-rium precipitation.
5.1. Amplitude of temperature increase across Termination II
5.1.1. Did Vil-car-1 calcite precipitate in isotopic equilibrium?
a) Classical equilibrium tests
Although the Hendy tests described in Section 4.1.1 yield noclear evidence for out-of-equilibrium precipitation in four out ofthe five tested Vil-car-1 laminae (Fig. 3), this does not constitutereliable evidence for thermodynamic equilibrium, for severalreasons. Strictly speaking, the Hendy test can only provideevidence of spatially variable disequilibrium fractionation.Although one might argue that kinetic isotope fractionationeffects near the apex of a stalagmite would likely displaydetectable lateral variations, that assumption is far less likely tohold true at the scale of a flow area several meters wide, but onlysampled within the diameter of the core (7.5 cm), half meter
away from the flowstone’s main water supply. Additionally,individual laminae proved too subtle and too thin to be sepa-rately subsampled in a strict manner. For these reasons, we donot entirely trust this test and suspect that the Vil-car-1 recordmay partly reflect out-of-equilibrium deposition due to kineticisotope fractionation effects.
On the other hand, Vil-car-1 profiles of d18Oc and d13Cc for thelast w80 ka are quantitatively consistent with coeval stalagmiterecords from elsewhere in the same cave (Supplementarymaterial fig. A), and a such internal consistency might be indic-ative of equilibrium precipitation (Dorale et al., 2002; Wang et al.,2008). However, there is unambiguous and widespread evidencethat modern calcite precipitates out of equilibrium in the Villarscave: Genty (2008) measured the isotopic compositions ofmodern drip water and of recent calcite samples, some of whichwere collected only a few meters from the Vil-car-1 flowstone.Temperatures computed from these measurements by means ofvarious equilibrium fractionation equations (Kim and O’Neil,1997, O’Neil et al., 1969, Craig, 1965 equations) differed signifi-cantly (4e5 �C discrepancy) from the modern temperature
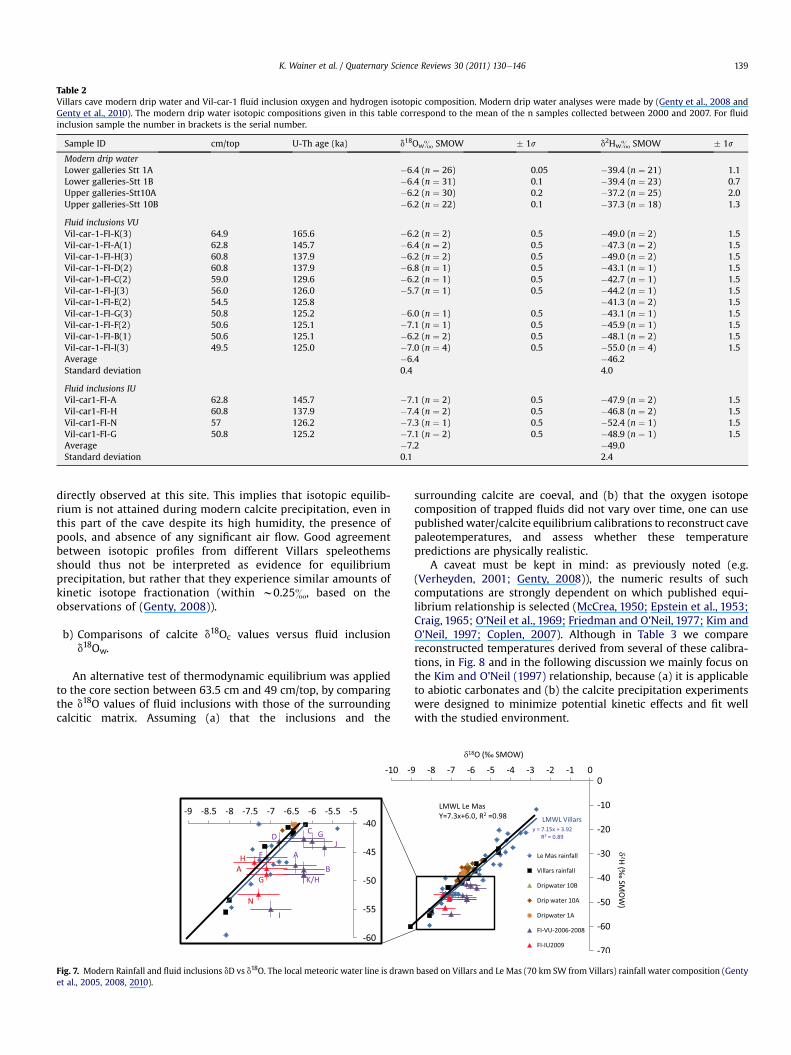
Table 2Villars cave modern drip water and Vil-car-1 fluid inclusion oxygen and hydrogen isotopic composition. Modern drip water analyses were made by (Genty et al., 2008 andGenty et al., 2010). The modern drip water isotopic compositions given in this table correspond to the mean of the n samples collected between 2000 and 2007. For fluidinclusion sample the number in brackets is the serial number.
Sample ID cm/top U-Th age (ka) d18Ow& SMOW � 1s d2Hw& SMOW � 1s
Modern drip waterLower galleries Stt 1A �6.4 (n ¼ 26) 0.05 �39.4 (n ¼ 21) 1.1Lower galleries-Stt 1B �6.4 (n ¼ 31) 0.1 �39.4 (n ¼ 23) 0.7Upper galleries-Stt10A �6.2 (n ¼ 30) 0.2 �37.2 (n ¼ 25) 2.0Upper galleries-Stt 10B �6.2 (n ¼ 22) 0.1 �37.3 (n ¼ 18) 1.3
Fluid inclusions VUVil-car-1-FI-K(3) 64.9 165.6 �6.2 (n ¼ 2) 0.5 �49.0 (n ¼ 2) 1.5Vil-car-1-FI-A(1) 62.8 145.7 �6.4 (n ¼ 2) 0.5 �47.3 (n ¼ 2) 1.5Vil-car-1-FI-H(3) 60.8 137.9 �6.2 (n ¼ 2) 0.5 �49.0 (n ¼ 2) 1.5Vil-car-1-FI-D(2) 60.8 137.9 �6.8 (n ¼ 1) 0.5 �43.1 (n ¼ 1) 1.5Vil-car-1-FI-C(2) 59.0 129.6 �6.2 (n ¼ 1) 0.5 �42.7 (n ¼ 1) 1.5Vil-car-1-FI-J(3) 56.0 126.0 �5.7 (n ¼ 1) 0.5 �44.2 (n ¼ 1) 1.5Vil-car-1-FI-E(2) 54.5 125.8 �41.3 (n ¼ 2) 1.5Vil-car-1-FI-G(3) 50.8 125.2 �6.0 (n ¼ 1) 0.5 �43.1 (n ¼ 1) 1.5Vil-car-1-FI-F(2) 50.6 125.1 �7.1 (n ¼ 1) 0.5 �45.9 (n ¼ 1) 1.5Vil-car-1-FI-B(1) 50.6 125.1 �6.2 (n ¼ 2) 0.5 �48.1 (n ¼ 2) 1.5Vil-car-1-FI-I(3) 49.5 125.0 �7.0 (n ¼ 4) 0.5 �55.0 (n ¼ 4) 1.5Average �6.4 �46.2Standard deviation 0.4 4.0
Fluid inclusions IUVil-car1-FI-A 62.8 145.7 �7.1 (n ¼ 2) 0.5 �47.9 (n ¼ 2) 1.5Vil-car1-FI-H 60.8 137.9 �7.4 (n ¼ 2) 0.5 �46.8 (n ¼ 2) 1.5Vil-car1-FI-N 57 126.2 �7.3 (n ¼ 1) 0.5 �52.4 (n ¼ 1) 1.5Vil-car1-FI-G 50.8 125.2 �7.1 (n ¼ 2) 0.5 �48.9 (n ¼ 1) 1.5Average �7.2 �49.0Standard deviation 0.1 2.4
K. Wainer et al. / Quaternary Science Reviews 30 (2011) 130e146 139
directly observed at this site. This implies that isotopic equilib-rium is not attained during modern calcite precipitation, even inthis part of the cave despite its high humidity, the presence ofpools, and absence of any significant air flow. Good agreementbetween isotopic profiles from different Villars speleothemsshould thus not be interpreted as evidence for equilibriumprecipitation, but rather that they experience similar amounts ofkinetic isotope fractionation (within w0.25&, based on theobservations of (Genty, 2008)).
b) Comparisons of calcite d18Oc values versus fluid inclusiond18Ow.
An alternative test of thermodynamic equilibrium was appliedto the core section between 63.5 cm and 49 cm/top, by comparingthe d18O values of fluid inclusions with those of the surroundingcalcitic matrix. Assuming (a) that the inclusions and the
Fig. 7. Modern Rainfall and fluid inclusions dD vs d18O. The local meteoric water line is drawnet al., 2005, 2008, 2010).
surrounding calcite are coeval, and (b) that the oxygen isotopecomposition of trapped fluids did not vary over time, one can usepublishedwater/calcite equilibrium calibrations to reconstruct cavepaleotemperatures, and assess whether these temperaturepredictions are physically realistic.
A caveat must be kept in mind: as previously noted (e.g.(Verheyden, 2001; Genty, 2008)), the numeric results of suchcomputations are strongly dependent on which published equi-librium relationship is selected (McCrea, 1950; Epstein et al., 1953;Craig, 1965; O’Neil et al., 1969; Friedman and O’Neil, 1977; Kim andO’Neil, 1997; Coplen, 2007). Although in Table 3 we comparereconstructed temperatures derived from several of these calibra-tions, in Fig. 8 and in the following discussion we mainly focus onthe Kim and O’Neil (1997) relationship, because (a) it is applicableto abiotic carbonates and (b) the calcite precipitation experimentswere designed to minimize potential kinetic effects and fit wellwith the studied environment.
based on Villars and Le Mas (70 km SW from Villars) rainfall water composition (Genty
110 115 120 125 130 135 140 145 150 155 160 165 170time (ka)
-3
-4
-5
-6
-7
-8
-9
δ18 O
c, V
il-ca
r-1(‰
PD
B)
-10
-5
0
5
10
15
20
25
T (°C
, Kim
and
O'N
eil 1
997)
-3
-4
-5
-6
-7
-8
-9
δ18O
w, V
il-ca
r-1 (‰
SM
OW
)
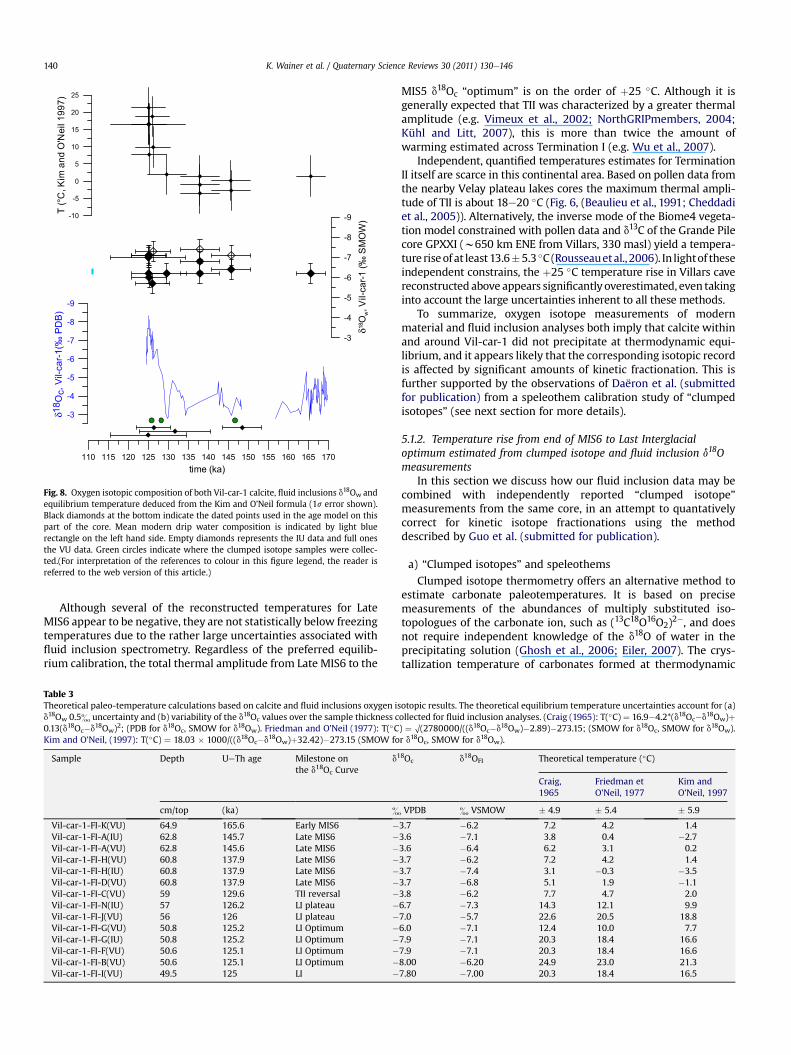
Fig. 8. Oxygen isotopic composition of both Vil-car-1 calcite, fluid inclusions d18Ow andequilibrium temperature deduced from the Kim and O’Neil formula (1s error shown).Black diamonds at the bottom indicate the dated points used in the age model on thispart of the core. Mean modern drip water composition is indicated by light bluerectangle on the left hand side. Empty diamonds represents the IU data and full onesthe VU data. Green circles indicate where the clumped isotope samples were collec-ted.(For interpretation of the references to colour in this figure legend, the reader isreferred to the web version of this article.)
K. Wainer et al. / Quaternary Science Reviews 30 (2011) 130e146140
Although several of the reconstructed temperatures for LateMIS6 appear to be negative, they are not statistically below freezingtemperatures due to the rather large uncertainties associated withfluid inclusion spectrometry. Regardless of the preferred equilib-rium calibration, the total thermal amplitude from Late MIS6 to the
Table 3Theoretical paleo-temperature calculations based on calcite and fluid inclusions oxygen isd18Ow 0.5& uncertainty and (b) variability of the d18Oc values over the sample thickness c0.13(d18Oc�d18Ow)2; (PDB for d18Oc, SMOW for d18Ow). Friedman and O’Neil (1977): T(�CKim and O’Neil, (1997): T(�C) ¼ 18.03 � 1000/((d18Oc�d18Ow)þ32.42)�273.15 (SMOW fo
Sample Depth UeTh age Milestone onthe d18Oc Curve
d1
cm/top (ka) &
Vil-car-1-FI-K(VU) 64.9 165.6 Early MIS6 �Vil-car-1-FI-A(IU) 62.8 145.7 Late MIS6 �Vil-car-1-FI-A(VU) 62.8 145.6 Late MIS6 �Vil-car-1-FI-H(VU) 60.8 137.9 Late MIS6 �Vil-car-1-FI-H(IU) 60.8 137.9 Late MIS6 �Vil-car-1-FI-D(VU) 60.8 137.9 Late MIS6 �Vil-car-1-FI-C(VU) 59 129.6 TII reversal �Vil-car-1-FI-N(IU) 57 126.2 LI plateau �Vil-car-1-FI-J(VU) 56 126 LI plateau �Vil-car-1-FI-G(VU) 50.8 125.2 LI Optimum �Vil-car-1-FI-G(IU) 50.8 125.2 LI Optimum �Vil-car-1-FI-F(VU) 50.6 125.1 LI Optimum �Vil-car-1-FI-B(VU) 50.6 125.1 LI Optimum �Vil-car-1-FI-I(VU) 49.5 125 LI �
MIS5 d18Oc “optimum” is on the order of þ25 �C. Although it isgenerally expected that TII was characterized by a greater thermalamplitude (e.g. Vimeux et al., 2002; NorthGRIPmembers, 2004;Kühl and Litt, 2007), this is more than twice the amount ofwarming estimated across Termination I (e.g. Wu et al., 2007).
Independent, quantified temperatures estimates for TerminationII itself are scarce in this continental area. Based on pollen data fromthe nearby Velay plateau lakes cores the maximum thermal ampli-tude of TII is about 18e20 �C (Fig. 6, (Beaulieu et al., 1991; Cheddadiet al., 2005)). Alternatively, the inverse mode of the Biome4 vegeta-tion model constrained with pollen data and d13C of the Grande Pilecore GPXXI (w650 km ENE from Villars, 330 masl) yield a tempera-ture riseof at least13.6�5.3 �C (Rousseauetal., 2006). In lightof theseindependent constrains, the þ25 �C temperature rise in Villars cavereconstructed above appears significantly overestimated, even takinginto account the large uncertainties inherent to all these methods.
To summarize, oxygen isotope measurements of modernmaterial and fluid inclusion analyses both imply that calcite withinand around Vil-car-1 did not precipitate at thermodynamic equi-librium, and it appears likely that the corresponding isotopic recordis affected by significant amounts of kinetic fractionation. This isfurther supported by the observations of Daëron et al. (submittedfor publication) from a speleothem calibration study of “clumpedisotopes” (see next section for more details).
5.1.2. Temperature rise from end of MIS6 to Last Interglacialoptimum estimated from clumped isotope and fluid inclusion d18Omeasurements
In this section we discuss how our fluid inclusion data may becombined with independently reported “clumped isotope”measurements from the same core, in an attempt to quantativelycorrect for kinetic isotope fractionations using the methoddescribed by Guo et al. (submitted for publication).
a) “Clumped isotopes” and speleothems
Clumped isotope thermometry offers an alternative method toestimate carbonate paleotemperatures. It is based on precisemeasurements of the abundances of multiply substituted iso-topologues of the carbonate ion, such as (13C18O16O2)2�, and doesnot require independent knowledge of the d18O of water in theprecipitating solution (Ghosh et al., 2006; Eiler, 2007). The crys-tallization temperature of carbonates formed at thermodynamic
otopic results. The theoretical equilibrium temperature uncertainties account for (a)ollected for fluid inclusion analyses. (Craig (1965): T(�C) ¼ 16.9�4.2*(d18Oc�d18Ow)þ) ¼ O(2780000/((d18Oc�d18Ow)�2.89)�273.15; (SMOW for d18Oc, SMOW for d18Ow).r d18Oc, SMOW for d18Ow).
8Oc d18OFI Theoretical temperature (�C)
Craig,1965
Friedman etO’Neil, 1977
Kim andO’Neil, 1997
VPDB & VSMOW � 4.9 � 5.4 � 5.9
3.7 �6.2 7.2 4.2 1.43.6 �7.1 3.8 0.4 �2.73.6 �6.4 6.2 3.1 0.23.7 �6.2 7.2 4.2 1.43.7 �7.4 3.1 �0.3 �3.53.7 �6.8 5.1 1.9 �1.13.8 �6.2 7.7 4.7 2.06.7 �7.3 14.3 12.1 9.97.0 �5.7 22.6 20.5 18.86.0 �7.1 12.4 10.0 7.77.9 �7.1 20.3 18.4 16.67.9 �7.1 20.3 18.4 16.68.00 �6.20 24.9 23.0 21.37.80 �7.00 20.3 18.4 16.5

Fig. 9. D47 offsets (relative to equilibrium values) vs 1000ln(a) offsets for modernVillars cave calcite deposit. Open squares correspond to replicate analyses, and areindicative of analytical precision limits and sample inhomogeneities. Grey ellipsescorrespond to 2s confidence limits of the replicates for each different speleothem. Theaverage slope is computed using sample means, not analytical replicates. Data from(Daëron et al., submiited for publication).
K. Wainer et al. / Quaternary Science Reviews 30 (2011) 130e146 141
equilibrium can thus be directly derived from the measurement ofD47, a variable describing the degree of isotopic “clumping” in CO2evolved from carbonate samples. Clumped-isotope thermometry, ifapplied to speleothems, would potentially allow independentreconstructions of T and seepage water d18O. Early investigations,however, have shown that D47 values of modern speleothemsformed under a wide range of environmental parameters aresignificantly less than expected for carbonate precipitating underequilibrium conditions (Affek et al., 2008; Daëron et al., submittedfor publication). These systematic D47 offsets likely result fromkinetic isotope fractionation (KIF) caused by rapid degassing andcrystallization reactions (Guo et al., 2008; Guo et al., submitted forpublication).
b) Application to Vil-car-1
As part of a broader calibration study of D47 in speleothems (cfsupplementary material B for the methods and materials used inthat study), Daëron et al. (submitted for publication) reported theclumped-isotope compositions of four samples from Vil-car-1,located respectively at 50.8, 58.6, 63.0, and 65.1 cm/top (Fig. 8).They observed that all Vil-car-1 temperatures computed from D47assuming equilibrium precipitation, including those for the glacialsample, consistently come out 9 to 20 �C warmer thanmodern cavetemperatures. These unreasonably high temperatures are qualita-tively consistent with modern clumped isotopes data from Villarscave (Daëron et al., submitted for publication), providing additionalevidence for out-of-equilibrium precipitation. Faced with a similarproblem, Affek et al. (2008) used the modern D47 offset (i.e. thedifference between the measured D47 value and the expectedequilibrium value for one modern speleothem) to correct for KIF inclumped-isotope measurement of fossil speleothems from thesame cave, and the resulting paleotemperatures are consistent withEastern Mediterranean sea-surface temperatures estimated usingalkenone unsaturation ratios. The same method cannot be appliedto Vil-car-1, however, because the clumped-isotope results ofDaëron et al. provide unambiguous evidence that the core experi-enced large variations in the amplitude of KIF effects over time:correcting the Vil-car‑1 D47 measurements by a fixed offset wouldinevitably yield an unrealistic thermal history, with temperatureestimates for MIS6 significantly warmer than for the LastInterglacial.
An alternative method, proposed by Guo et al. (submitted forpublication), describes how clumped-isotope data can becombined with fluid inclusion data to correct for KIF effects inspeleothems and thus reconstruct absolute paleotemperatures.This requires estimating the correlation between D47 effects andd18O effects. In the case of Villars cave, Guo et al. used the four local,modern measurements of isotopic disequilibria described byDaëron et al. (submitted for publication) to estimate the averagedirection of the modern KIF vector in a 2D space defined by D47 and1000ln(a), where a is the 18O fractionation factor betweencarbonate and water (Fig. 9). The two key assumptions behind thismethod are: (1) that, although the amplitude of KIF offsets affectingD47 and d18O may vary significantly over time, the relative balancebetween these two fractionation effects remains within certainlimits, as implied by the strong correlation observed in modernspeleothems worldwide (Fig. 4 in Daëron et al., submitted forpublication); (2) that these limits may be reasonably well esti-mated by compiling modern observations, so that the correlationbetween D47 and d18O offsets is characterized by its mean value andits standard deviation, both observed within the same cave settingas Vil-car-1.
Only three of the four clumped-isotope samples reported byDaëron et al. (submitted for publication) are bracketed by our fluid
inclusion data (Fig. 10). These are Vil-car-1-D47-63.0, �58.6, and�50.8, respectively corresponding to the Late MIS6, Termination IIand MIS-5 optimum. Because of current analytical requirements,individual samples for FI analysis are typically 100 times larger thanD47 samples. Each FI measurement thus corresponds to a time-averaged value which is expected to display smaller short-termvariations. For this reason, we selected to combine both data sets byinterpolating FI d18Ow values to the respective depths of the threeD47 samples (Fig. 10). Although this solution is not entirely satis-factory, FI and D47 samples are in close proximity for 5 out of the 6relevant data points (3 layers and 2 laboratories). Nevertheless,future studies would benefit from a protocol designed to succes-sively perform both types of measurements on the same samplematerial. Because of the systematic offset between FI results fromthe Innsbruck and Amsterdam labs, we used data from both labsindependently, compared the results, and estimated a posteriorihow paleo-temperature estimates might be affected by these FIlaboratory bias.
Each of the three samples may then be plotted on a graph of D47versus 1000ln(a), the latter being derived from the d18O composi-tions of the carbonate material and of fluid inclusions (Fig. 11). Inthis 2D space, carbonate precipitated at thermodynamic equilib-rium would plot along the “equilibrium line”, defined by the cali-bration functions of Kim and O’Neil (1997) and Ghosh et al. (2006).This is clearly not the case for the three Vil-car-1 samples, which allplot below the equilibrium line. Assuming, as stated above, thateach sample was offset from its T-dependent location along theequilibrium line along a KIF vector whose length is a prioriunknown and whose slope may vary through time according to thestatistical distribution observed in modern Villars speleothems(Fig. 9), one may geometrically project each sample on the equi-librium line, thus estimating a KIF-corrected paleo-temperature ofcrystallization (Guo et al., submitted for publication).

Fig. 11. In the 2D space defined by 1000ln(a) and D47 values, carbonate formed atthermodynamic equilibrium would plot along a specific line defined by existingtemperature equations (Kim and O’Neil, 1997; Ghosh et al., 2006). Because of rapidrates of CO2 degassing and carbonate precipitation, KIF effects cause the three Vil-car-1samples to plot below the equilibrium line. Using modern analyses to constrain theslope of past kinetic fractionation vectors, each sample may be projected back onto theequilibrium line to its original crystallization temperature. Note, the overall consis-tency of relative temperature variations between the 2 datasets, which allows toconstrain the warming between Late MIS6 and the last interglacial optimumto þ 13.9 � 5.2 �C (2s). Grey ellipses and numerical uncertainties all correspond to 2sconfidence limits.
Fig. 10. Relative positions of clumped isotope sampling locations (black arrows) andfluid inclusion data (red and blue markers). The stars correspond to the interpolatedvalue deduced from bracketing measurements, at the exact depth of a clumped isotopemeasurement. (For interpretation of the references to colour in this figure legend, thereader is referred to the web version of this article).
K. Wainer et al. / Quaternary Science Reviews 30 (2011) 130e146142
Temperature uncertainties in Fig. 11 account for: (a) externalprecision limits on D47; (b) a conservatively estimated uncertaintyof 0.5& for fluid inclusion d18O values; (c) the standard deviationobserved in the slope of modern KIF vectors. Note that we do notassume that the KIF vector retains strictly the same slope throughtime: as stated above, that slope is allowed to vary within the limitsestimated using modern observations. In spite of the incorporationof these significant sources of uncertainty, the formal standarderror on temperature does not exceed 2 �C, which is not signifi-cantly worse than existing continental temperature reconstruc-tions from other methods. Moreover, the dominant component inthe variance of our T estimates is the uncertainty in the d18Ow,which accounts for 80e85% of total variance (depending of whichlaboratory’s FI data is used), to be compared with 11e16% from theKIF correlation and only 4e5% from D47 uncertainties. Futureattempts at this kind of “speleo-thermometry” may likely benefitfrom improved precision/accuracy in the oxygen spectrometry offluid micro-inclusions.
The corrected fluid inclusion-clumped isotope temperaturesrange between 5.8 or 8.1 �C (�1.9 �C at 1s) at late MIS6 to 19 or 22.7(�1.9 �C at 1s) for theMIS5 optimum (temperatures fromUI and VUfluid inclusions data, respectively; uncertainties are given at 2 s-level in Fig. 11). Using data from VU yields reconstructed temper-atures warmer by 2.4e4.2 �C than those derived from the Innsbrucklaboratory. We suspect that this is the consequence of a systematicbias in the VU fluid inclusion measurements, because the resultingd18O and dD values are generally less consistent with the modernlocal meteoric water line, than the UI data (Fig. 7). Reliably esti-mating absolute cave paleotemperatures will thus requireimproving our understanding of (and ability to correct for) inter-laboratory differences in fluid inclusion analysis, which is the focusof an ongoing inter-laboratory calibration effort.
For the time being, although this issue remains somewhat ofa limiting factor concerning absolute paleotemperatures, inter-laboratory differences appear by contrast to have little effect on thetemperature increase between the end of MIS6 and the LastInterglacial optimum. Using FI data from Innsbruck or Amsterdamrespectively yield DT[6e5] estimates of 13.2 � 2.6 and 14.6 � 2.6 �C(1s) (Fig. 11).
c) Comparison with independent constraints
Compared to paleotemperatures derived from d18O using clas-sical equilibrium fractionation functions (5.1.1 b), our clumpedisotope/fluid inclusion reconstructions yield temperatures

K. Wainer et al. / Quaternary Science Reviews 30 (2011) 130e146 143
consistent with recently published independent estimates. Forinstance, pollen data from Monticchio Maar indicates a maximumamplitude ofw12 �C between end of MIS6 and the Last Interglacialoptimum (Allen and Huntley, 2009). Noble gas fluid inclusionanalyses from a western Germany stalagmite yield 9 � 5 �C (1s) asa lower bound for temperature rise across Termination II (Scholzet al., 2009). Finally, as shown in Fig. 6, this period also sawstrong (w13 �C) warming in North Atlantic and Western Mediter-ranean surface waters (Kandiano et al., 2004; Martrat et al., 2004;Sánchez Goñi et al., 2008), and the terrestrial amplitude ofglacial/interglacial temperature changes is generally accepted to belarger than that of SST.
The amplitude of the temperature fluctuation in a continentalsetting in the region at Termination I between the extremes isassumed to be about 7e13 �C (Allen et al., 1999; McGarry et al.,2004; Wu et al., 2007; Affek et al., 2008) which is consistent withthe amplitude of this study as well.
5.2. Drip water isotopic composition relative constancy: a tentativeexplanation
One of our most striking results is the drip water d18O constancywithin 1& (2s) from early MIS6 to the Last Interglacial d18Ooptimum. This was unexpected as the associated d18Oc decrease by5& and these phenomena occur synchronously to a first orderclimatic transition. The VU d18Ow average (�6.4&, Table 2) isconsistent with the values measured for modern drip water in theVillars cave (Table 2) and with the d18Ow of water trapped in macroinclusions of the MIS 5c (w101 ka) portion of the Vil24 stalagmitefrom Villars Cave (‑5.9 to ‑6.1 � 0.2& (1s), (Genty et al., 2002)).Thus, it is likely that drip water oxygen isotopic composition did notshow significant changes during the last 150 ka. We investigatedthis observation for the Termination II interval.
As it is currently found in the literature, drip water isotopiccomposition depends on several factors: (i) isotopic composition ofthe vapor source, (ii) storm tracks, (iii) air temperature, (iv) rainfallamount effect. There is no particular reason for a change of vaporsource or storm track between late MIS6 and the Last Interglacial.Besides, we have demonstrated that rainfall amount effect do notplay a dominant role in the rain oxygen isotopic depletion.
From the literature, we know that: (1) During the last deglaci-ation the ocean isotopic composition decreased by 1& (Adkins andSchrag, 2001). We will assume the same amplitude of change forTII; (2) The rain oxygen isotopic composition, d18OR versus airtemperature gradient is predicted at 0.58&/�C for mid-latitudes(Rozanski et al., 1993). In France, the Thonon-les-bains (46�220N,6�28’E, 385 masl) data set between 1963 and 1997 gives a gradientof 0.37&/�C and 0.20&/�C for the Brest (48�36’N; 4�57’W, 80 masl)data set between 1996 and 2000 (IAEA GNIP data). Based on theinterpretation of modern rainfall composition and air temperaturedata accumulated between 1996 and 2006 at Le Mas meteorolog-ical station (w60 km SE from Villars), we deduced a seasonalrelationship between rainfall oxygen isotopic composition (d18OR)and surface air temperature: d18OR (& SMOW) ¼ 0.24 T(�C) e 9.24(R2 ¼ 0.89) (Genty, 2008 and this study). The gradient (w0.24&/�C)is consistent with what can be found in previously quoted refer-ences and consists of an absolute value close to fractionation factorof the equilibrium formula but with an opposite sign.
We have calculated rainfall oxygen isotopic composition (d18OR)for the two considered periods and we have checked if the differentimpacts of each factor could cancel out each other during thedeglaciation: (1) We have used the local seasonal relationshipabove and the monthly temperature estimates provided by thecoupled model IPSL-CM4 (Marti et al., 2005, submitted forpublication), a 3D model atmosphere-ocean-continent and sea ice
at 126 ka for the Villars cave geographic coordinates, to deducemonthly d18OR during the Last Interglacial (collaboration withP. Braconnot and E. Mosquet); (2) Assuming the difference of meanannual temperature between the end of MIS6 and the Last Inter-glacial d18Oc optimum resulting from this study (DT[6‑5] ¼ 14�C),we calculated the late MIS6 monthly temperature (i.e., for JanuaryTjan126ka-DT[6e5] ¼ TjanMIS6) and monthly rainfall d18OR using thelocal seasonal relationship again; (3) From our model, a tempera-ture rise of w14 �C between the end of MIS 6 and MIS5 optimumsuggests eight months of seasonal freezing that prevent water frominfiltrating into the karst during late MIS6. This is consistent withsoil structure observed on the studied area (Van Vliet-Lanoë, 1988and personal communication). By analogy with recent observa-tions for a northern Swedish cave (Sundqvist et al., 2007), weassumed negligible infiltrationwhen the temperature of the monthwas negative and a rainfall partition similar to what is predicted bythe IPSL model at 126 ka which is quite similar as today.
Suppressing the eight months freezing involves a depletion ofthe drip water d18Ow of w�2.7& . The vapor source d18Oseawaterchange between a glacial and interglacial period leads to a deple-tion of w�1& and the air temperature increase would correspondto an enrichment of w3.4& with a gradient of 0.24&/�C. Conse-quently, the different effects broadly cancel out each other(Supplementary material Figure C). Details for this calculations arediscussed in (Wainer, 2009). In order to be more precise, it wouldbe interesting to investigate the rainfall partition along the year asit was attempted by (Meyer et al., 2008), but data to constrain thisparameter are lacking.
As the results of the different effects of the factors influencing thed18Ow that counteract each other, drip water d18Ow remains more orless constant during the TII. This suggests that the Vil-car-1 d18Oc TIIshift depends mostly on temperature rise. This appears to berestricted to Termination II. Indeed, no significant shift is observedin Vil-car-1 d18Oc record for Termination I. A warming amplitudethresholdmay be involved butfluid inclusion data should be done inthe TI part of the core and also on other TII speleothems of the sameregion in order to confirm this assumption.
5.3. Isotopic and geochemical patterns at the MIS6-MIS5 transition
According to the agemodel the penultimate glacial maximum inVil-car-1 core corresponds to the d63.5 cm/top discontinuity, afterwhich deposition of calcite resumes (Figs. 2 and 6).
From the discontinuity d63.5 cm/top up to w44.7 cm/top, thecalcite appears dark, dense and compact (Fig. 2). The first ageobtained after this discontinuity is 148.3 � 4.9 ka. High values ofboth d13Cc and d18Oc are observed between w148.3 to w145.8 ka(63.5e62.9 cm/top), coinciding with relatively high Mg and Srconcentrations (Fig. 4). One possible explanation is that calcitedeposition occurred under cold conditions and/or was associatedwith prior calcite precipitation in the epikarst which can cause suchhigh values (Fairchild et al., 2000). It will be necessary to check thislatter possibility by supplementary trace element measurements inorder to establish if a statistical correlation exists. The first warmingfrom 62.9 cm/top (145.4 � 2.8 ka), particularly visible for the d13Csignal (depletion of 3.2&) and somewhat subdued on the d18Ocprofile (depletion of 2&), is associated with decreasing Mg and Srcontents.
The warming phase is followed by the two-step deglaciation.The reversal is centred atw129.8 ka on the d18Oc curve and 128.9 kafor d13C curve (Fig. 6). A similar pattern consisting of a first warmingepisode followed by a two-step deglaciation is observed in thed18Oc profile from Soreq cave (Bar-Matthews et al., 1999, 2003), inM23414 and MD04-2845 Atlantic SST records (Kandiano et al.,
K. Wainer et al. / Quaternary Science Reviews 30 (2011) 130e146144
2004; Sánchez Goñi et al., 2008) and in the d18O benthic record offthe Iberian margin (Gouzy et al., 2004) (Figs. 1 and 6).
According to the age model, this feature can be tentativelyassigned to the Zeifen/Kattegat (Zeifen/post-Zeifen) oscillationobserved in other contemporaneous terrestrial archives (Gruger,1979; Seidenkrantz et al., 1996; Brauer et al., 2007; Sánchez Goñi,2007). This cooling is recorded by a decrease of pollen abundancein the Lago Grande di Monticchio between 128.2 and 127.9 ka.Assuming that the d18Oc variations in the Vil-car-1 core areprimarily controlled by the temperature, this d18Oc reversal back topre-deglaciation values is consistent with the observation in thenorthern Atlantic of ice-rafted debris (IRD) deposits and an increasein both benthic and planktonic d18O during Heinrich event H11(Lototskaya and Ganssen, 1999; Gouzy et al., 2004). The icebergdischarge linked to this event, synchronous with the post-Zeifenepisode, likely caused a significant cooling in Europe and specifi-cally at Villars sitewhich is close to the Atlantic Ocean. This reversalis recorded in a neighbour karstic site as well, Bourgeois-DelaunayCave (Couchoud et al., 2009).
The observation that this reversal is less pronounced in the d13Ccthan in the d18Oc record can be explained by the short duration ofthis event. Despite the significant uncertainties of our dating resultsin this part of the core, it appears likely that the duration of thisepisode did not exceed w200 years; this is consistent with itsestimated duration in the Monticchio record (250 years; Braueret al., 2007). The duration of this cooling event was sufficient forthe thermic wave to reach the cave but was not long enough tocompletely annihilate the vegetation but likely reduced its activity.It is interesting to note that no petrographic change is associated tothe d18Oc and d13Cc drops (Fig. 2).
Regular wiggles of w0.8& in amplitude are visible on the d18Ocdescending plateau. It is much less evident in the d13Cc profile(Figs. 2 and 4). To our knowledge, this cyclicity has not beendetected anywhere else, probably because of a lack of records withsufficiently high resolution for this period. According to our agemodel, these regular cycles have a centennial frequency. Theircause is not yet explained.
6. Conclusions
The Vil-car-1 record is the first speleothem record from Villarscave that extends back sufficiently (w180 ka) to record thepenultimate deglaciation: the transition between Late MIS 6 andthe Last Interglacial “optimum” is prominently recorded as a w5&depletion event affecting calcite d18O values.
Investigation of the potential causes for this isotopic depletionyielded several important results. The oxygen isotope compositionof paleodripwater trapped in fluid inclusions before, during andafter the transition remains constant (within 1&) across thepenultimate deglaciation. This observation was independentlyconfirmed by analyses from two different laboratories. This impliesthat isotopic effects related to the various processes that areexpected to affect seepage water compositions during TerminationII (changing amount of rainfall, seasonal bias in drip watercomposition due to winter freezing, etc.) cancelled each other. The5& drop in d18Oc must thus mainly be attributed to an increase incave temperature during the deglaciation (and to a lesser extent tovariation in KIF between late MIS6 and the Last Interglacialoptimum). However, using “simple” isotopic paleothermometers(d18O, D47) to estimate the absolute temperatures before and afterthis transition yielded unrealistic results, strongly suggesting thatcalcite deposition occurred in non-equilibrium conditions.
Correcting quantitatively for these isotopic disequilibria wasachieved by combining fluid inclusion d18O analyses with clumpedisotope measurements: as described by Guo et al. (submitted for
publication), modern observations can be used to constrain therelationship between kinetic fractionations affecting d18O and D47,and thus to reconstruct absolute paleotemperatures. Thesetemperatures range from 5.5 or 7.9 �C (�1.9 �C, 1s) during LateMIS6, to 18.9 or 22.9 �C (�1.9 �C, 1s) for the Last Interglacial d18Ocoptimum (using fluid inclusion data from UI and VU, respectively).Based on these results, the temperature increase between lateMIS6and the Last Interglacial d18Oc optimum can be robustly constrainedtow14 �C (with a formal standard error of 2.7 �C), which appears tobe consistent with existing independent estimates from pollen andsea-surface temperature records from Western Europe.
Combined fluid inclusion and clumped isotope analyses thusoffer a promising method to reconstruct absolute paleotemper-atures from speleothems deposited out of isotopic equilibriumwiththeir parent waters. This new approach now needs to be validatedby further studies from well-characterized cave sites.
Acknowledgements
This work was funded by the CNRS through the ANR PICCprogram and CNRS INSU programs (ECLIPSE). A significant part ofthe UeTh dating was done at the GEOTOP laboratory and SEMobservations were realised in collaboration with Eric Robin usingJEOL JSM 840. We thank the Villars Cave owner, the Versaveaufamily, O. Mestre for original meteorological data, P. Braconnot andE. Mosquet for the model IPSL-CM4 outputs, F. Mansouri,H. Rebaubier, F. Dewilde for their help with the stable isotopes andtrace elements measurements. We are grateful to H. Affek and W.Guo for many hours of fruitful discussion about D47 and equilib-rium, as well as D. Hoffman, F. Chabaux, N. Frank, B. Kiefel andV. Plagnes for fruitful discussions about U-series and V. Masson-Delmotte, M.F. Sanchez-Goni and E. Michel for the variousexchanges we had about Last Interglacial period and all the scien-tists whose work appear in this paper for the availability of theirdata. We are grateful to H. Affek and anonymous reviewer whohelped to improve significantly the manuscript. This is LSCEcontribution n�4335.
Appendix
Supplementary data related to this article can be found online atdoi:10.1016/j.quascirev.2010.07.004
References
Adkins, J.F., Schrag, D.P., 2001. Pore fluid constraints on deep ocean temperature andsalinity during the last glacial maximum. Geophys. Res. Lett. 28, 771e774.
Affek, H.P., Guo, W., Daeron, M., Eiler, J.M., 2008. ‘Clumped isotopes’ in speleothemcarbonate and atmospheric CO2-is there a kinetic isotope effect? Geochim.Cosmochim. Acta 72 A6eA6.
Allen, J.R.M., Brandt, U., Brauer, A., Hubberten, H.-W., Huntley, B., Keller, J.,Kraml, M., Mackensen, A., Mingram, J., Negendank, J.F.W., Nowaczyk, N.R.,Oberhänsli, H., Watts, W.A., Wulf, S., Zolitschka, B., 1999. Rapid environmentalchanges in southern Europe during the last glacial period. Nature 400, 740e743.
Allen, J.R.M., Huntley, B., 2009. Last Interglacial palaeovegetation, palaeoenviron-ments and chronology: a new record from Lago Grande di Monticchio, southernItaly. Quaternary Sci. Rev. 28, 1521e1538.
Almogi-Labin, A., Bar-Matthews, M., Shriki, D., Kolosovsky, E., Paterne, M.,Schilman, B., Ayalon, A., Aizenshtat, Z., Matthews, A., 2009. Climatic variabilityduring the last w90 ka of the southern and northern Levantine Basin as evidentfrom marine records and speleothems. Quaternary Sci. Rev. 28, 2882e2896.
Bar-Matthews, M., Ayalon, A., Kaufman, A., Wasserburg, G.J., 1999. The EasternMediterranean paleoclimate as a reflection of regional events: Soreq cave,Israel. Earth Planet Sc Lett. 166, 85e95.
Bar-Matthews, M., Ayalon, A., Gilmour, M., Matthems, A., Hawkesworth Chris, H.,2003. Sea-Land oxygen isotopic relationships from planktonic foraminifera andspeleothems in the Eastern Mediterranean region and their implication forpaleorainfall during interglacial intervals. Geochimica Cosmochimica Acta 67,3181e3199.
Beaulieu, J.L.d., Guiot, J., Reille, M., 1991. Long Europeen pollen records and quan-titative reconstruction of the last climatic cycle. 1989. In: Goodess, C.M.,
K. Wainer et al. / Quaternary Science Reviews 30 (2011) 130e146 145
Palutikof, J.P. (Eds.), Future Climatic Change and Radioactive Waste Disposal.NIREX, Norwich, NSS/R257, pp. 116e136.
Begemann, F., Ludwig, K.R., Lugmair, G.W., Min, K., Nyquist, L.E., Patchett, P.J.,Renne, P.R., Shih, C.Y., Villa, I.M., Walker, R.J., 2001. Call for an improved set ofdecay constants for geochronological use. Geochim Cosmochim Acta 65,111e121.
Borsato, A., Frisia, S., Fairchild, I.J., Somogyi, A., Susini, J., 2007. Trace elementdistribution in annual stalagmite laminae mapped by micrometer-resolutionX-ray fluorescence: implications for incorporation of environmentally signifi-cant species. Geochim Cosmochim Ac 71, 1494e1512.
Brauer, A., Allen, J.R.M., Mingram, J., Dulski, P., Wulf, S., Huntley, B., 2007. Evidencefor last interglacial chronology and environmental change from SouthernEurope. P Natl. Acad. Sci. USA 104, 450e455.
van Calsteren, P., Schwieters, J.B., 1995. Performance of a thermal ionization mass-spectrometer with a deceleration lens system and post-deceleration detectorselection. Int. J. Mass Spectrom. Ion Process. 146, 119e129.
Cheddadi, R., Mamakowa, K., Guiot, J., de Beaulieu, J.L., Reille, M., Andrieu, V.,Granoszewski, W., Peyron, O., 1998. Was the climate of the Eemian stable?A quantitative climate reconstruction from seven European pollen records.Palaeogeography, Palaeoclimatology, Palaeoecology 143, 73e85.
Cheddadi, R., de Beaulieu, J.L., Jouzel, J., Andrieu-Ponel, V., Laurent, J.M., Reille, M.,Raynaud, D., Bar-Hen, A., 2005. Similarity of vegetation dynamics duringinterglacial periods. P Natl. Acad. Sci. USA 102, 13939e13943.
Cheng, H., Edwards, R.L., Hoff, J., Gallup, C.D., Richards, D.A., Asmerom, Y., 2000. Thehalf-lives of uranium-234 and thorium-230. Chem. Geol. 169, 17e33.
Cheng, H., Edwards, R.L., Wan, Y.J., Ko, X.G., Ming, Y.F., Kelly, M.J., Wang, X.F.,Gallup, C.D., Liu, W.G., 2006. A penultimate glacial monsoon record from HuluCave and two-phase glacial terminations. Geology 34, 217e220.
Cleroux, C., Cortijo, E., Anand, P., Labeyrie, L., Bassinot, F., Caillon, N., Duplessy, J.C.,2008. Mg/Ca and Sr/Ca ratios in planktonic foraminifera: Proxies for upperwater column temperature reconstruction. Paleoceanography 23.
Combourieu-Nebout, N., Turon, J.L., Zahn, R., Capotondi, L., Londeix, L., Pahnke, K.,2002. Enhanced aridity and atmospheric high-pressure stability over thewestern Mediterranean during the North Atlantic cold events of the past 50 k.y.Geology 30, 863e866.
Coplen, T.B., 2007. Calibration of the calcite-water oxygen-isotope geothermometerat Devils Hole, Nevada, a natural laboratory. Geochim Cosmochim Ac 71,3948e3957.
Couchoud, I., Genty, D., Hoffmann, D., Drysdale, R., Blamart, D., 2009. Millennial-scale climate variability during the Last Interglacial recorded in a speleothemfrom south-western France. Quaternary Sci. Rev. 28, 3263e3274.
Craig, H., 1965. The measurement of oxygen isotope paleotemperatures. In:Tongiorgi, E. (Ed.), Stable Isotopes in Oceanographic Studies and Paleotemper-atures. Consiglio Nazionale delle Ricerche Laboratorio di Geologia Nucleare,Pisa, pp. 166e182.
Daëron, M., Guo, W., Eiler, J., Genty, K., Blamart, D., Boch, R., Drysdale, R.N., Maire, R.,Wainer, K., Zanchetta, G. 13C 18O clumping in speleothems: Observations fromnatural caves and precipitation experiments, submitted for publication.
Dorale, J.A., Edwards, R.L., Onac, B.P., 2002. Stable isotopes as environmental indi-cators in speleothems. In: Daoxian, Y., Cheng, Z. (Eds.), Karst Processes and theCarbon Cycle, Final Report of IGCP379. Geological Publishing House, Beijing,China, pp. 107e120.
Drysdale, R.N., Zanchetta, G., Hellstrom, J.C., Fallick, A.E., Zhao, J.X., 2005. Stalagmiteevidence for the onset of the Last Interglacial in southern Europe at 129 � 1 ka.Geophys. Res. Lett. 32.
Drysdale, R.N., Zanchetta, G., Hellstrom, J.C., Fallick, A.E., McDonald, J., Cartwright, I.,2007. Stalagmite evidence for the precise timing of North Atlantic cold eventsduring the early last glacial. Geology 35, 77e80.
Drysdale, R.N., Hellstrom, J., Zanchetta, G., Fallick, A.E., Sánchez Goñi, M.F.,Couchoud, I., McDonald, J., Maas, R., Lohmann, G., Isola, I., 2009. Evidence forobliquity forcing of glacial Termination II. Science 325, 1527e1531.
Dublyansky, Y.V., Spötl, C., 2009. Hydrogen and oxygen isotopes of water frominclusions in minerals: design of a new crushing system and on-line contin-uous-flow isotope ratio mass spectrometric analysis. Rapid Commun. MassSpectrom. 23, 2605e2613.
Edwards, R.L., Chen, J.H., Wasserburg, G.J., 1987. 238Ue234Ue230The232Th system-atics and the precise measurement of time over the past 500,000 years. EarthPlanet Sc Lett. 81, 175e192.
Eiler, J.M., 2007. “Clumped-isotope” geochemistrye The studyof naturally-occurring,multiply-substituted isotopologues. Earth Planetary Sci. Lett. 262, 309e327.
Epstein, S., Buchsbaum, R., Lowenstam, H., Urey, H., 1953. Revised carbonate-waterisotopic temperature scale. Bull. Geol. Soc. America 64, 1315e1326.
Fairchild, I.J., Borsato, A., Tooth, A.F., Frisia, S., Hawkesworth, C.J., Huang, Y.M.,McDermott, F., Spiro, B., 2000. Controls on trace element (SreMg) compositionsof carbonate cave waters: implications for speleothem climatic records. Chem.Geol. 166, 255e269.
Fairchild, I.J., Smith, C.L., Baker, A., Fuller, L., Spotl, C., Mattey, D., McDermott, F.,Eimp, 2006. Modification and preservation of environmental signals in spe-leothems. Earth-Science Rev. 75, 105e153.
Friedman, I., O’Neil, J.R., 1977. Compilation of stable isotope fractionnation factors ofgeochemical interest. In: Fleisher, M. (Ed.), Data of Geochemistry. U.S. Geolog-ical Survey Professional Paper, 440.
Genty, D., 2008. Paleoclimate Research in Villars cave (Dordogne, SW-France). Int. J.Speleology 37, 173e191.
Genty, D., Baker, A., Barnes, W., 1997. Comparaison entre les lamines luminescenteset les lamines visibles annuelles de stalagmites. Comptes Rendus de l’Académiedes Sciences de Paris. Sci. de la terre des planètes 325, 193e200.
Genty, D., Baker, A., Massault, M., Proctor, C., Gilmour, M., Pons-Branchu, E.,Hamelin, B., 2001. Dead carbon in stalagmites: carbonate bedrock paleo-dissolution vs. ageing of soil organic matter. Implication for 13C variation inspeleothems. Geochim Cosmochim Ac 65, 3443e3457.
Genty, D., Plagnes, V., Causse, C., Cattani, O., Stievenard, M., Falourd, S., Blamart, D.,Ouahdi, R., Van-Exter, S., 2002. Fossil water in large stalagmite voids as a toolfor paleoprecipitation stable isotope composition reconstitution and paleo-temperature calculation. Chem. Geol. 184, 83e95.
Genty, D., Blamart, D., Ouahdi, R., Gilmour, M., Baker, A., Jouzel, J., Van-Exter, S.,2003. Precise dating of Dansgaard-Oeschger climate oscillations in westernEurope from stalagmite data. Nature 421, 833e837.
Genty, D., Combourieu -Nebout, N., Hatte, C., Blamart, D., Ghaleb, B., Isabello, L.,2005. Rapid climatic changes of the last 90 kyr recorded on the Europeancontinent. Cr Geosci. 337, 970e982.
Genty, D., Blamart, D., Ghaleb, B., Plagnes, V., Causse, C., Bakalowicz, M., Zouari, K.,Chkir, N., Hellstrom, J., Wainer, K., Bourges, F., 2006. Timing and dynamics of thelast deglaciation from European and North African delta C-13 stalagmiteprofiles e comparison with Chinese and South Hemisphere stalagmites.Quaternary Sci. Rev. 25, 2118e2142.
Genty, D., Massault, M., 1997. Bomb 14C recorded in laminated speleothems:calculation of dead carbon proportion. Radiocarbon 39, 33e48.
Genty, D., Massault, M., 1999. Carbon transfer dynamics from bomb-14C and d13Ctime series of a laminated stalagmite from SW France e Modelling andcomparison with other stalagmite records. Geochim Cosmochim Ac 63,1537e1548.
Genty, D., Combourieu-Nebou, N., Peyron, O., Blamart, D., Wainer, K., Mansuri, F.,Ghaleb, B., Isabello, L., Dormoy, I., von Grafenstein, U., Bonelli, S., Landais, A.,Brauer, A., 2010. Isotopic characterization of rapid climatic events during OIS3and OIS4 in Villars Cave stalagmites (SW-France) and correlation with Atlanticand Mediterranean pollen records. Quaternary Sci. Rev. 29, 2799e2820.
Ghosh, P., Adkins, J., Affek, H., Balta, B., Guo, W.F., Schauble, E.A., Schrag, D.,Eiler, J.M., 2006. C-13-O-18 bonds in carbonate minerals: a new kind ofpaleothermometer. Geochim Cosmochim Ac 70, 1439e1456.
Gouzy, A., Malaizé, B., Pujol, C., Charlier, K., 2004. Climatic “pause” during Termi-nation II identified in shallow and intermediate waters off the Iberian margin.Quaternary Sci. Rev. 23, 1523e1528.
Govin, A., Michel, E., Labeyrie, L., Waelbroeck, C., Dewilde, F., Jansen, E., 2009.Evidence for northward expansion of Antarctic Bottom Water mass in theSouthern Ocean during the last glacial inception. Paleoceanography 24.
Greaves, M., Caillon, N., Rebaubier, H., Bartoli, G., Bohaty, S., Cacho, I., Clarke, L.,Cooper, M., Daunt, C., Delaney, M., deMenocal, P., Dutton, A., Eggins, S.,Elderfield, H., Garbe-Schoenberg, D., Goddard, E., Green, D., Groeneveld, J.,Hastings, D., Hathorne, E., Kimoto, K., Klinkhammer, G., Labeyrie, L., Lea, D.W.,Marchitto, T., Martinez-Boti, M.A., Mortyn, P.G., Ni, Y., Nuernberg, D., Paradis, G.,Pena, L., Quinn, T., Rosenthal, Y., Russell, A., Sagawa, T., Sosdian, S., Stott, L.,Tachikawa, K., Tappa, E., Thunell, R., Wilson, P.A., 2008. Interlaboratorycomparison study of calibration standards for foraminiferal Mg/Ca thermom-etry. Geochem. Geophys. Geosystems 9.
Gruger, E., 1979. Grande Pile Peat Bog e Continuous pollen record for the last140,000 Years e Comment. Quaternary Res. 12, 152e153.
Guo, W., Daeron, M., Niles, P., Genty, D., Kim, S.T., Vonhof, H., Affek, H., Wainer, K.,Blamart, D., Eiler, J., 2008. C-13-O-18 bonds in dissolved inorganic carbon:implications for carbonate clumped isotope thermometry. Geochim CosmochimAc 72 A336eA336.
Guo, W., Daëron, M., Niles, P., Goddard, W.A., Eiler, J.M. Isotopic fractionationsassociated with degassing of CO2 from aqueous solutions: implications forcarbonate clumped isotope thermometry, submitted for publication.
Hendy, C.H., 1971. The isotopic geochemistry of speleothems e I. The calculation ofthe effects of different modes of formation on the isotopic composition ofspeleothems and their applicability as palaeoclimatic indicators. GeochimCosmochim Ac 35, 801e824.
Kandiano, E.S., Bauch, H.A., Müller, A., 2004. Sea surface temperature variability inthe North Atlantic during the last two glacial-interglacial cycles: comparison offaunal, oxygen isotopic, and Mg/Ca-derived records. Palaeogeography, Palae-oclimatology, Palaeoecology 204, 145e164.
Kim, S.T., O’Neil, J.R., 1997. Equilibrium and nonequilibrium oxygen isotope effects insynthetic carbonates. Geochim Cosmochim Ac 61, 3461e3475.
Kühl, N., Litt, T., 2007. Recontruction of Eemian temperature based on the pollenrecord of site Gröbern. Germany. Quaternary Sci. Rev. 26, 3311e3317.
Lototskaya, A., Ganssen, G.M., 1999. The structure of termination II (penultimatedeglaciation and Eemian) in north Atlantic. Quaternary Sci. Rev. 18,1641e1654.
Ludwig, K.R., 2003. User’s Manual for Isoplot 3. In: Berkeley Geochron. Ctr. Spec.Pub, vol. 4, 77 pp.
Lundberg, J., Ford, D.C., 1994. Late Pleistocene sea-level change in the Bahamas frommass-spectrometric U-Series dating of Submerged speleothem. Quaternary Sci.Rev. 13, 1e14.
Marshall, D., Ghaleb, B., Countess, R., Gabities, J., 2009. Preliminary paleoclimatereconstruction based on a 12,500 year old speleothem from Vancouver Island,Canada: stable isotopes and UeTh disequilibrium dating. Quaternary Sci. Rev.28, 2507e2513.
K. Wainer et al. / Quaternary Science Reviews 30 (2011) 130e146146
Marti, O., Braconnot, P., Bellier, J., Benshila, R., Bony, S., Brockmann, P., Cadule, P.,Caubel, A., Denvil, S., Dufresne, J.-L., Fairhead, L., Filiberti, M.-A., Foujols, M.-A.,Fichefet, T., Friedlingstein, P., Goosse, H., Grandpeix, J.-Y., Hourdin, F., Krinner, G.,Lévy, C., Madec, G., Musat, I., de Noblet, N., Polcher, J., Talandier, C., 2005. TheNew IPSL Climate SystemModel: IPSL-CM4. Report No. 26. Institut Pierre SimonLaplace, Paris.
Marti, O., Braconnot, P., Dufresne, J.-L., Bellier, J., Benshila, R., Bony, S., Brockmann,P., Cadule, P., Caubel, A., Codron, F., de Noblet, N., Denvil, S., Fairhead, L.,Fichefet, T., Foujols, M.-A., Friedlingstein, P., Goosse, H., Grandpeix, J.-Y.,Guilyardi, E., Hourdin, F., Krinner, G., Lévy, C., Madec, G., Mignot, J., Musat, I.,Swingedouw, D., Talandier, C. Key features of the IPSL ocean atmospheremodel and its sensitivity to atmospheric resolution. Clim Dynam, submittedfor publication.
Martrat, B., Grimalt, J.O., Lopez-Martinez, C., Cacho, I., Sierro, F.J., Flores, J.A., Zahn, R.,Canals, M., Curtis, J.H., Hodell, D.A., 2004. Abrupt temperature changes in theWestern Mediterranean over the past 250,000 years. Science 306, 1762e1765.
Martrat, B., Grimalt, J.O., Shackleton, N.J., de Abreu, L., Hutterli, M.A., Stocker, T.F.,2007. Four climate cycles of recurring deep and surface water destabilizationson the Iberian margin. Science 317, 502e507.
Matthews, A., Ayalon, A., Bar-Matthews, M., 2000. D/H ratios of fluid inclusions ofSoreq cave (Israel) speleothems as a guide to the Eastern MediterraneanMeteoric Line. Chem. Geol. 166, 183e191.
McCrea, J., 1950. On the isotopic chemistry of carbonates and a paleotemperaturescale. J. Chem. Phys. 18, 849e857.
McDermott, F., Elliott, T.R., Vancalsteren, P., Hawkesworth, C.J., 1993. Measurementof Th-230/Th-232 ratios in Young Volcanic-Rocks by single-sector thermalionization mass-spectrometry. Chem. Geol. 103, 283e292.
McGarry, S., Bar-Matthews, M., Matthews, A., Vaks, A., Schilman, B., Ayalon, A.,2004. Constraints on hydrological and paleotemperature variations in theEasten Mediterranean region in the last 140 ka given by the dD values of spe-leothem fluid inclusions. Quaternary Sci. Rev. 23, 919e934.
Meyer,M.C., Spotl, C.,Mangini, A., 2008. Thedemiseof the Last Interglacial recorded inisotopically dated speleothems from the Alps. Quaternary Sci. Rev. 27, 476e496.
NorthGRIPmembers, 2004. High resolution climate record of the Northern hemi-sphere reaching into the Last Interglacial period. Nature 43, 147e151.
O’Neil, J.R., Clayton, R.N., Mayeda, T.K., 1969. Oxygen isotope fractionation in diva-lent metal carbonates. J. Chem. Phys. 51, 5547e5558.
Plagnes, V., Causse, C., Genty, D., Paterne, M., Blamart, D., 2002. A discontinuousclimatic record from 187 to 74 ka from a speleothem of the Clamouse Cave(south of France). Earth Planet Sc Lett. 201, 87e103.
Rousseau, D.D., Hatte, C., Guiot, J., Duzer, D., Schevin, P., Kukla, G., 2006. Recon-struction of the Grande Pile Eemian using inverse modeling of biomes and deltaC-13. Quaternary Sci. Rev. 25, 2806e2819.
Rozanski, K., Araguas-Araguas, L., Gonfiantini, R., 1993. Isotopic patterns in modernGlobal precipitation, in climate change in continental isotopic records. Geophys.Monogr. 78, 1e36.
Sánchez Goñi, M.F., 2007. Introduction to climate and vegetation in Europe duringMIS 5. In: Sirocko, F., Clausen, M., Sánchez Goñi, M.F., Litt, T. (Eds.), The Climateof Past Interglacials. Elsevier, Amsterdam, pp. 197e205.
Sánchez Goñi, M.F., Loutre, M.F., Crucifx, M., Peyron, O., Santos, L., Duprat, J.,Malaize, B., Turon, J.L., Peypouquet, J.P., 2005. Increasing vegetation and climategradient in Western Europe over the Last Glacial Inception (122e110 ka): data-model comparison. Earth Planet Sc Lett. 231, 111e130.
Sánchez Goñi, M.F., Landais, A., Fletcher, W.J., Naughton, F., Desprat, S., Duprat, J.,2008. Contrasting impacts of Dansgaard-Oeschger events over a westernEuropean latitudinal transect modulated by orbital parameters. Quaternary Sci.Rev. 27, 1136e1151.
Scholz, D., Kluge, T., Marx, T., Spötl, C., Schröder-Ritzraun, A., Riechelmann, D.,Aeschbach-Hertig, W., Mangini, A., Richter, D.K., Niggemann, S., 2009. Temporal
gradient between temperature and the oxygen isotope value of precipitation inthe realy Eemian reconstructed from a sepleothem in western Germany. Geo-phys. Res. 11 abstract.
Schwarcz, H.P., 1986. Geochronology and isotopic geochemistry of speleothems. In:Fritz, P., Fontes, G. (Eds.), Handbook of Environmental Isotope Geochemistry.Elsevier, Amsterdam, pp. 271e303.
Seidenkrantz, M.S., Bornmalm, L., Johnsen, S.J., Knudsen, K.L., Kuijpers, A.,Lauritzen, S.E., Leroy, S.A.G., Mergeai, I., Schweger, C., Van Vliet-Lanoë, B., 1996.Two-step deglaciation at the oxygene isotope stage 6/5e transition: the Zeifen-Kattegat climate oscillation. Quaternary Sci. Rev. 15, 63e75.
Shackleton, N.J., Chapman, M., Sanchez Goñi, M.F., Pailler, D., Lancelot, Y., 2002. Theclassic marine isotope substage 5e. Quaternary Res. 58, 14e16.
Sharp, Z.D., Atudorei, V., Durakiewicz, T., 2001. A rapid method for determination ofhydrogen and oxygen isotope ratios from water and hydrous minerals. Chem.Geol. 178, 197e210.
Sundqvist, H.S., Seibert, J., Holmgren, K., 2007. Understanding conditions behindspeleothem formation in Korallgrottan, northwestern Sweden. J. Hydrol 347,13e22.
Turner, S., van Calsteren, P., Vigier, N., Thomas, L., 2001. Determination of thoriumand uranium isotope ratios in low-concentration geological materials usinga fixed multi-collector-ICP-MS. J. Anal. At. Spectrom. 16, 612e615.
Vaks, A., Bar-Matthews, M., Ayalon, A., Matthews, A., Frumkin, A., Dayan, U.,Halicz, L., Almogi-Labin, A., Schilman, B., 2006. Paleoclimate and location of theborder between Mediterranean climate region and the Saharo-Arabian Desertas revealed by speleothems from the northern Negev Desert, Israel. Earth PlanetSc Lett. 249, 384e399.
Van Vliet-Lanoe, B., 1988. Des traces de glace de ségrégation dans la grotte deRemouchamps (Belgique): conséquences en ce qui concerne la sédimentationet la paléoclimatologie. Ann. de la Société Géologique de Belgique 111.
Verheyden, S., 2001. Speleothems as Palaeoclimatic Archives. Vrije Universiteit,Brussel, p. 131.
Vimeux, F., Cuffey, K.M., Jouzel, J., 2002. New insights into Southern Hemispheretemperature changes from Vostok ice cores using deuterium excess correction.Earth Planet Sc Lett. 203, 829e843.
Vogel, J.C., Kronfeld, J., 1997. Calibration of radiocarbon dates for the late Pleistoceneusing U/Th dates on stalagmites. Radiocarbon 39, 27e32.
Vonhof, H.B., van Breukelen, M.R., Postma, O., Rowe, P.J., Atkinson, T.C., Kroon, D.,2006. A continuous-flow crushing device for on-line delta H-2 analysis of fluidinclusion water in speleothems. Rapid Commun. Mass Spectrom. 20,2553e2558.
Vonhof, H.B., Atkinson, T.C., van Breukelen, M.R., Postma, O., 2007. Fluid inclusionhydrogen and oxygen isotope analysis using the “Amsterdam Device”: a prog-ress report. Geophys. Res. 9 Abstract.
Wainer, K., 2009. Reconstruction climatique des derniers 200ka à partir de l’étudeisotopique et géochimique des spéléothèmes du sud de la France. Thèse dedoctorat: Université Paris XI.
Wainer, K., Genty, D., Blamart, D., Hoffmann, D., Couchoud, I., 2009. A new stage 3millennial climatic variability record from a SW France speleothem. Palae-ogeogr Palaeocl 271, 130e139.
Wang, Y.J., Cheng, H., Edwards, R.L., Kong, X.G., Shao, X.H., Chen, S.T., Wu, J.Y.,Jiang, X.Y., Wang, X.F., An, Z.S., 2008. Millennial- and orbital-scale changes inthe East Asian monsoon over the past 224,000 years. Nature 451, 1090e1093.
Wu, H.B., Guiot, J.L., Brewer, S., Guo, Z.T., 2007. Climatic changes in Eurasia andAfrica at the last glacial maximum and mid-Holocene: reconstruction frompollen data using inverse vegetation modelling. Clim. Dynam 29, 211e229.
Yuan, D.X., Cheng, H., Edwards, R.L., Dykoski, C.A., Kelly, M.J., Zhang, M.L., Qing, J.M.,Lin, Y.S., Wang, Y.J., Wu, J.Y., Dorale, J.A., An, Z.S., Cai, Y.J., 2004. Timing, dura-tion, and transitions of the last interglacial Asian monsoon. Science 304,575e578.
Related Documents