Speleothem evidence for late Holocene climate variability and floods in Southern Greece Martin Finné a,b,c , Miryam Bar-Matthews d , Karin Holmgren a,b,c , Hanna S. Sundqvist a,b,c , Ilias Liakopoulos e , Qiong Zhang a,c a Department of Physical Geography and Quaternary Geology, Stockholm University, 106 91 Stockholm, Sweden b Navarino Environmental Observatory (NEO), Messinia, Greece c Bolin Centre for Climate Research, Stockholm University, Sweden d Geological Survey of Israel, 30 Malchei Israel Street, Jerusalem 95501, Israel e Ephorate of Palaeoanthropology and Speleology of Southern Greece, Greece abstract article info Article history: Received 9 September 2013 Available online xxxx Keywords: Mediterranean Southern Greece late Holocene Stalagmite Stable isotopes Climate variability Flooding history Hellenistic period We present stable isotope data (δ 18 O, δ 13 C) from a detrital rich stalagmite from Kapsia Cave, the Peloponnese, Greece. The cave is rich in archeological remains and there are reasons to believe that flooding of the cave has di- rectly affected humans using the cave. Using a combination of U–Th and 14 C dating to constrain a site-specific cor- rection factor for ( 232 Th/ 238 U) detrital molar ratio, a linear age model was constructed. The age model shows that the stalagmite grew during the period from ca. 950 BC to ca. AD 830. The stable oxygen record from Kapsia indi- cates cyclical changes of close to 500 yr in precipitation amount, with rapid shifts towards wetter conditions followed by slowly developing aridity. Superimposed on this signal, wetter conditions are inferred around 850, 700, 500 and 400–100 BC, and around AD 160–300 and AD 770; and driest conditions are inferred to have oc- curred around 450 BC, AD 100–150 and AD 650. Detrital horizons in the stalagmite indicate that three major floods took place in the cave at 500 BC, 70 BC and AD 450. The stable carbon isotope record reflects changes in biological activity being a result of both climate and human activities. © 2014 University of Washington. Published by Elsevier Inc. All rights reserved. Introduction Paleoclimate data from the Peloponnese peninsula in southern Greece is scarce (Finné et al., 2011). The peninsula represents an archeologically rich and relatively well explored area that could act as an important area for investigations on the past impact of climate changes on societal development. Available paleoclimate work is main- ly based on palynological studies (e.g., Kraft et al., 1980; Atherden et al., 1993; Jahns, 1993; Zangger et al., 1997; Kontopoulos and Avramidis, 2003; Urban and Fuchs, 2005; Triantaphyllou et al., 2010; Kouli, 2011). However, climate interpretation from palynological data is complex in this region due to its long history of humans altering the environment (e.g., Eastwood et al., 2007; Di Rita and Magri, 2009; Roberts et al., 2011). Limestone caves are frequently abundant and well-studied from an archeological perspective. Caves, with their well-sheltered environment, can preserve material useful, not only for archeological studies but also for paleoclimatic investigations. Provided suitable formation and preservation conditions, speleothems in caves can be precisely dated and yield high-resolution records of past variations in regional temperature, precipitation and vegetation (e.g., McDermott, 2004; Fairchild et al., 2006; Lachniet, 2009). Previous studies, incorporating paleoclimatic data from caves with archeological data, show the potential of working with this type of methods for an interdisciplinary analysis of climate–environment–society interactions (Gopher et al., 2010; Bar-Matthews and Ayalon, 2011). We initiated a study of speleothems from Kapsia Cave in the Pelo- ponnese, with the aim to reconstruct past climate variability and flooding history in a region that is well-studied regarding human histo- ry, and at the same site where archeological remains are abundant. Detrital horizons in the stalagmites from Kapsia Cave show signs of hav- ing been repeatedly flooded. While this may complicate the possibility of obtaining precise age information from the speleothems, improved dating techniques and the prospect of obtaining a record of past flooding events (Dorale et al., 2004), of which one might have caused the death of humans (Merdenisianos, 2005), motivated our research approach. Here, we present U–Th and 14 C dating results from a detrital-rich sta- lagmite from the cave. Dating results are used to construct an age model that is applied to stable oxygen and carbon isotopes (δ 18 O, δ 13 C) data to yield an interpretation of climate variability during a period from ca. 950 BC to ca. AD 830. This is a period that overlaps the period when the cave is believed to have been occupied, or in use, by humans. Setting Kapsia Cave is situated close to the village Kapsia in Arcadia prefec- ture in central Peloponnese (37°37′24″N, 22°21′14″E) (Fig. 1). The Quaternary Research xxx (2014) xxx–xxx YQRES-03518; No. of pages: 15; 4C: 0033-5894/$ – see front matter © 2014 University of Washington. Published by Elsevier Inc. All rights reserved. http://dx.doi.org/10.1016/j.yqres.2013.12.009 Contents lists available at ScienceDirect Quaternary Research journal homepage: www.elsevier.com/locate/yqres Please cite this article as: Finné, M., et al., Speleothem evidence for late Holocene climate variability and floods in Southern Greece, Quaternary Research (2014), http://dx.doi.org/10.1016/j.yqres.2013.12.009

Welcome message from author
This document is posted to help you gain knowledge. Please leave a comment to let me know what you think about it! Share it to your friends and learn new things together.
Transcript
Quaternary Research xxx (2014) xxx–xxx
YQRES-03518; No. of pages: 15; 4C:
Contents lists available at ScienceDirect
Quaternary Research
j ourna l homepage: www.e lsev ie r .com/ locate /yqres
Speleothem evidence for late Holocene climate variability and floods inSouthern Greece
Martin Finné a,b,c, Miryam Bar-Matthews d, Karin Holmgren a,b,c, Hanna S. Sundqvist a,b,c,Ilias Liakopoulos e, Qiong Zhang a,c
a Department of Physical Geography and Quaternary Geology, Stockholm University, 106 91 Stockholm, Swedenb Navarino Environmental Observatory (NEO), Messinia, Greecec Bolin Centre for Climate Research, Stockholm University, Swedend Geological Survey of Israel, 30 Malchei Israel Street, Jerusalem 95501, Israele Ephorate of Palaeoanthropology and Speleology of Southern Greece, Greece
0033-5894/$ – see front matter © 2014 University of Washttp://dx.doi.org/10.1016/j.yqres.2013.12.009
Please cite this article as: Finné, M., et al., SpResearch (2014), http://dx.doi.org/10.1016/j
a b s t r a c t
a r t i c l e i n f oArticle history:Received 9 September 2013Available online xxxx
Keywords:MediterraneanSouthern Greecelate HoloceneStalagmiteStable isotopesClimate variabilityFlooding historyHellenistic period
We present stable isotope data (δ18O, δ13C) from a detrital rich stalagmite from Kapsia Cave, the Peloponnese,Greece. The cave is rich in archeological remains and there are reasons to believe that flooding of the cave has di-rectly affected humans using the cave. Using a combination ofU–Th and 14C dating to constrain a site-specific cor-rection factor for (232Th/238U) detrital molar ratio, a linear agemodel was constructed. The agemodel shows thatthe stalagmite grew during the period from ca. 950 BC to ca. AD 830. The stable oxygen record from Kapsia indi-cates cyclical changes of close to 500 yr in precipitation amount, with rapid shifts towards wetter conditionsfollowed by slowly developing aridity. Superimposed on this signal, wetter conditions are inferred around 850,700, 500 and 400–100 BC, and around AD 160–300 and AD 770; and driest conditions are inferred to have oc-curred around 450 BC, AD 100–150 and AD 650. Detrital horizons in the stalagmite indicate that three majorfloods took place in the cave at 500 BC, 70 BC and AD 450. The stable carbon isotope record reflects changes inbiological activity being a result of both climate and human activities.
© 2014 University of Washington. Published by Elsevier Inc. All rights reserved.
Introduction
Paleoclimate data from the Peloponnese peninsula in southernGreece is scarce (Finné et al., 2011). The peninsula represents anarcheologically rich and relatively well explored area that could act asan important area for investigations on the past impact of climatechanges on societal development. Available paleoclimate work is main-ly based on palynological studies (e.g., Kraft et al., 1980; Atherden et al.,1993; Jahns, 1993; Zangger et al., 1997; Kontopoulos and Avramidis,2003; Urban and Fuchs, 2005; Triantaphyllou et al., 2010; Kouli,2011). However, climate interpretation from palynological data iscomplex in this region due to its long history of humans altering theenvironment (e.g., Eastwood et al., 2007; Di Rita and Magri, 2009;Roberts et al., 2011). Limestone caves are frequently abundantand well-studied from an archeological perspective. Caves, with theirwell-sheltered environment, can preserve material useful, not onlyfor archeological studies but also for paleoclimatic investigations.Provided suitable formation and preservation conditions, speleothemsin caves can be precisely dated and yield high-resolution records ofpast variations in regional temperature, precipitation and vegetation(e.g., McDermott, 2004; Fairchild et al., 2006; Lachniet, 2009). Previousstudies, incorporating paleoclimatic data from caves with archeologicaldata, show the potential of working with this type of methods for an
hington. Published by Elsevier Inc. A
eleothem evidence for late H.yqres.2013.12.009
interdisciplinary analysis of climate–environment–society interactions(Gopher et al., 2010; Bar-Matthews and Ayalon, 2011).
We initiated a study of speleothems from Kapsia Cave in the Pelo-ponnese, with the aim to reconstruct past climate variability andflooding history in a region that is well-studied regarding human histo-ry, and at the same site where archeological remains are abundant.Detrital horizons in the stalagmites fromKapsia Cave show signs of hav-ing been repeatedly flooded. While this may complicate the possibilityof obtaining precise age information from the speleothems, improveddating techniques and the prospect of obtaining a record of past floodingevents (Dorale et al., 2004), ofwhich onemight have caused thedeath ofhumans (Merdenisianos, 2005), motivated our research approach.
Here, we present U–Th and 14C dating results froma detrital-rich sta-lagmite from the cave. Dating results are used to construct an agemodelthat is applied to stable oxygen and carbon isotopes (δ18O, δ13C) data toyield an interpretation of climate variability during a period from ca.950 BC to ca. AD 830. This is a period that overlaps the period whenthe cave is believed to have been occupied, or in use, by humans.
Setting
Kapsia Cave is situated close to the village Kapsia in Arcadia prefec-ture in central Peloponnese (37°37′24″N, 22°21′14″E) (Fig. 1). The
ll rights reserved.
olocene climate variability and floods in Southern Greece, Quaternary
A B
C
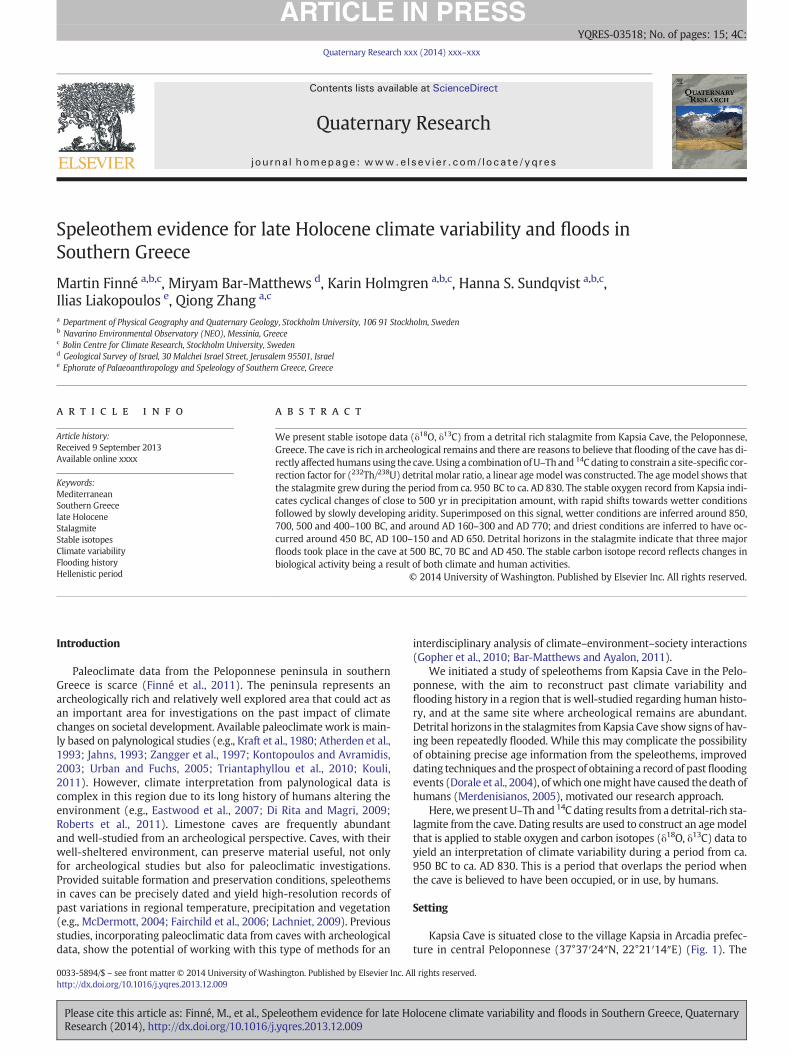
Figure 1.Map showing the location of Kapsia cave (KC) and other placesmentioned in the text (A andB) and a general outline of the cave interior (C). Altitudinal differences in the cave areafter map in Merdenisianos, 2005. The green square indicates the approximate sampling site of stalagmite GK-09-02. Red dashed lines in A indicate spatial differences in precipitationamounts, after Kutiel et al. (2002). Western Greece, including much of the Peloponnese, and northeastern Greece (around Thrace) and western Turkey receive more precipitation duringNCPI(−) due to anomalous air flow from south to north bringing in moist air from the sea (indicated by arrows). The opposite conditions occur in, e.g., eastern Greece, Crete, easternTurkey and theMiddle East (Kutiel et al., 2002). In map A, 1: Ioannina, Frogley et al., 2001; 2: Asea Valley, Unkel et al., 2013; 3: Sofular Cave, Fleitmann et al., 2009; 4: Gölhisar, Eastwoodet al., 2007; 5: Bereket basin, Kaniewski et al., 2007; 6: Eski Acigöl, Roberts et al., 2001; 7:NarGölu, Jones et al., 2006; 8: Soreq Cave, Bar-Matthews et al., 2003; 9: LakeVan,Wick et al., 2003.(For interpretation of the references to color in this figure legend, the reader is referred to the web version of this article.)
2 M. Finné et al. / Quaternary Research xxx (2014) xxx–xxx
cave entrance is located approximately 700 m asl where the MantineaPlainmeets the PindosMountains. TheMantinea Plain is a polje drainedby 5 sinkholes (Higgins and Higgins, 1996). The cave is formed in asmall limestone hill rising approximately 50 m above the plain surface.The limestones belong to the Triassic to EoceneGavrovo–Tripolitza zoneformed in shallowmarine conditions (Thiébault et al., 1994; Faupl et al.,2002). Bedrock thickness above the cave is 20–30 m. The cave is beau-tifully decorated with numerous speleothem formations such as flowstones, curtains, stalactites, stalagmites and columns. The cave hasbeen frequently flooded both in recent times and in the more distantpast, as is clear from meter-thick clay layers on the cave floor, distinctcolor changes (flood marks) on speleothem surfaces (Supplementalmaterials, Fig. 1), and dirt horizons in sliced stalagmites (Fig. 2).
Please cite this article as: Finné, M., et al., Speleothem evidence for late HResearch (2014), http://dx.doi.org/10.1016/j.yqres.2013.12.009
The cave environment has been monitored regularly betweenSeptember 2009 andMarch 2013. During this time cave air temperaturewas stable with an average of 12.4 ± 0.5°C and the average relative hu-midity was around 96%. Since 2010, tourists can visit parts of the cavethrough an artificial entrance opened in 2004 (Fig. 1).
No excavation has been carried out in the cavewith the exception ofthree small trial trenches (0.5 × 0.5 m) in one of the deepest chambers(Psathi, 2004). Many Neolithic (6500–3000 BC) remains from humanmade fires can be seen close to the natural entrance. Deeper in thecave human skulls and bones have been found, belonging to approxi-mately 50 individuals. The human bones come from both men andwomen of various age, from infants to adults (Bartsiokas et al., 1981;Pitsios, 1984; Pitsios et al., 1995). Because the anthropological material
olocene climate variability and floods in Southern Greece, Quaternary
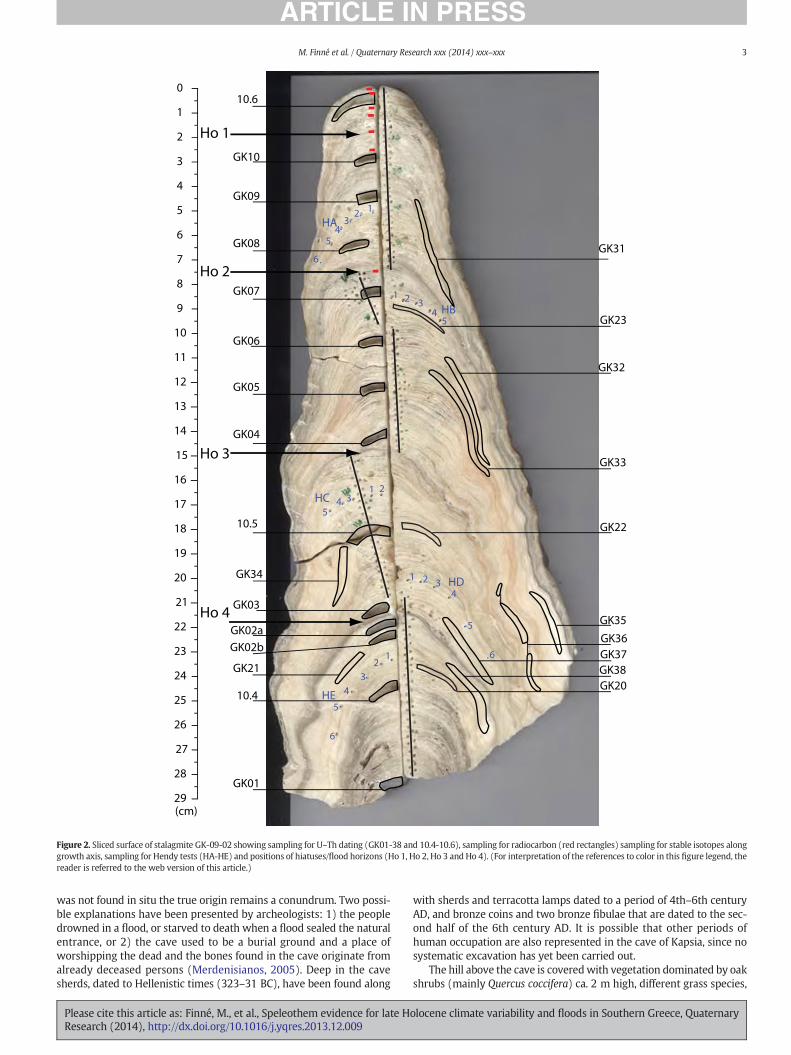
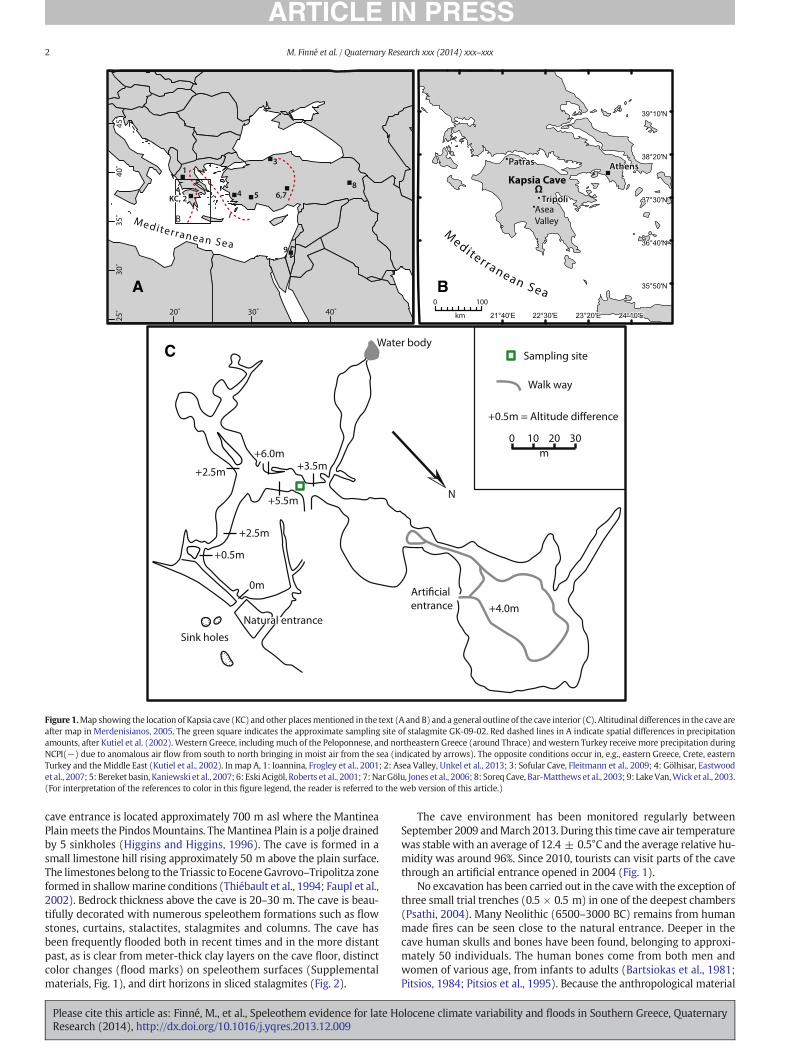
Figure 2. Sliced surface of stalagmite GK-09-02 showing sampling for U–Th dating (GK01-38 and 10.4-10.6), sampling for radiocarbon (red rectangles) sampling for stable isotopes alonggrowth axis, sampling for Hendy tests (HA-HE) and positions of hiatuses/flood horizons (Ho 1, Ho 2, Ho 3 and Ho 4). (For interpretation of the references to color in this figure legend, thereader is referred to the web version of this article.)
3M. Finné et al. / Quaternary Research xxx (2014) xxx–xxx
was not found in situ the true origin remains a conundrum. Two possi-ble explanations have been presented by archeologists: 1) the peopledrowned in a flood, or starved to death when a flood sealed the naturalentrance, or 2) the cave used to be a burial ground and a place ofworshipping the dead and the bones found in the cave originate fromalready deceased persons (Merdenisianos, 2005). Deep in the cavesherds, dated to Hellenistic times (323–31 BC), have been found along
Please cite this article as: Finné, M., et al., Speleothem evidence for late HResearch (2014), http://dx.doi.org/10.1016/j.yqres.2013.12.009
with sherds and terracotta lamps dated to a period of 4th–6th centuryAD, and bronze coins and two bronze fibulae that are dated to the sec-ond half of the 6th century AD. It is possible that other periods ofhuman occupation are also represented in the cave of Kapsia, since nosystematic excavation has yet been carried out.
The hill above the cave is coveredwith vegetation dominated by oakshrubs (mainly Quercus coccifera) ca. 2 m high, different grass species,
olocene climate variability and floods in Southern Greece, Quaternary
Table 1Results from radiocarbon analysis.
DFT (mm) Sample ID Lab. no. a14C (pMC) 14C age (yr BP)
0 10 Ua-42622 101.4 ± 0.4 n.a.3 2 Ua-41707 103.3 ± 0.4 n.a.8 4 Ua-41761 103.7 ± 0.3 n.a.11.5 5 Ua-42225 106.1 ± 0.4 n.a.18 11 Ua-42623 108.9 ± 0.4 n.a.25 6 Ua-42226 n.a. 1152 ± 3075 12 Ua-42624 n.a. 1425 ± 3075 12organic Ua-42625 n.a. 4189 ± 39
4 M. Finné et al. / Quaternary Research xxx (2014) xxx–xxx
Lamiaceae species and Euphorbia sp. Within the vegetation cover thereare patches of bare soil and outcropping bedrock. A stand of dead treetrunks, most likely Juniperus sp., indicates that burning disturbs the veg-etation at times and the latest major fire on the hill occurred in August1997. The cave can be flooded at times when surface water input ex-ceeds draining capacity of sinkholes, and the latest recorded flood wasin 2001.
The regional climate is typically Mediterranean, characterizedby hot dry summers and mild wet winters. Annual average air temper-ature for the nearest meteorological station, in Tripoli (approximately10 km to the south, elevation 650 m), is 14.1 ± 1.4°C for the period1951–2004. Annual average precipitation amount in Tripoli is768 ± 393 mm for the period 1951–2008, with a great deal of year-to-year variability (Supplemental materials, Fig. 2A). Around 70–80%of the yearly precipitation falls between October and April (Dotsikaet al., 2010) and snowfall occurs in higher terrain. High summer tem-perature and low summer precipitation lead to negative water balancefor the period May to September (as indicated by the calculated waterexcess in Supplemental Fig. 2B). Stable isotope data in precipitation(δ18O and δD) have been collected in Greece since 1960 (Argiriou andLykoudis, 2006; Dotsika et al., 2010). The western part of the countryis characterized by more precipitation and more enriched δ18O valuescompared to the areas located in the orographic shadow to the east ofthe Pindos Mountains (Dotsika et al., 2010). Generally, precipitationδ18O is more depleted during the winter months following surface airtemperatures (Argiriou and Lykoudis, 2006). During an annual cycle acorrelation between δ18O depletion and rainfall amounts is evidentwhen monthly average precipitation is below 100 mm (Argiriou andLykoudis, 2006).
Modern climate
To provide a baseline for discussing past climate change and possiblemechanism behind variability, the modern climate is briefly outlined.The North Atlantic Oscillation (NAO) influences winter precipitationand temperature of the eastern Mediterranean and Greece (Cullen anddeMenocal, 2000; Türkeş and Erlat, 2003; Feidas et al., 2004). Positive(negative) NAOwill create cooler and drier (warmer andwetter) condi-tions as less air from the North Atlantic penetrates into the region. Theinfluence of the NAO on winter temperatures in Greece has beenshown to occur mainly on a decadal scale (Feidas et al., 2004). Rainfalland temperature variability in the eastern Mediterranean depends fur-ther on the pressure difference between the North Sea and the CaspianSea, the so called North Sea–Caspian Pattern Index (NCPI) (Kutiel andBenaroch, 2002; Kutiel et al., 2002). During a positive phase of theNCPI, NCPI(+), an anomalous circulation pattern forms in the easternMediterranean/Aegean Sea with a stronger component of northeasterlywinds bringing cool and dry continental air into many parts of theregion, including thewestern Peloponnese (Fig. 1). DuringNCPI(−) cir-culation tends to be stronger from the southwest favoring higher tem-peratures and wetter conditions (Kutiel and Benaroch, 2002; Kutielet al., 2002). Another important control onwinter temperature variabil-ity is the Mediterranean Oscillation (MO), calculated from the differ-ences in pressure between e.g., Cairo and Algiers (Feidas et al., 2004;Harding et al., 2009). During positive MO a southward flow of cool airover Greece can be facilitated in connection to enhanced frequencyand persistence of low pressures over the central Mediterranean(Feidas et al., 2004).
Materials and methods
One actively growing stalagmite, labeled GK-09-02, was collected inKapsia Cave in September 2009. The facts that the corresponding stalac-tite was dripping, the stalagmite had a convex top, and modern deposi-tion of calcite took place on equipment placed at the collection siteimmediately after removal of the stalagmite all strongly suggest that
Please cite this article as: Finné, M., et al., Speleothem evidence for late HResearch (2014), http://dx.doi.org/10.1016/j.yqres.2013.12.009
the stalagmite was active at the time of removal. The stalagmite wasgrowingon an elevated plateau ca. 2 mabove the cavefloor. The growthlocation of the stalagmite is well away from both the natural and the ar-tificial entrance in a part of the cave not accessible for tourists (Fig. 1).The height of the stalagmite is ca. 295 mm and is conically shaped(Fig. 2).
A 1-cm slab was cut parallel to the growth axis of the stalagmiteusing a diamond saw. The slab was then cut along the center in twoequally sized parts (A and B) that were polished. Slab B was mainly de-voted to sampling for stable isotopes. U–Th and radiocarbon datingsamples were taken from both slabs.
The stalagmite is visibly laminated with translucent thin dark layersand thicker white deposits (Fig. 2). In areas the stalagmite is porous.Visual inspection of fabrics reveals regions with marked dark horizonsat 74 mm, 149 mm, and at 214 mm (Fig. 2) from the top. Petrographicthin sections (30 μm) were produced and analyzed under NikonOptiphot2-Pol under 25× and 100× magnification.
For radiocarbon analysis, five 2-mg sampleswere drilled at 3, 8, 11.5,18 and 25 mm from the top (Fig. 2, Table 1). At 75 mm from the top,two fractions (210 mg) were analyzed: the calcite and the organic frac-tion. One sample (2 mg) of calcite that precipitated during the periodfrom September 2009 to February 2010was also analyzed to investigateif the top of the stalagmite contains an elevated 14C activity that can beassociated with the atomic bomb testing in the 1960s and thus provideindependent evidence of recent deposition of the top of the stalagmite.Before analysis the powders were washed in de-ionized water in an ul-trasonic bath. Samples were leached stepwise in 0.5 HCl to investigatepossible contamination. The evolved CO2 gaswas converted into graph-ite using Fe-catalyst before inserted to the accelerator mass spectrome-ter. Radiocarbon analyses were performed at The Ångström Laboratory,Uppsala University, Sweden.
Initially 18 samples (0.5 g) were drilled for U–Th dating (Fig. 2).Based on these results a second round of 8 samples (0.3 g) was drilledcloser to the sides of the stalagmite in order to avoid detrital-richareas (Fig. 2). Additionally, the calcite, precipitated from September2009 until February 2010 and used for 14C dating, was also sampledfor U–Th dating. All samples were dissolved, with a combination of7 M HNO3 and HF, and equilibrated with a mixed 229Th/236U spikethat was calibrated with gravimetric standards (following Hendersonet al., 2001). Both spiked isotopes supplied by Harwell are isotopicallyclean (229Th N 99.99%; 236U = 99.97%). Samples were loaded ontominicolumns containing 2 ml of Bio-Rad AG 1X8 200–400 mesh resin.U was eluted by 1 M HBr and Th with 6 M HCl. U and Th solutionswere evaporated to dryness and the residues dissolved in 2 ml and5 ml of 0.1 MHNO3, respectively.
U–Th dating was performed at the Geological Survey of Israel (GSI)using a Nu Instruments Ltd (UK)MC-ICP-MS equipped with 12 Faradaycups and 3 ion counters. Each sample was introduced to theMC-ICP-MSthrough an Aridus® micro-concentric desolvating nebulizer sampleintroducing system. The instrumental mass bias was corrected (usingan exponential equation) by measuring the 235U/238U ratio andcorrecting with the natural 235U/238U ratio. Calibration of ion countersrelative to Faraday cupswas performed using several cycles ofmeasure-ment with different collector configurations in each particular analysis.
olocene climate variability and floods in Southern Greece, Quaternary
5M. Finné et al. / Quaternary Research xxx (2014) xxx–xxx
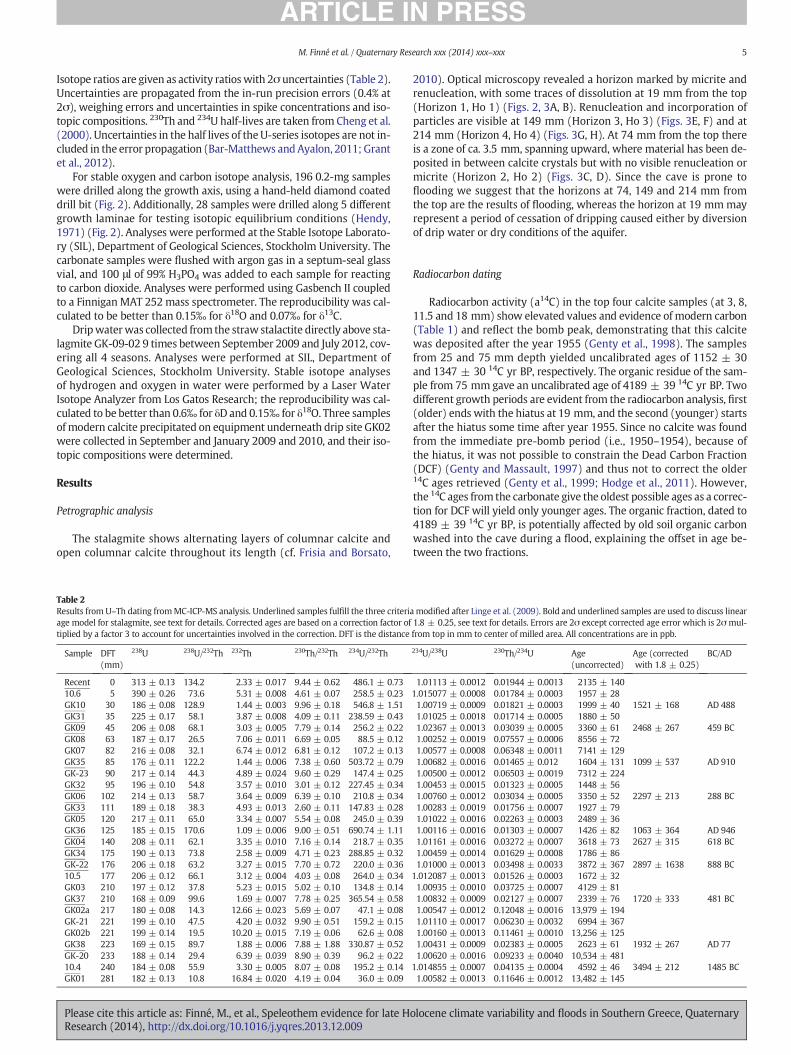
Isotope ratios are given as activity ratioswith 2σ uncertainties (Table 2).Uncertainties are propagated from the in-run precision errors (0.4% at2σ), weighing errors and uncertainties in spike concentrations and iso-topic compositions. 230Th and 234U half-lives are taken from Cheng et al.(2000). Uncertainties in the half lives of the U-series isotopes are not in-cluded in the error propagation (Bar-Matthews andAyalon, 2011; Grantet al., 2012).
For stable oxygen and carbon isotope analysis, 196 0.2-mg sampleswere drilled along the growth axis, using a hand-held diamond coateddrill bit (Fig. 2). Additionally, 28 samples were drilled along 5 differentgrowth laminae for testing isotopic equilibrium conditions (Hendy,1971) (Fig. 2). Analyses were performed at the Stable Isotope Laborato-ry (SIL), Department of Geological Sciences, Stockholm University. Thecarbonate samples were flushed with argon gas in a septum-seal glassvial, and 100 μl of 99% H3PO4 was added to each sample for reactingto carbon dioxide. Analyses were performed using Gasbench II coupledto a Finnigan MAT 252 mass spectrometer. The reproducibility was cal-culated to be better than 0.15‰ for δ18O and 0.07‰ for δ13C.
Dripwaterwas collected from the straw stalactite directly above sta-lagmite GK-09-02 9 times between September 2009 and July 2012, cov-ering all 4 seasons. Analyses were performed at SIL, Department ofGeological Sciences, Stockholm University. Stable isotope analysesof hydrogen and oxygen in water were performed by a Laser WaterIsotope Analyzer from Los Gatos Research; the reproducibility was cal-culated to be better than 0.6‰ for δD and 0.15‰ for δ18O. Three samplesof modern calcite precipitated on equipment underneath drip site GK02were collected in September and January 2009 and 2010, and their iso-topic compositions were determined.
Results
Petrographic analysis
The stalagmite shows alternating layers of columnar calcite andopen columnar calcite throughout its length (cf. Frisia and Borsato,
Table 2Results from U–Th dating fromMC-ICP-MS analysis. Underlined samples fulfill the three criteriaage model for stalagmite, see text for details. Corrected ages are based on a correction factor oftiplied by a factor 3 to account for uncertainties involved in the correction. DFT is the distance
Sample DFT(mm)
238U 238U/232Th 232Th 230Th/232Th 234U/232Th
Recent 0 313 ± 0.13 134.2 2.33 ± 0.017 9.44 ± 0.62 486.1 ± 0.7310.6 5 390 ± 0.26 73.6 5.31 ± 0.008 4.61 ± 0.07 258.5 ± 0.23GK10 30 186 ± 0.08 128.9 1.44 ± 0.003 9.96 ± 0.18 546.8 ± 1.51GK31 35 225 ± 0.17 58.1 3.87 ± 0.008 4.09 ± 0.11 238.59 ± 0.43GK09 45 206 ± 0.08 68.1 3.03 ± 0.005 7.79 ± 0.14 256.2 ± 0.22GK08 63 187 ± 0.17 26.5 7.06 ± 0.011 6.69 ± 0.05 88.5 ± 0.12GK07 82 216 ± 0.08 32.1 6.74 ± 0.012 6.81 ± 0.12 107.2 ± 0.13GK35 85 176 ± 0.11 122.2 1.44 ± 0.006 7.38 ± 0.60 503.72 ± 0.79GK-23 90 217 ± 0.14 44.3 4.89 ± 0.024 9.60 ± 0.29 147.4 ± 0.25GK32 95 196 ± 0.10 54.8 3.57 ± 0.010 3.01 ± 0.12 227.45 ± 0.34GK06 102 214 ± 0.13 58.7 3.64 ± 0.009 6.39 ± 0.10 210.8 ± 0.34GK33 111 189 ± 0.18 38.3 4.93 ± 0.013 2.60 ± 0.11 147.83 ± 0.28GK05 120 217 ± 0.11 65.0 3.34 ± 0.007 5.54 ± 0.08 245.0 ± 0.39GK36 125 185 ± 0.15 170.6 1.09 ± 0.006 9.00 ± 0.51 690.74 ± 1.11GK04 140 208 ± 0.11 62.1 3.35 ± 0.010 7.16 ± 0.14 218.7 ± 0.35GK34 175 190 ± 0.13 73.8 2.58 ± 0.009 4.71 ± 0.23 288.85 ± 0.32GK-22 176 206 ± 0.18 63.2 3.27 ± 0.015 7.70 ± 0.72 220.0 ± 0.3610.5 177 206 ± 0.12 66.1 3.12 ± 0.004 4.03 ± 0.08 264.0 ± 0.34GK03 210 197 ± 0.12 37.8 5.23 ± 0.015 5.02 ± 0.10 134.8 ± 0.14GK37 210 168 ± 0.09 99.6 1.69 ± 0.007 7.78 ± 0.25 365.54 ± 0.58GK02a 217 180 ± 0.08 14.3 12.66 ± 0.023 5.69 ± 0.07 47.1 ± 0.08GK-21 221 199 ± 0.10 47.5 4.20 ± 0.032 9.90 ± 0.51 159.2 ± 0.15GK02b 221 199 ± 0.14 19.5 10.20 ± 0.015 7.19 ± 0.06 62.6 ± 0.08GK38 223 169 ± 0.15 89.7 1.88 ± 0.006 7.88 ± 1.88 330.87 ± 0.52GK-20 233 188 ± 0.14 29.4 6.39 ± 0.039 8.90 ± 0.39 96.2 ± 0.2210.4 240 184 ± 0.08 55.9 3.30 ± 0.005 8.07 ± 0.08 195.2 ± 0.14GK01 281 182 ± 0.13 10.8 16.84 ± 0.020 4.19 ± 0.04 36.0 ± 0.09
Please cite this article as: Finné, M., et al., Speleothem evidence for late HResearch (2014), http://dx.doi.org/10.1016/j.yqres.2013.12.009
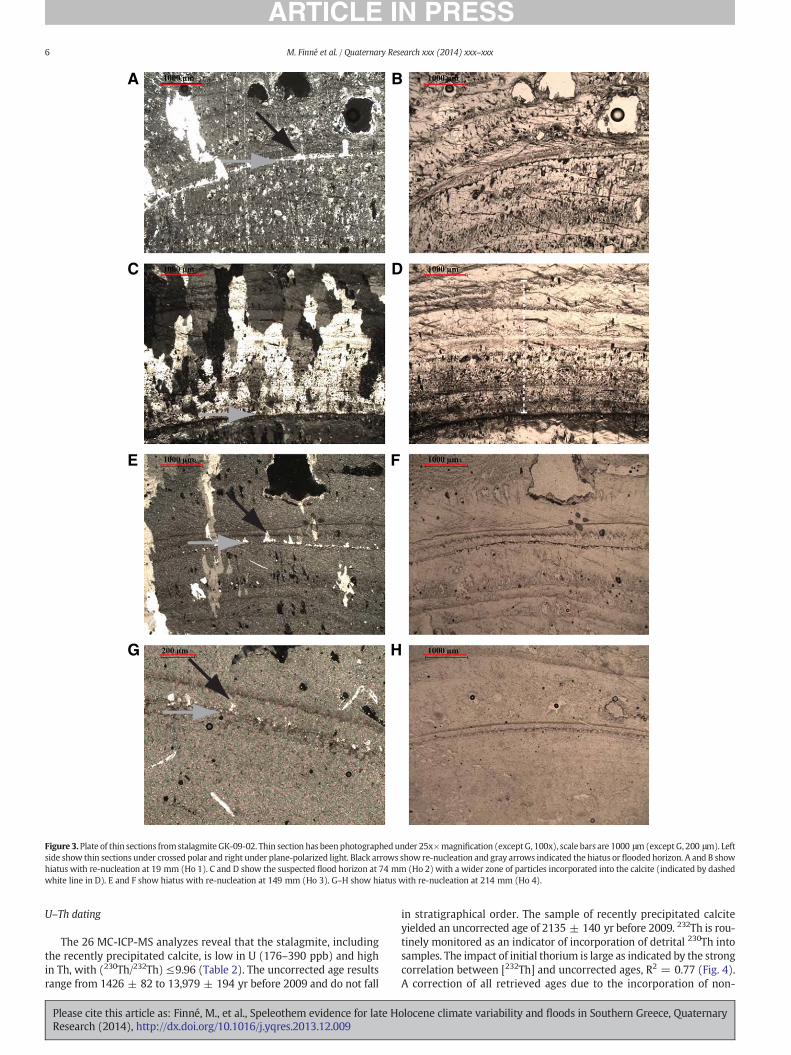
2010). Optical microscopy revealed a horizon marked by micrite andrenucleation, with some traces of dissolution at 19 mm from the top(Horizon 1, Ho 1) (Figs. 2, 3A, B). Renucleation and incorporation ofparticles are visible at 149 mm (Horizon 3, Ho 3) (Figs. 3E, F) and at214 mm (Horizon 4, Ho 4) (Figs. 3G, H). At 74 mm from the top thereis a zone of ca. 3.5 mm, spanning upward, where material has been de-posited in between calcite crystals but with no visible renucleation ormicrite (Horizon 2, Ho 2) (Figs. 3C, D). Since the cave is prone toflooding we suggest that the horizons at 74, 149 and 214 mm fromthe top are the results of flooding, whereas the horizon at 19 mmmayrepresent a period of cessation of dripping caused either by diversionof drip water or dry conditions of the aquifer.
Radiocarbon dating
Radiocarbon activity (a14C) in the top four calcite samples (at 3, 8,11.5 and 18 mm) show elevated values and evidence of modern carbon(Table 1) and reflect the bomb peak, demonstrating that this calcitewas deposited after the year 1955 (Genty et al., 1998). The samplesfrom 25 and 75 mm depth yielded uncalibrated ages of 1152 ± 30and 1347 ± 30 14C yr BP, respectively. The organic residue of the sam-ple from 75 mm gave an uncalibrated age of 4189 ± 39 14C yr BP. Twodifferent growth periods are evident from the radiocarbon analysis, first(older) ends with the hiatus at 19 mm, and the second (younger) startsafter the hiatus some time after year 1955. Since no calcite was foundfrom the immediate pre-bomb period (i.e., 1950–1954), because ofthe hiatus, it was not possible to constrain the Dead Carbon Fraction(DCF) (Genty and Massault, 1997) and thus not to correct the older14C ages retrieved (Genty et al., 1999; Hodge et al., 2011). However,the 14C ages from the carbonate give the oldest possible ages as a correc-tion for DCF will yield only younger ages. The organic fraction, dated to4189 ± 39 14C yr BP, is potentially affected by old soil organic carbonwashed into the cave during a flood, explaining the offset in age be-tween the two fractions.
modified after Linge et al. (2009). Bold and underlined samples are used to discuss linear1.8 ± 0.25, see text for details. Errors are 2σ except corrected age error which is 2σmul-from top in mm to center of milled area. All concentrations are in ppb.
234U/238U 230Th/234U Age(uncorrected)
Age (correctedwith 1.8 ± 0.25)
BC/AD
1.01113 ± 0.0012 0.01944 ± 0.0013 2135 ± 1401.015077 ± 0.0008 0.01784 ± 0.0003 1957 ± 281.00719 ± 0.0009 0.01821 ± 0.0003 1999 ± 40 1521 ± 168 AD 4881.01025 ± 0.0018 0.01714 ± 0.0005 1880 ± 501.02367 ± 0.0013 0.03039 ± 0.0005 3360 ± 61 2468 ± 267 459 BC1.00252 ± 0.0019 0.07557 ± 0.0006 8556 ± 721.00577 ± 0.0008 0.06348 ± 0.0011 7141 ± 1291.00682 ± 0.0016 0.01465 ± 0.012 1604 ± 131 1099 ± 537 AD 9101.00500 ± 0.0012 0.06503 ± 0.0019 7312 ± 2241.00453 ± 0.0015 0.01323 ± 0.0005 1448 ± 561.00760 ± 0.0012 0.03034 ± 0.0005 3350 ± 52 2297 ± 213 288 BC1.00283 ± 0.0019 0.01756 ± 0.0007 1927 ± 791.01022 ± 0.0016 0.02263 ± 0.0003 2489 ± 361.00116 ± 0.0016 0.01303 ± 0.0007 1426 ± 82 1063 ± 364 AD 9461.01161 ± 0.0016 0.03272 ± 0.0007 3618 ± 73 2627 ± 315 618 BC1.00459 ± 0.0014 0.01629 ± 0.0008 1786 ± 861.01000 ± 0.0013 0.03498 ± 0.0033 3872 ± 367 2897 ± 1638 888 BC
1.012087 ± 0.0013 0.01526 ± 0.0003 1672 ± 321.00935 ± 0.0010 0.03725 ± 0.0007 4129 ± 811.00832 ± 0.0009 0.02127 ± 0.0007 2339 ± 76 1720 ± 333 481 BC1.00547 ± 0.0012 0.12048 ± 0.0016 13,979 ± 1941.01110 ± 0.0017 0.06230 ± 0.0032 6994 ± 3671.00160 ± 0.0013 0.11461 ± 0.0010 13,256 ± 1251.00431 ± 0.0009 0.02383 ± 0.0005 2623 ± 61 1932 ± 267 AD 771.00620 ± 0.0016 0.09233 ± 0.0040 10,534 ± 481
1.014855 ± 0.0007 0.04135 ± 0.0004 4592 ± 46 3494 ± 212 1485 BC1.00582 ± 0.0013 0.11646 ± 0.0012 13,482 ± 145
olocene climate variability and floods in Southern Greece, Quaternary
A B
DC
E F
G H
Figure 3.Plate of thin sections fromstalagmite GK-09-02. Thin section has beenphotographedunder 25x×magnification (exceptG, 100x), scale bars are 1000 μm(exceptG, 200 μm). Leftside show thin sections under crossed polar and right under plane-polarized light. Black arrows show re-nucleation and gray arrows indicated the hiatus or flooded horizon. A and B showhiatus with re-nucleation at 19 mm (Ho 1). C and D show the suspected flood horizon at 74 mm (Ho 2) with a wider zone of particles incorporated into the calcite (indicated by dashedwhite line in D). E and F show hiatus with re-nucleation at 149 mm (Ho 3). G–H show hiatus with re-nucleation at 214 mm (Ho 4).
6 M. Finné et al. / Quaternary Research xxx (2014) xxx–xxx
U–Th dating
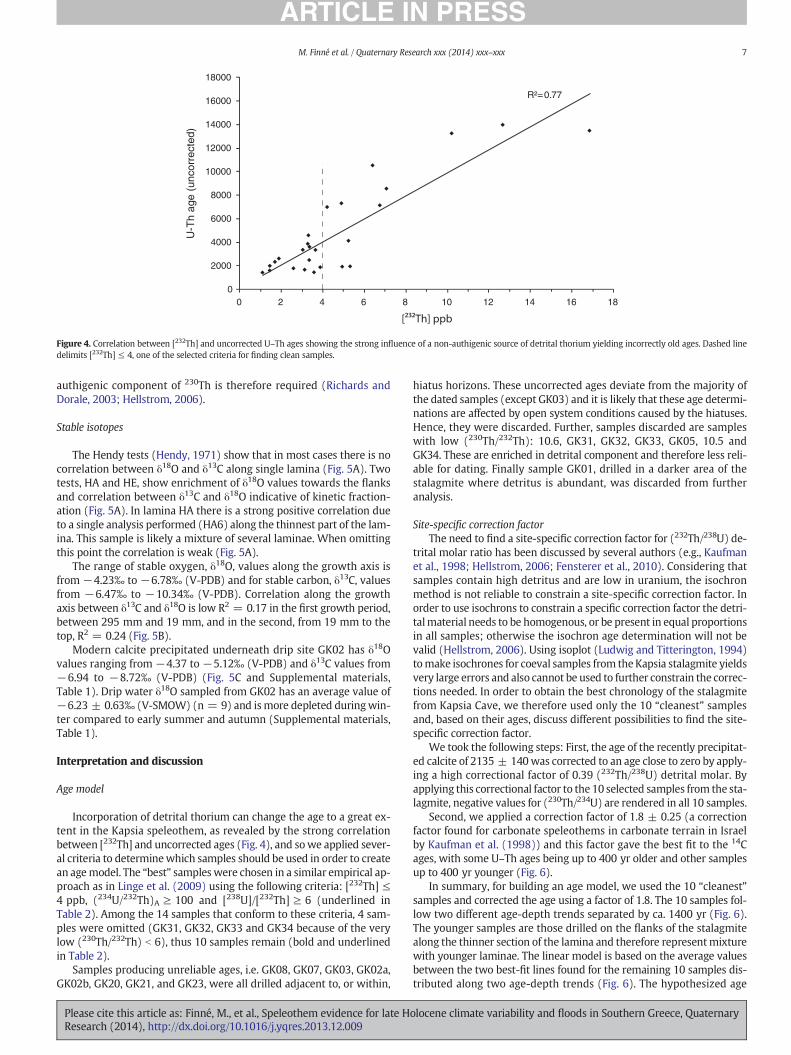
The 26 MC-ICP-MS analyzes reveal that the stalagmite, includingthe recently precipitated calcite, is low in U (176–390 ppb) and highin Th, with (230Th/232Th) ≤9.96 (Table 2). The uncorrected age resultsrange from 1426 ± 82 to 13,979 ± 194 yr before 2009 and do not fall
Please cite this article as: Finné, M., et al., Speleothem evidence for late HResearch (2014), http://dx.doi.org/10.1016/j.yqres.2013.12.009
in stratigraphical order. The sample of recently precipitated calciteyielded an uncorrected age of 2135 ± 140 yr before 2009. 232Th is rou-tinely monitored as an indicator of incorporation of detrital 230Th intosamples. The impact of initial thorium is large as indicated by the strongcorrelation between [232Th] and uncorrected ages, R2 = 0.77 (Fig. 4).A correction of all retrieved ages due to the incorporation of non-
olocene climate variability and floods in Southern Greece, Quaternary
R²= 0.77
0
2000
4000
6000
8000
10000
12000
14000
16000
18000
0 2 4 6 8 10 12 14 16 18
U-T
h ag
e (u
ncor
rect
ed)
Figure 4. Correlation between [232Th] and uncorrected U–Th ages showing the strong influence of a non-authigenic source of detrital thorium yielding incorrectly old ages. Dashed linedelimits [232Th] ≤ 4, one of the selected criteria for finding clean samples.
7M. Finné et al. / Quaternary Research xxx (2014) xxx–xxx
authigenic component of 230Th is therefore required (Richards andDorale, 2003; Hellstrom, 2006).
Stable isotopes
The Hendy tests (Hendy, 1971) show that in most cases there is nocorrelation between δ18O and δ13C along single lamina (Fig. 5A). Twotests, HA and HE, show enrichment of δ18O values towards the flanksand correlation between δ13C and δ18O indicative of kinetic fraction-ation (Fig. 5A). In lamina HA there is a strong positive correlation dueto a single analysis performed (HA6) along the thinnest part of the lam-ina. This sample is likely a mixture of several laminae. When omittingthis point the correlation is weak (Fig. 5A).
The range of stable oxygen, δ18O, values along the growth axis isfrom −4.23‰ to −6.78‰ (V-PDB) and for stable carbon, δ13C, valuesfrom −6.47‰ to −10.34‰ (V-PDB). Correlation along the growthaxis between δ13C and δ18O is low R2 = 0.17 in the first growth period,between 295 mm and 19 mm, and in the second, from 19 mm to thetop, R2 = 0.24 (Fig. 5B).
Modern calcite precipitated underneath drip site GK02 has δ18Ovalues ranging from −4.37 to −5.12‰ (V-PDB) and δ13C values from−6.94 to −8.72‰ (V-PDB) (Fig. 5C and Supplemental materials,Table 1). Drip water δ18O sampled from GK02 has an average value of−6.23 ± 0.63‰ (V-SMOW) (n = 9) and ismore depleted duringwin-ter compared to early summer and autumn (Supplemental materials,Table 1).
Interpretation and discussion
Age model
Incorporation of detrital thorium can change the age to a great ex-tent in the Kapsia speleothem, as revealed by the strong correlationbetween [232Th] and uncorrected ages (Fig. 4), and sowe applied sever-al criteria to determinewhich samples should be used in order to createan agemodel. The “best” sampleswere chosen in a similar empirical ap-proach as in Linge et al. (2009) using the following criteria: [232Th] ≤4 ppb, (234U/232Th)A ≥ 100 and [238U]/[232Th] ≥ 6 (underlined inTable 2). Among the 14 samples that conform to these criteria, 4 sam-ples were omitted (GK31, GK32, GK33 and GK34 because of the verylow (230Th/232Th) b 6), thus 10 samples remain (bold and underlinedin Table 2).
Samples producing unreliable ages, i.e. GK08, GK07, GK03, GK02a,GK02b, GK20, GK21, and GK23, were all drilled adjacent to, or within,
Please cite this article as: Finné, M., et al., Speleothem evidence for late HResearch (2014), http://dx.doi.org/10.1016/j.yqres.2013.12.009
hiatus horizons. These uncorrected ages deviate from the majority ofthe dated samples (except GK03) and it is likely that these age determi-nations are affected by open system conditions caused by the hiatuses.Hence, they were discarded. Further, samples discarded are sampleswith low (230Th/232Th): 10.6, GK31, GK32, GK33, GK05, 10.5 andGK34. These are enriched in detrital component and therefore less reli-able for dating. Finally sample GK01, drilled in a darker area of thestalagmite where detritus is abundant, was discarded from furtheranalysis.
Site-specific correction factorThe need to find a site-specific correction factor for (232Th/238U) de-
trital molar ratio has been discussed by several authors (e.g., Kaufmanet al., 1998; Hellstrom, 2006; Fensterer et al., 2010). Considering thatsamples contain high detritus and are low in uranium, the isochronmethod is not reliable to constrain a site-specific correction factor. Inorder to use isochrons to constrain a specific correction factor the detri-talmaterial needs to be homogenous, or be present in equal proportionsin all samples; otherwise the isochron age determination will not bevalid (Hellstrom, 2006). Using isoplot (Ludwig and Titterington, 1994)tomake isochrones for coeval samples from theKapsia stalagmite yieldsvery large errors and also cannot be used to further constrain the correc-tions needed. In order to obtain the best chronology of the stalagmitefrom Kapsia Cave, we therefore used only the 10 “cleanest” samplesand, based on their ages, discuss different possibilities to find the site-specific correction factor.
We took the following steps: First, the age of the recently precipitat-ed calcite of 2135 ± 140was corrected to an age close to zero by apply-ing a high correctional factor of 0.39 (232Th/238U) detrital molar. Byapplying this correctional factor to the 10 selected samples from the sta-lagmite, negative values for (230Th/234U) are rendered in all 10 samples.
Second, we applied a correction factor of 1.8 ± 0.25 (a correctionfactor found for carbonate speleothems in carbonate terrain in Israelby Kaufman et al. (1998)) and this factor gave the best fit to the 14Cages, with some U–Th ages being up to 400 yr older and other samplesup to 400 yr younger (Fig. 6).
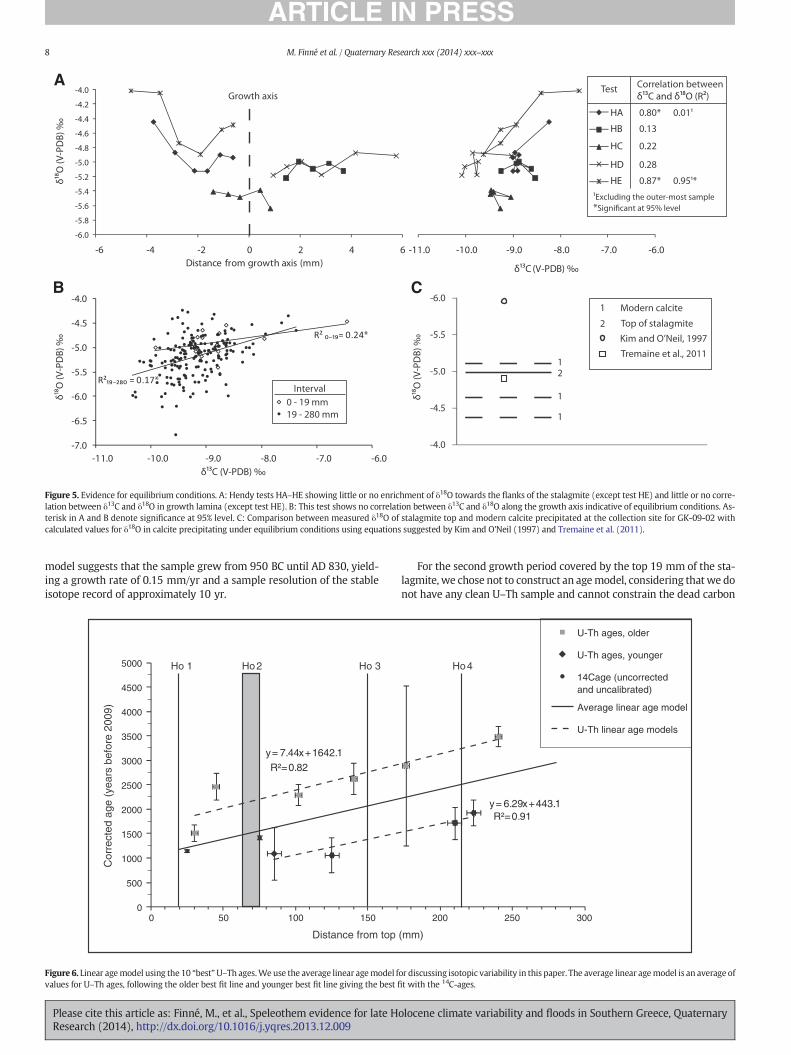
In summary, for building an age model, we used the 10 “cleanest”samples and corrected the age using a factor of 1.8. The 10 samples fol-low two different age-depth trends separated by ca. 1400 yr (Fig. 6).The younger samples are those drilled on the flanks of the stalagmitealong the thinner section of the lamina and therefore representmixturewith younger laminae. The linear model is based on the average valuesbetween the two best-fit lines found for the remaining 10 samples dis-tributed along two age-depth trends (Fig. 6). The hypothesized age
olocene climate variability and floods in Southern Greece, Quaternary
A
B C
Figure 5. Evidence for equilibrium conditions. A: Hendy tests HA–HE showing little or no enrichment of δ18O towards the flanks of the stalagmite (except test HE) and little or no corre-lation between δ13C and δ18O in growth lamina (except test HE). B: This test shows no correlation between δ13C and δ18O along the growth axis indicative of equilibrium conditions. As-terisk in A and B denote significance at 95% level. C: Comparison between measured δ18O of stalagmite top and modern calcite precipitated at the collection site for GK-09-02 withcalculated values for δ18O in calcite precipitating under equilibrium conditions using equations suggested by Kim and O'Neil (1997) and Tremaine et al. (2011).
8 M. Finné et al. / Quaternary Research xxx (2014) xxx–xxx
model suggests that the sample grew from 950 BC until AD 830, yield-ing a growth rate of 0.15 mm/yr and a sample resolution of the stableisotope record of approximately 10 yr.
y = 7.44x + 1642.1R²= 0.82
0
500
1000
1500
2000
2500
3000
3500
4000
4500
5000
1500 50 100
Cor
rect
ed a
ge (
year
s be
fore
200
9)
Distance from top
Ho 2Ho 1 Ho 3
Figure 6. Linear agemodel using the 10 “best”U–Th ages.We use the average linear agemodel fvalues for U–Th ages, following the older best fit line and younger best fit line giving the best fi
Please cite this article as: Finné, M., et al., Speleothem evidence for late HResearch (2014), http://dx.doi.org/10.1016/j.yqres.2013.12.009
For the second growth period covered by the top 19 mm of the sta-lagmite, we chose not to construct an agemodel, considering thatwe donot have any clean U–Th sample and cannot constrain the dead carbon
y = 6.29x + 443.1R²= 0.91
200 250 300
(mm)
Ho 4
U-Th ages, older
U-Th ages, younger
14Cage (uncorrectedand uncalibrated)
Average linear age model
U-Th linear age models
or discussing isotopic variability in this paper. The average linear agemodel is an average oft with the 14C-ages.
olocene climate variability and floods in Southern Greece, Quaternary
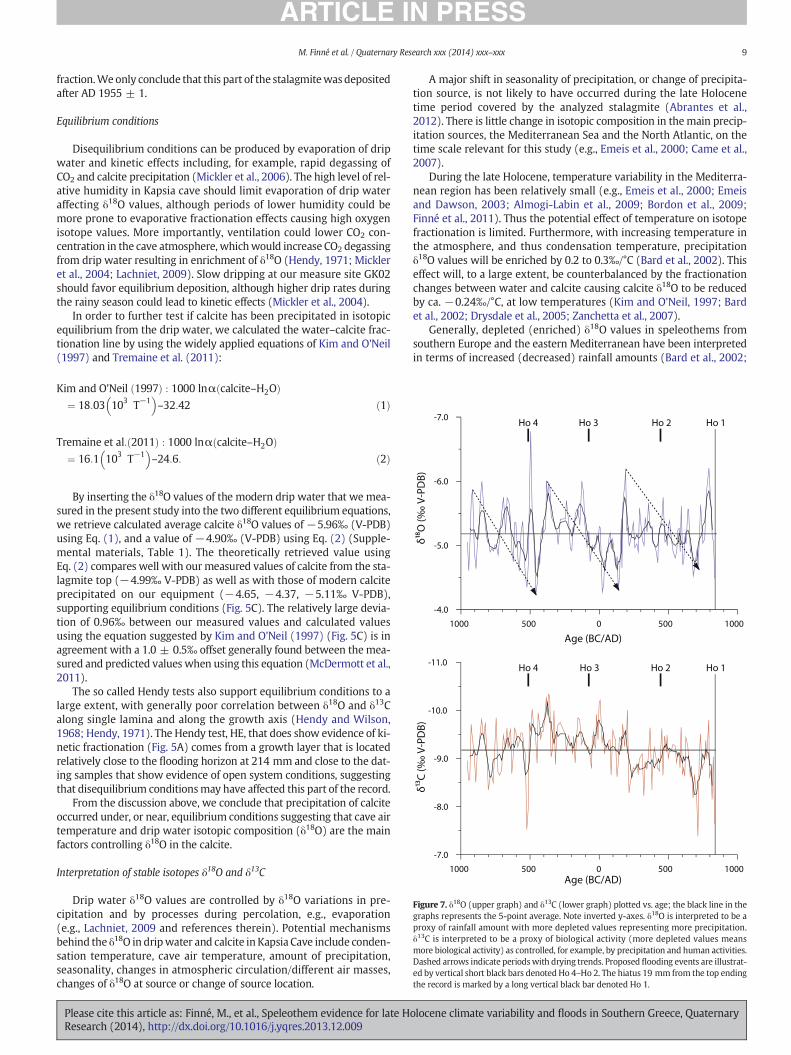
Figure 7. δ18O (upper graph) and δ13C (lower graph) plotted vs. age; the black line in thegraphs represents the 5-point average. Note inverted y-axes. δ18O is interpreted to be aproxy of rainfall amount with more depleted values representing more precipitation.δ13C is interpreted to be a proxy of biological activity (more depleted values meansmore biological activity) as controlled, for example, by precipitation and human activities.Dashed arrows indicate periodswith drying trends. Proposed flooding events are illustrat-ed by vertical short black bars denoted Ho 4–Ho 2. The hiatus 19 mm from the top endingthe record is marked by a long vertical black bar denoted Ho 1.
9M. Finné et al. / Quaternary Research xxx (2014) xxx–xxx
fraction.We only conclude that this part of the stalagmitewasdepositedafter AD 1955 ± 1.
Equilibrium conditions
Disequilibrium conditions can be produced by evaporation of dripwater and kinetic effects including, for example, rapid degassing ofCO2 and calcite precipitation (Mickler et al., 2006). The high level of rel-ative humidity in Kapsia cave should limit evaporation of drip wateraffecting δ18O values, although periods of lower humidity could bemore prone to evaporative fractionation effects causing high oxygenisotope values. More importantly, ventilation could lower CO2 con-centration in the cave atmosphere, whichwould increase CO2 degassingfrom drip water resulting in enrichment of δ18O (Hendy, 1971; Mickleret al., 2004; Lachniet, 2009). Slow dripping at our measure site GK02should favor equilibrium deposition, although higher drip rates duringthe rainy season could lead to kinetic effects (Mickler et al., 2004).
In order to further test if calcite has been precipitated in isotopicequilibrium from the drip water, we calculated the water–calcite frac-tionation line by using the widely applied equations of Kim and O'Neil(1997) and Tremaine et al. (2011):
Kim and O’Neil 1997ð Þ : 1000 lnα calcite–H2Oð Þ¼ 18:03 103 T−1
� �–32:42 ð1Þ
Tremaine et al: 2011ð Þ : 1000 lnα calcite–H2Oð Þ¼ 16:1 103 T−1
� �–24:6: ð2Þ
By inserting the δ18O values of the modern drip water that we mea-sured in the present study into the two different equilibrium equations,we retrieve calculated average calcite δ18O values of −5.96‰ (V-PDB)using Eq. (1), and a value of −4.90‰ (V-PDB) using Eq. (2) (Supple-mental materials, Table 1). The theoretically retrieved value usingEq. (2) compares well with our measured values of calcite from the sta-lagmite top (−4.99‰ V-PDB) as well as with those of modern calciteprecipitated on our equipment (−4.65, −4.37, −5.11‰ V-PDB),supporting equilibrium conditions (Fig. 5C). The relatively large devia-tion of 0.96‰ between our measured values and calculated valuesusing the equation suggested by Kim and O'Neil (1997) (Fig. 5C) is inagreement with a 1.0 ± 0.5‰ offset generally found between themea-sured and predicted values when using this equation (McDermott et al.,2011).
The so called Hendy tests also support equilibrium conditions to alarge extent, with generally poor correlation between δ18O and δ13Calong single lamina and along the growth axis (Hendy and Wilson,1968; Hendy, 1971). The Hendy test, HE, that does show evidence of ki-netic fractionation (Fig. 5A) comes from a growth layer that is locatedrelatively close to the flooding horizon at 214 mm and close to the dat-ing samples that show evidence of open system conditions, suggestingthat disequilibrium conditionsmay have affected this part of the record.
From the discussion above, we conclude that precipitation of calciteoccurred under, or near, equilibrium conditions suggesting that cave airtemperature and drip water isotopic composition (δ18O) are the mainfactors controlling δ18O in the calcite.
Interpretation of stable isotopes δ18O and δ13C
Drip water δ18O values are controlled by δ18O variations in pre-cipitation and by processes during percolation, e.g., evaporation(e.g., Lachniet, 2009 and references therein). Potential mechanismsbehind the δ18O in dripwater and calcite in Kapsia Cave include conden-sation temperature, cave air temperature, amount of precipitation,seasonality, changes in atmospheric circulation/different air masses,changes of δ18O at source or change of source location.
Please cite this article as: Finné, M., et al., Speleothem evidence for late HResearch (2014), http://dx.doi.org/10.1016/j.yqres.2013.12.009
A major shift in seasonality of precipitation, or change of precipita-tion source, is not likely to have occurred during the late Holocenetime period covered by the analyzed stalagmite (Abrantes et al.,2012). There is little change in isotopic composition in themain precip-itation sources, the Mediterranean Sea and the North Atlantic, on thetime scale relevant for this study (e.g., Emeis et al., 2000; Came et al.,2007).
During the late Holocene, temperature variability in the Mediterra-nean region has been relatively small (e.g., Emeis et al., 2000; Emeisand Dawson, 2003; Almogi-Labin et al., 2009; Bordon et al., 2009;Finné et al., 2011). Thus the potential effect of temperature on isotopefractionation is limited. Furthermore, with increasing temperature inthe atmosphere, and thus condensation temperature, precipitationδ18O values will be enriched by 0.2 to 0.3‰/°C (Bard et al., 2002). Thiseffect will, to a large extent, be counterbalanced by the fractionationchanges between water and calcite causing calcite δ18O to be reducedby ca. −0.24‰/°C, at low temperatures (Kim and O'Neil, 1997; Bardet al., 2002; Drysdale et al., 2005; Zanchetta et al., 2007).
Generally, depleted (enriched) δ18O values in speleothems fromsouthern Europe and the eastern Mediterranean have been interpretedin terms of increased (decreased) rainfall amounts (Bard et al., 2002;
olocene climate variability and floods in Southern Greece, Quaternary
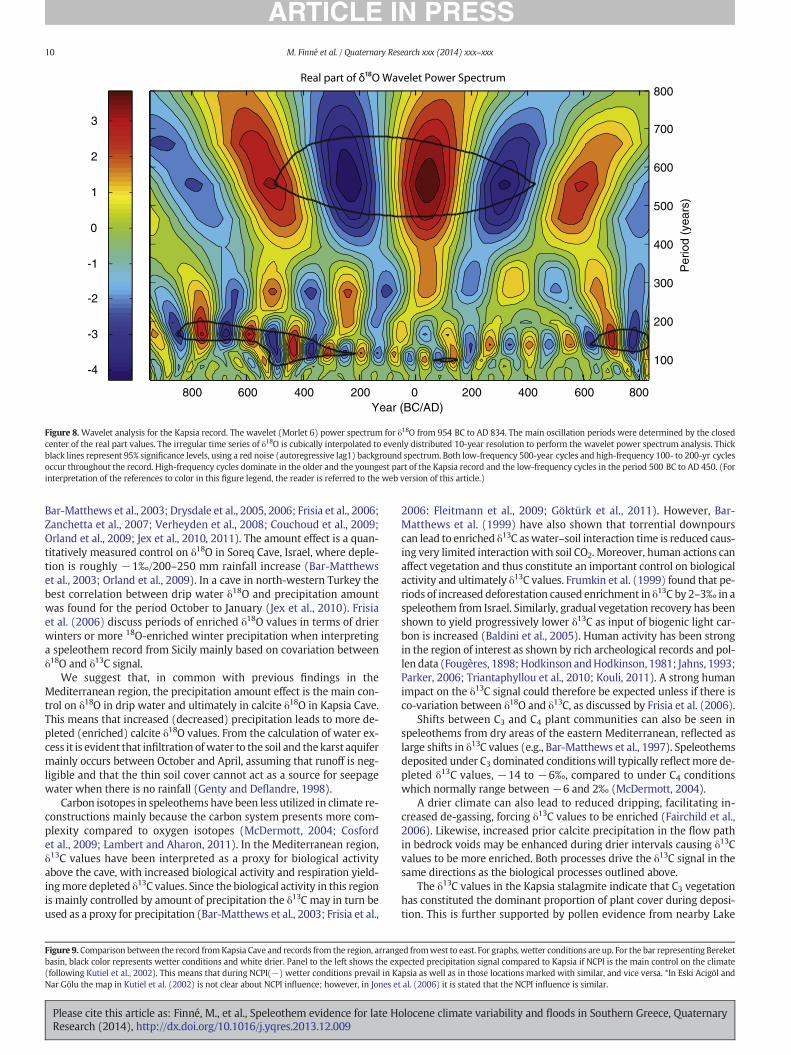
Figure 8.Wavelet analysis for the Kapsia record. The wavelet (Morlet 6) power spectrum for δ18O from 954 BC to AD 834. The main oscillation periods were determined by the closedcenter of the real part values. The irregular time series of δ18O is cubically interpolated to evenly distributed 10-year resolution to perform the wavelet power spectrum analysis. Thickblack lines represent 95% significance levels, using a red noise (autoregressive lag1) background spectrum. Both low-frequency 500-year cycles and high-frequency 100- to 200-yr cyclesoccur throughout the record. High-frequency cycles dominate in the older and the youngest part of the Kapsia record and the low-frequency cycles in the period 500 BC to AD 450. (Forinterpretation of the references to color in this figure legend, the reader is referred to the web version of this article.)
10 M. Finné et al. / Quaternary Research xxx (2014) xxx–xxx
Bar-Matthews et al., 2003; Drysdale et al., 2005, 2006; Frisia et al., 2006;Zanchetta et al., 2007; Verheyden et al., 2008; Couchoud et al., 2009;Orland et al., 2009; Jex et al., 2010, 2011). The amount effect is a quan-titatively measured control on δ18O in Soreq Cave, Israel, where deple-tion is roughly −1‰/200–250 mm rainfall increase (Bar-Matthewset al., 2003; Orland et al., 2009). In a cave in north-western Turkey thebest correlation between drip water δ18O and precipitation amountwas found for the period October to January (Jex et al., 2010). Frisiaet al. (2006) discuss periods of enriched δ18O values in terms of drierwinters or more 18O-enriched winter precipitation when interpretinga speleothem record from Sicily mainly based on covariation betweenδ18O and δ13C signal.
We suggest that, in common with previous findings in theMediterranean region, the precipitation amount effect is the main con-trol on δ18O in drip water and ultimately in calcite δ18O in Kapsia Cave.This means that increased (decreased) precipitation leads to more de-pleted (enriched) calcite δ18O values. From the calculation of water ex-cess it is evident that infiltration ofwater to the soil and the karst aquifermainly occurs between October and April, assuming that runoff is neg-ligible and that the thin soil cover cannot act as a source for seepagewater when there is no rainfall (Genty and Deflandre, 1998).
Carbon isotopes in speleothemshave been less utilized in climate re-constructions mainly because the carbon system presents more com-plexity compared to oxygen isotopes (McDermott, 2004; Cosfordet al., 2009; Lambert and Aharon, 2011). In the Mediterranean region,δ13C values have been interpreted as a proxy for biological activityabove the cave, with increased biological activity and respiration yield-ingmore depleted δ13C values. Since the biological activity in this regionis mainly controlled by amount of precipitation the δ13C may in turn beused as a proxy for precipitation (Bar-Matthews et al., 2003; Frisia et al.,
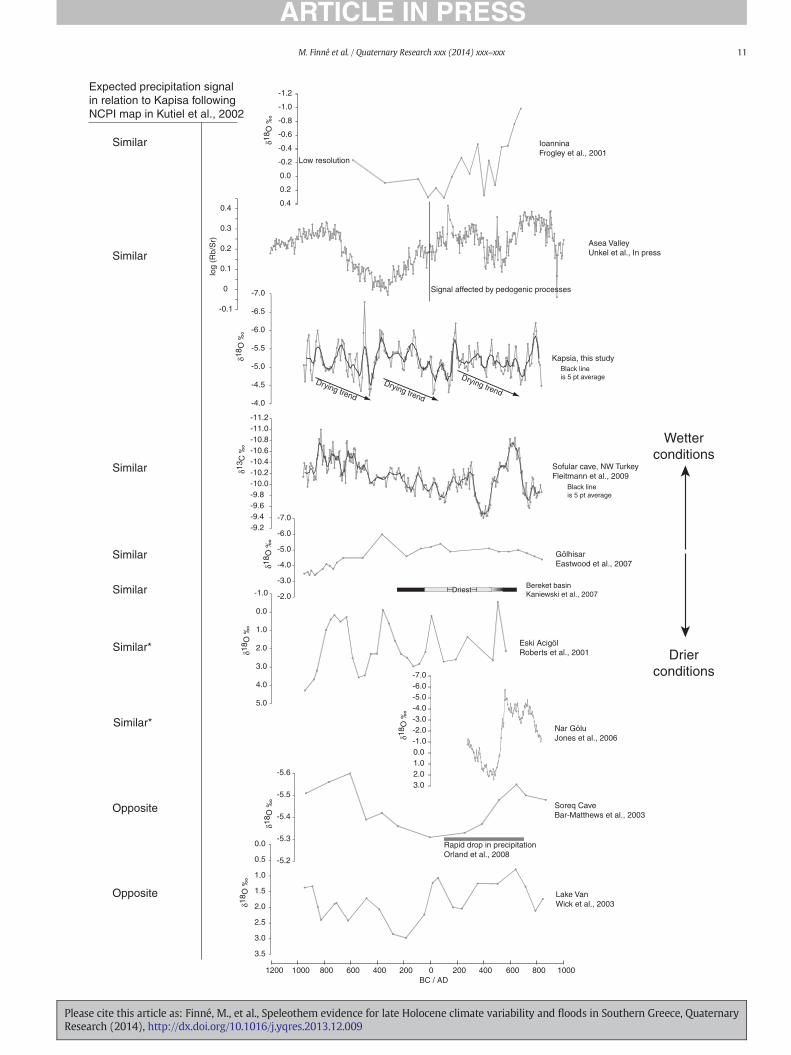
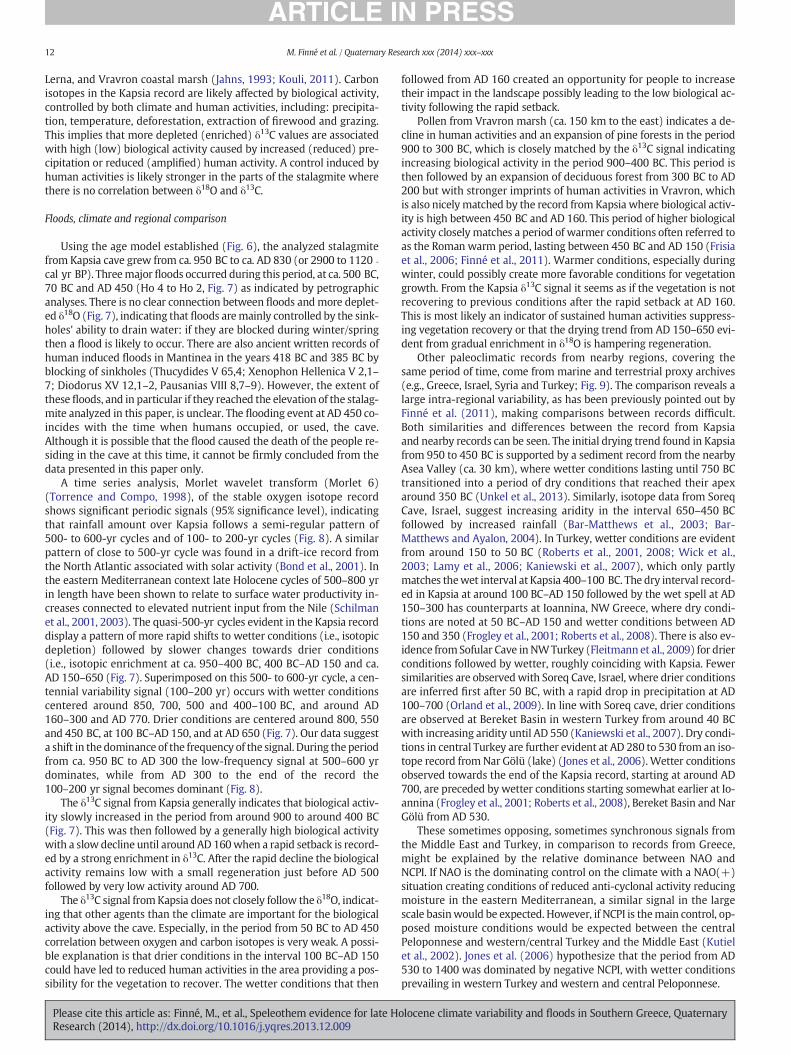
Figure 9. Comparison between the record fromKapsia Cave and records from the region, arrangbasin, black color represents wetter conditions and white drier. Panel to the left shows the ex(following Kutiel et al., 2002). This means that during NCPI(−) wetter conditions prevail in KaNar Gölu the map in Kutiel et al. (2002) is not clear about NCPI influence; however, in Jones e
Please cite this article as: Finné, M., et al., Speleothem evidence for late HResearch (2014), http://dx.doi.org/10.1016/j.yqres.2013.12.009
2006: Fleitmann et al., 2009; Göktürk et al., 2011). However, Bar-Matthews et al. (1999) have also shown that torrential downpourscan lead to enriched δ13C aswater–soil interaction time is reduced caus-ing very limited interactionwith soil CO2. Moreover, human actions canaffect vegetation and thus constitute an important control on biologicalactivity and ultimately δ13C values. Frumkin et al. (1999) found that pe-riods of increased deforestation caused enrichment in δ13C by 2–3‰ in aspeleothem from Israel. Similarly, gradual vegetation recovery has beenshown to yield progressively lower δ13C as input of biogenic light car-bon is increased (Baldini et al., 2005). Human activity has been strongin the region of interest as shown by rich archeological records and pol-len data (Fougères, 1898; Hodkinson andHodkinson, 1981; Jahns, 1993;Parker, 2006; Triantaphyllou et al., 2010; Kouli, 2011). A strong humanimpact on the δ13C signal could therefore be expected unless if there isco-variation between δ18O and δ13C, as discussed by Frisia et al. (2006).
Shifts between C3 and C4 plant communities can also be seen inspeleothems from dry areas of the eastern Mediterranean, reflected aslarge shifts in δ13C values (e.g., Bar-Matthews et al., 1997). Speleothemsdeposited under C3 dominated conditionswill typically reflectmore de-pleted δ13C values, −14 to −6‰, compared to under C4 conditionswhich normally range between −6 and 2‰ (McDermott, 2004).
A drier climate can also lead to reduced dripping, facilitating in-creased de-gassing, forcing δ13C values to be enriched (Fairchild et al.,2006). Likewise, increased prior calcite precipitation in the flow pathin bedrock voids may be enhanced during drier intervals causing δ13Cvalues to be more enriched. Both processes drive the δ13C signal in thesame directions as the biological processes outlined above.
The δ13C values in the Kapsia stalagmite indicate that C3 vegetationhas constituted the dominant proportion of plant cover during deposi-tion. This is further supported by pollen evidence from nearby Lake
ed fromwest to east. For graphs, wetter conditions are up. For the bar representing Bereketpected precipitation signal compared to Kapsia if NCPI is the main control on the climatepsia as well as in those locations marked with similar, and vice versa. *In Eski Acigöl andt al. (2006) it is stated that the NCPI influence is similar.
olocene climate variability and floods in Southern Greece, Quaternary
-7.0
-6.5
-6.0
-5.5
-5.0
-4.5
-4.0
δ18 O
‰
Kapsia, this study
-1.2
-1.0
-0.8
-0.6
-0.4
-0.2
0.0
0.2
0.4
δ18 O
‰
IoanninaFrogley et al., 2001
Similar
Low resolution
Similar
-11.2-11.0-10.8-10.6-10.4-10.2-10.0-9.8-9.6-9.4-9.2
δ13 C
‰
Sofular cave, NW TurkeyFleitmann et al., 2009
Eski AcigölRoberts et al., 2001
-1.0
0.0
1.0
2.0
3.0
4.0
5.0
δ18 O
‰
-7.0
-6.0
-5.0
-4.0
-3.0
-2.0
δ18 O
‰
GölhisarEastwood et al., 2007
0.0
0.5
1.0
1.5
2.0
2.5
3.0
3.5
Lake VanWick et al., 2003δ1
8 O ‰
-5.6
-5.5
-5.4
-5.3
-5.2
Soreq CaveBar-Matthews et al., 2003
δ18 O
‰
Rapid drop in precipitationOrland et al., 2008
-7.0-6.0-5.0-4.0-3.0-2.0-1.00.01.02.03.0
δ18 O
‰
Nar GöluJones et al., 2006
01200 1000 1000800800BC / AD
600 600400400 200 200
Expected precipitation signalin relation to Kapisa following NCPI map in Kutiel et al., 2002
Similar
Similar
Opposite
Opposite
Drying trend
Drying trend
Drying trend
Black lineis 5 pt average
Black lineis 5 pt average
Wetterconditions
Drierconditions
Bereket basinKaniewski et al., 2007
DriestSimilar
Similar*
Similar*
-0.1
0
0.1
0.2
0.3
0.4
Asea ValleyUnkel et al., In press
Signal affected by pedogenic processes
log
(Rb/
Sr)
11M. Finné et al. / Quaternary Research xxx (2014) xxx–xxx
Please cite this article as: Finné, M., et al., Speleothem evidence for late Holocene climate variability and floods in Southern Greece, QuaternaryResearch (2014), http://dx.doi.org/10.1016/j.yqres.2013.12.009
12 M. Finné et al. / Quaternary Research xxx (2014) xxx–xxx
Lerna, and Vravron coastal marsh (Jahns, 1993; Kouli, 2011). Carbonisotopes in the Kapsia record are likely affected by biological activity,controlled by both climate and human activities, including: precipita-tion, temperature, deforestation, extraction of firewood and grazing.This implies that more depleted (enriched) δ13C values are associatedwith high (low) biological activity caused by increased (reduced) pre-cipitation or reduced (amplified) human activity. A control induced byhuman activities is likely stronger in the parts of the stalagmite wherethere is no correlation between δ18O and δ13C.
Floods, climate and regional comparison
Using the age model established (Fig. 6), the analyzed stalagmitefrom Kapsia cave grew from ca. 950 BC to ca. AD 830 (or 2900 to 1120 -
cal yr BP). Threemajor floods occurred during this period, at ca. 500 BC,70 BC and AD 450 (Ho 4 to Ho 2, Fig. 7) as indicated by petrographicanalyses. There is no clear connection between floods andmore deplet-ed δ18O (Fig. 7), indicating that floods aremainly controlled by the sink-holes' ability to drain water: if they are blocked during winter/springthen a flood is likely to occur. There are also ancient written records ofhuman induced floods in Mantinea in the years 418 BC and 385 BC byblocking of sinkholes (Thucydides V 65,4; Xenophon Hellenica V 2,1–7; Diodorus XV 12,1–2, Pausanias VIII 8,7–9). However, the extent ofthese floods, and in particular if they reached the elevation of the stalag-mite analyzed in this paper, is unclear. The flooding event at AD 450 co-incides with the time when humans occupied, or used, the cave.Although it is possible that the flood caused the death of the people re-siding in the cave at this time, it cannot be firmly concluded from thedata presented in this paper only.
A time series analysis, Morlet wavelet transform (Morlet 6)(Torrence and Compo, 1998), of the stable oxygen isotope recordshows significant periodic signals (95% significance level), indicatingthat rainfall amount over Kapsia follows a semi-regular pattern of500- to 600-yr cycles and of 100- to 200-yr cycles (Fig. 8). A similarpattern of close to 500-yr cycle was found in a drift-ice record fromthe North Atlantic associated with solar activity (Bond et al., 2001). Inthe eastern Mediterranean context late Holocene cycles of 500–800 yrin length have been shown to relate to surface water productivity in-creases connected to elevated nutrient input from the Nile (Schilmanet al., 2001, 2003). The quasi-500-yr cycles evident in the Kapsia recorddisplay a pattern of more rapid shifts to wetter conditions (i.e., isotopicdepletion) followed by slower changes towards drier conditions(i.e., isotopic enrichment at ca. 950–400 BC, 400 BC–AD 150 and ca.AD 150–650 (Fig. 7). Superimposed on this 500- to 600-yr cycle, a cen-tennial variability signal (100–200 yr) occurs with wetter conditionscentered around 850, 700, 500 and 400–100 BC, and around AD160–300 and AD 770. Drier conditions are centered around 800, 550and 450 BC, at 100 BC–AD 150, and at AD 650 (Fig. 7). Our data suggesta shift in the dominance of the frequency of the signal. During the periodfrom ca. 950 BC to AD 300 the low-frequency signal at 500–600 yrdominates, while from AD 300 to the end of the record the100–200 yr signal becomes dominant (Fig. 8).
The δ13C signal from Kapsia generally indicates that biological activ-ity slowly increased in the period from around 900 to around 400 BC(Fig. 7). This was then followed by a generally high biological activitywith a slow decline until around AD 160when a rapid setback is record-ed by a strong enrichment in δ13C. After the rapid decline the biologicalactivity remains low with a small regeneration just before AD 500followed by very low activity around AD 700.
The δ13C signal fromKapsia does not closely follow the δ18O, indicat-ing that other agents than the climate are important for the biologicalactivity above the cave. Especially, in the period from 50 BC to AD 450correlation between oxygen and carbon isotopes is very weak. A possi-ble explanation is that drier conditions in the interval 100 BC–AD 150could have led to reduced human activities in the area providing a pos-sibility for the vegetation to recover. The wetter conditions that then
Please cite this article as: Finné, M., et al., Speleothem evidence for late HResearch (2014), http://dx.doi.org/10.1016/j.yqres.2013.12.009
followed from AD 160 created an opportunity for people to increasetheir impact in the landscape possibly leading to the low biological ac-tivity following the rapid setback.
Pollen from Vravron marsh (ca. 150 km to the east) indicates a de-cline in human activities and an expansion of pine forests in the period900 to 300 BC, which is closely matched by the δ13C signal indicatingincreasing biological activity in the period 900–400 BC. This period isthen followed by an expansion of deciduous forest from 300 BC to AD200 but with stronger imprints of human activities in Vravron, whichis also nicelymatched by the record from Kapsia where biological activ-ity is high between 450 BC and AD 160. This period of higher biologicalactivity closely matches a period of warmer conditions often referred toas the Roman warm period, lasting between 450 BC and AD 150 (Frisiaet al., 2006; Finné et al., 2011). Warmer conditions, especially duringwinter, could possibly create more favorable conditions for vegetationgrowth. From the Kapsia δ13C signal it seems as if the vegetation is notrecovering to previous conditions after the rapid setback at AD 160.This is most likely an indicator of sustained human activities suppress-ing vegetation recovery or that the drying trend from AD 150–650 evi-dent from gradual enrichment in δ18O is hampering regeneration.
Other paleoclimatic records from nearby regions, covering thesame period of time, come from marine and terrestrial proxy archives(e.g., Greece, Israel, Syria and Turkey; Fig. 9). The comparison reveals alarge intra-regional variability, as has been previously pointed out byFinné et al. (2011), making comparisons between records difficult.Both similarities and differences between the record from Kapsiaand nearby records can be seen. The initial drying trend found in Kapsiafrom 950 to 450 BC is supported by a sediment record from the nearbyAsea Valley (ca. 30 km), where wetter conditions lasting until 750 BCtransitioned into a period of dry conditions that reached their apexaround 350 BC (Unkel et al., 2013). Similarly, isotope data from SoreqCave, Israel, suggest increasing aridity in the interval 650–450 BCfollowed by increased rainfall (Bar-Matthews et al., 2003; Bar-Matthews and Ayalon, 2004). In Turkey, wetter conditions are evidentfrom around 150 to 50 BC (Roberts et al., 2001, 2008; Wick et al.,2003; Lamy et al., 2006; Kaniewski et al., 2007), which only partlymatches thewet interval at Kapsia 400–100 BC. The dry interval record-ed in Kapsia at around 100 BC–AD 150 followed by the wet spell at AD150–300 has counterparts at Ioannina, NW Greece, where dry condi-tions are noted at 50 BC–AD 150 and wetter conditions between AD150 and 350 (Frogley et al., 2001; Roberts et al., 2008). There is also ev-idence fromSofular Cave in NWTurkey (Fleitmann et al., 2009) for drierconditions followed by wetter, roughly coinciding with Kapsia. Fewersimilarities are observed with Soreq Cave, Israel, where drier conditionsare inferred first after 50 BC, with a rapid drop in precipitation at AD100–700 (Orland et al., 2009). In line with Soreq cave, drier conditionsare observed at Bereket Basin in western Turkey from around 40 BCwith increasing aridity until AD 550 (Kaniewski et al., 2007). Dry condi-tions in central Turkey are further evident at AD 280 to 530 from an iso-tope record from Nar Gölü (lake) (Jones et al., 2006).Wetter conditionsobserved towards the end of the Kapsia record, starting at around AD700, are preceded by wetter conditions starting somewhat earlier at Io-annina (Frogley et al., 2001; Roberts et al., 2008), Bereket Basin and NarGölü from AD 530.
These sometimes opposing, sometimes synchronous signals fromthe Middle East and Turkey, in comparison to records from Greece,might be explained by the relative dominance between NAO andNCPI. If NAO is the dominating control on the climate with a NAO(+)situation creating conditions of reduced anti-cyclonal activity reducingmoisture in the eastern Mediterranean, a similar signal in the largescale basinwould be expected. However, if NCPI is themain control, op-posed moisture conditions would be expected between the centralPeloponnese and western/central Turkey and the Middle East (Kutielet al., 2002). Jones et al. (2006) hypothesize that the period from AD530 to 1400 was dominated by negative NCPI, with wetter conditionsprevailing in western Turkey and western and central Peloponnese.
olocene climate variability and floods in Southern Greece, Quaternary
13M. Finné et al. / Quaternary Research xxx (2014) xxx–xxx
Conclusions
Wehave provided the first stalagmite-based paleoclimate record forsouthern Greece. The record covers a near 1800-yr-long period from950 BC to AD 830. The stable oxygen isotope signal in the stalagmiteshows that the regional hydroclimate followed a semi-regular patternof 500- to 600-yr cycles, similar to cycles found in the North Atlantic,which might be related to solar activity cycles. The cycles evident inour record include rapid shifts towards wetter conditions followed byslowly developing aridity. Centennial-scale variability in hydroclimaticconditions is superimposed on the low-frequency cycles. Wetter condi-tions are inferred around 850, 700, 500 and 400–100 BC, and around AD160–300 and AD 770. Driest conditions are inferred to have occurredaround 450 BC, AD 100–150 and AD 650.
Our record shows sometimes an opposing and sometimes a syn-chronous signal with records from theMiddle East and Turkey, indicat-ing shifts in the relative dominance between North Atlantic Oscillationand theNorth Sea–Caspian Pattern Index as regional climate controllingatmospheric processes.
Detrital hiatuses in the stalagmite show that floods occurred in thecave in 500 BC, 70 BC and AD 450. The latest floodmay have influencedthe presence of human activity in the cave, as is observed fromarcheological evidence from the 4th and 5th centuries AD.
Our record provides new knowledge, both about climate variabilityfrom the Peloponnese, a region where this type of data is scarce, andabout local environmental conditions that might have impacted onpast human activities. By adding this piece of information a better un-derstanding of the regional climate is achieved and attempts to under-stand climate variability in the region does not solely have to rely onmore distant paleoclimate records. This type of data further enhancesthe possibilities for improved analysis of the climate–society interac-tions over time in this archeologically rich region.
Supplementary data to this article can be found online at http://dx.doi.org/10.1016/j.yqres.2013.12.009.
Acknowledgment
This research has been carried out within the framework of theNavarino Environmental Observatory (NEO), Messinia, Greece, a coop-eration between Stockholm University, the Academy of Athens andTEMES S.A. NEO is dedicated to research and education on the climateand environment of the Mediterranean region. We thank the Ephorateof Palaeoanthropology and Speleology of Southern Greece for permit-ting visits to and sampling inKapsia Cave andYannis Bassiakos for intro-ducing us to the cave. Grigoris Rousiotis provided valuable informationabout the cave and the surroundings including recent floods and fires.Joylon Desmarchelier, Nikos Kalivitis, Giorgos Maneas, Meighan Boydand Kristina Westermark assisted during field work. Heike Sigmund,Stable Isotope Laboratory (SIL), Department of Geological Sciences,Stockholm University, provided help and comments on stable iso-tope analyses. Silvia Frisia gave invaluable input on the petro-graphic analyzes. Discussions with and help from Göran Possnert,Ångströmlaboratoriet, Uppsala University, has been crucial for 14C-dating and interpretations of the results. Marika Wennbom assistedwith maps. Comments from Senior Editor Derek Booth and two anony-mous reviewers improved the quality of themanuscript. Fieldworkwasfinanced by The Swedish Society for Anthropology and Geography andAlbert och Maria Bergström stiftelse. Analytical work was financed byM Althins Foundation, Carl Mannerfelts Fond and Lagrelius Fond.
References
Abrantes, F., Voelker, A.H.L., Sierro, F.J., Naughton, F., Rodrigues, T., Cacho, I., Ariztegui, D.,Brayshaw, D., Sicre,M.-A., Batista, L., 2012. Paleoclimate variability in theMediterraneanRegion. In: Lionello, P. (Ed.), Climate of the Mediterranean Region: From the Past to theFuture. Elsevier, London, pp. 1–86.
Please cite this article as: Finné, M., et al., Speleothem evidence for late HResearch (2014), http://dx.doi.org/10.1016/j.yqres.2013.12.009
Almogi-Labin, A., Bar-Matthews, M., Shriki, D., Kolosovsky, E., Paterne, M., Schilman, B.,Ayalon, A., Aizenshtat, Z., Matthews, A., 2009. Climatic variability during the last90 ka of the southern and northern Levantine Basin as evident from marine recordsand speleothems. Quaternary Science Reviews 28, 2882–2896.
Argiriou, A.A., Lykoudis, S., 2006. Isotopic composition of precipitation in Greece. Journalof Hydrology 327, 486–495.
Atherden, M., Hall, J., Wright, J.C., 1993. A pollen diagram from the northeast Peloponnese,Greece: implications for vegetation history and archaeology. TheHolocene 4, 351–356.
Baldini, J.U.L., McDermott, F., Baker, A., Baldini, L.M., Mattey, D.P., Railsback, L.B., 2005. Bio-mass effects on stalagmite growth and isotope ratios: a 20th century analogue fromWiltshire, England. Earth and Planetary Science Letters 240, 486–494.
Bard, E., Antonioli, F., Silenzi, S., 2002. Sea-level during the penultimate interglacial periodbased on a submerged stalagmite from Argentarola Cave (Italy). Earth and PlanetaryScience Letters 196, 135–146.
Bar-Matthews, M., Ayalon, A., 2004. Speleothems as palaeoclimate indicators, a case studyfrom Soreq Cave located in the eastern Mediterranean region, Israel. In: Battarbee,R.W., Gasse, F., Stickley, C.E. (Eds.), Past Climate Variability Through Europe andAfrica. Springer, Dordrecht, pp. 363–391.
Bar-Matthews, M., Ayalon, A., 2011. Mid-Holocene climate variations revealed by high-resolution speleothem records from Soreq Cave, Israel and their correlation with cul-tural changes. The Holocene 21, 163–171.
Bar-Matthews, M., Ayalon, A., Kaufman, A., 1997. Late Quaternary Paleoclimate in theEastern Mediterranean Region from stable isotope analysis of speleothems at SoreqCave, Israel. Quaternary Research 47, 155–168.
Bar-Matthews, M., Ayalon, A., Kaufman, A., Wasserburg, G.J., 1999. The easternMediterranean paleoclimate as a reflection of regional events: Soreq cave, Israel.Earth and Planetary Science Letters 166, 85–95.
Bar-Matthews, M., Ayalon, A., Gilmour, M., Matthews, A., Hawkesworth, C.J., 2003. Sea–land oxygen isotopic relationships from planktonic foraminifera and speleothemsin the Eastern Mediterranean region and their implication for paleorainfall during in-terglacial intervals. Geochimica et Cosmochimica Acta 67, 3181–3199.
Bartsiokas A., Merdenisianos K., Zafeiratos K., 1981. Τα ανθρωπολογικά ευρήματατου σπηλαίου Κάψια Τριπόλεως και η ιστορία τους. (1ο ΠανελλήνιοΣπηλαιολογικό Συμπόσιο. Αθήνα 1981. Δελτίο Ελληνικής ΣπηλαιολογικήςΕταιρείας (Ε.Σ.Ε.) ΧVΙΙΙ 1–2, 1981–82).
Bond, G., Kromer, B., Beer, J., Muscheler, R., Evans, M.N., Showers, W., Hoffmann, S., Lotti-Bond, R., Hajdas, I., Bonani, G., 2001. Persistent solar influence on north Atlantic cli-mate during the Holocene. Science 294, 2130–2136.
Bordon, A., Peyron, O., Lézine, A.-M., Brewer, S., Fouache, E., 2009. Pollen-inferred Late-Glacial and Holocene climate in southern Balkans (Lake Maliq). Quaternary Interna-tional 200, 19–30.
Came, R.E., Oppo, D.W., McManus, J.F., 2007. Amplitude and timing of temperature andsalinity variability in the subpolar North Atlantic over the past 10 k.y. Geology 35,315–318.
Cheng, H., Edwards, R.L., Hoff, J., Gallup, C.D., Richards, D.A., Asmerom, Y., 2000. The half-lives of uranium-234 and thorium-230. Chemical Geology 169, 17–33.
Cosford, J., Qing, H., Mattey, D., Eglington, B., Zhang, M., 2009. Climatic and local effects onstalagmite δ13C values at Lianhua Cave, China. Palaeogeography, Palaeoclimatology,Palaeoecology 280, 235–244.
Couchoud, I., Genty, D., Hoffmann, D., Drysdale, R., Blamart, D., 2009. Millennial-scale cli-mate variability during the Last Interglacial recorded in a speleothem from south-western France. Quaternary Science Reviews 28, 3263–3274.
Cullen, H.M., DeMenocal, P.B., 2000. North Atlantic influence on Tigris–Euphratesstreamflow. International Journal of Climatology 20, 853–863.
Di Rita, F., Magri, D., 2009. Holocene drought, deforestation and evergreen vegetationdevelopment in the central Mediterranean: a 5500 year record from Lago AliminiPiccolo, Apulia, southeast Italy. The Holocene 19, 295–306.
Dorale, J.A., Edwards, R.L., Alexander, E.C., Shen, C.-C., Richards, D.A., Cheng, H., 2004.Uranium-series dating of speleothems: current techniques, limits and applications.In: Sasowsky, I.D., Mylroie, J. (Eds.), Studies of Cave Sediments. Physical and ChemicalRecords of Palaeoclimate. Kluwer Academic, New York, pp. 177–197.
Dotsika, E., Lykoudis, S., Poutoukis, D., 2010. Spatial distribution of the isotopic composi-tion of precipitation and spring water in Greece. Global and Planetary Change 71,141–149.
Drysdale, R.N., Zanchetta, G., Hellstrom, J.C., Fallick, A.E., Zhao, J.-X., 2005. Stalagmite evi-dence for the onset of the Last Interglacial in southern Europe at 129 ± 1 ka. Geo-physical Research Letters 32, 1–4.
Drysdale, R., Zanchetta, G., Hellstrom, J., Maas, R., Fallick, A., Pickett, M., Cartwright, I.,Piccini, L., 2006. Late Holocene drought responsible for the collapse of Old World civ-ilizations is recorded in an Italian flowstone. Geology 34, 101–104.
Eastwood, W.J., Leng, M.J., Roberts, N., Davis, B., 2007. Holocene climate change inthe eastern Mediterranean region: a comparison of stable isotope and pollendata from Lake Gölhisar, southwest Turkey. Journal of Quaternary Science 22,327–341.
Emeis, K.-C., Dawson, A.G., 2003. Holocene palaeoclimate records over Europe and theNorth Atlantic. The Holocene 13, 305–309.
Emeis, K.C., Struck, U., Schulz, H.M., Rosenberg, R., Bernasconi, S., Erlenkeuser, H.,Sakamoto, T., Martinez-Ruiz, F., 2000. Temperature and salinity variations ofMediterranean Sea surface waters over the last 16,000 years from records of plank-tonic stable oxygen isotopes and alkenone unsaturation ratios. Palaeogeography,Palaeoclimatology, Palaeoecology 158, 259–280.
Fairchild, I.J., Smith, C.L., Baker, A., Fuller, L., Spötl, C., Mattey, D., McDermott, F., 2006.Modification and preservation of environmental signals in speleothems. Earth-Science Reviews 75, 105–153.
Faupl, P., Pavlopoulos, A., Migiros, G., 2002. Provenance of the Peloponnese (Greece)flysch based on heavy minerals. Geological Magazine 139, 513–524.
olocene climate variability and floods in Southern Greece, Quaternary
14 M. Finné et al. / Quaternary Research xxx (2014) xxx–xxx
Feidas, H., Makrogiannis, T., Bora-Senta, E., 2004. Trend analysis of air temperature timeseries in Greece and their relationship with circulation using surface and satellitedata: 1955–2001. Theoretical and Applied Climatology 79, 185–208.
Fensterer, C., Scholz, D., Hoffmann, D., Mangini, A., Pajón, J.M., 2010. 230Th/U-dating of alate Holocene low uranium speleothem from Cuba. IOP Conf. Ser.: Earth and Environ-mental Science, 9 012015.
Finné, M., Holmgren, K., Sundqvist, H.S., Weiberg, E., Lindblom, M., 2011. Climate in theeastern Mediterranean, and adjacent regions, during the past 6 000 years— a review.Journal of Archaeological Science 38, 3153–3173.
Fleitmann, D., Cheng, H., Badertscher, S., Edwards, R.L., Mudelsee, M., Göktürk, O.M.,Fankhauser, A., Pickering, R., Raible, C.C., Matter, A., Kramers, J., Tüysüz, O., 2009.Timing and climatic impact of Greenland interstadials recorded in stalagmites fromnorthern Turkey. Geophysical Research Letters 36 (art. no. L19707).
Fougères, G., 1898. Mantinée et l' Arcadie orientale (Paris 1898).Frisia, S., Borsato, A., 2010. Karst (chapter 6). Developments in Sedimentology 61 (C),
269–318.Frisia, S., Borsato, A., Mangini, A., Spötl, C., Madonia, G., Sauro, U., 2006. Holocene climate
variability in Sicily from a discontinuous stalagmite record and theMesolithic to Neo-lithic transition. Quaternary Research 66, 388–400.
Frogley, M.R., Griffiths, H.I., Heaton, T.H.E., 2001. Historical biogeography and late Quater-nary environmental change of Lake Pamvotis, Ioannina (north-western Greece):evidence from ostracods. Journal of Biogeography 28, 745–756.
Frumkin, A., Carmi, I., Gopher, A., Ford, D.C., Schwarcz, H.P., Tsuk, T., 1999. A Holocenemillennial-scale climatic cycle from a speleothem in Nahal Qanah Cave, Israel. TheHolocene 9, 677–682.
Genty, D., Deflandre, G., 1998. Drip flow variations under a stalactite of the Pere Noel cave(Belgium). Evidence of seasonal variations and air pressure constraints. Journal ofHydrology 211, 208–232.
Genty, D., Massault, M., 1997. Bomb 14C recorded in laminated speleothems: calculationof dead carbon proportion. Radiocarbon 39, 33–48.
Genty, D., Vokal, B., Obelic, B., Massault, M., 1998. Bomb 14C time history recorded intwo modern stalagmites — importance for soil organic matter dynamics andbomb 14C distribution over continents. Earth and Planetary Science Letters 160,795–809.
Genty, D., Massault, M., Gilmour, M., Baker, A., Verheyden, S., Kepens, E., 1999. Calculationof past dead carbon proportion and variability by the comparison of AMS 14C andTIMS U/Th ages on two Holocene stalagmites. Radiocarbon 41, 251–270.
Göktürk, O.M., Fleitmann, D., Badertscher, S., Cheng, H., Edwards, R.L., Leuenberger, M.,Fankhauser, A., Tüysüz, O., Kramers, J., 2011. Climate on the southern Black Seacoast during the Holocene: implications from the Sofular Cave record. QuaternaryScience Reviews 30, 2433–2445.
Gopher, A., Ayalon, A., Bar-Matthews, M., Barkai, R., Frumkin, A., Karkanas, P.,Shahack-Gross, R., 2010. The chronology of the late Lower Paleolithic in theLevant based on U–Th ages of speleothems from Qesem Cave, Israel. QuaternaryGeochronology 5, 644–656.
Grant, K.M., Rohling, E.J., Bar-Matthews, M., Ayalon, A., Medina-Elizalde, M., BronkRamsey, C., Satow, C., Roberts, A.P., 2012. Rapid coupling between ice volume andpolar temperature over the past 150 kyr. Nature 491, 744–747.
Harding, A.E., Palutikof, J., Holt, T., 2009. The climate system. In: Woodward, J.C.(Ed.), The Physical Geography of the Mediterranean. Oxford University Press,Oxford, pp. 69–88.
Hellstrom, J., 2006. U–Th dating of speleothems with high initial 230Th using stratigraph-ical constraint. Quaternary Geochronology 1, 289–295.
Henderson, G.M., Slowey, N.C., Fleisher, M.Q., 2001. U–Th dating of carbonate platformand slope sediments. Geochimica et Cosmochimica Acta 65, 2757–2770.
Hendy, C.H., 1971. The isotopic geochemistry of speleothems—I. The calculation of the ef-fects of different modes of formation on the isotopic composition of speleothems andtheir applicability as palaeoclimatic indicators. Geochimica et Cosmochimica Acta 35,801–824.
Hendy, C.H.,Wilson, A.T., 1968. Palaeoclimatic data from speleothems. Nature 219, 48–51.Higgins, M.D., Higgins, R.A., 1996. A Geological Companion to Greece and the Aegean.
Duckworth, London (240 pp.).Hodge, E., McDonald, J., Fischer, M., Redwood, D., Hual, Q., Levchenko, V., Drysdale, R.,
Waring, C., Fink, D., 2011. Using the 14C bomb pulse to date young speleothems. Ra-diocarbon 53, 345–357.
Hodkinson, S., Hodkinson, H., 1981. Mantineia and the Mantinike: settlement and societyin a Greek Polis. ABSA 76 (1981), 239–296.
Jahns, S., 1993. On the Holocene vegetation history of the Argive Plain (Peloponnese,southern Greece). Vegetation History and Archaeobotany 2, 187–203.
Jex, C.N., Baker, A., Fairchild, I.J., Eastwood, W.J., Leng, M.J., Sloane, H.J., Thomas, L.,Bekaroğlu, E., 2010. Calibration of speleothem δ18Owith instrumental climate recordsfrom Turkey. Global and Planetary Change 71, 207–217.
Jex, C.N., Baker, A., Eden, J.M., Eastwood, W.J., Fairchild, I.J., Leng, M.J., Thomas, L., Sloane,H.J., 2011. A 500 yr speleothem-derived reconstruction of late autumn–winter pre-cipitation, northeast Turkey. Quaternary Research 75, 399–405.
Jones, M.D., Roberts, C.N., Leng, M.J., Türkes, M., 2006. A high-resolution late Holocenelake isotope record from Turkey and links to North Atlantic and monsoon climate.Geology 34, 361–364.
Kaniewski, D., Paulissen, E., De Laet, V., Dossche, K., Waelkens, M., 2007. A high resolutionLate Holocene landscape ecological history inferred from an intramontane basin inthe Western Taurus Mountains, Turkey. Quaternary Science Reviews 26, 2201–2218.
Kaufman, A., Wasserburg, G.J., Porcelli, D., Bar-Matthews, M., Ayalon, A., Halicz, L., 1998.U–Th isotope systematics from the Soreq cave, Israel and climatic correlations.Earth and Planetary Science Letters 156, 141–155.
Kim, S.-T., O'Neil, J.R., 1997. Equilibrium and nonequilibrium oxygen isotope effects insynthetic carbonates. Geochimica et Cosmochimica Acta 61, 3461–3475.
Please cite this article as: Finné, M., et al., Speleothem evidence for late HResearch (2014), http://dx.doi.org/10.1016/j.yqres.2013.12.009
Kontopoulos, N., Avramidis, P., 2003. A late Holocene record of environmental changesfrom the Aliki lagoon, Egion, North Peloponnesus, Greece. Quaternary International111, 75–90.
Kouli, K., 2011. Vegetation development and human activities in Attiki (SE Greece) duringthe last 5,000 years. Vegetation History Archaeobotany 21, 267–278.
Kraft, J.C., Rapp Jr., G.R., Aschenbrenner, S.E., 1980. Late Holocene palaeogeomorphic re-constructions in the area of the Bay of Navarino: Sandy Pylos. Journal of Archaeolog-ical Science 7, 187–210.
Kutiel, H., Benaroch, Y., 2002. North Sea-Caspian pattern (NCP) — an upper level atmo-spheric teleconnection affecting the EasternMediterranean: identification and defini-tion. Theoretical and Applied Climatology 71, 17–28.
Kutiel, H., Maheras, P., Türkeş, M., Paz, S., 2002. North Sea–Caspian Pattern (NCP) —an upper level atmospheric teleconnection affecting the eastern Mediterranean— implications on the regional climate. Theoretical and Applied Climatology72, 173–192.
Lachniet, M.S., 2009. Climatic and environmental controls on speleothem oxygen-isotopevalues. Quaternary Science Reviews 28, 412–432.
Lambert, W.J., Aharon, P., 2011. Controls on dissolved inorganic carbon and δ13C in cavewaters from DeSoto Caverns: implications for speleothem δ13C assessments.Geochimica et Cosmochimica Acta 75, 753–768.
Lamy, F., Arz, H.W., Bond, G.C., Bahr, A., Pätzold, J., 2006. Multicentennial-scale hydrolog-ical changes in the Black Sea and northern Red Sea during the Holocene and theArctic/North Atlantic Oscillation. Paleoceanography 21, PA1008.
Linge, H., Baker, A., Andersson, C., Lauritzen, S.-., 2009. Variability in luminescent lamina-tion and initial 230Th/232Th activity ratios in a late Holocene stalagmite from northernNorway. Quaternary Geochronology 4, 181–192.
Ludwig, K.R., Titterington, D.M., 1994. Calculation of 230Th U isochrons, ages, and errors.Geochimica et Cosmochimica Acta 58, 5031–5042.
McDermott, F., 2004. Palaeo-climate reconstruction from stable isotope variations inspeleothems: a review. Quaternary Science Reviews 23, 901–918.
McDermott, F., Atkinson, T.C., Fairchild, I.J., Baldini, L.M., Mattey, D.P., 2011. A first evalu-ation of the spatial gradients in δ18O recorded by European Holocene speleothems.Global and Planetary Change 79, 275–287.
Merdenisianos, C., 2005. The cave of Kapsia at Mantinia and its anthropological findings.Hellenic Speleological Society.
Mickler, P.J., Banner, J.L., Stern, L., Asmerom, Y., Edwards, R.L., Ito, E., 2004. Stable isotopevariations in modern tropical speleothems: evaluating equilibrium vs. kinetic isotopeeffects. Geochimica et Cosmochimica Acta 68, 4381–4393.
Mickler, P.J., Stern, L.A., Banner, J.L., 2006. Large kinetic isotope effects in modernspeleothems. Bulletin of the Geological Society of America 118, 65–81.
Orland, I.J., Bar-Matthews, M., Kita, N.T., Ayalon, A., Matthews, A., Valley, J.W., 2009. Cli-mate deterioration in the Eastern Mediterranean as revealed by ion microprobe anal-ysis of a speleothem that grew from 2.2 to 0.9 ka in Soreq Cave, Israel. QuaternaryResearch 71, 27–35.
Parker, C., 2006. Arkadian landscapes. Rosetta 1, 10–21.Pitsios, T., 1984. Η ανθρωπολογική μελέτη των σκελετικών ευρημάτων
αρχαιολογικών ανασκαφών. Ανθρωπολογικά 6, 41–51.Pitsios, T., Ioannou, I., Merdenisianos, K., 1995. 5th International Congress on Cave
Development, Evolution and Environment. Deltion ESE, vol. XXI, p. 201(Athens).
Psathi, E., 2004. Σπήλαιο Κάψια. Archaeologicon Deltion 56–59 (2001–2004),522.
Richards, D.A., Dorale, J.A., 2003. Uranium-series chronology and environmentalapplications of speleothems. Reviews in Mineralogy and Geochemistry 52,407–460.
Roberts, N., Reed, J.M., Leng, M.J., Kuzucuoglu, C., Fontugne, M., Bertaux, J.,Woldring, H., Bottema, S., Black, S., Hunt, E., Karabiyikoglu, M., 2001. Thetempo of Holocene climatic change in the eastern Mediterranean region: newhigh-resolution crater-lake sediment data from central Turkey. The Holocene11, 721–736.
Roberts, N., Jones, M.D., Benkaddour, A., Eastwood, W.J., Filippi, M.L., Frogley, M.R.,Lamb, H.F., Leng, M.J., Reed, J.M., Stein, M., Stevens, L., Valero-Garcés, B.,Zanchetta, G., 2008. Stable isotope records of Late Quaternary climate and hy-drology from Mediterranean lakes: the ISOMED synthesis. Quaternary ScienceReviews 27, 2426–2441.
Roberts, N., Eastwood, W.J., Kuzucuoğlu, C., Fiorentino, G., Caracuta, V., 2011. Climatic,vegetation and cultural change in the eastern Mediterranean during the mid-Holocene environmental transition. The Holocene 21, 147–162.
Schilman, B., Almogi-Labin, A., Bar-Matthews, M., Labeyrie, L., Paterne, M., Luz, B., 2001.Long- and short-term carbon fluctuations in the Eastern Mediterranean during thelate Holocene. Geology 29, 1099–1102.
Schilman, B., Almogi-Labin, A., Bar-Matthews, M., Luz, B., 2003. Late Holocene productiv-ity and hydrographic variability in the eastern Mediterranean inferred from benthicforaminiferal stable isotopes. Paleoceanography 18.
Thiébault, F., Fleury, J.J., Clément, B., Dégardin, J.M., 1994. Paleogeographic andpaleotectonic implications of clay mineral distribution in late Jurassic–early Creta-ceous sediments of the Pindos–Olonos and Beotian Basins, Greece. Palaeogeography,Palaeoclimatology, Palaeoecology 108, 23–40.
Thornthwaite, C.W., 1954. The measurement of potential evapotranspiration. Mather,Seabrook, NJ (225 pp.).
Torrence, C., Compo, G.P., 1998. A practical guide to wavelet analysis. Bulletin of theAmerican Meteorological Society 79, 61–78.
Tremaine, D.M., Froelich, P.N., Wang, Y., 2011. Speleothem calcite farmed in situ:modern calibration of δ18O and δ13C paleoclimate proxies in a continuously-monitored natural cave system. Geochimica et Cosmochimica Acta 75,4929–4950.
olocene climate variability and floods in Southern Greece, Quaternary

15M. Finné et al. / Quaternary Research xxx (2014) xxx–xxx
Triantaphyllou, M.V., Kouli, K., Tsourou, T., Koukousioura, O., Pavlopoulos, K., Dermitzakis,M.D., 2010. Paleoenvironmental changes since 3000 BC in the coastal marsh ofVravron (Attica, SE Greece). Quaternary International 216, 14–22.
Türkeş, M., Erlat, E., 2003. Precipitation changes and variability in Turkey linked tothe North Atlantic oscillation during the period 1930–2000. International Journal ofClimatology 23, 1771–1796.
Unkel, I., Schimmelmann, A., Shriner, C., Forsén, J., Heymann, C., Brückner, H., 2013. Theenvironmental history of the last 6500 years in the Asea Valley (Peloponnese,Greece) and its linkage to the local archaeological record. Zeitschrift fürGeomorphologie (in press).
Urban, B., Fuchs, M., 2005. Late Pleistocene vegetation of the basin of Phlious, NE-Pelo-ponnese, Greece. Review of Palaeobotany and Palynology 137, 15–29.
Verheyden, S., Nader, F.H., Cheng, H.J., Edwards, L.R., Swennen, R., 2008. Paleoclimate recon-struction in the Levant region from the geochemistry of a Holocene stalagmite from theJeita Cave, Lebanon. Quaternary Research 70, 368–381.
Wick, L., Lemcke, G., Sturm, M., 2003. Evidence of Lateglacial and Holocene climaticchange and human impact in eastern Anatolia: high-resolution pollen, charcoal, iso-topic and geochemical records from the laminated sediments of Lake Van, Turkey.The Holocene 13, 665–675.
Zanchetta, G., Drysdale, R.N., Hellstrom, J.C., Fallick, A.E., Isola, I., Gagan, M.K., Pareschi,M.T., 2007. Enhanced rainfall in the Western Mediterranean during deposition ofsapropel S1: stalagmite evidence from Corchia cave (Central Italy). Quaternary Sci-ence Reviews 26, 279–286.
Please cite this article as: Finné, M., et al., Speleothem evidence for late HResearch (2014), http://dx.doi.org/10.1016/j.yqres.2013.12.009
Zangger, E., Timpson, M.E., Yazvenko, S.B., Kuhnke, F., Knauss, J., 1997. The Pylos regionalarchaeological project: part II: landscape evolution and site preservation. Hesperia66, 549–641.
Further reading
Bar-Matthews, M., Ayalon, A., Matthews, A., Sass, E., Halicz, L., 1996. Carbon and oxygenisotope study of the active water-carbonate system in a karstic Mediterraneancave: implications for paleoclimate research in semiarid regions. Geochimica etCosmochimica Acta 60, 337–347.
Caseldine, C.J., Turney, C., 2010. The bigger picture: towards integrating palaeoclimate andenvironmental data with a history of societal change. Journal of Quaternary Science25, 88–93.
Fleitmann, D., Burns, S.J., Neff, U., Mudelsee, M., Mangini, A., Matter, A., 2004.Palaeoclimatic interpretation of high-resolution oxygen isotope profiles derivedfrom annually laminated speleothems from Southern Oman. Quaternary Science Re-views 23, 935–945.
Kaniewski, D., Paulissen, E., Van Campo, E., Al-Maqdissi, M., Bretschneider, J., VanLerberghe, K., 2008. Middle East coastal ecosystem response to middle-to-lateHolocene abrupt climate changes. Proceedings of the National Academy of Sciencesof the United States of America 105, 13941–13946.
olocene climate variability and floods in Southern Greece, Quaternary
Related Documents