Spectrochimica Acta Part A 71 (2008) 1158–1165 Contents lists available at ScienceDirect Spectrochimica Acta Part A: Molecular and Biomolecular Spectroscopy journal homepage: www.elsevier.com/locate/saa Spectrophotometric study of the effects of surfactants and ethanol on the acidity constants of fluorescein Mohammad Bagher Gholivand a , Jahan B. Ghasemi a,∗ , Saadi Saaidpour a , Ali Mohajeri b a Chemistry Department, Faculty of Sciences, Razi University, Kermanshah, Iran b Gas Research Institute, Research Institute of Petroleum Industry, Tehran, Iran article info Article history: Received 27 December 2007 Received in revised form 28 February 2008 Accepted 11 March 2008 Keywords: Fluorescein Acidity constants SDS TX-100 DATAN Spectrophotometric abstract In the present paper, a sensitive, fast and suitable method for the calculation of pK a values of fluorescein is proposed. The effects of sodium dodecyl sulfate (SDS) and Triton X-100 (TX-100) as a surface-active agent on the acidic and basic forms, and the spectral properties of fluorescein were studied by the spec- trophotometric method. The study was performed in sub-micelle surfactant concentration, and absorption spectra at 300–550nm intervals were recorded. Stepwise acidity constants of fluorescein at pH range 1.50–10.00 and at constant ionic strength 0.1M and 25 ◦ C were determined using DATAN program using pH-spectrophotometric titration data. The method is efficient, however the component spectra showed intensive overlapping. The calculated acidity constants of fluorescein in water at ionic strength 0.1 are pK a1 = 2.20, pK a2 = 4.30 and pK a3 =6.43. The acidity constants of the dye in ethanol–water solution were studied by the same procedure. Effect of surfactants and ethanol on acidity constants and pure spectrum of each component are also discussed. © 2008 Elsevier B.V. All rights reserved. 1. Introduction Dissociation constants (i.e. pK a values) can be a key parame- ter for understanding and quantifying chemical phenomena such as reaction rates, biological activity, biological uptake, biological transport and environmental fate [1]. Determination of equilibrium constants for acid–base dye molecules has long been a concern in analytical chemistry. Thermodynamic information associated with these constants is mainly useful for determining the end point in acid–base reactions. Because of their binding proper- ties, the applications of indicators have recently been extended to include their use in the spectrophotometric determination of cations. Therefore, accurate determination of equilibrium con- stants at the best possible certainty, has a crucial importance [2]. The fluorescein dye [Scheme 1] is probably the most com- mon fluorescent probe today. It has a very high molar absorptivity in the visible region, a large fluorescence quantum yield, and a high photostability which makes it very useful in applications where a high sensitivity is needed. Furthermore, it is commercially available in many derivatives, like flourescein isothiocyanate and flourescein succinimidyl ester, which can be covalently attached to macromolecules and aminoacids. Flourescein derivatives are ∗ Corresponding author. Tel.: +98 831 8358077; fax: +98 831 4223306. E-mail address: [email protected] (J.B. Ghasemi). frequently used in studies of nucleic acid and proteins [3]. Flu- orescein in aqueous solution occurs in cationic, neutral, anionic and dianionic forms making its absorption and fluorescence prop- erties strongly pH dependent. The dissociation constants of all of forms of flourescein have been difficult to determine, because their spectra overlap substantially and different pK a values are quite close. Previous determinations have been based on rather crude assumptions about the spectra overlaps between the dis- sociated forms and have yielded rather scattered estimations of the dissociation constants. With the recent advent of pow- erful chemometric methods for spectra analysis, complicated spectroscopic mixtures can today be analyzed with confidence [4]. During the past two decades, application of the micelles in a wide variety of analytical techniques has been a subject of growing interest [5]. It is well known that the proton-release occuring dur- ing the reaction between a dye and different surfactants results in a change in the dye spectrum which resembles to that observed upon increasing the pH of solution. The resulting shift in the acidity con- stants facillitates the determination of organic acids in the presence of equal pK a of inorganic acids by moving the equivalence points apart, or allows the use of acid–base indicators outside their normal indicator pH ranges [6]. There are several important papers about the physicochemical behaviors of fluorescein in different media [7–12]. In this work the DATa ANalysis, DATAN program was used for analysis of spectroscopic data and determination of dissocia- 1386-1425/$ – see front matter © 2008 Elsevier B.V. All rights reserved. doi:10.1016/j.saa.2008.03.010

Welcome message from author
This document is posted to help you gain knowledge. Please leave a comment to let me know what you think about it! Share it to your friends and learn new things together.
Transcript
So
Ma
b
a
ARRA
KFASTDS
1
tatciwpttcs[
mihwaflt
1d
Spectrochimica Acta Part A 71 (2008) 1158–1165
Contents lists available at ScienceDirect
Spectrochimica Acta Part A: Molecular andBiomolecular Spectroscopy
journa l homepage: www.e lsev ier .com/ locate /saa
pectrophotometric study of the effects of surfactants and ethanoln the acidity constants of fluorescein
ohammad Bagher Gholivanda, Jahan B. Ghasemia,∗, Saadi Saaidpoura, Ali Mohajerib
Chemistry Department, Faculty of Sciences, Razi University, Kermanshah, IranGas Research Institute, Research Institute of Petroleum Industry, Tehran, Iran
r t i c l e i n f o
rticle history:eceived 27 December 2007eceived in revised form 28 February 2008ccepted 11 March 2008
a b s t r a c t
In the present paper, a sensitive, fast and suitable method for the calculation of pKa values of fluoresceinis proposed. The effects of sodium dodecyl sulfate (SDS) and Triton X-100 (TX-100) as a surface-activeagent on the acidic and basic forms, and the spectral properties of fluorescein were studied by the spec-trophotometric method. The study was performed in sub-micelle surfactant concentration, and absorption
eywords:luoresceincidity constantsDSX-100
spectra at 300–550 nm intervals were recorded. Stepwise acidity constants of fluorescein at pH range1.50–10.00 and at constant ionic strength 0.1 M and 25 ◦C were determined using DATAN program usingpH-spectrophotometric titration data. The method is efficient, however the component spectra showedintensive overlapping. The calculated acidity constants of fluorescein in water at ionic strength 0.1 arepKa1 = 2.20, pKa2 = 4.30 and pKa3 = 6.43. The acidity constants of the dye in ethanol–water solution were
dureo dis
foaeotqcsoes[
wiici
ATANpectrophotometric
studied by the same proceof each component are als
. Introduction
Dissociation constants (i.e. pKa values) can be a key parame-er for understanding and quantifying chemical phenomena suchs reaction rates, biological activity, biological uptake, biologicalransport and environmental fate [1]. Determination of equilibriumonstants for acid–base dye molecules has long been a concernn analytical chemistry. Thermodynamic information associated
ith these constants is mainly useful for determining the endoint in acid–base reactions. Because of their binding proper-ies, the applications of indicators have recently been extendedo include their use in the spectrophotometric determination ofations. Therefore, accurate determination of equilibrium con-tants at the best possible certainty, has a crucial importance2].
The fluorescein dye [Scheme 1] is probably the most com-on fluorescent probe today. It has a very high molar absorptivity
n the visible region, a large fluorescence quantum yield, and aigh photostability which makes it very useful in applications
here a high sensitivity is needed. Furthermore, it is commerciallyvailable in many derivatives, like flourescein isothiocyanate andourescein succinimidyl ester, which can be covalently attachedo macromolecules and aminoacids. Flourescein derivatives are
∗ Corresponding author. Tel.: +98 831 8358077; fax: +98 831 4223306.E-mail address: [email protected] (J.B. Ghasemi).
soait[
f
386-1425/$ – see front matter © 2008 Elsevier B.V. All rights reserved.oi:10.1016/j.saa.2008.03.010
. Effect of surfactants and ethanol on acidity constants and pure spectrumcussed.
© 2008 Elsevier B.V. All rights reserved.
requently used in studies of nucleic acid and proteins [3]. Flu-rescein in aqueous solution occurs in cationic, neutral, anionicnd dianionic forms making its absorption and fluorescence prop-rties strongly pH dependent. The dissociation constants of allf forms of flourescein have been difficult to determine, becauseheir spectra overlap substantially and different pKa values areuite close. Previous determinations have been based on ratherrude assumptions about the spectra overlaps between the dis-ociated forms and have yielded rather scattered estimationsf the dissociation constants. With the recent advent of pow-rful chemometric methods for spectra analysis, complicatedpectroscopic mixtures can today be analyzed with confidence4].
During the past two decades, application of the micelles in aide variety of analytical techniques has been a subject of growing
nterest [5]. It is well known that the proton-release occuring dur-ng the reaction between a dye and different surfactants results in ahange in the dye spectrum which resembles to that observed uponncreasing the pH of solution. The resulting shift in the acidity con-tants facillitates the determination of organic acids in the presencef equal pKa of inorganic acids by moving the equivalence pointspart, or allows the use of acid–base indicators outside their normal
ndicator pH ranges [6]. There are several important papers abouthe physicochemical behaviors of fluorescein in different media7–12].In this work the DATa ANalysis, DATAN program was usedor analysis of spectroscopic data and determination of dissocia-
M.B. Gholivand et al. / Spectrochimica A
te
2
ss
pslTsas
2
tflfl
+ +
Scheme 1. Structure of fluorescein disodium.
ion constants and the effect of anionic, nonionic surfactants andthanol on the pKa values of flourescein [13].
. Theoretical
In this paper, we decided to investigate the dissociation con-tants of the dye at different concentrations of anionic, nonionicurfactants and binary mixtures of ethanol–water at 25 ◦C. A three-
H
H
H
Scheme 2. Chemical struc
cta Part A 71 (2008) 1158–1165 1159
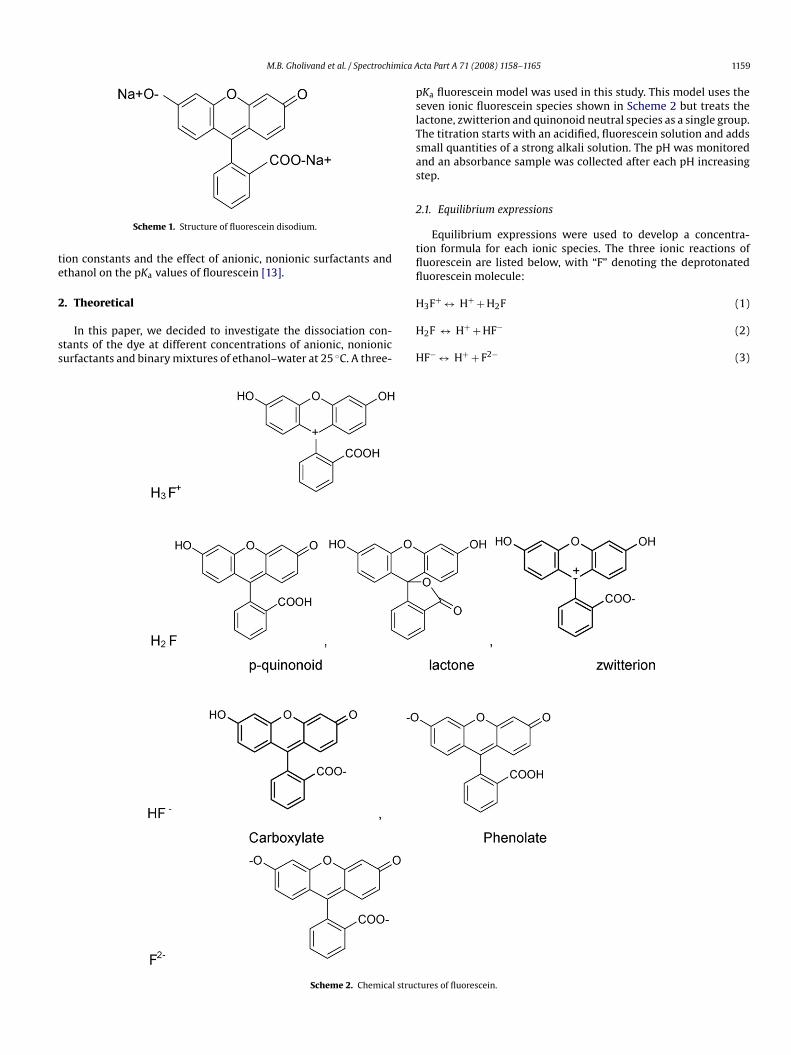
Ka fluorescein model was used in this study. This model uses theeven ionic fluorescein species shown in Scheme 2 but treats theactone, zwitterion and quinonoid neutral species as a single group.he titration starts with an acidified, fluorescein solution and addsmall quantities of a strong alkali solution. The pH was monitorednd an absorbance sample was collected after each pH increasingtep.
.1. Equilibrium expressions
Equilibrium expressions were used to develop a concentra-ion formula for each ionic species. The three ionic reactions ofuorescein are listed below, with “F” denoting the deprotonateduorescein molecule:
3F ↔ H + H2F (1)
2F ↔ H+ + HF− (2)
F− ↔ H+ + F2− (3)
tures of fluorescein.
1 mica A
tr(p
K
K
K
t
[
[
[
[
ec
2
aqfiB
a
wlc
tiois
T
T
tiwa
2
tsda
A
wtrotbtip
A
f
t
c
c
c
c
wccatft
t
wcec
160 M.B. Gholivand et al. / Spectrochi
Relative equilibrium concentrations are denoted by the ioniza-ion constant Ka, with the numerical subscript indicating the ioniceaction and the square brackets denote molar concentrations (Eqs.4), (5) and (6)). As the use of molar concentrations is only appro-riate for dilute solutions, activity corrections are included later.
a1 = [H+][H2F][H3F+]
(4)
a2 = [H+][HF−][H2F]
(5)
a3 = [H+][F2−][HF−]
(6)
A fluorescein mass balance gives :
[FTotal] = [H3F+] + [H2F] + [HF−] + [F2−] (7)
Rearrangement of Eqs. (4), (5) and (6) followed by their substi-ution into Eq. (7) produces four equations. These are:
H3F+] = [FTotal]
(1 + Ka1/[H+] + (Ka1Ka2)/[H+]2 + Ka1Ka2Ka3/[H+]3)
(8)
H2F] = [FTotal]
([H+]/Ka1 + 1 + Ka2/[H+] + Ka2Ka3/[H+]2)(9)
HF−] = [FTotal]
([H+]2/(Ka1Ka2) + [H+]/Ka2 + 1 + Ka3/[H+])
(10)
F2−] = [FTotal]
([H+]3/(Ka1Ka2Ka3) + [H+]2
/(Ka2Ka3) + [H+]/Ka3 + 1)
(11)
These last four Eqs. (8)–(11) allow the precise concentration ofach species to be calculated as long as the total fluorescein con-entration, pH and individual Ka values are known.
.2. Absorbance equations
The assumption that each ionic species has a characteristicbsorptivity and obeys the Beer–Lambert’s law is fundamental touantitative absorbance spectrophotometry but needs to be con-rmed wherever possible. For the concentrations at which theeer–Lambert’s law applies:
bsorbance = εbc (12)
here ε is the molar absorptivity constant at the analytical wave-ength; b is the path length of the light beam through the sample;is the fluorescein species concentration.
As the same spectrophotometer and wavelength were usedhroughout the determination, the molar absorptivity constant andnstrument pathlength were combined to produce a factor for eachf the four ionic species (F1, F2, F3 and F4). The total absorbances the sum of the absorbencies of the different fluorescein species,uch that:
otal absorbance = F1[H3F+] + F2[H2F] + F3[HF−] + F4[F2−] (13)
otal absorbance = F1(Eq.(8)) + F2(Eq.(9)) + F3(Eq.(10))
+F4(Eq.(11)) (14)
Or where Eq. # symbolises the right-hand side of equation #. . .
fi(s
T
cta Part A 71 (2008) 1158–1165
If the total fluorescein, the pH and total absorbance are known,here are seven unknowns: Ka1, Ka2, Ka3, F1, F2, F3 and F4. Dur-ng the solving process, in an iterative method, these seven values
ere adjusted, in a least squares manner, until the calculated totalbsorbance matched the measured total absorbance.
.3. Determination of apparent acidity constants
Acidity constants of fluorescein were determined from absorp-ion spectra recorded at various pH values. Spectra of the titrationamples are digitized and arranged in a data matrix A, which isecomposed into an orthonormal basis set by NIPALS or any equiv-lent method [14]:
= TP′ + E ≈ TP′ =r∑
i=1
tipi (15)
here the orthogonal target vectors ti and orthonormal projec-ion vectors p′
iare mathematical constructs that cannot be directly
elated to component spectra and concentrations. r is the numberf independent spectroscopic components, which corresponds tohe number of light-absorbing chemical species. It is determinedy visual inspection of the t and p′ vectors or by performing a chi2-est [5]. E is an error matrix. Assuming linear response, the spectran matrix A are linear combinations of the concentrations, C, andure spectral response, V, of the chemical components.
= CV + E′ ≈ CV =r∑
i=1
civi (16)
The concentrations of the protolytic forms are then calculatedrom the equilibrium expressions (1)–(11):
if assume: s = c3H+ + K1c2
H+ + K1K2cH+ + K1K2K3
hen:
+H3F = c3
H+ctot
s(17)
H2F = Ka1c2H+
s(18)
−HF = Ka1Ka2cH+
s(19)
−2F = Ka1Ka2Ka3
s(20)
here Ka1, Ka2 and Ka3 are the acidity constants andH+, cH3F
+, cH2F, cHF−, cF
−2 and ctot are vectors having theoncentrations of protons, fluorescein cation, neutral species,nion, dianion, and total fluorescein as elements. Different sets ofrial concentration vectors (identified by a hat) were calculatedor various trials values of the acidity constants, and fitted to thearget vectors:
i =r∑
i=1
rjici (21)
here ti is the ith column of matrix T, ci is a vector containing thealculated concentration of protolytic form i. Each fit defines thelements (rji) of a trial matrix R [5]. The accuracy of this fit dependsrucially on the trial values of the equilibrium constants, and best
t determines their values and the elements of matrix R. From Eqs.15) and (16) follows that there is a square matrix R (r × r) thatatisfies= CR (22)
mica Acta Part A 71 (2008) 1158–1165 1161
P
s
cbrc
C
V
icabw
3
3
wccm[iStFstu
3
s3mH
3
pa
S
Fs
owta
3
ofe3ortwpepov[
4
M.B. Gholivand et al. / Spectrochi
′ = R−1V (23)
ince A = CV = C(RR−1)V = (CR)(R−1V) = TP′.If the spectral profiles of the components are known, the con-
entration of each component can easily be calculated, for example,y least squares minimization. If R can be determined, the spectralesponses (V) and concentrations (C) of the components can bealculated from the target (T) and projection (P′) matrices:
= TR−1 (24)
= RP′ (25)
The trial values of the acidity constants are systematically var-ed to give highest correspondence between the concentrationsalculated from Eq. (21) and those calculated by Eq. (24). Finally,bsorption spectra are calculated from Eqs. (24) and (25) and cane compared to the experimental absorbance matrix to see howell is the whole minimization process.
. Experimental
.1. Reagents
All chemicals were of analytical grade. Doubly distilled wateras used for the preparation of solutions. Fluorescein was pur-
hased from Merck and was used without further purification. Itsoncentration was determined spectrophotometrically, assuming aolar absorptivity of the dianion in 0.1 M NaOH of 76,900 M−1 cm−1
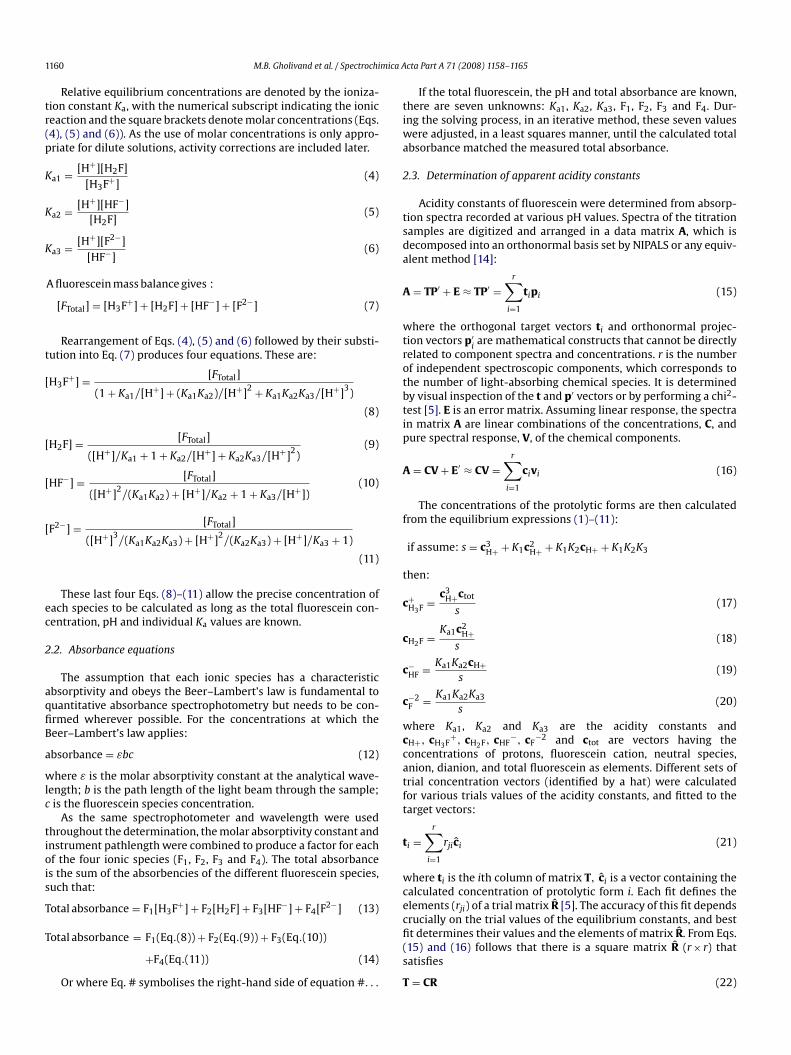
4,20]. The stock standard solution of dye was 7 × 10⁻⁴ M. Theonic strength was also kept constant at 0.1 using NaCl (Merck).odium dodecyl sulfate (SDS) and pol(oxyethylene)(9.5)p-(1,1,3,3-etramethyl) (Triton X-100) [Scheme 3] and ethanol (EtOH) wereluka chemicals and were used without further purification. Thetock solutions for SDS and TX-100 are 10−3 M. For the spectropho-ometric titration, NaOH (Merck 99%) and HCl (Merck 37%) weresed.
.2. Apparatus
All absorption spectra were recorded on a CECIL 9000pectrophotometer (spectral bandwidth 0.2 nm and scan rate00 nm min−1) using quartz cell of 1-cm pathlength. Measure-ents of pH were made with a HANNA 302 pH-meter using aANNA combined glass electrode.
.3. Computer hardware and software
All absorption spectra were collected with a laboratory-writtenrogram, in QUICKBASIC, and transferred to DELL computer withPentium IV CPU for subsequent data processing and adjustment
cheme 3. Structures of sodium dodecyl sulphate (SDS) and Triton X-100.
3mpoh(fltwes
taT
gin
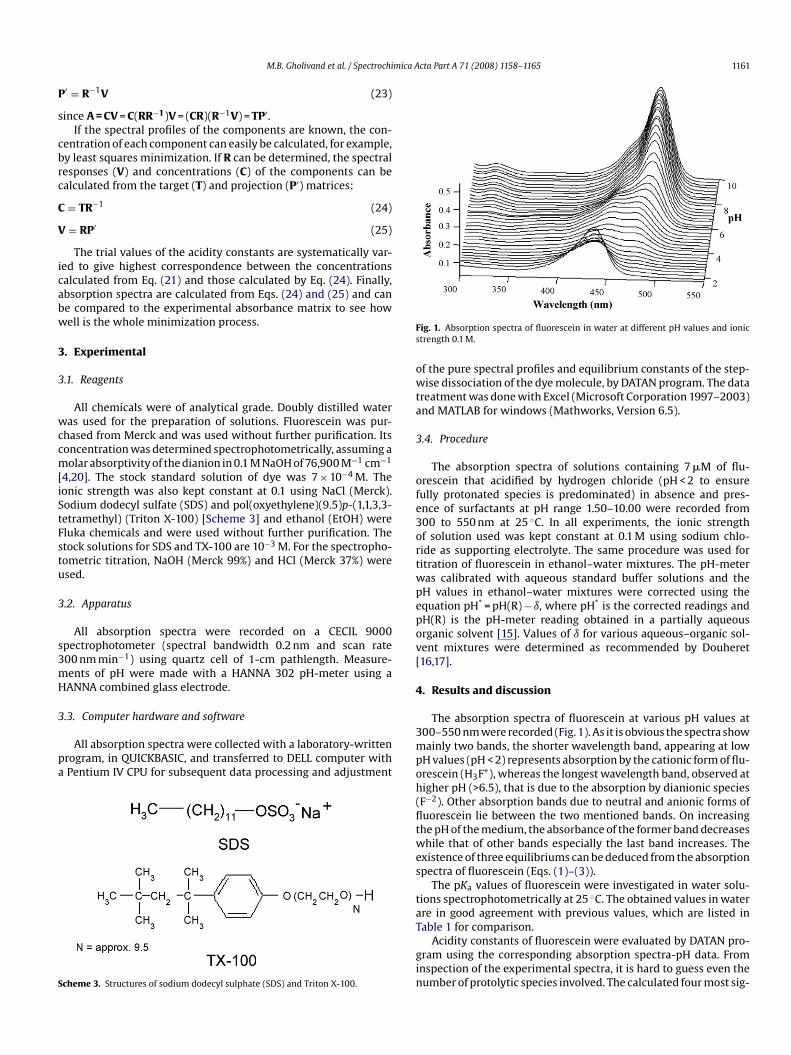
ig. 1. Absorption spectra of fluorescein in water at different pH values and ionictrength 0.1 M.
f the pure spectral profiles and equilibrium constants of the step-ise dissociation of the dye molecule, by DATAN program. The data
reatment was done with Excel (Microsoft Corporation 1997–2003)nd MATLAB for windows (Mathworks, Version 6.5).
.4. Procedure
The absorption spectra of solutions containing 7 �M of flu-rescein that acidified by hydrogen chloride (pH < 2 to ensureully protonated species is predominated) in absence and pres-nce of surfactants at pH range 1.50–10.00 were recorded from00 to 550 nm at 25 ◦C. In all experiments, the ionic strengthf solution used was kept constant at 0.1 M using sodium chlo-ide as supporting electrolyte. The same procedure was used foritration of fluorescein in ethanol–water mixtures. The pH-meteras calibrated with aqueous standard buffer solutions and theH values in ethanol–water mixtures were corrected using thequation pH* = pH(R) − ı, where pH* is the corrected readings andH(R) is the pH-meter reading obtained in a partially aqueousrganic solvent [15]. Values of ı for various aqueous–organic sol-ent mixtures were determined as recommended by Douheret16,17].
. Results and discussion
The absorption spectra of fluorescein at various pH values at00–550 nm were recorded (Fig. 1). As it is obvious the spectra showainly two bands, the shorter wavelength band, appearing at low
H values (pH < 2) represents absorption by the cationic form of flu-rescein (H3F+), whereas the longest wavelength band, observed atigher pH (>6.5), that is due to the absorption by dianionic speciesF−2). Other absorption bands due to neutral and anionic forms ofuorescein lie between the two mentioned bands. On increasinghe pH of the medium, the absorbance of the former band decreaseshile that of other bands especially the last band increases. The
xistence of three equilibriums can be deduced from the absorptionpectra of fluorescein (Eqs. (1)–(3)).
The pKa values of fluorescein were investigated in water solu-ions spectrophotometrically at 25 ◦C. The obtained values in waterre in good agreement with previous values, which are listed in
able 1 for comparison.Acidity constants of fluorescein were evaluated by DATAN pro-ram using the corresponding absorption spectra-pH data. Fromnspection of the experimental spectra, it is hard to guess even theumber of protolytic species involved. The calculated four most sig-
1162 M.B. Gholivand et al. / Spectrochimica Acta Part A 71 (2008) 1158–1165
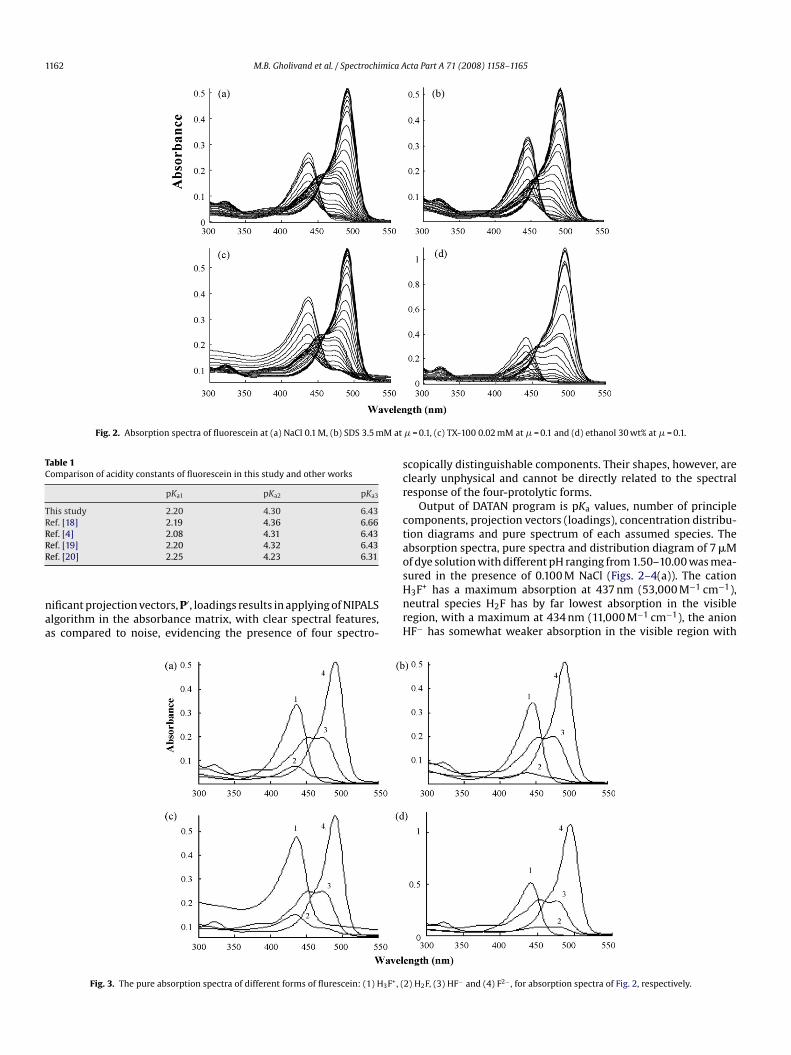
Fig. 2. Absorption spectra of fluorescein at (a) NaCl 0.1 M, (b) SDS 3.5 mM at
Table 1Comparison of acidity constants of fluorescein in this study and other works
pKa1 pKa2 pKa3
This study 2.20 4.30 6.43Ref. [18] 2.19 4.36 6.66Ref. [4] 2.08 4.31 6.43RR
naa
scr
ctaosured in the presence of 0.100 M NaCl (Figs. 2–4(a)). The cation
ef. [19] 2.20 4.32 6.43ef. [20] 2.25 4.23 6.31
ificant projection vectors, P′, loadings results in applying of NIPALSlgorithm in the absorbance matrix, with clear spectral features,s compared to noise, evidencing the presence of four spectro-
HnrH
Fig. 3. The pure absorption spectra of different forms of flurescein: (1) H3F+, (
� = 0.1, (c) TX-100 0.02 mM at � = 0.1 and (d) ethanol 30 wt% at � = 0.1.
copically distinguishable components. Their shapes, however, arelearly unphysical and cannot be directly related to the spectralesponse of the four-protolytic forms.
Output of DATAN program is pKa values, number of principleomponents, projection vectors (loadings), concentration distribu-ion diagrams and pure spectrum of each assumed species. Thebsorption spectra, pure spectra and distribution diagram of 7 �Mf dye solution with different pH ranging from 1.50–10.00 was mea-
3F+ has a maximum absorption at 437 nm (53,000 M−1 cm−1),eutral species H2F has by far lowest absorption in the visibleegion, with a maximum at 434 nm (11,000 M−1 cm−1), the anionF− has somewhat weaker absorption in the visible region with
2) H2F, (3) HF− and (4) F2− , for absorption spectra of Fig. 2, respectively.
M.B. Gholivand et al. / Spectrochimica Acta Part A 71 (2008) 1158–1165 1163
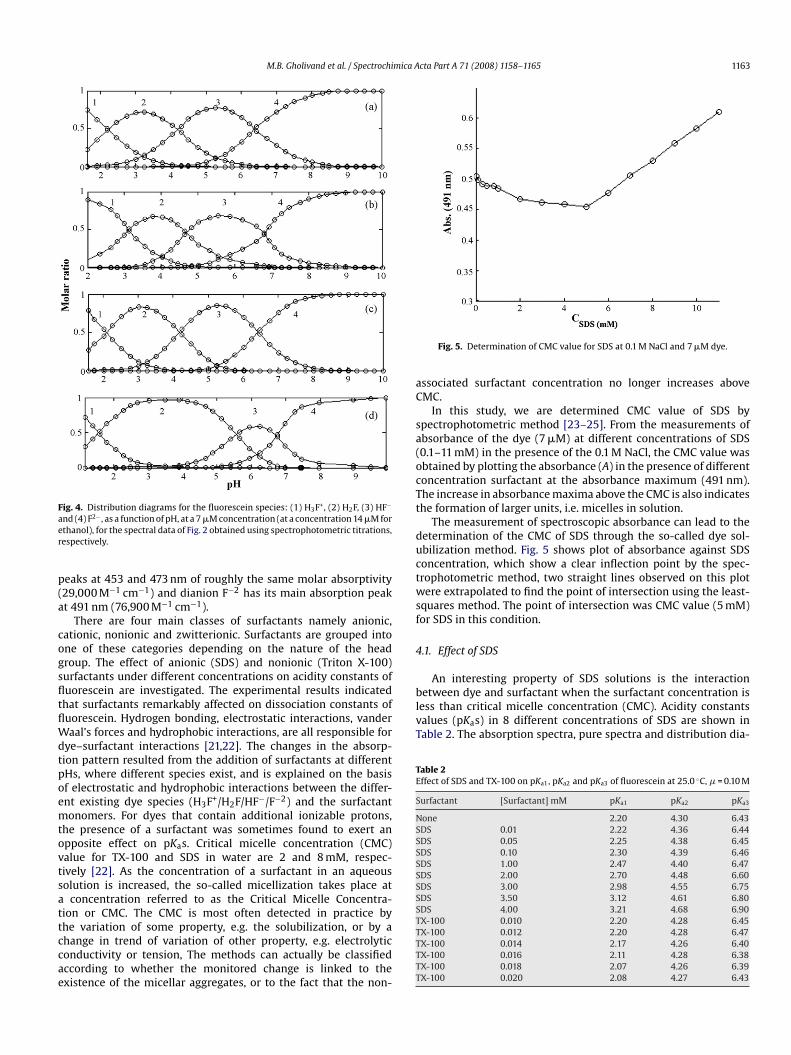
Fig. 4. Distribution diagrams for the fluorescein species: (1) H3F+, (2) H2F, (3) HF−
aer
p(a
cogsfltflWdtpoemtovtsattccae
aC
sa(ocTt
ductwsf
4
between dye and surfactant when the surfactant concentration isless than critical micelle concentration (CMC). Acidity constantsvalues (pKas) in 8 different concentrations of SDS are shown inTable 2. The absorption spectra, pure spectra and distribution dia-
Table 2Effect of SDS and TX-100 on pKa1, pKa2 and pKa3 of fluorescein at 25.0 ◦C, � = 0.10 M
Surfactant [Surfactant] mM pKa1 pKa2 pKa3
None 2.20 4.30 6.43SDS 0.01 2.22 4.36 6.44SDS 0.05 2.25 4.38 6.45SDS 0.10 2.30 4.39 6.46SDS 1.00 2.47 4.40 6.47SDS 2.00 2.70 4.48 6.60SDS 3.00 2.98 4.55 6.75SDS 3.50 3.12 4.61 6.80SDS 4.00 3.21 4.68 6.90TX-100 0.010 2.20 4.28 6.45
nd (4) F2− , as a function of pH, at a 7 �M concentration (at a concentration 14 �M forthanol), for the spectral data of Fig. 2 obtained using spectrophotometric titrations,espectively.
eaks at 453 and 473 nm of roughly the same molar absorptivity29,000 M−1 cm−1) and dianion F−2 has its main absorption peakt 491 nm (76,900 M−1 cm−1).
There are four main classes of surfactants namely anionic,ationic, nonionic and zwitterionic. Surfactants are grouped intone of these categories depending on the nature of the headroup. The effect of anionic (SDS) and nonionic (Triton X-100)urfactants under different concentrations on acidity constants ofuorescein are investigated. The experimental results indicatedhat surfactants remarkably affected on dissociation constants ofuorescein. Hydrogen bonding, electrostatic interactions, vanderaal’s forces and hydrophobic interactions, are all responsible for
ye–surfactant interactions [21,22]. The changes in the absorp-ion pattern resulted from the addition of surfactants at differentHs, where different species exist, and is explained on the basisf electrostatic and hydrophobic interactions between the differ-nt existing dye species (H3F+/H2F/HF−/F−2) and the surfactantonomers. For dyes that contain additional ionizable protons,
he presence of a surfactant was sometimes found to exert anpposite effect on pKas. Critical micelle concentration (CMC)alue for TX-100 and SDS in water are 2 and 8 mM, respec-ively [22]. As the concentration of a surfactant in an aqueousolution is increased, the so-called micellization takes place at
concentration referred to as the Critical Micelle Concentra-ion or CMC. The CMC is most often detected in practice byhe variation of some property, e.g. the solubilization, or by a
hange in trend of variation of other property, e.g. electrolyticonductivity or tension, The methods can actually be classifiedccording to whether the monitored change is linked to thexistence of the micellar aggregates, or to the fact that the non-TTTTT
Fig. 5. Determination of CMC value for SDS at 0.1 M NaCl and 7 �M dye.
ssociated surfactant concentration no longer increases aboveMC.
In this study, we are determined CMC value of SDS bypectrophotometric method [23–25]. From the measurements ofbsorbance of the dye (7 �M) at different concentrations of SDS0.1–11 mM) in the presence of the 0.1 M NaCl, the CMC value wasbtained by plotting the absorbance (A) in the presence of differentoncentration surfactant at the absorbance maximum (491 nm).he increase in absorbance maxima above the CMC is also indicateshe formation of larger units, i.e. micelles in solution.
The measurement of spectroscopic absorbance can lead to theetermination of the CMC of SDS through the so-called dye sol-bilization method. Fig. 5 shows plot of absorbance against SDSoncentration, which show a clear inflection point by the spec-rophotometric method, two straight lines observed on this plotere extrapolated to find the point of intersection using the least-
quares method. The point of intersection was CMC value (5 mM)or SDS in this condition.
.1. Effect of SDS
An interesting property of SDS solutions is the interaction
X-100 0.012 2.20 4.28 6.47X-100 0.014 2.17 4.26 6.40X-100 0.016 2.11 4.28 6.38X-100 0.018 2.07 4.26 6.39X-100 0.020 2.08 4.27 6.43
1164 M.B. Gholivand et al. / Spectrochimica Acta Part A 71 (2008) 1158–1165
FS
gres(bc7lti(ta(ri(oiH
Table 3Acidity constants of fluorescein at different percent of ethanol at 25.0 ◦C, � = 0.10 M
EtOH (w/w%) pKa1 pKa2 pKa3
None 2.20 4.30 6.4320 1.68 5.08 6.60345
4
TNasiTtaF1tato
4
eAuatbtocvttsmahcdeεaia(mi
mawthe acidity constants of the fluorescein on the solvent composition.
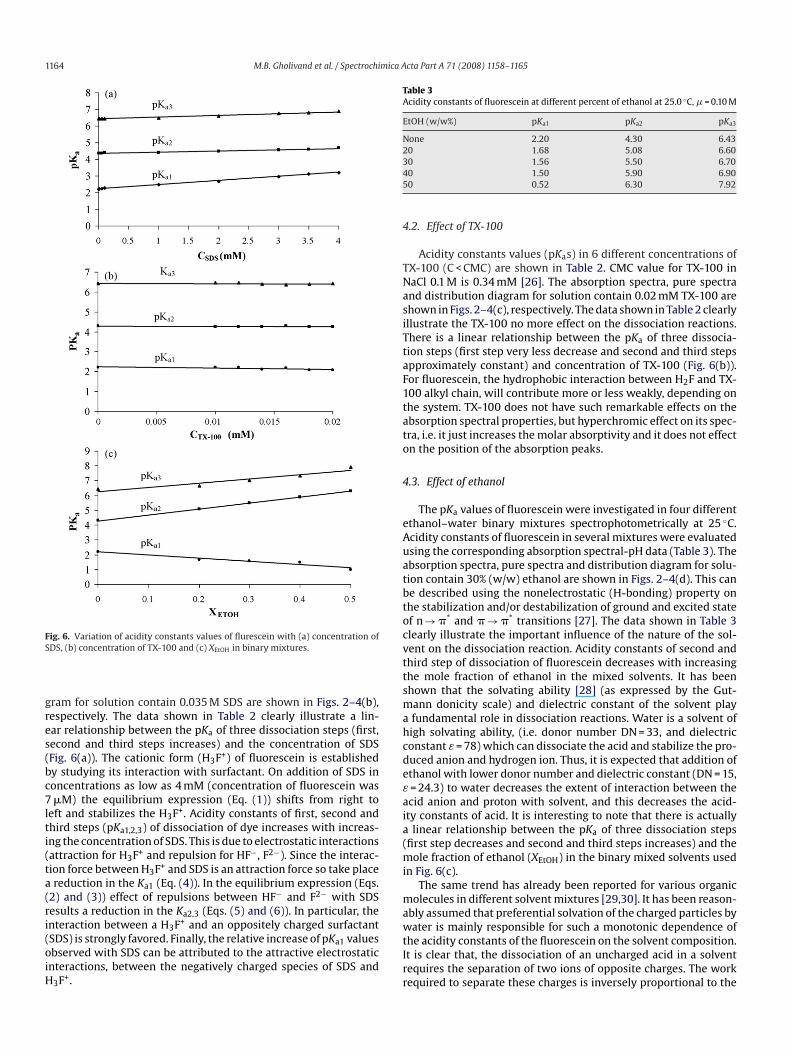
ig. 6. Variation of acidity constants values of flurescein with (a) concentration ofDS, (b) concentration of TX-100 and (c) XEtOH in binary mixtures.
ram for solution contain 0.035 M SDS are shown in Figs. 2–4(b),espectively. The data shown in Table 2 clearly illustrate a lin-ar relationship between the pKa of three dissociation steps (first,econd and third steps increases) and the concentration of SDSFig. 6(a)). The cationic form (H3F+) of fluorescein is establishedy studying its interaction with surfactant. On addition of SDS inoncentrations as low as 4 mM (concentration of fluorescein was�M) the equilibrium expression (Eq. (1)) shifts from right to
eft and stabilizes the H3F+. Acidity constants of first, second andhird steps (pKa1,2,3) of dissociation of dye increases with increas-ng the concentration of SDS. This is due to electrostatic interactionsattraction for H3F+ and repulsion for HF−, F2−). Since the interac-ion force between H3F+ and SDS is an attraction force so take placereduction in the Ka1 (Eq. (4)). In the equilibrium expression (Eqs.
2) and (3)) effect of repulsions between HF− and F2− with SDSesults a reduction in the Ka2,3 (Eqs. (5) and (6)). In particular, thenteraction between a H3F+ and an oppositely charged surfactantSDS) is strongly favored. Finally, the relative increase of pKa1 values
bserved with SDS can be attributed to the attractive electrostaticnteractions, between the negatively charged species of SDS and3F+.
Irr
0 1.56 5.50 6.700 1.50 5.90 6.900 0.52 6.30 7.92
.2. Effect of TX-100
Acidity constants values (pKas) in 6 different concentrations ofX-100 (C < CMC) are shown in Table 2. CMC value for TX-100 inaCl 0.1 M is 0.34 mM [26]. The absorption spectra, pure spectrand distribution diagram for solution contain 0.02 mM TX-100 arehown in Figs. 2–4(c), respectively. The data shown in Table 2 clearlyllustrate the TX-100 no more effect on the dissociation reactions.here is a linear relationship between the pKa of three dissocia-ion steps (first step very less decrease and second and third stepspproximately constant) and concentration of TX-100 (Fig. 6(b)).or fluorescein, the hydrophobic interaction between H2F and TX-00 alkyl chain, will contribute more or less weakly, depending onhe system. TX-100 does not have such remarkable effects on thebsorption spectral properties, but hyperchromic effect on its spec-ra, i.e. it just increases the molar absorptivity and it does not effectn the position of the absorption peaks.
.3. Effect of ethanol
The pKa values of fluorescein were investigated in four differentthanol–water binary mixtures spectrophotometrically at 25 ◦C.cidity constants of fluorescein in several mixtures were evaluatedsing the corresponding absorption spectral-pH data (Table 3). Thebsorption spectra, pure spectra and distribution diagram for solu-ion contain 30% (w/w) ethanol are shown in Figs. 2–4(d). This cane described using the nonelectrostatic (H-bonding) property onhe stabilization and/or destabilization of ground and excited statef n → �* and � → �* transitions [27]. The data shown in Table 3learly illustrate the important influence of the nature of the sol-ent on the dissociation reaction. Acidity constants of second andhird step of dissociation of fluorescein decreases with increasinghe mole fraction of ethanol in the mixed solvents. It has beenhown that the solvating ability [28] (as expressed by the Gut-ann donicity scale) and dielectric constant of the solvent playfundamental role in dissociation reactions. Water is a solvent ofigh solvating ability, (i.e. donor number DN = 33, and dielectriconstant ε = 78) which can dissociate the acid and stabilize the pro-uced anion and hydrogen ion. Thus, it is expected that addition ofthanol with lower donor number and dielectric constant (DN = 15,= 24.3) to water decreases the extent of interaction between thecid anion and proton with solvent, and this decreases the acid-ty constants of acid. It is interesting to note that there is actually
linear relationship between the pKa of three dissociation stepsfirst step decreases and second and third steps increases) and the
ole fraction of ethanol (XEtOH) in the binary mixed solvents usedn Fig. 6(c).
The same trend has already been reported for various organicolecules in different solvent mixtures [29,30]. It has been reason-
bly assumed that preferential solvation of the charged particles byater is mainly responsible for such a monotonic dependence of
t is clear that, the dissociation of an uncharged acid in a solventequires the separation of two ions of opposite charges. The workequired to separate these charges is inversely proportional to the
mica A
daftdclot
R
[
[[
[[[[[[[[[[
[
[[[
[Saunders Sunburst Series, 1998.
M.B. Gholivand et al. / Spectrochi
ielectric constant of the solvent. The energy required for dissoci-tion is supplied by solvation of the ions and the proton transferrom acid to the solvent molecule supplies an additional energy. Ifhe dielectric constant and the solvating ability of the solvent areecreased, more energy will be required to separate the anion andation and consequently the extent of dissociation of acid will beowered. Therefore, the increase in first step and the decrease in sec-nd and third step of dissociation constants are due to increasinghe mole fraction of ethanol in the binary mixed solvent.
eferences
[1] D. Kara, M. Alkan, Spectrochim. Acta A 56 (2000) 2753.[2] P.B. Hernandez, M.T. Ramirez, A.R. Hernandez, A. Gutierrez, Talanta 46 (1998)
1439.[3] R. Sjoback, J. Nygren, M. Kubista, Biopolymers 46 (1998) 445.[4] R. Sjoback, J. Nygren, M. Kubista, Spectrochim. Acta A 51 (1995) L7.[5] Z. Yuanqin, L. Fan, L. Xiaoyan, L. Jing, Talanta 56 (2002) 705.[6] Laurier L. Schramm, Surfactants: Fundamentals and Applications in the
Petroleum Industry, Cambridge University Press, 2000.[7] S.A. Smith, W.A. Pretorius, Water SA 28 (2002) 395.[8] N. Klonis, W.H. Sawyer, Photochem. Photobiol. 72 (2000) 179.[9] M. Kubista, I.H. Ismail, A. Forootan, B. Sjvgreen, J. Fluoresc. 14 (2004) 139.10] N. Klonis, A.H.A. Clayton, E.W. Voss, W.H. Sawyer, Photochem. Photobiol. 67
(1998) 500.
[
[
[
cta Part A 71 (2008) 1158–1165 1165
11] T.R. Brewer, M.R. Mattieson, Chem. Educ. 8 (2003) 56.12] N.O. Mchedlov-Petrossyan, V.I. Kukhtik, V.I. Alekseeva, Dyes Pigments 24 (1994)
11.13] I. Scarminio, M. Kubista, Anal. Chem. 65 (1993) 409.14] M. Kubista, R. Sjoback, B. Albinsson, Anal. Chem. 65 (1993) 994.15] R.G. Bates, Determination of pH: Theory and Practice, Wiley, New York, 1973.16] G. Douheret, Bull. Soc. Chim. Fr. (1967) 1412.17] G. Douheret, Bull. Soc. Chim. Fr. (1968) 3122.18] L. Lindqvist, Ark. Kemi. 16 (1960) 79.19] H. Diehl, R. Markuszewski, Talanta 36 (1989) 416.20] M. Kubista, R. Sjoback, J. Nygren, Anal. Chim. Acta 302 (1995) 121.21] M. Dakiky, I. Nemcova, Dyes Pigments 44 (2000) 181.22] M. Dakiky, A. Manassra, M. Abdul Kareem, F. Jumean, M. Khamis, Dyes Pigments
63 (2004) 101.23] K.R. Acharya, S.C. Bhattacharyy, S.P. Moulik, J. Photochem. Photobiol. A 122
(1999) 47.24] F. Ysambertt, F. Vejar, j. Paredes, J.L. Salager, Colloids Surf. A 137 (1998) 189.25] H. Nakamura, A. Sano, K. Matsuura, Anal. Sci. 14 (1998) 379.26] N.M. Vanos, J.R. Haak, L.A.M. Rupert, Physico-Chemical Properties of Selected
Anionic, Cationic and Nonionic Surfactants, Elsevier, 1993.27] D.A. Skoog, F.J. Holler, T.A. Nieman, Principles of Instrumental Analysis, fifth ed.,
28] V. Gutmann, Coordination Chemistry in Nonaqueous Solutions, Springer, NewYork, 1960.
29] D. Almasifar, F. Forghaniha, Z. Khojasteh, J. Ghasemi, H. Shargi, M. Shamsipur,J. Chem. Eng. Data 42 (1997) 1212.
30] J. Ghasemi, A. Niazi, M. Kubista, A. Elbergali, Anal. Chim. Acta 455 (2002) 335.
Related Documents