Spectral sensitivity differences in two Mysis sibling species (Crustacea, Mysida): Adaptation or phylogenetic constraints? Asta Audzijonyte ˙ a,b, * , Johan Pahlberg c , Risto Va ¨ino ¨la ¨ a , Magnus Lindstro ¨m b a Finnish Museum of Natural History, P.O. Box 17 (P. Rautatiekatu 13), FI-00014 University of Helsinki, Helsinki, Finland b Tva ¨rminne Zoological Station, University of Helsinki, FI-10900, Hanko, Finland c Department of Biological and Environmental Sciences, P.O. Box 65 (Viikinkaari 1), FI-00014 University of Helsinki, Helsinki, Finland Received 19 February 2005; received in revised form 26 April 2005; accepted 10 May 2005 Abstract The variation in eye spectral sensitivities of the closely related mysid species Mysis relicta Love ´n, 1862 and Mysis salemaai Audzijonyte ˙ and Va ¨ino ¨la ¨, 2005 was studied in sympatric and allopatric populations from the brackish Baltic Sea and from two lakes representing different light environments. In the Baltic Sea the maximum spectral sensitivity of M. relicta, measured by the electroretinogram (ERG) technique, was shifted by ca 20 nm to longer wavelengths than in M. salemaai (564 and 545 nm, respectively). The spectral sensitivity of M. salemaai was closer to that of marine mysid species, which is consistent with its broader euryhalinity and the presumed longer brackish-water history. The species-specific sensitivities in the Baltic Sea were not affected by regional differences in light environments. In two lake populations of M. relicta , the spectral sensitivity was further shifted by ca 28 nm towards the longer wavelengths compared with the conspecific Baltic Sea populations. The spectral sensitivities in the four M. relicta populations were not correlated to the current light conditions, but rather to the phylogeo- graphic histories and fresh- vs. brackish-water environments. A framework to further explore factors affecting spectral sensitivities in Mysis is suggested. D 2005 Elsevier B.V. All rights reserved. Keywords: Baltic Sea; ERG; Glacial relicts; Mysis relicta ; Mysis salemaai ; Vision 1. Introduction It is generally assumed that vision in animals is well adapted to the light characteristics of their envir- onments (Lythgoe, 1979; Johnson et al., 2002). Light conditions in aquatic habitats are largely defined by primary production and the amount of dissolved or- ganic matter, displacing the spectrum of the transmit- ted light from a maximum at about 470 nm in clear water to almost 700 nm in heavily stained water (Kirk, 1994). The spectral sensitivity of organisms living there must be adjusted accordingly and two main theories have been proposed to predict these 0022-0981/$ - see front matter D 2005 Elsevier B.V. All rights reserved. doi:10.1016/j.jembe.2005.05.007 * Corresponding author. Finnish Museum of Natural History, P.O. Box 17 (P. Rautatiekatu 13), FI-00014 University of Helsinki, Helsinki, Finland. E-mail address: [email protected] (A. Audzijonyte ˙). Journal of Experimental Marine Biology and Ecology 325 (2005) 228 – 239 www.elsevier.com/locate/jembe

Welcome message from author
This document is posted to help you gain knowledge. Please leave a comment to let me know what you think about it! Share it to your friends and learn new things together.
Transcript

Spectral sensitivity differences in two Mysis sibling species(Crustacea, Mysida): Adaptation or phylogenetic constraints?
Asta Audzijonyte a,b,*, Johan Pahlberg c, Risto Vainola a, Magnus Lindstrom b
aFinnish Museum of Natural History, P.O. Box 17 (P. Rautatiekatu 13), FI-00014 University of Helsinki, Helsinki, FinlandbTvarminne Zoological Station, University of Helsinki, FI-10900, Hanko, Finland
cDepartment of Biological and Environmental Sciences, P.O. Box 65 (Viikinkaari 1), FI-00014 University of Helsinki, Helsinki, Finland
Received 19 February 2005; received in revised form 26 April 2005; accepted 10 May 2005
Abstract
The variation in eye spectral sensitivities of the closely related mysid species Mysis relicta Loven, 1862 and Mysis salemaai
Audzijonyte and Vainola, 2005 was studied in sympatric and allopatric populations from the brackish Baltic Sea and from two
lakes representing different light environments. In the Baltic Sea the maximum spectral sensitivity of M. relicta, measured bythe electroretinogram (ERG) technique, was shifted by ca 20 nm to longer wavelengths than in M. salemaai (564 and 545 nm,respectively). The spectral sensitivity of M. salemaai was closer to that of marine mysid species, which is consistent with its
broader euryhalinity and the presumed longer brackish-water history. The species-specific sensitivities in the Baltic Sea werenot affected by regional differences in light environments. In two lake populations of M. relicta, the spectral sensitivity wasfurther shifted by ca 28 nm towards the longer wavelengths compared with the conspecific Baltic Sea populations. The spectral
sensitivities in the four M. relicta populations were not correlated to the current light conditions, but rather to the phylogeo-graphic histories and fresh- vs. brackish-water environments. A framework to further explore factors affecting spectralsensitivities in Mysis is suggested.D 2005 Elsevier B.V. All rights reserved.
Keywords: Baltic Sea; ERG; Glacial relicts; Mysis relicta; Mysis salemaai; Vision
1. Introduction
It is generally assumed that vision in animals iswell adapted to the light characteristics of their envir-
onments (Lythgoe, 1979; Johnson et al., 2002). Lightconditions in aquatic habitats are largely defined byprimary production and the amount of dissolved or-ganic matter, displacing the spectrum of the transmit-ted light from a maximum at about 470 nm in clearwater to almost 700 nm in heavily stained water(Kirk, 1994). The spectral sensitivity of organismsliving there must be adjusted accordingly and twomain theories have been proposed to predict these
0022-0981/$ - see front matter D 2005 Elsevier B.V. All rights reserved.
doi:10.1016/j.jembe.2005.05.007
* Corresponding author. Finnish Museum of Natural History, P.O.
Box 17 (P. Rautatiekatu 13), FI-00014 University of Helsinki,
Helsinki, Finland.
E-mail address: [email protected] (A. Audzijonyte).
Journal of Experimental Marine Biology and Ecology 325 (2005) 228–239
www.elsevier.com/locate/jembe
adaptations. The sensitivity theory simply expectsvision to closely match the spectral distribution oflight (Clarke, 1936), while the contrast theory (Lyth-goe, 1972) suggests that an boffsetQ visual pigmentwill better detect a contrasting object against thebackground. The sensitivity theory may apply partic-ularly to deep-water habitats, where both spectralrange and total amount of the transmitted light arestrongly reduced. Indeed, in a number of deep-waterfishes the peak absorbance of visual pigments clustersaround 474–490 nm, which is the dominant wave-length of light in deep oceanic waters (Douglas andPartridge, 1997).
However, as more data are collected, it is becomingclearer that such fine tuning of vision can be restrictedby a number of factors, including genetic and physi-ological constraints and phylogenetic history (Archeret al., 1999). It has been shown that only five aminoacid changes may be responsible for the variation inkmax in most vertebrate red and green pigments(Yokoyama, 2000), while four amino acids are in-volved in spectral tuning of rod opsins of cottoid fishesin Lake Baikal (Hunt et al., 1996). Physiological con-straints reflect the need to maximise the signal-to-noiseratio of the visual pigment, increasingly prone to ther-mal instability and spontaneous activation whenadapted to longer wavelengths (Donner et al., 1990;Firsov and Govardovskii, 1990; Partridge and Cum-mings, 1999). Moreover, the behaviour of an animal,such as burrowing or migration, can greatly alter itsactual light environment, but remain unaccounted byresearches. This would cause an apparently suboptimalmatch between the species spectral sensitivity and thelight environment. Finally, evolutionary inertia or phy-logenetic constraints are thought to play an importantrole in limiting adaptation to the current selectionpressures (Douglas and Partridge, 1997; Marshall etal., 1999; Partridge and Cummings, 1999). However,just how much they affect adaptations remains contro-versial, as both rapid evolution and rigid constraintshave been shown in different animal groups (Lindstromand Nilsson, 1988; Carulli et al., 1994; Kevan et al.,2001). For example, arthropods living in completelydark caves may possess either eyes of true photorecep-tion (Meyer-Rochow and Liddle, 1988) or only rudi-mentary eye-stalks (Meyer-Rochow et al., 2001).
In order to analyse how phylogenetic constraintsaffect current adaptation, one should be able to sep-
arate the forces of current and past selection and theeffects of physiological and biophysical limitations.This is notoriously difficult, if not impossible. Nev-ertheless, recent advances in the fields of phyloge-netics and phylogeography can provide importantinsights into the question. Knowledge of phylogeneticrelationships of the studied taxa is essential for com-paring adaptations at various hierarchical levels,while information on molecular divergences enablesvisual characteristics to be viewed on absolute timescales.
Opossum shrimps of the genus Mysis (Crustacea:Mysida) represent good model organisms to analysevisual adaptation at different taxonomic levels andtime scales. Adult Mysis have superposition eyes(Hallberg, 1977) and apparently a single visual pig-ment (Lindstrom and Nilsson, 1988; Jokela-Maatta etal., in press). Pronounced differences of the spectralsensitivity in two post-glacially isolated populationsof M. relicta living in different light environmentswere reported earlier and rapid evolutionary changessuggested (Lindstrom and Nilsson, 1988; Lindstrom,2000a). However, recent taxonomic findings haveshown that the conventional M. relicta actually con-sists of four sibling species with different distribu-tions, zoogeographical histories and ecologicalcharacteristics (Vainola, 1986; Vainola et al., 1994).Two of the species, M. relicta Loven, 1862 and M.salemaai Audzijonyte and Vainola, 2005, are wide-spread in Europe and co-exist in the northernmost partof the Baltic Sea and a number of lakes (Vainola andVainio, 1998; Audzijonyte and Vainola, 2005). Differ-ences in the spectral sensitivities were found betweeninshore and offshore Mysis populations of the BalticSea, likely to represent the two sibling species(Lindstrom, 2000a). However, as the two popula-tions also came from different light environments,no clear conclusions could be drawn regarding thespecies-specific, or phylogenetically constrained, dif-ferences.
In this study we used an electroretinogram (ERG)technique to measure the spectral sensitivities of M.relicta and M. salemaai from allopatric, parapatricand sympatric populations, and from different lightenvironments. We studied M. relicta from two lakesin southern Finland and an inshore site in the Gulf ofFinland (Baltic Sea), and M. salemaai from an off-shore site in the Gulf of Finland. In addition, we
A. Audzijonyte et al. / J. Exp. Mar. Biol. Ecol. 325 (2005) 228–239 229

analysed specimens from sympatric populations ofthe two species from the Bothnian Bay, the north-ernmost Baltic Sea (Fig. 1). The aims of the studywere twofold. First, we examined the interspecificdifferences of spectral sensitivity between M. relictaand M. salemaai, probably reproductively isolatedsince some two million years (Vainola, 1986), inorder to assess whether the earlier reported differen-tiation in parapatric conditions also prevails in thesame light environment in sympatry. Second, weanalysed four post-glacially isolated populations ofM. relicta s. str. from different light environments, tomeasure the amount of differentiation accumulatedduring a 10 kyr time period as a response to differentlight conditions.
2. Materials and methods
2.1. Samples
M. relicta is widespread in relatively deep lakes ofNorthern Europe, including many lakes in southernand central Finland. In the brackish-water Baltic Seathis species mainly lives inshore; in deeper offshoreareas it is replaced by M. salemaai. Freshwateroccurrences of M. salemaai are rarer and includeseveral lakes in Karelia, central and southwesternSweden, Norway, Ireland and Denmark (Vainola etal., 1994). In the northernmost part of the Baltic Sea,the Bothnian Bay, the two species are widely sym-patric and occur in approximately equal proportions
Fig. 1. A) Map of the Baltic Sea, indicating position of the ice-cap during deglaciation ca 12 kyr ago (thick line) and the extent of the freshwater
Baltic Ice Lake at that time (grey shading) (according to Donner, 1995). The current Mysis populations are thought to be derived from this
periglacial lake. B) A more detailed map of the studied localities.
A. Audzijonyte et al. / J. Exp. Mar. Biol. Ecol. 325 (2005) 228–239230

(Vainola and Vainio, 1998). During daytime M.relicta and M. salemaai usually stay in the deep,often close to the bottom, while at night they conductvertical migrations in the water column (Salemaa etal., 1986).
Samples of M. relicta and/or M. salemaai wereobtained during the summer of 2004 from five local-ities with different environmental light spectra. Sam-ples from sites inhabited by a single species onlyincluded M. relicta from the clear-water Lake Vuohi-jarvi, from the dark-water Lake Paajarvi, and from abrackish-water site of the inshore Gulf of Finland(Pojoviken Bay) in the Baltic Sea. M. salemaai wasobtained from an offshore site in the Gulf of Finland(near Klovaskar, Tammisaari Archipelago) (Fig. 1).Samples were taken from depths of 15–80 m usingan epibenthic sled or with vertical net hauls. In addi-tion, a sample from a site with sympatric populationsof the two species was collected in the Bothnian Bay(station RR6, 64848VN, 23828VE) with a vertical haulfrom a depth of about 80 m. When collected duringdaytime, mysids were immediately put into light-tighttanks. Animals from the dark-water Lake Paajarvi,known to be particularly sensitive to light (Lindstromand Nilsson, 1988; Lindstrom et al., 1988), werecaptured at night. The collected animals were keptin aerated aquaria in complete darkness in water withsalinities and temperatures similar to their naturalenvironments. The acclimatisation period from collec-tion to experiments was at least three days. No light-induced damage to the eyes was evident at the begin-ning of the experiments.
2.2. Environmental light measurements
The spectrum of transmitted light at the sam-pling localities was obtained with a QSM 2500quantum spectrometer (Techtum Instrument, Umea,Sweden) connected to a plotter. Recordings wereperformed at 5-m depth intervals or less, down tothe threshold sensitivity of the instrument, at noonon a clear day (Lindstrom, 2000a). In Lake Vuo-hijarvi recordings were done at the depths of 10and 15 m.
No direct measurements of light transmission wereavailable from the Bothnian Bay. Therefore we havecalculated spectral light attenuation coefficients as thesum of the absorption by phytoplankton, chromophor-
ic dissolved organic matter (CDOM) and waterthrough 400–700 nm at 10 nm intervals accordingto Baker and Smith (1982). The absorption coeffi-cients for phytoplankton and CDOM were calculatedfrom the specific absorption spectra normalised withchlorophyll a (Baker and Smith, 1982) and dissolvedorganic carbon (DOC), respectively. Calculationswere also performed for the offshore Gulf of Finlandconditions to test the accuracy of the model with theavailable direct measurements of the light transmis-sion. In the offshore Gulf of Finland, the specificabsorptivity of CDOM at 300 nm was 1.05 m!1
(mg DOC l!1)!1 and the spectral slope coefficient(S) of CDOM was 0.0192 nm!1 (Vahatalo and Zepp,unpublished). For the Bothnian Bay, with strong sig-nature of river waters, we used S of 0.015 nm!1,which represents riverine CDOM entering to estuary(Vahatalo et al., 2005). The concentration of DOC was5 mg DOC l!1 at offshore Gulf of Finland and wasestimated to 7 mg DOC l!1 at the Bothnian Bay(Vahatalo, unpublished). The concentration of chloro-phyll a was taken from the Finnish Institute of MarineResearch information website (http://www.fimr.fi/en/itamerikanta/tietoa/mittaustulokset.html, retrieved onFebruary 15, 2005).
2.3. Electroretinogram (ERG) recordings
The animals were collected from aquaria in infra-red (IR) light using an IR converter (Find-R-Scope,FWJ Industries). Preparations for the ERG recordingswhere also conducted under IR light using KodakWratten 87 filters in front of the light source. Forthe samples from the sympatric populations, theheads of mysids were removed in IR light and therest of the body used for species identification prior tothe experiment.
For experiments the head of a mysid was re-moved and mounted in the specimen chamber bathedin brackish-water from the Baltic Sea (salinity ca4x) and throughout the experiment held at a con-stant temperature of about 8 8C. A hole was madewith a micro-needle through the cornea in the dorsalregion of the eye and the recording glass pipetteelectrode (diameter 10 Am) was lowered throughthe hole. The perforation would destroy only asmall proportion of up to 2000 ommatidia in thecompound eye (see Fig. 2 in Lindstrom and Nilsson,
A. Audzijonyte et al. / J. Exp. Mar. Biol. Ecol. 325 (2005) 228–239 231

1988). Preparation typically lasted 10–20 min, andwas performed in IR light. Yet, taking into consid-eration the earlier recorded high sensitivity to longwavelengths in M. relicta (Lindstrom and Meyer-Rochow, 1987), the eyes were allowed to adapt incomplete darkness for ca 1 h before starting themeasurements. Further details of the recording tech-nique are given in Donner (1971), Lindstrom et al.(1988), and Pahlberg et al. (in press). Figures of M.relicta rhabdomeric anatomy are given in Lindstromet al. (1988) and Jokela-Maatta et al. (in press). Thespectral sensitivity was measured at 12–16 test wave-lengths produced by interference filters (Schott DILor Melles-Griot, half-bandwidths 7–16 nm) coveringthe range of 472–777 nm. The light source used wasa 6 V and 15 W microscope lamp driven by astabilized power supply in DC mode. The lightintensity reaching the eye was controlled with neutraldensity filters and a neutral wedge. The stimulusfield was homogeneous over an area covering theprojection of the eye onto a plane, and the beam wasperpendicular to it. The response criterion was set at100 or 200 AV, depending on sensitivity of the eye;it was at the lower end of the linear part of theintensity–response curve (Lindstrom and Nilsson,1984). The stimuli were 125 ms light pulses withan inter-stimulus interval of 1 min for smallresponses, and 2 min if the response was N200 AV.
The AC signal was low-pass filtered at 3 and 0.3kHz and further by a 50 Hz notch. The amplitudes ofresponses were read in AC mode from a Tektronix5031 dual-beam storage oscilloscope. The relativequantum content of stimuli of different wavelengthswas calibrated using an Ocean Optics S2000 fibreoptic spectrometer (Inc., FL, USA) (see Pahlberg etal., in press).
The absolute sensitivities varied extensively amongpopulations and individual measurements, due to dif-ferent conditions of the analysed eyes and preparationquality. Therefore the sensitivities obtained from in-dividual measurements were scaled, setting the logvalue of maximum sensitivity to zero. To accountfor a possible slow change in sensitivity during theexperiment, spectral sensitivity at 512 nm was mea-sured at about every 10 min; the obtained values wereused to correct sensitivities at other wavelengths at thefixed moment of the experiment. The scaled and time-corrected values of spectral sensitivities at each mea-sured wavelength were averaged within each popula-tion and standard error values calculated. In order totest whether the shape of the spectral sensitivity curveremains stable, spectral sensitivities were repeatedlymeasured during the experiment in four specimensfrom different populations at 406, 512 and 628 nm;no changes in the relative spectral sensitivity wereobserved.
Fig. 2. Spectral distribution of ambient light in the studied localities: a) offshore Gulf of Finland, at 20 m (Lindstrom and Nilsson, 1988), b)
inshore Gulf of Finland, at 10 m (Lindstrom, 2000a); c) Lake Vuohijarvi, at 15 m; d) Lake Paajarvi, at 5 m (Lindstrom, 2000a). Light
distribution is given at different depths for different localities to account for varying water transparency and the absolute amount of light at a
fixed depth.
A. Audzijonyte et al. / J. Exp. Mar. Biol. Ecol. 325 (2005) 228–239232

To determine the wavelength of peak sensitivitya cubic polynomial curve was fitted to the datapoints of individual recordings using SYSTAT 8.0software, and the wavelength of maximum sensitiv-ity was read from the curve. Spectral sensitivityvalues at shorter wavelengths, where curves becamestraight and the secondary peak appeared, wereexcluded to improve the fit. The cubic polynomialfitted the data well; a linear correlation coefficientbetween the original data and the fitted curve wasN0.98. Mean and standard error values of themaximum spectral sensitivity were calculated foreach population.
3. Results
3.1. Light environments
The light environments in the studied localitiesvaried from typical marine coastal water with maxi-mum transmitted light at about 550 nm to that of adark humic water with maximum between 600–700nm (Fig. 2, Table 1) (Lindstrom and Nilsson, 1988;Lindstrom, 2000a,b). In the offshore Gulf of Finlandthe light was most strongly dominated by shorterwavelengths, with maximum transmitted light at555–575 nm. The light environment at the inshoresite in the Gulf of Finland was similar to that of theclear-water Lake Vuohijarvi with maximum transmit-ted light at 565–585 nm. The dominant light was evenfurther displaced towards long wavelengths in thehumic Lake Paajarvi.
Maximum light transmittance modelled from thespectral light attenuation coefficients of water, chlo-rophyll a and DOC, was at 550–580 nm in the off-shore Gulf of Finland site, which was in a closeagreement with the direct measurements. For theBothnian Bay, where no direct measurements wereavailable, the model suggested maximum transmittedlight at 570–590 nm. The calculated spectral curvesalso indicated that due to higher concentrations ofCDOM in the Bothnian Bay, the amount of light atwavelengths b550 nm decreases faster compared withthe Gulf of Finland offshore area (not shown).
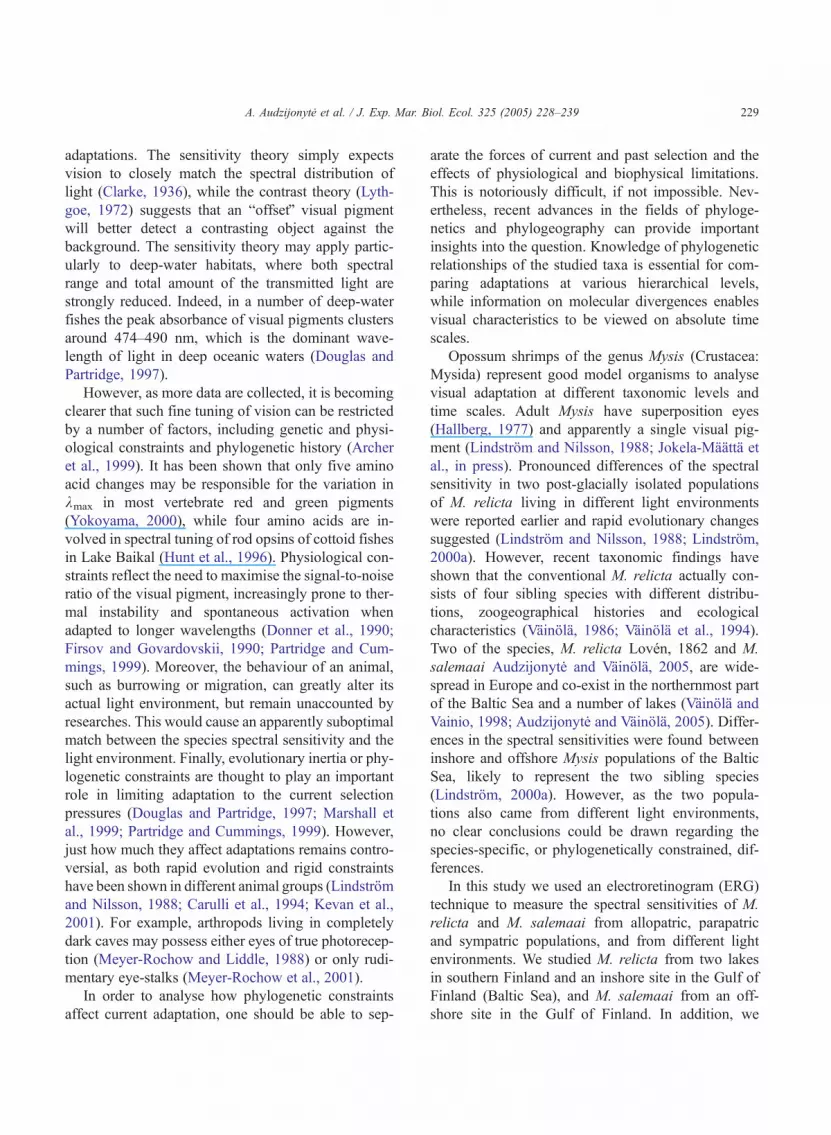
3.2. Spectral sensitivity differences between sympatricM. relicta and M. salemaai
At the sympatric site in the Bothnian Bay themaximum spectral sensitivity of M. relicta, as deter-mined by the curve-fitting procedure, was displacedby 18 nm towards longer wavelengths from that in M.salemaai, with estimated k(Smax) of 564F3 and546F1 nm respectively (Fig. 3A, Table 1). The spec-tral sensitivity difference was particularly clear in thelongwave-slope regions, where slopes from the orig-inal data had closely similar shapes in all the analysedspecimens.
3.3. Intraspecific variation
The spectral sensitivities in the four studied popu-lations of M. relicta differed clearly between thesamples from the lakes and those from the BalticSea, whereas little difference was seen between the
Table 1
Wavelengths of the maximally transmitted light, k(Imax), in the environment and the maximum spectral sensitivities, k(Smax) of the eye in the
studied populations of Mysis. Other characteristics of habitats are also given. GoF—Gulf of Finland, ID—site numbers, as indicated in Fig. 1B
Species ID Location k(Imax)
(nm)
k(Smax)
meanFS.E.
(nm)
n Maximum
depth (m)
Salinity
(x)
Occurrence
M. relicta 1 Lake Paajarvi 600–700 591F2 5 79 Fresh Allopatric
M. relicta 2 Lake Vuohijarvi 565–585 592F5 6 60 Fresh Allopatric
M. relicta 3 Inshore GoF 565–585 563F3 4 40 3–4 Parapatric
M. salemaai 4 Offshore GoF 550–575 544F3 6 80 6–7 Parapatric
M. relicta 5 Bothnian Bay 570–590* 564F3 5 86 3–4 Sympatric
M. salemaai 5 Bothnian Bay 570–590* 546F1 5 86 3–4 Sympatric
*Spectral transmission maximum for the Bothnian Bay was calculated from chlorophyll a and DOC concentrations, according to Baker and
Smith (1982) and Vahatalo and Zepp (unpublished); see Materials and methods.
Occurrence refers to sympatric, parapatric or allopatric occurrences of M. relicta and M. salemaai.
A. Audzijonyte et al. / J. Exp. Mar. Biol. Ecol. 325 (2005) 228–239 233
two lakes or between the two Baltic sites (Figs. 3Band 4; Table 1). k(Smax) in lakes Paajarvi (591F2 nm)and Vuohijarvi (592F5 nm) was ca 28 nm longwave-shifted from those in the Gulf of Finland and BothnianBay populations (563F3 and 564F3 nm, respective-ly). The two lake populations were characterised byhigh absolute sensitivities (not shown) and particular-ly straight peak areas of the spectral curves. In the twoBaltic Sea populations spectral curves had clearerpeaks. Towards the shortwave part of the spectrum,
the sensitivities of lake populations dropped and in-creased again at 472 nm, but confidence intervals atthese wavelengths were broad. The increase mostlikely indicates the beta-band of the same visual pig-ment and not an additional pigment. So far only asingle visual pigment has been recorded in M. relictaand M. salemaai and selective adaptation to light ofdifferent wavelengths has not changed the shape ofthe curve (Lindstrom, 2000a and unpublihed; Jokela-Maatta et al., in press).
Fig. 3. A) Scaled (max=0) log spectral sensitivities of M. relicta (n =5) and M. salemaai (n =5) from the sympatric populations in the Bothnian
Bay. The scaled mean values are connected to a curve, means and standard error bars are indicated. B) Scaled (max=0) log spectral sensitivities
of M. relicta and M. salemaai from the six studied populations: a) M. relicta from Lake Paajarvi (n =5) and Lake Vuohijarvi (dashed line)
(n =6); b) M. relicta from inshore Gulf of Finland, Pojoviken Bay (n =4) and Bothnian Bay (dashed line) (n =5); c) M. salemaai from offshore
Gulf of Finland, near Klovaskar (n =6) and Bothnian Bay (dashed line) (n =5). For clarity, the two data points within each group of spectra are
slightly displaced horizontally and unidirectional standard error bars are indicated.
A. Audzijonyte et al. / J. Exp. Mar. Biol. Ecol. 325 (2005) 228–239234
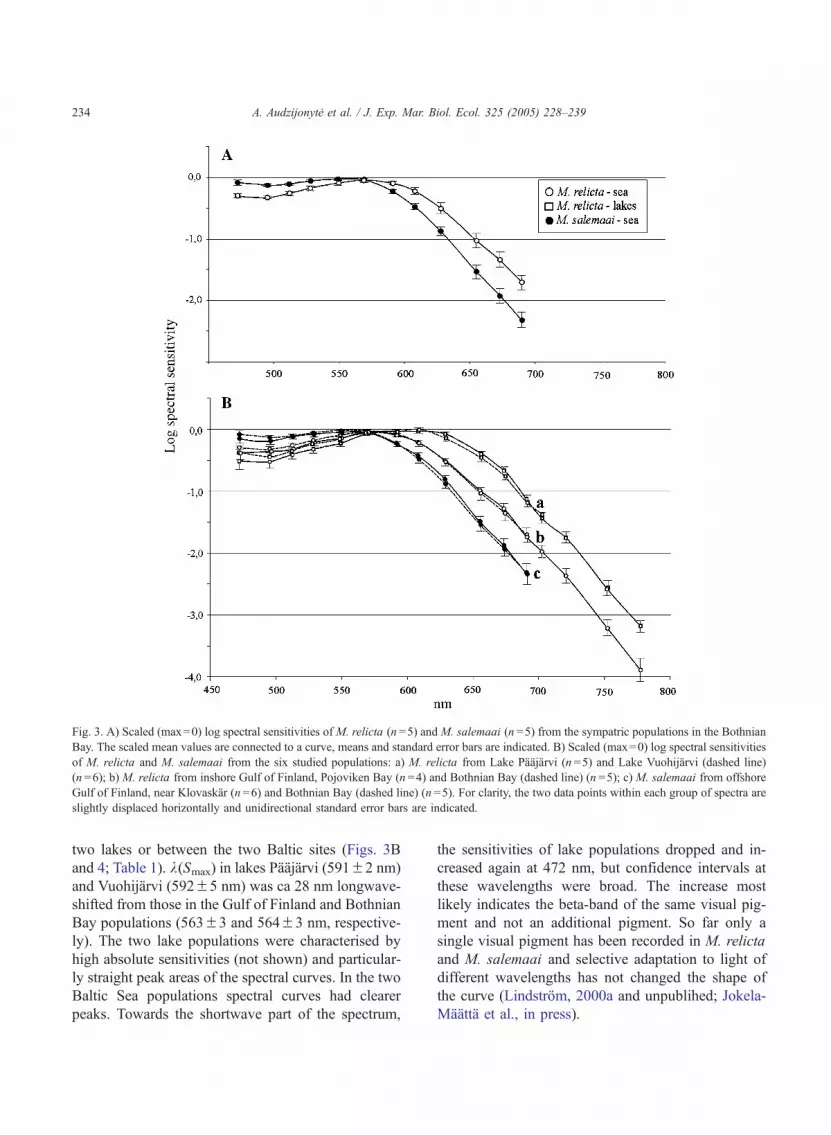
The spectral sensitivities of M. salemaai from theoffshore Gulf of Finland site and the Bothnian Baywere closely similar to each other, with the estimatedk(Smax) at 544F3 and 546F1 nm respectively (Figs.3B and 4; Table 1).
4. Discussion
The two species of opossum shrimp M. relicta andM. salemaai provide an interesting framework tostudy the evolutionary dynamics of visual adaptation.The levels of interspecific molecular differentiationbetween the two species in allozymes (Nei’sD =0.27) and in mitochondrial DNA (about 8% se-quence divergence) suggest that they probably di-verged before Pleistocene times, ca 2–3 millionyears ago (Vainola, 1986; Audzijonyte and Vainola,2005). Current distributions in the Baltic Sea and inNorth European lakes also imply that the species havedifferent salinity preferences. They co-exist sympatri-cally only in a few lakes and in the northernmost partof the Baltic Sea (Vainola et al., 1994; Vainola andVainio, 1998; Audzijonyte and Vainola, 2005). Incontrast to the relatively deep genetic and evolution-ary divergence between M. relicta and M. salemaai,intraspecific genetic differences among populations ofM. relicta are small, in accord with a common late-
glacial origin of the Baltic and lake populations from asingle periglacial refugium (Vainola et al., 1994).However, currently they are exposed to differentlight conditions and therefore likely are under differ-ent selection regimes.
The electroretinogram (ERG) technique, used inthis study, differs from the direct analysis of the visualpigments, e.g. microspectrophotometry (MSP), in thatit measures combined effect of the visual pigmentabsorbance, intraocular screening pigments andbself-screeningQ (Goldstein and Williams, 1966; Gold-smith, 1978; Frank and Widder, 1999). On the onehand, this may be an advantage of ERG over MSPanalyses, because it should reveal a btrueQ sensitivityof an eye, instead of the absorption spectra of thevisual pigment only. On the other hand, the molecularbasis of evolution, i.e. whether differences are due tochanges in opsin, chromophores or screening pig-ments, cannot be inferred by the ERG method alone.Yet, recent MSP results from M. relicta and M. sale-maai (Jokela-Maatta et al., in press) indicate clearcorrelation between MSP and ERG spectral curves.Fitting the visual-pigments templates (Govardovskii etal., 2000) to MSP spectra also shows that the twospecies analysed in this study have predominantly, oreven exclusively, A2 chromophore (Jokela-Maatta etal., in press). It is therefore likely that different ERGspectra in Mysis at least partly reflect geneticallyencoded changes of the opsin itself. Yet, the maxi-mum absorbance of the visual pigment cannot becalculated from the ERG analysis results. A numberof studies have shown that ERG spectral curves arelongwave-displaced compared with the visual pig-ment absorption curves (Goldsmith, 1978; Johnsonet al., 2002; Jokela-Maatta et al., in press). It remainsto be tested, whether this shift in ERG peak sensitiv-ities reflects a true phenomenon in nature, or is anartefact of the ERG analysis. For the time being, wedo not attribute much significance to the exact max-imum spectral sensitivity values per se, but to thedifferences among populations; peak sensitivityvalues are used only as descriptors of the horizontaldisplacement of the spectral curves along the wave-length scale. Focusing on differences rather than onpeak sensitivities gives better means to compare datafrom ERG and MSP analyses. This approach alsoallows better comparisons to the earlier ERG record-ings on Mysis (Lindstrom and Nilsson, 1988; Lind-
Fig. 4. Wavelength of the maximum spectral sensitivity, k(Smax)
(meanFS.E.) of M. relicta and M. salemaai from the six studied
populations plotted against the wavelength (mean and range, Table
1) of the maximally transmitted light in their environments, k(Imax).
Standard error bars of the average k(Smax) value for each population
are indicated. Graphic symbols for populations are the same as in
Fig. 3.
A. Audzijonyte et al. / J. Exp. Mar. Biol. Ecol. 325 (2005) 228–239 235

strom, 2000a) conducted with different ERG settingsand calibration; the positions of the spectral sensitivitypeaks in the earlier studies do not exactly correspondto those reported here, but relative comparisons arestill valid.
4.1. Interspecific differentiation
Although palaeogeographic and phylogeographicdata suggest that ancestors of all populations studiedhere inhabited eastern periglacial lakes during the lastglacial maximum, and thus were exposed to similarenvironmental conditions, different salinity prefer-ences and broad-scale distributions of M. relicta andM. salemaai nevertheless indicate that in the long-termthey have evolved in different salinity regimes (Vainolaet al., 1994). As the light in the majority of freshwaterhabitats is dominated by longer wavelengths than inmarine waters (Jerlov, 1976), it could be expected thatthe predominantly freshwater M. relicta is more likelyto posses longer-wavelength spectral sensitivity thanthe brackish-water M. salemaai.
The maximum spectral sensitivity of M. salemaaiin sympatric and parapatric populations in the BalticSea was about 20 nm shortwave-shifted from that ofM. relicta, and there was little intraspecific variationin the Baltic Sea populations of either species (Figs. 3and 4). The spectral sensitivity of M. salemaai israther similar to that found in a number of genuinelybrackish-water or even marine mysid species that alsolive in the Baltic Sea, e.g. Mysis mixta, Praunusflexuosus or Neomysis integer, while the longwavesensitivities in M. relicta represent a distinctly devi-ating pattern (Lindstrom, 2000a). Still the dominantlight in the offshore Baltic is at least 50 nm longerwavelengths than in most oceanic waters, and evenmore shifted in the peripheral and inshore areas, af-fected by higher nutrient and dissolved organic matterconcentrations from the terrestrial input (Jerlov, 1976;Lindstrom, 2000a). The spectral sensitivities of themainly offshore M. salemaai and inshore M. relicta(as well as of other Baltic mysids mentioned above)are likewise displaced towards the longer wave-lengths, when compared with truly oceanic crusta-ceans (Frank and Widder, 1999; Marshall et al.,1999; Johnson et al., 2002). The spectral sensitivityof M. salemaai seems to be adapted to the lightconditions of the open Baltic Sea, where light trans-
mittance drops quickly at N580 nm wavelengths (Fig.2). Eyes of M. relicta in the Baltic Sea in turn appearbetter fitted to coastal areas, with relatively more lightat wavelengths greater than 600 nm. A similar gradi-ent of spectral sensitivity displacement in coastal andfreshwater species has been reported in a number offishes (Lythgoe et al., 1994) and marine decapods(Johnson et al., 2002), but no correlation was foundin crabs (Forward et al., 1988).
4.2. Intraspecific variation in M. relicta
Studies of the intraspecific variation of spectralsensitivity can provide important insights into thedynamics of visual adaptation, particularly if sup-plemented by information on historical relationshipsamong the populations. While a number of intra-specific studies have focused on ontogeneticchanges during the life-cycle (Partridge and Cum-mings, 1999), little is known about adaptations indifferent populations as a response to environmentalconditions.
In this study, the two lake populations of M. relictahad distinctly different spectral sensitivities from thetwo Baltic Sea populations, but little variation wasfound either between the two lakes or between siteswithin the Baltic Sea, despite clear differences in lightenvironments (Fig. 3B). The longwave-shift of thespectral sensitivity of M. relicta in the dark LakePaajarvi, as compared with the inshore Gulf of Fin-land, has already been discussed on the basis of bothERG and MSP analyses (Lindstrom and Nilsson,1988; Dontsov et al., 1999; Jokela-Maatta et al., inpress). As the light environment in the humic lakediffers strongly from that in clear water conditions,fast adaptive change within the lake after the post-glacial isolation was repeatedly suggested. The cur-rent finding of the longwave sensitivity in the clearwater of Lake Vuohijarvi therefore seems to contradictthis hypothesis. Why is the spectral sensitivity of M.relicta in Lake Vuohijarvi similar to that in LakePaajarvi, when the environmental light spectrum inVuohijarvi is similar to the inshore site in the Gulf ofFinland?
Two scenarios should be considered to explain theobserved lack of correspondence between the lightenvironment and spectral sensitivity of M. relicta:(i) the longwave-shifted sensitivity has a particular
A. Audzijonyte et al. / J. Exp. Mar. Biol. Ecol. 325 (2005) 228–239236

local adaptive value and arose in lakes Paajarvi andVuohijarvi independently, or (ii) it is the ancestralstate, dating back to the common ancestors of thetwo populations in Late Pleistocene periglaciallakes. Neither of the hypotheses can be confidentlycorroborated with the current data, but knowledgefrom eye physiology and phylogeography give somebackground for thought.
As regards the first hypothesis, and considering thesignal-to-noise ratio of a visual pigment, it is generallyknown that a longwave sensitive pigment is moreprone to thermal instability and spontaneous activa-tion. Shifting sensitivity towards the longwave part ofthe spectrum is therefore beneficial only when theincreased photon catch will counterbalance the highernoise of the less stable pigment (Donner et al., 1990;Firsov and Govardovskii, 1990). Such an advantagewould, however, not seem to apply for M. relicta inthe clear-water Lake Vuohijarvi, where enough lightshould be available at shorter wavelengths. Thus theadaptive value of the longwave spectral sensitivity inthis population cannot be explained from the currentknowledge of the physiology of vision.
In the second scenario the longer wavelength sen-sitivity represents an ancestral state in freshwater M.relicta, which then has been lost in the Baltic popula-tions. This seems consistent with the phylogeographichistory of the species. The ice-age ancestors of thestudied Mysis inhabited eastern periglacial lakes,which coalesced during deglaciation in the Baltic IceLake ca 15–11.5 kyr ago (see Fig. 1A). Lakes Paajarviand Vuohijarvi, as most other lakes in Finland, wereseparated from the Baltic at ca 10 kyr ago, before anyconsiderable brackish influence, and remained isolat-ed from each other and from the Baltic since then(Tikkanen and Oksanen, 2002). With the opening ofthe Danish straits about 9 kyr ago, saline watersentered into the Baltic Sea, which from then on hasbeen a brackish-water body (Donner, 1995). Recon-structing light environments in the periglacial lakesand different stages of the Baltic Sea is largely spec-ulative, but the simplest scenario to account for thedifference of spectral sensitivity in the four M. relictapopulations would be a single shortwave shift in theBaltic Sea, post-dating the isolation of lakes. Theefficient spread of the shortwave-shifted spectral sen-sitivity throughout the Baltic Sea would generallyimply its high adaptive value. Provided the recorded
spectral sensitivity difference has a genetic basis, suchspread cannot be explained by chance (genetic drift)alone, as population genetic data on presumably neu-tral allozyme characters indicate minimal differentia-tion between the Baltic and lakes (Fstg0.05, Vainolaet al., 1994). Little genetic differentiation means largeeffective population sizes in both lakes and the BalticSea, suggesting that lack of genetic variation is un-likely to be a limiting factor in the adaptive process. Itthus remains unclear why the spectral sensitivity haschanged in the Baltic Sea, but not in Lake Vuohijarvi.To account for that, additional environmental factorsshould be invoked; the long-term light environment inthe Baltic Sea and Lake Vuohijarvi could have alsobeen different from those today. The most obviousenvironmental difference is the salinity itself, but toour knowledge, its effect on the spectral sensitivityhas not been proven so far.
The well-known history of North European lakesand the associated phylogeographic histories of thetwo Mysis species (Vainola et al., 1994) provide anattractive framework to test the hypotheses on con-straints and on the polarity and time scales of thespectral sensitivity changes. On the one hand, bothspecies are represented by continental eastern andsoutheastern populations that were directly derivedfrom the periglacial lakes, and so did not migratethrough the Baltic basin. The retention or repeatedgain of the longwave sensitivity in M. relicta can beassessed in numerous lakes, independently isolatedfrom the early freshwater Baltic and representing avariety of light conditions. On the other hand, both M.relicta and M. salemaai are also found in youngerlakes in Sweden that were isolated during the brack-ish-water phase of the Baltic Sea. Assuming a singleshortwave-shift in spectral sensitivity in the BalticSea, M. relicta in these lakes could have vision char-acteristics similar to that in the Baltic Sea. In addition,the range of M. salemaai comprises freshwater popu-lations in SW Scandinavia and Ireland, which haveexperienced more drastic environmental changes dur-ing their Late Pleistocene history, and which are partlyderived from different refugia (Vainola et al., 1994).In effect, this framework can be used to construct, foreach species, a population tree with well defined anddated branching events (i.e. lake isolations) and anassociated environmental record, on which the spec-tral sensitivity patterns can be mapped in terms of the
A. Audzijonyte et al. / J. Exp. Mar. Biol. Ecol. 325 (2005) 228–239 237

comparative phylogenetic method (e.g. Brooks andMcLennan, 2002).
In summary, this study shows that information onthe current light environment is not sufficient to ex-plain differences in the spectral sensitivities amongMysis species and populations (Fig. 4) and suggeststhat evolutionary constraints, or other environmentalfactors, may affect the adaptation both at the inter- andintraspecific levels. At the same time, however, largedifferences in k(Smax) among post-glacially isolated(10 kyr)M. relicta population demonstrate that spectralsensitivity change can occur relatively fast. The obser-vations are to some extent contradictory, and furtherstudy is needed to elucidate the roles of phylogeneticconstraints and adaptive shifts in vision in Mysis.
Acknowledgements
We are grateful to Ari Laine (Finnish Institute ofMarine Research, r/v bArandaQ) for the sample fromthe Bothnian Bay. We thank Kristian Donner, VictorGovardovski, Eric Warrant and three anonymousreferees for inspiring suggestions and significant com-ments on the manuscript, and Anssi Vahatalo for helpwith light transmission calculations. The study hasbeen supported by grants from the Walter and Andreede Nottbeck Foundation (to AA), by the FinnishSociety of Sciences and Letters, the Ella and GeorgEhrnrooth Foundation and the Oskar Oflund Founda-tion (to JP) and the University of Helsinki researchfunds (to RV). [RH]
References
Archer, S.N., Djamgoz, M.B.A., Loew, E.R., Partridge, J.C., Val-
lerga, S. (Eds.), 1999. Adaptive Mechanisms in the Ecology of
Vision. Kluwer Academic Publishers.
Audzijonyte, A., Vainola, R., 2005. Diversity and distributions of
circumpolar fresh- and brackish-water Mysis (Crustacea:
Mysida): descriptions of M. relicta Loven, 1862, M. salemaai
n. sp., M. segerstralei n. sp. and M. diluviana n. sp., based on
molecular and morphological characters. Hydrobiologia 544,
88–141.
Baker, K.S., Smith, R.C., 1982. Bio-optical classification and model
of natural waters 2. Limnol. Oceanogr. 27, 500–509.
Brooks, D.R., McLennan, D.A., 2002. The Nature of Diversity: An
Evolutionary Voyage of Discovery. The University of Chicago
Press (676 pp.).
Carulli, J.P., Chen, De-Mao, Stark, W.S., Hartl, D.L., 1994. Phy-
logeny and physiology of Drosophila opsins. J. Mol. Evol. 38,
250–262.
Clarke, G.L., 1936. On the depth at which fishes can see. Ecology
17, 452–456.
Donner, K.O., 1971. On vision in Pontoporeia affinis and P. femor-
ata. Soc. Scient. Fenn. Comment. Biol. 41, 1–17.
Donner, J., 1995. The Quaternary History of Scandinavia. Cam-
bridge University Press, Cambridge.
Donner, K., Firsov, M.L., Govardovskii, V.I., 1990. The frequency
of isomerization-like bdarkQ events in rhodopsin and porphyrop-
sin rods of the bull–frog retina. J. Physiol. 428, 673–692.
Dontsov, A.E., Fedorovich, I.B., Lindstrom, M., Ostrovsky, M.A.,
1999. Comparative study of spectral and antioxidant properties
of pigments from the eyes of two Mysis relicta (Crustacea,
Mysidacea) populations, with different light damage resistance.
J. Comp. Physiol., B. Biochem. Syst. Environ. Physiol. 169,
157–164.
Douglas, R.H., Partridge, J.C., 1997. On the visual pigments of
deep-sea fishes. J. Fish Biol. 50, 68–85.
Firsov, M.L., Govardovskii, V.I., 1990. Dark noise of visual pig-
ments with different absorption maxima. Sens. Syst. 4, 25–34.
Forward Jr., R.B., Cronin, T.W., Douglass, J.K., 1988. The
visual pigments of crabs—II. Environmental adaptations. J.
Comp. Physiol., A Sens. Neural Behav. Physiol. 162,
479–490.
Frank, T.M., Widder, E.A., 1999. Comparative study of the spectral
sensitivities of mesopelagic crustaceans. J. Comp. Physiol., A
Sens. Neural Behav. Physiol. 185, 255–265.
Goldsmith, T.H., 1978. The effect of screening pigments on the
spectral sensitivity of some crustacea with scotopic (superposi-
tion) eyes. Vis. Res. 18, 475–482.
Goldstein, E.B., Williams, T.P., 1966. Calculated effects of
bscreening pigmentsQ. Vis. Res. 6, 39–55.Govardovskii, V.I., Fyhrquist, N., Reuter, T., Kuzmin, D.G., Don-
ner, K., 2000. In search of the visual pigment template. Vis.
Neurosci. 17, 509–528.
Hallberg, E., 1977. The fine structure of the compound
eyes of mysids (Crustacea, Mysidacea). Cell Tissue Res.
184, 45–65.
Hunt, D.M., Fitzgibbon, J., Slobodyanyuk, S.J., Bowmaker, J.K.,
1996. Spectral tuning and molecular evolution of rod visual
pigments in the species flock of cottoid fish in Lake Baikal.
Vis. Res. 36, 1217–1224.
Jerlov, N.G., 1976. Marine Optics. Elsevier, Amsterdam.
Johnson, M.L., Gaten, E., Shelton, P.M.J., 2002. Spectral sensitiv-
ities of five marine decapod crustaceans and a review of spectral
sensitivity variation in relation to habitat. J. Mar. Biol. Assoc.
U.K. 82, 835–842.
Jokela-Maatta, M., Pahlberg, J., Lindstrom, M., Porter, M., Zak,
P., Ostrovsky, M., Cronin, T., Donner, K., in press. Visual
pigment absorbance spectra and spectral sensitivity of Mysis
relicta (Crustacea, Mysida) in different light environments. J.
Comp. Physiol., A.
Kevan, P.G., Chittka, L., Dyer, A.G., 2001. Limits to the salience of
ultraviolet: lessons from color vision in bees and birds. J. Exp.
Biol. 204, 2571–2580.
A. Audzijonyte et al. / J. Exp. Mar. Biol. Ecol. 325 (2005) 228–239238

Kirk, J.T.O., 1994. Light and Photosynthesis in Aquatic Environ-
ments, 2nd ed. Cambridge University Press, Cambridge.
Lindstrom, M., 2000a. Eye function of Mysidacea (Crustacea) in the
northern Baltic Sea. J. Exp. Mar. Biol. Ecol. 246, 85–101.
Lindstrom, M., 2000b. Annual changes in the underwater light
milieu in a Finnish Baltic Sea coastal locality. Geophysica 36,
215–232.
Lindstrom, M., Meyer-Rochow, V.B., 1987. Near infra-red sensitiv-
ity of the eye of the crustacean Mysis relicta? Biochem. Bio-
phys. Res. Commun. 147, 747–752.
Lindstrom, M., Nilsson, H.L., 1984. Synformagan hos pungrakan
Mysis relicta i olika ljusmiljoer. Mem. Soc. Fauna Flora Fenn.
60, 35–38.
Lindstrom, M., Nilsson, H.L., 1988. Eye function of Mysis relicta
Loven (Crustacea) from two photic environments. Spectral sen-
sitivity and light tolerance. J. Exp. Mar. Biol. Ecol. 120, 23–37.
Lindstrom, M., Nilsson, H.L., Meyer-Rochow, V.B., 1988. Recov-
ery from light-induced sensitivity loss in the eye of the crusta-
cean Mysis relicta in relation to temperature. A study of ERG-
determined V/log I relationships and morphology at 4 8C and 14
8C. Zool. Sci. 5, 743–757.Lythgoe, J.N., 1972. The adaptation of visual pigments to the photic
environment. In: Dartnall, H.J.A. (Ed.), Handbook of Sensory
Physiology, vol. VII/I. Springer, Berlin, Heidelberg, New York,
pp. 566–603.
Lythgoe, J.N., 1979. The Ecology of Vision. Clarendon Press,
Oxford.
Lythgoe, J.N., Muntz, W.R.A., Partridge, J.C., Shand, J., Williams,
D.Mc.B., 1994. The ecology of the visual pigments of snappers
(Lutjanidae) on the Great Barrier Reef. J. Comp. Physiol., A
Sens. Neural Behav. Physiol. 174, 461–467.
Marshall, J., Kent, J., Cronin, T., 1999. Visual adaptations in
crustaceans: spectral sensitivity in diverse habitats. In: Archer,
S.N., Djamgoz, M.B.A., Loew, E.R., Partridge, J.C., Vallerga, S.
(Eds.), Adaptive Mechanisms in the Ecology of Vision. Kluwer
Academic Publishers, pp. 285–327.
Meyer-Rochow, V.B., Liddle, A.R., 1988. Structure and function of
the eyes of two species of opilionid from New Zealand glow-
worm caves: Megalopsalis tumida (Palpatores) and Hendea
myersi cavernicola (Laniatores). Proc. R. Soc. Lond., B 233,
293–319.
Meyer-Rochow, V.B., Gottstein, S., Lindstrom, M., 2001. Is Tro-
glocaris anophthalmus (Crustacea, Decapoda, Atyidae) blind,
eyeless, or both? Memoires de Biospeologie (Int. J. Subterran.
Biol.) 28, 149–156.
Pahlberg, J., Lindstrom, M., Ala-Laurila, P., Fyhrquist-Vanni, N.,
Koskelainen, A., Donner, K., in press. The photoactivation
energy of the visual pigment in two spectrally different popula-
tions of Mysis relicta (Crustacea, Mysida). J. Comp. Physiol. A.
Partridge, J.C., Cummings, M.E., 1999. Adaptation of visual pig-
ments to the aquatic environment. In: Archer, S.N., Djamgoz,
M.B.A., Loew, E.R., Partridge, J.C., Vallerga, S. (Eds.), Adap-
tive Mechanisms in the Ecology of Vision. Kluwer Academic
Publishers, pp. 251–283.
Salemaa, H., Tyystjarvi-Muuronen, K., Aro, E., 1986. Life histories,
distribution and abundance of Mysis mixta and Mysis relicta in
the northern Baltic Sea. Ophelia (Suppl. 4), 239–247.
Tikkanen, M., Oksanen, J., 2002. Late Weichselian and Holocene
shore displacement history of the Baltic Sea in Finland. Fennia
180, 9–20.
Vahatalo, A.V., Wetzel, R.G., Paerl, H.W., 2005. Light absorption
by phytoplankton and chromophoric dissolved organic matter in
the drainage basin and estuary of the Neuse River, North
Carolina (U.S.A.). Freshw. Biol. 50, 477–493.
Vainola, R., 1986. Sibling species and phylogenetic relationships of
Mysis relicta (Crustacea: Mysidacea). Ann. Zool. Fenn. 23,
207–221.
Vainola, R., Vainio, J.K., 1998. Distributions, life cycles and hy-
bridization of two Mysis relicta group species (Crustacea,
Mysida) in the northern Baltic Sea and Lake Baven. Hydro-
biologia 368, 137–148.
Vainola, R., Riddoch, B.J., Ward, R.D., Jones, R.I., 1994. Genetic
zoogeography of the Mysis relicta species group (Crustacea:
Mysidacea) in northern Europe and North America. Can. J. Fish.
Aquat. Sci. 51, 1490–1505.
Yokoyama, S., 2000. Molecular evolution of vertebrate visual pig-
ments. Prog. Retin. Eye Res. 19, 385–419.
A. Audzijonyte et al. / J. Exp. Mar. Biol. Ecol. 325 (2005) 228–239 239
Related Documents