XV International Conference on Atmospheric Electricity, 15-20 June 2014, Norman, Oklahoma, U.S.A. 1 Spectral Characteristics of the Electric Field Related to the Preliminary Breakdown Stage of Cloud-to-Ground Lightning Flashes G. Maslowski 1,* , P. Baranski 2 , G. Karnas 1 1. Rzeszow University of Technology, Rzeszow, Poland 2. Institute of Geophysics, Polish Academy of Sciences, Warsaw, Poland ABSTRACT: The preliminary breakdown (PB) process is usually associated with some intra-cloud lightning discharge activity preceding the stepped leader (SL) phase of single or multiple cloud-to-ground (CG) flash and its first return stroke (RS) or RS and continuing current (CC) sequence, i.e., RS/CC component. On the basis of its electric field recordings in LF or HF range, the PB process can be well studied in the time domain. However, there are only few research works dealing with the power spectrum density (PSD) analysis of such important lightning pre-discharge incidents. Hence, the PSD designation of PB episodes can give some additional information about their frequency characteristics that seems to be very useful and convenient computer procedure for an exact examination of complex pulse structures of different PB stages and following lightning stokes. In this paper we have presented the PSD spectrogram patterns obtained for four selected PB stages preceding different types of CG flashes. These flash events were detected by the Local Lightning Detection Network (LLDN) operated in the region of Warsaw during thunderstorm seasons in 2009 with six measuring stations and in 2013 with two measuring stations only. From the extended E-field records database gathered by the LLDN stations we were able to select only 10 cases of single or multiple CG flashes with distinct PB stage followed by their first RS or RS/CC component. Besides their overall statistics, the most interesting four examples of PSD spectrograms of the considered PB stage together with following CG strokes were presented in detail. The obtained average value of PB stage parameters are: 2.2±0.5 ms for its duration, 20.5±14.7 ms for the time interval between the PB stage and the following first CG stoke, while the frequency range of the PB train pulses was changing from 3.5±2.0 kHz to 21.6±2.4 kHz, and the absolute value of PB spectral amplitude was 30.5±9.7 dB/Hz. We note that distinct differences in dynamic spectra properties of PB and the first RS or RS/CC flash stroke may be applied for developing more efficient and precise computer discrimination procedures that could be used for the better and more reliable detection of the first RS or RS/CC component of CG flash incidents by a new type of lightning location system. Contact information Grzegorz Maslowski, Rzeszow University of Technology, 35-959 Rzeszow, W. Pola 2, Poland; Email: [email protected]

Welcome message from author
This document is posted to help you gain knowledge. Please leave a comment to let me know what you think about it! Share it to your friends and learn new things together.
Transcript

XV International Conference on Atmospheric Electricity, 15-20 June 2014, Norman, Oklahoma, U.S.A.
1
Spectral Characteristics of the Electric Field Related to the
Preliminary Breakdown Stage of Cloud-to-Ground
Lightning Flashes
G. Maslowski1,*, P. Baranski2
, G. Karnas1
1. Rzeszow University of Technology, Rzeszow, Poland
2. Institute of Geophysics, Polish Academy of Sciences, Warsaw, Poland
ABSTRACT: The preliminary breakdown (PB) process is usually associated with some intra-cloud
lightning discharge activity preceding the stepped leader (SL) phase of single or multiple cloud-to-ground
(CG) flash and its first return stroke (RS) or RS and continuing current (CC) sequence, i.e., RS/CC
component. On the basis of its electric field recordings in LF or HF range, the PB process can be well
studied in the time domain. However, there are only few research works dealing with the power spectrum
density (PSD) analysis of such important lightning pre-discharge incidents. Hence, the PSD designation of
PB episodes can give some additional information about their frequency characteristics that seems to be
very useful and convenient computer procedure for an exact examination of complex pulse structures of
different PB stages and following lightning stokes. In this paper we have presented the PSD spectrogram
patterns obtained for four selected PB stages preceding different types of CG flashes. These flash events
were detected by the Local Lightning Detection Network (LLDN) operated in the region of Warsaw
during thunderstorm seasons in 2009 with six measuring stations and in 2013 with two measuring stations
only. From the extended E-field records database gathered by the LLDN stations we were able to select
only 10 cases of single or multiple CG flashes with distinct PB stage followed by their first RS or RS/CC
component. Besides their overall statistics, the most interesting four examples of PSD spectrograms of the
considered PB stage together with following CG strokes were presented in detail. The obtained average
value of PB stage parameters are: 2.2±0.5 ms for its duration, 20.5±14.7 ms for the time interval between
the PB stage and the following first CG stoke, while the frequency range of the PB train pulses was
changing from 3.5±2.0 kHz to 21.6±2.4 kHz, and the absolute value of PB spectral amplitude was
30.5±9.7 dB/Hz. We note that distinct differences in dynamic spectra properties of PB and the first RS or
RS/CC flash stroke may be applied for developing more efficient and precise computer discrimination
procedures that could be used for the better and more reliable detection of the first RS or RS/CC
component of CG flash incidents by a new type of lightning location system.
Contact information
Grzegorz Maslowski, Rzeszow University of Technology, 35-959 Rzeszow, W. Pola 2, Poland;
Email: [email protected]
XV International Conference on Atmospheric Electricity, 15-20 June 2014, Norman, Oklahoma, U.S.A.
2
INTRODUCTION
Preliminary breakdown, often referred to as initial breakdown, was effectively studied by different
groups of scientists [e. g., Clarence and Malan 1957, Kitagawa and Brook 1960, Beasley et al. 1982,
Gomes et al. 1998, Gomes and Corray 2004, Mäkelä et al. 2008, Nag and Rakov 2009, Baharudin et al.
2012]. Our primary aim of this work was to find and show to what extent the PB stage and following
lightning CG strokes occurring during thunderstorms in Warsaw region can be well represented and
recognized in the frequency domain by designation of their PSD spectrograms. To the best of our
knowledge, this is the first attempt of this kind performed in countries of central Europe. For this purpose
we have used extended electric field recordings database gathered during the field campaign of the Local
Lightning Detection Network (LLDN) set up in Warsaw region in 2009 and its limited measurement
action in 2013. Besides delivering anextended database of E-field recordings with frequency range up to
50 kHz of different CG flash strokes, measurement capability of the LLDN system has also given us a
possibility to evaluate in post-time analysis their thundercloud electric charge sources and locations in the
3D domain. The six measuring stations (A, B, C, D, E and F) of the LLDN were located in Warsaw region
and were equipped with dedicated setups consisting of E-field antennae, triggering circuit, backup
memory and commercial GPS receiver (see Fig. 1). More detailed information on the configuration and
performance features of the LLDN can be found in the papers by Baranski et al. [2011] and Baranski et al.
[2012].
In this paper we have presented in the form of a combined time-frequency-signal power domain four
selected examples of the performed PSD analysis for different CG flash events, when their pronounced PB
stage was followed by first CG lightning stroke incidents. Similar studies were done recently by Baranski
et al. [2007], Maslowski et al. [2011], Karnas et al. [2013] and more currently by Karnas and Maslowski
[2014]. Alike PSD spectrograms, but only in frequency domain and with higher frequency range from 0.2
to 20 MHz were previously reported by Willet et al. [1990].
Our transformation of the particular E-field record to relevant PSD spectrogram form was done with
application of the Short-Time Fourier Transform (STFT) available in a powerful signal processing toolbox
of Matlab. The comprehensive description of used algorithms was given by Oppenheim and Schafer
[1989], and Cohen [1995].
ANALYSIS OF PRELIMINARY BREAKDOWN STAGE PRECEDING DIFFERENT TYPES OF
CG FLASHES AND DISCUSSION OF THE RESULTS
Since June 2009, when the LLDN has started its field measurement action in Warsaw region with full
configuration of six independent stations, only ten E-field records can be selected when the distinct PB
stage and following first CG lightning stroke have been clearly distinguished. Six of such cases were
collected during the field campaign in Warsaw region in 2009. The rest were recognized from limited
number of the LLDN stations used for operation in the years from 2010 to 2013 and therefore only those
records from the station E were taken into final considerations.
Among 10 cases of purely detected PB stages, five were associated with the following first negative
RS of four multiple (i.e., three discrete and one hybrid) and one single CG flash, two were preceding
negative RS/CC component of one multiple and one single CG flash, the next two were involved in

XV International Conference on Atmospheric Electricity, 15-20 June 2014, Norman, Oklahoma, U.S.A.
3
subsequent initiation of three bipolar CG flashes (i.e., a single negative RS jump combined with following
positive one and that were separated by a few millisecond time span) and only one was connected to
single positive CG stoke.
Some important time, amplitude, frequency and PSD spectrogram parameters were evaluated for such
collection of the PB events and were presented in Tab. 1. It is worth to note that values of the time domain
parameters of the PB episode listed in Tab. 1 (see rows 1-4) are well fitted to their value ranges reported
by other researchers [e.g., Rakov and Uman 2003].
Four selected examples of the PB events occurring during different thunderstorms in Warsaw region
and associated with different types of following CG flashes were chosen for illustration and taken into
consideration to present some their characteristic features and interdependencies. Hence, their relevant
PSD spectrograms have been evaluated and given in Figs. 3-5. The PSD designation was done with
application of the Matlab build-in functions. Taking into account that the sampling frequency of used
ADC unit was 50 kHz, the obtained PSD analysis was limited up to 25 kHz according to the Nyquist
criteria. A 128-point time window with 120-point overlap was set to the STFT procedure. An additional
interpolation was applied to get smoother PSD plots.
In Fig. 2 we have shown the exemplary PB stage that was followed by one RS and three RS/CC
components of multiple CG flash detected by the LLDN during thunderstorm approaching to Warsaw on
30 June, 2009. Moreover, we can notice that some characteristic M changes and their E-field variations
are superimposed on the particular CC stage recordings. This case and other PSD spectra related to
different types of multiple CG flashes detected by the LLDN in Warsaw region were also reported by
Maslowski et al. [2011].
The dominant negative polarity of PB pulses preceding the first also negative RS change of CG flash
was the most frequent case recorded by us and reported by other researchers [e. g., Rakov and Uman
2003]. For the case presented in Fig. 2, the time interval between PB stage and 1RS was 17.8 ms and was
close to the geometric mean value for all of the considered cases (see Tab. 1). The PSD stripe for this PB
incident was scattered between several frequencies. The most intense E-field emission part of the PB pulse
train was concentrated about three frequencies, i.e,. 8 kHz, 14 kHz and 21 kHz. From direct time and
signal power relation between E-field records of this PB stage and the corresponding shape of the obtained
PSD stripe we can see that the evaluated bottom spectral frequency of PB pulse train corresponds well to
the average frequency of PB pulses observed in their E-field recordings (see panel c and d in Fig. 2).
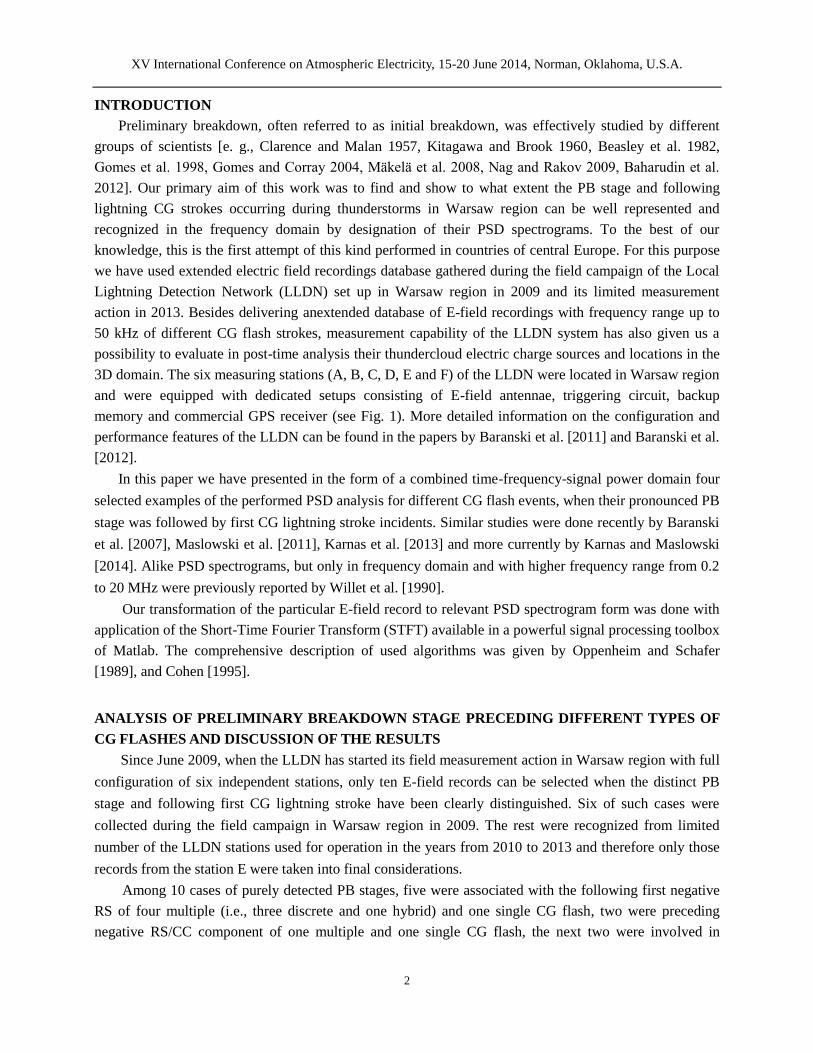
The next PB stage incident we have analyzed was also preceding multiple CG flash (see Fig. 3). But
this time such a flash was composed from two small RS followed immediately by large CC change. All
these flash components were detected successfully by the LLDN in Warsaw during thunderstorm observed
on 25 June 2009. The BIL (Breakdown-Intermediate-Leader) model of initial breakdown [Clarence and
Malan 1957] can be fitted to this case very well. It was the only case where the amplitude of the PB stage
was greater than for 1RS/CC jump (see panel c in Fig. 3), which was clearly reflected by strong/intense
PSD stripe for such PB event in comparison to those indicated by following RS/CC stroke changes.
An unique positive single CG flash event with preceding PB stage and another type of complex and
strong intra-cloud (IC) activity is presented in Fig. 4. We have noted that the time characteristic of this PB
stage were quite different from the ones occurring in two previously analyzed cases. The time interval

XV International Conference on Atmospheric Electricity, 15-20 June 2014, Norman, Oklahoma, U.S.A.
4
between PB and 1RS was only 5.5 ms, that is the minimum value in our database. On the other hand, the
time duration of this PB stage was 1.4 ms and was the greatest one in our observations. The considered PB
stage has displayed the clear BIL structure with all B, I and L changes that were distinctly pronounced and
recognized in our E-field recordings (see panel d in Fig. 4).
On the left side of our extended in time E-field record shown in panel (d) in Fig. 4 some additional
intense and powerful IC discharges activity can be noticed. This activity has been manifested by the single
and strong bipolar pulse occurring at 10:17:48.0260 UT and preceded by another pulse train similar to that
recognized as the PB stage before positive RS incident. It is very likely that such IC activity represented
by our E-field recordings may be an evidence for occurrence in Poland of a rare compact intra-cloud
discharge (CID) event recently studied by Nag et al. [2010]. We have noted that the CID lightning event
was also followed by a kind of pre-discharge pulse train similar to the PB one and its phase B, and
occurring later before a positive CG flash with single stroke.
Much higher signal power indicated by the PSD stripe/line for positive RS incident (see panel c in
Fig. 4) in comparison to that obtained for negative RS flash component (see panel c in Fig. 2) is due to the
meaningful difference of the horizontal distance, i. e., 25.6 km against 4.3 km from the measuring station
E for particular evaluated charge source of the each considered RS event.
The fourth selected case of the PB stage was preceding three so-called complex lightning discharge
events (CLDEs) not frequently observed in Poland and previously described by Baranski and Bodzak
[2006]. This time each of the recorded CLDE consisted of a distinct negative and positive jump of two
E-field changes of bipolar CG flash, that were separated by the time interval of the order of 1 ms. Such
polarity change of two lightning strokes could mean that the first RS transferred to ground a large negative
charge coming from the extended negative charge layer of a thundercloud while the second positive one,
with smaller E-field amplitude than the first RS, would be an evidence of subsequent positive charge
transfer to ground from a small and lower positive charge center (LPCC) imbedded in negative charge
layer. This suggestion/scenario was partly confirmed by the PERUN lightning detection system routinely
operated in Poland. According to the PERUN detection, all three negative RS components of three bipolar
flashes shown in panel (b) in Fig. 5 have been distinguished as three following CG strokes of one multiple
negative CG flash located at a distance range of 46 km, 47 km and 45 km from our measuring station E,
respectively, and having the estimated peak current -12.6 kA, -23 kA and -18.7 kA, respectively. However,
none of positive RS changes of the considered three CLDEs were properly identified by the PERUN
system.
The diffuse structure of the PSD stripes corresponding to three bipolar CG flashes presented in panels
(a) and (c) in Fig. 5 together with their low level of signal power within the frequency range from 5 kHz to
20 kHz was caused by the great distance of these flashes, i.e., of the order of 50 km range from our
recording station E in comparison to the other three cases shown in Figs. 2-4.
CONCLUSIONS
Several cases of E-field records representing different types of CG lightning flashes activity in
Warsaw region were selected from the LLDN database for the examination of possible occurrence of their
preceding pre-discharge preliminary breakdown process and evaluation of the corresponding PSD

XV International Conference on Atmospheric Electricity, 15-20 June 2014, Norman, Oklahoma, U.S.A.
5
spectrogram parameters. These chosen cases including single, multiple or complex/bipolar CG discharges
with RS or RS/CC signatures of different polarities were presented together with their preceding PB stages.
The selected exemplary E-field recordings were transformed to combined time-frequency domain with
application of the Short-Time Fourier Transform. As a result, the corresponding PSD spectrograms were
obtained for each pronounced lightning incidents noted during the considered examples. Some their
characteristic parameters were listed on the basis of data gathered during the field campaign of LLDN in
Warsaw region in 2009 and limited measurement action in 2013. It is worth noting that distinct spectral
stripes of PB stage were significantly different from the following ones and associated with first or
subsequent lightning stokes of CG flashes. Usually, there were no low frequency components (up to 5
kHz) for the PB spectrogram stripe/line compared to the ones representing RS or RS/CC flash components.
On the other hand, the PSD spectrogram stripe/line of PB stage preceding positive RS was much more
intense and steady, and had no distinct minimum frequency, as compared to the one appearing before
negative RS or RS/CC components of CG flash. In other recorded cases of negative RSs the characteristic
spectrogram stripes/lines of their preceding PB stages were scattered in the frequency domain. Our
analysis has also shown that the signal amplitude ratio between the PB stage and the first RS was strongly
dependent on the distance range of evaluated lightning strike point from the measuring station. For greater
distances this ratio was lower because the breakdown pulses were also attenuated. However, in one
recorded case (see Fig. 3) the E-field amplitude of PB stage is higher than this one for following 1RS/CC
flash component. It could be a result of much closer space location of thundercloud PB electric charge
sources related to measuring stations of the LLDN than the one obtained for charge source of the
considered 1RS/CC flash component. As now, any determination of space locations of electric charge
sources involved in a thundercloud PB process is beyond of present measurement ability of our LLDN set
up in Warsaw region.
The PSD spectrogram designation is a good alternative for the time domain analysis of different
short-lasted pre-discharge and lightning stroke incidents. There is a great potential in using of the
FFT-based methods for computer processing of different E-field signatures related to diverse patterns of
CG and IC lightning discharge activity inside a thundercloud. However, further investigations of different
kind of fast pre-discharge CG flash events in the VLF-LF-HF ranges are strongly needed in order to
elaborate and unify some computer procedures useful for obtaining important parameters of PB stage from
its PSD spectrograms. In this way we could obtain the relevant computer discrimination criteria for
reliable detection of different kinds of lightning strokes and their preceding PB stages.
ACKNOWLEDGMENTS
This work was partially supported by grand No. COST/204/2006 from Polish Ministry of Science and
High Education for setting up the LLDN system in Warsaw region.
REFERENCES
Baharudin Z. A., Ahmad N. A., Fernando M., Cooray V., Mäkelä J. S., 2012, Comparative study on preliminary
breakdown pulse trains observed in Johor, Malaysia and Florida, USA, Atmos. Res., 117, 111-121.

XV International Conference on Atmospheric Electricity, 15-20 June 2014, Norman, Oklahoma, U.S.A.
6
Baranski P. and P. Bodzak, 2006, Some observations of bipolar flashes during summer thunderstorms near Warsaw,
Acta Geophysica, 54, 71-89. doi : 10.2478/s11600-006-0007-x.
Baranski P., Michnowski S., Maslowski G. and W. Gajda, 2007, Signatures of electric field changes associated with
the contnuing current stage of cloud-to-ground flashes, Proceedings of the 13th
International Conference on
Atmosferic Electricity, August 13-18, Beijing, China, vol. I, 489-492.
Baranski P., Loboda M., Wiszniowski J. and W. Gajda, 2011, Characteristics of multiple cloud-to-ground (CG)
lightning flashes recorded by Local Lightning Detection Network (LLDN) in the Warsaw region, in
Proceedings of the XIV International Conference on Atmospheric Electricity, Rio de Janeiro, Brazil.
Baranski P., Loboda M., Wiszniowski J., Morawski M., 2012, Evaluation of multiple ground flash charge structure
from electric field measurements using the local lightning detection network in the region of Warsaw, Atmos.
Res., 117, 99-110. doi:10.1016/j.atmosres.2011.10.011.
Beasley W., Uman M. A., Rustan P. L., 1982, Electric fields preceding cloud-to-ground lightning flashes, J. Geophys.
Res., 87 (C7), 4883–4902.
Clarence N. D., Malan D. J., 1957, Preliminary discharge processes in lightning flashes to ground, Q. J. R. Meteorol.
Soc., 83, 161–172.
Cohen L., 1995, Time-Frequency Analysis, Englewood Cliffs, NJ: Prentice-Hall.
Gomes C., Cooray V., 2004, Radiation field pulses associated with the initiation of positive cloud-to-ground
lightning flashes, J. Atmos. Sol. Terr. Phys., 66, 1047–1055.
Gomes C., Cooray V., Jayaratne C., 1998, Comparison of preliminary breakdown pulses observed in Sweden and Sri
Lanka, J. Atmos. Sol. Terr. Phys., 60, 975–979.
Karnas G., Maslowski G., Baranski P., Berlinski J., Pankanin G., 2013, Instrumentation and data analysis process at
the new lightning research station in Poland, Przeglad Elektrotechniczny, vol.6, 217-220.
Karnas G., Maslowski G., 2014, Preliminary measurements and analysis of lightning electric field recorded at the
observation station in the south-east part of Poland, Przeglad Elektrotechniczny, (in press).
Kitagawa N., Brook M., 1960, A comparison of intracloud and cloud-to-ground lightning discharges. J. Geophys.
Res., 65, 1189–1201.
Mäkelä J. S., Porjo N., Mäkelä A., Tuomi T., Cooray V., 2008, Properties of preliminary breakdown process in
Scandinavian lightning, J. Atmos. Sol. Terr. Phys., 70, 2041–2052.
Maslowski G., Baranski P., Karnas G., 2011, Electric field frequency spectra of multiple cloud-to-ground lightning
flashes recorded in the Warsaw region by local lightning detection network, in Proceedings of the XIV
International Conference on Atmospheric Electricity, Rio de Janeiro, Brazil.
Nag A., Rakov V. A., 2009, Electric field pulse trains occurring prior to the first stroke in negative cloud-to-ground
lightning, IEEE Trans. Electromagn. Compat., 51 (1), 147–150.
Nag A., Rakov V. A., Tsalikis D., Cramer J. A., 2010, On phenomenology of compact intracloud lightning discharges,
J. Geophys. Res., 115, D14115. doi:10.1029/2009JD012957.
Oppenheim, A. V., and R. W. Schafer, 1989, Discrete-Time Signal Processing, Prentice-Hall, Englewood Cliffs, NJ,
pp.713-718.
Rakov V. A., Uman M. A., 2003, Lightning: Physics and Effects, Cambridge Univ. Press, New York.
Willet J. C., Bailey J. C., Leteinturier C., Krider E. P., 1990, Lightning electromagnetic radiation field spectra in the
interval from 0.2 to 20 MHz, J. Geophys. Res., 95, 20 367-87.

XV International Conference on Atmospheric Electricity, 15-20 June 2014, Norman, Oklahoma, U.S.A.
7
Figure 1. One of six E-field antennae devices used by the LLDN in Warsaw region (panel a) and general view of
measuring station E located on the roof of Space Research Centre building (panel b).
Table 1. The value ranges of time, amplitude, frequency and PSD spectrogram parameters of recorded ten PB stage
events. The values of PB parameters given in rows 1-4 are obtained from E-field signatures of PB stages. The rest
rows (5-10) are indicated these values obtained from the relevant PSD analysis of PB stages.
Parameter Minimum
value
Maximum
value
Arithmetic
mean
Geometric
mean
Standard
deviation
PB duration from E-field, ms 0.3 2.5 1.3 1.0 ±0.8
PB amplitude, V/m 2 42.7 11.7 7.8 ±12.2
PB to 1RS amplitude ratio, % 5.5 170 47.9 23.2 ±61.1
Time span from PB to 1RS, ms 5.5 45.9 20.5 15.6 ±14.7
PB duration from PSD, ms 1.4 2.6 2.2 2.1 ±0.5
PB amplitude, dB/Hz -42.0 -16.3 -30.5 -29.0 ±9.7
PB min. frequency, kHz 0.7 7.3 3.5 2.8 ±2.0
PB max. frequency, kHz 15.1 23.2 21.6 21.5 ±2.4
1RS amplitude, dB/Hz -39.2 -4.4 -24.3 -20.6 ±12.1
1RS max. frequency, kHz 9.5 23.1 20.8 20.2 ±4.0

XV International Conference on Atmospheric Electricity, 15-20 June 2014, Norman, Oklahoma, U.S.A.
8
Figure 2. The PSD spectrogram of multiple negative cloud-to-ground flash with four strokes recorded in Warsaw
region on 30 June 2009. Panel (a) presents the spectrogram view of PSD for the time period from 20:41:30.6 to
20:41:30.8 UT and panel (b) the corresponding part of the E-field record from station E of the LLDN. In panel (c)
the 30 ms time window/zoom of PSD spectrogram taken from panel (a) is shown, which is obeying only the PB
stage with the first RS. Panel (d) gives the corresponding simultaneous part of E-field record that represented these
two lightning flash incidents from panel (c).
XV International Conference on Atmospheric Electricity, 15-20 June 2014, Norman, Oklahoma, U.S.A.
9
Figure 3. The PSD spectrogram of PB stage preceding multiple negative CG flash with two RS/CC strokes recorded
in Warsaw region on 25 June 2009. Panel (a) presents the spectrogram view of PSD for the time period from
17:15:02.63 to 17:15:02.75 UT and panel (b) the corresponding part of the E-field record from station E of the
LLDN. In panel (c) the 70 ms time window/zoom of PSD spectrogram cut off from panel (a) is shown, which is
obeying only the PB stage with following two RS/CC flash incidents. Panel (d) gives the corresponding
simultaneous part of E-field record that represented the same three lightning events from panel (c).

XV International Conference on Atmospheric Electricity, 15-20 June 2014, Norman, Oklahoma, U.S.A.
10
Figure 4. The case of PB activity preceding the positive return stroke in single CG flash. The obtained PSD
spectrogram of these two lightning processes is given for the time span of 250 ms in panel (a). The corresponding
simultaneous E-field changes shown in panel (b) were recorded by the station E, i.e., one station of the LLDN system
in Warsaw region on 10 July 2009 from 10:17:48.00 to 10:17:48.25 UT. The same lightning incidents as those from
panel (a) and (b) are presented in panel (c) and (d), respectively, but with the relevant time scale extension through
the selected 30 ms time window depicting in more details some pronounced and complex intra-cloud lightning
activity before the occurrence of positive RS.

XV International Conference on Atmospheric Electricity, 15-20 June 2014, Norman, Oklahoma, U.S.A.
11
Figure 5. The PSD spectrogram of PB stage preceding three complex lightning discharge events (CLDEs), each
consisting of single negative and positive RS component of bipolar CG flash that were separated by the time interval
of the order of 1 ms and were recorded in Warsaw region on 10 October 2013. Panel (a) presents the spectrogram
view of PSD for the time period from 13:51:42.680 to 13:51:42.830 UT and panel (b) the corresponding part of the
E-field record from station E of the LLDN. In panel (c) the 40 ms time window/zoom of PSD spectrogram cut off
from panel (a) is shown, it is obeying only the PB stage with the following first CLDE. Panel (d) gives the
corresponding simultaneous part of E-field record that represented the same time window as displayed in panel (c).
Related Documents


