ASQ Automotive Division Webinar Series SPC Some common questions May 27 8PM EDT Presenter: John Katona

Welcome message from author
This document is posted to help you gain knowledge. Please leave a comment to let me know what you think about it! Share it to your friends and learn new things together.
Transcript

ASQ Automotive Division Webinar Series
SPC Some common questionsMay 27 8PM EDT
Presenter: John Katona

ASQ Automotive Division Webinar Series
SPC Some common questionsMay 27 8PM EDT
Agenda:
5 Min Introduction5 Min Introduction70 Min presentation 10 Min Q&A

ASQ Automotive Division
ASQ Automotive Division is part of the American Society for
Quality (ASQ), the world’s leading authority on quality issues
since 1946.
ASQ Automotive Division has more than 3400 members
globally. Members include professionals from almost every globally. Members include professionals from almost every
discipline in the vehicle manufacturing and supplier business in
the automotive, heavy-truck, off-highway, agricultural, industrial
and construction equipment industries.

ASQ Automotive Division
VISION
• To be the worldwide leader on quality issues related to the automotive industry.
MISSION
• To provide member value by identifying, communicating, and • To provide member value by identifying, communicating, and promoting quality knowledge, professional development and networking opportunities.

ASQ Automotive Division
OBJECTIVES:
• Be a global provider of automotive quality knowledge and learning opportunities for advancing individual and organizational performance excellence.
• Engage, grow and retain members through new and improved communities and cutting-edge technologies.
• Develop and sustain a strong Council Leadership to support our members.
• Develop and sustain a strong Council Leadership to support our members.

Statistical Process Control
Some Common Questions
John Katona
Page 6
John Katona
Secretary
ASQ Automotive Division

Question 1My process has several sources of
variation:Can I put them all on (1) chart?
Can I put all (12) nests on the same chart
Page 7
Can I put all (12) nests on the same chart or do I need (12) charts?
My mold makes (32) parts in every shot. Can I just grab any (4) parts from a shot
and maintain only a single chart?

Spindle A
Spindle B
Dotplot of Spindle A, Spindle B, Spindle C, Spindle D, Spindle E
Page 8
31.831.230.630.029.428.828.2
Spindle C
Spindle D
Spindle E
Data
Each symbol represents up to 2 observations.
Spindle A
Spindle B
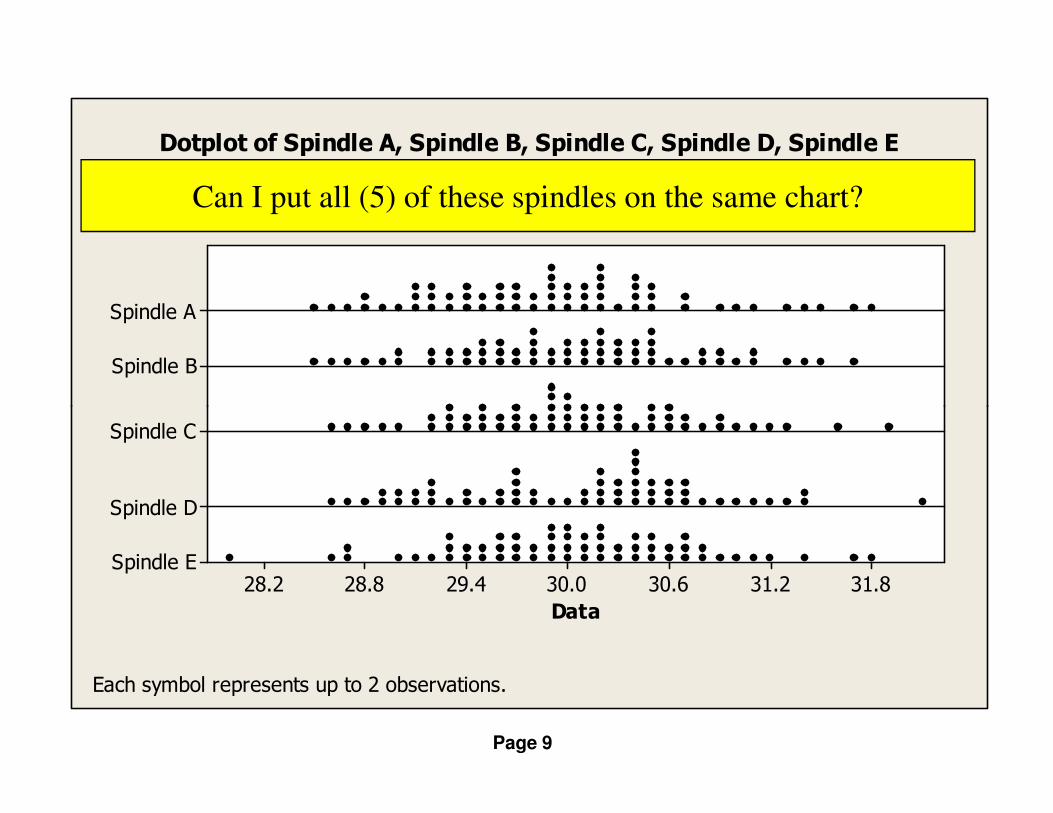
Dotplot of Spindle A, Spindle B, Spindle C, Spindle D, Spindle E
Can I put all (5) of these spindles on the same chart?
Page 9
31.831.230.630.029.428.828.2
Spindle C
Spindle D
Spindle E
Data
Each symbol represents up to 2 observations.
Spindle A
Spindle B
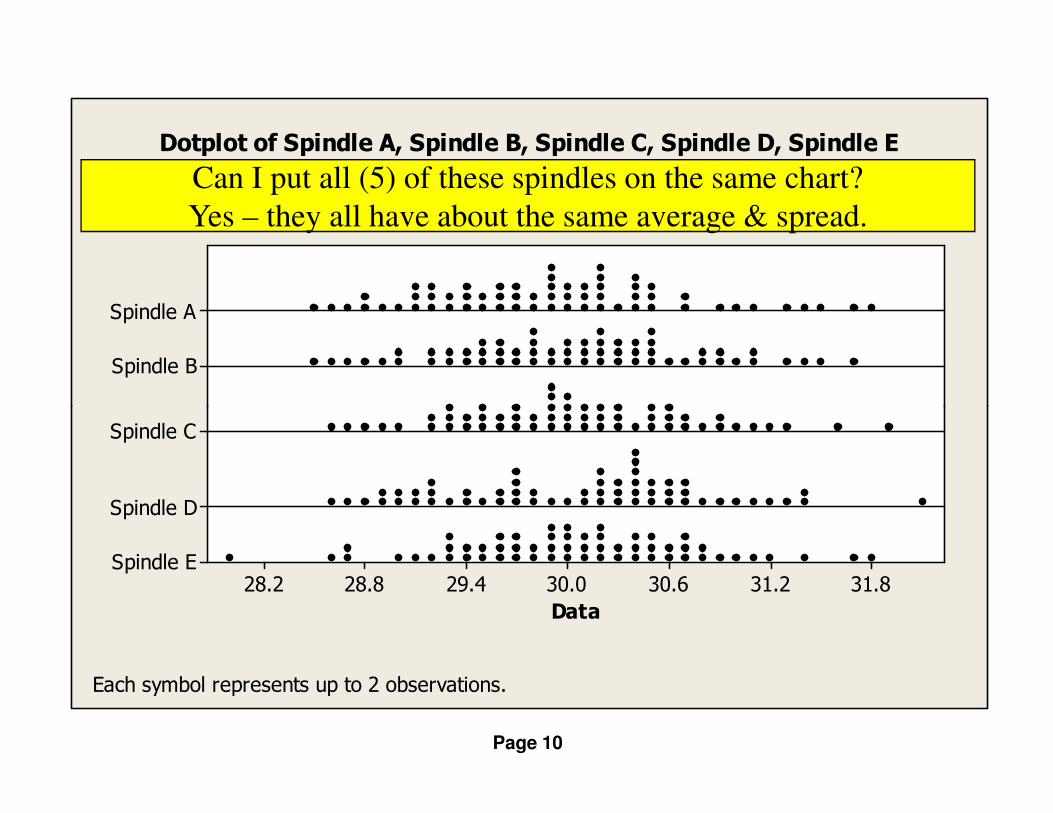
Dotplot of Spindle A, Spindle B, Spindle C, Spindle D, Spindle E
Can I put all (5) of these spindles on the same chart?
Yes – they all have about the same average & spread.
Page 10
31.831.230.630.029.428.828.2
Spindle C
Spindle D
Spindle E
Data
Each symbol represents up to 2 observations.

9181716151413121111
31.0
30.5
30.0
29.5
29.0
Sample
Sample M
ean
__X=30.007
UC L=30.914
LC L=29.101
1
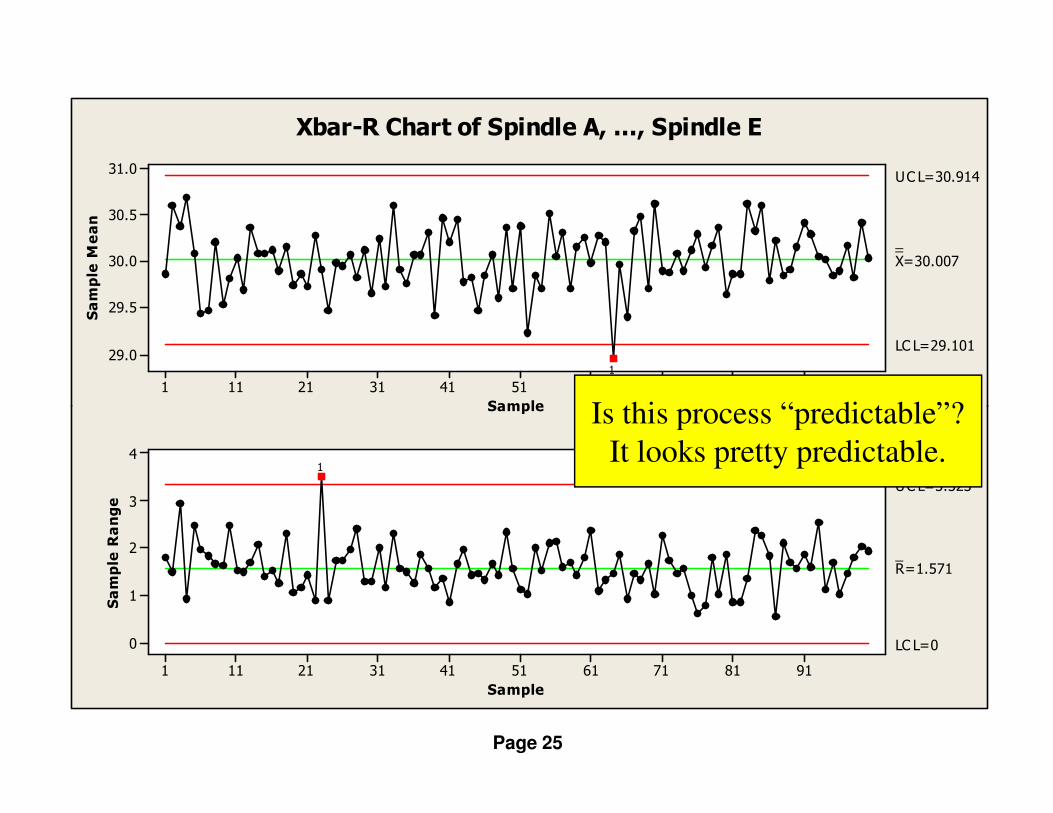
Xbar-R Chart of Spindle A, ..., Spindle E
Each Subgroup contains all (5) Spindles –
Data is from (5) identical distributions, all normal with mean 30 and standard deviation 0.7
Page 11
Sample
9181716151413121111
4
3
2
1
0
Sample
Sample Range
_R=1.571
UC L=3.323
LC L=0
1
9181716151413121111
31.0
30.5
30.0
29.5
29.0
Sample
Sample M
ean
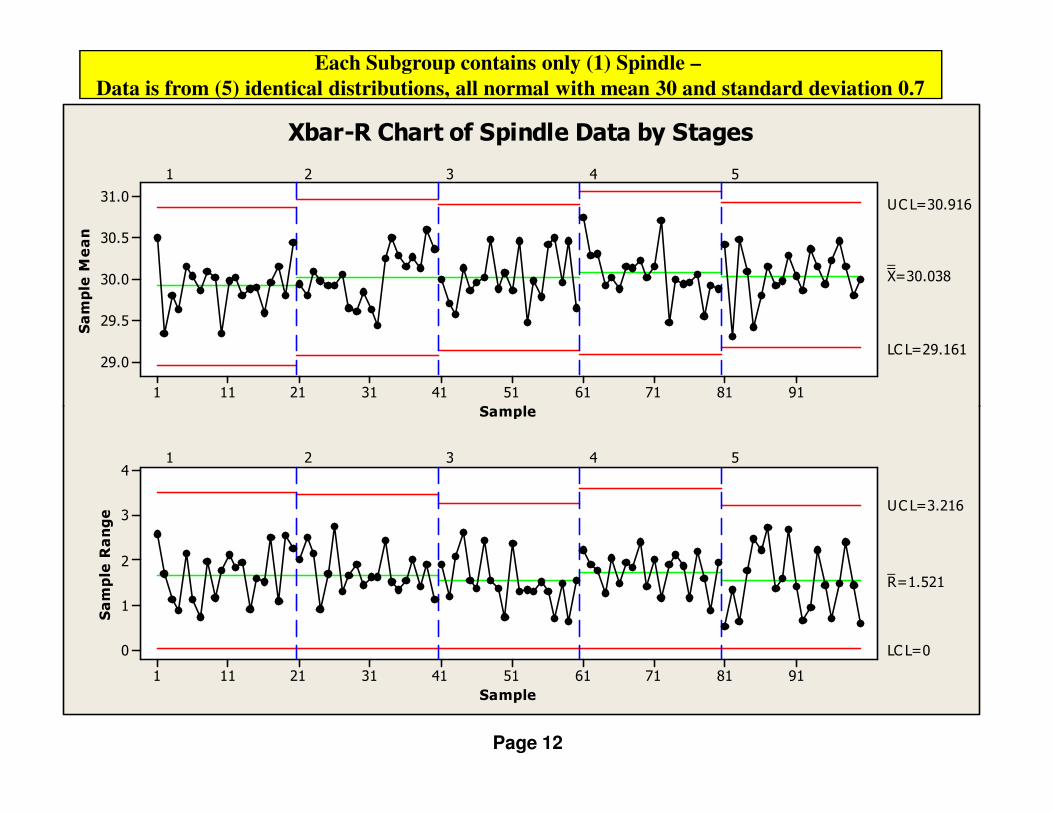
__X=30.038
UC L=30.916
LC L=29.161
1 2 3 4 5
Xbar-R Chart of Spindle Data by Stages
Each Subgroup contains only (1) Spindle –
Data is from (5) identical distributions, all normal with mean 30 and standard deviation 0.7
Page 12
Sample
9181716151413121111
4
3
2
1
0
Sample
Sample Range
_R=1.521
UC L=3.216
LC L=0
1 2 3 4 5

Fixture 1
Fixture 2
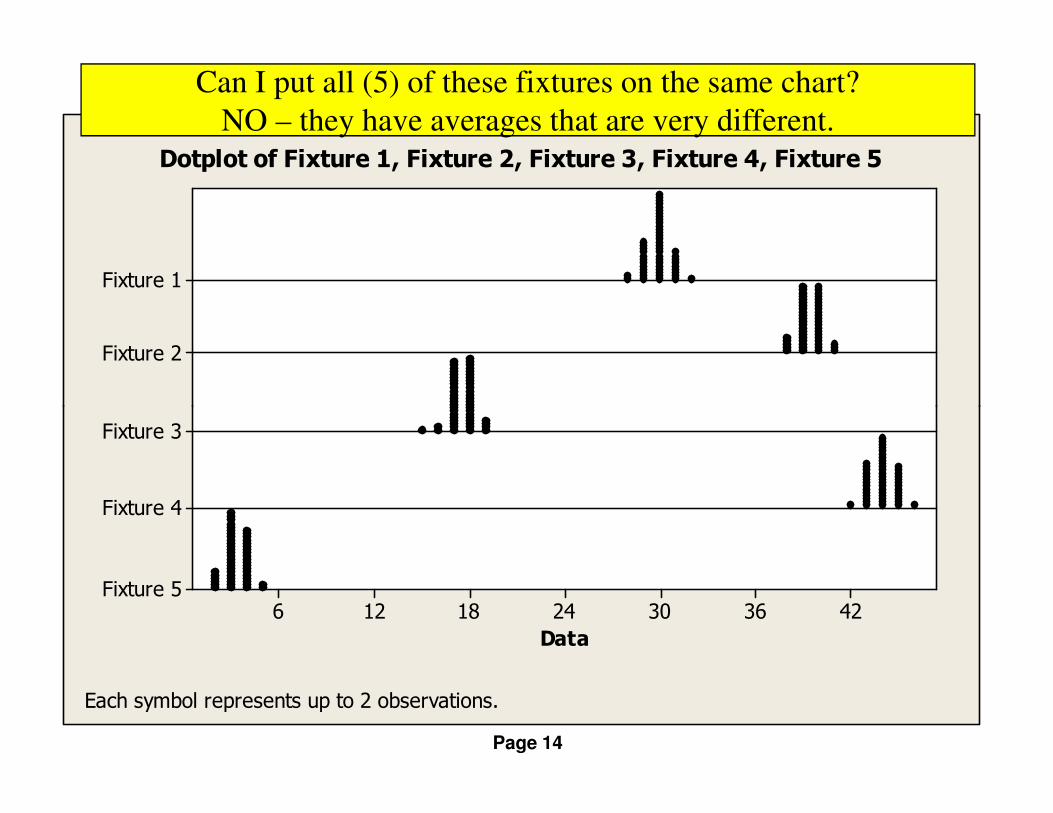
Dotplot of Fixture 1, Fixture 2, Fixture 3, Fixture 4, Fixture 5
Can I put all (5) of these fixtures on the same chart?
Page 13
4236302418126
Fixture 3
Fixture 4
Fixture 5
Data
Each symbol represents up to 2 observations.
Fixture 1
Fixture 2
Dotplot of Fixture 1, Fixture 2, Fixture 3, Fixture 4, Fixture 5
Can I put all (5) of these fixtures on the same chart?
NO – they have averages that are very different.
Page 14
4236302418126
Fixture 3
Fixture 4
Fixture 5
Data
Each symbol represents up to 2 observations.
9181716151413121111
48
36
24
12
0
Sample
Sample M
ean
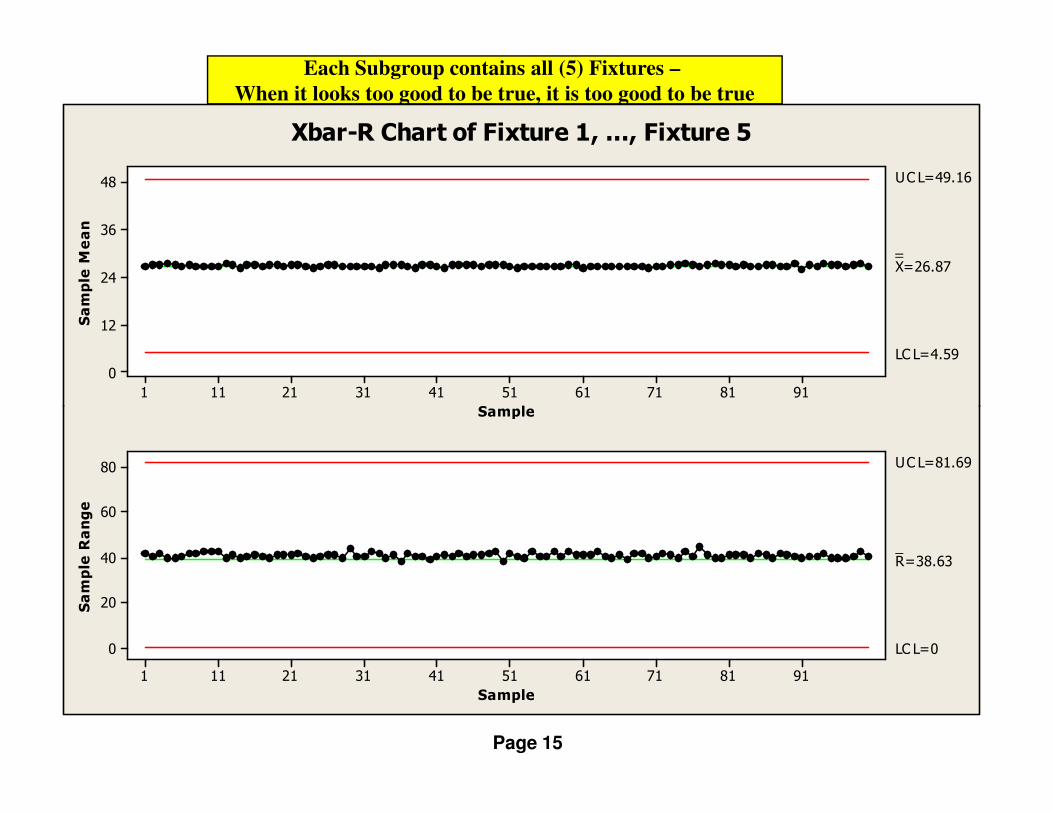
__X=26.87
UC L=49.16
LC L=4.59
Xbar-R Chart of Fixture 1, ..., Fixture 5
Each Subgroup contains all (5) Fixtures –
When it looks too good to be true, it is too good to be true
Page 15
Sample
9181716151413121111
80
60
40
20
0
Sample
Sample Range
_R=38.63
UC L=81.69
LC L=0

9181716151413121111
48
36
24
12
0
Sample
Sample M
ean
__X=26.87
UC L=49.16
LC L=4.59
Xbar-R Chart of Fixture 1, ..., Fixture 5
Each Subgroup contains all (5) Fixtures –
When it looks too good to be true, it is too good to be true
Page 16
Sample
9181716151413121111
80
60
40
20
0
Sample
Sample Range
_R=38.63
UC L=81.69
LC L=04236302418126
Fixture 1
Fixture 2
Fixture 3
Fixture 4
Fixture 5
Data
Dotplot of Fixture 1, Fixture 2, Fixture 3, Fixture 4, Fixture 5
Each symbol represents up to 2 observations.
9181716151413121111
40
30
20
10
0
Sample
Sample M
ean
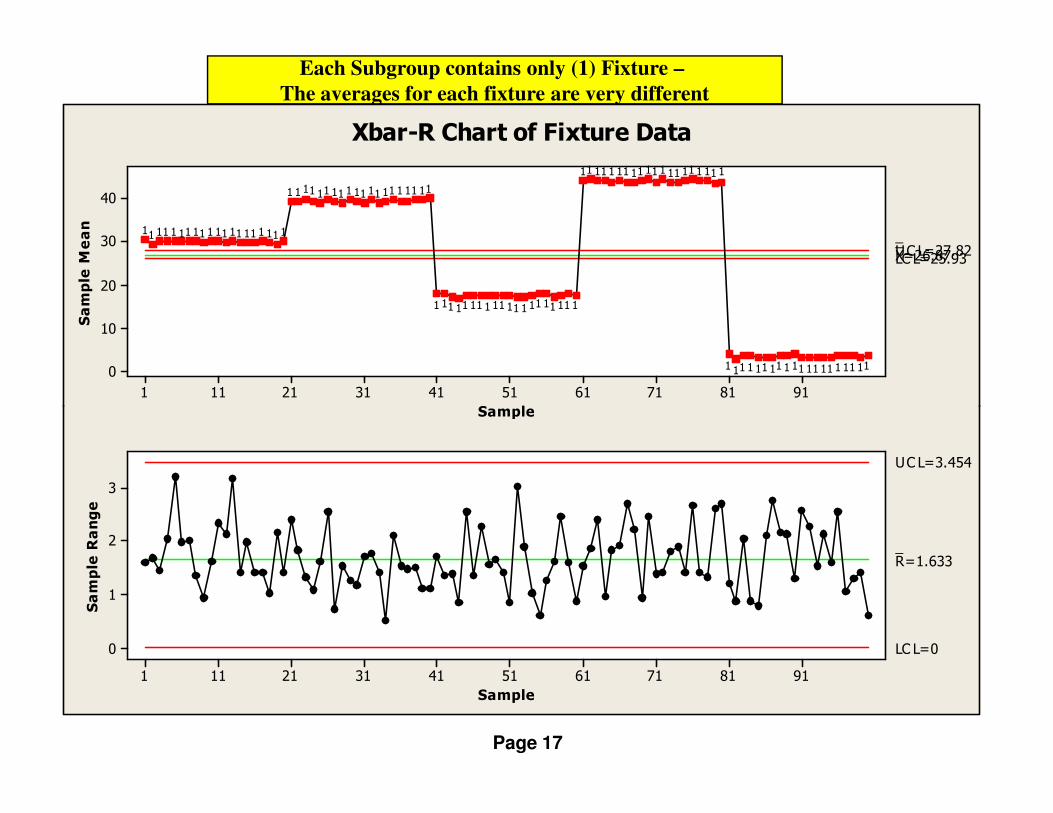
__X=26.87UC L=27.82LC L=25.93
11111111111111111111
11111111111111111111
11111111111111111111
11111111111111111111
11111111111111111111
Xbar-R Chart of Fixture Data
Each Subgroup contains only (1) Fixture –
The averages for each fixture are very different
Page 17
Sample
9181716151413121111
3
2
1
0
Sample
Sample Range
_R=1.633
UC L=3.454
LC L=0

9181716151413121111
40
30
20
10
0
Sample
Sample M
ean
__X=3.38UC L=4.29LC L=2.47
1 2 3 4 5
Xbar-R Chart of Fixture Data by Stages
Each Subgroup contains only (1) Fixture –
The averages for each fixture are very different
Page 18
Sample
9181716151413121111
4
3
2
1
0
Sample
Sample Range
_R=1.580
UC L=3.341
LC L=0
1 2 3 4 5

Question 1My process has several sources of variation:
Can I put them all on (1) chart?
Can I put all (12) nests on the same chart or do I need (12) charts?
Do all (12) nests have the same average & spread?
My mold makes (32) parts in every shot. Can I just grab any (4)
Page 19
My mold makes (32) parts in every shot. Can I just grab any (4) parts from a shot and maintain only a single chart?
Do all (32) cavities have the same average & spread?
Answer:If the averages and spreads are the same, then yes.
Otherwise NO.

I have an engineering specification.Why do I need statistical control
limits?
Question 2
Page 20
limits?
Can’t I just put the spec or 70% of the spec on the control chart?
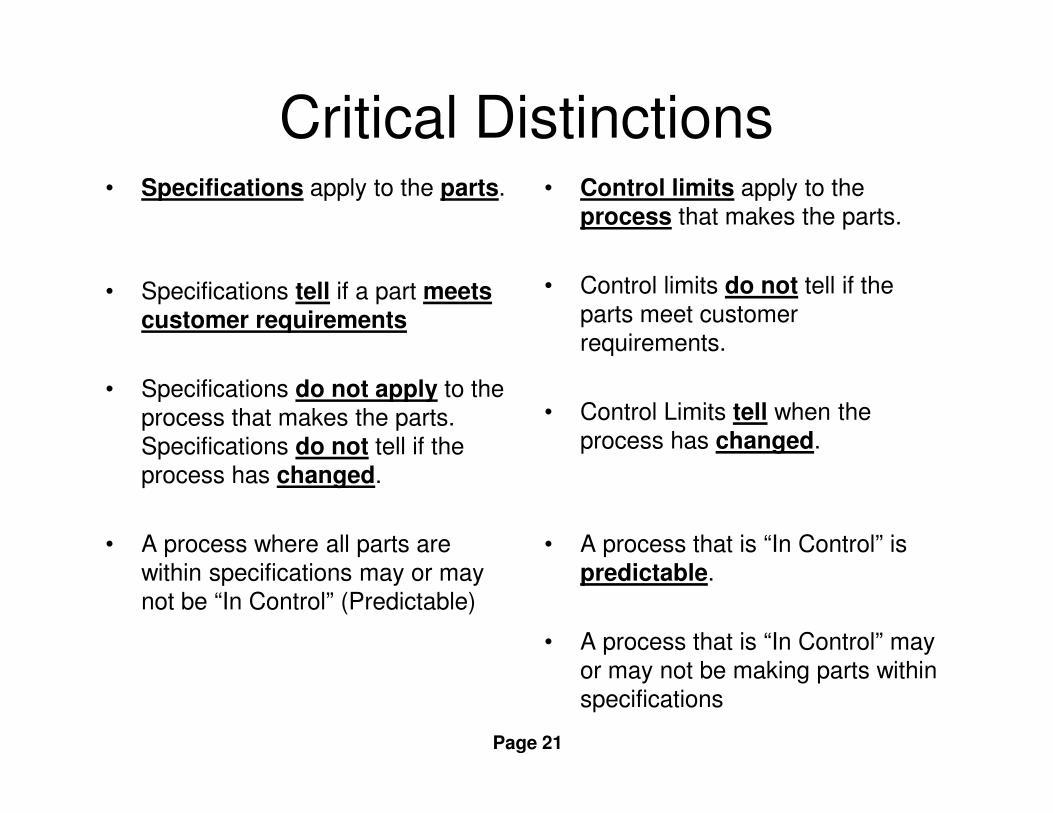
Critical Distinctions• Specifications apply to the parts.
• Specifications tell if a part meets customer requirements
• Specifications do not apply to the
process that makes the parts.
• Control limits apply to the
process that makes the parts.
• Control limits do not tell if the
parts meet customer
requirements.
• Control Limits tell when the
Page 21
process that makes the parts.
Specifications do not tell if the
process has changed.
• A process where all parts are
within specifications may or may
not be “In Control” (Predictable)
• Control Limits tell when the
process has changed.
• A process that is “In Control” is
predictable.
• A process that is “In Control” may
or may not be making parts within
specifications

LSL USL
LSL 26
Target *
USL 34
Sample Mean 30.0075
Sample N 500
StDev (Within) 0.708499
StDev (O v erall) 0.688751
Process Data
C p 1.88
C PL 1.89
C PU 1.88
C pk 1.88
O v erall C apability
Potential (Within) C apability
Within
Overall
Process Capability of Spindle Data
Is this process “In control” or “predictable”?
Page 22
33.632.431.230.028.827.626.4
Pp 1.94
PPL 1.94
PPU 1.93
Ppk 1.93
C pm *
PPM < LSL 0.00
PPM > USL 0.00
PPM Total 0.00
O bserv ed Performance
PPM < LSL 0.01
PPM > USL 0.01
PPM Total 0.02
Exp. Within Performance
PPM < LSL 0.00
PPM > USL 0.00
PPM Total 0.01
Exp. O v erall Performance

LSL USL
LSL 26
Target *
USL 34
Sample Mean 30.0075
Sample N 500
StDev (Within) 0.708499
StDev (O v erall) 0.688751
Process Data
C p 1.88
C PL 1.89
C PU 1.88
C pk 1.88
Pp 1.94
O v erall C apability
Potential (Within) C apability
Within
Overall
Process Capability of Spindle Data
Is this process “In control” or “predictable”?
The Specifications and distribution shape don’t reveal
anything about process stability or predictability
from one time period to the next.
Is this process
Changing from (1)
Page 23
33.632.431.230.028.827.626.4
Pp 1.94
PPL 1.94
PPU 1.93
Ppk 1.93
C pm *
PPM < LSL 0.00
PPM > USL 0.00
PPM Total 0.00
O bserv ed Performance
PPM < LSL 0.01
PPM > USL 0.01
PPM Total 0.02
Exp. Within Performance
PPM < LSL 0.00
PPM > USL 0.00
PPM Total 0.01
Exp. O v erall Performance
Changing from (1)
time period to the next?
Without the
control chart you
don’t know.
9181716151413121111
31.0
30.5
30.0
29.5
29.0
Sample
Sample M
ean
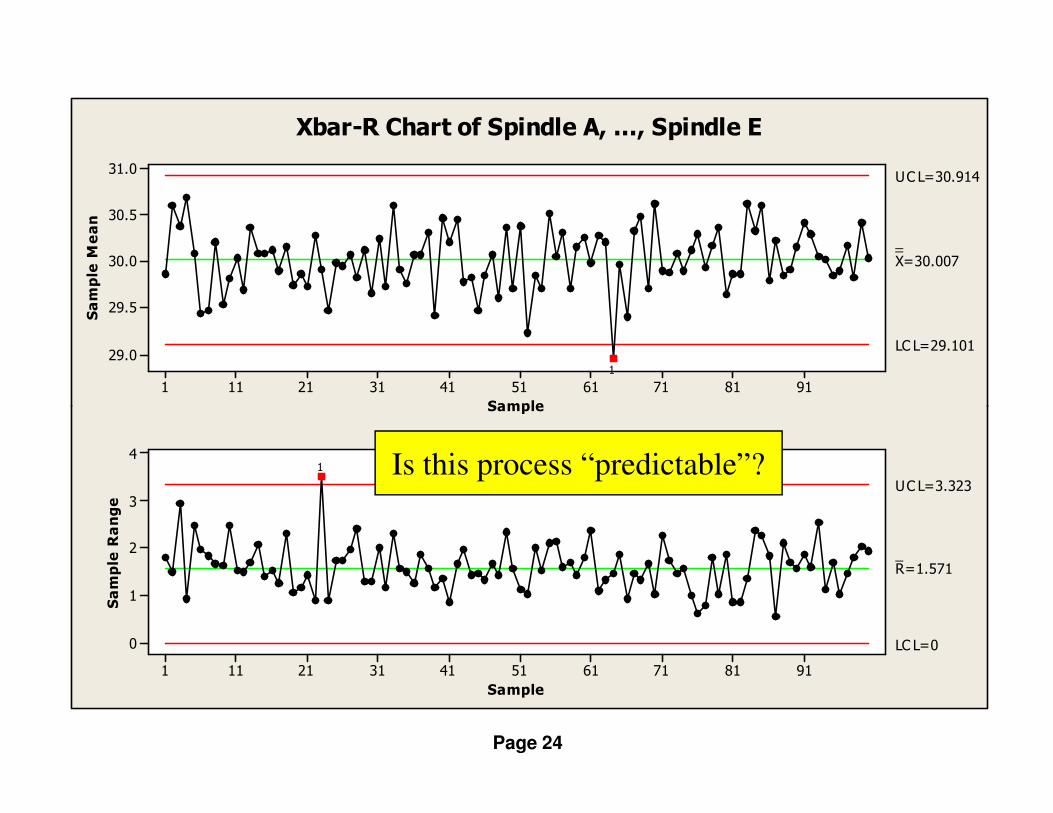
__X=30.007
UC L=30.914
LC L=29.101
1
Xbar-R Chart of Spindle A, ..., Spindle E
Page 24
Sample
9181716151413121111
4
3
2
1
0
Sample
Sample Range
_R=1.571
UC L=3.323
LC L=0
1 Is this process “predictable”?
9181716151413121111
31.0
30.5
30.0
29.5
29.0
Sample
Sample M
ean
__X=30.007
UC L=30.914
LC L=29.101
1
Xbar-R Chart of Spindle A, ..., Spindle E
Is this process “predictable”?
Page 25
Sample
9181716151413121111
4
3
2
1
0
Sample
Sample Range
_R=1.571
UC L=3.323
LC L=0
1
Is this process “predictable”?
It looks pretty predictable.
9181716151413121111
31.0
30.5
30.0
29.5
29.0
Sample
Sample M
ean
__X=30.007
UC L=30.914
LC L=29.101
1
Xbar-R Chart of Spindle A, ..., Spindle E
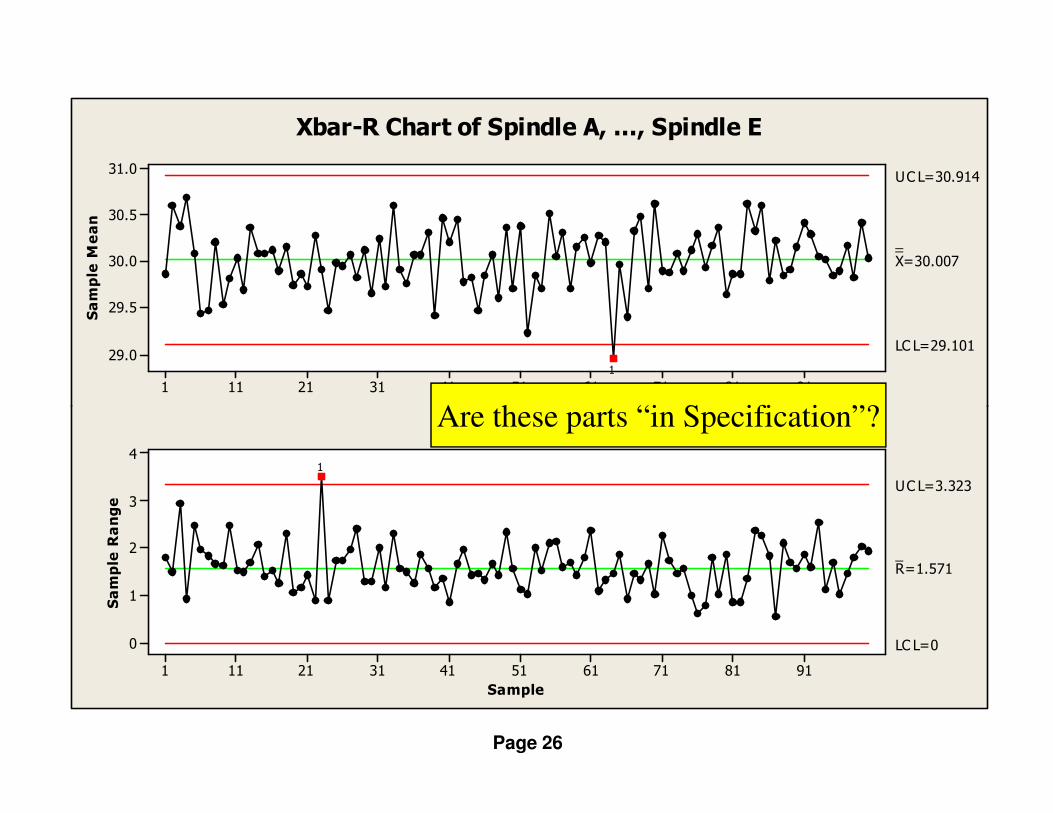
Are these parts “in Specification”?
Page 26
Sample
9181716151413121111
4
3
2
1
0
Sample
Sample Range
_R=1.571
UC L=3.323
LC L=0
1
Are these parts “in Specification”?

9181716151413121111
31.0
30.5
30.0
29.5
29.0
Sample
Sample M
ean
__X=30.007
UC L=30.914
LC L=29.101
1
Xbar-R Chart of Spindle A, ..., Spindle E
Are these parts “in Specification”?
Page 27
Sample
9181716151413121111
4
3
2
1
0
Sample
Sample Range
_R=1.571
UC L=3.323
LC L=0
1
Are these parts “in Specification”?
The Control Chart does not answer this question!
Question2 I have an engineering specification.
Why do I need statistical control limits?
1. Engineering spec. is for classifying parts as conforming or non
Page 28
parts as conforming or non conforming to Customer
Requirement, it does not signal process change.
2. Control limits signal process change. They do not classify parts as meeting
Customer Requirements.

I’m measuring “flatness” or “leak” or “roundness”.
Why do I have a Lower Control Limit? Shouldn’t it just be 0?
Page 29

I’m measuring “flatness” or “leak” or “roundness”.
Why do I have a Lower Control Limit? Shouldn’t it just be 0?
Page 30
This point is below the Lower Control Limit. This is unusual
compared to where the process ordinarily makes product.
Control Limits alert us to process changes and unusual events

I’m measuring “Weld Strength”.
Why do I have an Upper Control Limit?
Page 31

I’m measuring “Weld Strength”.
Why do I have an Upper Control Limit?
These point are above the Upper Control Limit. This is unusual
compared to where the process ordinarily makes product.
Control Limits alert us to process changes and unusual events
Page 32
Control Limits alert us to process changes and unusual events

Why are my control limits so narrow?Why would we control the process tighter than the specification??
Subgroup Size n=1
Page 33

Why are my control limits so narrow?Why would we control the process tighter than the specification??
Subgroup Size n=1
Page 34
Control limits tell us where the process ordinarily makes product.
Control limits are based on data from the process, not on the specification.
Control Limits alert us to process changes and unusual events.
A process that is very “Capable” will have control limits narrower than the specification.

Why are my control limits so narrow?Why would we control the process tighter than the specification??
Subgroup Size n=5
Control limits tell us where the process ordinarily makes product.
Page 35
Control limits tell us where the process ordinarily makes product.
Control limits are based on data from the process, not on the specification.
Control Limits alert us to process changes and unusual events.
A process that is very “Capable” will have control limits narrower than the specification.
Increasing the Subgroup Size will further “tighten” the control limits.
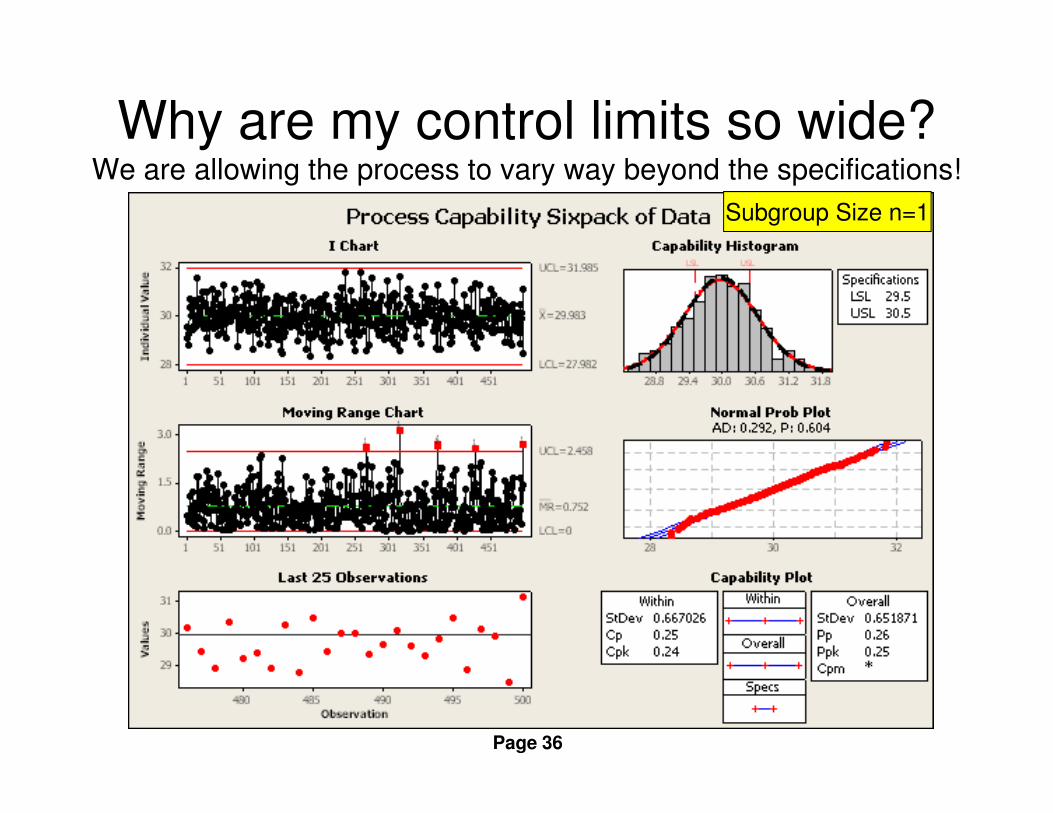
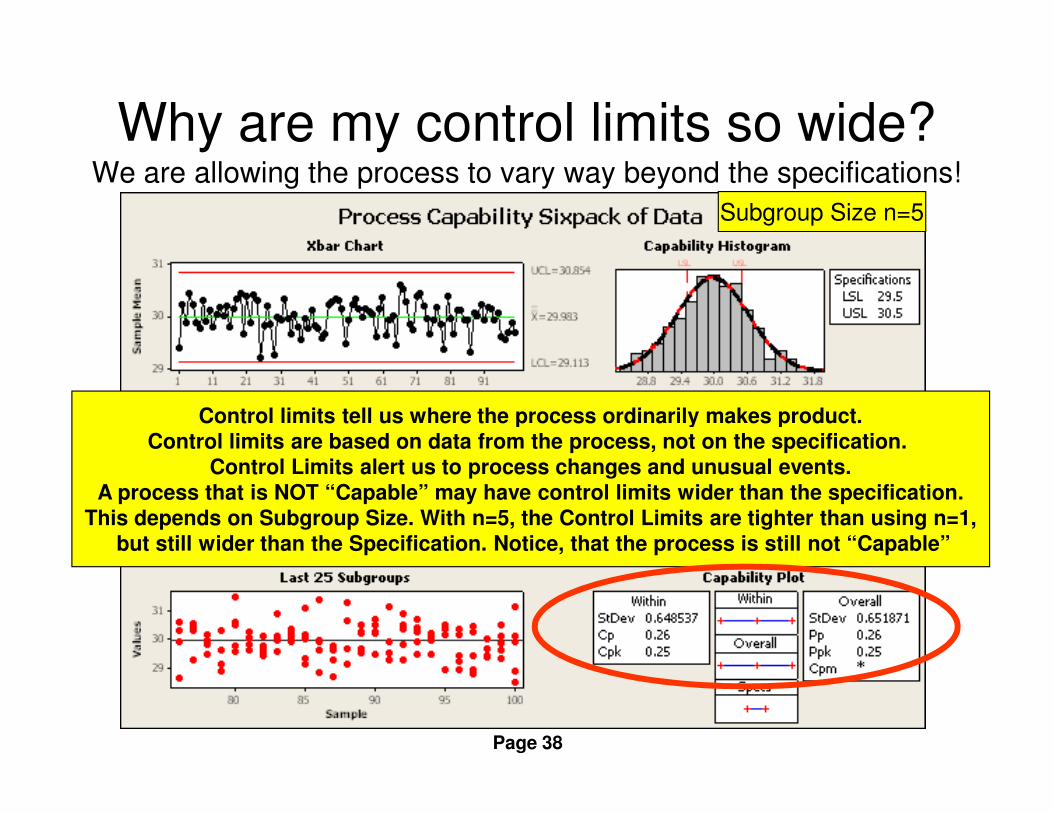
Why are my control limits so wide? We are allowing the process to vary way beyond the specifications!
Subgroup Size n=1
Page 36

Why are my control limits so wide?We are allowing the process to vary way beyond the specifications!
Subgroup Size n=1
Control limits tell us where the process ordinarily makes product.
Page 37
Control limits tell us where the process ordinarily makes product.Control limits are based on data from the process, not on the specification.
Control Limits alert us to process changes and unusual events.A process that is NOT “Capable” may have control limits wider than the specification.
This depends on Subgroup Size. With n=1, here the Control Limits are wider than the specification.
Why are my control limits so wide?We are allowing the process to vary way beyond the specifications!
Subgroup Size n=5
Control limits tell us where the process ordinarily makes product.
Page 38
Control limits tell us where the process ordinarily makes product.Control limits are based on data from the process, not on the specification.
Control Limits alert us to process changes and unusual events.A process that is NOT “Capable” may have control limits wider than the specification.
This depends on Subgroup Size. With n=5, the Control Limits are tighter than using n=1,but still wider than the Specification. Notice, that the process is still not “Capable”
Question 3
Cp, Cpk, Pp, Ppk???
What’s all this alphabet soup
about?
Page 39
Why are there (4) of these
indices??

Cp Pp
Process CAPABILITY (adjusted for targeting) Cpk can improve to Cp
if I can adjust my
Process PERFORMANCE (adjusted for targeting)
Ppk can improve to Pp if I
Page 40
Cpk Ppk
if I can adjust my process average so it is
in the middle of the specifications.
can adjust my process average so it is in the
middle of the specifications.
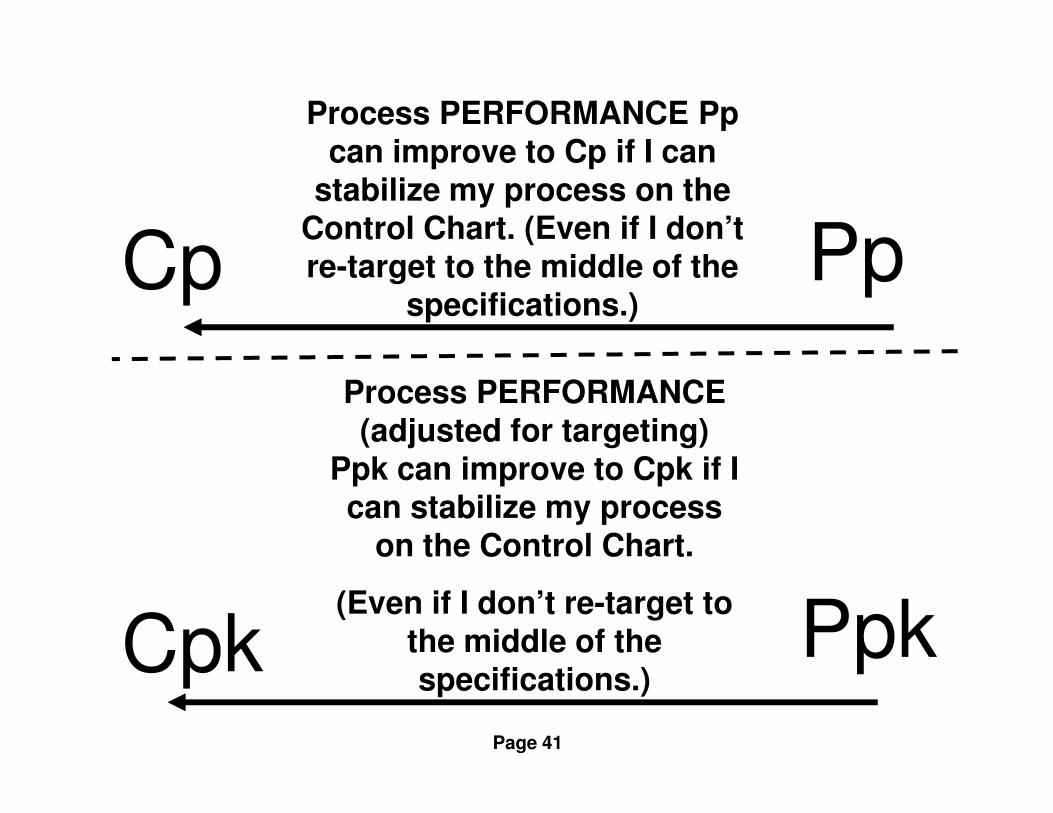
Cp Pp
Process PERFORMANCE Pp can improve to Cp if I can
stabilize my process on the Control Chart. (Even if I don’t re-target to the middle of the
specifications.)
Process PERFORMANCE
Page 41
Cpk Ppk
Process PERFORMANCE (adjusted for targeting)
Ppk can improve to Cpk if I can stabilize my process
on the Control Chart.
(Even if I don’t re-target to the middle of the specifications.)

Cp Ppk
Process PERFORMANCE (adjusted for “targeting)
Ppk can improve to Cp if I can stabilize my process on the Control Chart and
Page 42
Cp Ppkon the Control Chart and also re-target to the middle
of the specifications.
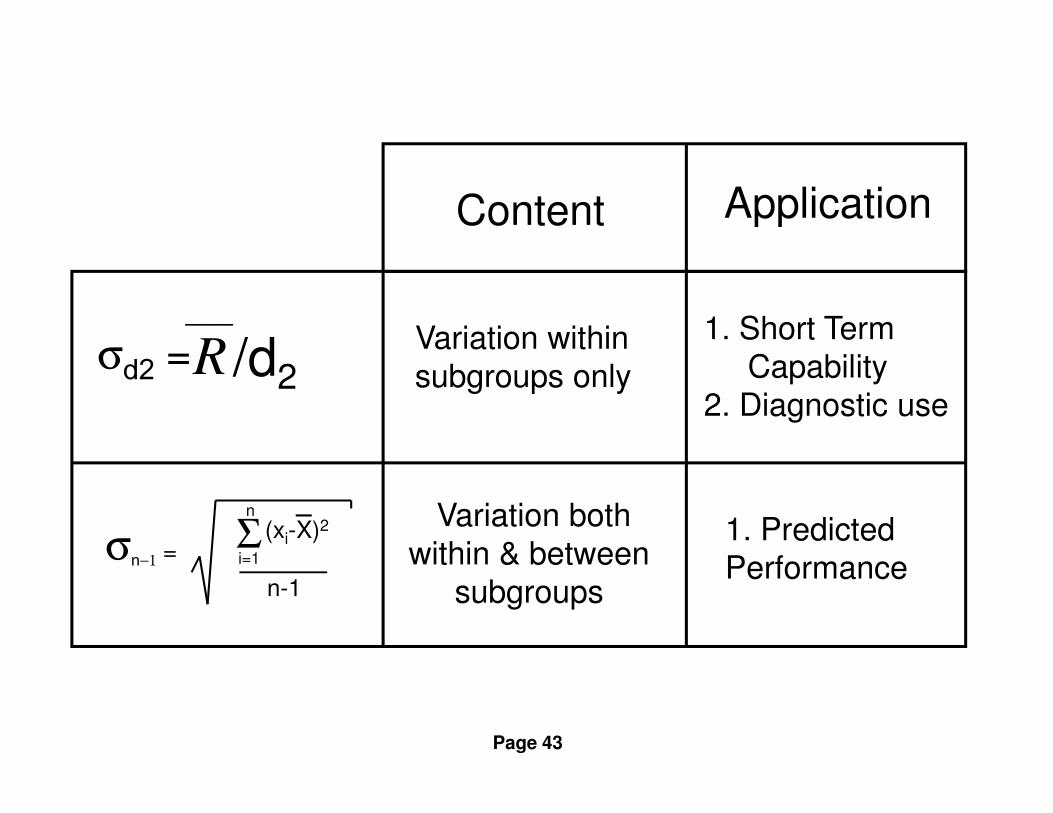
Content Application
Variation within
subgroups only
1. Short Term
Capability
2. Diagnostic use
___
Rσd2 = /d2
Page 43
σn−1= i=1
n
Σ (xi-X)2
n-1
Variation both
within & between
subgroups
2. Diagnostic use
1. Predicted
Performance

Cp=Total Tolerance
6σd2
The minimum Upper Specification - X
Capability Indices – Include Within Group Variation Only
“Cp shows how good Ppkcould be if the process were targeted
within the specifications and stable on the control chart”
Page 44
Cpk=The minimum
of either
3σd2
or
- Lower Specification
3σd2
Upper Specification - X
X
Cpk will be worse than Cp if the process is not centered within
the specifications.“Cpk shows how good Ppk could be if
the process was just stable on the control chart”

Performance Indices – Include Both Within Group &Between Group Variation
Pp=Total Tolerance
6σn−1
Pp will be worse than Cp if the process is unstable on the control chart
“Pp shows how good Ppk could be if the process was just targeted
within the specifications.”
Page 45
Ppk=The minimum
of either
3
or
- Lower Specification
3
Upper Specification - X
X
σn−1
σn−1
464136312621161161
0.834
0.831
0.828
Sample Mean
__X=0.829989
UCL=0.833553
LCL=0.826424
0.8400.8370.8340.8310.8280.8250.822
LSL USL
LSL 0.82
USL 0.84
Specifications
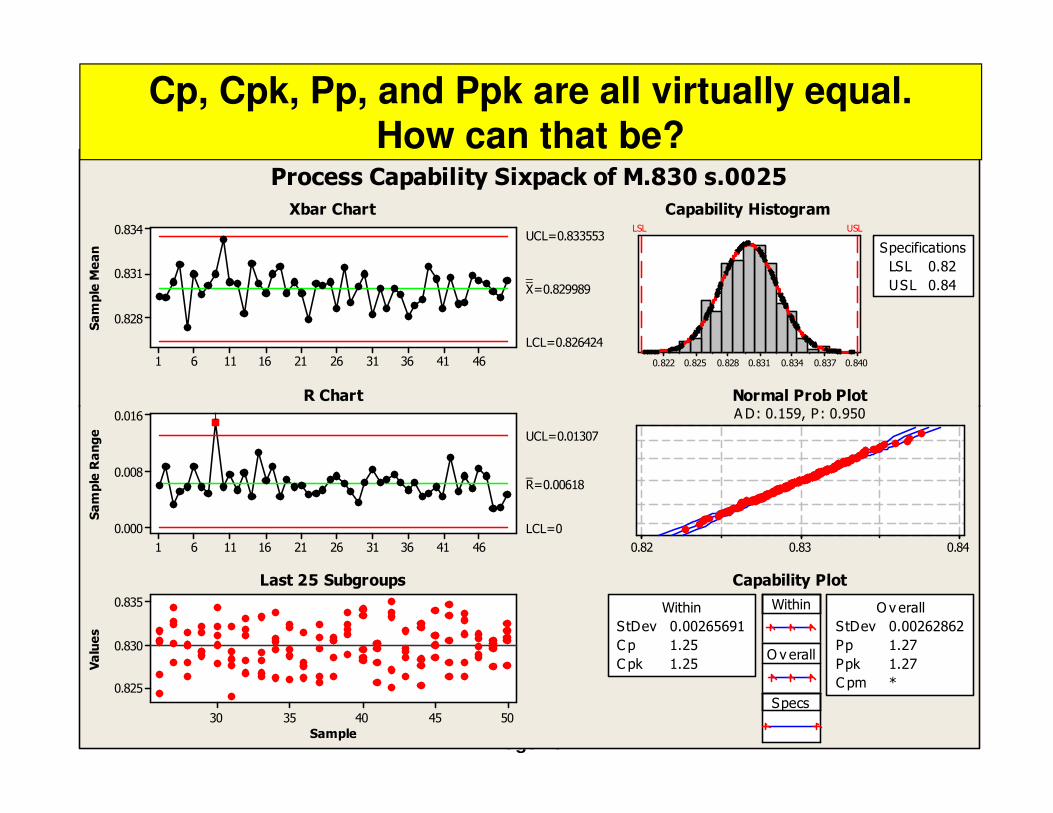
Process Capability Sixpack of M.830 s.0025
Xbar Chart
R Chart
Capability Histogram
Normal Prob PlotA D: 0.159, P: 0.950
Cp, Cpk, Pp, and Ppk are all virtually equal.How can that be?
Page 46
464136312621161161
0.016
0.008
0.000
Sample Range
_R=0.00618
UCL=0.01307
LCL=0
5045403530
0.835
0.830
0.825
Sample
Values
0.840.830.82
Within
O v erall
Specs
StDev 0.00265691
C p 1.25
C pk 1.25
Within
StDev 0.00262862
Pp 1.27
Ppk 1.27
C pm *
O v erall
1
Last 25 Subgroups
A D: 0.159, P: 0.950
Capability Plot
464136312621161161
0.834
0.831
0.828
Sample Mean
__X=0.829989
UCL=0.833553
LCL=0.826424
0.8400.8370.8340.8310.8280.8250.822
LSL USL
LSL 0.82
USL 0.84
Specifications
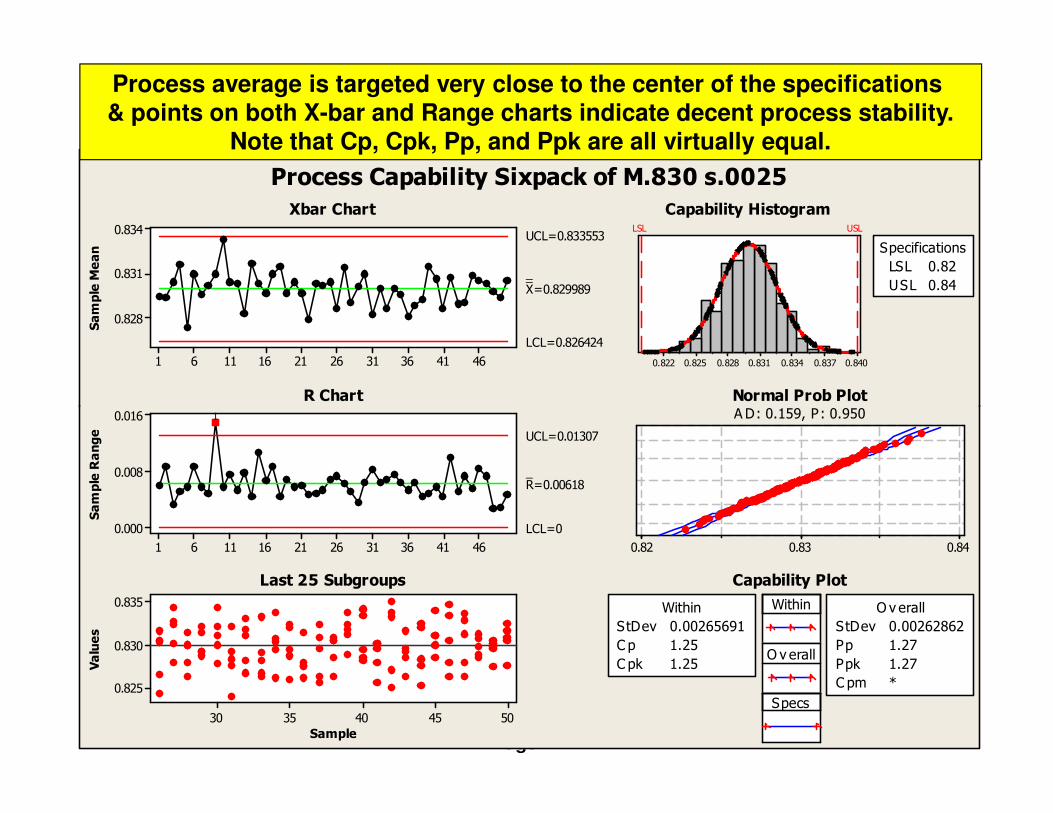
Process Capability Sixpack of M.830 s.0025
Xbar Chart
R Chart
Capability Histogram
Normal Prob PlotA D: 0.159, P: 0.950
Process average is targeted very close to the center of the specifications & points on both X-bar and Range charts indicate decent process stability.
Note that Cp, Cpk, Pp, and Ppk are all virtually equal.
Page 47
464136312621161161
0.016
0.008
0.000
Sample Range
_R=0.00618
UCL=0.01307
LCL=0
5045403530
0.835
0.830
0.825
Sample
Values
0.840.830.82
Within
O v erall
Specs
StDev 0.00265691
C p 1.25
C pk 1.25
Within
StDev 0.00262862
Pp 1.27
Ppk 1.27
C pm *
O v erall
1
Last 25 Subgroups
A D: 0.159, P: 0.950
Capability Plot
464136312621161161
0.8300
0.8275
0.8250
Sample Mean
__X=0.826120
UCL=0.829249
LCL=0.822991
0.8400.8370.8340.8310.8280.8250.822
LSL USL
LSL 0.82
USL 0.84
Specifications
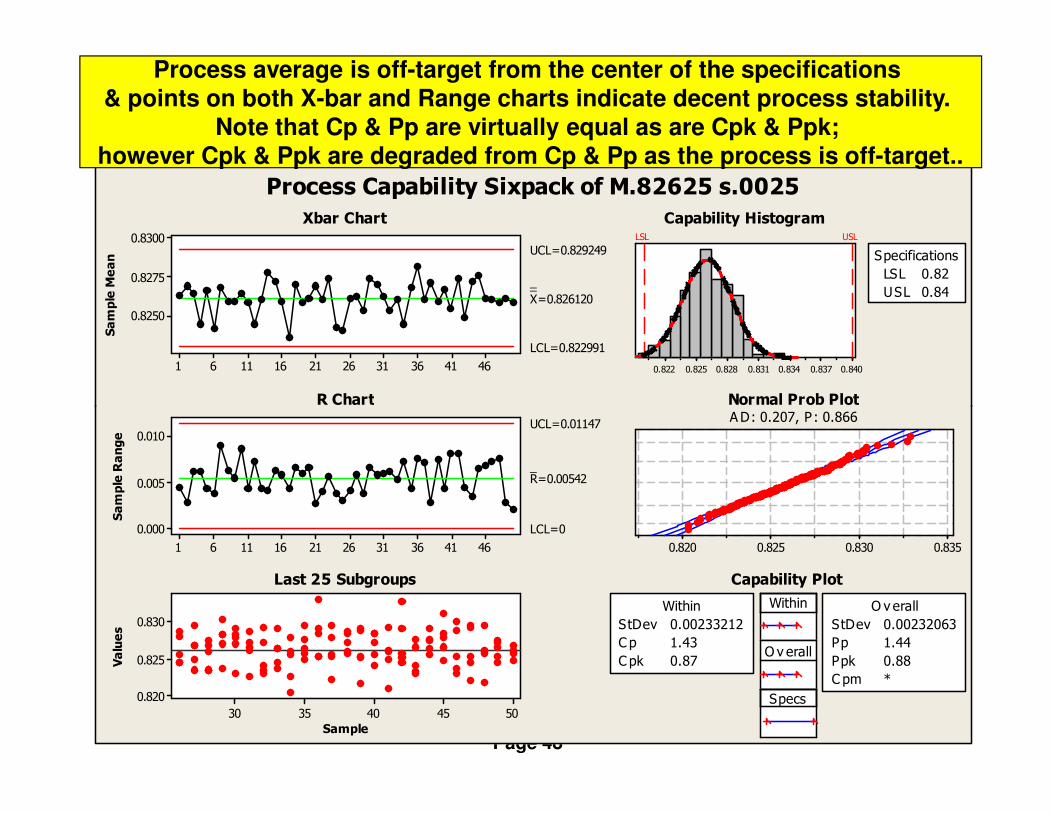
Process Capability Sixpack of M.82625 s.0025
Xbar Chart
R Chart
Capability Histogram
Normal Prob Plot
Process average is off-target from the center of the specifications & points on both X-bar and Range charts indicate decent process stability.
Note that Cp & Pp are virtually equal as are Cpk & Ppk; however Cpk & Ppk are degraded from Cp & Pp as the process is off-target..
Page 48
464136312621161161
0.010
0.005
0.000
Sample Range
_R=0.00542
UCL=0.01147
LCL=0
5045403530
0.830
0.825
0.820
Sample
Values
0.8350.8300.8250.820
Within
O v erall
Specs
StDev 0.00233212
C p 1.43
C pk 0.87
Within
StDev 0.00232063
Pp 1.44
Ppk 0.88
C pm *
O verall
R Chart
Last 25 Subgroups
Normal Prob PlotA D: 0.207, P : 0.866
Capability Plot
252321191715131197531
6.8
6.4
6.0
Sample Mean
__X=6.4553UCL=6.5050LCL=6.4055
7.257.006.756.506.256.005.75
LSL USL
LSL 5.95
USL 6.95
Specifications
11111
11
1
1
1
1
1
11
1
11111
1
1
1
1
1
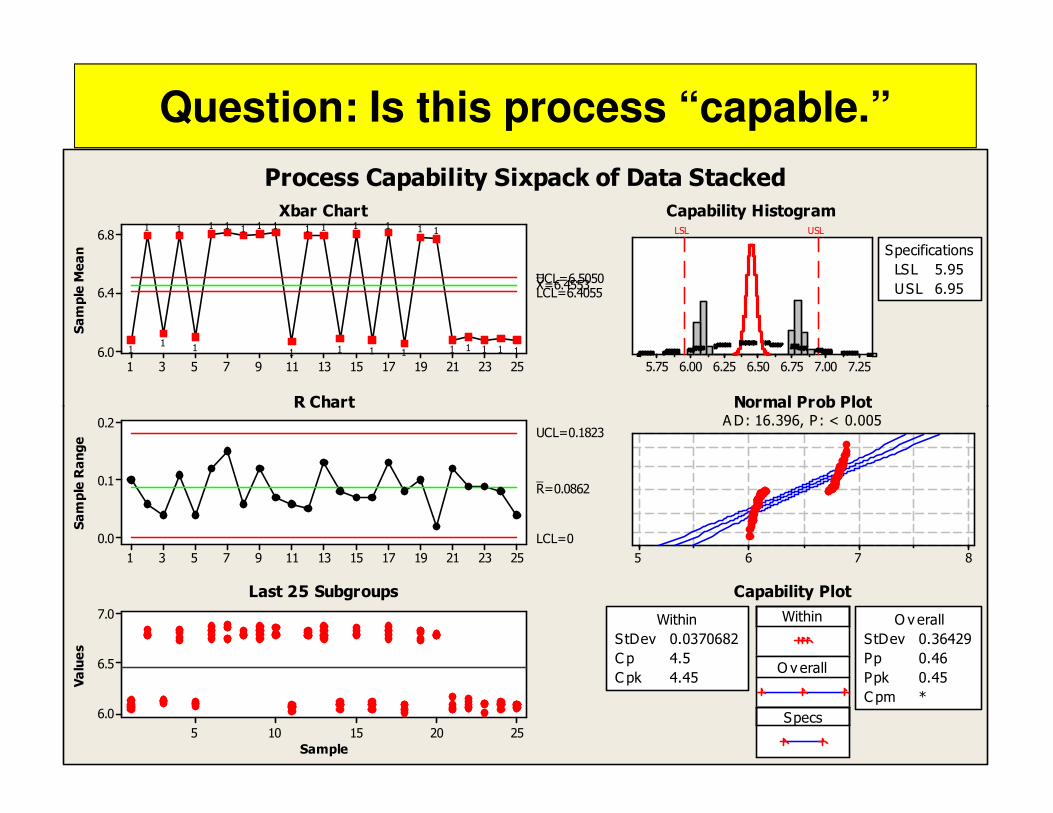
Process Capability Sixpack of Data Stacked
Xbar Chart
R Chart
Capability Histogram
Normal Prob Plot
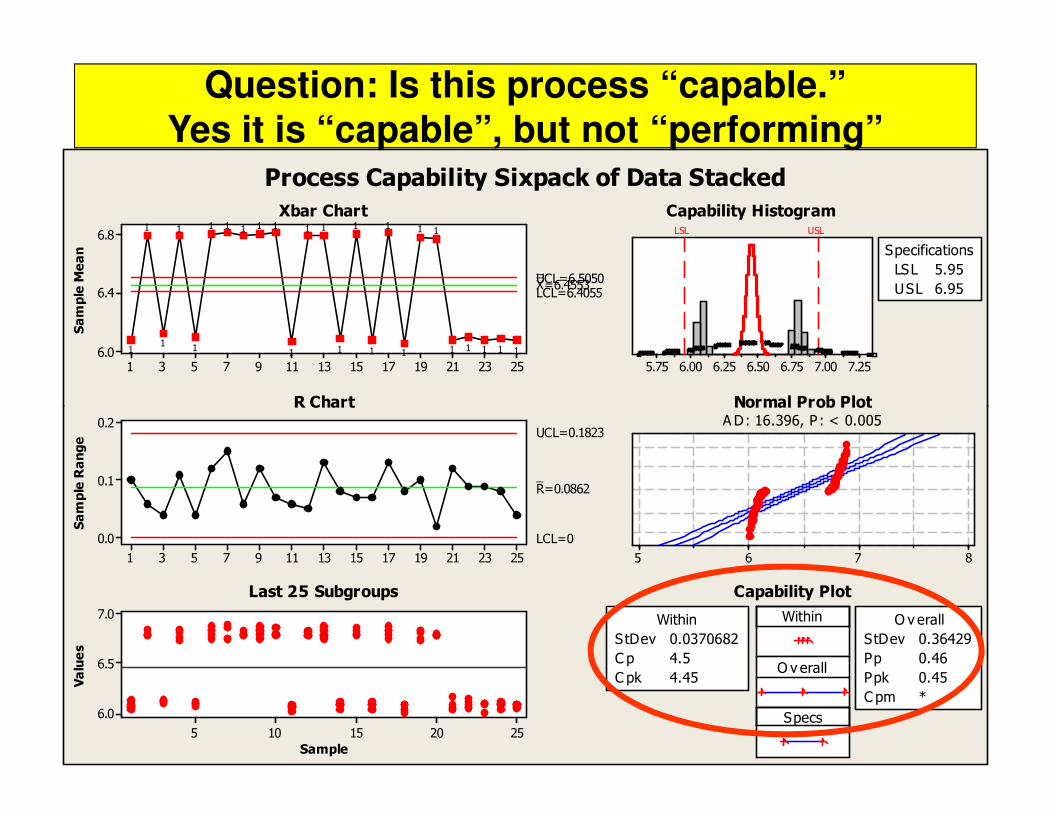
Question: Is this process “capable.”
Page 49
252321191715131197531
0.2
0.1
0.0
Sample Range
_R=0.0862
UCL=0.1823
LCL=0
252015105
7.0
6.5
6.0
Sample
Values
8765
Within
O v erall
Specs
StDev 0.0370682
C p 4.5
C pk 4.45
Within
StDev 0.36429
Pp 0.46
Ppk 0.45
C pm *
O verall
R Chart
Last 25 Subgroups
Normal Prob PlotA D: 16.396, P : < 0.005
Capability Plot
252321191715131197531
6.8
6.4
6.0
Sample Mean
__X=6.4553UCL=6.5050LCL=6.4055
7.257.006.756.506.256.005.75
LSL USL
LSL 5.95
USL 6.95
Specifications
11111
11
1
1
1
1
1
11
1
11111
1
1
1
1
1
Process Capability Sixpack of Data Stacked
Xbar Chart
R Chart
Capability Histogram
Normal Prob Plot
Question: Is this process “capable.”Yes it is “capable”, but not “performing”
Page 50
252321191715131197531
0.2
0.1
0.0
Sample Range
_R=0.0862
UCL=0.1823
LCL=0
252015105
7.0
6.5
6.0
Sample
Values
8765
Within
O v erall
Specs
StDev 0.0370682
C p 4.5
C pk 4.45
Within
StDev 0.36429
Pp 0.46
Ppk 0.45
C pm *
O verall
R Chart
Last 25 Subgroups
Normal Prob PlotA D: 16.396, P : < 0.005
Capability Plot
252321191715131197531
6.8
6.4
6.0
Sample Mean
__X=6.4553UCL=6.5050LCL=6.4055
7.257.006.756.506.256.005.75
LSL USL
LSL 5.95
USL 6.95
Specifications
11111
11
1
1
1
1
1
11
1
11111
1
1
1
1
1
Process Capability Sixpack of Data Stacked
Xbar Chart
R Chart
Capability Histogram
Normal Prob Plot
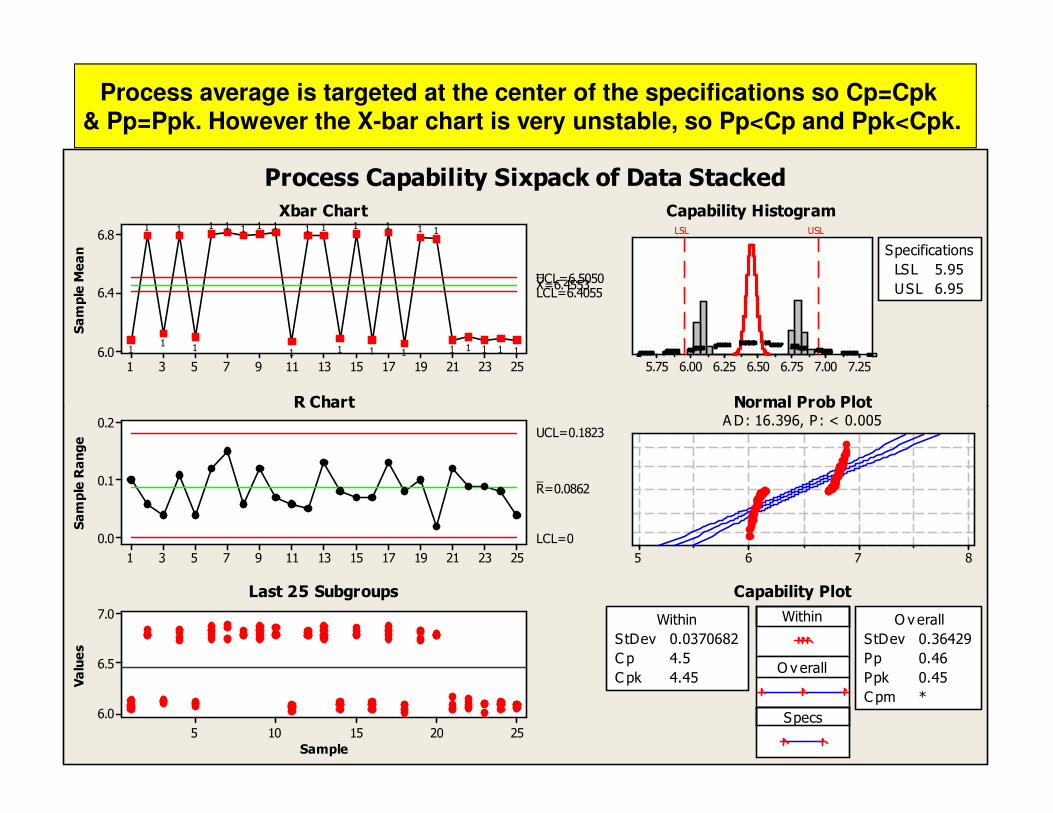
Process average is targeted at the center of the specifications so Cp=Cpk & Pp=Ppk. However the X-bar chart is very unstable, so Pp<Cp and Ppk<Cpk.
Page 51
252321191715131197531
0.2
0.1
0.0
Sample Range
_R=0.0862
UCL=0.1823
LCL=0
252015105
7.0
6.5
6.0
Sample
Values
8765
Within
O v erall
Specs
StDev 0.0370682
C p 4.5
C pk 4.45
Within
StDev 0.36429
Pp 0.46
Ppk 0.45
C pm *
O verall
R Chart
Last 25 Subgroups
Normal Prob PlotA D: 16.396, P : < 0.005
Capability Plot
ASQ Automotive Division Webinar Series
Thank you for attending the Webinar
For video from this webinar please check our website:Video will be delayed by a few weeks:
www.asq-auto.org
Twitter: @ASQautomotive
New Website
Twitter: @ASQautomotiveFacebook: ASQ Automotive division
Slides are posted at: http://www.slideshare.net/oldeckQuestions & Comments: [email protected]
Related Documents