ENVIRONMENTAL MICROBIOLOGY Spatiotemporal Analysis of Bacterial Diversity in Sediments of Sundarbans Using Parallel 16S rRNA Gene Tag Sequencing Pijush Basak & Niladri Shekhar Majumder & Sudip Nag & Anish Bhattacharyya & Debojyoti Roy & Arpita Chakraborty & Sohan SenGupta & Arunava Roy & Arghya Mukherjee & Rudradip Pattanayak & Abhrajyoti Ghosh & Dhrubajyoti Chattopadhyay & Maitree Bhattacharyya Received: 26 March 2014 /Accepted: 10 September 2014 # Springer Science+Business Media New York 2014 Abstract The influence of temporal and spatial variations on the microbial community composition was assessed in the unique coastal mangrove of Sundarbans using parallel 16S rRNA gene pyrosequencing. The total sediment DNA was extracted and subjected to the 16S rRNA gene pyrosequenc- ing, which resulted in 117 Mbp of data from three experimen- tal stations. The taxonomic analysis of the pyrosequencing data was grouped into 24 different phyla. In general, Proteobacteria were the most dominant phyla with predomi- nance of Deltaproteobacteria, Alphaproteobacteria, and Gammaproteobacteria within the sediments. Besides Proteobacteria, there are a number of sequences affiliated to the following major phyla detected in all three stations in both the sampling seasons: Actinobacteria, Bacteroidetes , Planctomycetes, Acidobacteria, Chloroflexi, Cyanobacteria, Nitrospira, and Firmicutes. Further taxonomic analysis re- vealed abundance of micro-aerophilic and anaerobic microbi- al population in the surface layers, suggesting anaerobic na- ture of the sediments in Sundarbans. The results of this study add valuable information about the composition of microbial communities in Sundarbans mangrove and shed light on pos- sible transformations promoted by bacterial communities in the sediments. Keywords Sundarbans . Microbial diversity . 454-amplicon sequencing . 16S rRNA gene Introduction Recent advancement in high-throughput sequencing, popular- ly known as next-generation sequencing technology, has im- mensely contributed in global increase in microbial diversity and ecology studies employing samples from different envi- ronments, e.g., soil or sediment, marine or freshwater, animal, or insect gut. Precise description of microbial diversity and abundance has recently been achieved using high-throughput sequencing platforms and explored results clearly account over 100 times more depth in the microbial diversity assess- ment in comparison to previous reports using the traditional culture-dependent methods [1–3]. Mangroves are among the world’ s most productive ecosystems, and microbes play a key role in maintaining this productivity [4]. In effect, they also constitute the largest and most diverse pool of metabolic pathways on Earth [5] with potential biotechnological and environmental implications [6]. It is estimated that about three fourth of the world’ s tropical and subtropical coastlines are Electronic supplementary material The online version of this article (doi:10.1007/s00248-014-0498-y) contains supplementary material, which is available to authorized users. P. Basak : S. Nag : A. Bhattacharyya : D. Roy : A. Chakraborty : S. SenGupta : R. Pattanayak : D. Chattopadhyay (*) : M. Bhattacharyya (*) Department of Biochemistry, University College of Science, University of Calcutta, 35, Ballygunge Circular Road, Calcutta 700019, India e-mail: [email protected] e-mail: [email protected] N. S. Majumder Roche Diagnostics India Pvt. Ltd., 4C, Akash Tower, 781 Anandapur, Calcutta 700 107, India A. Roy : A. Mukherjee : D. Chattopadhyay Department of Biotechnology, University College of Science, University of Calcutta, 35, Ballygunge Circular Road, Calcutta 700019, India A. Ghosh (*) Department of Biochemistry, Bose Institute, Centenary Campus, P 1/12, C. I. T. Road, Scheme, VIIM, Calcutta 700054, West Bengal, India e-mail: [email protected] Microb Ecol DOI 10.1007/s00248-014-0498-y

Welcome message from author
This document is posted to help you gain knowledge. Please leave a comment to let me know what you think about it! Share it to your friends and learn new things together.
Transcript
ENVIRONMENTAL MICROBIOLOGY
Spatiotemporal Analysis of Bacterial Diversity in Sedimentsof Sundarbans Using Parallel 16S rRNA Gene Tag Sequencing
Pijush Basak & Niladri Shekhar Majumder & Sudip Nag & Anish Bhattacharyya &
Debojyoti Roy & Arpita Chakraborty & Sohan SenGupta & Arunava Roy &
Arghya Mukherjee & Rudradip Pattanayak & Abhrajyoti Ghosh &
Dhrubajyoti Chattopadhyay & Maitree Bhattacharyya
Received: 26 March 2014 /Accepted: 10 September 2014# Springer Science+Business Media New York 2014
Abstract The influence of temporal and spatial variations onthe microbial community composition was assessed in theunique coastal mangrove of Sundarbans using parallel 16SrRNA gene pyrosequencing. The total sediment DNA wasextracted and subjected to the 16S rRNA gene pyrosequenc-ing, which resulted in 117 Mbp of data from three experimen-tal stations. The taxonomic analysis of the pyrosequencingdata was grouped into 24 different phyla. In general,Proteobacteria were the most dominant phyla with predomi-nance of Deltaproteobacteria, Alphaproteobacteria, andGammaproteobacteria within the sediments. BesidesProteobacteria, there are a number of sequences affiliated to
the following major phyla detected in all three stations in boththe sampling seasons: Actinobacteria, Bacteroidetes,Planctomycetes, Acidobacteria, Chloroflexi, Cyanobacteria,Nitrospira, and Firmicutes. Further taxonomic analysis re-vealed abundance of micro-aerophilic and anaerobic microbi-al population in the surface layers, suggesting anaerobic na-ture of the sediments in Sundarbans. The results of this studyadd valuable information about the composition of microbialcommunities in Sundarbans mangrove and shed light on pos-sible transformations promoted by bacterial communities inthe sediments.
Keywords Sundarbans .Microbial diversity .
454-amplicon sequencing . 16S rRNAgene
Introduction
Recent advancement in high-throughput sequencing, popular-ly known as next-generation sequencing technology, has im-mensely contributed in global increase in microbial diversityand ecology studies employing samples from different envi-ronments, e.g., soil or sediment, marine or freshwater, animal,or insect gut. Precise description of microbial diversity andabundance has recently been achieved using high-throughputsequencing platforms and explored results clearly accountover 100 times more depth in the microbial diversity assess-ment in comparison to previous reports using the traditionalculture-dependent methods [1–3]. Mangroves are among theworld’s most productive ecosystems, and microbes play a keyrole in maintaining this productivity [4]. In effect, they alsoconstitute the largest and most diverse pool of metabolicpathways on Earth [5] with potential biotechnological andenvironmental implications [6]. It is estimated that about threefourth of the world’s tropical and subtropical coastlines are
Electronic supplementary material The online version of this article(doi:10.1007/s00248-014-0498-y) contains supplementary material,which is available to authorized users.
P. Basak : S. Nag :A. Bhattacharyya :D. Roy :A. Chakraborty :S. SenGupta :R. Pattanayak :D. Chattopadhyay (*) :M. Bhattacharyya (*)Department of Biochemistry, University College of Science,University of Calcutta, 35, Ballygunge Circular Road,Calcutta 700019, Indiae-mail: [email protected]: [email protected]
N. S. MajumderRoche Diagnostics India Pvt. Ltd., 4C, Akash Tower, 781Anandapur, Calcutta 700 107, India
A. Roy :A. Mukherjee :D. ChattopadhyayDepartment of Biotechnology, University College of Science,University of Calcutta, 35, Ballygunge Circular Road,Calcutta 700019, India
A. Ghosh (*)Department of Biochemistry, Bose Institute, Centenary Campus, P1/12, C. I. T. Road, Scheme, VIIM, Calcutta 700054, West Bengal,Indiae-mail: [email protected]
Microb EcolDOI 10.1007/s00248-014-0498-y

covered by mangrove biome. These ecosystems play numer-ous important roles in maintaining and sustaining the environ-ment. They also act as buffer zones between the land and seaand are thus essential for maintenance of sea level and forprotection of the coast [7]. Moreover, these ecosystems oftenserve as terminal basins for inland wastes and nutrient-richsediments. The unique mangrove ecosystem serves to absorbthese excess nutrients without suffering any major structuralor functional disturbance [8] and, therefore, is capable ofreducing eutrophication in adjacent coastal waters [8].
Mangroves are a complex and dynamic microbial ecosys-tem. Periodic tidal flooding, high rainfall, and humidity, to-gether with extremely variable environmental factors such assalinity, light, temperature, and nutrient availability [5, 6] giverise to a highly diverse and adaptive microbial community inmangrove ecosystems [6, 9]. Knowledge of the microbialdiversity and the activities of microorganisms in mangrovesediments are thus important for understanding how the man-grove ecosystems function. This is in turn necessary to formu-late effective management and conservation strategies [6] asmangroves are already critically endangered or approachingextinction in 26 out of the 120 countries havingmangroves [7].
Until recently, only a limited number of studies haveattempted to analyze the microbial diversity of mangroves.Most of these studies have concentrated on the South Amer-ican mangroves, which contribute to about 11 % of the totalmangrove vegetation [10]. Early studies relied mostly onculture-dependent techniques, fingerprinting methods, anduse of clone libraries to analyze phylogenetic and functionalgenes [11–16]. As a result, these studies were limited to only asmall population size and did not represent the total microbialdiversity. Some studies focused on the effects of pollution, oilspills, or anthropogenic stress factors on the mangrove micro-bial community [6, 17–21]. However, a complete snapshot ofthe total microbial diversity of a pristine mangrove ecosystemis presently sparse. Recently, Andreote et al. have reported acomprehensive metagenomic analysis of the Brazilian man-groves [22]. Such metagenomic studies using next-generationhigh-throughput sequencing techniques have the potential ofproviding the widest, unbiased view of the microbial diversitypresent in the environment [22, 23]. In addition to taxonomyand diversity, metagenomic approaches can provide a view ofthe potential metabolic pathways and community structurespresent in the environment.
The Sundarbans is the largest single block of tidal halo-phytic mangrove ecosystem in the world with 20,400 km2
(7900 sq mi) of area covered and has been recognized as aUNESCO World Heritage site. Situated in the Ganges-Brahmaputra river delta on the Bay of Bengal, it is sharedbetweenWest Bengal, India, and Bangladesh. Home to a widevariety of endangered species including the Bengal tiger, theSundarbans play a pivotal role in protecting the coastline andaverting natural calamities. However, to our knowledge, only
two studies have attempted to investigate the biodiversity ofthis vital and fragile ecosystem. Manna et al. attempted tocorrelate the different components of Sundarbans ecosystem[24], while both Ghosh et al. [12] and Chakraborty et al.[communicated] carried out small scale studies on the micro-bial diversity using cultivation-independent molecular ap-proaches. Therefore, a comprehensive study of the vast mi-crobial diversity of this unique mangrove biome is severelylacking.
In this study, we present the first detailed description of themicrobes found at the surface and subsurface sediment layersin three different mangrove areas in the Indian Sundarbans.These descriptions are based on sequences of the V1–V3region of the 16S rRNA gene as determined by 454 ampliconsequencing (pyrosequencing). Furthermore, we examinedtemporal changes in the microbial diversity of the samplingstations during the post-monsoon (December 2011) and mon-soon (July 2012) seasons mainly to understand the role ofclimate and other parameters in shaping the sediment micro-bial communities in Sundarbans.
Materials and Methods
Study Area and Soil Sampling
Samples were taken in triplicate from surface (2 cm) andsubsurface (16 cm) sediments of the Sundarbans mangrovewetland, which is located on the northeastern coast of India(Fig. 1). The samples were collected during two differentseasons (post-monsoon, December 2011, and monsoon, July2012) from three different stations, i.e., Jharkhali (station A),Sahidnagar (station B), and Godkhali (station C) along thetidal gradient in close proximity of each other (Fig. 1). Thestations are representatives of different anthropogenic influ-ences described previously. Samples were collected in tripli-cate from each station, and individual collection was thenmixed to homogeneity to generate a representative compositesample for further analysis. Samples were brought to thelaboratory in sealed sterile container, flash frozen in liquidnitrogen, and stored at −80 °C.
Soil Analyses and Site Climate
Microbiological and biochemical analyses were performedwith the field moist soils. Physical and chemical analyseswere carried out with air-dried soil samples. The soil pH wasmeasured in 1:2.5 soil/water suspensions and found to bealkaline (Table 1). The total organic carbon (TOC) was mea-sured by the methods described previously [25, 26]. Briefly,TOC in a sample was determined by combusting the air-driedsediment sample catalytically in oxygen atmosphere into in-strument chamber at 500–900 °C, and the resulting carbon
P. Basak et al.

dioxide gas was detected by a non-dispersive infrared (NDIR)detector in an Aurora TOC Analyzer (O I Analytical, Collegestation, TX, USA) that was calibrated to directly display thedetected carbon dioxide mass. This mass was proportional tothe TOC mass in the sediment sample and calculated as totalmass of carbon per unit of sediment sample.
Conductivity and salinity were measured in situ with HachPortable Meters (HQ40d) (Hach Company, Loveland, CO,
USA). Measured salinity was expressed in parts per thousand(ppt) or grams per kilogram, as described previously [27].Nutrients like inorganic nitrogen (ammonia, nitrite, and nitrate),soluble phosphate, and reactive silicate were measured afterquantitative extraction in respective buffering conditions follow-ing standard methodologies [28]. Briefly, nitrite was measuredafter complexing with sulfanilamide followed by a couplingreaction with n(1-napthyl)-ethylene diaminedihydrochloride,
Fig. 1 Geographical location of the sampling stations (Jharkhali—A, Sahidnagar—B, and Godkhali—C) in Indian Sundarbans. Coordinates of thesampling points and description of the stations are presented in the “Materials and Methods”
Table 1 Physicochemical parameters of the post-monsoon samples (December 2011) and the monsoon samples (July 2012)
Physicochemical parameters Station A (Jharkhali) Station B (Sahidnagar) Station C (Godkhali)
Post-monsoon samples
pH 7.5±0.2 7.4±0.1 7.2±0.2
Salinity (PSU) 15–18 15–17 14–16
Conductivity (ms/cm) 30–36 30–34 28–32
Temperature (°C) 24±0.5 25±0.4 26±0.5
Total organic carbon (TOC) (mg/L) AS, 8.5; A6, 8.5 BS, 5.8; B6, 12.0 CS, 2.0; C6, 7.5
Total nitrogen (N) (mg/L) AS, 1.6; A6, 0.63 BS, 1.3; B6, 1.3 CS, 1.2; C6, 1.01
Total bacterial count (cells/g) AS, 3×10⁶; A6, 7×10⁶ BS, 3.5×10⁶; B6, 8.4×10⁶ CS, 8.8×10⁶; C6, 9.6×10⁶
Monsoon samples
pH 7.3±0.2 7.3±0.1 7.6±0.2
Salinity (PSU) 9–11 10–12 8–10
Conductivity (ms/cm) 18–22 20–24 16–20
Temperature (°C) 29±0.5 30±0.4 31±0.5
Total organic carbon (TOC) (mg/L) AS, 7.2; A6, 8.8 BS, 4.9; B6, 9.0 CS, 1.5; C6, 6.2
Total nitrogen (N) (mg/L) AS, 1.9; A6, 0.74 BS, 1.52; B6, 1.34 CS, 1.4; C6, 1.21
Total bacterial count (cells/g) AS, 2.8×10⁶; A6, 8×10⁶ BS, 3.6×10⁶; B6, 10×106 CS, 7.2×10⁶; C6, 1.04×10⁷
PSU practical salinity unit
Spatiotemporal Analysis of Bacterial Diversity

which forms an azo dye upon coupling. The resulting azo dyewas measured spectrophotometrically at 543 nm. The nitrate, incontrary, was quantitatively reduced to nitrite using cadmium(Cd) granules prior to measurement. The total nitrite was thenmeasured spectrophotometrically as described earlier, and fur-ther subtraction of the measured value of free nitrite in thesediment resulted in determination of nitrate in the sample.Ammonia was measured in a reaction with hypochlorite underalkaline condition, which results in formation ofmonochloramine. In a successive reaction with phenol andnitroprusside, monochloramine was converted into indophenolblue, which was measured spectrophotometrically at 630 nm.The soluble phosphate was measured using acidified molybdatereagent, which yields phosphomolybdate complex upon reac-tion with soluble phosphate. This complex has further reducedinto molybdenum blue and measured spectrophotometrically at880 nm. The reactive silicate was measured using the formationof yellow silicomolybdic acid in the presence of molybdateunder acidic condition (Figure S1).
Soil DNA Isolation
Soil DNAwas extracted from 0.5 g soil subsamples using theMoBio DNA Power Soil kit (MoBio Laboratories, Carlsbad,CA). A NanoDrop (Thermo Scientific, Wilmington, DE,USA) spectrophotometer was used to obtain an accuratequantification of the extracted DNA and to measure otherimportant parameters for DNA quality, such as the ratio ofabsorbance at 260:280 nm and 260:230 nm. Isolated soilDNAwith a ratio of absorbance at 260:280 nm and 260:230of 1.8 and 2.0, respectively, was used to initiate ampliconsequencing analysis.
PCR Amplification of Bacterial 16S rRNA Gene
Amplification of the V1–V3 region of the 16S rRNA genewas performed in a 25-μl reactionmixture containing 17.50μlof water (Invitrogen, USA), 2.5 μl Fast Start buffer (10×),0.5 μl dNTP (10 mM), 1.0 μl Fusion Forward Primer(10 μM), 1.0 μl Fusion Reverse Primer (10 μM), 0.5 μl faststart enzyme (5 U/μl fast start high PCR system, Roche), and2 μl extracted soil DNA. The fusion primers consisted of atemplate-specific sequence and a fixed sequence, as recom-mended by the “Sequencing Technical Bulletin No. 013-2009” (454 Life Sciences, USA). In the 5′–3′ direction, for-ward primers contained a Roche A sequencing adaptor(CCATCTCATCCCTGCGTGTCTCCGAC), a key sequence(TCAG), a 10-bp Multiplex Identifier (MID) sequence, and atemplate specific sequence GAGTTTGATCCTGGCTCAG.Reverse primers contained a Roche B sequencing adaptor(CCTATCCCCTGTGTGCCTTGGCAGTC), a key sequence(TCAG), and a template-specific sequence ATTACCGCGGCTGCTGG. The PCR reactions were run on a Veriti Thermal
Cycler (Applied Biosystem) under the following conditions:initial denaturation at 94 °C for 3 min, followed by 25 cyclesof denaturation at 94 °C for 15 s, annealing at 58 °C for 45 s,elongation at 72 °C for 1 min, and a final elongation at 72 °Cfor 10 min. Samples were held at 4 °C.
Library Preparation
PCR amplicons were evaluated by electrophoresis on a 1.5 %agarose gel. The amplicon library was purified with AgencourtAMPure XP beads (Beckman Coulter Inc., Canada) and quan-tified by fluorometry using the Quant-iT™ PicoGreen dsDNAAssayKit (Invitrogen, Burlington, ON) according to theRoche454 “Amplicon Library Preparation Method Manual” of theGS Junior Titanium Series (454 Life Sciences, USA). Pooledamplicons were diluted as recommended and amplified byemulsion PCR on a Thermal Cycler 9700 (AppliedBiosystems) according to the Roche 454 “em-PCR Amplifi-cation Method Manual–Lib L” (454 Life Sciences, USA).Pyrosequencing was performed for 200 cycles on a Roche454 GS-Junior sequencing instrument according to the manu-facturer’s protocol (454 Life Sciences, USA). All reads werefiltered using the standard read rejecting filters of theGS Juniorsequencer, namely key pass filters, dot andmixed filters, signalintensity filters, and primer filters (454 Sequencing Systemsoftware Manual, V 2.5.3, 454 Life Sciences, USA).
454 Data Processing and Analysis
Analysis of the pyrosequence data was carried out using acombination of mothur (software version 1.33.0) and Ribo-somal Database Project (RDP-II). The raw data were subject-ed to initial quality trimming using the mothur software [29],and all reads having an average quality value of <20 werediscarded. Then, we removed the number of chimeric se-quence by using UCHIME algorithm. Then, the chimeric freereads were further screened for the presence of ambiguousbases, and any reads which have a length <200 were discardedand forward primer sequence was removed from the finaldataset. The obtained processed reads were then de-multiplexed to separate sample based on the 10-bp MIDsequence, and any reads which do not match to the MID werediscarded. The high-quality reads were then aligned to bacterial16S rRNA gene sequence, and clustering was performed at97 % similarity using the RDP pipeline; a representative se-quence from each cluster was selected based on abundanceusing the sequence selection tool. The representative sequencesobtained from each cluster were then classified using the naiveBayesian Classifier (Ribosomal Data Project, release 10) at abootstrap confidence of 80.
To assess the dissimilarities between the bacterial commu-nities in the given surface and subsurface sediment samples intwo seasons, non-metric multidimensional scaling (NMDS)
P. Basak et al.

was performed. NMDS plots for communities using Jaccardand Sorenson similarity indices (jclass and sorclass) werecreated using the NMDS algorithm in mothur [29].
In addition, sample dispersion based on various environ-mental parameters was evaluated through principal componentanalysis (PCA) using Past v 2.17c software [30]. Prior to themultivariate analysis, standardization of the entire dataset wascarried out by subtracting the mean from each observation anddivided by the corresponding standard deviation. The stan-dardized dataset was also used to generate a cluster of thesamples according to the environmental variables using Eu-clidean distance as the measure of similarity between samples.
Nucleotide Sequence Accession Numbers
All 454-GS Junior sequence data from this study were submit-ted to the NCBI Sequence Read Archive (SRA) under acces-sion numbers: SRR1032105 (ASurface_Dec11), SRR1221694(BSur face_Dec11), SRR1231523 (CSur face_Dec11),SRR1060346 (ASubsu r f a c e_Dec11) , SRR1224602(BSubsurface_Dec11), SRR1231530 (CSubsurface_Dec11),SRR1523729 (AS u r f a c e _ Ju l y12 ) , SRR1224601(BSurface_July12), SRR1231528 (CSurface_July12),SRR1060363 (ASubsu r f a c e_July12) , SRR1224603(BSubsurface_July12), and SRR1231524 (CSubsurface_July12).
Result and Discussion
Description of Sampling Sites
The Sundarbans mangrove along the Bay of Bengal hasevolved as deltaic formations through natural deposition ofupstream sediments by three major rivers: Ganges, Brahma-putra, and Meghna and their tributaries. Other major riversflowing through this ecosystem are Saptamukhi, Thakuran,Vidyadhari, Matla, and Goasaba. The geosystem inSundarbans is dominated by deltaic formations that are madeup of a mosaic of low-lying “islands” intersected by a com-plex network of tidal waterways, estuaries, creeks, and mud-flats. The Sundarbans floor varies from 0.9 to 2.11 m abovesea level. The average temperature ranges between 20 and40 °C, with average high during May–June and low in De-cember–January, respectively. Rainfall is heavy with humidityas high as 80 % as it is close to the Bay of Bengal. Thesubtropical monsoon lasts from June to September with anaverage rainfall of 125.5–221.07 mm/month during the mon-soon period. Samples were collected in December 2011 (withan average rainfall of 5.4 mm/month) and July 2012 (with anaverage rainfall of 293.6 mm/month). The pH was foundcomparable in both the sampling seasons. Previous studieshave shown that the salinity in Sundarbans gradually
increased from post-monsoon (17.3 PSU) to pre-monsoonperiods (24.5 PSU) and reached its lowest value during themonsoon (12.6 PSU) season. Within the water column, dis-solved oxygen (DO) concentration was found to be highduring post-monsoon period and low in monsoon season [24].
In the present study, two sampling stations are located inJharkhali Island (Fig. 1). This island is surrounded on the threesides by the Matla and the Vidyadhari rivers and by a creek,Boro Herobhanga Khal, joining these two river flow. Thiscreek remains flooded by water coming from both riversparticularly during high tide and monsoon season. The areais dominated by typical mangrove habitat. Station A(Jharkhali jetty; 22° 01′ 07.6139″ N, 88° 40′ 56.1910″ E) islocated in the subtidal area at the southern part of the Jharkhaliisland and on the bank of Boro Herobhanga creek. This stationis inundated by sea water throughout the year. This stationconsists of low-density mangrove vegetation mostly dominat-ed by Hental Palm (Phoenix paludosa). Due to the presence ofthe jetty in this sampling station, the area is under anthropo-genic pressure mainly due to oil leakage and agri-waste dis-posal from the inhabited area within the island. Station B(Sahid Nagar; 22° 00′ 25.5999″ N, 88° 42′ 13.9438″ E) islocated near the subtidal preserved area on the southeasternside of the Jharkhali Island and at the junction of Vidyadhaririver and Boro Herobhanga creek. This area is in the processof eco-restoration because of the large-scale successful affor-estation program. This area is densely vegetated with man-grove plant species like Hental Palm (P. paludosa), Sundari(Heritiera fomes), Gewa (Excoecaria agallocha), Goran(Ceriops decandra), and Keora (Sonneratia apetala). Littleanthropogenic influences are present in station B, mainly dueto human activities and sedimentation events and could beconsidered as nearly pristine mangrove sediment in the pres-ent study. Station C (Godkhali; 22° 06′ 32.57″ N, 88° 46′22.22″ E) is located on opposite side of the Gosaba Island(Fig. 1), which is the last inhabited island towards theSajnekhali Wildlife sanctuary and Sundarbans Tiger projectarea of Sundarbans reserve forest (UNESCO World Heritagesite: 1989). This station is situated in an intertidal zone withhigh anthropogenic influences mainly due to the addition ofindustrial effluents and oil leakage. The Commercial andtouristic use of the Jetty situated near this station furtherinfluence the flora and fauna in the neighborhood. Mangroveplants are scarce in this area, and non-mangrove plant speciesdominate the floral counterpart indicating that the typicalmangrove ecosystem has been altered in this area.
General Statistics
To our knowledge, this is the first report of the microbialdiversity analysis in the Sundarbans sediment using pyrose-quencing. We analyzed bacterial 16S rRNA gene (SSU)amplicons prepared from 12 sediment samples originated
Spatiotemporal Analysis of Bacterial Diversity
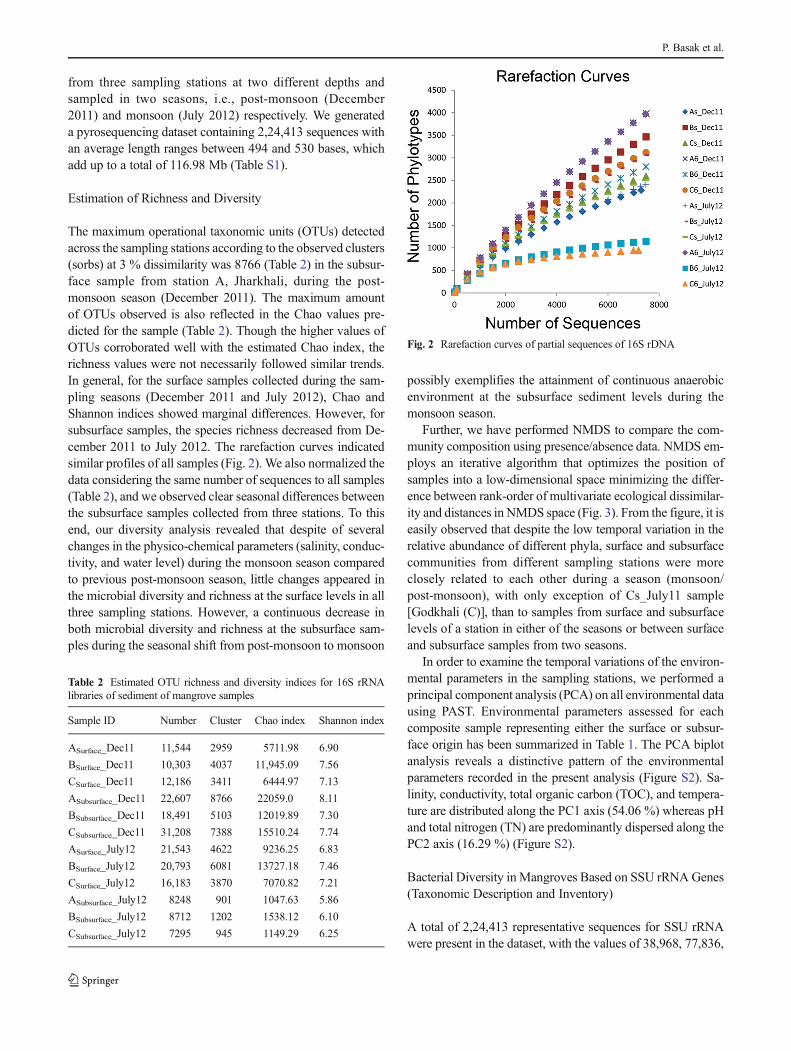
from three sampling stations at two different depths andsampled in two seasons, i.e., post-monsoon (December2011) and monsoon (July 2012) respectively. We generateda pyrosequencing dataset containing 2,24,413 sequences withan average length ranges between 494 and 530 bases, whichadd up to a total of 116.98 Mb (Table S1).
Estimation of Richness and Diversity
The maximum operational taxonomic units (OTUs) detectedacross the sampling stations according to the observed clusters(sorbs) at 3 % dissimilarity was 8766 (Table 2) in the subsur-face sample from station A, Jharkhali, during the post-monsoon season (December 2011). The maximum amountof OTUs observed is also reflected in the Chao values pre-dicted for the sample (Table 2). Though the higher values ofOTUs corroborated well with the estimated Chao index, therichness values were not necessarily followed similar trends.In general, for the surface samples collected during the sam-pling seasons (December 2011 and July 2012), Chao andShannon indices showed marginal differences. However, forsubsurface samples, the species richness decreased from De-cember 2011 to July 2012. The rarefaction curves indicatedsimilar profiles of all samples (Fig. 2). We also normalized thedata considering the same number of sequences to all samples(Table 2), and we observed clear seasonal differences betweenthe subsurface samples collected from three stations. To thisend, our diversity analysis revealed that despite of severalchanges in the physico-chemical parameters (salinity, conduc-tivity, and water level) during the monsoon season comparedto previous post-monsoon season, little changes appeared inthe microbial diversity and richness at the surface levels in allthree sampling stations. However, a continuous decrease inboth microbial diversity and richness at the subsurface sam-ples during the seasonal shift from post-monsoon to monsoon
possibly exemplifies the attainment of continuous anaerobicenvironment at the subsurface sediment levels during themonsoon season.
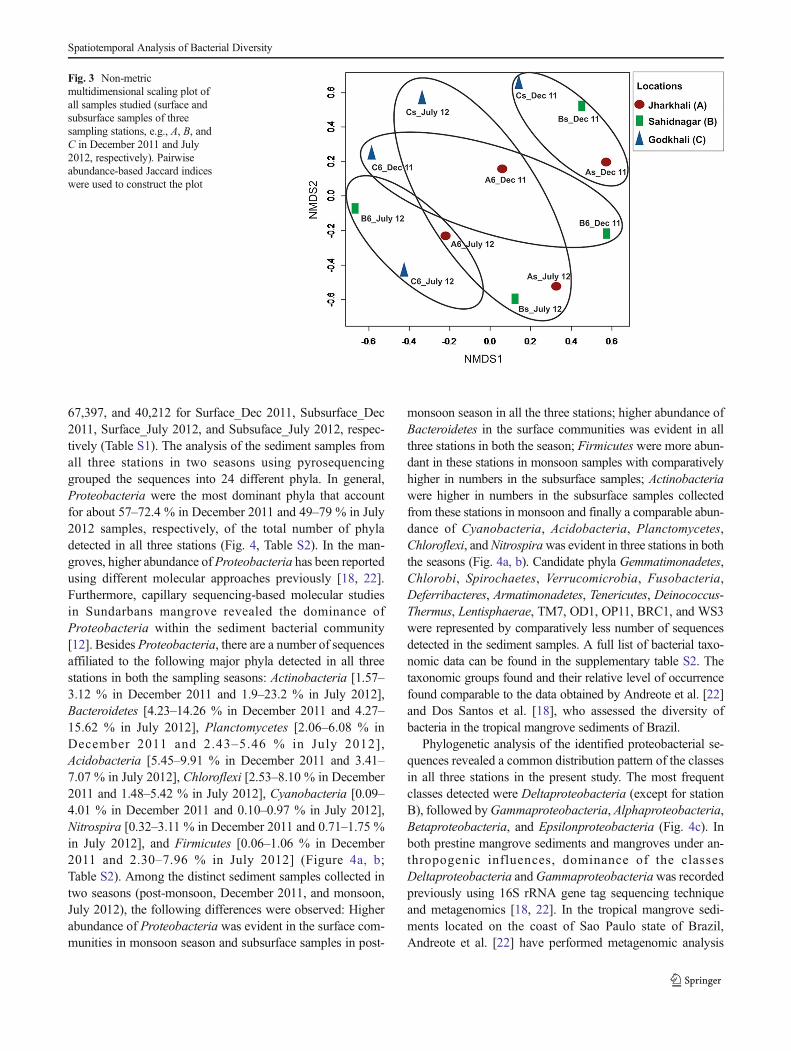
Further, we have performed NMDS to compare the com-munity composition using presence/absence data. NMDS em-ploys an iterative algorithm that optimizes the position ofsamples into a low-dimensional space minimizing the differ-ence between rank-order of multivariate ecological dissimilar-ity and distances in NMDS space (Fig. 3). From the figure, it iseasily observed that despite the low temporal variation in therelative abundance of different phyla, surface and subsurfacecommunities from different sampling stations were moreclosely related to each other during a season (monsoon/post-monsoon), with only exception of Cs_July11 sample[Godkhali (C)], than to samples from surface and subsurfacelevels of a station in either of the seasons or between surfaceand subsurface samples from two seasons.
In order to examine the temporal variations of the environ-mental parameters in the sampling stations, we performed aprincipal component analysis (PCA) on all environmental datausing PAST. Environmental parameters assessed for eachcomposite sample representing either the surface or subsur-face origin has been summarized in Table 1. The PCA biplotanalysis reveals a distinctive pattern of the environmentalparameters recorded in the present analysis (Figure S2). Sa-linity, conductivity, total organic carbon (TOC), and tempera-ture are distributed along the PC1 axis (54.06 %) whereas pHand total nitrogen (TN) are predominantly dispersed along thePC2 axis (16.29 %) (Figure S2).
Bacterial Diversity in Mangroves Based on SSU rRNAGenes(Taxonomic Description and Inventory)
A total of 2,24,413 representative sequences for SSU rRNAwere present in the dataset, with the values of 38,968, 77,836,
Table 2 Estimated OTU richness and diversity indices for 16S rRNAlibraries of sediment of mangrove samples
Sample ID Number Cluster Chao index Shannon index
ASurface_Dec11 11,544 2959 5711.98 6.90
BSurface_Dec11 10,303 4037 11,945.09 7.56
CSurface_Dec11 12,186 3411 6444.97 7.13
ASubsurface_Dec11 22,607 8766 22059.0 8.11
BSubsurface_Dec11 18,491 5103 12019.89 7.30
CSubsurface_Dec11 31,208 7388 15510.24 7.74
ASurface_July12 21,543 4622 9236.25 6.83
BSurface_July12 20,793 6081 13727.18 7.46
CSurface_July12 16,183 3870 7070.82 7.21
ASubsurface_July12 8248 901 1047.63 5.86
BSubsurface_July12 8712 1202 1538.12 6.10
CSubsurface_July12 7295 945 1149.29 6.25
Fig. 2 Rarefaction curves of partial sequences of 16S rDNA
P. Basak et al.
67,397, and 40,212 for Surface_Dec 2011, Subsurface_Dec2011, Surface_July 2012, and Subsuface_July 2012, respec-tively (Table S1). The analysis of the sediment samples fromall three stations in two seasons using pyrosequencinggrouped the sequences into 24 different phyla. In general,Proteobacteria were the most dominant phyla that accountfor about 57–72.4 % in December 2011 and 49–79 % in July2012 samples, respectively, of the total number of phyladetected in all three stations (Fig. 4, Table S2). In the man-groves, higher abundance of Proteobacteria has been reportedusing different molecular approaches previously [18, 22].Furthermore, capillary sequencing-based molecular studiesin Sundarbans mangrove revealed the dominance ofProteobacteria within the sediment bacterial community[12]. Besides Proteobacteria, there are a number of sequencesaffiliated to the following major phyla detected in all threestations in both the sampling seasons: Actinobacteria [1.57–3.12 % in December 2011 and 1.9–23.2 % in July 2012],Bacteroidetes [4.23–14.26 % in December 2011 and 4.27–15.62 % in July 2012], Planctomycetes [2.06–6.08 % inDecember 2011 and 2.43–5.46 % in July 2012],Acidobacteria [5.45–9.91 % in December 2011 and 3.41–7.07 % in July 2012], Chloroflexi [2.53–8.10 % in December2011 and 1.48–5.42 % in July 2012], Cyanobacteria [0.09–4.01 % in December 2011 and 0.10–0.97 % in July 2012],Nitrospira [0.32–3.11 % in December 2011 and 0.71–1.75 %in July 2012], and Firmicutes [0.06–1.06 % in December2011 and 2.30–7.96 % in July 2012] (Figure 4a, b;Table S2). Among the distinct sediment samples collected intwo seasons (post-monsoon, December 2011, and monsoon,July 2012), the following differences were observed: Higherabundance of Proteobacteria was evident in the surface com-munities in monsoon season and subsurface samples in post-
monsoon season in all the three stations; higher abundance ofBacteroidetes in the surface communities was evident in allthree stations in both the season; Firmicutes were more abun-dant in these stations in monsoon samples with comparativelyhigher in numbers in the subsurface samples; Actinobacteriawere higher in numbers in the subsurface samples collectedfrom these stations in monsoon and finally a comparable abun-dance of Cyanobacteria, Acidobacteria, Planctomycetes,Chloroflexi, andNitrospirawas evident in three stations in boththe seasons (Fig. 4a, b). Candidate phyla Gemmatimonadetes,Chlorobi, Spirochaetes, Verrucomicrobia, Fusobacteria,Deferribacteres, Armatimonadetes, Tenericutes, Deinococcus-Thermus, Lentisphaerae, TM7, OD1, OP11, BRC1, and WS3were represented by comparatively less number of sequencesdetected in the sediment samples. A full list of bacterial taxo-nomic data can be found in the supplementary table S2. Thetaxonomic groups found and their relative level of occurrencefound comparable to the data obtained by Andreote et al. [22]and Dos Santos et al. [18], who assessed the diversity ofbacteria in the tropical mangrove sediments of Brazil.
Phylogenetic analysis of the identified proteobacterial se-quences revealed a common distribution pattern of the classesin all three stations in the present study. The most frequentclasses detected were Deltaproteobacteria (except for stationB), followed byGammaproteobacteria, Alphaproteobacteria,Betaproteobacteria, and Epsilonproteobacteria (Fig. 4c). Inboth prestine mangrove sediments and mangroves under an-thropogenic influences, dominance of the classesDeltaproteobacteria andGammaproteobacteriawas recordedpreviously using 16S rRNA gene tag sequencing techniqueand metagenomics [18, 22]. In the tropical mangrove sedi-ments located on the coast of Sao Paulo state of Brazil,Andreote et al. [22] have performed metagenomic analysis
Fig. 3 Non-metricmultidimensional scaling plot ofall samples studied (surface andsubsurface samples of threesampling stations, e.g., A, B, andC in December 2011 and July2012, respectively). Pairwiseabundance-based Jaccard indiceswere used to construct the plot
Spatiotemporal Analysis of Bacterial Diversity

where they detected higher abundance of the classesDeltaproteobacteria and Gammaproteobacteria. Further-more, Dos Santos et al. [18] have used pyrosequencing of16S rDNA tags to show dominance of these group ofproteobacterial classes in the sediments of “Restinga daMarambaia”mangrove in Rio de Janeiro, Brazil, under naturalconditions and after simulated oil spills. Taken together, bac-terial community analysis of the tropical mangrove sedimentsrevealed a universal dominance of the proteobacterial classesDeltaproteobacteria and Gammaproteobacteria both underpristine conditions and under anthropogenic interference.The higher abundance of Deltaproteobacteria in sea waterand inmarine sediments has been proposed to be similar to themangrove ecosystems, where frequent anaerobic conditionsfacilitate in selection of microaerophilic/anaerobic sulfate-reducing organisms belonging to deltaproteobacterial class[20]. In general, oxygen penetration in the sediment remainslimited to the upper few centimeters, and the subsurfacesediment beneath the surface is shown to be anaerobic in
nature. Predominance of Deltaproteobacteria at the surfaceand subsurface sediment samples collected in the presentstudy clearly demonstrates the anaerobic nature of the sedi-ments both at the subtidal and intertidal regions of Sundarbansespecially during the monsoon season.
The Deltaproteobacteria were dominated by ordersDesulfobacterales, Desulfuromonadales, Myxococcales, andBdellovibrionales. Abundance of Desulfobacterales,Desulfuromonadales, and Bdellovibrionales in the sedimentsamples collected from three stations in general indicatesanaerobic nature of the sediment. Previous studies have shownthat the Deltaproteobacteria were dominant due to anaerobiccondition of the mangrove sediment that drives selection ofspecific microbial groups such as sulfur/sulfate-reducing bac-teria belonging to phylum Deltaproteobacteria [20]. In thepresent study, theMyxococcales, representing the only aerobicdeltaproteobacterial order, found mostly abundant in thesurface-derived samples from station B in both the seasonsindicates comparatively less anaerobic nature of the samples
Fig. 4 Composition of different phyla based on the classification ofpartial rRNA gene sequences of bacteria from Sundarbans sedimentsusing RDPII classifier (v 2.2). a Distribution of phyla in post-monsoon
(December 2011) sediments, b Distribution of phyla in monsoon (July2012) sediments. c Differential proportion of sequences assigned withinthe phylum Proteobacteria
P. Basak et al.

collected from this station. To this end, we believe that thestation B (Sahidnagar), which is under eco-restoration, hassufficient mangrove vegetation that further influenced themicrobial abundance and diversity, as evident from the presentdataset. It has been proposed that the activities of the man-grove roots provide a source of oxygen and interfere directlyto the redox potential of the mangrove sediment [31]. Due toeco-restoration, station B might receive more available oxy-gen compared to other two stations. In contrary, in bothstations A (Jharkhali) and C (Godkhali), vegetation has beenheavily affected due to anthropogenic influences, such as oilleakage and addition of agri-industrial wastes, which ultimate-ly reduced the number of mangrove trees and most importantlynot all the mangrove plant species are present in these stations.This scenario might have led to higher abundance of anaerobicsulfur-reducing bacteria such as Desulfobacterales,Desulfuromonadales, and Bdellovibrionales in stations A andC, respectively.
After Deltaproteobacteria, Gammaproteobacteria werethe most abundant proteobacterial class in all the three stationsin post-monsoon samples (Fig. 4c). However, in monsoonsamples, Gammaproteobacteria and Alphaproteobacteriaboth shared equal abundance after Deltaproteobacteria inthese stations (Fig. 5a). Neither depth dependent (spatial)nor any seasonal differentiation was observed with respect tothe abundance of Gammaproteobacteria in the sampling sta-tions. Within our dataset, the Gammaproteobacteria were
dominated by the orders Chromatiales, Legionellales, andXanthomonadales (Fig. 5c). Chromatiales includes a groupof anaerobic bacteria, commonly known as purple sulfurbacteria, which are capable of photosynthesis by oxidizinghydrogen sulfide to sulfide and sulfate. Chromatiales arecommonly reported in anoxic lake sediments and in otheraquatic habitats including mangrove sediments and anoxicconditions are primary pre-requisites for their sulfur-photolithoautotrophy [32]. In contrary, members of the orderLegionellales are not commonly encountered in mangrovesediments and they comprised two families, Legionella andCoxiella, both are involved in human disease [33]. Abundanceof Legionellales in Sundarbans sediments clearly indicateshuman intervention in this ecosystem. Besides these ordersof Gammaproteobacteria, a number of sequences affiliated tothe orders Pseudomonadales , Enterobacteriales ,Methylococcales, Alteromonadales, Oceanospirillales, andThiotrichales were identified within the present dataset. Intheir study on Brazilian mangrove sediments, Dos Santoset al. [18] have shown that several orders within theGammaproteobacteria show major shift after oil contamina-tion. Especially, the order Chromatiales was shown to besensitive as it was dominant before oil contamination anddecreased significantly after oil contamination. WithinSundarbans sediments, however, we could see a constantdominance of the order Chromatiales in all three samplingstations with different history of anthropogenic activities
Fig. 5 Composition of different classes based on the classification of partial 16S rRNA sequences of Proteobacteria from Sundarbans sediment usingRDPII classifier (v 2.2). Deltaproteobacterial orders (a), Alphaproteobacterial orders (b), and Gammaproteobacteria orders (c)
Spatiotemporal Analysis of Bacterial Diversity

possibly confirming the fact that although oil and hydrocarboncontaminations are evident in Sundarbans, especially in sta-tions A and C, alteration of the abundance of an order requiresconsiderable concentration of those contaminants to be addedinto the Sundarbans mangrove sediment systems. Besides, norepresentatives of the orders Alteromonadales andOceanospirillales were detected in the present study. Thesegammaproteobacterial orders were shown byDos Santos et al.[18] to be dominant after oil contamination in the Brazilianmangrove sediment.
Alphaproteobacteria were dominated by the ordersRhodospirillales, Rhodobacterales, Rhizobiales, andSphingomonadales (Fig. 5b). Among the alphaproteobacterialorders, Rhodospirillales was the most abundant and recordedto be maximum in the monsoon dataset from stations A(71.7 %) and B (63.1 %). In general , the orderRhodospirillales is represented by two families, e.g., photo-synthetic non-sulfur Rhodospirillaceae and heterotrophicacetic acid synthesizer, Acetobacteraceae. BesidesRhodospirillales, Rhizobiales representing nitrogen fixingand symbiotic bacteria,Rhodobacterales representing primarycolonizer on the temperate ocean sediments and coastal watercolumns [34], and Sphingomonadales representing the aro-matic hydrocarbon-degrading bacteria [35] were the dominantalphaproteobacterial orders detected in all three stations inboth the seasons. Besides the dominant alphaproteobacterialorders, a number of sequences affiliated to the ordersCaulobacterales , Kordiimonadales , Rickettsiales ,Sneathiellales, and Kiloniellales were detected within thepresent dataset.
Betaproteobacterial sequences were dominated by the or-ders Burkholderiales and Rhodocyclales. In Sundarbans sedi-ment, members of the order Burkholderiales with diversefunctional attributes have been reported previously [12, 36].Most of the identifiedmembers of Rhodocyclales order includeorganisms that reside in aquatic habitat and prefer oligotrophicconditions. Besides these orders, Nitrosomonadales,Hydrogenophilales, Methylophilales, and Neisseriales werealso detected with the dataset.
Actinobacterial sequences were detected in all the threestations in both the seasons under study. Interestingly,actinobacterial sequences are more abundant in the subsurfacesamples in monsoon samples. This might be due to the ad-sorption of Actinobacteria to the mineral particle surface, andthe salinity in such micro-niches was lower than what wasmeasured for the subsurface sediment samples. However, thediversity was found lower at the surface confirming the eco-logical principle that more extreme environment, e.g., salinityin this case, affects the diversity of Actinobacteria. Further-more, during the monsoon season, an increased addition of thefreshwater/rain water through the major rivers in this areafurther reduces the local salinity in these sampling stations(approx. 12 PSU). The phylum Actinobacteriawas dominated
by orders Actinomycetales and Acidimicrobiales. Besides,members of the following orders were also detected in limitednumber with the sediment: Solirubrobacterales ,Rubrobacterales, Nitriliruptorales, Coriobacterales,Euzebyales, and Spaerobacterales. Actinomycetales wasfound highly abundant at the subsurface samples in the mon-soon season. Previous analyses on diversity of Actinobacteriain saline sediments revealed detection of Acidimicrobiales inlow-salinity sediments and absence in higher salinity sedimentsamples [37]. In Sundarbans sediment, the observed salinityremained in the lower side (12–20 PSU) possibly due to theaddition of continuous freshwater and this has further sug-gested the reason for domination of halo-tolerantAcidimicrobiales in this sediment. Previous culture-dependent analyses in Indian Sundarbans mangrove haveidentified and characterized several salt-tolerant antibacterialStreptomyces spp. [38].
Acidobacteria were found evenly distributed in all threesampling stations in both seasons. Previous studies haveshown that phylogenetic evenness for Acidobacteria largelydepends on the soil pH [39, 40]. The relative abundance wasshown strongly correlated with the soil pH, withAcidobacteria representing larger portion of soil bacterialcommunities at low pH soils. In Sundarbans sediments,pH remains nearly neutral and uniform throughout theyear (pH 7.3–7.8). This has further corroborated withthe findings of even distribution of Acidobacteria inthese sampling stations. In marine ecosystems, the abun-dance of Acidobacteria has been reported previously[22, 41]. In the Red Sea, for example, Acidobacteriawere reported in the middle and deep layers of coralreef sands where suboxic and anoxic conditions arebeing maintained [41]. Such findings not only supportedacidobacterial distribution in Sundarbans but also corre-lated well to the findings that the sediments of Sundarbansare suboxic in nature.
Representative sequences affiliated to candidate phylaPlanctomycetes, Bacteroidetes, Nitrospira, Chloroflexi,Cyanobacteria, and Firmicutes were ubiquitous in all threestations both at the surface and at subsurface levels of thesediments. Planctomycetes sequences were represented byclasses Phycisphaerae and Planctomycetacia. Bacteroidetessequences were dominated by the members of the classesFlavobacteria and Sphingobacteria, which corroborate wellwith our previous culture-independent capillary sequencing-based analysis of the bacterial population in these three sta-tions [communicated]. Among the Firmicutes, Bacilli, andClostridia orders were dominating in all the stations.Chloroflexi and Nitrospira sequences were dominated byorders Anaerolineae and Nitrospira, respectively. Only a fewcyanobacterial sequences were detected in each of these sam-pling stations, and most importantly, we could not assigncyanobacterial sequences below the phylum level.
P. Basak et al.

The number of sequence reads related to candidate divi-sions TM7, WS3, OD1, OP11, and BRC1 was detected in thesediment samples from both seasons. To date, no cultivatedrepresentatives exist representing either TM7, WS3, or OD1candidate divisions. Thus far, no distinct ecological attributehas been assigned to members of the candidate division TM7that are commonly found in a wide range of environments,including terrestrial (rhizosphere, soils, and peat bog) andaquatic (groundwater, freshwater, sea water, and deep-seasediments) habitats [42]. Members of the candidate divisionWS3 were detected only in the methanogenic environments[43] and OD1 division is widespread in environments domi-nated by sulfur, such as marine environments and sulfureta[42]. OP11 division is commonly detected in terrestrial andmarine environments, and recent partial genome sequencinganalysis of one of the members belonging to this divisionrevealed several eco-physiological aspects in this candidatedivision [44, 45]. Candidate division BRC1 was originallydetected in extreme, low-diversity environments, and the eco-logical role of this candidate division is still yet to beunraveled [42].
Conclusion
This is the first 16S rRNA gene amplicon sequencing analysisof microbial diversity of Sundarbans, the unique tiger landmangrove of the world in the backdrop of climate change. Themassive parallel 454 amplicon sequencing of 12 samples ofthe surface and subsurface sediments and data analysisunraveled the complexity of the bacterial diversity in thesediment samples. Furthermore, detected diversity of the bac-terial community composition has clearly provided novelinsights into the ongoing biogeochemical processes associatedwith the regular deposition of sediment in this coastal man-grove. Moreover, this study also unfolds the bacterial com-munity structure during seasonal changes between permanent-ly inundated sediments and sediments submitted to seasonaldewatering. To this end, an increased understanding of micro-bial community variation with respect to seasonal changesrather raise the questions of whether this observed composi-tion changes during monsoon and post-monsoon would con-fer a better resistance to the subsequent drying stress formicrobial communities in seasonally dewatered sediments orsuch changes reflected an alteration of microbial structurewith respect to changes in the biogeochemical cycling ofnutrients. Further analyses, however, are essential for betterunderstanding of the sediment biogeochemical cycles andtheir relationship to the microbial community pattern in thesediment. This work is also important in building a databaseand an understanding of how microbial communities varygeographically and with anthropogenic intervention.
Acknowledgments The authors would like to acknowledge the instru-ment facility provided by UGC-CAS, DST–FIST, DBT-IPLS, WorldBank, ICZM project in the Department of Biochemistry, University ofCalcutta, India. We acknowledge Mr. Tapas Paul, World Bank, for hiscontinuous support and enthusiasm regarding our study in Sundarbans.The expenditure of this work and the research fellowships of P.B., S.N.,A.B..., D.R., A.C., and R.P. were supported by the ICZM project, WorldBank. A.G. was supported by Ramanujan Fellowship from the Depart-ment of Science and Technology, India (SR/S2/RJN-106/2012). Theauthors thank Ms. Anwesha Haldar, Department of Geography, Univer-sity of Calcutta, for making a working map of the study sites inSundarbans.
References
1. Schmitt S, Tsai P, Bell J, Fromont J, Ilan M, Lindquist N, Perez T,Rodrigo A, Schupp PJ, Vacelet J, Webster N, Hentschel U, TaylorMW (2012) Assessing the complex spongemicrobiota: core, variableand species-specific bacterial communities in marine sponges. ISMEJ 6:564–576
2. Godoy-Vitorino F, Goldfarb KC, Karaoz U, Leal S, Garcia-AmadoMA, Hugenholtz P, Tringe SG, Brodie EL, Dominguez-Bello MG(2012) Comparative analyses of foregut and hindgut bacterial com-munities in hoatzins and cows. ISME J 6:531–541
3. Sogin ML, Morrison HG, Huber JA, Mark Welch D, Huse SM, NealPR, Arrieta JM, Herndl GJ (2006) Microbial diversity in the deep seaand the underexplored “rare biosphere”. Proc Natl Acad Sci U S A103:12115–12120
4. Gomes NC, Cleary DF, Calado R, Costa R (2011) Mangrove bacte-rial richness. Commun Integr Biol 4:419–423
5. Alongi DM (1988) Bacterial productivity and microbial biomass intropical mangrove sediments. Microb Ecol 15:59–79
6. Holguin G, Gonzalez-Zamorano P, De-Bashan LE, Mendoza R,Amador E, Bashan Y (2006)Mangrove health in an arid environmentencroached by urban development—a case study. Sci Total Environ363:260–274
7. Duke NC, Meynecke JO, Dittmann S, Ellison AM, Anger K, BergerU, Cannicci S, Diele K, Ewel KC, Field CD, Koedam N, Lee SY,Marchand C, Nordhaus I, Dahdouh-Guebas F (2007) Aworld with-out mangroves? Science 317:41–42
8. Bouchez A, Pascault N, Chardon C, Bouvy M, Cecchi P, Lambs L,Herteman M, Fromard F, Got P, Leboulanger C (2013) Mangrovemicrobial diversity and the impact of trophic contamination. MarPollut Bull 66:39–46
9. Feller IC, Lovelock CE, Berger U, McKee KL, Joye SB, Ball MC(2010) Biocomplexity in mangrove ecosystems. Ann RevMar Sci 2:395–417
10. Giri C, Ochieng E, Tieszen LL, Zhu Z, Singh A, Loveland T, MasekJ, Duke N (2011) Status and distribution of mangrove forests of theworld using earth observation satellite data. Glob Ecol Biogeogr 20:154–159
11. Gomes NC, Flocco CG, Costa R, Junca H, Vilchez R, Pieper DH,Krogerrecklenfort E, Paranhos R, Mendonca-Hagler LC, Smalla K(2010)Mangrove microniches determine the structural and functionaldiversity of enriched petroleum hydrocarbon-degrading consortia.FEMS Microbiol Ecol 74:276–290
12. Ghosh A, Dey N, Bera A, Tiwari A, Sathyaniranjan K, ChakrabartiK, Chattopadhyay D (2010) Culture independent molecular analysisof bacterial communities in the mangrove sediment of Sundarban,India. Saline Syst 6:1
13. Yan B, Hong K, Yu ZN (2006) Archaeal communities in mangrovesoil characterized by 16S rRNA gene clones. JMicrobiol 44:566–571
Spatiotemporal Analysis of Bacterial Diversity

14. Taketani RG, Yoshiura CA, Dias AC, Andreote FD, Tsai SM (2010)Diversity and identification of methanogenic archaea and sulphate-reducing bacteria in sediments from a pristine tropical mangrove.Antonie Van Leeuwenhoek 97:401–411
15. Dias AC, Pereira Silva Mde EC, Cotta SR, Dini-Andreote F, SoaresFL Jr, Salles JF, Azevedo JL, Van Elsas JD, Andreote FD (2012)Abundance and genetic diversity of nifH gene sequences in anthro-pogenically affected Brazilian mangrove sediments. Appl EnvironMicrobiol 78:7960–7967
16. Zhang Y, Dong J, Yang Z, Zhang S, Wang Y (2008) Phylogeneticdiversity of nitrogen-fixing bacteria in mangrove sediments assessedby PCR-denaturing gradient gel electrophoresis. ArchMicrobiol 190:19–28
17. Marcial Gomes NC, Borges LR, Paranhos R, Pinto FN, Mendonca-Hagler LC, Smalla K (2008) Exploring the diversity of bacterialcommunities in sediments of urban mangrove forests. FEMSMicrobiol Ecol 66:96–109
18. Dos Santos HF, Cury JC, Do Carmo FL, Dos Santos AL, Tiedje J,Van Elsas JD, Rosado AS, Peixoto RS (2011) Mangrove bacterialdiversity and the impact of oil contamination revealed by pyrose-quencing: bacterial proxies for oil pollution. PLoS ONE 6:e16943
19. Peixoto R, Chaer GM, Carmo FL, Araujo FV, Paes JE, Volpon A,Santiago GA, Rosado AS (2011) Bacterial communities reflect thespatial variation in pollutant levels in Brazilian mangrove sediment.Antonie Van Leeuwenhoek 99:341–354
20. Taketani RG, Franco NO, RosadoAS, van Elsas JD (2010)Microbialcommunity response to a simulated hydrocarbon spill in mangrovesediments. J Microbiol 48:7–15
21. Brito EM, Guyoneaud R, Goni-Urriza M, Ranchou-Peyruse A,Verbaere A, Crapez MA, Wasserman JC, Duran R (2006)Characterization of hydrocarbonoclastic bacterial communities frommangrove sediments in Guanabara Bay, Brazil. Res Microbiol 157:752–762
22. Andreote FD, Jimenez DJ, Chaves D, Dias AC, Luvizotto DM, Dini-Andreote F, Fasanella CC, Lopez MV, Baena S, Taketani RG, deMelo IS (2012) The microbiome of Brazilian mangrove sediments asrevealed by metagenomics. PLoS ONE 7:e38600
23. Gilbert JA, Meyer F, Bailey MJ (2011) The future of microbialmetagenomics (or is ignorance bliss?). ISME J 5:777–779
24. Manna S, Chaudhuri K, Bhattacharyya S, Bhattacharyya M (2010)Dynamics of Sundarban estuarine ecosystem: eutrophication inducedthreat to mangroves. Saline Syst 6:8
25. Nelson DW, Somers LE (1975) Organic carbon. Academic, London26. Black CA (1965) Methods of soil analysis. American Society of
Agronomy, Wisconsin, USA27. Knudsen M (1901) Hydrographical tables. G.E.C, Gad Copenhagen28. Knap A, Michaels A, Close A, Ducklow H, Dickson A (eds.) (1996)
Protocols for the Joint global ocean flux study (jgofs) coremeasurements
29. Schloss PD, Westcott SL, Ryabin T, Hall JR, Hartmann M, HollisterEB, Lesniewski RA, Oakley BB, Parks DH, Robinson CJ, Sahl JW,Stres B, Thallinger GG, Van Horn DJ, Weber CF (2009) Introducingmothur: open-source, platform-independent, community-supportedsoftware for describing and comparing microbial communities.Appl Environ Microbiol 75:7537–7541
30. Hammer Ø, Harper DAT, Ryan PD (2001) PAST: paleontologicalstatistics software package for education and data analysis.Palaeontol Electron 4:9
31. Clark M (1998) Redox stratification and heavy metal partitioning inAvicennia-dominated mangrove sediments: a geochemical model.Chem Geol 149:147–171
32. Proctor LM (1997) Nitrogen-fixing, photosynthetic, anaerobic bac-teria associated with pelagic copepods. Aquat Microb Ecol 12:105–113
33. Sauer JD, Shannon JG, Howe D, Hayes SF, Swanson MS, HeinzenRA (2005) Specificity of Legionella pneumophila and Coxiellaburnetii vacuoles and versatility of Legionella pneumophila revealedby coinfection. Infect Immun 73:4494–4504
34. Dang H, Li T, Chen M, Huang G (2007) Cross-ocean distribution ofRhodobacterales bacteria as primary surface colonizers in temperatecoastal marine waters. Appl Environ Microbiol 74:52–60
35. Liang Q, Lloyd-Jones G (2010) Sphingobium scionense sp. nov., anaromatic hydrocarbon-degrading bacterium isolated from contami-nated sawmill soil. Int J Syst Evol Microbiol 60:413–416
36. Barua S, Tripathi S, Chakraborty A, Ghosh S, Chakrabarti K (2012)Characterization and crop production efficiency of diazotrophic bac-terial isolates from coastal saline soils. Microbiol Res 167:95–102
37. Wu J, Guan T, Jiang H, Zhi X, Tang S, Dong H, Zhang L, Li W(2009) Diversity of Actinobacterial community in saline sedimentsfrom Yunnan and Xinjiang, China. Extremophiles 13:623–632
38. Arumugam M, Mitra A, Pramanik A, Saha M, Gachhui R,Mukherjee J (2010) Streptomyces Sundarbansensis sp. nov., anactinomycete that produces 2-allyloxyphenol. Int J Syst EvolMicrobiol 61:2664–2669
39. Dunbar J, Takala S, Barns SM, Davis JA, Kuske CR (1999) Levels ofbacterial community diversity in four arid soils compared by cultiva-tion and 16S rRNA gene cloning. Appl Environ Microbiol 65:1662–1669
40. Lauber CL, Hamady M, Knight R, Fierer N (2009) Pyrosequencing-based assessment of soil pH as a predictor of soil bacterial communitystructure at the continental scale. Appl Environ Microbiol 75:5111–5120
41. Schottner S, Pfitzner B, Grunke S, Rasheed M, Wild C, Ramette A(2011) Drivers of bacterial diversity dynamics in permeable carbon-ate and silicate coral reef sands from the Red Sea. Environ Microbiol13:1815–1826
42. Bolhuis H, Stal LJ (2011) Analysis of bacterial and archaeal diversityin coastal microbial mats using massive parallel 16S rRNA gene tagsequencing. ISME J 5:1701–1712
43. Derakshani M, Lukow T, Liesack W (2001) Novel bacterial lineagesat the (sub)division level as detected by signature nucleotide-targetedrecovery of 16S rRNA genes from bulk soil and rice roots of floodedrice microcosms. Appl Environ Microbiol 67:623–631
44. Harris JK, Kelley ST, Pace NR (2004) New perspective on uncul-tured bacterial phylogenetic division OP11. Appl Environ Microbiol70:845–849
45. Youssef NH, Blainey PC, Quake SR, Elshahed MS (2011) Partialgenome assembly for a candidate division OP11 single cell from ananoxic spring (Zodletone Spring, Oklahoma). Appl EnvironMicrobiol 77:7804–7814
P. Basak et al.
Related Documents