Spatial Modelling of Soil-Transmitted Helminth Infections in Kenya: A Disease Control Planning Tool Rachel L. Pullan 1 *, Peter W. Gething 2 , Jennifer L. Smith 1 , Charles S. Mwandawiro 3 , Hugh J. W. Sturrock 1 , Caroline W. Gitonga 4 , Simon I. Hay 2 , Simon Brooker 1,4 1 Department of Infectious and Tropical Diseases, London School of Hygiene and Tropical Medicine, London, United Kingdom, 2 Spatial Ecology and Epidemiology Group, Department of Zoology, University of Oxford, Oxford, United Kingdom, 3 Kenya Medical Research Institute (KEMRI), Nairobi, Kenya, 4 KEMRI-Wellcome Trust Research Programme, Nairobi, Kenya Abstract Background: Implementation of control of parasitic diseases requires accurate, contemporary maps that provide intervention recommendations at policy-relevant spatial scales. To guide control of soil transmitted helminths (STHs), maps are required of the combined prevalence of infection, indicating where this prevalence exceeds an intervention threshold of 20%. Here we present a new approach for mapping the observed prevalence of STHs, using the example of Kenya in 2009. Methods and Findings: Observed prevalence data for hookworm, Ascaris lumbricoides and Trichuris trichiura were assembled for 106,370 individuals from 945 cross-sectional surveys undertaken between 1974 and 2009. Ecological and climatic covariates were extracted from high-resolution satellite data and matched to survey locations. Bayesian space-time geostatistical models were developed for each species, and were used to interpolate the probability that infection prevalence exceeded the 20% threshold across the country for both 1989 and 2009. Maps for each species were integrated to estimate combined STH prevalence using the law of total probability and incorporating a correction factor to adjust for associations between species. Population census data were combined with risk models and projected to estimate the population at risk and requiring treatment in 2009. In most areas for 2009, there was high certainty that endemicity was below the 20% threshold, with areas of endemicity $20% located around the shores of Lake Victoria and on the coast. Comparison of the predicted distributions for 1989 and 2009 show how observed STH prevalence has gradually decreased over time. The model estimated that a total of 2.8 million school-age children live in districts which warrant mass treatment. Conclusions: Bayesian space-time geostatistical models can be used to reliably estimate the combined observed prevalence of STH and suggest that a quarter of Kenya’s school-aged children live in areas of high prevalence and warrant mass treatment. As control is successful in reducing infection levels, updated models can be used to refine decision making in helminth control. Citation: Pullan RL, Gething PW, Smith JL, Mwandawiro CS, Sturrock HJW, et al. (2011) Spatial Modelling of Soil-Transmitted Helminth Infections in Kenya: A Disease Control Planning Tool. PLoS Negl Trop Dis 5(2): e958. doi:10.1371/journal.pntd.0000958 Editor: Giovanna Raso, Centre Suisse de Recherches Scientifiques, Co ˆ te d’Ivoire Received July 28, 2010; Accepted January 7, 2011; Published February 8, 2011 Copyright: ß 2011 Pullan et al. This is an open-access article distributed under the terms of the Creative Commons Attribution License, which permits unrestricted use, distribution, and reproduction in any medium, provided the original author and source are credited. Funding: RLP is supported by the Partnership for Child Development, Imperial College, UK, who, together with Deworm the World, principally fund the Global Atlas of Helminth Infection (GAHI, www.thiswormyworld.org). SB is supported by a Research Career Development Fellowship (#081673) from the Wellcome Trust, which also supports the GAHI. JLS is supported by the International Trachoma Initiative to develop a Global Atlas of Trachoma. SIH is funded by a Senior Research Fellowship from the Wellcome Trust (#079091), which also supports PWG. HS is supported by a London School of Hygiene and Tropical Medicine Graduate Teaching Assistantship. This work forms part of the output of the Malaria Atlas Project (MAP, www.map.ox.ac.uk), principally funded by the Wellcome Trust, UK. The funders had no role in the study design, data collection and analysis or preparation of the manuscript. Competing Interests: The authors have declared that no competing interests exist. * E-mail: [email protected] Introduction In Africa, an increasing number of countries are implementing national treatment programmes for the control of soil-transmitted helminths (STH). The main strategy of these programmes is the delivery of deworming through the public school system, which has been demonstrated as a cost-effective way to reduce infection and morbidity of STH and improve educational outcomes [1–4]. There have also been moves to integrate mass drug administration (MDA) for STH and schistosomiasis with other neglected tropical diseases (NTDs), including lymphatic filariasis (LF) and onchocer- ciasis [5,6]. Whatever the implementation approach, governments need to target treatment appropriately, based on reliable and up- to-date information on the geographical distribution of infection [7]. The ability to map the distribution of STHs has been greatly enhanced in recent years by the use of geographical information systems, remote sensing and spatial statistics [8,9]. Recent work has increasingly employed a Bayesian geostatistical modelling approach, which provides a flexible and powerful tool for risk mapping, enabling investigation of spatial heterogeneity, environ- mental predictors and associated uncertainties. To date, Bayesian geostatistics has been used to predict spatial patterns for a number of NTDs, including STH [10–12], schistosomiasis [13–15], Loa loa [16] and LF [17], facilitating prediction of infection prevalence in unsurveyed areas, targeting of large-scale control programmes and prioritisation of future data collection. Whilst the derived risk maps www.plosntds.org 1 February 2011 | Volume 5 | Issue 2 | e958

Welcome message from author
This document is posted to help you gain knowledge. Please leave a comment to let me know what you think about it! Share it to your friends and learn new things together.
Transcript
Spatial Modelling of Soil-Transmitted HelminthInfections in Kenya: A Disease Control Planning ToolRachel L. Pullan1*, Peter W. Gething2, Jennifer L. Smith1, Charles S. Mwandawiro3, Hugh J. W. Sturrock1,
Caroline W. Gitonga4, Simon I. Hay2, Simon Brooker1,4
1 Department of Infectious and Tropical Diseases, London School of Hygiene and Tropical Medicine, London, United Kingdom, 2 Spatial Ecology and Epidemiology Group,
Department of Zoology, University of Oxford, Oxford, United Kingdom, 3 Kenya Medical Research Institute (KEMRI), Nairobi, Kenya, 4 KEMRI-Wellcome Trust Research
Programme, Nairobi, Kenya
Abstract
Background: Implementation of control of parasitic diseases requires accurate, contemporary maps that provideintervention recommendations at policy-relevant spatial scales. To guide control of soil transmitted helminths (STHs), mapsare required of the combined prevalence of infection, indicating where this prevalence exceeds an intervention threshold of20%. Here we present a new approach for mapping the observed prevalence of STHs, using the example of Kenya in 2009.
Methods and Findings: Observed prevalence data for hookworm, Ascaris lumbricoides and Trichuris trichiura wereassembled for 106,370 individuals from 945 cross-sectional surveys undertaken between 1974 and 2009. Ecological andclimatic covariates were extracted from high-resolution satellite data and matched to survey locations. Bayesian space-timegeostatistical models were developed for each species, and were used to interpolate the probability that infectionprevalence exceeded the 20% threshold across the country for both 1989 and 2009. Maps for each species were integratedto estimate combined STH prevalence using the law of total probability and incorporating a correction factor to adjust forassociations between species. Population census data were combined with risk models and projected to estimate thepopulation at risk and requiring treatment in 2009. In most areas for 2009, there was high certainty that endemicity wasbelow the 20% threshold, with areas of endemicity $20% located around the shores of Lake Victoria and on the coast.Comparison of the predicted distributions for 1989 and 2009 show how observed STH prevalence has gradually decreasedover time. The model estimated that a total of 2.8 million school-age children live in districts which warrant mass treatment.
Conclusions: Bayesian space-time geostatistical models can be used to reliably estimate the combined observed prevalenceof STH and suggest that a quarter of Kenya’s school-aged children live in areas of high prevalence and warrant masstreatment. As control is successful in reducing infection levels, updated models can be used to refine decision making inhelminth control.
Citation: Pullan RL, Gething PW, Smith JL, Mwandawiro CS, Sturrock HJW, et al. (2011) Spatial Modelling of Soil-Transmitted Helminth Infections in Kenya: ADisease Control Planning Tool. PLoS Negl Trop Dis 5(2): e958. doi:10.1371/journal.pntd.0000958
Editor: Giovanna Raso, Centre Suisse de Recherches Scientifiques, Cote d’Ivoire
Received July 28, 2010; Accepted January 7, 2011; Published February 8, 2011
Copyright: � 2011 Pullan et al. This is an open-access article distributed under the terms of the Creative Commons Attribution License, which permitsunrestricted use, distribution, and reproduction in any medium, provided the original author and source are credited.
Funding: RLP is supported by the Partnership for Child Development, Imperial College, UK, who, together with Deworm the World, principally fund the GlobalAtlas of Helminth Infection (GAHI, www.thiswormyworld.org). SB is supported by a Research Career Development Fellowship (#081673) from the Wellcome Trust,which also supports the GAHI. JLS is supported by the International Trachoma Initiative to develop a Global Atlas of Trachoma. SIH is funded by a Senior ResearchFellowship from the Wellcome Trust (#079091), which also supports PWG. HS is supported by a London School of Hygiene and Tropical Medicine GraduateTeaching Assistantship. This work forms part of the output of the Malaria Atlas Project (MAP, www.map.ox.ac.uk), principally funded by the Wellcome Trust, UK.The funders had no role in the study design, data collection and analysis or preparation of the manuscript.
Competing Interests: The authors have declared that no competing interests exist.
* E-mail: [email protected]
Introduction
In Africa, an increasing number of countries are implementing
national treatment programmes for the control of soil-transmitted
helminths (STH). The main strategy of these programmes is the
delivery of deworming through the public school system, which
has been demonstrated as a cost-effective way to reduce infection
and morbidity of STH and improve educational outcomes [1–4].
There have also been moves to integrate mass drug administration
(MDA) for STH and schistosomiasis with other neglected tropical
diseases (NTDs), including lymphatic filariasis (LF) and onchocer-
ciasis [5,6]. Whatever the implementation approach, governments
need to target treatment appropriately, based on reliable and up-
to-date information on the geographical distribution of infection
[7]. The ability to map the distribution of STHs has been greatly
enhanced in recent years by the use of geographical information
systems, remote sensing and spatial statistics [8,9]. Recent work
has increasingly employed a Bayesian geostatistical modelling
approach, which provides a flexible and powerful tool for risk
mapping, enabling investigation of spatial heterogeneity, environ-
mental predictors and associated uncertainties. To date, Bayesian
geostatistics has been used to predict spatial patterns for a number
of NTDs, including STH [10–12], schistosomiasis [13–15], Loa loa
[16] and LF [17], facilitating prediction of infection prevalence in
unsurveyed areas, targeting of large-scale control programmes and
prioritisation of future data collection. Whilst the derived risk maps
www.plosntds.org 1 February 2011 | Volume 5 | Issue 2 | e958
are statistically appealing, their uptake by managers of national
control programmes could be improved. This is in part due to
difficulty in interpreting these continuous, species-specific maps
and translating them into practical guidance for STH control at
district levels, which is defined on the basis of combined
prevalence of any STH species. Furthermore, the extent to which
models can be extrapolated temporally remains unclear [13,18].
This is particularly relevant when decision makers need to rely on
historic data to implement control in a rapidly changing
epidemiological context, due to both general improvements in
socio-economic and sanitary conditions and previous deworming
efforts.
In this study, we use the largest assembly of contemporary
empirical evidence for STH in any country in Africa to map the
observed prevalence of STH across Kenya using a space-time
model based geostatistical approach, and estimate the spatially-
varying probability that mass treatment is warranted. The
resulting models are used to calculate the school-aged population
at risk of infection and requiring MDA in Kenya.
Methods
Analysis outlineThe objective of these analyses was to determine the spatial
distribution of observed prevalence of STH infection in Kenya.
Data on the observed prevalence of hookworm, Ascaris lumbricoides
and Trichuris trichiura spanning 34 years were collated using search
principles and criteria outlined below, in order to create a robustly
geo-located dataset of helminth surveys. This database was used to
produce a continuous predictive surface of combined observed
STH prevalence adopting a Bayesian space-time geostatistics
approach, adjusting for environmental covariates; no spatial
prediction was made for areas masked as environmentally
unsuitable for STH transmission (maximum land surface temper-
ature (LST) .40uC). The resulting models were used to
interpolate the probability across Kenya that combined observed
STH prevalence is greater than 20%, the threshold recommended
by the World Health Organization (WHO) as indicating the need
for targeted MDA [19]. Validation procedures were implemented
to assess the accuracy of endemicity predictions. Finally, the total
population at risk of STH infection was extracted by district in
order to guide targeted intervention strategies.
Data sourcesData on the prevalence of infection in Kenya were abstracted
from an ongoing project to develop a Global Atlas of Helminth
Infection (www.thiswormyworld.org; [7]). For this project, survey
data are identified through structured searches of electronic
bibliographic databases, complemented with manual searches of
local archives and libraries and direct contact with researchers. A
manual search of archives of the Division of Vector Borne and
Neglected Tropical Diseases of the Kenya Ministry of Public
Health and Sanitation in Nairobi proved a particularly useful
source of information. References from identified publications
were checked for additional surveys. Estimates of infection
prevalence were included according to pre-defined criteria: only
cross-sectional prevalence surveys were included; data were
excluded if based on hospital or clinic surveys, post-intervention
surveys, or surveys among sub-populations, such as among
refugees, prisoners or nomads. For data from clinical trials or
cohort studies, only baseline, pre-intervention estimates of
prevalence were included. In instances where multiple surveys
from the same location were conducted at different times, each
survey was included. Abstracted data included details on the
source of the data, date and location of survey, characteristics of
the surveyed population, survey methodology, method of diagno-
sis, age range of sampled individuals, and the number of
individuals examined and the number positive with hookworm,
A. lumbricoides and T. trichiura. Authors of published data were
contacted if relevant information was unclear from the original
reports. For the current analysis, survey data were collected
between 1974 and 2009.
The longitude and latitude of each survey were determined
using a combination of resources including a national schools
database developed by the Ministry of Education in 2008 using
geographical positioning systems (GPS); a village database digitised
from topographical maps in 2002 by the International Livestock
Research Institute in Nairobi; a range of electronic gazetteers (see
Brooker et al. [7]); and contact with authors who used GPS.
Estimating combined prevalence of any STHSurvey reports typically provide proportions infected with
individual worm species, and rarely give data on the combined
proportion infected with any STH species, although it is the
prevalence of infection with any STH species (i.e. combined
prevalence of all STH) that is important when making decisions
about effective targeting for treatment. Therefore, combined STH
prevalence was calculated using a simple probabilistic model,
incorporating a small correction factor to allow for non-
independence between species, following the approach of de Silva
and Hall [20]. In brief, when assuming the probability of infection
with one species to be independent of infection with others, the
combined probability of having at least one infection is the simple
probability law for the union between three elements: PHAT = H +A + T 2 (HA) 2 (AT) 2 (HT) + (HAT) where PHAT is the com-
bined STH prevalence, H is the prevalence of hookworm
infection, A the prevalence of A. lumbricoides and T the prevalence
of T. trichiura. Previous analysis of 60 datasets from 20 countries by
de Silva and Hall suggests that, due to non-independence,
overestimation of combined STH prevalence using simple
probability increases by 0.6% for every 10% increase in
Author Summary
Effective targeting of mass drug administration for thetreatment of soil-transmitted helminths (STH) requiresreliable, up-to-date maps that indicate where prevalenceexceeds the 20% intervention threshold recommended bythe World Health Organization. We present a newapproach for mapping the prevalence of STH in Kenya,incorporating observed prevalence data from 945 cross-sectional surveys undertaken between 1974 and 2009. Thedistribution of each species was modelled using model-based geostatistics; models included information onenvironmental factors, the spatial distribution of existingsurveys and when these surveys were conducted. Result-ing risk maps were combined and linked with populationdata enabling estimation of the population at risk of anySTH infection and requiring treatment in 2009. In mostareas, there was high certainty that combined STHprevalence was below the 20% intervention threshold,with areas of high prevalence located around the shores ofLake Victoria and on the coast. Results also suggest thatobserved prevalence decreased over time and emphasisethe importance of continued surveillance in areas whereobserved prevalence was historically high. We show howspatial modelling can be used to develop up-to-date mapsof STH risk to help improve the precision of decisionmaking in disease control.
Mapping Soil Transmitted Helminths in Kenya
www.plosntds.org 2 February 2011 | Volume 5 | Issue 2 | e958
prevalence [20]. The true combined observed prevalence of STH
can therefore be estimated as PHAT 4 1.06. This correction factor
was thus incorporated into the estimation of combined observed
prevalence of STH. This approach to estimating combined
prevalence is used, both when presenting observed prevalence
data and when using species specific models to develop spatial
models of combined observed prevalence, as explained below.
Ecological and climatic covariates and limits oftransmission
A set of ecological and climatic covariates were assembled from
a variety of sources, as described elsewhere [21]. Monthly average
LST and precipitation at 30-arcsec (,1 km) resolution were
downloaded from the WorldClim website [22]. These were
produced from global weather station temperature records
gathered from a variety of sources for the period 1950–2000
and interpolated using a thin-plate smoothing spline algorithm
[23]. Enhanced vegetation index (EVI; a measure of vegetation
density) for 2001–2005 were obtained from the Moderate
Resolution Imaging Spectroradiometer (MODIS) [24], and
elevation was obtained from an interpolated digital elevation
model from the Global Land Information System of the United
States Geological Survey ((http://edcwww.cr.usgs.gov/landdaac/
gtopo30/). Distance to permanent water bodies was derived in
ArcMap 9.2 from an electronic map obtained from the World
Wildlife Fund (Global 200 Ecoregions data [25]). Maximum LST,
elevation and precipitation were standardised to optimise sampling
during Markov Chain Monte Carlo (MCMC) simulation by
subtracting the arithmetic mean and dividing by the standard
deviation.
These ecological and climatic data, along with results from
previous studies, were used to define the spatial limits for the
transmission of STH. Specifically, it has been shown experimen-
tally that the development of free-living infectious stages of A.
lumbricoides and T. trichiura ceases at 38uC and hookworm at 40uC[26–29]. This is supported by an observed relationship between
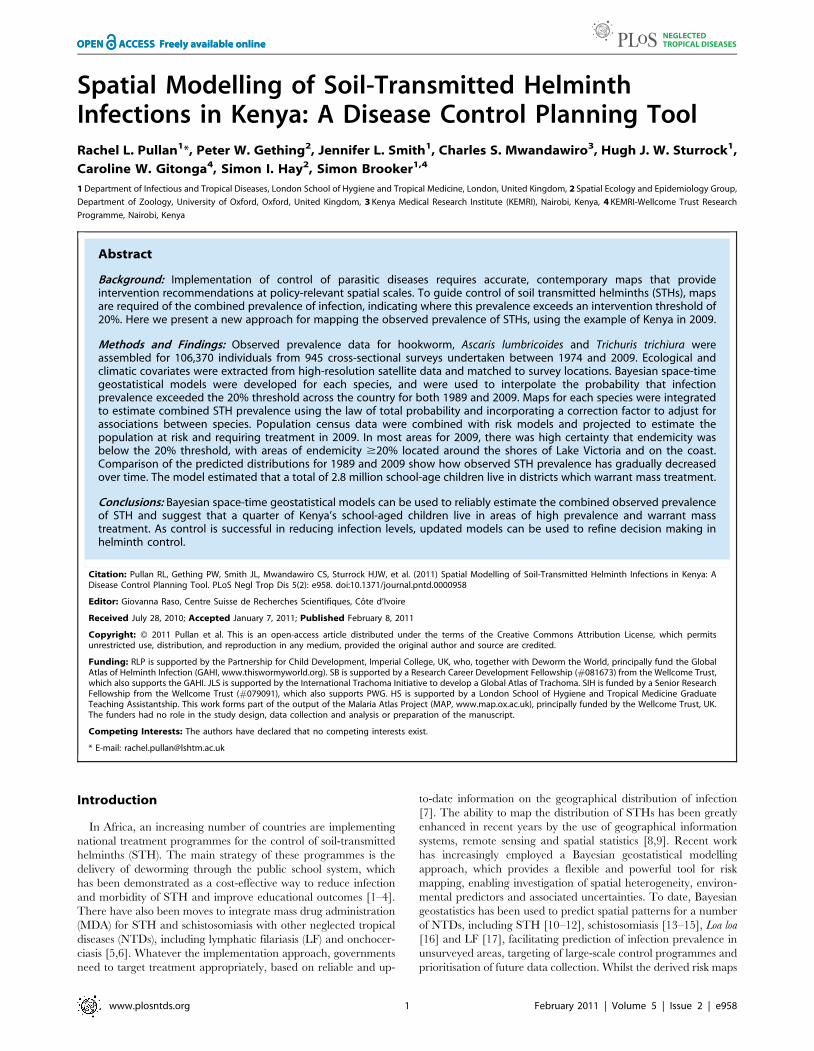
prevalence across sub-Saharan Africa and maximum LST, shown
in Figure 1. On this basis, using monthly LST at 30–arcsec
(,1 km) spatial resolution [22], areas were masked as unsuitable
for STH transmission where maximum LST .40uC. No spatial
prediction was subsequently made for such areas.
Bayesian space-time modelling approachPrevalence of hookworm, A. lumbricoides and T. trichiura were
modelled separately. Variable selection from abstracted survey
covariates (age range of sampled individuals, method of diagnosis)
and environmental covariates was performed using fixed-effects
grouped logistic regression models in Stata/SE 10.0 (StataCorp,
College Station, TX, USA) with backwards elimination. Bayesian
space time multivariable models were subsequently developed in
WinBUGs version 1.4 (MRC Biostatistics Unit, Cambridge and
Imperial College London, UK) (see Text S1). The number of
examined and egg-positive individuals for each species at each
survey location were modelled as binomial variates (i.e. grouped
hierarchical logistic regression), conditional on a vector of fixed
environmental covariate effects as described above and a
geostatistical random effect that modelled spatial correlation using
an isotropic, stationary exponential decay function [30]. To
capture changes in prevalence over time, a temporal first-order
autoregressive function was also included, under the assumption
that fitted temporal correlation exists only with the preceding year
[18,31].
Spatial predictionPredictions of infection prevalence were made on a 0.160.1
decimal degree (approx 11611 km at the equator) grid covering
Kenya, at every point considered suitable for STH transmission
(i.e. maximum LST ,40uC). Prediction was performed in
WinBUGs using the spatial.unipred command, which implements
an interpolation function (krigging) for the spatial random effect.
Kato-Katz is the WHO recommended diagnostic for surveillance
of STH infections [32,33], and mass drug administration is
targeted at school-aged children [16]. Thus, models were coded so
that the predictive surfaces represented school-based surveys using
the Kato-Katz technique for diagnosis. Predicted prevalence at
each realisation was calculated for two years (1989, 2009), chosen
to provide both a historical and contemporary representation of
infection levels. Prediction was carried out by adding the
interpolated geostatistical random effect and the temporal random
effect corresponding with the year of interest to the sum of the
products of the covariate coefficients and the values of the
covariates at each prediction location. The overall sum was then
back transformed from the logit scale to the prevalence scale.
Prevalence of STH at each realisation was estimated using the
probabilistic model given above, producing a posterior probability
distribution for combined STH at each prediction location.
Probability contour maps were subsequently developed by
calculating the observed proportion of the STH posterior
probability distribution at each prediction location that exceeded
WHO policy intervention thresholds (20% and 50% prevalence)
[16]. Prediction locations were classified as endemic if the
probability that observed STH prevalence exceeded 20% (the
MDA once-yearly intervention threshold) was .0.5 (i.e. this was
the most likely category). These locations were further classified as
hyper-endemic if the probability that observed STH prevalence
exceeded 50% (the MDA twice-yearly intervention threshold) was
.0.5. Digital administration level 2 (district) boundaries and a
population distribution map of Kenya (adjusted population counts
for the year 2000 projected to 2009 by applying the national,
medium variant, inter-censal growth rates, as previously described
[34], at 5 km2 resolution) were overlaid on the endemicity-class
surface to determine the proportion of the district population
living in each endemicity class. Districts were defined as MDA
Figure 1. Relationship between mean land surface temperature(LST) and prevalence of soil-transmitted helminth infection.LST estimated from global weather station temperature records,Estimates are derived from 3,714 spatially unique cross-sectional surveylocations across sub-Saharan Africa, provided by the Global Atlas ofHelminth Infection (www.thiswormyworld.org). Error bars show thestandard error of the mean.doi:10.1371/journal.pntd.0000958.g001
Mapping Soil Transmitted Helminths in Kenya
www.plosntds.org 3 February 2011 | Volume 5 | Issue 2 | e958
intervention districts if over 33% of the population were in
endemic (once-yearly MDA) or hyperendemic (twice yearly MDA)
endemicity classes. This cut-off was chosen post-estimation as the
level that ensures treatment of .80% of the population predicted
as exceeding the 20% prevalence threshold. The proportion of the
Kenyan population of school-going age (5–14 years) was estimated
as 0.26, based on the World Population Prospects: 2008 Revision
Population Database (http://esa.un.org/unpp/index.asp?panel = 3;
accessed 11th May 2010) and the number of treatments needed
estimated using a primary-school net enrolment rate of 0.815 (http://
data.worldbank.org/indicator/SE.PRM.NENR; accessed 11th May
2010; [35]).
Model validationModel validation was performed by randomly allocating the
survey locations to one of four subsets (each containing
approximately 25% of the total dataset) and training the space
time models on the three subsets whilst simultaneously predicting
infection prevalence at the locations of the fourth, excluded subset
(as done previously [10]). This was repeated for each subset, giving
an observed and predicted value for all 945 survey locations.
Validation statistics included area under the curve (AUC) of the
receiver operating characteristic (ROC; a plot of sensitivity vs. one
minus specificity, where the predicted probability of infection
being greater than 5%, 20% and 50% were compared to observed
values) to assess discriminatory performance of the predictive
model [36] AUC values of ,0.7 indicate poor discriminatory
performance, 0.7–0.8 acceptable, 0.8–0.9 excellent and .0.9
outstanding discriminatory performance. The correlation coeffi-
cient between observed and predicted prevalence and the mean
error and mean absolute error were used to assess bias (mean
error) and the accuracy (mean absolute error) of predictions.
Validation was repeated for models without temporal and/or
spatial random effects.
Results
Survey dataA total of 976 independent surveys conducted between 1975
and 2009 were identified through our searches, of which 945
surveys (97%), including some 106,370 individuals, could be geo-
positioned. The majority (96%) of surveys were conducted among
children in schools. Of the included surveys, 813 were spatially
unique locations, whilst the rest were surveys undertaken in the
same location but at different times.
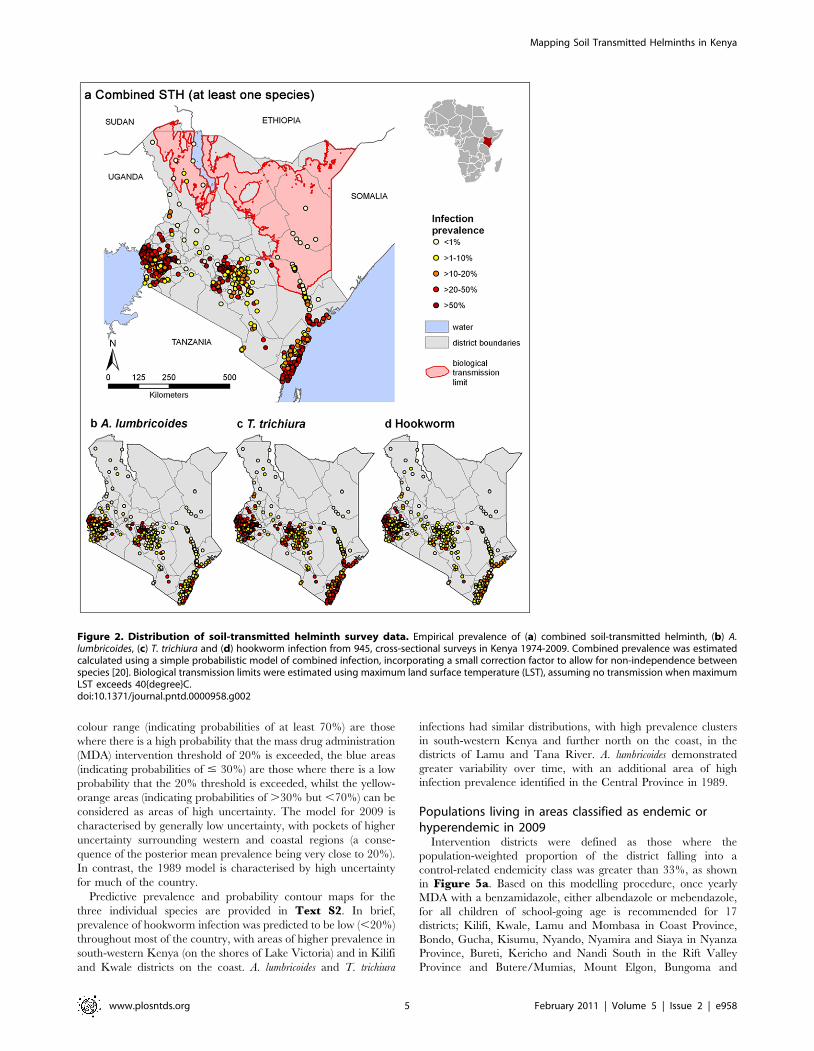
Figure 2 presents the observed geographical distribution of
each species as well as the estimated combined prevalence of STH,
based on all the included survey data. The observed prevalence of
all STH species is highest in western Kenya and on the coast;
pockets of observed high prevalence of A. lumbricoides and T.
trichiura prevalence also occur in central Kenya. In addition to
geographical variation, observed prevalence also varies over time
(Table 1): for example, mean combined STH prevalence in
Central Province was 43.8% in the period 1980–1989 (n = 86
surveys), but only 12.6% in the period 2000–2009 (n = 80 surveys).
Bayesian space time modellingIn univariate analysis, all tested environmental covariates were
statistically significant predictors of infection prevalence (See TextS2). In particular, infection prevalence was significantly associated
with the diagnosis method used for all species. Prevalence was also
significantly associated with maximum LST, elevation, precipita-
tion, EVI and distance to permanent water bodies. Note that the
odds ratios are on the same scale (standard deviations) for each
variable, which were standardised to have a mean of zero and a
standard deviation of one. Model-based geostatistical analysis
resulted in some weakening of associations between environmental
predictors and odds of infection, because these environmental
covariates are themselves spatially correlated. Multivariable
analysis (Table 2) indicated that the odds of A. lumbricoides was
significantly lower in community-based surveys compared with
school surveys and showed borderline associations with maximum
LST. Estimates of T. trichiura odds were lower in community based
surveys and in surveys that used alternative diagnostic methods to
Kato Katz, significantly decreased with increasing maximum LST
and elevation, and demonstrated a borderline negative association
with precipitation. Odds of hookworm infection also differed
significantly with diagnostic method, was significantly negatively
associated with maximum LST and elevation, and demonstrated
borderline positive associations with precipitation.
Variance of the geostatistical random effect (which indicates a
propensity for clustering not explained by the environmental
covariates) was similarly large for all three STH species. For all
three species the distance at which spatial correlation fell below
5% was 39–49 km (95% credible intervals ranging between 31–
68 km), corresponding with a very rapid decline in spatial
correlation with distance at larger scales, after accounting for
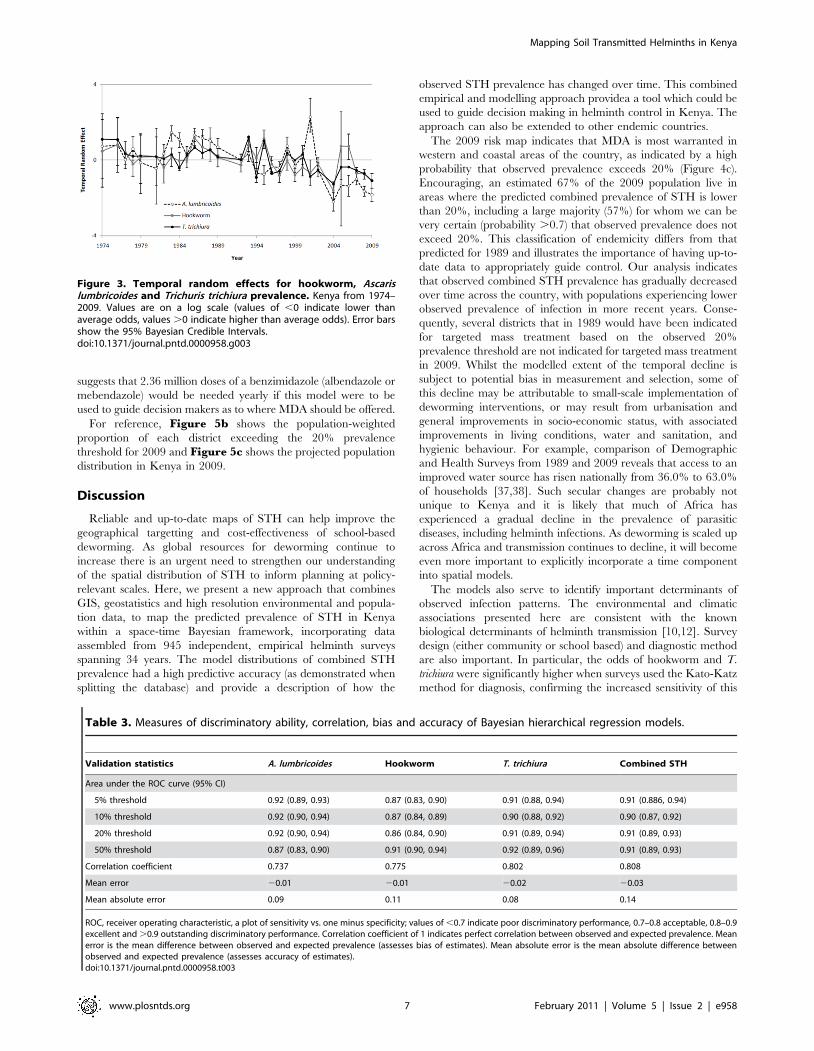
covariates. The variance of the temporal random effect was
greatest for A. lumbricoides, indicating greater variation over time
compared with hookworm and T. trichiura. A closer inspection of
the temporal random effect associated with each year (Figure 3)
shows that, although there is considerable inter-year variation,
there is evidence of a general decline in prevalence odds over time
for all three STH species, after adjusting for the spatial distribution
of the survey data. Bayesian space-time models were also run on a
restricted dataset comprising surveys that reported using Kato
Katz for diagnosis of infection, with no major differences in
findings observed (see Text S2).
For each STH species, and for the combined prevalence of
STH, models consistently had an AUC (area under the ROC
curve) estimate .0.85 for each prevalence threshold investigated,
and in most instances AUC .0.9, indicating very good
discriminatory performance of the model to classify areas
(sensitivity and specificity) (Table 3) [36]. For comparison, at a
20% prevalence threshold the AUC was 0.91 (95% CI 0.89, 0.93)
for the full space-time model, compared with 0.86 (0.81, 0.91) in a
model that only accounted for spatial correlation, 0.80 (0.76, 0.83)
when accounting for only temporal clustering, and 0.6 (0.56, 0.64)
when neither of these random effects were included. Mean error of
the space-time model predictions was ,3% for each STH species,
and 5% for combined prevalence, suggesting that the models
consistently under-predicted prevalence.
Predictive prevalence and probability contour mapsPredictive maps of combined STH prevalence in school-aged
children (i.e. school-based surveys using Kato-Katz for diagnosis)
were created from the spatial model for two example years (1989
and 2009), shown in Figure 4a–b. Masked areas shown in grey
have a mean LST .40uC, and so were considered outside the
environmental limits for STH transmission. Clusters of high
combined STH prevalence were located on the shores of Lake
Victoria in western Kenya, and along the coast. Consistent with
the temporal random effects shown in Figure 3, there are notable
differences in predicted combined prevalence between years;
overall prevalence was considerably lower in 2009, with predicted
combined prevalence of 10 to 20% for much of the country, whilst
in 1989 this was higher at .20–30%. Continuous probability
contour maps are presented in Figure 4c–d. Areas within the red
Mapping Soil Transmitted Helminths in Kenya
www.plosntds.org 4 February 2011 | Volume 5 | Issue 2 | e958
colour range (indicating probabilities of at least 70%) are those
where there is a high probability that the mass drug administration
(MDA) intervention threshold of 20% is exceeded, the blue areas
(indicating probabilities of # 30%) are those where there is a low
probability that the 20% threshold is exceeded, whilst the yellow-
orange areas (indicating probabilities of .30% but ,70%) can be
considered as areas of high uncertainty. The model for 2009 is
characterised by generally low uncertainty, with pockets of higher
uncertainty surrounding western and coastal regions (a conse-
quence of the posterior mean prevalence being very close to 20%).
In contrast, the 1989 model is characterised by high uncertainty
for much of the country.
Predictive prevalence and probability contour maps for the
three individual species are provided in Text S2. In brief,
prevalence of hookworm infection was predicted to be low (,20%)
throughout most of the country, with areas of higher prevalence in
south-western Kenya (on the shores of Lake Victoria) and in Kilifi
and Kwale districts on the coast. A. lumbricoides and T. trichiura
infections had similar distributions, with high prevalence clusters
in south-western Kenya and further north on the coast, in the
districts of Lamu and Tana River. A. lumbricoides demonstrated
greater variability over time, with an additional area of high
infection prevalence identified in the Central Province in 1989.
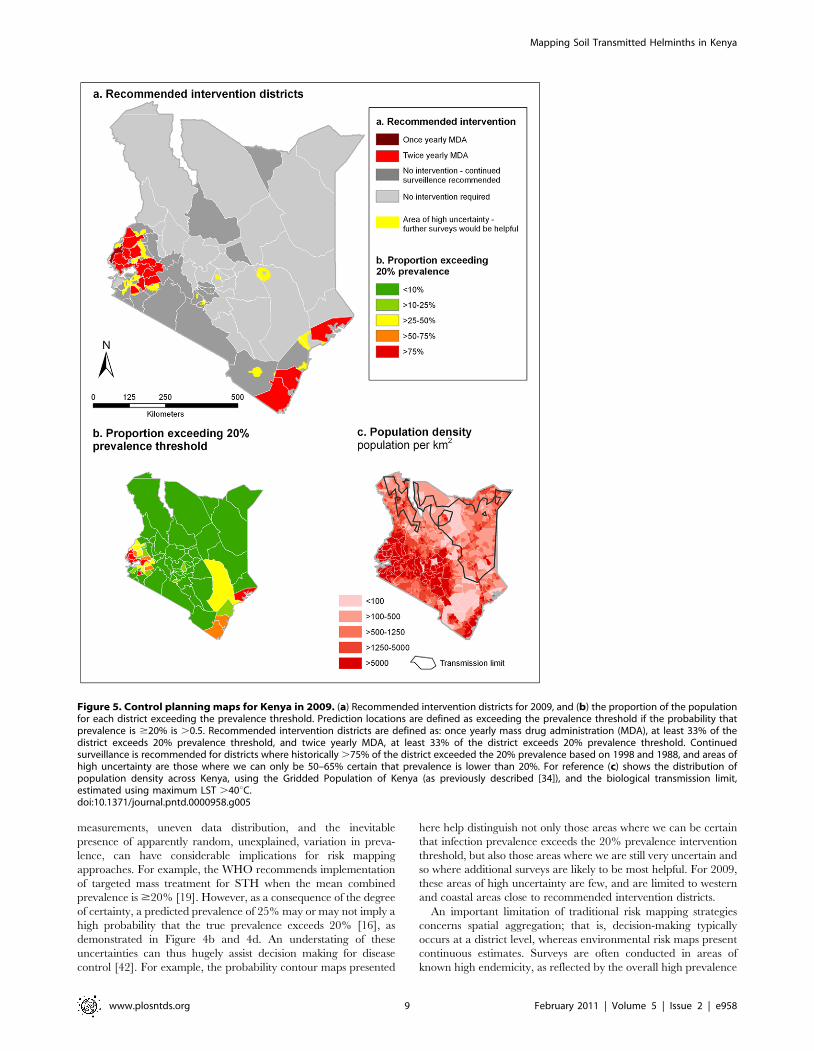
Populations living in areas classified as endemic orhyperendemic in 2009
Intervention districts were defined as those where the
population-weighted proportion of the district falling into a
control-related endemicity class was greater than 33%, as shown
in Figure 5a. Based on this modelling procedure, once yearly
MDA with a benzamidazole, either albendazole or mebendazole,
for all children of school-going age is recommended for 17
districts; Kilifi, Kwale, Lamu and Mombasa in Coast Province,
Bondo, Gucha, Kisumu, Nyando, Nyamira and Siaya in Nyanza
Province, Bureti, Kericho and Nandi South in the Rift Valley
Province and Butere/Mumias, Mount Elgon, Bungoma and
Figure 2. Distribution of soil-transmitted helminth survey data. Empirical prevalence of (a) combined soil-transmitted helminth, (b) A.lumbricoides, (c) T. trichiura and (d) hookworm infection from 945, cross-sectional surveys in Kenya 1974-2009. Combined prevalence was estimatedcalculated using a simple probabilistic model of combined infection, incorporating a small correction factor to allow for non-independence betweenspecies [20]. Biological transmission limits were estimated using maximum land surface temperature (LST), assuming no transmission when maximumLST exceeds 40{degree}C.doi:10.1371/journal.pntd.0000958.g002
Mapping Soil Transmitted Helminths in Kenya
www.plosntds.org 5 February 2011 | Volume 5 | Issue 2 | e958
Kakamega in Western Province. Twice yearly MDA is recom-
mended for Busia in Western Province, where 54% of the district’s
population are estimated to live in a hyperendemic area
(prevalence $50%). These districts represent approximately 26%
(2.82 million) of Kenyan children of school-going age. Thus,
assuming a primary-school net enrolment rate of 81.5%, this
Table 1. Summary of the Kenya soil-transmitted helminth survey data.
Survey data points Persons examined Estimated combined STH prevalence (SD)
Total 945 106,370 37.0% (27.7%)
Upper age sampled
,5 years 46 9915 39.1% (26.9%)
5–9 years 820 92239 36.4% (27.9%)
10–14 years 79 4216 44.6% (21.8%)
Decade
1974–1979 39 10840 20.7% (20.0%)
1980–1989 205 34202 42.3% (22.9%)
1990–1999 183 20058 61.2% (27.5%)
2000–2009 513 41270 29.0% (24.2%)
Province
Central 169 24178 34.3% (21.1%)
Coast 215 20576 41.3% (30.0%)
Eastern 77 15350 13.3% (9.9%)
Nairobi 2 250 76.2% (28.2%)
North eastern 18 1181 0.2% (0.6%)
Nyanza 371 36534 42.1% (23.0%)
Rift Valley 35 4034 12.2% (15.0%)
Western 58 4267 80.7% (21.8%)
Type of sample survey
School 918 98750 38.2% (27.7%)
Community 27 7620 22.0% (20.0%)
Method of diagnosis
Kato-Katz 557 66920 38.6% (30.4%)
All others* 388 39450 36.6% (23.3%)
*Other diagnostic methods include concentration (12 surveys), sedimentation (22 surveys), direct smear (12 surveys) and 342 studies for which the diagnostic methodwas not reported.doi:10.1371/journal.pntd.0000958.t001
Table 2. Estimates of Bayesian hierarchical logistic regression models of soil-transmitted helminth species in Kenya. Data from1974–2009.
Posterior mean OR (95% CI)
Variable A. lumbricoides Hookworm T. trichiura
Community based (vs. school based) 0.72 (0.51,0.96) 0.85 (0.57, 1.21) 0.45 (0.29, 0.68)
Other diagnostic method (vs. KK) 0.90 (0.72,1.1) 0.68 (0.53, 0.84) 0.43 (0.31, 0.57)
Maximum LST * 1.18 (0.93,1.46) 0.84 (0.73, 0.96) 0.83 (0.73, 0.99)
Elevation * 1.32 (0.84,1.80) 0.74 (0.60, 0.95) 0.75 (0.61, 0.93)
Precipitation * 1.01 (0.87,1.15) 1.13 (0.98, 1.28) 0.91 (0.77, 1.04)
EVI 2.57 (0.75,5.86) 0.62 (0.11, 1.64) 3.58 (0.47, 8.16)
Distance to permanent water bodies 0.77 (0.26,1.92) 1.24 (0.33, 3.14) 1.20 (0.34, 3.19)
w (rate of decay of spatial correlation) 6.83 (4.94, 9.02) 8.62 (6.35, 10.93) 7.06 (5.15, 9.15)
s2space (variance of spatial random effect) 4.03 (3.05,3.97) 3.53 (2.83,4.53) 3.55 (2.78, 4.63)
s2time (variance of temporal random effect) 1.22 (0.56, 2.45) 0.66 (0.32, 1.36) 0.87 (0.39, 1.67)
CI, Bayesian credible interval; EVI, enhanced vegetation index; Maximum LST, maximum land surface temperature.*Variables were standardised to have a mean of 0 and a standard deviation of 1.doi:10.1371/journal.pntd.0000958.t002
Mapping Soil Transmitted Helminths in Kenya
www.plosntds.org 6 February 2011 | Volume 5 | Issue 2 | e958
suggests that 2.36 million doses of a benzimidazole (albendazole or
mebendazole) would be needed yearly if this model were to be
used to guide decision makers as to where MDA should be offered.
For reference, Figure 5b shows the population-weighted
proportion of each district exceeding the 20% prevalence
threshold for 2009 and Figure 5c shows the projected population
distribution in Kenya in 2009.
Discussion
Reliable and up-to-date maps of STH can help improve the
geographical targetting and cost-effectiveness of school-based
deworming. As global resources for deworming continue to
increase there is an urgent need to strengthen our understanding
of the spatial distribution of STH to inform planning at policy-
relevant scales. Here, we present a new approach that combines
GIS, geostatistics and high resolution environmental and popula-
tion data, to map the predicted prevalence of STH in Kenya
within a space-time Bayesian framework, incorporating data
assembled from 945 independent, empirical helminth surveys
spanning 34 years. The model distributions of combined STH
prevalence had a high predictive accuracy (as demonstrated when
splitting the database) and provide a description of how the
observed STH prevalence has changed over time. This combined
empirical and modelling approach providea a tool which could be
used to guide decision making in helminth control in Kenya. The
approach can also be extended to other endemic countries.
The 2009 risk map indicates that MDA is most warranted in
western and coastal areas of the country, as indicated by a high
probability that observed prevalence exceeds 20% (Figure 4c).
Encouraging, an estimated 67% of the 2009 population live in
areas where the predicted combined prevalence of STH is lower
than 20%, including a large majority (57%) for whom we can be
very certain (probability .0.7) that observed prevalence does not
exceed 20%. This classification of endemicity differs from that
predicted for 1989 and illustrates the importance of having up-to-
date data to appropriately guide control. Our analysis indicates
that observed combined STH prevalence has gradually decreased
over time across the country, with populations experiencing lower
observed prevalence of infection in more recent years. Conse-
quently, several districts that in 1989 would have been indicated
for targeted mass treatment based on the observed 20%
prevalence threshold are not indicated for targeted mass treatment
in 2009. Whilst the modelled extent of the temporal decline is
subject to potential bias in measurement and selection, some of
this decline may be attributable to small-scale implementation of
deworming interventions, or may result from urbanisation and
general improvements in socio-economic status, with associated
improvements in living conditions, water and sanitation, and
hygienic behaviour. For example, comparison of Demographic
and Health Surveys from 1989 and 2009 reveals that access to an
improved water source has risen nationally from 36.0% to 63.0%
of households [37,38]. Such secular changes are probably not
unique to Kenya and it is likely that much of Africa has
experienced a gradual decline in the prevalence of parasitic
diseases, including helminth infections. As deworming is scaled up
across Africa and transmission continues to decline, it will become
even more important to explicitly incorporate a time component
into spatial models.
The models also serve to identify important determinants of
observed infection patterns. The environmental and climatic
associations presented here are consistent with the known
biological determinants of helminth transmission [10,12]. Survey
design (either community or school based) and diagnostic method
are also important. In particular, the odds of hookworm and T.
trichiura were significantly higher when surveys used the Kato-Katz
method for diagnosis, confirming the increased sensitivity of this
Figure 3. Temporal random effects for hookworm, Ascarislumbricoides and Trichuris trichiura prevalence. Kenya from 1974–2009. Values are on a log scale (values of ,0 indicate lower thanaverage odds, values .0 indicate higher than average odds). Error barsshow the 95% Bayesian Credible Intervals.doi:10.1371/journal.pntd.0000958.g003
Table 3. Measures of discriminatory ability, correlation, bias and accuracy of Bayesian hierarchical regression models.
Validation statistics A. lumbricoides Hookworm T. trichiura Combined STH
Area under the ROC curve (95% CI)
5% threshold 0.92 (0.89, 0.93) 0.87 (0.83, 0.90) 0.91 (0.88, 0.94) 0.91 (0.886, 0.94)
10% threshold 0.92 (0.90, 0.94) 0.87 (0.84, 0.89) 0.90 (0.88, 0.92) 0.90 (0.87, 0.92)
20% threshold 0.92 (0.90, 0.94) 0.86 (0.84, 0.90) 0.91 (0.89, 0.94) 0.91 (0.89, 0.93)
50% threshold 0.87 (0.83, 0.90) 0.91 (0.90, 0.94) 0.92 (0.89, 0.96) 0.91 (0.89, 0.93)
Correlation coefficient 0.737 0.775 0.802 0.808
Mean error 20.01 20.01 20.02 20.03
Mean absolute error 0.09 0.11 0.08 0.14
ROC, receiver operating characteristic, a plot of sensitivity vs. one minus specificity; values of ,0.7 indicate poor discriminatory performance, 0.7–0.8 acceptable, 0.8–0.9excellent and .0.9 outstanding discriminatory performance. Correlation coefficient of 1 indicates perfect correlation between observed and expected prevalence. Meanerror is the mean difference between observed and expected prevalence (assesses bias of estimates). Mean absolute error is the mean absolute difference betweenobserved and expected prevalence (assesses accuracy of estimates).doi:10.1371/journal.pntd.0000958.t003
Mapping Soil Transmitted Helminths in Kenya
www.plosntds.org 7 February 2011 | Volume 5 | Issue 2 | e958

method [39,40]. Our adopted Bayesian framework may in the
future be expanded to include adjustment for measurement error
of these different diagnostic tools. For example, recent work
employing Bayesian methods has sought to estimate the sensitivity
and specificity of diagnosis in the absence of a gold standard
[31,41], and future refinements of our models will seek to reliable
integrate measurement error into model predictions. Other
sources of uncertainty also remain. For example, despite inclusion
of environmental covariates, some small scale residual spatial
variation remains - represented by the spatial random effects. This
suggests that other factors, which may be related to poverty,
hygiene and other small-scale environmental covariates, influence
the observed current distribution of STH in Kenya. It should also
be acknowledged that these maps represent stable rural popula-
tions; prevalence may vary among sub-populations such as
nomads and refuges, or those living in urban slum areas with
inadequate sanitation and overcrowding. In these instances, risk
maps may under-estimate infection prevalence, and targeted
surveys may be necessary before control decisions are made.
The explicit estimation of uncertainty is a particular strength of
our adopted model-based geostatistics approach, which takes
empirical estimates of infection prevalence and generates continu-
ous maps by interpolating prevalence at unsurveyed locations on a
grid system. Bayesian geostatistical inference acknowledges error or
uncertainty associated with the data such that for each prediction
location a distribution of possible prevalence values is generated (i.e.
a posterior probability distribution). These uncertainties, which
arise from the constraints of finite sampling, error in survey
Figure 4. Continuous predicted combined soil-transmitted helminth (STH) prevalence and probability contour maps for Kenya.Probability contour map shows the probability that combined STH prevalence exceeds 20%. Estimates of predicted prevalence are the meanposterior predictive values from a Bayesian space-time model for (a) 2009 and (b) 1989. The probability contour maps show the spatial distribution ofprobability that combined STH prevalence is .20% for (c) 2009 and (d) 1989. Biological transmission limits were estimated using maximum landsurface temperature (LST), assuming no transmission when maximum LST exceeds 40{degree}C.doi:10.1371/journal.pntd.0000958.g004
Mapping Soil Transmitted Helminths in Kenya
www.plosntds.org 8 February 2011 | Volume 5 | Issue 2 | e958
measurements, uneven data distribution, and the inevitable
presence of apparently random, unexplained, variation in preva-
lence, can have considerable implications for risk mapping
approaches. For example, the WHO recommends implementation
of targeted mass treatment for STH when the mean combined
prevalence is $20% [19]. However, as a consequence of the degree
of certainty, a predicted prevalence of 25% may or may not imply a
high probability that the true prevalence exceeds 20% [16], as
demonstrated in Figure 4b and 4d. An understating of these
uncertainties can thus hugely assist decision making for disease
control [42]. For example, the probability contour maps presented
here help distinguish not only those areas where we can be certain
that infection prevalence exceeds the 20% prevalence intervention
threshold, but also those areas where we are still very uncertain and
so where additional surveys are likely to be most helpful. For 2009,
these areas of high uncertainty are few, and are limited to western
and coastal areas close to recommended intervention districts.
An important limitation of traditional risk mapping strategies
concerns spatial aggregation; that is, decision-making typically
occurs at a district level, whereas environmental risk maps present
continuous estimates. Surveys are often conducted in areas of
known high endemicity, as reflected by the overall high prevalence
Figure 5. Control planning maps for Kenya in 2009. (a) Recommended intervention districts for 2009, and (b) the proportion of the populationfor each district exceeding the prevalence threshold. Prediction locations are defined as exceeding the prevalence threshold if the probability thatprevalence is $20% is .0.5. Recommended intervention districts are defined as: once yearly mass drug administration (MDA), at least 33% of thedistrict exceeds 20% prevalence threshold, and twice yearly MDA, at least 33% of the district exceeds 20% prevalence threshold. Continuedsurveillance is recommended for districts where historically .75% of the district exceeded the 20% prevalence based on 1998 and 1988, and areas ofhigh uncertainty are those where we can only be 50–65% certain that prevalence is lower than 20%. For reference (c) shows the distribution ofpopulation density across Kenya, using the Gridded Population of Kenya (as previously described [34]), and the biological transmission limit,estimated using maximum LST .40uC.doi:10.1371/journal.pntd.0000958.g005
Mapping Soil Transmitted Helminths in Kenya
www.plosntds.org 9 February 2011 | Volume 5 | Issue 2 | e958
reported by the survey data. Mean prevalence may however vary
significantly across districts, with localised pockets of high
prevalence. In Kwale district for example, the predicted combined
prevalence in 2009 varied between 5% and 53%, making the
district-level mean prevalence of 21% harder to interpret. Risk
maps are primarily restricted to continuous estimates due to the
huge computational costs associated with prediction over large
areas, constraining modelling approaches to those that produce
independent, marginal predictions prediction that ignore correla-
tion between prediction locations. Importantly, whilst these
provide valid estimates of uncertainty for each location considered
in isolation, it is not possible to construct valid probability
distributions for a group of prediction locations, such as a district
[43]. In the future, it may be feasible to develop joint simulation
approaches that allow for robust estimates of mean prevalence at
varying levels of spatial aggregation, such as those employed by
Gething et al [43]. However, here we negate these problems by
presenting the proportion of the population for each district that
live in an area where prevalence exceeds the 20% threshold. This
simple and statistically robust measurement provides an accurate
indication of population at risk and represents a practical
adaptation of modern Bayesian geostatistical techniques.
Bias associated with measurement error also represents an
important limitation when interpreting the current model. The
diagnostic sensitivity of different techniques can vary considerably
[40,44,45], and whilst attempts were made to adjust for this, a
large proportion of the surveys included did not mention the
diagnostic method used nor the numbers of stool samples taken.
Similarly, as the majority of surveys were school-based, selection
bias may be present if the socio-demographic characteristics of
school-going children varied through time or space. Notably, the
proportion of surveys reporting using Kato Katz increased over
time, whilst primary school enrolment rates have risen from 56%
in 1998 to nearly 82% in 2009 [35]. The number of stool samples
typically examined per individual may also have changed over
time. Further, as infection intensities reduce as a consequence of
the scale-up of control, the influence of measurement error in
diagnosis will become more pronounced and must be taken into
account. Specifically, a reduction in infection intensity would
reduce test sensitivity, resulting in lower observed prevalence. Such
systematic changes and potential biases may have served to
dampen or exaggerate the temporal and spatial trends in modelled
prevalence, and should be borne in mind during interpretation.
However, restricting analysis to surveys that used Kato Katz did
not lead to different conclusions. Current treatment guidelines are
however based on prevalence as determined using the diagnostic
tools currently available [16,32]. Thus, whilst the modelled
distribution of STH infection may under-predict true prevalence,
it does still provide a reliable indication of whether deworming is
warranted given current WHO recommendations [16]. Further
research is needed to investigate the full implications of diagnostic
sensitivity and specificity for epidemiological surveillance and
mapping of helminth species, particularly in the context of
ongoing control.
A final limitation relates to how we estimate the combined
prevalence of any STH species. In this instance, the distribution of
each STH species was modelled independently and combined
probability distributions were subsequently calculated post-esti-
mation, using a probabilistic model that adjusts for non-
independence between species [20]. Whilst this overcomes the
considerable computational costs associated with joint modelling
of all three species, it does risk over-estimating combined
prevalence in areas of very low prevalence and conversely
under-estimating prevalence in areas of very high prevalence.
Despite this, we believe that this aspect is unlikely to have a major
effect at a policy-decision level, which concerns mid-level
prevalence values (20 to 50%).
Conclusion and future directionsAccurate and up-to-date maps of STH are essential for decision-
making in helminth control. Our prediction of STH prevalence in
2009 highlights the marked heterogeneity of prevalence across
Kenya and the importance of a geographically targeted approach
to implementing control. The observed reduction in prevalence
over time also serves to warn against relying on purely historic
data when planning control; this will only become more important
as control is implemented at increasing large scales. The resulting
maps give an accurate description of the observed distribution of
STH species across Kenya (together with associated uncertainties),
and provide decision-makers with the information that can be used
to prioritise districts for targeted STH control programmes among
school-aged children, following the WHO recommendations.
The current work forms part of an ongoing project, the Global
Atlas of Helminth Infection (www.thiswormyworld.org), which
seeks to develop an open-access, global information resource on
the distribution of STH and schistosomiasis [7,46]. The work
presented here will be expanded to predict STH prevalence across
all of sub-Saharan Africa. For each country, three types of maps
will be presented: (i) a Survey Data Map showing the observed
prevalence of infection based on survey data; (ii) a Predictive Risk
Map showing the probability that infection prevalence warrants
MDA, according to recommended WHO thresholds; and (iii) a
Control Planning Map showing which districts require MDA
treatment or where further surveys would be helpful in defining
risk [47]. These maps will provide a sound epidemiological basis
for guiding global investments in helminth control and country
deworming efforts across the continent.
Supporting Information
Text S1 Model description.
Found at: doi:10.1371/journal.pntd.0000958.s001 (0.25 MB
RTF)
Text S2 Additional results to support those provided in the main
article.
Found at: doi:10.1371/journal.pntd.0000958.s002 (95.82 MB
RTF)
Acknowledgments
We are grateful to the many individuals who contributed prevalence data
to the Global Atlas of Helminth Infection, including Willis Akhwale, Mike
Doenhoff, Thomas Handzel, Jimmy Kihara, Charles King, Tjalling
Leenstra, Pascal Magnussen, Khalid Massa, Susan Montgomery, David
Mwaniki, Mariam T Mwanje, Eric Muchiri, Annette Olsen, Evan Secor,
Claire Standley and Russell Stothard. We are also grateful to Peris Karanja
and Deborah Mbotha for their help with data assembly and Abdisalan
Noor, Archie Clements and Ricardo Magalhaes for statistical advice, and
wish to thank Margaret Ndanyi, Karen Levy, Beth Waweru, Mariam T
Mwanje, Jimmy Kihara, Lesley Drake, Don Bundy, Michael Kremer,
Mike Mills and members of the Kenya school health steering committee for
their contributions and support of deworming in Kenya. Thanks also go to
Abdisalan Noor and to an anonymous reviewer for helpful comments on
an earlier draft of the manuscript.
Author Contributions
Conceived and designed the experiments: SB. Performed the experiments:
CWG. Analyzed the data: RLP PWG JLS HJWS. Wrote the paper: RLP
CSM CWG SIH SB.
Mapping Soil Transmitted Helminths in Kenya
www.plosntds.org 10 February 2011 | Volume 5 | Issue 2 | e958
References
1. Warren KS, Bundy DAP, Anderson RM, Davis AR, Henderson DA, et al.
(1993) Helminth infections. In: Jamison DT, Mosley WH, Measham AR,
Bobadilla JL, eds. Disease Control Priorities in Developing Countries. Oxford:
Oxford University Press. pp 131–160.
2. Hotez PJ, Bundy DAP, Beegle K, Brooker S, Drake L, et al. (2006) Helminth
Infections: soil-transmitted helminth infections and schistosomiasis. In:
Jamison DT, Breman JG, Measham AR, Alleyne G, Claeson M, et al., eds.
Disease Control Priorities in Developing Countries. 2 ed. New York: Oxford
University Press. pp 467–497.
3. Guyatt HL, Brooker S, Kihamia CM, Hall A, Bundy DA (2001) Evaluation of
efficacy of school-based anthelmintic treatments against anaemia in children in
the United Republic of Tanzania. Bull World Health Organ 79: 695–703.
4. Brooker S, Kabatereine NB, Fleming AF, Devlin N (2008) Cost and cost-
effectiveness of nationwide school-based helminth control in Uganda: intra-
country variation and effects of scaling-up. Health Policy Plan 23: 24–35.
5. Hopkins DR, Eigege A, Miri ES, Gontor I, Ogah G, et al. (2002) Lymphatic
filariasis elimination and schistosomiasis control in combination with onchocer-
ciasis control in Nigeria. Am J Trop Med Hyg 67: 266–272.
6. Ndyomugyenyi R, Kabatereine NB (2003) Integrated community-directed
treatment for the control of onchocerciasis, schistosomiasis and intestinal
helminths infections in Uganda: advantages and disadvantages. Trop Med Int
Health 8: 997–1004.
7. Brooker S, Kabatereine NB, Smith JL, Mupfasoni D, Mwanje MT, et al. (2009)
An updated atlas of human helminth infections: the example of East Africa.
Int J Health Geogr 8: 42.
8. Brooker S, Michael E (2000) The potential of geographical information systems
and remote sensing in the epidemiology and control of human helminth
infections. Adv Parasitol 47: 245–288.
9. Brooker S, Clements ACA, Bundy DAP (2006) Global epidemiology, ecology
and control of soil-transmitted helminth infections. Adv Parasitol 62: 221–261.
10. Clements AC, Deville M-A, Ndayishimiye O, Brooker S, Fenwick A (2010)
Spatial co-distribution of neglected tropical diseases in the East African Great
Lakes region: revisiting the justification for integrated control. Trop Med Int
Health 15: 198–207.
11. Brooker S, Clements ACA (2009) Spatial heterogeneity of parasite co-infection:
Determinants and geostatistical prediction at regional scales. International
Journal for Parasitology 39: 591–597.
12. Raso G, Vounatsou P, Gosoniu L, Tanner HP, N’Goran E K, et al. (2006) Risk
factors and spatial patterns of hookworm infection among schoolchildren in a
rural area of western Cote d’Ivore. Int J Epidemiol 36: 201–210.
13. Clements AC, Bosque-Oliva E, Sacko M, Landoure A, Dembele R, et al. (2009)
A comparative study of the spatial distribution of schistosomiasis in Mali in
1984-1989 and 2004-2006. PLoS Negl Trop Dis 3: e431.
14. Clements AC, Garba A, Sacko M, Toure S, Dembele R, et al. (2008) Mapping
the probability of schistosomiasis and associated uncertainty, West Africa. Emerg
Infect Dis 14: 1629–1632.
15. Vounatsou P, Raso G, Tanner M, N’goran EK, Utzinger J (2009) Bayesian
geostatistical modelling for mapping schistosomiasis transmission. Parasitology
136: 1695–1705.
16. Diggle P, Thomson MC, Christensen OF, Rowlingson B, Obsomer V, et al.
(2007) Spatial modelling and the prediction of Loa loa risk: decision making
under uncertainty. Ann Trop Med Parasitol 101: 499–509.
17. Gyapong JO, Kyelem D, Kleinschmidt I, Agbo K, Ahouandogbo F, et al. (2002)
The use of spatial analysis in mapping the distribution of bancroftian filariasis in
four West African countries. Ann Trop Med Parasitol 96: 695–705.
18. Yang GL, Vounatsou P, Zhou X, Tanner M, Utzinger J (2005) A Bayesian-
based approach for spatio-temporal modelling of county-level prevalence of
Schistosomiasis infection in Jiangsu province, China. Int J Parasitol 131: 97–108.
19. WHO (2006) Preventive chemotherapy in human helminthiasis. Coordinated
use of anthelmintihic drugs in control interventions a manual for health
professionals and programme managers. Geneva: World Health Organization.
20. de Silva N, Hall A (2010) Using the prevalence of individual species of intestinal
nematode worms to estimate the combined prevalence of any species. PLoS Negl
Trop Dis 4: e655.
21. Noor AM, Gething PW, Alegana VA, Patil AP, Hay SI, et al. (2009) The risks of
malaria infection in Kenya in 2009. BMC Infect Dis 9: 180.
22. WorldClim. http://www.worldclim.org/download.htm. Accessed 7th June 2009.
23. Hijmans RJ, Cameron SE, Parra JL, Jones PG, Jarvis A (2005) Very high
resolution interpolated climate surfaces for global land areas. Int J Climatol 25.
24. Scharlemann JPW, Benz D, Hay SI, Purse BV, Tatem AJ, et al. (2008) Global
data for ecology and epidemiology: a novel algorithm for temporal Fourierprocessing MODIS data. PLoS ONE 3: e1408.
25. Olson DM, Dinerstein E (2009) The Global 200: Priority ecoregions for globalconservation. Ann Missouri Botanical Garden 89: 125–126.
26. Beer RJ (1976) The relationship between Trichuris trichiura (Linnaeus 1758) ofman and Trichuris suis (Schrank 1788) of the pig. Res Vet Sci 20: 47–54.
27. Seamster AP (1950) Developmental studies concenring the eggs of Ascaris
lumbricoides var. suum. Am Mid Natur 43: 450–468.28. Udonsi JK, Atata G (1987) Necator americanus: Temperature, pH, Light, and
Larval Development, Longevity, and Desiccation Tolerance. Exp Parasitol 63:136–142.
29. Smith G, Schad GA (1989) Ancylostoma duodenale and Necator americanus: effect of
temperature on egg development and mortality. Parasitol 99: 127–132.30. Diggle P, Moyeed R, Tawn J (1998) Model-based geostatistics (with discussion).
Appl Stats 47: 299–350.31. Wang X-H, Zhou X-N, Vounatsou P, Chen Z, Utzinger J, et al. (2008) Bayesian
spatio-temporal modelling of Schistosoma japonicum prevalence data in the absence
of a diagnostic ’gold’ standard. PLoS Negl Trop Dis 2: e250.32. Montresor A, Crompton DWT, Hall A, Bundy DAP, Savioli L (1998)
Guidelines for the evaluation of soil-transmitted helminthiasis and schistosomi-asis at community level: a guide for managers of control programmes. Geneva:
World Health Organization.33. WHO (1994) Bench aids for the diagnosis of intestinal parasites. Geneva: World
Health Organization.
34. Hay SI, Guerra CA, Gething PW, Patil AP, Tatem AJ, et al. (2009) A worldmalaria map: Plasmodium falciparum endemicity in 2007. PLoS Med 24:
e1000048.35. World Development Indicators (WDI) 2009 Washington D.C.: World Bank;
2009.
36. Brooker S, Hay SI, Bundy DAP (2000) Tools from ecology: useful for evaluatinginfection risk models. Trends Parasitol 18: 70 - 74.
37. Kenya National Bureau of Statistics, Nairobi, Kenya and MEASURE DHS,ICF Macro, Calverton, Maryland, USA (2009) Kenya: DHS, 2008-09 - Final
Report.38. National Council for Population and Development, Nairobi, Kenya and
Institute for Resource Development/Macro Systems, Inc., Columbia, Maryland
USA (1989) Kenya: DHS, 1989.39. Goodman D, Haji HJ, Bickle QD, Stoltzfus RJ, Tielsch JM, et al. (2007) A
comparison of methods for detecting the eggs of Ascaris, Trichuris, and hookwormin infant stool, and the epidemiology of infection in Zanzibari infants. Am J Trop
Med Hyg 76: 725–731.
40. Knopp S, Mgeni AF, Khamis IS, Steinmann P, Stothard JR, et al. (2008)Diagnosis of soil-transmitted helminths in the era of preventive chemotherapy:
effect of multiple stool sampling and use of different diagnostic techniques. PLoSNegl Trop Dis 2: e331.
41. Tarafder MR, Carabin H, Joseph L, Balolong EJ, Olveda R, et al. (2008)Estimating the sensitivity and specificity of Kato-Katz stool examination
technique for detection of hookworms, Ascaris lumbricoides and Trichuris trichiura
infections in humans in the absence of a ’gold standard’. Int J Parasitol 40:399–404.
42. Clements AC, Lwambo NJ, Blair L, Nyandindi U, Kaatano G, et al. (2006)Bayesian spatial analysis and disease mapping: tools to enhance planning and
implementation of a schistosomiasis control programme in Tanzania. Trop Med
Int Health 11: 490–503.43. Gething PW, Patil AP, Hay SI (2010) Quantifying aggregated uncertainty in
Plasmodium falciparum malaria prevalence and populations at risk via efficientspace-time geostatistical joint simulations. PloS Comp Biol 6: e1000724.
44. Goodman D, Haji HJ, Bickle QD, Stoltzfus RJ, Tielsch JM, et al. (2007) A
comparison of methods for detecting the eggs of Ascaris, Trichuris and hookwormin infant stool, and the epidemiology of infection in Zanzibari infants. Am J Trop
Med Hyg 76: 725–731.45. Wang X-H, Zhou X-N, Vounatsou P, Chen Z, Utzinger J (2008) Bayesian
Spatio-Temporal Modeling of Schistosoma japonicum Prevalence Data in theAbsence of a Diagnostic ’Gold’ Standard. PLoS Negl Trop Dis 2: e250.
46. Brooker S, Rowlands M, Haller L, Savioli L, Bundy DAP (2000) Towards an
atlas of human helminth infection in sub-Saharan Africa: the use of geographicalinformation systems (GIS). Parasitol Today 16: 303–307.
47. Brooker S, Hotez PJ, Bundy DAP (2010) The Global Atlas of HelminthInfection: Mapping the way forward in neglected tropical disease control. PLoS
Negl Trop Dis 4(7): e779: e779.
Mapping Soil Transmitted Helminths in Kenya
www.plosntds.org 11 February 2011 | Volume 5 | Issue 2 | e958
Related Documents