RESEARCH ARTICLE Calculating the prevalence of soil-transmitted helminth infection through pooling of stool samples: Choosing and optimizing the pooling strategy James E. Truscott ID 1,2 *, Julia C. Dunn ID 2 , Marina Papaiakovou 1,3 , Fabian Schaer 1,3 , Marleen Werkman ID 1,2 , D. Timothy J. Littlewood 1,3 , Judd L. Walson 1,3,4 , Roy M. Anderson 1,2 1 The DeWorm3 Project, Department of Life Sciences, Natural History Museum, London, United Kingdom, 2 Department of Infectious Disease Epidemiology, Faculty of Medicine, Imperial College London, London, United Kingdom, 3 Parasites & Vectors, Department of Life Sciences, Natural History Museum, London, United Kingdom, 4 Department of Global Health, University of Washington, Seattle, Washington, United States of America * [email protected] Abstract Prevalence is a common epidemiological measure for assessing soil-transmitted helminth burden and forms the basis for much public-health decision-making. Standard diagnostic techniques are based on egg detection in stool samples through microscopy and these tech- niques are known to have poor sensitivity for individuals with low infection intensity, leading to poor sensitivity in low prevalence populations. PCR diagnostic techniques offer very high sensitivities even at low prevalence, but at a greater cost for each diagnostic test in terms of equipment needed and technician time and training. Pooling of samples can allow preva- lence to be estimated while minimizing the number of tests performed. We develop a model of the relative cost of pooling to estimate prevalence, compared to the direct approach of testing all samples individually. Analysis shows how expected relative cost depends on both the underlying prevalence in the population and the size of the pools constructed. A critical prevalence level (approx. 31%) above which pooling is never cost effective, independent of pool size. When no prevalence information is available, there is no basis on which to choose between pooling and testing all samples individually. We recast our model of relative cost in a Bayesian framework in order to investigate how prior information about prevalence in a given population can be used to inform the decision to choose either pooling or full testing. Results suggest that if prevalence is below 10%, a relatively small exploratory prevalence survey (10–15 samples) can be sufficient to give a high degree of certainty that pooling may be relatively cost effective. PLOS Neglected Tropical Diseases | https://doi.org/10.1371/journal.pntd.0007196 March 21, 2019 1 / 14 a1111111111 a1111111111 a1111111111 a1111111111 a1111111111 OPEN ACCESS Citation: Truscott JE, Dunn JC, Papaiakovou M, Schaer F, Werkman M, Littlewood DTJ, et al. (2019) Calculating the prevalence of soil- transmitted helminth infection through pooling of stool samples: Choosing and optimizing the pooling strategy. PLoS Negl Trop Dis 13(3): e0007196. https://doi.org/10.1371/journal. pntd.0007196 Editor: Maria Victoria Periago, Consejo Nacional de Investigaciones Cientificas y Tecnicas, Fundacio ´n Mundo Sano, ARGENTINA Received: September 26, 2018 Accepted: January 29, 2019 Published: March 21, 2019 Copyright: © 2019 Truscott et al. This is an open access article distributed under the terms of the Creative Commons Attribution License, which permits unrestricted use, distribution, and reproduction in any medium, provided the original author and source are credited. Data Availability Statement: All data are within the manuscript and its Supporting Information files. Funding: JET, MP, FS, MW, DTJL, JLW and RMA gratefully thank the Bill and Melinda Gates Foundation for research grant support via the DeWorm3 (OPP1129535) award to the Natural History Museum in London (http://www. gatesfoundation.org/). JCD is supported by the

Welcome message from author
This document is posted to help you gain knowledge. Please leave a comment to let me know what you think about it! Share it to your friends and learn new things together.
Transcript

RESEARCH ARTICLE
Calculating the prevalence of soil-transmitted
helminth infection through pooling of stool
samples: Choosing and optimizing the pooling
strategy
James E. TruscottID1,2*, Julia C. DunnID
2, Marina Papaiakovou1,3, Fabian Schaer1,3,
Marleen WerkmanID1,2, D. Timothy J. Littlewood1,3, Judd L. Walson1,3,4, Roy
M. Anderson1,2
1 The DeWorm3 Project, Department of Life Sciences, Natural History Museum, London, United Kingdom,
2 Department of Infectious Disease Epidemiology, Faculty of Medicine, Imperial College London, London,
United Kingdom, 3 Parasites & Vectors, Department of Life Sciences, Natural History Museum, London,
United Kingdom, 4 Department of Global Health, University of Washington, Seattle, Washington, United
States of America
Abstract
Prevalence is a common epidemiological measure for assessing soil-transmitted helminth
burden and forms the basis for much public-health decision-making. Standard diagnostic
techniques are based on egg detection in stool samples through microscopy and these tech-
niques are known to have poor sensitivity for individuals with low infection intensity, leading
to poor sensitivity in low prevalence populations. PCR diagnostic techniques offer very high
sensitivities even at low prevalence, but at a greater cost for each diagnostic test in terms of
equipment needed and technician time and training. Pooling of samples can allow preva-
lence to be estimated while minimizing the number of tests performed. We develop a model
of the relative cost of pooling to estimate prevalence, compared to the direct approach of
testing all samples individually. Analysis shows how expected relative cost depends on both
the underlying prevalence in the population and the size of the pools constructed. A critical
prevalence level (approx. 31%) above which pooling is never cost effective, independent of
pool size. When no prevalence information is available, there is no basis on which to choose
between pooling and testing all samples individually. We recast our model of relative cost in
a Bayesian framework in order to investigate how prior information about prevalence in a
given population can be used to inform the decision to choose either pooling or full testing.
Results suggest that if prevalence is below 10%, a relatively small exploratory prevalence
survey (10–15 samples) can be sufficient to give a high degree of certainty that pooling may
be relatively cost effective.
PLOS Neglected Tropical Diseases | https://doi.org/10.1371/journal.pntd.0007196 March 21, 2019 1 / 14
a1111111111
a1111111111
a1111111111
a1111111111
a1111111111
OPEN ACCESS
Citation: Truscott JE, Dunn JC, Papaiakovou M,
Schaer F, Werkman M, Littlewood DTJ, et al.
(2019) Calculating the prevalence of soil-
transmitted helminth infection through pooling of
stool samples: Choosing and optimizing the
pooling strategy. PLoS Negl Trop Dis 13(3):
e0007196. https://doi.org/10.1371/journal.
pntd.0007196
Editor: Maria Victoria Periago, Consejo Nacional de
Investigaciones Cientificas y Tecnicas, Fundacion
Mundo Sano, ARGENTINA
Received: September 26, 2018
Accepted: January 29, 2019
Published: March 21, 2019
Copyright: © 2019 Truscott et al. This is an open
access article distributed under the terms of the
Creative Commons Attribution License, which
permits unrestricted use, distribution, and
reproduction in any medium, provided the original
author and source are credited.
Data Availability Statement: All data are within the
manuscript and its Supporting Information files.
Funding: JET, MP, FS, MW, DTJL, JLW and RMA
gratefully thank the Bill and Melinda Gates
Foundation for research grant support via the
DeWorm3 (OPP1129535) award to the Natural
History Museum in London (http://www.
gatesfoundation.org/). JCD is supported by the
Author summary
Current diagnostic methods for assessing prevalence of soil-transmitted helminths
(STHs) largely rely on microscopic visualization of helminth eggs, an inexpensive but
insensitive method of detection. However, growing interest in going beyond control to
break transmission of STH through mass drug administration will require highly sensitive
assays to detect the low intensity infections that occur when prevalence is low within a
population. Molecular tools, such as real-time PCR, offer the required sensitivity, but
depend on well-equipped laboratories and adequately trained technicians. In addition,
current assays are relatively expensive to perform at the scale required for surveys. Sample
pooling is a technique that can be used to estimate prevalence from a set of samples, while
potentially employing fewer tests for a given sample size, reducing cost. The decision in
favour of or against pooling will determine how samples are collected, properly stored and
analysed, and that needs to be established early in the study or program design process.
Our work identifies the key determinants on which this decision should be made, what
information is needed to make the choice and how the decision can be made.
Introduction
Prevalence is a key epidemiological measure for assessing the burden of soil-transmitted hel-
minths (STH) in human communities. The majority of data collected within national surveil-
lance and treatment programs are in the form of prevalence, although infection intensity data
based on egg counts from faecal samples can also be collected by using a variety of diagnostic
techniques [1]. Treatment guidelines from the World Health Organisation (WHO) for control
of STH species use prevalence data to categorise areas into high, medium and low risk and
concomitantly define mass drug administration (MDA) treatment strategies accordingly [2].
In the context of public health decision making, intensity data are chiefly used to calculate the
prevalence of individuals with low, medium and high intensity infections. Such an approach
has been used as a proxy measure for STH infection-induced morbidity in populations [3]. In
recent years, interest has started to turn from control of morbidity to the possibility of the
elimination of STH infection through breaking the parasite’s transmission cycle in the human
population [4,5]. Breaking transmission is achieved by driving infection prevalence through a
critical threshold below which parasite reproduction cannot sustain transmission [6,7]. In this
context, the ability to accurately measure a very low prevalence will become increasingly
important as programmes target elimination.
A variety of diagnostic methods are currently used in assessing prevalence in endemic
areas, but most are based on microscopic examination of a standard quantity of stool and the
subsequent calculation of the number of eggs it contains [8]. The most frequently used egg-
counting method for STH diagnosis is the Kato-Katz (KK) technique [9]. Egg counting meth-
ods generally require minimal equipment, beyond a microscope, and testers can acquire the
necessary skills within a week of training [10]. However, the sensitivity of these techniques is
known to be poor under most conditions, although this is hard to quantify in the absence of a
gold standard. This is largely a consequence of heterogeneity in the distribution of egg output
in stool excreted by an infected individual with a given worm burden [11,12]. A survey of the
literature suggests that the sensitivity of egg counting methods is highly inconsistent across
studies. Sensitivity appears to vary according to parasite species, chosen diagnostic method,
underlying prevalence/intensity of disease and even across different studies (presumably indi-
cating the importance of the degree of training of the operator/tester). Some patterns emerge
Optimzing the pooling strategy for STH prevalence estimation
PLOS Neglected Tropical Diseases | https://doi.org/10.1371/journal.pntd.0007196 March 21, 2019 2 / 14
London Centre for Neglected Tropical Disease
Research (LCNTDR), funded by GlaxoSmithKline
(https://www.gsk.com/). The funders had no role in
study design, data collection and analysis, decision
to publish, or preparation of the manuscript.
Competing interests: The authors have declared
that no competing interests exist.

however; the test-sensitivity to detect Ascaris lumbricoides eggs appears generally high across
all background intensities (sensitivity approx. 0.7) [8,13–15] while hookworm-larvae detection
in stool is much less reliable, showing a tendency to drop from higher values at high prevalence
(sensitivity: 0.65 at 80% prevalence)[15] to low values at very low prevalence (sensitivity: 0.3 at
18% prevalence) [14].
Molecular methods, such as Polymerase Chain Reaction (PCR) and quantitative PCR
(qPCR) techniques, offer a significantly more sensitive diagnostic method by detecting STH
DNA in the stool specimen, almost certainly from eggs, and amplifying it to ensure more reli-
able measures of concentration [14,16,17]. The initial quantity of DNA in the sample can be
quantified indirectly by counting the number of cycles of amplification necessary to reach a
predetermined detection threshold [16]. Sensitivities in the range of 98% are reported, depend-
ing on the efficiency of the protocol used for extraction of the DNA [14]. The main drawbacks
for these techniques are the expense, the potential for contamination within the laboratory, the
need for relatively advanced equipment with a reliable supply chain, and extensive training of
laboratory staff. In most cases, field-collected samples need to be properly preserved and stored
before they get transported to centralised facilities for subsequent processing and testing [18].
In this situation, pooling of stool samples represents an appealing approach whereby the time
and cost (translated to labour time needed to perform a number of DNA extractions and PCR
runs) can be significantly reduced while still maintaining the sensitivity of the diagnostic test
performed and hence ascertaining the presence of STH species in all the samples collected.
Pooling consists of combining equal portions from each sample that will make up the pool
and combining them into one sample, usually with a homogenisation step to ensure sufficient
mixing. The number of samples that make up a pool is a key variable of the protocol. Aggregat-
ing samples into a pool allows bulk properties of the constituent samples to be measured with
a single test. There is a range of theoretical and experimental work on the estimation of faecal
egg count by pooling, for STH infections in both animals and humans [19–21]. Comparisons
of mean egg counts and egg count reduction rates from individual and pooled samples show
reasonable levels of agreement, improving as pool sizes increase [22].
The most common approach is the use of pooling to detect presence of an infectious agent.
Assuming sufficient sensitivity, a negative test for the pool implies all constituent samples are
negative. The larger the pool size, the fewer tests that need to be made. The process of pooling
naturally ‘averages’ the intensities of constituent samples and hence the sensitivity and speci-
ficity for detection at pool level may differ from that at the individual sample level. At low lev-
els of infection, a pool consisting of a single positive sample will require greater sensitivity due
to an effective dilution. The impact of pooling on the sensitivity of detection and egg count
estimation has been investigated using the Kato-Katz diagnostic for STHs and schistosomiasis
[23]. The results indicate that the detection sensitivity was considerably reduced by pooling, as
expected, while estimated egg counts were generally increased. A similar study based on the
POC-CCA diagnostic technique for schistosomiasis found much lower drops in sensitivity
with pooling, perhaps reflecting the better inherent sensitivity of the method [24]. Other work
has attempted to use detailed models of worm distribution and diagnostics [12] to address sen-
sitivity and specificity for pooled samples for Schistosoma mansoni [25,26]. The relationship
between the probability of individual samples being positive, and pools being positive, can be
used to estimate prevalence from pooled results, but standard estimators can be strongly biased
[27].
An extension of the pooling technique is to use it as a method to identify the test status of
all samples. In this case, pools with a positive test result have their constituent samples individ-
ually tested to identify infected individuals [28]. In this paper, we examine using this approach
Optimzing the pooling strategy for STH prevalence estimation
PLOS Neglected Tropical Diseases | https://doi.org/10.1371/journal.pntd.0007196 March 21, 2019 3 / 14

to calculate the prevalence of STH infection in a population. We also assess the optimal design
for a pooling scheme, in order to minimize the number of tests performed.
The main aim of this study is to examine the circumstances under which pooling of samples
from a survey to measure prevalence is potentially more cost-effective than testing all samples,
where the cost of a survey design is a function of the number of tests or DNA extractions that
are required. The question arises specifically in the context of the DeWorm3 project, a cluster
randomized trial to test the feasibility of interrupting STH transmission using biannual MDA
targeting all age groups funded by the Bill and Melinda Gates Foundation [4,29]. The project
includes cross-sectional prevalence surveys conducted using qPCR, to be completed at base-
line, mid-point and end-point of the trial. However, without prior information on the preva-
lence of infection within a cluster, it is impossible to say whether pooling will be more or less
cost-effective than testing all samples individually, or indeed what sampling and pooling strat-
egy might be most efficient.
We construct probability distributions for the cost of testing and overall cost-effectiveness
of pooling and use both to investigate the dependence of cost effectiveness on the underlying
prevalence of STH infection in a given population and the number of samples aggregated into
a pool. Note that the method is designed to be used for all stool sample diagnostics for faecal
egg detection released by human helminths, not just STHs. We also examine the effect of
uncertainty in the underlying prevalence on cost-effectiveness and look at how sparse prior
information on prevalence can be used to make decisions on the sampling protocol to be
employed.
Methods
Expected relative cost of a pooling strategy
Our method for using pooling to calculate prevalence is analogous to that outlined by Corst-
jens et al for identifying infected individuals through pooling [28]. Samples are grouped in
pools of size n. Aliquots from each pool are then extracted and tested using qPCR. Assuming
100% sensitivity for the test, a negative result indicates that all constituent samples are also neg-
ative. For pools that test positive, all constituent samples are individually processed and tested
to ascertain how many are positive.
For a pool size of n and an underlying prevalence, π, the probability of a positive pool is
pþ ¼ 1 � ð1 � pÞn
ð1Þ
Assuming a total number of samples N, the number of positive pools, N+, will have a positive
binomial distribution
Nþ � BinomðNT; pþÞ ð2Þ
where NT ¼ N=n is the total number of pools. This expression assumes that the number of
samples is exactly divisible by the pool size, which would be expected to be a feature of sam-
pling design. The number of tests, T, required to calculate prevalence is also a random variable
T ¼ NT þ nNþ ð3Þ
The cost of the testing strategy will be a function of the number of tests performed. Other
factors that determine cost include equipment overheads, staff time and the details of the test-
ing protocol as the number of tests needed increases [18]. While such detailed cost data are
often not available, they can be acquired. We discuss this important aspect of cost-effectiveness
calculation in detail in the Discussion section. Here, we consider the simplest possible case in
Optimzing the pooling strategy for STH prevalence estimation
PLOS Neglected Tropical Diseases | https://doi.org/10.1371/journal.pntd.0007196 March 21, 2019 4 / 14
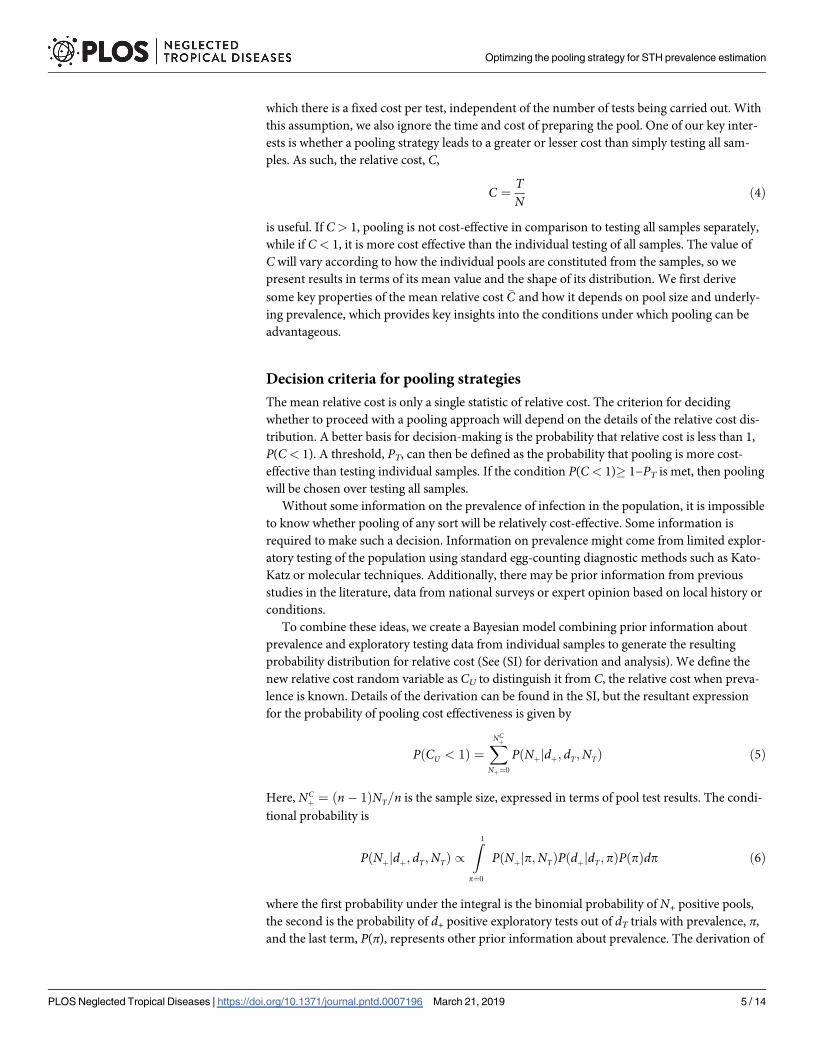
which there is a fixed cost per test, independent of the number of tests being carried out. With
this assumption, we also ignore the time and cost of preparing the pool. One of our key inter-
ests is whether a pooling strategy leads to a greater or lesser cost than simply testing all sam-
ples. As such, the relative cost, C,
C ¼TN
ð4Þ
is useful. If C> 1, pooling is not cost-effective in comparison to testing all samples separately,
while if C< 1, it is more cost effective than the individual testing of all samples. The value of
C will vary according to how the individual pools are constituted from the samples, so we
present results in terms of its mean value and the shape of its distribution. We first derive
some key properties of the mean relative cost �C and how it depends on pool size and underly-
ing prevalence, which provides key insights into the conditions under which pooling can be
advantageous.
Decision criteria for pooling strategies
The mean relative cost is only a single statistic of relative cost. The criterion for deciding
whether to proceed with a pooling approach will depend on the details of the relative cost dis-
tribution. A better basis for decision-making is the probability that relative cost is less than 1,
P(C< 1). A threshold, PT, can then be defined as the probability that pooling is more cost-
effective than testing individual samples. If the condition P(C< 1)� 1−PT is met, then pooling
will be chosen over testing all samples.
Without some information on the prevalence of infection in the population, it is impossible
to know whether pooling of any sort will be relatively cost-effective. Some information is
required to make such a decision. Information on prevalence might come from limited explor-
atory testing of the population using standard egg-counting diagnostic methods such as Kato-
Katz or molecular techniques. Additionally, there may be prior information from previous
studies in the literature, data from national surveys or expert opinion based on local history or
conditions.
To combine these ideas, we create a Bayesian model combining prior information about
prevalence and exploratory testing data from individual samples to generate the resulting
probability distribution for relative cost (See (SI) for derivation and analysis). We define the
new relative cost random variable as CU to distinguish it from C, the relative cost when preva-
lence is known. Details of the derivation can be found in the SI, but the resultant expression
for the probability of pooling cost effectiveness is given by
PðCU < 1Þ ¼XN
Cþ
Nþ¼0
PðNþjdþ; dT;NTÞ ð5Þ
Here, NCþ¼ ðn � 1ÞNT=n is the sample size, expressed in terms of pool test results. The condi-
tional probability is
PðNþjdþ; dT;NTÞ /
Z1
p¼0
PðNþjp;NTÞPðdþjdT; pÞPðpÞdp ð6Þ
where the first probability under the integral is the binomial probability of N+ positive pools,
the second is the probability of d+ positive exploratory tests out of dT trials with prevalence, π,
and the last term, P(π), represents other prior information about prevalence. The derivation of
Optimzing the pooling strategy for STH prevalence estimation
PLOS Neglected Tropical Diseases | https://doi.org/10.1371/journal.pntd.0007196 March 21, 2019 5 / 14

this relationship can be found in the SI. We use this model to examine the dependence of the
probability of efficient pooling, and hence the decision to pool, on the amount and type of
information available on the underlying prevalence of disease.
Results
We first consider the case in which the underlying prevalence of infection, π, is known. The
value of the relative cost, C, can vary in the range [1/n,1+1/n], where pooling is cost effective
when C< 1. The distribution of relative cost is examined further below and in the SI, but the
dependence of relative cost on pool size and prevalence can be seen by considering the case in
which the expected relative cost, �C ¼ 1. This acts as a discriminant, dividing cases in which
the expected cost effectiveness is positive for pooling from those in which it is negative. In the
SI, we calculate the prevalence as a function of pool size for unit relative cost as
pcðnÞ ¼ 1 � exp �lnðnÞn
� �
ð7Þ
This discriminant characterises any combination of pool size and prevalence as, on average,
cost effective or not (Fig 1). For a given pool size, prevalence below πc(n)are cost effective, on
average. In the figure, pool size is an integer quantity and the continuous line of the discrimi-
nant in the figure is a series of points at whole number values. Critical prevalence has a maxi-
mum value
pmaxc ¼ 1 � exp �
1
e
� �
’ 0:31 ð8Þ
Consequently, pooling is, on average, not cost effective for all prevalence greater than
31%, independent of the size of the pools. The maximum critical prevalence is achieved for
Fig 1. Expected relative cost as a function of prevalence and pool size. A) Combinations of prevalence and pool size for which pooling is cost
effective or not, on average. Solid line indicates combinations for which pooling and individual sampling are matched. Grey lines indicate contours for
relative cost at 50% and 80% (as formulated by equation S5 in the SI). Dotted line shows most cost-effective pool size for a given prevalence. B) Relative
cost of optimum pool size as a function of prevalence. Pool sizes for prevalence are given by the dotted line in panel A.
https://doi.org/10.1371/journal.pntd.0007196.g001
Optimzing the pooling strategy for STH prevalence estimation
PLOS Neglected Tropical Diseases | https://doi.org/10.1371/journal.pntd.0007196 March 21, 2019 6 / 14

n = e’ 2.72. Hence the pool size which is cost effective for the largest range of prevalence is 3,
the nearest integer. As pool size increases, the critical prevalence for cost effectiveness falls.
Within the cost-effective region, the optimally pool size (on average) for a given preva-
lence is shown by the dotted line in Fig 1A. Optimal pool size increases slowly with decreas-
ing prevalence but doesn’t rise above 5 until prevalence is below 5%. Below this prevalence,
however, optimal pool size grows rapidly with decreasing prevalence. Fig 1B shows how the
mean relative cost effectiveness for optimum pool size varies with prevalence. As prevalence
decreases below the value at which pooling becomes a viable option, the cost effectiveness
gradually increases. For prevalence values around 2%, pooling on average requires only a
fifth of the number of extractions and tests as would be required if testing samples
individually.
The effect of uncertainty in the underlying infection prevalence is analysed in detail in the
SI. We present the main results in this section. The introduction of uncertainty in underlying
prevalence has two effects on the probability distribution of relative cost. Firstly, uncertainty of
the underlying prevalence increases the overall variance. The variance including uncertainty is
(See SI)
varðCUÞ ¼NT � 1
NTvarðpþÞ þ varðCÞ ð9Þ
where CU is the relative cost with uncertainty in the underlying prevalence. The variance is the
sum of the variance associated with pool construction and that associated with the uncertainty
in the underlying prevalence. For any reasonable number of pools employed, the first term is
effectively var(p+). The mean cost effectiveness is also altered by the additional uncertainty in
prevalence. The mean can be expressed as
�CU ¼1
nþ1 �
Bðdþ þ 1; dT � �pdT þ nþ 1Þ
Bðdþ þ 1; dT � �pdT þ 1Þð10Þ
where B(. . .) is the beta function, dT is the total number of exploratory tests and �p ¼ dþ=dT is
the expected underlying prevalence. In general, it is not clear whether �CU is greater than or less
than �C; that is, whether the uncertainty in prevalence leads to a higher or lower relative cost.
However, it is the case that for low prevalence situations where �p < 1=ðnþ 1Þ, the cost is
increased by uncertainty (See SI). Fig 2 shows the effect of uncertainty in prevalence on relative
cost.
Fig 2A shows the effect on the critical prevalence/pool size relationship for dT = 10, effec-
tively correcting Fig 1A for the effects of uncertainty in underlying prevalence. Critical preva-
lence (100%) is higher for larger pool sizes but lower for the most cost-effective lower pool
sizes, but the effect is not large. The maximum prevalence for cost effective pooling is only
marginally affected. The figure also compares contours for 80% and 50% relative cost between
known and uncertain prevalence. Prevalence uncertainty increases the separation of the 100%
and 80% cost contours, with 80% achievable only below a prevalence of 15%. A relative cost of
50% is not possible within the range of pool sizes examined. As shown in Fig 2B, the difference
between the uncertain and known prevalence result drops as the sample size increases and the
differences become negligible for sample sizes above 50.
Fig 3 shows the probability that pooling will be cost effective, given the number of explor-
atory tests (on the left) and the number of those that are positive (along the bottom). The prev-
alence prior is set to be uninformative. The diagnostic test in the exploratory phase is assumed
to have 100% sensitivity and specificity in this case and pool size is set at 5. Taking the proba-
bility of cost effectiveness, PT = 80% as the pooling choice threshold, the green region of Fig 3
Optimzing the pooling strategy for STH prevalence estimation
PLOS Neglected Tropical Diseases | https://doi.org/10.1371/journal.pntd.0007196 March 21, 2019 7 / 14

defines the exploratory results that would trigger the use of pooling for this size of pool. Five or
more negative tests with no positives exceeds the threshold, as does 10 or more tests with one
or fewer positives. Having reached the threshold for choosing pooling, it’s possible that further
information can invalidate that choice. For example, 5 negative tests suggest pooling, but if the
next test were positive, the support for pooling would drop to 60%, and as such below the cho-
sen threshold. The band of yellow and orange result combinations that run diagonally across
the figure correspond to the critical prevalence for pool size of 5. Fig 2A shows this to be about
27% for 10 samples. The broken grey line tracks this prevalence across the table,
approximately.
Kato-Katz sensitivities for hookworm vary considerably (25–65%) and appear to decline
as prevalence reduces in a roughly linear fashion (evidence from the literature on this is very
variable and often hard to interpret). Our models of diagnostic sensitivity as a function of
Fig 2. The effect of prevalence uncertainty on mean relative cost. A) Prevalence for expected relative cost of 100%,
80% and 50% with sample size of 10. Grey lines show relative costs for known prevalence, as in Fig 1A. Y axis indicates
known underlying prevalence or mean prevalence from exploratory data when prevalence is unknown. B) Relative cost
against exploratory sample size. Broken line shows relative cost when prevalence is known and set to the mean from
the exploratory tests. (Mean prevalence 15%, pool size of 5).
https://doi.org/10.1371/journal.pntd.0007196.g002
Fig 3. Probability of greater efficiency using pooling, as a function of the number of exploratory tests and the
number of positive results. The exploratory diagnostic test is assumed to be perfect in this case. Prior knowledge of
prevalence is uninformative. Pool size = 5. Green => 80%, yellow = 80% -> 50%, orange = 50% -> 20%, red<= 20%.
The broken grey line approximately tracks the critical prevalence for 100% relative cost for pool size of 5 and
exploratory sample size of 10.
https://doi.org/10.1371/journal.pntd.0007196.g003
Optimzing the pooling strategy for STH prevalence estimation
PLOS Neglected Tropical Diseases | https://doi.org/10.1371/journal.pntd.0007196 March 21, 2019 8 / 14

prevalence indicate that for hookworm, sensitivity is increasing approximately linearly with
underlying prevalence. Fig 4 shows the support for pooling for hookworm with sensitivity
varying from 30% at the lowest prevalences to 70% for 100% prevalence. This increases the
number of samples needed to support a decision to pool, but does not change the basic struc-
ture i.e. support for pooling is only generated by finding very low numbers of positive samples.
Discussion
Analysis of mean relative cost reveals some of the main qualitative and quantitative features of
pooling as compared to complete processing of individual samples. The line defining neutral
relative cost, �C ¼ 1, suggests that the maximum prevalence for which pooling could be advan-
tageous is given by pmaxc , which is approximately 31%. The closest integer pool size to this point
of maximum effectiveness is at a pool size of three (Fig 1A). The value of the maximum preva-
lence and the pool size at which it occurs do not vary significantly with uncertainty as to the
underlying prevalence.
Analysis shows that the most efficient pool size for prevalence values below pmaxc remains
below five down to approximately 5% prevalence. However, below 5%, there is a rapid increase
in optimal pool size, with a 2% prevalence having an optimal pool size close to 10. It should be
noted that pool sizes of five are considerably smaller than those used purely for the detection
of the presence of infectious agents, rather than assessing the prevalence of infection [19]. The
relative cost for optimal pool size is shown in Fig 1B. The trend indicates that the relative cost
is minimum for the lowest prevalence values. A prevalence rate below about 10% indicates that
pooling is less than half the cost of testing all samples individually.
The shape of the optimal pool size curve in Fig 1A suggests that, in the absence of accurate
prevalence information, 5 is a good default pool size. However, in areas that have been sub-
jected to multiple rounds of MDA, a larger pool size of 10 would lead to more cost effective
pooling, assuming no loss of sensitivity. In particular, this would apply in the case of transmis-
sion assessment surveys (TAS). Currently, there is no formally endorsed TAS for STHs, but
they typically involve large sample sizes to compare measured prevalence to threshold values
at the 1–2% level [30]. Key to the use of pooling in this context, however, would be assessing
whether pooling sensitivity could still reliably be assumed to be 100% for pooled samples from
lightly infected individuals.
Fig 4. Probability of greater efficiency using pooling, as a function of the number of exploratory tests and the
number of positive results. The exploratory diagnostic test is assumed to have a sensitivity that varies smoothly from
30% for the lowest prevalence to 70% for the highest. Prior knowledge of prevalence is uninformative. Pool size = 5.
Green => 80%, yellow = 80% -> 50%, orange = 50% -> 20%, red<= 20%.
https://doi.org/10.1371/journal.pntd.0007196.g004
Optimzing the pooling strategy for STH prevalence estimation
PLOS Neglected Tropical Diseases | https://doi.org/10.1371/journal.pntd.0007196 March 21, 2019 9 / 14

The issue of qPCR sensitivity to low egg counts and, by extension, sample dilution, is made
complicated by the nature of the qPCR process. A positive result for a sample is the result of a
detection threshold being reached within a certain number of amplification cycles (the CT
value). Detection sensitivity as a function of egg count or dilution therefore tends to have a
binary character. If the threshold is attained within the maximum number of cycles used, the
sensitivity tends to be close to 100%. When CT values get close to the maximum value, sensi-
tivity drops rapidly to very low levels. Additionally, the detection threshold and the maximum
number of cycles performed are calibrated with respect to the preparation protocol to be used
for a batch of samples. As a result, point at which sensitivity falls away is very dependent on
the particular experimental set up and hard to generalise. The characteristics of sensitivity as a
function of dilution are the subject of current research.
The introduction of uncertainty in the underlying prevalence both increases the variance of
the relative cost and also biases its mean value. However, as shown in Fig 2, even with quite
poor information on prevalence, the bias in expected relative cost is only plus or minus a few
percentage points. Relatively little information on prevalence is required to achieve good sup-
port for a pooling approach. If the exploratory data is assumed to have 100% sensitivity, as
would be the case for qPCR, as few as 5 individual tests can be sufficient to reach 80% support
for pooling if the underlying prevalence is very low (Fig 3). Support of 80% for individual sam-
pling can be achieved with only a couple of data points, if the underlying prevalence is very
high. There is a range of exploratory data results that give no clear indication for either strategy
(that is, support for pooling is between 20% and 80%). This occurs when exploratory results
indicate prevalence is close to the critical value at which relative cost is 1. The decision for or
against pooling will be most difficult when the costs of the two alternatives are closely
balanced.
When exploratory data are collected through Kato-Katz diagnostics, the reduced sensitivity
increases the amount of data necessary for a decision to be made (Fig 4). This situation is likely
to be quite common, as most prevalence surveys are currently conducted using microscope-
based techniques. However, in order to take advantage of this, the sensitivity of the Kato-Katz
method would have to be well characterised. Since this feature of KK is so poorly documented
and is context- and technician-dependent, it would be necessary to use the most pessimistic
sensitivity figures, which would push up the amount of data required for a decision and biasing
the decision process in the direction of caution and against pooling. However, the situation
seems very different for the highly sensitive PCR diagnostic method; the method further bene-
fits from inclusion of internal controls to ensure successful extraction of the DNA/target pres-
ent and from the consistency of application with accepted ranges of the detectable value
measured assuming a standardized level of technician competency.
In this study, we have used a relative cost metric as the basis on which to discriminate
between pooling and testing of all samples separately. Relative cost, as defined in the Methods
section, has the advantage that it is simple to interpret and is a linear function of the number
of tests performed. The cost metric comprises two parts; the function that converts the number
of tests done into a cost (the cost function) and the way in which the cost of pooling and of
testing all samples are compared.
The cost of a sampling strategy is made up of the cost of consumables, such as reagents,
primers and extraction kits, and the cost of staff time and equipment requirements. For con-
sumables, there is the possibility of economies of scale through bulk buying. These would
introduce non-linearities into the relationship between number of extractions and cost, which
would apply to both strategies. However, the cost of consumables is likely to be swamped by
the much larger costs of machinery purchase and staff salaries for highly-trained technicians.
These costs are likely to scale linearly with numbers of tests, since they reflect the number of
Optimzing the pooling strategy for STH prevalence estimation
PLOS Neglected Tropical Diseases | https://doi.org/10.1371/journal.pntd.0007196 March 21, 2019 10 / 14

man-hours per test. Non-linear effects may arise if more equipment or technicians are
required to manage the workload. Automated sample processing, extraction and PCR offers
the opportunity to significantly reduce the cost of personnel at the expense of larger up-front
equipment costs.
The process described as testing in the main text comprises three stages. The most time-
consuming stage, and hence the highest cost, is the extraction of DNA from samples, although
the pooling process represents a small but not insignificant amount of work [23]. This requires
bead-beating and centrifuging of samples [31]. The final PCR amplification of extracted DNA
is much less labour intensive, but may be limited by the availability of PCR machines. For
pooled samples, there is a preliminary stage of creating pools from individual samples [22].
Hence pooling strategies require some additional work, but it is small in comparison to extrac-
tion steps. Such assumptions do require validated approaches using the most efficient pooling
approach. The small additional cost associated with pooling samples will reduce slightly the
relative cost of pooling described in our analysis. Taking this into account, the neutral cost
effectiveness curve of Fig 1A would drop down to slightly lower prevalence values. In order to
assess the absolute cost of different sampling strategies, detailed cost information on the differ-
ent stages of testing will be required. It is likely that this kind of cost information will be con-
text-specific but it should be easy to collect.
The relative cost metric used in the current work has the advantage that absolute costs can-
cel out, provided the cost functions are linear with the same cost per test. However, this may
not be the best cost metric for decision making. It is possible that relative cost may be less
important than the absolute difference in outlay between the two sampling approaches. In that
case, the difference in cost may be a better metric. While this wouldn’t affect the expected cost-
effectiveness as a function of prevalence and pool size as shown in Fig 1, decisions based on
exploratory data would now need to be based on the probability of achieving a given cost or
saving with respect to testing all samples. This may result in different decisions being made
than those suggested by analyses based on relative costs. The theory described in this paper
can be easily adapted to address the use of different metrics.
Two potential features of STH prevalence surveys not considered in this paper are the prev-
alence of the different species that make up the STH classification, and spatial or geographical
heterogeneity in infection prevalence. In the case of multiple species, each species will require
an independent PCR run for detection if using a singleplex or multi-parallel protocol. How-
ever, the pooling and DNA extraction stages of testing will act on all species present simulta-
neously and these are the costliest parts of the process. Hence the optimal protocol is probably
to use pooling for all species of interest if it is indicated as optimal for any of them.
Large-scale surveys are likely to comprise sub-regions across which prevalence will vary.
Similarly, cluster-based trials will feature clusters containing a range of prevalence values in
sub-populations (or villages) within the cluster. If a wide range of prevalence is indicated
(based on prior prevalence information), greater cost effectiveness may be achievable by
assigning sub-regions or clusters to different sampling strategies. Whether this is justified will
depend on what additional costs are incurred by having a dual sample strategy. However,
these costs, if known, could be included in the decision-making analysis.
The analysis presented here represents a basic framework for understanding the cost effec-
tiveness of pooling strategies and a guide to decision-making about the best strategy to adopt
in any given setting. Our findings provide a general picture of when to use pooling, how to
judge pool sizes, and how prior information can be used to make better decisions. When con-
sidering pooling strategy and decisions in specific cases, details of pooling protocols, costs and
decision-making priorities will need to be factored into the model and the appropriate
Optimzing the pooling strategy for STH prevalence estimation
PLOS Neglected Tropical Diseases | https://doi.org/10.1371/journal.pntd.0007196 March 21, 2019 11 / 14

calculations made as detailed in this paper. Acquiring detailed cost data is an important
requirement in applying these methods.
Supporting information
S1 File. Model derivation and analysis.
(PDF)
Acknowledgments
We gratefully acknowledge the work of Steve Williams and his group at Smith College for
their work on the design of qPCR pooling techniques that underlies the current work.
Author Contributions
Conceptualization: James E. Truscott, Julia C. Dunn, Marina Papaiakovou, Fabian Schaer,
Marleen Werkman, D. Timothy J. Littlewood, Judd L. Walson, Roy M. Anderson.
Formal analysis: James E. Truscott.
Funding acquisition: Judd L. Walson.
Methodology: James E. Truscott, Julia C. Dunn, Marina Papaiakovou.
Writing – original draft: James E. Truscott, Julia C. Dunn, Marleen Werkman.
Writing – review & editing: James E. Truscott, Julia C. Dunn, Marina Papaiakovou, Fabian
Schaer, Marleen Werkman, D. Timothy J. Littlewood, Judd L. Walson, Roy M. Anderson.
References1. WHO. Preventive chemotherapy in human helminthiasis: coordinated use of anthelminthic drugs in con-
trol interventions: a manual for health professionals and programme managers [Internet]. Geneva;
2006. http://whqlibdoc.who.int/publications/2006/9241547103_eng.pdf
2. WHO. Eliminating soil-transmitted helminthiasis as a public health problem in children: progress report
2001–2010 and strategic plan 2011–2020 [Internet]. Geneva; 2012. http://whqlibdoc.who.int/
publications/2012/9789241503129_eng.pdf
3. WHO. Helminth control in school age children: a guide for managers of control programmes. Second.
Geneva: World Health Organization; 2011.
4. Asbjornsdottir KH, Ajjampur SSR, Anderson RM, Bailey R, Gardiner I, Halliday KE, et al. Assessing the
feasibility of interrupting the transmission of soil-transmitted helminths through mass drug administra-
tion: The DeWorm3 cluster randomized trial protocol. Garba A, editor. PLoS Negl Trop Dis. 2018; 12:
e0006166. https://doi.org/10.1371/journal.pntd.0006166 PMID: 29346377
5. Brooker SJ, Mwandawiro CS, Halliday KE, Njenga SM, Mcharo C, Gichuki PM, et al. Interrupting trans-
mission of soil-transmitted helminths: a study protocol for cluster randomised trials evaluating alterna-
tive treatment strategies and delivery systems in Kenya. BMJ Open. 2015; 5: e008950. https://doi.org/
10.1136/bmjopen-2015-008950 PMID: 26482774
6. Truscott JE, Werkman M, Wright JE, Farrell SH, Sarkar R, Asbjornsdottir K, et al. Identifying optimal
threshold statistics for elimination of hookworm using a stochastic simulation model. Parasites and Vec-
tors. 2017;10.
7. Werkman M, Wright JE, Truscott JE, Easton A V, Oliveira RG, Toor J, et al. Testing for soil-transmitted
helminth transmission elimination: Analysing the impact of the sensitivity of different diagnostic tools.
PLoS Negl Trop Dis. 2018; 12: e0006114. https://doi.org/10.1371/journal.pntd.0006114 PMID:
29346366
8. Nikolay B, Brooker SJ, Pullan RL. Sensitivity of diagnostic tests for human soil-transmitted helminth
infections: a meta-analysis in the absence of a true gold standard. Int J Parasitol. 2014; 44: 765–74.
https://doi.org/10.1016/j.ijpara.2014.05.009 PMID: 24992655
9. Katz N, Chaves A, Pellegrino J. A simple device for quantitative stool thick-smear technique in Schisto-
somiasis mansoni. Rev Inst Med Trop Sao Paulo. 1972; 14: 397. PMID: 4675644
Optimzing the pooling strategy for STH prevalence estimation
PLOS Neglected Tropical Diseases | https://doi.org/10.1371/journal.pntd.0007196 March 21, 2019 12 / 14

10. Speich B, Knopp S, Mohammed KA, Khamis IS, Rinaldi L, Cringoli G, et al. Comparative cost assess-
ment of the Kato-Katz and FLOTAC techniques for soil-transmitted helminth diagnosis in epidemiologi-
cal surveys. Parasit Vectors. 2010; 3: 71. https://doi.org/10.1186/1756-3305-3-71 PMID: 20707931
11. Anderson RM, Schad GA. Hookworm burdens and faecal egg counts: An analysis of the biological
basis of variation. Trans R Soc Trop Med Hyg. 1985/01/01. 1985; 79: 812–825. https://doi.org/10.1016/
0035-9203(85)90128-2 PMID: 3832493
12. de Vlas SJ, Gryseels B, van Oortmarssen GJ, Polderman AM, Habbema JDF. A model for variations in
single and repeated egg counts in schistosoma mansoni infections. Parasitology. 1992; 104: 451.
https://doi.org/10.1017/S003118200006371X PMID: 1641245
13. Arndt MB, John-Stewart G, Richardson BA, Singa B, van Lieshout L, Verweij JJ, et al. Impact of Hel-
minth Diagnostic Test Performance on Estimation of Risk Factors and Outcomes in HIV-Positive Adults.
Rodrigues MM, editor. PLoS One. 2013; 8: e81915. https://doi.org/10.1371/journal.pone.0081915
PMID: 24324729
14. Easton A V, Oliveira RG, O’Connell EM, Kepha S, Mwandawiro CS, Njenga SM, et al. Multi-parallel
qPCR provides increased sensitivity and diagnostic breadth for gastrointestinal parasites of humans:
field-based inferences on the impact of mass deworming. Parasit Vectors. 2016; 9: 38. https://doi.org/
10.1186/s13071-016-1314-y PMID: 26813411
15. Sayasone S, Utzinger J, Akkhavong K, Odermatt P. Repeated stool sampling and use of multiple tech-
niques enhance the sensitivity of helminth diagnosis: A cross-sectional survey in southern Lao People’s
Democratic Republic. Acta Trop. 2015; 141: 315–321. https://doi.org/10.1016/j.actatropica.2014.09.
004 PMID: 25225157
16. Pilotte N, Papaiakovou M, Grant JR, Bierwert LA, Llewellyn S, McCarthy JS, et al. Improved PCR-
Based Detection of Soil Transmitted Helminth Infections Using a Next-Generation Sequencing
Approach to Assay Design. Albonico M, editor. PLoS Negl Trop Dis. 2016; 10: e0004578. https://doi.
org/10.1371/journal.pntd.0004578 PMID: 27027771
17. Mejia R, Vicuña Y, Broncano N, Sandoval C, Vaca M, Chico M, et al. A novel, multi-parallel, real-time
polymerase chain reaction approach for eight gastrointestinal parasites provides improved diagnostic
capabilities to resource-limited at-risk populations. Am J Trop Med Hyg. 2013; 88: 1041–7. https://doi.
org/10.4269/ajtmh.12-0726 PMID: 23509117
18. Papaiakovou M, Pilotte N, Baumer B, Grant J, Asbjornsdottir K, Schaer F, et al. A comparative analysis
of preservation techniques for the optimal molecular detection of hookworm DNA in a human fecal spec-
imen. PLoS Negl Trop Dis. 2018; 12: e0006130. https://doi.org/10.1371/journal.pntd.0006130 PMID:
29346412
19. Levecke B, Anderson RM, Berkvens D, Charlier J, Devleesschauwer B, Speybroeck N, et al. Mathemat-
ical Inference on Helminth Egg Counts in Stool and Its Applications in Mass Drug Administration Pro-
grammes to Control Soil-Transmitted Helminthiasis in Public Health. Adv Parasitol. 2015; 87: 193–247.
https://doi.org/10.1016/bs.apar.2015.01.001 PMID: 25765196
20. Rinaldi L, Levecke B, Bosco A, Ianniello D, Pepe P, Charlier J, et al. Comparison of individual and
pooled faecal samples in sheep for the assessment of gastrointestinal strongyle infection intensity and
anthelmintic drug efficacy using McMaster and Mini-FLOTAC. Vet Parasitol. 2014; 205: 216–223.
https://doi.org/10.1016/j.vetpar.2014.06.011 PMID: 25002307
21. Kure A, Mekonnen Z, Dana D, Bajiro M, Ayana M, Vercruysse J, et al. Comparison of individual and
pooled stool samples for the assessment of intensity of Schistosoma mansoni and soil-transmitted hel-
minth infections using the Kato-Katz technique. Parasit Vectors. 2015; 8: 489. https://doi.org/10.1186/
s13071-015-1101-1 PMID: 26400064
22. Mekonnen Z, Meka S, Ayana M, Bogers J, Vercruysse J, Levecke B. Comparison of Individual and
Pooled Stool Samples for the Assessment of Soil-Transmitted Helminth Infection Intensity and Drug
Efficacy. Brooker S, editor. PLoS Negl Trop Dis. 2013; 7: e2189. https://doi.org/10.1371/journal.pntd.
0002189 PMID: 23696905
23. Leta GT, French M, Dorny P, Vercruysse J, Levecke B. Comparison of individual and pooled diagnostic
examination strategies during the national mapping of soil-transmitted helminths and Schistosoma
mansoni in Ethiopia. PLoS Negl Trop Dis. 2018; 12: e0006723. https://doi.org/10.1371/journal.pntd.
0006723 PMID: 30199526
24. Lo NC, Coulibaly JT, Bendavid E, N’Goran EK, Utzinger J, Keiser J, et al. Evaluation of a Urine Pooling
Strategy for the Rapid and Cost-Efficient Prevalence Classification of Schistosomiasis. PLoS Negl Trop
Dis. 2016; 10: e0004894. https://doi.org/10.1371/journal.pntd.0004894 PMID: 27504954
25. Muñoz-Zanzi C, Thurmond M, Hietala S, Johnson W. Factors affecting sensitivity and specificity of
pooled-sample testing for diagnosis of low prevalence infections. Prev Vet Med. 2006; 74: 309–322.
https://doi.org/10.1016/j.prevetmed.2005.12.006 PMID: 16427711
Optimzing the pooling strategy for STH prevalence estimation
PLOS Neglected Tropical Diseases | https://doi.org/10.1371/journal.pntd.0007196 March 21, 2019 13 / 14

26. Mitchell S, Pagano M. Pooled testing for effective estimation of the prevalence of Schistosoma man-
soni. Am J Trop Med Hyg. 2012; 87: 850–861. https://doi.org/10.4269/ajtmh.2012.12-0216 PMID:
22964721
27. Colon S, Patil GP, Taillie C. Estimating prevalence using composites. Environ Ecol Stat. 2001; 8: 213–
236. https://doi.org/10.1023/A:1011387523306
28. Corstjens PLAM, Hoekstra PT, de Dood CJ, van Dam GJ. Utilizing the ultrasensitive Schistosoma up-
converting phosphor lateral flow circulating anodic antigen (UCP-LF CAA) assay for sample pooling-
strategies. Infect Dis poverty. 2017; 6: 155. https://doi.org/10.1186/s40249-017-0368-1 PMID:
29089064
29. Means AR, Asbjornsdottir K, Mwandawiro C, Rollinson D, Jacobson J, Littlewood T, et al. Sustaining
Progress towards NTD Elimination: An Opportunity to Leverage Lymphatic Filariasis Elimination Pro-
grams to Interrupt Transmission of Soil-Transmitted Helminths. Lammie PJ, editor. PLoS Negl Trop
Dis. 2016; 10: e0004737. https://doi.org/10.1371/journal.pntd.0004737 PMID: 27416062
30. Anon. Lymphatic filariasis: monitoring and epidemiological assessment of mass drug administration: a
manual for national elimination programmes [Internet]. Geneva; 2011. http://www.who.int/lymphatic_
filariasis/resources/9789241501484/en/
31. Kaisar MMM, Brienen EAT, Djuardi Y, Sartono E, Yazdanbakhsh M, Verweij JJ, et al. Improved diagno-
sis of Trichuris trichiura by using a bead-beating procedure on ethanol preserved stool samples prior to
DNA isolation and the performance of multiplex real-time PCR for intestinal parasites. Parasitology.
2017; 144: 965–974. https://doi.org/10.1017/S0031182017000129 PMID: 28290266
Optimzing the pooling strategy for STH prevalence estimation
PLOS Neglected Tropical Diseases | https://doi.org/10.1371/journal.pntd.0007196 March 21, 2019 14 / 14
Related Documents