Spatial isolation favours the divergence in microcystin net production by Microcystis in Ugandan freshwater lakes William Okello a,b , Veronika Ostermaier a , Cyril Portmann c , Karl Gademann c , Rainer Kurmayer a, * a Austrian Academy of Sciences, Institute for Limnology, Mondseestrasse 9, 5310 Mondsee, Austria b National Fisheries Resources Research Institute (NaFIRRI), Plot No. 39/45 Nile Crescent, P.O. Box 343, Jinja, Uganda c Chemical Synthesis Laboratory, Swiss Federal Institute of Technology (EPFL), SB-ISIC-LSYNC, 1015 Lausanne, Switzerland article info Article history: Received 31 August 2009 Received in revised form 15 February 2010 Accepted 15 February 2010 Available online 18 February 2010 Keywords: Eutrophication Water monitoring Real-time PCR mcy genotype Geographical isolation Population genetics abstract It is generally agreed that the hepatotoxic microcystins (MCs) are the most abundant toxins produced by cyanobacteria in freshwater. In various freshwater lakes in East Africa MC- producing Microcystis has been reported to dominate the phytoplankton, however the regulation of MC production is poorly understood. From May 2007 to April 2008 the Microcystis abundance, the absolute and relative abundance of the mcyB genotype indica- tive of MC production and the MC concentrations were recorded monthly in five freshwater lakes in Uganda: (1) in a crater lake (Lake Saka), (2) in three shallow lakes (Lake Mburo, George, Edward), (3) in Lake Victoria (Murchison Bay, Napoleon Gulf). During the whole study period Microcystis was abundant or dominated the phytoplankton. In all samples mcyB-containing cells of Microcystis were found and on average comprised 20 2% (SE) of the total population. The proportion of the mcyB genotype differed significantly between the sampling sites, and while the highest mcyB proportions were recorded in Lake Saka (37 3%), the lowest proportion was recorded in Lake George (1.4 0.2%). Consequently Microcystis from Lake George had the lowest MC cell quotas (0.03–1.24 fg MC cell 1 ) and resulted in the lowest MC concentrations (0–0.5 mgL 1 ) while Microcystis from Lake Saka consistently showed maximum MC cell quotas (14–144 fg cell 1 ) and the highest MC concentrations (0.5–10.2 mgL 1 ). Over the whole study period the average MC content per Microcystis cell depended linearly on the proportion of the mcyB genotype of Microcystis. It is concluded that Microcystis populations differ consistently and independently of the season in mcyB genotype proportion between lakes resulting in population-specific differences in the average MC content per cell. ª 2010 Elsevier Ltd. All rights reserved. 1. Introduction During the last decades cyanobacteria in freshwater have been of interest due to their ability to produce various hepatotoxic and neurotoxic substances. It is generally agreed that the hepatotoxic microcystins (MCs) are the most abun- dant toxins produced by cyanobacteria in freshwater (WHO, 2006; Erdner et al., 2008; Hudnell, 2008). MCs are cyclic Abbreviations: MC, microcystin; mcy, gene encoding the MC synthetase; HPLC, high performance liquid chromatography; DAD, diode array detection; MALDI-TOF MS, matrix-assisted laser desorption/ionization time-of-flight mass spectrometry; PC, the phycocyanin gene. * Corresponding author. Tel.: þ43 6232 3125 32; fax: þ43 6232 3578. E-mail address: [email protected] (R. Kurmayer). Available at www.sciencedirect.com journal homepage: www.elsevier.com/locate/watres water research 44 (2010) 2803–2814 0043-1354/$ – see front matter ª 2010 Elsevier Ltd. All rights reserved. doi:10.1016/j.watres.2010.02.018

Welcome message from author
This document is posted to help you gain knowledge. Please leave a comment to let me know what you think about it! Share it to your friends and learn new things together.
Transcript
w a t e r r e s e a r c h 4 4 ( 2 0 1 0 ) 2 8 0 3 – 2 8 1 4
Avai lab le a t www.sc iencedi rec t .com
journa l homepage : www.e lsev ie r . com/ loca te /wat res
Spatial isolation favours the divergence in microcystin netproduction by Microcystis in Ugandan freshwater lakes
William Okello a,b, Veronika Ostermaier a, Cyril Portmann c, Karl Gademann c,Rainer Kurmayer a,*a Austrian Academy of Sciences, Institute for Limnology, Mondseestrasse 9, 5310 Mondsee, Austriab National Fisheries Resources Research Institute (NaFIRRI), Plot No. 39/45 Nile Crescent, P.O. Box 343, Jinja, Ugandac Chemical Synthesis Laboratory, Swiss Federal Institute of Technology (EPFL), SB-ISIC-LSYNC, 1015 Lausanne, Switzerland
a r t i c l e i n f o
Article history:
Received 31 August 2009
Received in revised form
15 February 2010
Accepted 15 February 2010
Available online 18 February 2010
Keywords:
Eutrophication
Water monitoring
Real-time PCR
mcy genotype
Geographical isolation
Population genetics
Abbreviations: MC, microcystin; mcy, gDAD, diode array detection; MALDI-TOF Mphycocyanin gene.
* Corresponding author. Tel.: þ43 6232 3125E-mail address: [email protected]
0043-1354/$ – see front matter ª 2010 Elsevidoi:10.1016/j.watres.2010.02.018
a b s t r a c t
It is generally agreed that the hepatotoxic microcystins (MCs) are the most abundant toxins
produced by cyanobacteria in freshwater. In various freshwater lakes in East Africa MC-
producing Microcystis has been reported to dominate the phytoplankton, however the
regulation of MC production is poorly understood. From May 2007 to April 2008 the
Microcystis abundance, the absolute and relative abundance of the mcyB genotype indica-
tive of MC production and the MC concentrations were recorded monthly in five freshwater
lakes in Uganda: (1) in a crater lake (Lake Saka), (2) in three shallow lakes (Lake Mburo,
George, Edward), (3) in Lake Victoria (Murchison Bay, Napoleon Gulf). During the whole
study period Microcystis was abundant or dominated the phytoplankton. In all samples
mcyB-containing cells of Microcystis were found and on average comprised 20� 2% (SE) of
the total population. The proportion of the mcyB genotype differed significantly between
the sampling sites, and while the highest mcyB proportions were recorded in Lake Saka
(37� 3%), the lowest proportion was recorded in Lake George (1.4� 0.2%). Consequently
Microcystis from Lake George had the lowest MC cell quotas (0.03–1.24 fg MC cell�1) and
resulted in the lowest MC concentrations (0–0.5 mg L�1) while Microcystis from Lake Saka
consistently showed maximum MC cell quotas (14–144 fg cell�1) and the highest MC
concentrations (0.5–10.2 mg L�1). Over the whole study period the average MC content per
Microcystis cell depended linearly on the proportion of the mcyB genotype of Microcystis. It is
concluded that Microcystis populations differ consistently and independently of the season
in mcyB genotype proportion between lakes resulting in population-specific differences in
the average MC content per cell.
ª 2010 Elsevier Ltd. All rights reserved.
1. Introduction hepatotoxic and neurotoxic substances. It is generally agreed
During the last decades cyanobacteria in freshwater have
been of interest due to their ability to produce various
ene encoding the MCS, matrix-assisted laser
32; fax: þ43 6232 3578.c.at (R. Kurmayer).er Ltd. All rights reserved
that the hepatotoxic microcystins (MCs) are the most abun-
dant toxins produced by cyanobacteria in freshwater (WHO,
2006; Erdner et al., 2008; Hudnell, 2008). MCs are cyclic
synthetase; HPLC, high performance liquid chromatography;desorption/ionization time-of-flight mass spectrometry; PC, the
.
w a t e r r e s e a r c h 4 4 ( 2 0 1 0 ) 2 8 0 3 – 2 8 1 42804
heptapeptides that share the common structure cyclo
(-D-Ala(1)–X(2)–D-MeAsp(3)–Z(4)–Adda(5)–D-Glu(6)–Mdha(7)), where
X and Z are variable L-amino acids (e.g. MC-LR refers to leucine
and arginine in the variable positions of this peptide), D-
MeAsp is D-erythro-b-iso-methyl-aspartic acid, Adda is (2S, 3S,
8S, 9S )-3-amino-9-methoxy-2,6,8-trimethyl-10-phenyldeca-
4,6-dienoic acid, and Mdha is N-methyl-dehydroalanine.
Structural variation has been reported most frequently in
positions 2, 4, and 7 of the MC molecule resulting in over 80
structural variants that have been characterized from field
samples or isolated strains (Kruger et al., 2009). In a recent
paper, we could show that cyanobacteria contribute signifi-
cantly to the phytoplankton of freshwater lakes in Uganda
while other algal groups like diatoms, green algae, and cryp-
tomonads are of a relatively minor importance (Okello et al.,
2009). We further concluded that in Uganda the genus Micro-
cystis is the only MC-producing genus which is favoured under
more shallow, eutrophic conditions which is in correspon-
dence to the general theory on how physical factors govern
phytoplankton associations (Reynolds et al., 2002). In this
earlier study we did not monitor Microcystis populations as
well as the MC net production of the phytoplankton commu-
nity during different seasons. This is of relevance as it is
known that beside the absolute population abundance it is the
proportion of MC-producing genotypes (those containing the
mcy gene cluster encoding MC synthesis) vs. non-MC-
producing genotypes (those lacking the mcy gene cluster)
that has a decisive influence on MC net production (Sivonen
and Jones, 1999; Kurmayer and Christiansen, 2009). So far
research was unable to document an adaptive value of MC
production, thus making it difficult to identify proximate
factors triggering MC synthesis (Kaebernick and Neilan, 2001;
Schatz et al., 2007). Although the transcription rate of the mcy
gene cluster is increased from low to high irradiance condi-
tions it is generally agreed that MC synthesis is constitutive
(Kaebernick and Neilan, 2001). In the course of seasonal
studies several researchers reported the occurrence of
seasonal shifts in the proportion of MC-producing vs. non-
MC-producing genotypes in dependence on various abiotic
or biotic environmental factors (Briand et al., 2008; Hotto et al.,
2008). In East Africa usually dry seasons with precipitation
minima and wet seasons with maxima of precipitation have
been correlated with changes in phytoplankton composition
(Talling, 1986). During the rainy season (from March to May
and August–November), the phytoplankton in shallow lakes
will be affected directly by a reduced water temperature
(2.5 �C in Kasese and 3 �C in Kampala), reduced light avail-
ability in the water column as well as increased terrestrial
run-off. Only in deep lakes such as the main basin of Lake
Victoria, the mixing regime will change, as a higher stability of
the water column has been described during the dry season
(Talling, 1986). These physical changes in the water column
have a significant effect on phytoplankton community
composition (Talling, 1987). Generally in shallow lakes less
seasonality in phytoplankton composition is observed when
compared with the main basin of Lake Victoria.
In contrast to the seasonal influence we recently empha-
sized that it is rather the spatial isolation of populations than
the seasonal influence of biotic or abiotic factors that leads to
differences in the population structure of MC-producing
genotypes (Kurmayer and Gumpenberger, 2006). We further
concluded that the structural variation within the position 2 of
the MC molecule is selectively neutral (Kurmayer and
Gumpenberger, 2006) implying that genetic drift resulting
from geographic isolation has the potential to lead to new
MC variants that appear unique and dominant in particular
waterbodies, i.e. [Asp3, Dhb7]-MC-HtyY and [Asp3, Dhb7]-
MC-HtyHty (Christiansen et al., 2008a). For lakes located in the
Alps of Austria, Germany and Switzerland we hypothesized
that populations diverge in their mcy genotype composition at
least during consecutive years (Ostermaier and Kurmayer,
2009). However, we also observed that the genetic population
structure changed between years, for example due to the
extinction of the population during winter and a subsequent
re-immigration of new genotypes (Kurmayer and
Gumpenberger, 2006).
In this study we aimed to investigate the seasonal devel-
opment of Microcystis and potential MC-producing genotypes
and the resulting MC concentrations in five freshwater lakes
in Uganda. Microcystis has been reported to dominate in
shallow eutrophic lakes such as Lake George at least for
decades (Ganf, 1974). While the shallow lakes close to the
Ruwenzori mountain (L. George, L. Edward, L. Mburo) are
naturally eutrophic, the genus Microcystis also has become
abundant in bays of Lake Victoria as a result of human
induced eutrophication (Hecky, 1993; Mugidde, 1993;
Verschuren et al., 2002). It is hypothesized that if spatial
isolation leads to genetic divergence in MC production then
the variation in mcy genotype proportion between sites should
significantly exceed the variation in mcy genotype proportion
that is observed within sites during the season. Vice versa if
spatial isolation is of minor importance, the seasonal varia-
tion in mcy genotype proportion as caused by unknown biotic
and abiotic factors that is observed within sites should
significantly exceed the between site variation.
2. Materials and methods
2.1. Description of the study sites
From five freshwater lakes in Uganda six sampling sites were
chosen (Fig. 1): (1) A site in the center of Lake Saka (N0�41.6700,
E30�14.6670), mean depth of 3.6 m. Lake Saka is a small crater
lake (1.4 km2) located at an altitude of 1520 m.a.s.l.. The other
sampling sites included the shallow eutrophic lakes (2) Lake
George, (3) Lake Edward, (4) Lake Mburo as well as Lake
Victoria, (5) Murchison Bay near Kampala, and (6) Napoleon
Gulf near Jinja, which were described previously (Okello et al.,
2009).
2.2. Field sampling and analysis of Microcystisabundance
Depth-integrated water samples and plankton net samples (30
mm mesh size) were taken monthly from May 2007 until April
2008 as described (Okello et al., 2009). For DNA and MC anal-
ysis aliquots (250–2400 ml) were filtered onto GF/C filters
(B 47 mm, Whatman, Kent, Great Britain) and the filters were
dried at 50 �C. Microcystis were counted by the inverted
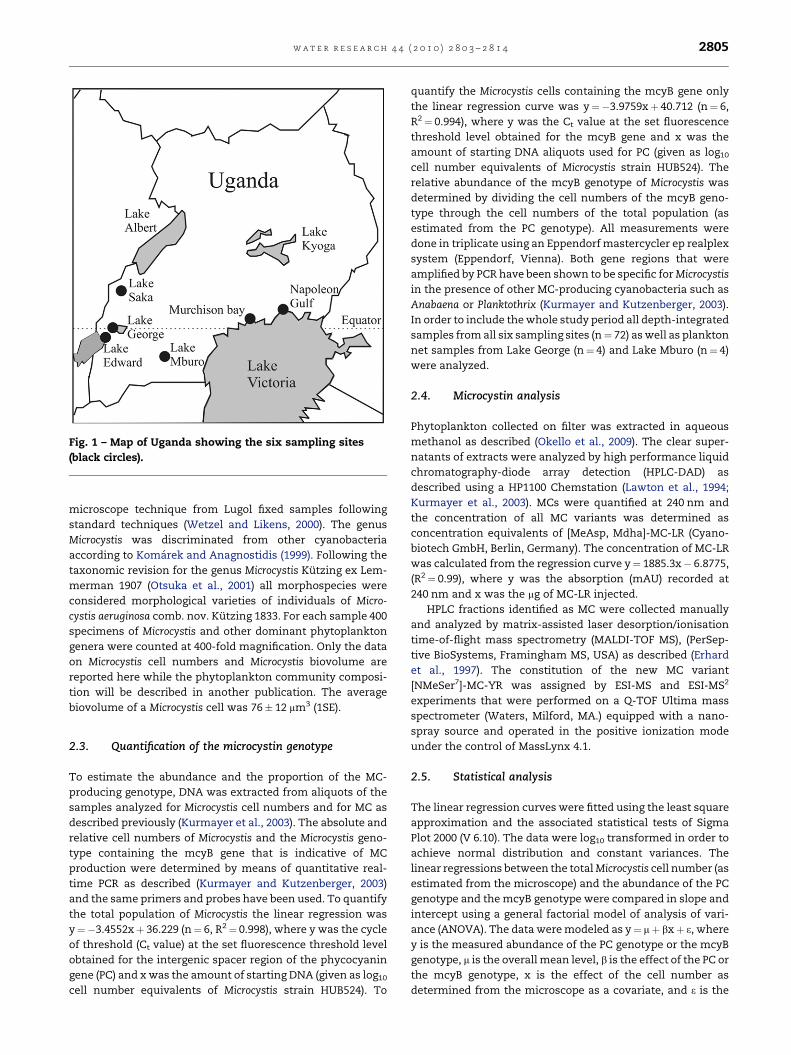
Fig. 1 – Map of Uganda showing the six sampling sites
(black circles).
w a t e r r e s e a r c h 4 4 ( 2 0 1 0 ) 2 8 0 3 – 2 8 1 4 2805
microscope technique from Lugol fixed samples following
standard techniques (Wetzel and Likens, 2000). The genus
Microcystis was discriminated from other cyanobacteria
according to Komarek and Anagnostidis (1999). Following the
taxonomic revision for the genus Microcystis Kutzing ex Lem-
merman 1907 (Otsuka et al., 2001) all morphospecies were
considered morphological varieties of individuals of Micro-
cystis aeruginosa comb. nov. Kutzing 1833. For each sample 400
specimens of Microcystis and other dominant phytoplankton
genera were counted at 400-fold magnification. Only the data
on Microcystis cell numbers and Microcystis biovolume are
reported here while the phytoplankton community composi-
tion will be described in another publication. The average
biovolume of a Microcystis cell was 76� 12 mm3 (1SE).
2.3. Quantification of the microcystin genotype
To estimate the abundance and the proportion of the MC-
producing genotype, DNA was extracted from aliquots of the
samples analyzed for Microcystis cell numbers and for MC as
described previously (Kurmayer et al., 2003). The absolute and
relative cell numbers of Microcystis and the Microcystis geno-
type containing the mcyB gene that is indicative of MC
production were determined by means of quantitative real-
time PCR as described (Kurmayer and Kutzenberger, 2003)
and the same primers and probes have been used. To quantify
the total population of Microcystis the linear regression was
y¼�3.4552xþ 36.229 (n¼ 6, R2¼ 0.998), where y was the cycle
of threshold (Ct value) at the set fluorescence threshold level
obtained for the intergenic spacer region of the phycocyanin
gene (PC) and x was the amount of starting DNA (given as log10
cell number equivalents of Microcystis strain HUB524). To
quantify the Microcystis cells containing the mcyB gene only
the linear regression curve was y¼�3.9759xþ 40.712 (n¼ 6,
R2¼ 0.994), where y was the Ct value at the set fluorescence
threshold level obtained for the mcyB gene and x was the
amount of starting DNA aliquots used for PC (given as log10
cell number equivalents of Microcystis strain HUB524). The
relative abundance of the mcyB genotype of Microcystis was
determined by dividing the cell numbers of the mcyB geno-
type through the cell numbers of the total population (as
estimated from the PC genotype). All measurements were
done in triplicate using an Eppendorf mastercycler ep realplex
system (Eppendorf, Vienna). Both gene regions that were
amplified by PCR have been shown to be specific for Microcystis
in the presence of other MC-producing cyanobacteria such as
Anabaena or Planktothrix (Kurmayer and Kutzenberger, 2003).
In order to include the whole study period all depth-integrated
samples from all six sampling sites (n¼ 72) as well as plankton
net samples from Lake George (n¼ 4) and Lake Mburo (n¼ 4)
were analyzed.
2.4. Microcystin analysis
Phytoplankton collected on filter was extracted in aqueous
methanol as described (Okello et al., 2009). The clear super-
natants of extracts were analyzed by high performance liquid
chromatography-diode array detection (HPLC-DAD) as
described using a HP1100 Chemstation (Lawton et al., 1994;
Kurmayer et al., 2003). MCs were quantified at 240 nm and
the concentration of all MC variants was determined as
concentration equivalents of [MeAsp, Mdha]-MC-LR (Cyano-
biotech GmbH, Berlin, Germany). The concentration of MC-LR
was calculated from the regression curve y¼ 1885.3x� 6.8775,
(R2¼ 0.99), where y was the absorption (mAU) recorded at
240 nm and x was the mg of MC-LR injected.
HPLC fractions identified as MC were collected manually
and analyzed by matrix-assisted laser desorption/ionisation
time-of-flight mass spectrometry (MALDI-TOF MS), (PerSep-
tive BioSystems, Framingham MS, USA) as described (Erhard
et al., 1997). The constitution of the new MC variant
[NMeSer7]-MC-YR was assigned by ESI-MS and ESI-MS2
experiments that were performed on a Q-TOF Ultima mass
spectrometer (Waters, Milford, MA.) equipped with a nano-
spray source and operated in the positive ionization mode
under the control of MassLynx 4.1.
2.5. Statistical analysis
The linear regression curves were fitted using the least square
approximation and the associated statistical tests of Sigma
Plot 2000 (V 6.10). The data were log10 transformed in order to
achieve normal distribution and constant variances. The
linear regressions between the total Microcystis cell number (as
estimated from the microscope) and the abundance of the PC
genotype and the mcyB genotype were compared in slope and
intercept using a general factorial model of analysis of vari-
ance (ANOVA). The data were modeled as y¼ mþ bxþ 3, where
y is the measured abundance of the PC genotype or the mcyB
genotype, m is the overall mean level, b is the effect of the PC or
the mcyB genotype, x is the effect of the cell number as
determined from the microscope as a covariate, and 3 is the
w a t e r r e s e a r c h 4 4 ( 2 0 1 0 ) 2 8 0 3 – 2 8 1 42806
random deviation. To compare the mcyB proportions between
sampling sites one-way ANOVA was used.
Multiple linear regression analysis was used to test the
relationship between the MC concentration (in mg MC ml�1) as
dependent variable and the influence of Microcystis cell
numbers as determined by the microscope or real-time PCR
via PC and mcyB as independent variables. A forward stepwise
analysis was employed selecting for the independent variable
for inclusion that makes the most significant unique contri-
bution to the prediction of the data. Calculations were per-
formed using SPSS 15.0 for Windows and the F value to enter
the respective model was set default (p< 0.05).
3. Results
3.1. Microcystis abundance
Microcystis appeared throughout the sampling period in all the
lakes. Only on 30 September 2007 Microcystis abundance was
below the detection limit in the depth-integrated sample
obtained from Lake Victoria (Napoleon Gulf). During the study
period Microcystis cell numbers varied between 104 –106
(Lake Saka), 105 –106 (L. George), 105 –106 (L. Edward), 104 –105
(L. Mburo), 104–105 (L. Victoria, Murchison bay), and
103–104 cells ml�1 (L. Victoria, Napoleon Gulf). We recorded the
highest Microcystis biovolume in samples from Lake George
(273 mm3 l�1) and the lowest (0.3 mm3 l�1) in samples from
Lake Victoria (Napoleon Gulf). On average Microcystis consti-
tuted between 18 and 46% of the total phytoplankton
biovolume (Table 1). This implied that the phytoplankton at all
the sampling sites had the potential for MC production.
3.2. Quantification of the microcystin genotype
In order to test the hypothesis that populations of Microcystis
differ in the proportion of the mcy genotype, the absolute
abundance of both the total population as well as the
subpopulation containing the mcyB gene were determined by
means of real-time PCR. Overall, both the microscope as well
as real-time PCR showed congruent results in estimating the
total Microcystis population number that on average differed
by one order of magnitude in lakes George and Edward, and
less than an order of magnitude in the other lakes (Fig. 2).
Consequently over the study period a linear relationship
between cell numbers estimated via the microscope and real-
time PCR of the PC genotype was found (Fig. 3A): The
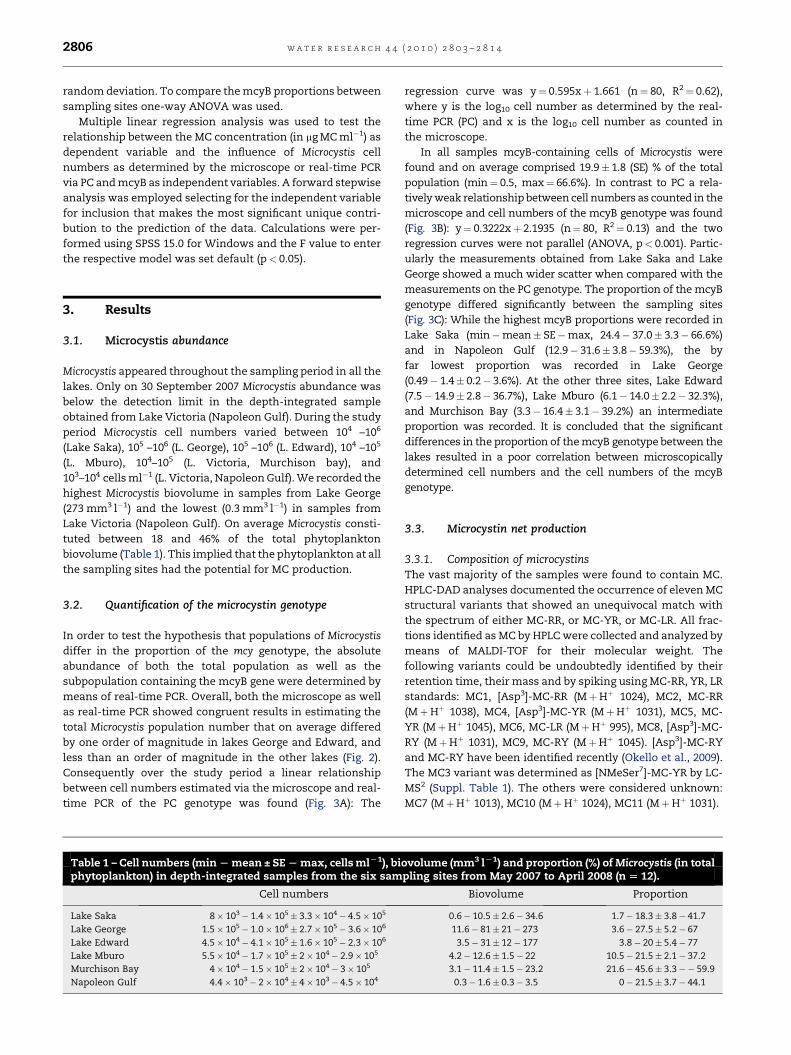
Table 1 – Cell numbers (min L mean ± SE L max, cells mlL1), biphytoplankton) in depth-integrated samples from the six sam
Cell numbers
Lake Saka 8� 103� 1.4� 105� 3.3� 104� 4.5� 105
Lake George 1.5� 105� 1.0� 106� 2.7� 105� 3.6� 106
Lake Edward 4.5� 104� 4.1� 105� 1.6� 105� 2.3� 106
Lake Mburo 5.5� 104� 1.7� 105� 2� 104� 2.9� 105
Murchison Bay 4� 104� 1.5� 105� 2� 104� 3� 105
Napoleon Gulf 4.4� 103� 2� 104� 4� 103� 4.5� 104
regression curve was y¼ 0.595xþ 1.661 (n¼ 80, R2¼ 0.62),
where y is the log10 cell number as determined by the real-
time PCR (PC) and x is the log10 cell number as counted in
the microscope.
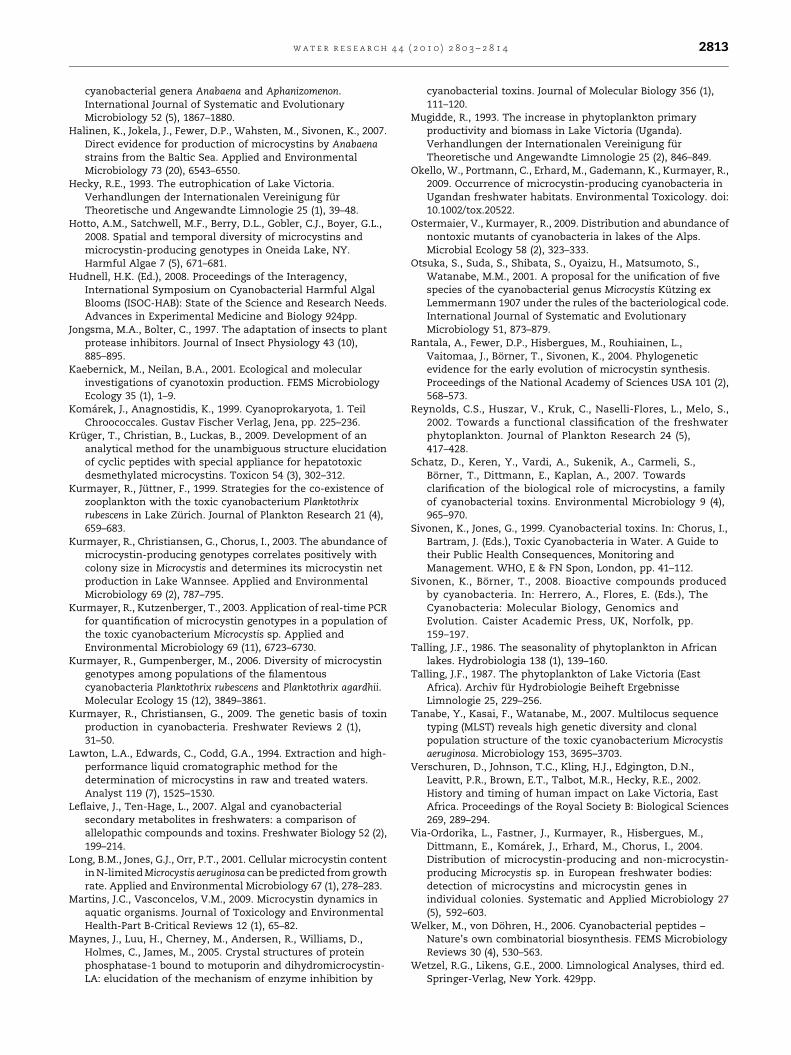
In all samples mcyB-containing cells of Microcystis were
found and on average comprised 19.9� 1.8 (SE) % of the total
population (min¼ 0.5, max¼ 66.6%). In contrast to PC a rela-
tively weak relationship between cell numbers as counted in the
microscope and cell numbers of the mcyB genotype was found
(Fig. 3B): y¼ 0.3222xþ 2.1935 (n¼ 80, R2¼ 0.13) and the two
regression curves were not parallel (ANOVA, p< 0.001). Partic-
ularly the measurements obtained from Lake Saka and Lake
George showed a much wider scatter when compared with the
measurements on the PC genotype. The proportion of the mcyB
genotype differed significantly between the sampling sites
(Fig. 3C): While the highest mcyB proportions were recorded in
Lake Saka (min�mean� SE�max, 24.4� 37.0� 3.3� 66.6%)
and in Napoleon Gulf (12.9� 31.6� 3.8� 59.3%), the by
far lowest proportion was recorded in Lake George
(0.49� 1.4� 0.2� 3.6%). At the other three sites, Lake Edward
(7.5� 14.9� 2.8� 36.7%), Lake Mburo (6.1� 14.0� 2.2� 32.3%),
and Murchison Bay (3.3� 16.4� 3.1� 39.2%) an intermediate
proportion was recorded. It is concluded that the significant
differences in the proportion of the mcyB genotype between the
lakes resulted in a poor correlation between microscopically
determined cell numbers and the cell numbers of the mcyB
genotype.
3.3. Microcystin net production
3.3.1. Composition of microcystinsThe vast majority of the samples were found to contain MC.
HPLC-DAD analyses documented the occurrence of eleven MC
structural variants that showed an unequivocal match with
the spectrum of either MC-RR, or MC-YR, or MC-LR. All frac-
tions identified as MC by HPLC were collected and analyzed by
means of MALDI-TOF for their molecular weight. The
following variants could be undoubtedly identified by their
retention time, their mass and by spiking using MC-RR, YR, LR
standards: MC1, [Asp3]-MC-RR (MþHþ 1024), MC2, MC-RR
(MþHþ 1038), MC4, [Asp3]-MC-YR (MþHþ 1031), MC5, MC-
YR (MþHþ 1045), MC6, MC-LR (MþHþ 995), MC8, [Asp3]-MC-
RY (MþHþ 1031), MC9, MC-RY (MþHþ 1045). [Asp3]-MC-RY
and MC-RY have been identified recently (Okello et al., 2009).
The MC3 variant was determined as [NMeSer7]-MC-YR by LC-
MS2 (Suppl. Table 1). The others were considered unknown:
MC7 (MþHþ 1013), MC10 (MþHþ 1024), MC11 (MþHþ 1031).
ovolume (mm3 lL1) and proportion (%) of Microcystis (in totalpling sites from May 2007 to April 2008 (n [ 12).
Biovolume Proportion
0.6� 10.5� 2.6� 34.6 1.7� 18.3� 3.8� 41.7
11.6� 81� 21� 273 3.6� 27.5� 5.2� 67
3.5� 31� 12� 177 3.8� 20� 5.4� 77
4.2� 12.6� 1.5� 22 10.5� 21.5� 2.1� 37.2
3.1� 11.4� 1.5� 23.2 21.6� 45.6� 3.3�� 59.9
0.3� 1.6� 0.3� 3.5 0� 21.5� 3.7� 44.1
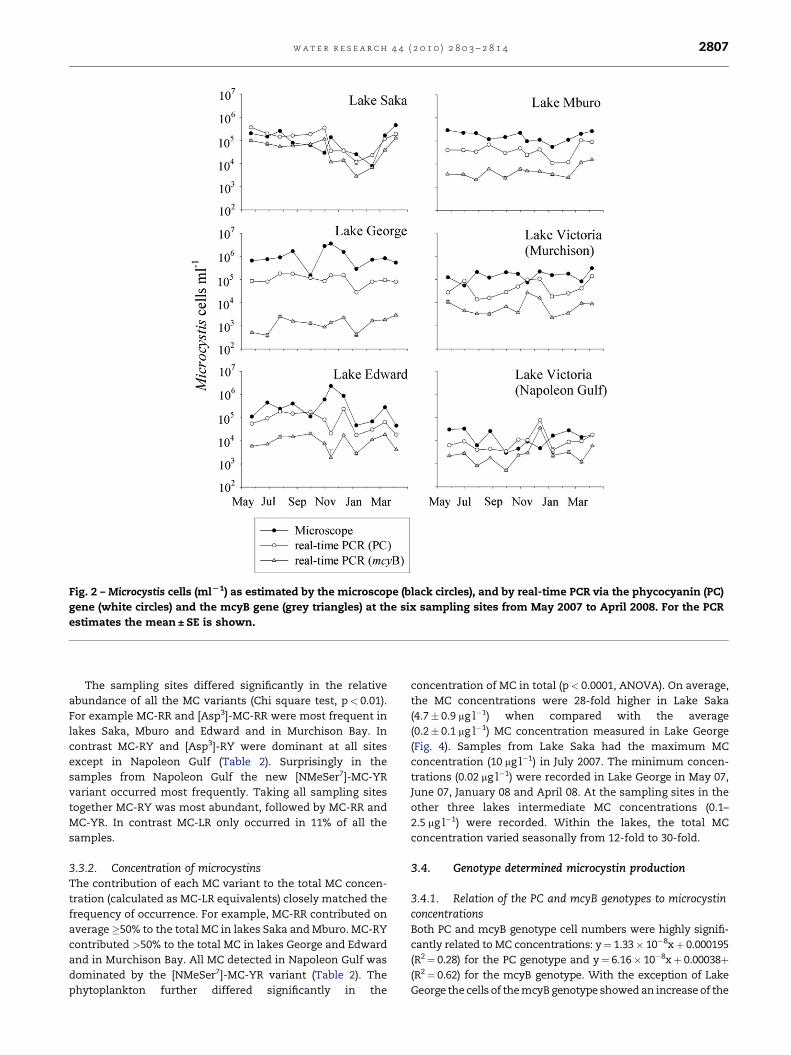
Fig. 2 – Microcystis cells (mlL1) as estimated by the microscope (black circles), and by real-time PCR via the phycocyanin (PC)
gene (white circles) and the mcyB gene (grey triangles) at the six sampling sites from May 2007 to April 2008. For the PCR
estimates the mean ± SE is shown.
w a t e r r e s e a r c h 4 4 ( 2 0 1 0 ) 2 8 0 3 – 2 8 1 4 2807
The sampling sites differed significantly in the relative
abundance of all the MC variants (Chi square test, p< 0.01).
For example MC-RR and [Asp3]-MC-RR were most frequent in
lakes Saka, Mburo and Edward and in Murchison Bay. In
contrast MC-RY and [Asp3]-RY were dominant at all sites
except in Napoleon Gulf (Table 2). Surprisingly in the
samples from Napoleon Gulf the new [NMeSer7]-MC-YR
variant occurred most frequently. Taking all sampling sites
together MC-RY was most abundant, followed by MC-RR and
MC-YR. In contrast MC-LR only occurred in 11% of all the
samples.
3.3.2. Concentration of microcystinsThe contribution of each MC variant to the total MC concen-
tration (calculated as MC-LR equivalents) closely matched the
frequency of occurrence. For example, MC-RR contributed on
average�50% to the total MC in lakes Saka and Mburo. MC-RY
contributed >50% to the total MC in lakes George and Edward
and in Murchison Bay. All MC detected in Napoleon Gulf was
dominated by the [NMeSer7]-MC-YR variant (Table 2). The
phytoplankton further differed significantly in the
concentration of MC in total (p< 0.0001, ANOVA). On average,
the MC concentrations were 28-fold higher in Lake Saka
(4.7� 0.9 mg l�1) when compared with the average
(0.2� 0.1 mg l�1) MC concentration measured in Lake George
(Fig. 4). Samples from Lake Saka had the maximum MC
concentration (10 mg l�1) in July 2007. The minimum concen-
trations (0.02 mg l�1) were recorded in Lake George in May 07,
June 07, January 08 and April 08. At the sampling sites in the
other three lakes intermediate MC concentrations (0.1–
2.5 mg l�1) were recorded. Within the lakes, the total MC
concentration varied seasonally from 12-fold to 30-fold.
3.4. Genotype determined microcystin production
3.4.1. Relation of the PC and mcyB genotypes to microcystinconcentrationsBoth PC and mcyB genotype cell numbers were highly signifi-
cantly related to MC concentrations: y¼ 1.33� 10�8xþ 0.000195
(R2¼ 0.28) for the PC genotype and y¼ 6.16� 10�8xþ 0.00038þ(R2¼ 0.62) for the mcyB genotype. With the exception of Lake
George the cells of the mcyB genotype showed an increase of the
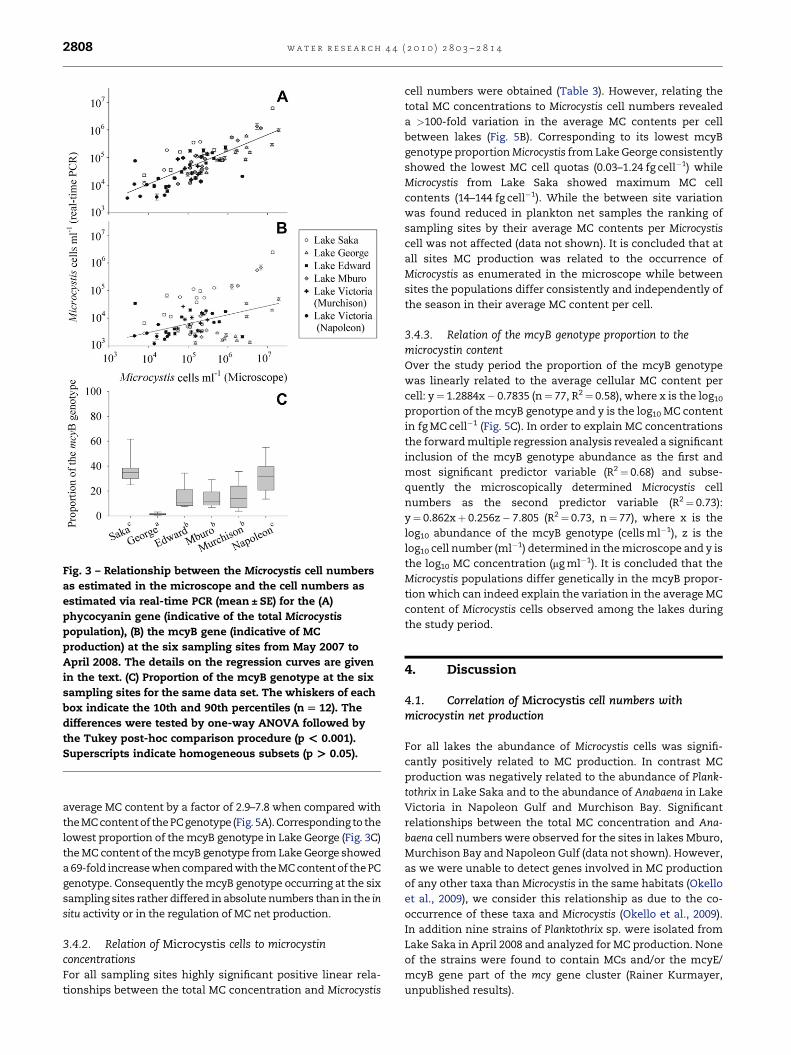
Fig. 3 – Relationship between the Microcystis cell numbers
as estimated in the microscope and the cell numbers as
estimated via real-time PCR (mean ± SE) for the (A)
phycocyanin gene (indicative of the total Microcystis
population), (B) the mcyB gene (indicative of MC
production) at the six sampling sites from May 2007 to
April 2008. The details on the regression curves are given
in the text. (C) Proportion of the mcyB genotype at the six
sampling sites for the same data set. The whiskers of each
box indicate the 10th and 90th percentiles (n [ 12). The
differences were tested by one-way ANOVA followed by
the Tukey post-hoc comparison procedure (p < 0.001).
Superscripts indicate homogeneous subsets (p > 0.05).
w a t e r r e s e a r c h 4 4 ( 2 0 1 0 ) 2 8 0 3 – 2 8 1 42808
average MC content by a factor of 2.9–7.8 when compared with
the MC content of the PCgenotype (Fig. 5A). Corresponding to the
lowest proportion of the mcyB genotype in Lake George (Fig. 3C)
the MC content of the mcyB genotype from Lake George showed
a 69-fold increase when compared with the MC content of the PC
genotype. Consequently the mcyB genotype occurring at the six
sampling sites rather differed in absolute numbers than in the in
situ activity or in the regulation of MC net production.
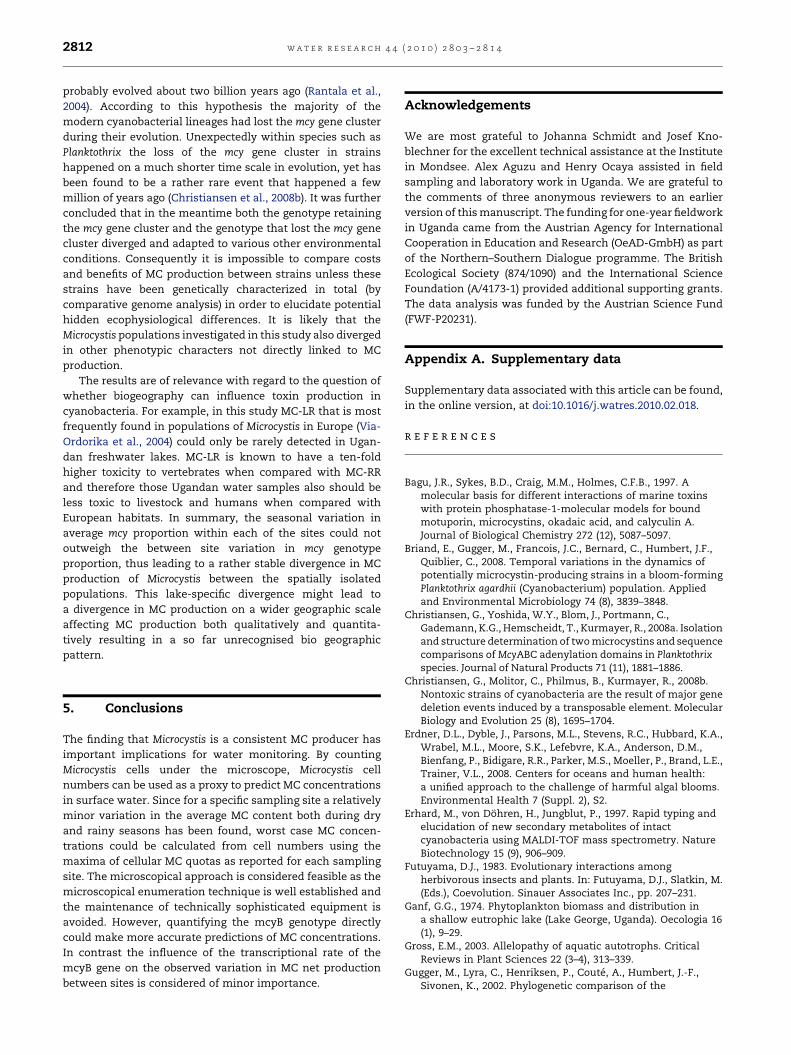
3.4.2. Relation of Microcystis cells to microcystinconcentrationsFor all sampling sites highly significant positive linear rela-
tionships between the total MC concentration and Microcystis
cell numbers were obtained (Table 3). However, relating the
total MC concentrations to Microcystis cell numbers revealed
a >100-fold variation in the average MC contents per cell
between lakes (Fig. 5B). Corresponding to its lowest mcyB
genotype proportion Microcystis from Lake George consistently
showed the lowest MC cell quotas (0.03–1.24 fg cell�1) while
Microcystis from Lake Saka showed maximum MC cell
contents (14–144 fg cell�1). While the between site variation
was found reduced in plankton net samples the ranking of
sampling sites by their average MC contents per Microcystis
cell was not affected (data not shown). It is concluded that at
all sites MC production was related to the occurrence of
Microcystis as enumerated in the microscope while between
sites the populations differ consistently and independently of
the season in their average MC content per cell.
3.4.3. Relation of the mcyB genotype proportion to themicrocystin contentOver the study period the proportion of the mcyB genotype
was linearly related to the average cellular MC content per
cell: y¼ 1.2884x� 0.7835 (n¼ 77, R2¼ 0.58), where x is the log10
proportion of the mcyB genotype and y is the log10 MC content
in fg MC cell�1 (Fig. 5C). In order to explain MC concentrations
the forward multiple regression analysis revealed a significant
inclusion of the mcyB genotype abundance as the first and
most significant predictor variable (R2¼ 0.68) and subse-
quently the microscopically determined Microcystis cell
numbers as the second predictor variable (R2¼ 0.73):
y¼ 0.862xþ 0.256z� 7.805 (R2¼ 0.73, n¼ 77), where x is the
log10 abundance of the mcyB genotype (cells ml�1), z is the
log10 cell number (ml�1) determined in the microscope and y is
the log10 MC concentration (mg ml�1). It is concluded that the
Microcystis populations differ genetically in the mcyB propor-
tion which can indeed explain the variation in the average MC
content of Microcystis cells observed among the lakes during
the study period.
4. Discussion
4.1. Correlation of Microcystis cell numbers withmicrocystin net production
For all lakes the abundance of Microcystis cells was signifi-
cantly positively related to MC production. In contrast MC
production was negatively related to the abundance of Plank-
tothrix in Lake Saka and to the abundance of Anabaena in Lake
Victoria in Napoleon Gulf and Murchison Bay. Significant
relationships between the total MC concentration and Ana-
baena cell numbers were observed for the sites in lakes Mburo,
Murchison Bay and Napoleon Gulf (data not shown). However,
as we were unable to detect genes involved in MC production
of any other taxa than Microcystis in the same habitats (Okello
et al., 2009), we consider this relationship as due to the co-
occurrence of these taxa and Microcystis (Okello et al., 2009).
In addition nine strains of Planktothrix sp. were isolated from
Lake Saka in April 2008 and analyzed for MC production. None
of the strains were found to contain MCs and/or the mcyE/
mcyB gene part of the mcy gene cluster (Rainer Kurmayer,
unpublished results).
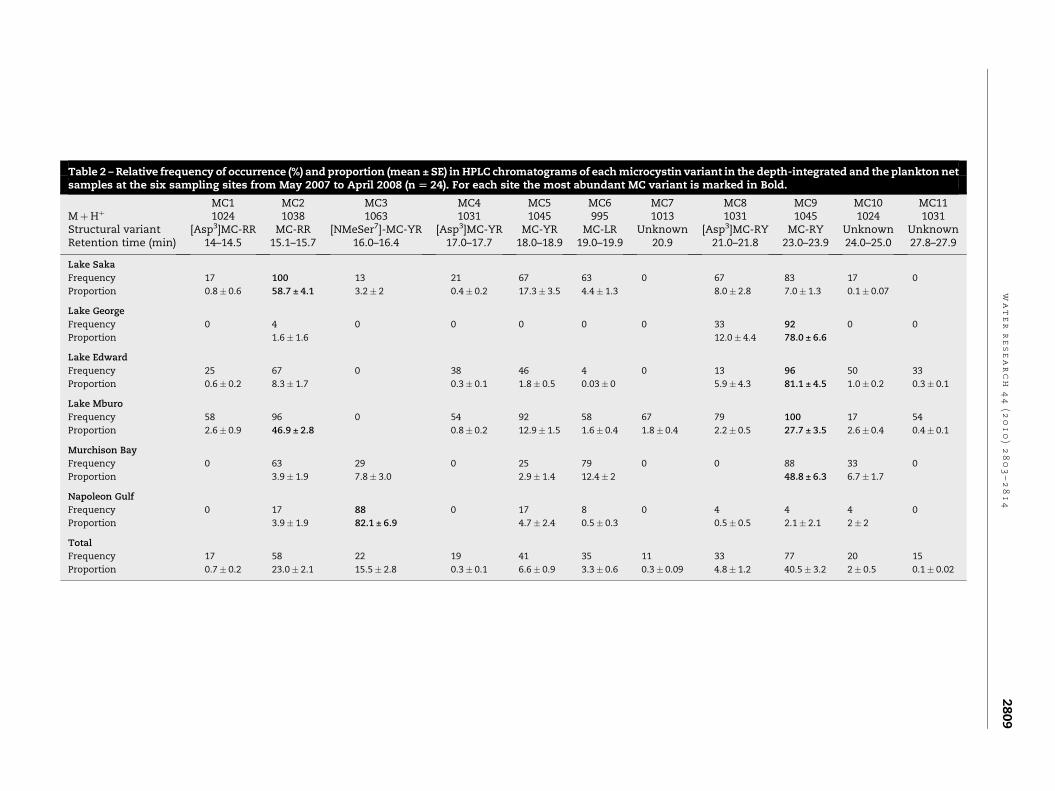
Table 2 – Relative frequency of occurrence (%) and proportion (mean ± SE) in HPLC chromatograms of each microcystin variant in the depth-integrated and the plankton netsamples at the six sampling sites from May 2007 to April 2008 (n [ 24). For each site the most abundant MC variant is marked in Bold.
MC1 MC2 MC3 MC4 MC5 MC6 MC7 MC8 MC9 MC10 MC11MþHþ 1024 1038 1063 1031 1045 995 1013 1031 1045 1024 1031Structural variant [Asp3]MC-RR MC-RR [NMeSer7]-MC-YR [Asp3]MC-YR MC-YR MC-LR Unknown [Asp3]MC-RY MC-RY Unknown UnknownRetention time (min) 14–14.5 15.1–15.7 16.0–16.4 17.0–17.7 18.0–18.9 19.0–19.9 20.9 21.0–21.8 23.0–23.9 24.0–25.0 27.8–27.9
Lake Saka
Frequency 17 100 13 21 67 63 0 67 83 17 0
Proportion 0.8� 0.6 58.7 ± 4.1 3.2� 2 0.4� 0.2 17.3� 3.5 4.4� 1.3 8.0� 2.8 7.0� 1.3 0.1� 0.07
Lake George
Frequency 0 4 0 0 0 0 0 33 92 0 0
Proportion 1.6� 1.6 12.0� 4.4 78.0 ± 6.6
Lake Edward
Frequency 25 67 0 38 46 4 0 13 96 50 33
Proportion 0.6� 0.2 8.3� 1.7 0.3� 0.1 1.8� 0.5 0.03� 0 5.9� 4.3 81.1 ± 4.5 1.0� 0.2 0.3� 0.1
Lake Mburo
Frequency 58 96 0 54 92 58 67 79 100 17 54
Proportion 2.6� 0.9 46.9 ± 2.8 0.8� 0.2 12.9� 1.5 1.6� 0.4 1.8� 0.4 2.2� 0.5 27.7 ± 3.5 2.6� 0.4 0.4� 0.1
Murchison Bay
Frequency 0 63 29 0 25 79 0 0 88 33 0
Proportion 3.9� 1.9 7.8� 3.0 2.9� 1.4 12.4� 2 48.8 ± 6.3 6.7� 1.7
Napoleon Gulf
Frequency 0 17 88 0 17 8 0 4 4 4 0
Proportion 3.9� 1.9 82.1 ± 6.9 4.7� 2.4 0.5� 0.3 0.5� 0.5 2.1� 2.1 2� 2
Total
Frequency 17 58 22 19 41 35 11 33 77 20 15
Proportion 0.7� 0.2 23.0� 2.1 15.5� 2.8 0.3� 0.1 6.6� 0.9 3.3� 0.6 0.3� 0.09 4.8� 1.2 40.5� 3.2 2� 0.5 0.1� 0.02
wa
te
rr
es
ea
rc
h4
4(2
01
0)
28
03
–2
81
42
80
9
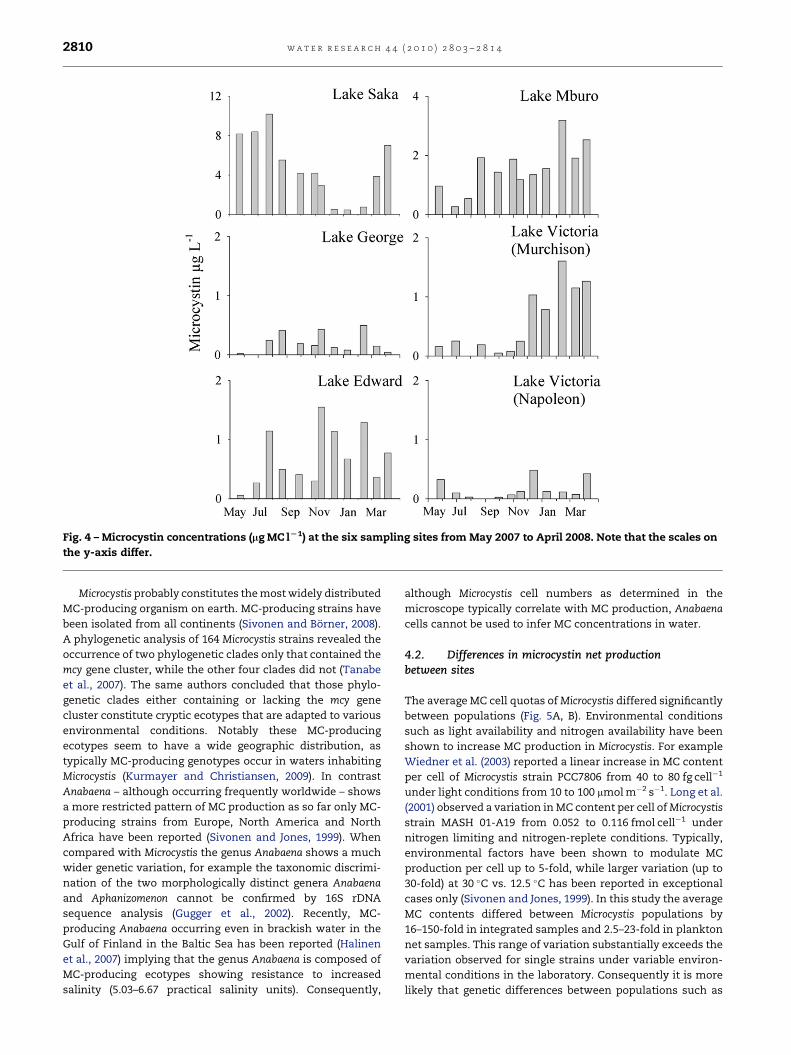
Fig. 4 – Microcystin concentrations (mg MC lL1) at the six sampling sites from May 2007 to April 2008. Note that the scales on
the y-axis differ.
w a t e r r e s e a r c h 4 4 ( 2 0 1 0 ) 2 8 0 3 – 2 8 1 42810
Microcystis probably constitutes the most widely distributed
MC-producing organism on earth. MC-producing strains have
been isolated from all continents (Sivonen and Borner, 2008).
A phylogenetic analysis of 164 Microcystis strains revealed the
occurrence of two phylogenetic clades only that contained the
mcy gene cluster, while the other four clades did not (Tanabe
et al., 2007). The same authors concluded that those phylo-
genetic clades either containing or lacking the mcy gene
cluster constitute cryptic ecotypes that are adapted to various
environmental conditions. Notably these MC-producing
ecotypes seem to have a wide geographic distribution, as
typically MC-producing genotypes occur in waters inhabiting
Microcystis (Kurmayer and Christiansen, 2009). In contrast
Anabaena – although occurring frequently worldwide – shows
a more restricted pattern of MC production as so far only MC-
producing strains from Europe, North America and North
Africa have been reported (Sivonen and Jones, 1999). When
compared with Microcystis the genus Anabaena shows a much
wider genetic variation, for example the taxonomic discrimi-
nation of the two morphologically distinct genera Anabaena
and Aphanizomenon cannot be confirmed by 16S rDNA
sequence analysis (Gugger et al., 2002). Recently, MC-
producing Anabaena occurring even in brackish water in the
Gulf of Finland in the Baltic Sea has been reported (Halinen
et al., 2007) implying that the genus Anabaena is composed of
MC-producing ecotypes showing resistance to increased
salinity (5.03–6.67 practical salinity units). Consequently,
although Microcystis cell numbers as determined in the
microscope typically correlate with MC production, Anabaena
cells cannot be used to infer MC concentrations in water.
4.2. Differences in microcystin net productionbetween sites
The average MC cell quotas of Microcystis differed significantly
between populations (Fig. 5A, B). Environmental conditions
such as light availability and nitrogen availability have been
shown to increase MC production in Microcystis. For example
Wiedner et al. (2003) reported a linear increase in MC content
per cell of Microcystis strain PCC7806 from 40 to 80 fg cell�1
under light conditions from 10 to 100 mmol m�2 s�1. Long et al.
(2001) observed a variation in MC content per cell of Microcystis
strain MASH 01-A19 from 0.052 to 0.116 fmol cell�1 under
nitrogen limiting and nitrogen-replete conditions. Typically,
environmental factors have been shown to modulate MC
production per cell up to 5-fold, while larger variation (up to
30-fold) at 30 �C vs. 12.5 �C has been reported in exceptional
cases only (Sivonen and Jones, 1999). In this study the average
MC contents differed between Microcystis populations by
16–150-fold in integrated samples and 2.5–23-fold in plankton
net samples. This range of variation substantially exceeds the
variation observed for single strains under variable environ-
mental conditions in the laboratory. Consequently it is more
likely that genetic differences between populations such as
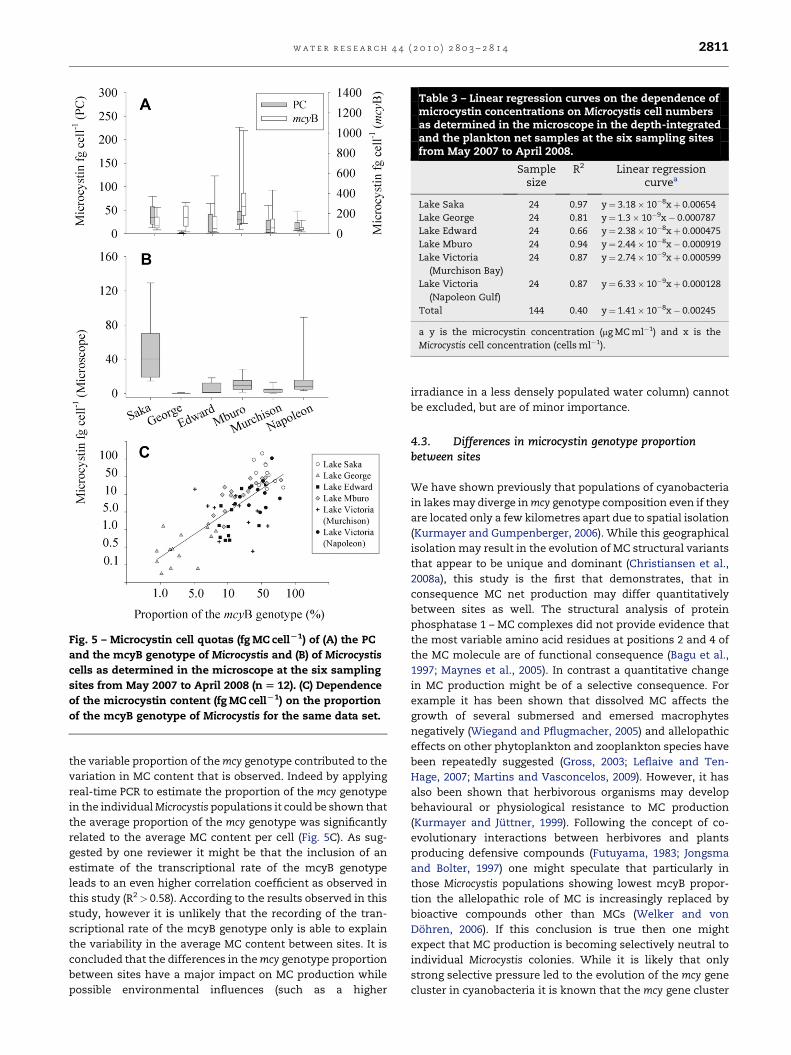
Fig. 5 – Microcystin cell quotas (fg MC cellL1) of (A) the PC
and the mcyB genotype of Microcystis and (B) of Microcystis
cells as determined in the microscope at the six sampling
sites from May 2007 to April 2008 (n [ 12). (C) Dependence
of the microcystin content (fg MC cellL1) on the proportion
of the mcyB genotype of Microcystis for the same data set.
Table 3 – Linear regression curves on the dependence ofmicrocystin concentrations on Microcystis cell numbersas determined in the microscope in the depth-integratedand the plankton net samples at the six sampling sitesfrom May 2007 to April 2008.
Samplesize
R2 Linear regressioncurvea
Lake Saka 24 0.97 y¼ 3.18� 10�8xþ 0.00654
Lake George 24 0.81 y¼ 1.3� 10�9x� 0.000787
Lake Edward 24 0.66 y¼ 2.38� 10�8xþ 0.000475
Lake Mburo 24 0.94 y¼ 2.44� 10�8x� 0.000919
Lake Victoria
(Murchison Bay)
24 0.87 y¼ 2.74� 10�9xþ 0.000599
Lake Victoria
(Napoleon Gulf)
24 0.87 y¼ 6.33� 10�9xþ 0.000128
Total 144 0.40 y¼ 1.41� 10�8x� 0.00245
a y is the microcystin concentration (mg MC ml�1) and x is the
Microcystis cell concentration (cells ml�1).
w a t e r r e s e a r c h 4 4 ( 2 0 1 0 ) 2 8 0 3 – 2 8 1 4 2811
the variable proportion of the mcy genotype contributed to the
variation in MC content that is observed. Indeed by applying
real-time PCR to estimate the proportion of the mcy genotype
in the individual Microcystis populations it could be shown that
the average proportion of the mcy genotype was significantly
related to the average MC content per cell (Fig. 5C). As sug-
gested by one reviewer it might be that the inclusion of an
estimate of the transcriptional rate of the mcyB genotype
leads to an even higher correlation coefficient as observed in
this study (R2> 0.58). According to the results observed in this
study, however it is unlikely that the recording of the tran-
scriptional rate of the mcyB genotype only is able to explain
the variability in the average MC content between sites. It is
concluded that the differences in the mcy genotype proportion
between sites have a major impact on MC production while
possible environmental influences (such as a higher
irradiance in a less densely populated water column) cannot
be excluded, but are of minor importance.
4.3. Differences in microcystin genotype proportionbetween sites
We have shown previously that populations of cyanobacteria
in lakes may diverge in mcy genotype composition even if they
are located only a few kilometres apart due to spatial isolation
(Kurmayer and Gumpenberger, 2006). While this geographical
isolation may result in the evolution of MC structural variants
that appear to be unique and dominant (Christiansen et al.,
2008a), this study is the first that demonstrates, that in
consequence MC net production may differ quantitatively
between sites as well. The structural analysis of protein
phosphatase 1 – MC complexes did not provide evidence that
the most variable amino acid residues at positions 2 and 4 of
the MC molecule are of functional consequence (Bagu et al.,
1997; Maynes et al., 2005). In contrast a quantitative change
in MC production might be of a selective consequence. For
example it has been shown that dissolved MC affects the
growth of several submersed and emersed macrophytes
negatively (Wiegand and Pflugmacher, 2005) and allelopathic
effects on other phytoplankton and zooplankton species have
been repeatedly suggested (Gross, 2003; Leflaive and Ten-
Hage, 2007; Martins and Vasconcelos, 2009). However, it has
also been shown that herbivorous organisms may develop
behavioural or physiological resistance to MC production
(Kurmayer and Juttner, 1999). Following the concept of co-
evolutionary interactions between herbivores and plants
producing defensive compounds (Futuyama, 1983; Jongsma
and Bolter, 1997) one might speculate that particularly in
those Microcystis populations showing lowest mcyB propor-
tion the allelopathic role of MC is increasingly replaced by
bioactive compounds other than MCs (Welker and von
Dohren, 2006). If this conclusion is true then one might
expect that MC production is becoming selectively neutral to
individual Microcystis colonies. While it is likely that only
strong selective pressure led to the evolution of the mcy gene
cluster in cyanobacteria it is known that the mcy gene cluster
w a t e r r e s e a r c h 4 4 ( 2 0 1 0 ) 2 8 0 3 – 2 8 1 42812
probably evolved about two billion years ago (Rantala et al.,
2004). According to this hypothesis the majority of the
modern cyanobacterial lineages had lost the mcy gene cluster
during their evolution. Unexpectedly within species such as
Planktothrix the loss of the mcy gene cluster in strains
happened on a much shorter time scale in evolution, yet has
been found to be a rather rare event that happened a few
million of years ago (Christiansen et al., 2008b). It was further
concluded that in the meantime both the genotype retaining
the mcy gene cluster and the genotype that lost the mcy gene
cluster diverged and adapted to various other environmental
conditions. Consequently it is impossible to compare costs
and benefits of MC production between strains unless these
strains have been genetically characterized in total (by
comparative genome analysis) in order to elucidate potential
hidden ecophysiological differences. It is likely that the
Microcystis populations investigated in this study also diverged
in other phenotypic characters not directly linked to MC
production.
The results are of relevance with regard to the question of
whether biogeography can influence toxin production in
cyanobacteria. For example, in this study MC-LR that is most
frequently found in populations of Microcystis in Europe (Via-
Ordorika et al., 2004) could only be rarely detected in Ugan-
dan freshwater lakes. MC-LR is known to have a ten-fold
higher toxicity to vertebrates when compared with MC-RR
and therefore those Ugandan water samples also should be
less toxic to livestock and humans when compared with
European habitats. In summary, the seasonal variation in
average mcy proportion within each of the sites could not
outweigh the between site variation in mcy genotype
proportion, thus leading to a rather stable divergence in MC
production of Microcystis between the spatially isolated
populations. This lake-specific divergence might lead to
a divergence in MC production on a wider geographic scale
affecting MC production both qualitatively and quantita-
tively resulting in a so far unrecognised bio geographic
pattern.
5. Conclusions
The finding that Microcystis is a consistent MC producer has
important implications for water monitoring. By counting
Microcystis cells under the microscope, Microcystis cell
numbers can be used as a proxy to predict MC concentrations
in surface water. Since for a specific sampling site a relatively
minor variation in the average MC content both during dry
and rainy seasons has been found, worst case MC concen-
trations could be calculated from cell numbers using the
maxima of cellular MC quotas as reported for each sampling
site. The microscopical approach is considered feasible as the
microscopical enumeration technique is well established and
the maintenance of technically sophisticated equipment is
avoided. However, quantifying the mcyB genotype directly
could make more accurate predictions of MC concentrations.
In contrast the influence of the transcriptional rate of the
mcyB gene on the observed variation in MC net production
between sites is considered of minor importance.
Acknowledgements
We are most grateful to Johanna Schmidt and Josef Kno-
blechner for the excellent technical assistance at the Institute
in Mondsee. Alex Aguzu and Henry Ocaya assisted in field
sampling and laboratory work in Uganda. We are grateful to
the comments of three anonymous reviewers to an earlier
version of this manuscript. The funding for one-year fieldwork
in Uganda came from the Austrian Agency for International
Cooperation in Education and Research (OeAD-GmbH) as part
of the Northern–Southern Dialogue programme. The British
Ecological Society (874/1090) and the International Science
Foundation (A/4173-1) provided additional supporting grants.
The data analysis was funded by the Austrian Science Fund
(FWF-P20231).
Appendix A. Supplementary data
Supplementary data associated with this article can be found,
in the online version, at doi:10.1016/j.watres.2010.02.018.
r e f e r e n c e s
Bagu, J.R., Sykes, B.D., Craig, M.M., Holmes, C.F.B., 1997. Amolecular basis for different interactions of marine toxinswith protein phosphatase-1-molecular models for boundmotuporin, microcystins, okadaic acid, and calyculin A.Journal of Biological Chemistry 272 (12), 5087–5097.
Briand, E., Gugger, M., Francois, J.C., Bernard, C., Humbert, J.F.,Quiblier, C., 2008. Temporal variations in the dynamics ofpotentially microcystin-producing strains in a bloom-formingPlanktothrix agardhii (Cyanobacterium) population. Appliedand Environmental Microbiology 74 (8), 3839–3848.
Christiansen, G., Yoshida, W.Y., Blom, J., Portmann, C.,Gademann, K.G., Hemscheidt, T., Kurmayer, R., 2008a. Isolationand structure determination of two microcystins and sequencecomparisons of McyABC adenylation domains in Planktothrixspecies. Journal of Natural Products 71 (11), 1881–1886.
Christiansen, G., Molitor, C., Philmus, B., Kurmayer, R., 2008b.Nontoxic strains of cyanobacteria are the result of major genedeletion events induced by a transposable element. MolecularBiology and Evolution 25 (8), 1695–1704.
Erdner, D.L., Dyble, J., Parsons, M.L., Stevens, R.C., Hubbard, K.A.,Wrabel, M.L., Moore, S.K., Lefebvre, K.A., Anderson, D.M.,Bienfang, P., Bidigare, R.R., Parker, M.S., Moeller, P., Brand, L.E.,Trainer, V.L., 2008. Centers for oceans and human health:a unified approach to the challenge of harmful algal blooms.Environmental Health 7 (Suppl. 2), S2.
Erhard, M., von Dohren, H., Jungblut, P., 1997. Rapid typing andelucidation of new secondary metabolites of intactcyanobacteria using MALDI-TOF mass spectrometry. NatureBiotechnology 15 (9), 906–909.
Futuyama, D.J., 1983. Evolutionary interactions amongherbivorous insects and plants. In: Futuyama, D.J., Slatkin, M.(Eds.), Coevolution. Sinauer Associates Inc., pp. 207–231.
Ganf, G.G., 1974. Phytoplankton biomass and distribution ina shallow eutrophic lake (Lake George, Uganda). Oecologia 16(1), 9–29.
Gross, E.M., 2003. Allelopathy of aquatic autotrophs. CriticalReviews in Plant Sciences 22 (3–4), 313–339.
Gugger, M., Lyra, C., Henriksen, P., Coute, A., Humbert, J.-F.,Sivonen, K., 2002. Phylogenetic comparison of the
w a t e r r e s e a r c h 4 4 ( 2 0 1 0 ) 2 8 0 3 – 2 8 1 4 2813
cyanobacterial genera Anabaena and Aphanizomenon.International Journal of Systematic and EvolutionaryMicrobiology 52 (5), 1867–1880.
Halinen, K., Jokela, J., Fewer, D.P., Wahsten, M., Sivonen, K., 2007.Direct evidence for production of microcystins by Anabaenastrains from the Baltic Sea. Applied and EnvironmentalMicrobiology 73 (20), 6543–6550.
Hecky, R.E., 1993. The eutrophication of Lake Victoria.Verhandlungen der Internationalen Vereinigung furTheoretische und Angewandte Limnologie 25 (1), 39–48.
Hotto, A.M., Satchwell, M.F., Berry, D.L., Gobler, C.J., Boyer, G.L.,2008. Spatial and temporal diversity of microcystins andmicrocystin-producing genotypes in Oneida Lake, NY.Harmful Algae 7 (5), 671–681.
Hudnell, H.K. (Ed.), 2008. Proceedings of the Interagency,International Symposium on Cyanobacterial Harmful AlgalBlooms (ISOC-HAB): State of the Science and Research Needs.Advances in Experimental Medicine and Biology 924pp.
Jongsma, M.A., Bolter, C., 1997. The adaptation of insects to plantprotease inhibitors. Journal of Insect Physiology 43 (10),885–895.
Kaebernick, M., Neilan, B.A., 2001. Ecological and molecularinvestigations of cyanotoxin production. FEMS MicrobiologyEcology 35 (1), 1–9.
Komarek, J., Anagnostidis, K., 1999. Cyanoprokaryota, 1. TeilChroococcales. Gustav Fischer Verlag, Jena, pp. 225–236.
Kruger, T., Christian, B., Luckas, B., 2009. Development of ananalytical method for the unambiguous structure elucidationof cyclic peptides with special appliance for hepatotoxicdesmethylated microcystins. Toxicon 54 (3), 302–312.
Kurmayer, R., Juttner, F., 1999. Strategies for the co-existence ofzooplankton with the toxic cyanobacterium Planktothrixrubescens in Lake Zurich. Journal of Plankton Research 21 (4),659–683.
Kurmayer, R., Christiansen, G., Chorus, I., 2003. The abundance ofmicrocystin-producing genotypes correlates positively withcolony size in Microcystis and determines its microcystin netproduction in Lake Wannsee. Applied and EnvironmentalMicrobiology 69 (2), 787–795.
Kurmayer, R., Kutzenberger, T., 2003. Application of real-time PCRfor quantification of microcystin genotypes in a population ofthe toxic cyanobacterium Microcystis sp. Applied andEnvironmental Microbiology 69 (11), 6723–6730.
Kurmayer, R., Gumpenberger, M., 2006. Diversity of microcystingenotypes among populations of the filamentouscyanobacteria Planktothrix rubescens and Planktothrix agardhii.Molecular Ecology 15 (12), 3849–3861.
Kurmayer, R., Christiansen, G., 2009. The genetic basis of toxinproduction in cyanobacteria. Freshwater Reviews 2 (1),31–50.
Lawton, L.A., Edwards, C., Codd, G.A., 1994. Extraction and high-performance liquid cromatographic method for thedetermination of microcystins in raw and treated waters.Analyst 119 (7), 1525–1530.
Leflaive, J., Ten-Hage, L., 2007. Algal and cyanobacterialsecondary metabolites in freshwaters: a comparison ofallelopathic compounds and toxins. Freshwater Biology 52 (2),199–214.
Long, B.M., Jones, G.J., Orr, P.T., 2001. Cellular microcystin contentin N-limited Microcystis aeruginosa can be predicted from growthrate. Applied and Environmental Microbiology 67 (1), 278–283.
Martins, J.C., Vasconcelos, V.M., 2009. Microcystin dynamics inaquatic organisms. Journal of Toxicology and EnvironmentalHealth-Part B-Critical Reviews 12 (1), 65–82.
Maynes, J., Luu, H., Cherney, M., Andersen, R., Williams, D.,Holmes, C., James, M., 2005. Crystal structures of proteinphosphatase-1 bound to motuporin and dihydromicrocystin-LA: elucidation of the mechanism of enzyme inhibition by
cyanobacterial toxins. Journal of Molecular Biology 356 (1),111–120.
Mugidde, R., 1993. The increase in phytoplankton primaryproductivity and biomass in Lake Victoria (Uganda).Verhandlungen der Internationalen Vereinigung furTheoretische und Angewandte Limnologie 25 (2), 846–849.
Okello, W., Portmann, C., Erhard, M., Gademann, K., Kurmayer, R.,2009. Occurrence of microcystin-producing cyanobacteria inUgandan freshwater habitats. Environmental Toxicology. doi:10.1002/tox.20522.
Ostermaier, V., Kurmayer, R., 2009. Distribution and abundance ofnontoxic mutants of cyanobacteria in lakes of the Alps.Microbial Ecology 58 (2), 323–333.
Otsuka, S., Suda, S., Shibata, S., Oyaizu, H., Matsumoto, S.,Watanabe, M.M., 2001. A proposal for the unification of fivespecies of the cyanobacterial genus Microcystis Kutzing exLemmermann 1907 under the rules of the bacteriological code.International Journal of Systematic and EvolutionaryMicrobiology 51, 873–879.
Rantala, A., Fewer, D.P., Hisbergues, M., Rouhiainen, L.,Vaitomaa, J., Borner, T., Sivonen, K., 2004. Phylogeneticevidence for the early evolution of microcystin synthesis.Proceedings of the National Academy of Sciences USA 101 (2),568–573.
Reynolds, C.S., Huszar, V., Kruk, C., Naselli-Flores, L., Melo, S.,2002. Towards a functional classification of the freshwaterphytoplankton. Journal of Plankton Research 24 (5),417–428.
Schatz, D., Keren, Y., Vardi, A., Sukenik, A., Carmeli, S.,Borner, T., Dittmann, E., Kaplan, A., 2007. Towardsclarification of the biological role of microcystins, a familyof cyanobacterial toxins. Environmental Microbiology 9 (4),965–970.
Sivonen, K., Jones, G., 1999. Cyanobacterial toxins. In: Chorus, I.,Bartram, J. (Eds.), Toxic Cyanobacteria in Water. A Guide totheir Public Health Consequences, Monitoring andManagement. WHO, E & FN Spon, London, pp. 41–112.
Sivonen, K., Borner, T., 2008. Bioactive compounds producedby cyanobacteria. In: Herrero, A., Flores, E. (Eds.), TheCyanobacteria: Molecular Biology, Genomics andEvolution. Caister Academic Press, UK, Norfolk, pp.159–197.
Talling, J.F., 1986. The seasonality of phytoplankton in Africanlakes. Hydrobiologia 138 (1), 139–160.
Talling, J.F., 1987. The phytoplankton of Lake Victoria (EastAfrica). Archiv fur Hydrobiologie Beiheft ErgebnisseLimnologie 25, 229–256.
Tanabe, Y., Kasai, F., Watanabe, M., 2007. Multilocus sequencetyping (MLST) reveals high genetic diversity and clonalpopulation structure of the toxic cyanobacterium Microcystisaeruginosa. Microbiology 153, 3695–3703.
Verschuren, D., Johnson, T.C., Kling, H.J., Edgington, D.N.,Leavitt, P.R., Brown, E.T., Talbot, M.R., Hecky, R.E., 2002.History and timing of human impact on Lake Victoria, EastAfrica. Proceedings of the Royal Society B: Biological Sciences269, 289–294.
Via-Ordorika, L., Fastner, J., Kurmayer, R., Hisbergues, M.,Dittmann, E., Komarek, J., Erhard, M., Chorus, I., 2004.Distribution of microcystin-producing and non-microcystin-producing Microcystis sp. in European freshwater bodies:detection of microcystins and microcystin genes inindividual colonies. Systematic and Applied Microbiology 27(5), 592–603.
Welker, M., von Dohren, H., 2006. Cyanobacterial peptides –Nature’s own combinatorial biosynthesis. FEMS MicrobiologyReviews 30 (4), 530–563.
Wetzel, R.G., Likens, G.E., 2000. Limnological Analyses, third ed.Springer-Verlag, New York. 429pp.

w a t e r r e s e a r c h 4 4 ( 2 0 1 0 ) 2 8 0 3 – 2 8 1 42814
Wiedner, C., Visser, P.M., Fastner, J., Metcalf, J.S., Codd, G.A.,Mur, L.R., 2003. Effects of light on the microcystin content ofMicrocystis strain PCC 7806. Applied and EnvironmentalMicrobiology 69 (3), 1475–1481.
Wiegand, C., Pflugmacher, S., 2005. Ecotoxicological effects ofselected cyanobacterial secondary metabolites: a short
review. Toxicology and Applied Pharmacology 203,201–218.
World Health Organization, 2006. Guidelines for Drinking-waterQuality. First Addendum to Third Edition. In:Recommendations, third ed., vol. 1. World HealthOrganization, Geneva. 515pp.
Related Documents