Ecological Factors Controlling Microcystin Concentrations in the Bay of Quinte, Maumee Bay, and Three Grand River Reservoirs by Sarah Jane Yakobowski A thesis presented to the University of Waterloo in fulfillment of the thesis requirement for the degree of Master of Science in Biology Waterloo, Ontario, Canada, 2008 ©Sarah Jane Yakobowski 2008

Welcome message from author
This document is posted to help you gain knowledge. Please leave a comment to let me know what you think about it! Share it to your friends and learn new things together.
Transcript

Ecological Factors Controlling
Microcystin Concentrations in the Bay of
Quinte, Maumee Bay, and Three Grand
River Reservoirs
by
Sarah Jane Yakobowski
A thesis
presented to the University of Waterloo
in fulfillment of the
thesis requirement for the degree of
Master of Science
in
Biology
Waterloo, Ontario, Canada, 2008
©Sarah Jane Yakobowski 2008

ii
Author’s Declaration
I hereby declare that I am the sole author of this thesis. This is a true copy of the thesis, including any
required final revisions, as accepted by my examiners.
I understand that my thesis may be made electronically available to the public.

iii
Abstract
Certain types of cyanobacteria have the potential to produce toxins including microcystin, a
hepatotoxin. Toxic cyanobacterial blooms are becoming increasingly common worldwide. They are a
concern in the Great Lakes and surrounding waters. In this study, Lake Ontario’s Bay of Quinte,
Lake Erie’s Maumee Bay, and three reservoirs along the Grand River were studied. Environmental
variables, cyanobacterial biomass inferred from the Fluoroprobe, and microcystin concentrations
were measured. In 2005 the three reservoirs, Belwood Lake, Conestogo Lake, and Guelph Lake
were sampled every two weeks from July to September. Belwood Lake was also sampled in October
when a cyanobacterial bloom occurred. In 2006 the Bay of Quinte was sampled twice, in July and
September, and Maumee Bay was sampled twice, in June and August.
Physical variables measured included water transparency and temperature. All species of
nitrogen (N) and phosphorus (P) were measured, along with extracted chlorophyll a and particulate
carbon (C), N, and P. The distribution of chlorophyll and major algal groups throughout the water
column was profiled in situ using a spectral fluorometer (Fluoroprobe).Variable fluorescence of
phytoplankton was assessed using Pulse Amplitude Modulated (PAM) fluorometry to measure
photosynthetic parameters. Phytoplankton counts were performed on selected samples from the Bay
of Quinte and Maumee Bay.
Total and dissolved microcystin were measured using the protein phosphatase inhibition
assay (PPIA). PPIA was chosen over alternative detection methods because it is a functional assay
that measures the level of microcystin in a sample via the amount of protein phosphatase inhibition
that it exerts. This yields ecologically relevant data as protein phosphatase inhibition is the main
mode of microcystin toxicity. The PPIA formulation used in our lab was based on variations in the
literature that use unconcentrated water samples directly in the assay. The assay was optimized to
employ both a higher and lower standard curve through the use of two enzyme concentrations. The

iv
lower enzyme concentration allowed the method detection limit to be decreased to 0.05 µg/L to
accommodate our low-microcystin samples.
In the Bay of Quinte, microcystin levels were higher in July 2006 (total mean=2.25 μg/L )
than in September 2006 (total mean=0.58 μg/L). In July a cyanobacterial bloom consisting of 97%
Microcystis spp. was present. In September 83% of the cyanobacterial biomass was composed of
Anabaena spiroides and only 8% was Microcystis spp. In the Bay of Quinte elevated microcystin
concentrations were associated with higher soluble reactive P levels, lower seston C:P molar ratios,
and lower total N. In Maumee Bay microcystin levels were higher in August 2006 (total mean= 4.45
μg/L) than they were in June 2006 (<0.05 μg/L). In August a cyanobacterial bloom consisting of 22%
Microcystis spp. and 48% Aphanizomenon flos-aquae was observed. Higher microcystin
concentrations in Maumee Bay were associated with decreased total N: total P molar ratios, increased
total P, and decreased water transparency as measured by Secchi depth.
Belwood Lake had the highest microcystin levels of the three reservoirs but only once
exceeded the recommended World Health Organization concentration of 1.0 μg/L. Belwood Lake’s
largest cyanobacterial bloom in October 2005 was accompanied by relatively low microcystin levels
(<0.2 μg/L). Conestogo and Guelph lakes always had microcystin levels below 0.2 μg/L and 0.6
μg/L, respectively. In the Grand River reservoirs, increased microcystin concentrations were
associated with higher chlorophyll a, higher light attenuation coefficients, lower total N, lower total
N: total P molar ratios, higher C:P molar ratios, lower nitrate, higher cyanobacterial biomass, and
higher total P. When data from the Bay of Quinte, Maumee Bay, and Grand River reservoirs were
pooled, total microcystin had the most significant positive correlation with total P. Total microcystin
and water temperature also had a significant positive correlation.

v
Acknowledgements
I would firstly like to thank my advisor, Dr. Stephanie Guildford for all of her guidance, expertise,
support, and patience throughout my degree. It has been greatly appreciated! I thank my committee
members, Dr. Ralph Smith and Dr. Kirsten Muller, for their input, and Dr. Josh Neufeld and Dr.
William Taylor for kindly sitting in on my thesis defence. I am very grateful to my UWAEG
labmates, especially Amanda Poste and Aline Chhun with whom I collaborated on the microcystin
project. I thank Amanda Poste for organizing the Bay of Quinte and Maumee Bay field work and for
performing the PAM measurements. I also thank Annie Chiavaroli whose work for her 4th year
project on the GRCA reservoirs formed the basis of my fourth chapter. I am thankful to all who
participated in the Bay of Quinte 2005 sampling and provided me with water to analyze, especially
Kim Rattan, Greg Silsbe, Dan Hamilton, Tim Kuntz, and any others. I am grateful to those who
assisted in the lab and field, especially Zing-Ying Ho, Janet Ma, Ann Balasubramaniam, Cindy
Wang, and Justin Lorentz. I thank David Depew, who performed the CN analysis, Dr. Yuri Kozlov,
who performed much of the chemical analyses in my fourth chapter, and Ryan Sorichetti who
performed silica analysis. I also thank Dr. Luis Leon for providing data on Grand River catchment
area land use.
I would like to thank my family and friends who supported me personally throughout my
degree, especially my partner, Tomas Grana, and my parents, Edward and Barbara Yakobowski.
Thank you for patiently listening.

vi
Dedication
In memory of my grandparents,
Douglas and Ethel Wicks and Edward and Helen Yakobowski.

vii
Table of Contents Author’s Declaration ............................................................................................................................. ii Abstract ................................................................................................................................................ iii Acknowledgements ............................................................................................................................... v Dedication ............................................................................................................................................ vi Table of Contents ................................................................................................................................ vii List of Figures ....................................................................................................................................... x List of Tables.................................................................................................................................... xviii Chapter 1 Introduction .......................................................................................................................... 1
1.0 Introduction to Thesis.................................................................................................................. 1 1.1 Ecology of Cyanobacteria Linked to Their Success.................................................................... 2
1.1.1 Buoyancy Regulation ........................................................................................................... 3 1.1.2 Resting Cells ........................................................................................................................ 3 1.1.3 Nitrogen and Phosphorus ..................................................................................................... 4 1.1.4 Influence of Dreissenid Mussels .......................................................................................... 4 1.1.5 Mucilage............................................................................................................................... 5 1.1.6 Pigments ............................................................................................................................... 6
1.2. Structure and Properties of Microcystin.................................................................................... 6 1.3 Effects of Microcystin: from Enzyme to Ecosystem................................................................... 8 1.4 Factors Linked to Toxin Production......................................................................................... 10 1.5 Study Sites................................................................................................................................. 11
1.5.1 Maumee Bay ...................................................................................................................... 11 1.5.2 Bay of Quinte ..................................................................................................................... 13 1.5.3 Grand River Reservoirs ...................................................................................................... 16
1.6 Hypotheses ................................................................................................................................ 18 Chapter 2 Microcystin Detection ........................................................................................................ 20
2.1 Introduction to Methods for Microcystin Detection.................................................................. 20 2.1.1 Liquid Chromatography ..................................................................................................... 21 2.1.2 Enzyme-Linked Immunosorbent Assay ............................................................................. 22 2.1.3. Protein Phosphatase Inhibition Assay ............................................................................... 22
2.2 Assay Troubleshooting and Optimization ................................................................................. 25 2.2.1 Microcystin......................................................................................................................... 27

viii
2.2.2 PP2A Inactivity .................................................................................................................. 28 2.2.3 Enzyme Supply .................................................................................................................. 29 2.2.4 PP2A Level Optimization .................................................................................................. 30
2.3 Method Validation with Microcystis Cultures .......................................................................... 35 2.4 Final PPIA Formulation ............................................................................................................ 36
2.4.1 Preparation of Buffers, Enzyme, and Substrate Solutions ................................................. 36 2.4.2 Preparation of Microcystin-LR Standards.......................................................................... 37 2.4.3 Assay Step Sequence.......................................................................................................... 38
2.5 Data Handling ........................................................................................................................... 39 2.6 Problems and Cautionary Notes ................................................................................................ 40
Chapter 3 Bay of Quinte and Maumee Bay ........................................................................................ 41 3.1 Introduction ............................................................................................................................... 41
3.1.1 Microcystin Background .................................................................................................... 41 3.1.2 Dreissenids in the Great Lakes........................................................................................... 41 3.1.3 Study Sites.......................................................................................................................... 42 3.1.4 Hypotheses ......................................................................................................................... 43
3.2 Methods..................................................................................................................................... 43 3.2.1 Study Sites.......................................................................................................................... 43 3.2.2 Sampling Procedure ........................................................................................................... 44 3.2.3 Nutrient and Chlorophyll Analyses.................................................................................... 45 3.2.4 Microcystin Analysis.......................................................................................................... 46 3.2.5 Data Analysis ..................................................................................................................... 46
3.3 Results ....................................................................................................................................... 47 3.3.1 Bay of Quinte Results ........................................................................................................ 47 3.3.2 2005 Bay of Quinte Microcystin Results ........................................................................... 74 3.3.3 Maumee Bay 2006 Results................................................................................................. 75
3.4 Discussion ................................................................................................................................. 99 3.4.1 Bay of Quinte Discussion................................................................................................... 99 3.4.2 Maumee Bay Discussion .................................................................................................. 104
3.5 Conclusion............................................................................................................................... 107 Chapter 4 Grand River Reservoirs .................................................................................................... 109
4.1 Study Sites............................................................................................................................... 109

ix
4.1.1 Microcystin Background .................................................................................................. 110 4.1.2 Hypotheses ....................................................................................................................... 110
4.2 Methods................................................................................................................................... 111 4.2.1 Sampling Procedure ......................................................................................................... 111 4.2.2 Light Calculations ............................................................................................................ 112 4.2.3 Nutrient and Chlorophyll Analyses.................................................................................. 112 4.2.4 Microcystin Analysis........................................................................................................ 113 4.2.5 Data Analysis ................................................................................................................... 113
4.3 Results ..................................................................................................................................... 115 4.3.1 Physical Characteristics.................................................................................................... 115 4.3.2 Chlorophyll....................................................................................................................... 124 4.3.3 Phosphorus ....................................................................................................................... 126 4.3.4 Nitrogen............................................................................................................................ 129 4.3.5 Nutrient Ratios ................................................................................................................. 133 4.3.6 Fluoroprobe and PAM...................................................................................................... 136 4.3.7 Microcystin....................................................................................................................... 139
4.4 Discussion ............................................................................................................................... 141 4.4.1 Light and Water Column Stability ................................................................................... 141 4.4.2 Phosphorus ....................................................................................................................... 142 4.4.3 Nitrogen and TN:TP......................................................................................................... 142 4.4.4 Chlorophyll and Fluoroprobe Results .............................................................................. 143 4.4.5 Nutrient Status Indicators................................................................................................. 144
4.5 Conclusion............................................................................................................................... 144 Chapter 5 Conclusions ...................................................................................................................... 146
5.1 Summary of Hypothesis Testing for Individual Water Bodies ............................................... 146 5.2 Bloom Formation and Implications for Toxicity .................................................................... 148 5.3 Overall Trends with Microcystin ............................................................................................ 149 5.4 Final Thoughts......................................................................................................................... 154
Appendix A Bay of Quinte 2006 Dataset.......................................................................................... 167 Appendix B Maumee Bay 2006 Dataset ........................................................................................... 170 Appendix C GRCA Dataset by Date................................................................................................. 173

x
List of Figures
Figure 1.1. A bathymetric map of Lake Erie courtesy of the National Geophysical Data Center:
National Oceanic and Atmospheric Administration (www.ngdc.noaa.gov/mgg/image/erie.jpg).
The relatively shallow western basin of Lake Erie is indicated by the large square and Maumee
Bay is indicated by the smaller circle.......................................................................................... 12 Figure 1.2. A bathymetric map of Lake Ontario courtesy of the National Geophysical Data Center:
National Oceanic and Atmospheric Administration
(http://www.ngdc.noaa.gov/mgg/image/ontario512.jpg). The Bay of Quinte is indicated and
labelled. ....................................................................................................................................... 15 Figure 1.3. A map of the Bay of Quinte showing the relatively small geographical area surveyed
from Deseronto, Ontario. ............................................................................................................ 15 Figure 1.4. A map showing land use in the Grand River watershed. Areas not coloured are
rural/agricultural. This image is credited to Dr. Bob Sharpe and Sonya Chittick and was sourced
from: http://info.wlu.ca/~wwwgeog/thesis/tour2.html. Reproduced with permission. ............... 17 Figure 1.5. The Grand River watershed with Conestogo, Belwood, and Guelph lakes circled from left
to right. Image courtesty of GRCA: http://library.mcmaster.ca/maps/images/GRCAMap.gif. .. 18 Figure 2.1. “Dose-response inhibitory activity of microcystin-LR on PP2A using colorimetric (p-
NPP) and fluorogemic (MUP and DiFMUP) substrates. Each value represents the mean of three
experiments +/- the standard deviation.” Bouaicha et al., 2002. Copyright Elsevier, reproduced
with permission. .......................................................................................................................... 26 Figure 2.2. An example of results from an early assay attempt using the Upstate 1 enzyme (see Table
2.2). The variation in replicates for each microcystin standard is shown. The amount of
microcystin present in the well has a nearly insignificant impact on fluorescence..................... 26 Figure 2.3. May 31, 2006 comparison of ‘New’ Ridel-de Haen microcystin-LR standard supplied
dissolved in methanol and ‘Old’ microcystin-LR standard supplied as a powder. 1x Promega 1
PP2A (Table 2.2) was used to test inhibition caused by the toxin. ............................................. 28 Figure 2.4. Comparison of newly purchased Promega 1 PP2A and older, relatively inactive Upstate 2
PP2A (Table 2.2) performed on May 29, 2006. .......................................................................... 29 Figure 2.5. September 5, 2006 comparison of three enzyme concentrations using the Upstate 3
enzyme batch (Table 2.2). ........................................................................................................... 32

xi
Figure 2.6. “Inhibition curve for microcystin-LR standards analysed in four replicates in high-purity
water with error bars representing standard deviation.” Heresztyn and Nicholson (2001).
Copyright Elsevier, reproduced with permission. ....................................................................... 33 Figure 2.7. A standard curve used to isolate ‘low’ samples between 0.05 and 0.1 µg/L microcystin
performed on July 12, 2007. Upstate 4 enzyme (Table 2.2) was used at a concentration of 0.18x.
Graph ‘A’ shows all of the standards and that the greatest resolution occurred between the
desired 0.05 and 0.1 µg/L. Standards lower and higher than those, respectively, could not be
differentiated from each other. Graph ‘B’ shows the interpolation between 0.05 and 0.1 that was
used for quantification of samples............................................................................................... 34 Figure 2.8. An example of a standard curve from March 30, 2007 that employed Upstate 4 enzyme
(Table 2.2) at a concentration of 0.4x. This curve was used to test samples between the 0.1 and
0.25 µg/L range. Graph ‘A’ shows all of the standards and the obvious magnification of the 0.1-
0.25 area of the curve. Graph ‘B’ shows the result of interpolation between those points that was
used for sample quantification. ................................................................................................... 35 Figure 3.1. A map of western Lake Erie showing the seven stations sampled within Maumee Bay.. 44 Figure 3.2. Boxplot of Secchi depth at 6 Bay of Quinte stations sampled in 2006. Variation shown
within a sampling period is that between stations. ...................................................................... 50 Figure 3.3. Boxplot of extracted chlorophyll a at six Bay of Quinte stations in 2006. The extracted
chlorophyll values represent the means of duplicate extractions and readings. .......................... 50 Figure 3.4. Boxplot of particulate phosphorus measured at six stations in the Bay of Quinte in 2006.
..................................................................................................................................................... 51 Figure 3.5. Boxplot of July 4, 2006 Bay of Quinte chlorophyll a levels at three deep and three
shallow stations. .......................................................................................................................... 51 Figure 3.6. Boxplot of TP from six stations in the Bay of Quinte in 2006. ........................................ 52 Figure 3.7. Boxplot of SRP concentration in the Bay of Quinte on July 4, 2006 and Sept. 22, 2006. 52 Figure 3.8. Boxplot of TDP from six Bay of Quinte stations in 2006. ............................................... 53 Figure 3.9. Boxplot of July 4, 2006 SRP concentrations at three deep and three shallow stations in the
Bay of Quinte. ............................................................................................................................. 53 Figure 3.10. Boxplot of July 4, 2006 TDP concentrations at three deep and three shallow stations in
the Bay of Quinte. ....................................................................................................................... 54 Figure 3.11. Boxplot of ammonia levels at six Bay of Quinte stations in 2006.................................. 55

xii
Figure 3.12. Boxplot of nitrate values for July 4, 2006 and Sept. 22, 2006 in the Bay of Quinte. The
line at 0 in September represents 5 of the 6 stations which were below the detection limit. ...... 55 Figure 3.13. Boxplot of NO2 concentrations at six stations in the Bay of Quinte on July 4, 2006 and
Sept. 22, 2006.............................................................................................................................. 56 Figure 3.14. Boxplot of September 22, 2006 NO2 at three deep and three shallow stations in the Bay
of Quinte...................................................................................................................................... 56 Figure 3.15. Boxplot of particulate N levels in the Bay of Quinte at six stations on July 4, 2006 and
Sept. 22, 2006.............................................................................................................................. 57 Figure 3.16. TN values for six stations in the Bay of Quinte in 2006 shown in a boxplot. ................ 58 Figure 3.17. Boxplot of TN:TP (molar) from six Bay of Quinte stations in 2006. ............................. 58 Figure 3.18. Boxplot showing soluble reactive Si concentrations at six stations in the Bay of Quinte
on July 4, 2006 and Sept. 22, 2006. ............................................................................................ 59 Figure 3.19. Boxplot showing particulate Si concentrations at six stations in the Bay of Quinte on
July 4, 2006 and Sept. 22, 2006. ................................................................................................. 59 Figure 3.20. Boxplot showing particulate Si concentrations at three deep and three shallow stations in
the Bay of Quinte on Sept. 22, 2006. .......................................................................................... 60 Figure 3.21. Boxplot of C:N molar ratios from six Bay of Quinte stations in 2006. .......................... 61 Figure 3.22. Boxplot of C to N molar ratios from the Bay of Quinte on September 22, 2006. 3 deep
stations (depth range: 5.2- 6.4m) and 3 shallow stations (depth range: 1.2- 2.4m) are compared.
..................................................................................................................................................... 61 Figure 3.23. Boxplot showing C to P molar ratios for six Bay of Quinte sites in 2006. ..................... 62 Figure 3.24. Boxplot of ETRmax measurements from the Bay of Quinte obtained via PAM
fluorometry in 2006. An outlier (station GPt in Sept.) has been excluded.................................. 62 Figure 3.25. Below are profiles showing temperature, total chlorophyll, and cyanobacterial
distributions with depth as determined by the Fluoroprobe in the Bay of Quinte in 2006.......... 63 Figure 3.26. Boxplot comparing fluoroprobe results for total chlorophyll and cyanobacterial pigments
from the Bay of Quinte, 2006. Each box represents six stations................................................. 68 Figure 3.27. Box-plot showing total microcystin-LR equivalents (both intracellular and extracellular)
for all six stations in the Bay of Quinte in 2006.......................................................................... 72 Figure 3.28. Box-plot showing dissolved microcystin-LR equivalents for six stations in the Bay of
Quinte, 2006. ............................................................................................................................... 72

xiii
Figure 3.29. Boxplot showing the percentage of total microcystin comprised by dissolved toxin in the
Bay of Quinte in 2006. ................................................................................................................ 73 Figure 3.30. Scatterplot showing the relationship between percent dissolved microcystin and total
microcystin. The deep vs. shallow and July vs. Sept. samples have been differentiated for
comparison. ................................................................................................................................. 73 Figure 3.31. Boxplot of particulate microcystin/ chlorophyll a for two sampling periods in the Bay of
Quinte, 2006. ............................................................................................................................... 74 Figure 3.32. Boxplot of secchi depth from 7 stations in Maumee Bay on June 20, 2006 and Aug. 22,
2006............................................................................................................................................. 78 Figure 3.33. Boxplot of extracted chlorophyll a from 7 stations in Maumee Bay on Aug. 22, 2006
and from all stations except Crib on June 20, 2006. The Aug. data is an average of 2 extractions
and analyses................................................................................................................................. 78 Figure 3.34. Below are the Maumee Bay 2006 Fluoroprobe profiles. ................................................ 79 Figure 3.35. Boxplot of particulate P. No data from June for MB18 was available. .......................... 85 Figure 3.36. Boxplot of total P from 7 stations in Maumee Bay on June 20, 2006 and Aug. 22, 2006.
..................................................................................................................................................... 85 Figure 3.37. Boxplot of total dissolved P from 7 stations in Maumee Bay on June 20, 2006 and 6 on
Aug. 22, 2006 (Crib not sampled then). ...................................................................................... 86 Figure 3.38. Boxplot of TDP in June, 2006 from Maumee Bay separated by station depth............... 86 Figure 3.39. Boxplots showing distribution of SRP by depth and month in 2006 in Maumee Bay.
Crib was not sampled on either date. .......................................................................................... 87 Figure 3.40. Boxplot of C to P molar ratios from 7 stations in Maumee Bay on Aug. 22, 2006 and 5
stations in June 20, 2006 (Crib and MB18 not sampled). ........................................................... 87 Figure 3.41. Boxplot of NH3 measured from 6 Maumee Bay stations on Aug. 22, 2006 (Crib not
sampled). No June data is available. ........................................................................................... 88 Figure 3.42. Boxplot of NO3 from 6 Maumee Bay stations on June 20, 2006 and Aug. 22, 2006 (Crib
not sampled either time). ............................................................................................................. 89 Figure 3.43. Boxplot of NO2 from 6 Maumee Bay stations on June 20, 2006 and Aug. 22, 2006 (Crib
not sampled either time). ............................................................................................................. 89 Figure 3.44. Boxplot of particulate N in Maumee Bay on June 20, 2006 and Aug. 22, 2006. Crib was
not sampled in June. .................................................................................................................... 90

xiv
Figure 3.45. Boxplot comparing Total N on June 20, 2006 and Aug. 22, 2006 at deep and shallow
stations in Maumee Bay. Note: Crib and MB18 were not sampled in June................................ 91 Figure 3.46. C to N molar ratio from Maumee Bay on June 20, 2006 (6 stations: Crib not sampled)
and Aug. 22, 2006 (7 stations). ................................................................................................... 91 Figure 3.47. Boxplot of TN to TP ratio for Maumee Bay on June 20, 2006 and Aug. 22, 2006. June
MB18 and June Crib data were unattainable............................................................................... 92 Figure 3.48. Percent cyanobacteria as detected by the Fluoroprobe on June 20, 2006 and August 22,
2006 in Maumee Bay. ................................................................................................................. 95 Figure 3.49. Comparison of Maumee Bay chlorophyll estimates from laboratory acetone extraction
of samples from 1m or the surface (Appendix B) and in situ Fluoroprobe chlorophyll estimates
averaged over the mixed layer..................................................................................................... 95 Figure 3.50. Boxplot of dissolved microcystin in Maumee Bay on June 20, 2006 and Aug. 22, 2006.
Data is in equivalents of microcystin-LR.................................................................................... 96 Figure 3.51. Boxplot of total microcystin in Maumee Bay on June 20, 2006 and Aug. 22, 2006. Data
is in equivalents of microcystin-LR and includes both intracellular and extracellular toxin. ..... 97 Figure 3.52. Boxplot showing distribution of percent dissolved microcystin values for Aug. 22, 2006
in Maumee Bay. June data is not presented as microcystin was below detection....................... 97 Figure 3.53. Boxplot of the PAM’s ETRmax values from Maumee Bay. June 8M, June Crib, and
Aug. Crib were not sampled........................................................................................................ 98 Figure 3.54. Boxplot of ETRmax, a PAM parameter, at two depth categories in Maumee Bay in
August, 2006. .............................................................................................................................. 98 Figure 3.55. Boxplot of Fv/Fm values from the PAM. N=4 for June and N=6 for August. ............... 99 Figure 4.1. Depth of stations on each sampling trip. One station was sampled from each reservoir and
it was chosen at the seemingly deepest point of the reservoir................................................... 115 Figure 4.2. Mixing depths in Belwood, Conestogo, and Guelph lakes in 2005 as determined by
fluoroprobe temperature profiles. Sampling dates are listed in Table 4.2................................. 116 Figure 4.3. GRCA Fluoroprobe profiles below. ................................................................................ 117 Figure 4.4. Secchi depth from Belwood, Conestogo, and Guelph lakes. Sampling dates: Table 4.2.
................................................................................................................................................... 123 Figure 4.5. Light attenuation coefficient from Belwood, Conestogo, and Guelph lakes in 2005 as
determined from CTD profiler readings. Sampling trip dates are listed in Table 4.2. .............. 123

xv
Figure 4.6. Euphotic depth in Belwood, Conestogo, and Guelph lakes in 2005. Sampling trip dates
are listed in Table 4.2. ............................................................................................................... 124 Figure 4.7. Mean irradiance from Belwood, Conestogo, and Guelph lakes in 2005. Dates of sampling
trips are listed in Table 4.2. ....................................................................................................... 124 Figure 4.8. Epilimnetic extracted chlorophyll a levels from Belwood, Conestogo, and Guelph lakes
from 2005. All samples were taken at a depth of 2m with the exception of that from Belwood
Lake on trip #7. Sampling trip dates are listed in Table 4.2...................................................... 125 Figure 4.9. Hypolimnetic extracted chlorophyll a from Belwood, Conestogo, and Guelph lakes in
2005. Depths sampled were typically 10m for Belwood Lake, 7m for Conestogo Lake, and 6m
for Guelph Lake. Sampling trip dates are listed in Table 4.2.................................................... 125 Figure 4.10. Epilimnetic soluble reactive P levels from Belwood, Conestogo, and Guelph lakes in
2005. Sampling trip dates are listed in Table 4.2. ..................................................................... 127 Figure 4.11. Epilimnetic total dissolved P levels from Belwood, Conestogo, and Guelph lakes in
2005. Sampling trip dates are listed in Table 4.2. ..................................................................... 127 Figure 4.12. Epilimnetic particulate P levels in Belwood, Conestogo, and Guelph lakes in 2005.
Sampling trip dates are listed in Table 4.2. ............................................................................... 128 Figure 4.13. Epilimnetic total P levels in Belwood, Conestogo, and Guelph lakes in 2005. Samples
were always taken from 2m with the exception of the Belwood sample on trip #7. Sampling trip
dates are listed in Table 4.2. ...................................................................................................... 128 Figure 4.14. Hypolimnetic total P from Belwood, Conestogo, and Guelph lakes in 2005. Depths
sampled were typically 10m for Belwood Lake, 7m for Conestogo Lake, and 6m for Guelph
Lake. Sampling trip dates are listed in Table 4.2. ..................................................................... 129 Figure 4.15. Epilimnetic ammonia levels in Belwood, Conestogo, and Guelph lakes in 2005.
Sampling trip dates are listed in Table 4.2. ............................................................................... 130 Figure 4.16. Epilimnetic nitrate levels in Belwood, Conestogo, and Guelph lakes in 2005. Sampling
trip dates are listed in Table 4.2. ............................................................................................... 130 Figure 4.17. Epilimnetic nitrite levels in Belwood, Conestogo, and Guelph lakes in 2005. Sampling
trip dates are listed in Table 4.2. ............................................................................................... 131 Figure 4.18. Epilimnetic particulate N in Belwood, Conestogo, and Guelph lakes in 2005. Sampling
trip dates are listed in Table 4.2. ............................................................................................... 132

xvi
Figure 4.19. Epilimnetic total N levels in Belwood, Conestogo, and Guelph lakes in 2005. Samples
were always taken from 2m with the exception of the Belwood sample on trip #7. Sampling trip
dates are listed in Table 4.2. ...................................................................................................... 132 Figure 4.20. Hypolimnetic total N levels in Belwood, Conestogo, and Guelph lakes in 2005. Depths
sampled were typically 10m for Belwood Lake, 7m for Conestogo Lake, and 6m for Guelph
Lake. Sampling trip dates are listed in Table 4.2. ..................................................................... 133 Figure 4.21. Epilimnetic TN to TP molar ratios from Belwood, Conestogo, and Guelph lakes in 2005.
Samples were taken from 2m with the exception of the Belwood sample on trip #7. Sampling
trip dates are listed in Table 4.2. ............................................................................................... 134 Figure 4.22. Hypolimnetic TN to TP molar ratios from Belwood, Conestogo, and Guelph lakes in
2005. Depths sampled were typically 10m for Belwood Lake, 7m for Conestogo Lake, and 6m
for Guelph Lake. Sampling trip dates are listed in Table 4.2.................................................... 135 Figure 4.23. Epilimnetic particulate C to N molar ratios from Belwood, Conestogo and Guelph lakes
from 2005. The line indicates a ratio of 8.3 above which moderate N deficiency is suggested.
Sampling dates can be found in Table 4.2................................................................................. 135 Figure 4.24. Epilimnetic particulate C to P molar ratios from Belwood, Conestogo and Guelph lakes
in 2005. The lines indicate the range of ratios between 129 and 258 that suggests moderate P
deficiency. Ratios above 258 suggest extreme P deficiency. Sampling dates can be found in
Table 4.2.................................................................................................................................... 136 Figure 4.25. 2005 concentrations of cyanobacteria-specific pigments in Belwood, Conestogo, and
Guelph lakes as determined by the Fluoroprobe. ...................................................................... 137 Figure 4.26. Percent cyanobacteria as determined by the fluoroprobe in Belwood, Conestogo, and
Guelph lakes in 2005................................................................................................................. 137 Figure 4.27. Variable fluorescence (Fv/Fm) as determined by the Diving-PAM in Belwood,
Conestogo, and Guelph lakes in 2005. Sampling trip dates are listed in Table 4.2. ................. 138 Figure 4.28. Total microcystin levels (epilimnetic) in Belwood, Conestogo, and Guelph lakes in
2005. Sampling trip dates are listed in Table 4.2. ..................................................................... 140 Figure 4.29. Linear regression of epilimnetic microcystin and epilimnetic chlorophyll in all three
GRCA reservoirs on all dates in 2005, R2=0.53, P<0.01. ......................................................... 140 Figure 5.1. Plot of total microcystin vs. C:P molar ratio for all water bodies sampled in this study.
M=Maumee Bay, Q=Bay of Quinte, B=Belwood Lake, C=Conestogo Lake, and G=Guelph
Lake........................................................................................................................................... 149

xvii
Figure 5.2. Total microcystin plotted against extracted chlorophyll a for all Maumee Bay, Bay of
Quinte, and GRCA data. Symbols are as in Figure 5.1. ............................................................ 150 Figure 5.3. Total microcystin plotted against the Fluoroprobe’s estimate of chlorophyll attributable to
cyanobacteria for all water bodies in this study. Symbols are as in Figure 5.1......................... 150 Figure 5.4. Total microcystin plotted against TN:TP molar ratios in all study sites. The x-axis in a log
scale. Symbols are as in Figure 5.1. .......................................................................................... 151 Figure 5.5. Total microcystin plotted against Fv/Fm variable fluorescence ratios for all study sites.
Symbols are as in Figure 5.1. .................................................................................................... 152 Figure 5.6. The log plus one of total microcystin plotted against the log of TP. The log plus one was
used for the y-axis as some data points were 0.00. All water bodies in this study are represented.
Symbols are as in Figure 5.1. .................................................................................................... 153 Figure 5.7. Total Microcystin plotted against Temperature for all study sites. Symbols are as in
Figure 5.1. ................................................................................................................................. 153

xviii
List of Tables
Table 1.1. Summary chart of the known structural classes of cyanotoxins (Chorus and Bartram 1999;
Falconer 2005)............................................................................................................................... 2 Table 2.1. Comparison of liquid chromatography, ELISA, and PPIA methods (Mountfort et al. 2005,
Bouaicha et al. 2002, Rapala et al. 2002, Neissan and van der Greef 1992, Kemeny and
Challacombe 1988). .................................................................................................................... 20 Table 2.2. PP2A enzyme batches received from Upstate and Promega suppliers over the course of the
study. ........................................................................................................................................... 30 Table 2.3. Results of testing of Microcystis cultures maintained by Cindy Wang under different P
conditions. Non-microcystin results used with permission. ‘Lim.’ = limited, ‘Rep.’= replete,
‘Diss.’= dissolved, and ‘Mcyst’= microcystin. ........................................................................... 36 Table 2.4. Details of preparation of assay solutions described in Bouaicha et al. (2002)................... 37 Table 3.1. All Bay of Quinte ANOVA results. Significant differences and strong trends are
highlighted................................................................................................................................... 47 Table 3.2. Preserved phytoplankton count performed by Hedy Kling on a sample from station NA
from July 4, 2006. ....................................................................................................................... 69 Table 3.3. Phytoplankton count performed by Hedy Kling on a sample from station NA from
September 22, 2006. Note: Aphanocapsa holsatica specifically refers to Aphanocapsa holsatica
(Lemm) Cronb. & Kom. Data on heterocysts are not available. ................................................. 70 Table 3.4. Bay of Quinte 2005 microcystin results. ‘# Runs’ refers to the number assays from which
results were averaged to yield the total microcystin number listed............................................. 75 Table 3.5. All Maumee Bay ANOVA results. Significant differences and strong trends are
highlighted................................................................................................................................... 75 Table 3.6. Phytoplankton count performed by Hedy Kling on a sample from station 8M from Aug.
21, 2006. Please note: Aphanocapsa holsatica specifically refers to Aphanocapsa holsatica
(Lemm) Cronb. & Kom. And Chroococcus minutus specifically refers to Chroococcus minutus
(Kutz) Naeg. ................................................................................................................................ 93 Table 4.1. GRCA variables that were normal or required log-transformations prior to statistical
analysis. ..................................................................................................................................... 114 Table 4.2. Numbered sampling trips as they appear in the GRCA figures and their corresponding
dates........................................................................................................................................... 114

xix
Table 4.3. Summary of linear regressions performed with total microcystin as the dependent variable.
Significant regressions are in bold. Regressions that neared statistical significance are also
listed. ‘Epi. Avg.’= average of entire mixed layer. ................................................................... 139 Table 4.4. Breakdown of Belwood, Conestogo, and Guelph watersheds by land type. 2005 data was
used with permission of Luis Leon and originally compiled by Lesley-Ann Chiavaroli.......... 143 Table 5.1. Summary of variables hypothesized to be associated with higher microcystin
concentrations and the results hypothesis testing...................................................................... 148

1
Cha
pter 1 Introduction
1.0 Introduction to Thesis
In recent years, cyanobacterial blooms have received increasing attention worldwide due to their
more frequent and severe occurrences (Falconer 2005). The ability of many bloom-forming species
to produce toxins is particularly alarming to water quality managers. Genera capable of producing
these cyanotoxins (Table 1.1) are important research subjects as much remains to be understood
about the conditions that trigger potentially toxic blooms in a variety of water bodies. One such
cyanotoxin is microcystin. In this study, two Great Lakes bays and three small reservoirs were
surveyed to better understand the dynamics of microcystin within them and the environmental
variables influencing its concentrations. In this introductory chapter (1), I provide a general review of
the ecology of cyanobacteria, background information about microcystin, a brief review of the
factors linked with microcystin occurrence, a description of the three study sites and an outline of my
hypotheses to be tested. Chapter 2 describes the research I conducted to adapt a sensitive assay for
measuring total and dissolved microcystin in unconcentrated natural water samples across a range of
concentrations. Subsequent chapters describe the results of surveys conducted in the Bay of Quinte
and Maumee Bay during early and late summer 2006 where physical and chemical variables were
measured and related to microcystin concentrations (Chapter 3), and the results from similar bi-
weekly surveys of the three Grand River reservoirs sampled from July through September 2005
(Chapter 4). In Chapter 5 I briefly compare the data in all three study sites and provide my overall
conclusions.

2
Table 1.1. Summary chart of the known structural classes of cyanotoxins (Chorus and Bartram 1999;
Falconer 2005).
Toxin Name Mammalian Target Organ Producers (Genera) Cyclic Peptides
Microcystins Liver Microcystis Anabaena Planktothrix/ Oscillatoria Nostoc Hapalosiphon (soil dweller) Anabaenopsis Snowella Woronichinia
Nodularin Liver Nodularia Alkaloids
Anatoxin-a Nerve synapse Anabaena Planktothrix/ Oscillatoria Aphanizomenon
Aplysiatoxins Skin Lyngbya Schizothrix Planktothrix/ Oscillatoria
Cylindrospermopsins Liver Cylindrospermopsis Aphanizomenon Umezakia
Lyngbyatoxin-a Skin, G.I. tract Lyngbya
Saxitoxins Nerve axons Anabaena Aphanizomenon Lyngbya Cylindrospermopsis
Lipopolysaccharides Skin/ Exposed Tissue (irritant) All
1.1 Ecology of Cyanobacteria Linked to Their Success
Cyanobacteria are intriguing organisms as they are the only known prokaryotic oxygenic
photosynthesizers and have become adapted to varied habitats such as hot springs, snow and ice, the
calm surface waters of stratified eutrophic lakes, and in deep dimly lit layers (Graham and Wilcox
2000). Their success in these varied niches is a testament to their ability to compete with other

3
photosynthesizers. A variety of characteristics can potentially give cyanobacteria a competitive
advantage under certain circumstances, and these will now be discussed.
1.1.1 Buoyancy Regulation
Some cyanobacteria possess the ability to produce gas vesicles which allow them to regulate their
position within the water column. When enough gas vesicles are formed and intact, individual cells,
filaments, and colonies are positively buoyant and move up toward their light source. Buoyancy
becomes negative and cyanobacteria sink for various reasons including gas vesicles collapse (when
turgor pressure becomes too great during rapid growth) and the accumulation of dense photosynthetic
products (Ibelings et al. 1991, Reynolds 2006). Buoyancy-regulating cyanobacteria may be able to
out compete other phytoplankton by migrating between richer nutrient supplies in deeper waters and
more abundant light in shallower waters (Ganf and Oliver 1982). However, buoyancy regulation can
only occur and be advantageous if a stable water column is present, as turbulent water mixes all
phytoplankton (Huisman et al. 2004). Stability is achieved when water is stratified in summer and
wind energy is not sufficient to mix the epilimnion. Warm water also promotes strong stratification
and is well-tolerated by cyanobacteria but not all phytoplankton (Robarts and Zohary 1987). This
temperature tolerance assists them in community dominance in late summer when temperate lakes
are warmest (Kalff 2003).
1.1.2 Resting Cells
The filamentous bloom-forming genera, such as Aphanizomenon and Anabaena, produce akinetes
which are specialized thick-walled cells ideal for resting in the sediment (Kalff 2003) and
recolonizing the water body when appropriate. Notably, Microcystis has no such specialized
reproductive cells, but can survive well in its vegetative form in the sediments (Falconer 2005).

4
1.1.3 Nitrogen and Phosphorus
Cyanobacterial dominance has long been associated with high total P (Downing et al. 2001) and with
a low N to P ratio (Ferber et al. 2004, Smith 1982). These observations may be explained by the fact
that cyanobacteria are much better competitors for N than P and, therefore, do not dominate under
low P conditions. As well, some cyanobacteria possess heterocysts which are specialized cells which
fix atmospheric nitrogen under conditions of nitrogen limitation. Nitrogen is then stored within the
cell as cyanophycin particles which contain N-rich arginine and asparagine (Graham and Wilcox
2000). Notably, no group of algae other than cyanobacteria can fix nitrogen so, when water has a low
N to P ratio, N may limit the growth of eukaryotes while N-fixing cyanobacteria exploit the large
available P pool, becoming dominant (Levine and Schindler 1999, Schindler 1977). It has also been
proposed that non-N fixing cyanobacteria can become dominant if N is limiting in the epilimnion
because they can access any benthic NH4+ source by vertical migration via buoyancy regulation
(Blomqvist et al. 1994).
1.1.4 Influence of Dreissenid Mussels
Decades of reduction in point-source P inputs to the Great Lakes have successfully lowered P levels
to those that would not be expected to promote high cyanobacterial biomass (Nicholls and Hopkins
1993), yet it is occurring (Nicholls et al. 2002). The introduction of invasive Dreissena spp. mussels
may be at least partly responsible. Because dreissenids are such efficient filterers, they increase water
clarity and the length of the clear water phase, which promotes phytoplankton growth, including that
of cyanobacteria (MacIsaac 1996). Several characteristics of Microcystis explain why it may be more
successful in the presence of dreissenids than other phytoplankton. Firstly, Microcystis colonies are
sometimes so large that dreissenids cannot consume them (Vanderploeg et al. 2001) and thus
Microcystis is able to grow while other phytoplankton are grazed down. Secondly, evidence suggests
that dreissenids can differentiate between toxic and non-toxic Microcystis and that they selectively

5
reject still-viable toxic cells as pseudofeces, thereby promoting the formation of toxic blooms
(Vanderploeg et al. 2001). Thirdly, research has shown that dreissenids may indirectly promote
Microcystis by altering the ratio of available N:P. They do this during their process of nutrient
regeneration by excreting much more phosphorus than nitrogen (N:P is <20) (Arnott and Vanni
1996) and by increasing the nitrate flux to the sediments while decreasing the flux of (Bykova et al.
2006). Furthermore, studies have found an interaction effect between total phosphorus concentrations
and the positive affect of dreissenids on Microcystis (Raikow et al. 2004, Sarnelle et al. 2005). For
instance, dreissenid abundance and ‘low’ total P (<25 ug/L) were seen to promote Microcystis
dominance but dreissenid presence at higher total P did not have the same effect (Raikow et al.
2004).
1.1.5 Mucilage
Mucilage is a gelatinous secretion which surrounds the unicells, colonies, and filaments of certain
members of various phytoplankton groups including cyanobacteria (Reynolds 2006). Although the
function of mucilage is still not fully understood, several properties of it may give cyanobacteria
which possess it, such as Microcystis colonies, a competitive advantage. Firstly, mucilage is much
less dense than water and so contributes to positive buoyancy (Reynolds 2006). Secondly, a
mucilaginous sheath increases the streamlining of colonies and filaments, thereby facilitating vertical
movements in the water column (Reynolds 2006). Thirdly, mucilage can protect cyanobacteria from
grazing by increasing the size of colonies and filaments, making them difficult or impossible to be
filtered out of the water (Reynolds 2006). However, if they are consumed by grazers, a fourth
function of mucilage can come into play. As cyanobacteria pass through the gut of some grazers,
they can survive digestion due to their protective sheaths, and emerge as viable cells (Porter 1976,
Reynolds 2006). While passing through the gut, they can even absorb some nutrients from their

6
would-be consumers (Porter 1976, Reynolds 2006). In certain situations these benefits of mucilage
may help promote the success of sheathed cyanobacteria.
1.1.6 Pigments
Because many cyanobacteria are buoyant and can form surface blooms, photoinhibition can be
problematic. Photoinhibition is a decrease in photosynthetic activity caused by over-excitation of the
light-harvesting centres of photosystem II (Reynolds 2006). If several generations of cyanobacteria
are exposed to high irradiace, they accumulate zeaxanthin, a type of carotenoid (Reynolds 2006).
Zeaxanthin allows cyanobacteria to dissipate excess energy as heat, thereby preventing damage to the
photosynthetic apparatus (Reynolds 2006). This can prove to be very advantageous to cyanobacteria
under high irradiance.
1.2. Structure and Properties of Microcystin
Microcystin is a hepatotoxic cyclic peptide and is the most frequently encountered and best studied
cyanotoxin (Chorus and Bartram 1999). There are currently over 70 known structural variants of
microcystin (Codd et al. 2005), with the best known variant being microcystin-LR. The microcystin
molecule contains seven variable amino acids and, most notably, the unusual Adda, which is
involved in binding protein phosphatase and accounts for most of the toxicity (Falconer 2005). Adda,
unlike the twenty standard ribosomally-translated amino acids, is produced through post-translational
modifications performed by a peptide synthetase enzyme (Kaebernick and Neilan 2001).
A single cyanobacterial strain can produce multiple microcystin variants at the same time
and the relative abundance of each variant produced has been shown to change throughout a culture’s
population growth (Lyck 2004). This has environmental implications as the different variants of
microcystin elicit different degrees of toxicity. Those with more hydrophobic L-amino acids
7
(including microcystin-LR) are more toxic and those with more hydrophilic amino acids are less
toxic (Falconer 2005).
Microcystin is mainly held within the cell until it lyses, which means that the senescence of a
large microcystin-producing cyanobacterial bloom results in a strong pulse of toxins into the water.
Once in the water, microcystins are stable, with the following four routes of detoxification occurring
in nature: adsorption by sediments, thermal decomposition aided by low pH and high temperature,
photolysis, and microbial degradation (reviewed by Harada and Tsuji 1998). Notably, the activity of
enzymes of the human gut, such as trypsin, is not included in this list. In nature, microcystins may
persist for weeks, although the precise length of time appears to be dependant on the numbers of
degrading bacteria present (Mazur and Plinski 2001). The degradation products of microcystin do not
display toxicity (Harada and Tsuji 1998).
It is generally thought that microcystin is a secondary metabolite as is not required for an
organism’s primary metabolism (as is a primary metabolite) (Carmichael 1992, Kaebernick and
Neilan 2001a). There has been some debate on this issue since some research has identified a
correlation between growth rate and microcystin production (Orr and Jones 1998). However, the fact
that non-toxic strains of cyanobacteria can function as well as toxin-producing strains supports the
idea that microcystin is not involved in basic metabolism.
There is no conclusive theory about the endogenous function of microcystin, but research
into the topic has generated several preliminary hypotheses which follow. Microcystin has a high
affinity for iron and binds Fe2+ so it has been proposed that the toxin may be useful in collecting iron
under conditions of low availability (Lukac et al. 1993). Alternatively, microcystin may chelate Fe2+
when intracellular iron concentrations are high, thereby protecting the cell from free radical
formation and damage (Kaebernick and Neilan 2001, Utkilen and Gjolme 1995). Furthermore, it has
been asserted that microcystin may play a role in photosynthesis. Evidence to support this includes

8
that the observation that the ‘Adda’ portion of microcystin binds to the thylakoid and that genetic
studies have shown increased transcription of mcy genes (the genes that encode microcystin
production) under high light conditions (Kaebernick and Neilan 2001, Kaebernick et al. 2000). Yet
another hypothesis addresses the allelopathic properties of microcystin (discussed below) and the
possibility that such cyanotoxins function in aiding competition with other phytoplankton (Figueredo
et al. 2007). All of these hypotheses assume that microcystin is still functional to cyanobacteria, but it
is plausible that this peptide is simply an evolutionary relic which has lost its purpose to these ancient
organisms but happens to be toxic.
1.3 Effects of Microcystin: from Enzyme to Ecosystem
Microcystin exerts wide-spread effects, one of which is the inhibition of protein phosphatases (PP) 1
and 2A which are important regulatory enzymes in all eukaryotes (MacKintosh et al. 1990). The
Adda amino acid binds to the enzyme at the hydrophobic groove of its catalytic site thus preventing
enzymatic activity (Goldberg et al. 1995). Microcystin requires a transport system to enter cells and,
in vertebrates, the only suitable system is the bile acid carrier between the stomach and the liver
(Falconer 1993). Microcystin then accumulates in hepatocytes and PP inhibition can lead to collapse
of the hepatocyte cytoskeletons and possibly death by hemorrhaging (Wiegand and Pflugmacher
2005). Long-term low-level exposure or a strong exposure episode can result in chronic liver injury,
including cancer (Chorus and Bartram 1999).
The effects of microcystin in the environment range from primary producers to top
carnivores. Dissolved microcystin in the water can affect other phytoplankton including
cyanobacteria (Sedmak and Elersek 2005). In a laboratory experiment, the presence of microcystins
induced cell aggregation, increased cell and chloroplast volume, and resulted in an overproduction of
photosynthetic pigments in Microcystis aeruginosa and the green alga Scenedesmus quadricauda
(Sedmak and Elersek 2005). Cell aggregation could benefit cyanobacteria by both allowing their own

9
colonies to adjust their buoyancy more quickly and by increasing the sedimentation rate of
competitors from other algal divisions (Sedmak and Elersek 2005). The sedimentation rate of the
motile green alga Chlamydomomas reinhardtii was also shown to be increased by microcystin since
the toxin caused paralysis of the cells (Kearns and Hunter 2001). Evidence for the allelopathic
function of microcystin includes the observation that a M. aeruginosa culture grown in spent non-
toxic Planktothrix agardhii medium produced more toxins (Engelke et al. 2003). In a study of a
related toxin, cylindrospermopsin, evidence for allelopathic function was also found when
phytoplankton grown in the exudates of the toxin-producer Cylindrospermopsis raciborskii showed
inhibited photosynthesis (Figueredo et al. 2007).
Microcystin can affect vascular plants as well. The submerged plant Ceratophyllum
dermersum showed reduced growth following microcystin exposure and impaired photosynthesis
was documented in Elodea canadensis, Myriophyllum spicatum, and Phragmites australis
(Pflugmacher 2002). Toxin present in irrigation water reduced the growth rate and chlorophyll
content of Solanum tuberosum L. (potato), inhibited seedling growth of Synapis alba L. (mustard),
and reduced root development in Phaseolus vulgaris (bean). Furthermore, microcystin was retained
in these plants’ tissues, which is particularly concerning in these crop species (McElhiney et al.
2001).
Negative effects of microcystin have been documented for a variety of zooplankton,
including Bosmina, Chaoborus, and Tetrahymena (Wiegand and Pflugmacher 2005). With the
common cladoceran, Daphnia, experiments have showed that certain Microcystis cells can rapidly
clog the filtering apparatus and, for those that ingest them, depressed function or death can result
(Nizan et al. 1986, Thostrup and Christoffersen 1999). Microcystin has been implicated in fish kills
(Huisman et al. 2004) but it can have subtler effects on fish as well. For instance, it has been shown
to decrease motility in Danio rerio and Leucaspius delineatus and to reverse the diurnal activity
10
pattern of L. delineatus (Baganz et al. 2004). Such changes could have a variety of consequences for
behaviour-dependant processes like reproduction and predator avoidance.
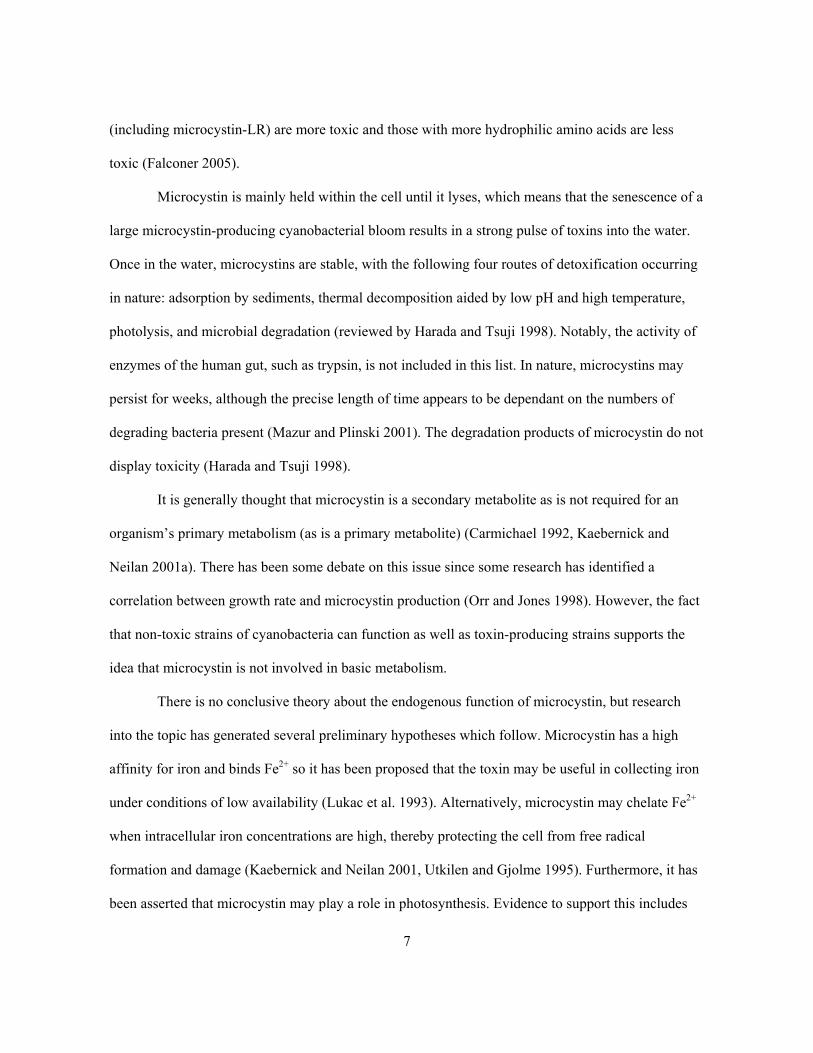
1.4 Factors Linked to Toxin Production
The rate at which individual cells produce microcystin can vary greatly within a species, so factors
beyond abundance of potentially toxigenic species must be investigated in order to understand
microcystin production. The ability of cyanobacterial strains to produce microcystin has been traced
to the mcy gene cluster (Meisner et al. 1996). If this gene cluster is present, it can be expressed to
varying degrees or it may not be expressed at all (Meisner et al. 1996). Both laboratory and field
studies have revealed some intriguing relationships between environmental factors and microcystin
levels that have furthered our collective understanding of microcystin dynamics (reviewed in
Zurawell et al. 2005).
Field studies have shown associations between microcystin and total P, soluble reactive P,
total N, the N to P ratio, chlorophyll a, light, and dissolved O2 (Billam et al. 2006, Kardinaal and
Visser 2005). The literature shows much variability in these relationships, however, and they are
often contradictory (Kardinaal and Visser 2005). For instance, even the relationship between total
phosphorus and microcystin has been shown to be positive (Giani et al. 2005), negative (Oh et al.
2000), and almost nonexistent (Sivonen 1990). Nonetheless, some general patterns can be seen, such
as microcystin production generally being higher under lower light conditions (ex.: Kotak et al.
2000).
Laboratory studies have been used to isolate the effects of individual variables on cell
division rates and microcystin production in particular strains. Culture growth stage, light,
temperature, major nutrients (N, P), salinity, pH, and micronutrients (example: Fe) have all been
investigated. Reviews have noted that toxigenic strains generally produce the most microcystin under
optimal growth conditions, which typically include elevated nutrient concentrations (Kardinaal and

11
Visser 2005, Sivonen and Jones 1999). The exact environmental variables found to best explain
microcystin concentrations appear to be strain-specific, however (Orr and Jones 1998). This led Orr
and Jones (1998) to develop their hypothesis that microcystin production is directly affected by cell
division rate regardless of which environmental factor is limiting that rate at the time.
A review of culture studies showed that toxin production within a single strain can vary only
by a factor of 3 to 4, even over a broad range of environmental conditions (Sivonen and Jones 1999).
However, field microcystin levels can vary by over three orders of magnitude, as can the responses
of different strains to similar growth conditions in the lab (Sivonen and Jones 1999). This suggests
that the majority of natural microcystin variability can be explained not by environmental conditions
but by the relative abundance of the toxic strains present (Giani et al. 2005, Ozawa et al. 2005). The
seasonal succession of cyanobacterial species and strains is most likely very important to microcystin
concentrations, but it is not well understood (Billam et al. 2006, Codd et al. 2005). To date, a reliable
and universal predictor of microcystin production has yet to be identified.
1.5 Study Sites
1.5.1 Maumee Bay
Maumee Bay comprises the westernmost part of Lake Erie’s Western Basin (Figure 1.1) and toxic
cyanobacterial blooms have become a problem there in recent years (Bridgeman 2005). Maumee Bay
is a relatively shallow eutrophic body of water (Table 1.2) and has been impacted by a variety of
human activities. The bay and its major tributary, the Maumee River, are both bordered by the
historically industrial city of Toledo, Ohio, USA. A major glacial wetland known as the Great Black
Swamp, which was once located north of Toledo, was drained and converted to farmland in the
1800’s, thereby changing the hydrology and natural filtering capacity of the area. More wetland
bordering Maumee Bay was filled in the 1980’s to create Maumee Bay State Park (U.S. Army

12
Engineer District, Buffalo 1983). Furthermore, Maumee Bay and neighbouring areas have been
dredged over the years to harvest sand and concern has arisen that contaminants trapped in the
sediments could be released (U.S. Army Engineer District, Buffalo 1983). The aforementioned
processes have contributed to the eutrophication and disturbance of the Maumee Bay aquatic
ecosystem.
The relatively high summer total phosphorus (TP) of the area (Table 1.2) and its sheltered
and calm water column can promote cyanobacterial blooms. The high turbidity introduced into the
bay by the Maumee River has also been associated with the presence of Microcystis blooms
(Bridgeman 2005). Furthermore, the presence of Microcystis-promoting dreissenids has been
documented in Maumee Bay (Fraleigh et al. 1991).
Figure 1.1. A bathymetric map of Lake Erie courtesy of the National Geophysical Data Center: National Oceanic and Atmospheric Administration (www.ngdc.noaa.gov/mgg/image/erie.jpg). The relatively shallow western basin of Lake Erie is indicated by the large square and Maumee Bay is indicated by the smaller circle.

13
Table 1.2. Selected characteristics of the study sites. Information sourced from the following literature: (Bailey et al. 1999, Bur et al. 2002, Grand River Conservation Authority 1980, Grand River Conservation Authority 1984, Hartman 1973, Minns 1995, Minns et al. 1986, Nicholls and Hopkins 1993, Porta et al. 2005).
Attribute Water Body
Bay of Quinte Maumee Bay Belwood Lake Conestogo
Lake Guelph Lake Surface Area (km2) 257.4 ~ 7.77 (max.) 7.35 (max.) 3.6 (max.) (Minns, 1995) (GRCA, 1980) (GRCA, 1980) (GRCA, 1984) Catchment Area (km2) 18 182 ~ 799 518 ~ (Minns, 1986) (GRCA, 1980) (GRCA, 1980) Mean Depth (m) Upper Bay: 3.5 approx. 7 varies Varies varies Middle Bay: 5.2 (Hartman, 1973) Lower Bay: 24.4 (Minns, 1995) Max. Depth (m) 66.4 approx. 10 ~ 22.6 ~ (Minns, 1995) (Hartman, 1973) (GRCA, 1980) Avg. Summer TP (ug/L) 35 45 22.4 18.3 17.9
(2005 UW data) (Western Basin) (2005 UW
data) (2005 UW data) (2005 UW
data) (Porta et al., 2005) Avg. Summer Secchi (m) 2.2 2.7 1.5 2.6 2.6
(2005 UW data) (LEFTG, 2002) (2005 UW
data) (2005 UW data) (2005 UW
data) Year of Damming n/a n/a 1942 1958 1975 (GRCA, 1980) (GRCA, 1980) (GRCA, 1980) Dreissenids Present? Yes, since 1993 Yes, since 1989 No No No
(Bailey et al.,
1999) (Nicholls & G.,
1993)
1.5.2 Bay of Quinte
The Bay of Quinte is a well-studied area of Lake Ontario which is readily recognized by its
characteristic z-shaped border (Figures 1.3 and 1.4). Like Maumee Bay, the Bay of Quinte has been
strongly influenced by colonial human settlement. After colonization in the 1800’s, watershed
deforestation, mining, and agricultural practices all resulted in increased nutrient and fine particle
inputs to the bay (Minns 1995). Mining and industrial development resulted in the discharge of
chemicals into the water body while natural hydrology was disturbed by damming (Minns 1995). In

14
the 1900’s, a growing urban population furthered eutrophication and algal blooms had already been
reported twice in the Bay of Quinte by the 1930’s (Minns 1995). Phosphorus inputs from detergents
and sewage severely altered the Bay of Quinte ecosystem. The system was pushed from a clearwater
state to a turbid one in which macrophyte abundance and fish stocks were significantly reduced
(Minns 1995). As in the Maumee Bay area, the draining of wetlands adjacent to the Bay of Quinte
exacerbated the decline in water quality.
Point-source phosphorus loading controls and the use of upgraded waste water treatment
plants with tertiary treatment were implemented in the 1970’s. Nonetheless, the Bay of Quinte was
defined as one of 42 areas of concern in the Great Lakes in 1985 by the International Joint
Commission and a Remedial Action Plan was formed to deal with eutrophication, undesirable algae,
and degraded phytoplankton and zooplankton communities (Nicholls et al. 2004).
P-loading reduction resulted in a dramatic decrease in total phytoplankton abundance
(Nicholls et al. 2004), however the invasion of dreissenids between 1993 and 1994 quickly resulted
in an undesirable species shift (Bailey et al. 1999). In 1995, Microcystis showed a sudden 13-fold
increase that occurred while all other algal taxa abundances remained the same or decreased
(Nicholls et al. 2002). Microcystin has since become a concern in the bay and studies of its scope
were soon underway.

15
Figure 1.2. A bathymetric map of Lake Ontario courtesy of the National Geophysical Data Center:
National Oceanic and Atmospheric Administration
(http://www.ngdc.noaa.gov/mgg/image/ontario512.jpg). The Bay of Quinte is indicated and labelled.
Figure 1.3. A map of the Bay of Quinte showing the relatively small geographical area surveyed
from Deseronto, Ontario.
16
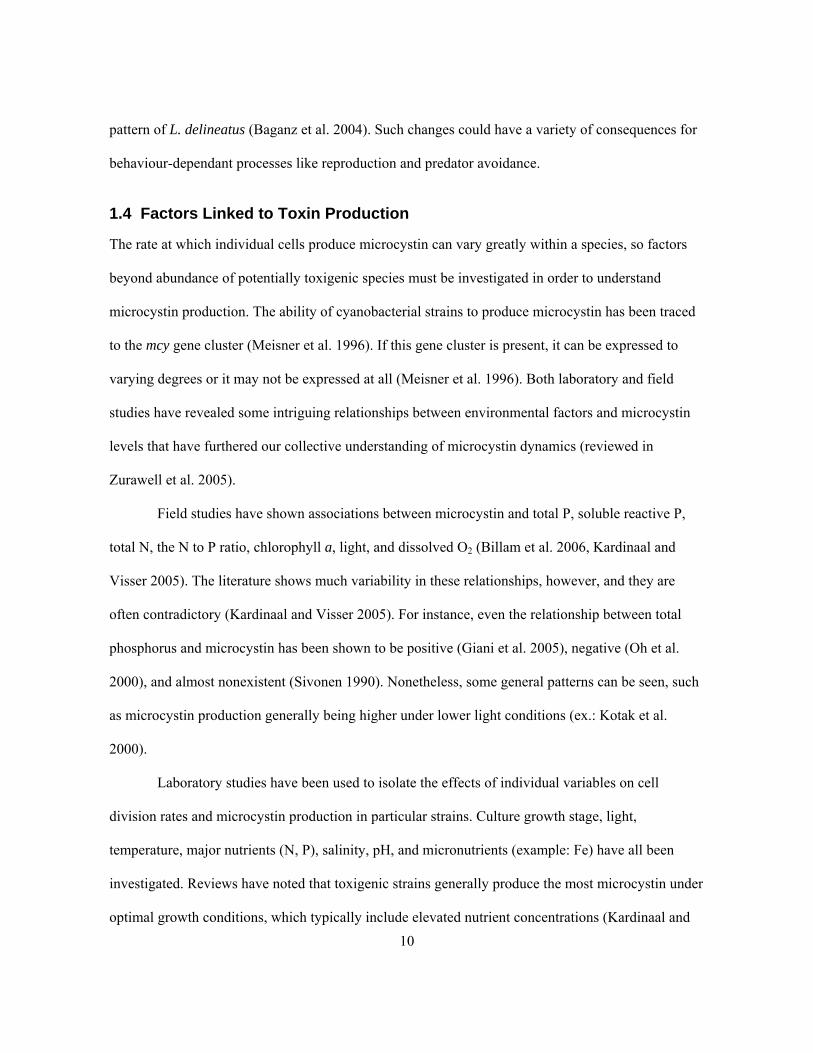
1.5.3 Grand River Reservoirs
The Grand River is an important tributary to Lake Erie which originates just south of Georgian Bay
(Rott et al. 1998). The entire Grand River catchment area (Figure 1.4) has been largely converted for
agricultural and urban uses. The watershed is home to much livestock, including approximately
500,000 cattle, 750,000 pigs, and 9,000,000 hens and chickens (Dorner et al. 2004), which results in
substantial nutrient input to the river. Belwood Lake, Conestogo Lake, and Guelph Lake (Figure 1.5)
are all reservoirs created by damming which occurred in 1942, 1958, and 1975, respectively (Grand
River Conservation Authority 1980). Belwood Lake resulted from the building of the Shand Dam,
which was constructed on the Grand River near Fergus, Ontario. The Conestogo Dam was built on
the mid-reaches of the Conestogo River, while a main dam and two smaller ones were constructed on
the Speed River near Guelph, Ontario. All dams were constructed as a way to limit downstream flow
following the spring melt and to provide more constant river flow throughout the year (Grand River
Conservation Authority 1980). Discharge from the dams is carefully regulated by the GRCA in
anticipation of flow regimes to prevent flooding. As a result, the depth of the reservoirs varies
dramatically throughout the year (Grand River Conservation Authority 1980). Since their inception,
the reservoirs have become popular recreational sites as well (Grand River Conservation Authority
1980).
All three reservoirs were reported as being eutrophic and having hypolimnetic oxygen
depletion problems by 1980 (Grand River Conservation Authority 1980). Their warm, stratified,
calm waters are ideal conditions for excess algal growth (Grand River Conservation Authority 1980).
A massive cyanobacterial bloom on Belwood Lake in the late summer of 2004 alarmed the public
and water quality managers and created the impetus for this study.
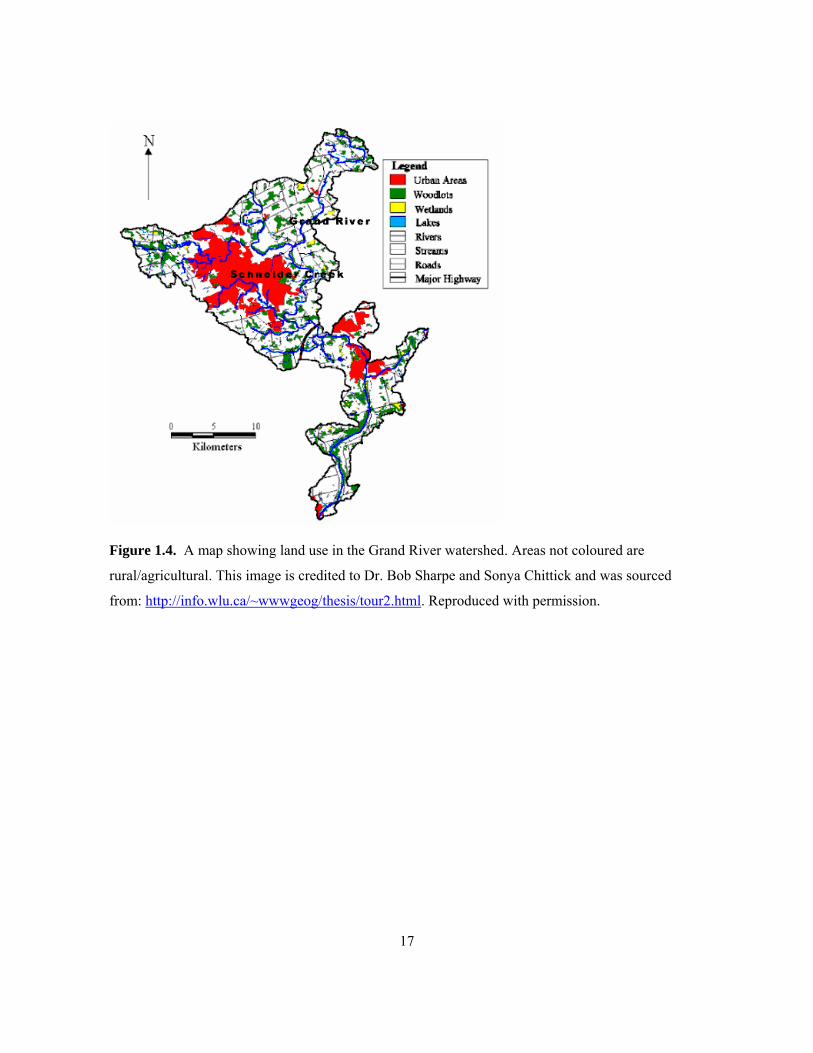
17
Figure 1.4. A map showing land use in the Grand River watershed. Areas not coloured are
rural/agricultural. This image is credited to Dr. Bob Sharpe and Sonya Chittick and was sourced
from: http://info.wlu.ca/~wwwgeog/thesis/tour2.html. Reproduced with permission.

18
Figure 1.5. The Grand River watershed with Conestogo, Belwood, and Guelph lakes circled from
left to right. Image courtesty of GRCA: http://library.mcmaster.ca/maps/images/GRCAMap.gif.
1.6 Hypotheses
Following the review of the literature outlined above, several hypotheses were formed and were
tested in this study. Those hypotheses are as follows:
1) If nutrient status affects microcystin concentrations and favourable growth conditions result in
more microcystin production, then indicators of greater nutrient deficiency will be negatively
associated with microcystin levels.
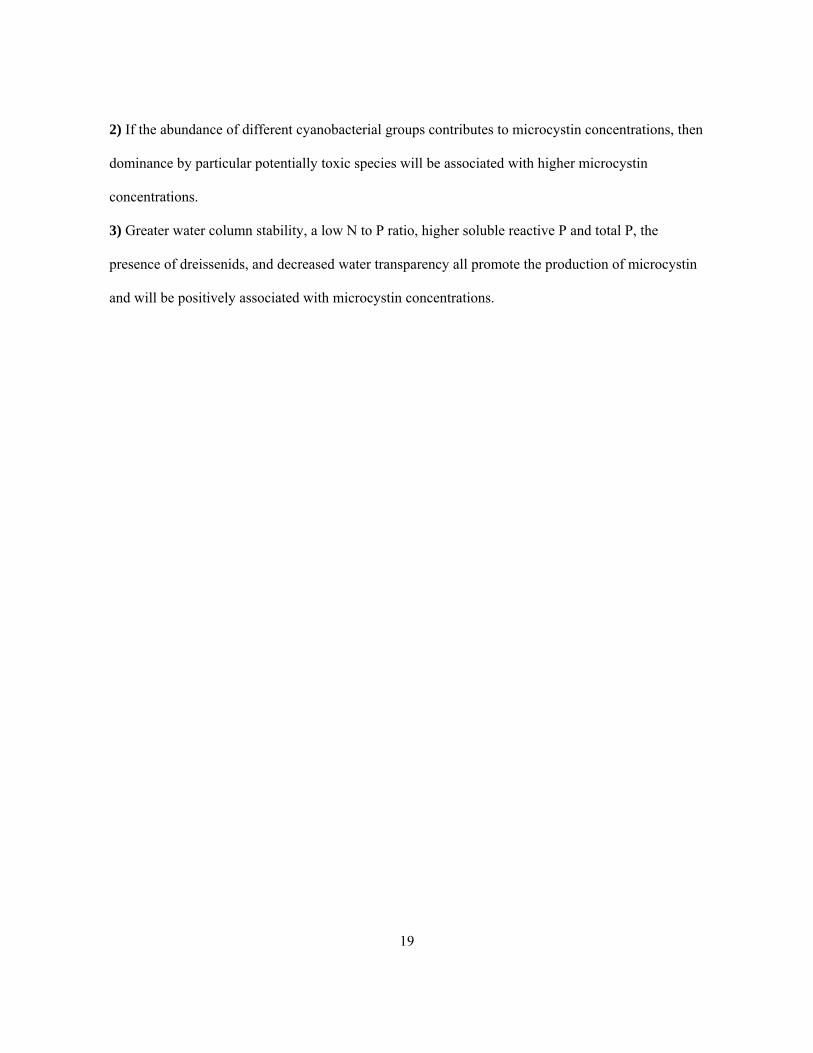
19
2) If the abundance of different cyanobacterial groups contributes to microcystin concentrations, then
dominance by particular potentially toxic species will be associated with higher microcystin
concentrations.
3) Greater water column stability, a low N to P ratio, higher soluble reactive P and total P, the
presence of dreissenids, and decreased water transparency all promote the production of microcystin
and will be positively associated with microcystin concentrations.

20
Chapter 2 Microcystin Detection
2.1 Introduction to Methods for Microcystin Detection
Over the past decades, microcystin detection methods have evolved to currently offer several
effective alternatives. Early microcystin detection used the mouse bioassay in which mortality was
the main indication of toxicity. Three more accurate and humane methods have now replaced the
mouse bioassay. These techniques are liquid chromatography followed by mass spectrometry, the
enzyme-linked immunosorbant assay (ELISA), and the protein phosphatase inhibition assay (PPIA)
(Table 2.1). This study employed PPIA for microcystin detection.
Table 2.1. Comparison of liquid chromatography, ELISA, and PPIA methods (Mountfort et al. 2005,
Bouaicha et al. 2002, Rapala et al. 2002, Neissan and van der Greef 1992, Kemeny and Challacombe
1988).
Liquid Chromatography
ELISA PPIA
Typical Detection Limit
0.160-0.175 µg/L with regular kit, 0.05 µg.L with high sensitivity kit
Often 0.1 µg/L, 0.05 µg/L in this study
Type of Sample Used Concentrated water or filter extract with clean-up step
Filtered or whole water, filter extract
Filtered or whole water, filter extract
Preconcentration of Samples?
Yes, typically with C18 columns
Unnecessary Unnecessary
Characteristic of Toxin Detected
Molecular structure as compared to multiple standards, molecular mass also if followed by mass spectrometry
Molecular structure only Toxicity to enzyme
Major Equipment Required
HPLC System and potentially a mass spectrometer
Microplate spectrophotometer
Microplate fluorometer, incubator
Cost per Sample ~$125 if sent away, undetermined if performed in lab
$9 when duplicates performed only
<$2 when quadriplicates performed

21
2.1.1 Liquid Chromatography
Liquid chromatography (LC) is regarded as the most analytical and precise detection method.
Generally, this type of analysis involves injecting a sample into a liquid mobile phase of organic
solvents which is forced through a column packed with a stationary phase such as modified silica gel
(Niessan and van der Greef 1992). Compounds in the mobile phase are sorbed to the stationary phase
and are ‘sorted’ as they are eluted from the column. They are detected, represented on a
chromatograph, and compared to various standards of microcystin variants (Niessan and van der
Greef 1992). High performance liquid chromatography (HPLC) is a well-known variant of liquid
chromatography that employs high pressure to force the mobile phase through the column (Niessan
and van der Greef 1992). Following their passage through the columns, compounds may be analyzed
by mass spectrometry. In microcystin analysis, this allows for the quantification of each structural
variant and confirms their identities. The mass spectrometer detects the molecular weight and
structure of compounds and measures their abundance relative to others in a sample (Niessan and van
der Greef 1992).
Liquid chromatography and mass spectrometry require expensive equipment and extensive
training that are inaccessible in many labs. Although samples may be sent away for analysis, this
would also be costly for the testing of many samples. Liquid chromatography also requires the time-
consuming concentration and cleanup of water samples prior to their analysis on C18 solid phase
extraction cartridges or by ultrafiltration (Heresztyn and Nicholson 2001). C18 cartridges contain
silica with chains of 18 carbon atoms that bind dissolved compounds from the water. Potentially
interfering impurities may be washed out of the column (‘sample clean-up’) and then toxin can be
eluted from the column with the use of an appropriate solvent, thereby concentrating it. Not only is
this step time consuming, but it requires a larger volume of sample water (~ 1 L) than the protein

22
phosphatase inhibition assay. The above drawbacks reduce the utility of this well-established
technique for screening of a large number of samples in most labs.
2.1.2 Enzyme-Linked Immunosorbent Assay
The commercially-available ELISA kits for cyanobacterial toxin detection employ competitive
capture of microcystin (Carmichael and An 1999). This means that ‘capture’ antibodies are fixed to
the wells of a microplate and microcystins in a sample must compete for the limited number of
binding sites with enzyme-bound microcystin that is supplied as an assay reagent. After a period of
time the wells are washed to remove unbound microcystin. Next, a colorimetric substrate is added
which binds to the enzyme attached to the microcystins that were not present in the sample. Colour
generation is then measured so that greater activity indicates lower levels of microcystin in the
sample. A downfall of ELISA is that microcystins are bound based on their shape so, due to
structural differences, some microcystin variants are more readily detected than others. Variants that
are more readily bound may not necessarily be the most toxic or prevelant variants in the sample, so
this can be problematic when the toxic effect of microcystin is of interest. ELISA kits are extremely
user-friendly, however this feature is reflected in the cost of this method (the 2007 quote for one 96-
well plate for cyanobacterial toxin detection from Envirologix was $396 USD).
2.1.3. Protein Phosphatase Inhibition Assay
PPIA is most distinct from LC and ELISA in that it is a functional assay. Microcystin is quantified
not by its physical properties but by the way it actually affects the biological activity of organisms in
nature. Microcystin’s main mode of toxicity is through the inhibition of protein phosphatases (PP) 1
and 2A, which are important regulatory enzymes in all eukaryotes (MacKintosh, et al 1990).
Microcystin present in a microplate sample well will irreversibly bind to the catalytic subunits of
extracted PP1 and 2A (Carmichael and An 1999) thus inhibiting them. Enzyme activity is measured

23
by the fluorescence, colour generation, or radioactivity that occurs when the enzyme cleaves
phosphate from a substrate, and more microcystin present is indicated by lower levels of phosphate
cleavage. The strength of the PPIA method for ecological studies lies in the fact that the enzymatic
effect measured is the one actually experienced by aquatic organisms. Data generated are estimates
of microcystin-LR equivalents present, as microcystin-LR (the microcystin variant with leucine and
arginine) is the standard most commonly used.
The cost of PPIA is much less than that of LC or ELISA. Although a fluorometer capable of
reading microplates at the appropriate wavelengths is required, this is a multipurpose piece of
equipment that can easily be shared between labs and projects. Once this investment has been made,
the materials required for one assay performed in a 96-well plate are relatively modest in cost. This
assay is an appropriate choice for projects which require the screening of many samples and research
questions which are mainly interested in ecological effects rather than toxin variant quantification.
Budget-conscious labs will also find this method appealing, however substantial time may be needed
to establish the assay at the forefront of a project. Familiarity with molecular and biochemical
techniques will likely be required during troubleshooting and this may not be readily available in an
ecology lab.
The use of PPIA for microcystin detection has evolved and improved over the years due to
optimization of the assay. The earliest versions of PPIA were radiometric (Jones and Orr 1994, Lam
et al. 1995, Lambert et al. 1994, Sim and Mudge 1993). However, the increased ease and safety of
using a colorimetric substrate, rather than a radiolabelled one, gave rise to the use of the PP1 enzyme
and p-nitrophenol phosphate as a colorigenic substrate (ex.: An and Carmichael 1994). Mountfort et
al. (1999) then made a useful comparison between the colorigenic substrate p-nitrophenol phosphate
and the fluorogenic substrate methylumbelliferyl phosphate (MUP) in PPIA for the detection of
okadaic acid, a dinoflagellate toxin, and found that the fluorometric form of the assay was more

24
accurate. Although the colorometric version of the assay is still used today, this finding incited
interest in the fluorometric version. Fontal et al. (1999) further investigated fluorogenic substrates
and found that, with the substrate 6,8-difluoro-4-methylumbelliferyl phosphate (DiFMUP), use of the
PP2A enzyme resulted in less noise and, therefore, greater sensitivity than did use of the PP1
enzyme.
Furthermore, Honkenen et al. (1990) described that PP2A was much more sensitive (50
times) to microcystin than was PP1 so it could be used to detect smaller quantities of toxin. As a
result, the use of PP2A is now much more prevalent in the literature than is the use of PP1. Bouaicha
et al. (2002) built on these results by comparing the use of DiFMUP and MUP substrates with the
PP2A enzyme and found lower variation in test results using the MUP substrate than the DiFMUP
substrate. The above improvements to PPIA led our research group to choose the fluorometric assay
using the PP2A enzyme and the MUP substrate for our analyses.
Both Heresztyn and Nicholson (2001) and Bouaicha et al. (2002) demonstrated another key
improvement to the PPIA method: the ability to use unconcentrated water samples directly in the
assay. Many other formulations of the assay used concentrated samples of microcystin, such as toxin
extracted from algal or invertebrate tissue. However, if water with low levels of dissolved toxin is
going to be tested, the sample would have to be concentrated by running a significant volume (ex.: 1
L) through a C18 solid phase extraction cartridge. With these concentrated samples a relatively small
sample volume can be used. For example, Fontal et al. (1999) used 10 µL of microcystin-LR
standard in a total well volume of 200 µL. This setup would not be appropriate when unconcentrated
lake water, which presumably has a lower total amount of toxin per well, is tested. Heresztyn and
Nicholson (2001) used untreated water samples in their assays, however they focused on their ability
to use water that has not been cleaned by C18 or other means. They kept the typical small amount of
sample found in other assay formulations (20 µL sample: 240 µL total volume) and, therefore, had a

25
lower detection limit of 0.2 µg/L microcystin. In order to use unconcentrated water samples and to
have a more sensitive assay, Bouaicha et al. (2002) used more concentrated solutions of buffer and
substrate so that 200 µL of sample could be present in a well with 300 µL total volume. This
innovation allows filtered lake water and sonicated whole lake water to be tested directly with a
documented method detection limit of 0.1 µg/L. Because of this improvement, the method outlined
in Bouaicha et al. (2002) was employed to test samples for this study.
2.2 Assay Troubleshooting and Optimization
The establishment of the PPIA method in our lab was not as smooth as was hoped and required
lengthy trouble-shooting. The results from Bouaicha et al. (2002) that we were attempting to imitate
may be seen in Figure 2.1. The fluorescence activity is measured as a percentage of the positive
control which contains no microcystin. When the assay was first attempted, results were typically as
seen in Figure 2.2, which are obviously contrasted with those of Figure 2.1. As one can see, in
Bouaicha et al. (2002)’s work, at a level of 1 µg/L (1000 pg/mL) the fluorescence activity was
approximately 0% of its level when 0 µg/L microcystin was present. Therefore, effectively all
enzyme was inactivated at the 1 µg/L microcystin level. However, as may be seen in Figure 2.2, the
percent of fluorescence activity for the same 0-1 µg/L microcystin range decreased from 126.5% to
only 83.9%, indicating that very little inactivation of the enzyme was occurring. It was evident that
some component of the assay was malfunctioning and so extensive trouble-shooting was undertaken
to uncover the culprit.

26
Figure 2.1. “Dose-response inhibitory activity of microcystin-LR on PP2A using colorimetric (p-
NPP) and fluorogemic (MUP and DiFMUP) substrates. Each value represents the mean of three
experiments +/- the standard deviation.” Bouaicha et al., 2002. Copyright Elsevier, reproduced with
permission.
0
20
40
60
80
100
120
140
0 0.2 0.4 0.6 0.8 1 1.2Microcystin-LR (ug/L)
Act
ivity
(% o
f Con
trol
)
Figure 2.2. An example of results from an early assay attempt using the Upstate 1 enzyme (see Table
2.2). The variation in replicates for each microcystin standard is shown. The amount of microcystin
present in the well has a nearly insignificant impact on fluorescence.
27
2.2.1 Microcystin
It was suspected that a lack of toxic potency of the microcystin-LR standards may have been causing
the lack of noticeable difference between standards. Standard solutions used in our assays were
initially prepared from powdered microcystin that had been dissolved in sterile Milli-Q water. The
highly concentrated microcystin stock was aliquoted to polypropylene microcentrifuge tubes and
frozen. When it was discovered that microcystin can sorb to polypropylene pipette tips (Hyenstrand
et al. 2001), concern arose that microcystin loss to the microcentrifuge tubes could be reducing the
amount of toxin delivered to the assay. A new Ridel-de Haёn Oekanal® microcystin-LR standard
was purchased from Sigma-Aldrich at a concentration of 10 µg/mL in methanol. As dissolving a
powder was now unnecessary, a step which may have introduced error into the process was
eliminated and the microcystin in methanol was deemed simpler to work with. A comparison of the
microcystin-LR in methanol and the powdered microcystin-LR and their effects on PP2A inhibition
can be seen in Figure 2.3. Although there is slightly more inhibition of the enzyme by the new
microcystin than the old one, the inhibition did not reach the desired levels, so another assay
component was still the problem.

28
0
20
40
60
80
100
120
0 0.2 0.4 0.6 0.8 1 1.2
[Microcystin-LR] (ug/L)
% o
f Con
trol's
Flu
ores
cenc
eNew MCYST Old MCYST
Figure 2.3. May 31, 2006 comparison of ‘New’ Ridel-de Haen microcystin-LR standard supplied
dissolved in methanol and ‘Old’ microcystin-LR standard supplied as a powder. 1x Promega 1 PP2A
(Table 2.2) was used to test inhibition caused by the toxin.
2.2.2 PP2A Inactivity
The first recognized issue with PP2A was the matrix in which it was supplied to us. The first enzyme
received was supplied by Upstate (a subsidiary of Millipore) and was that which was used by
Bouaicha et al. (2002). This was provided in 10% glycerol solution. This glycerol concentration
resulted in the enzyme solution being solid when frozen and the repeated thaw-freeze cycles required
to use a fraction of the enzyme at a time were thought to have possibly caused enzyme inactivation. It
was believed that the enzyme problem would be solved when PP2A was purchased from Promega
which was supplied in 50% glycerol solution and was a viscous liquid at -20oC. This enzyme initially
worked and showed vastly greater activity than the Upstate PP2A that we had been using (Figure
2.4). However, promptly after its first use the Promega enzyme also apparently became inactivated.

29
-10000
0
10000
20000
30000
40000
50000
0 0.02 0.04 0.06 0.08 0.1 0.12
PP2A (Units/mL)
Arb
itrar
y Fl
uore
scen
ce U
nits
New Promega 1 PP2A Old Upstate 2 PP2A
Figure 2.4. Comparison of newly purchased Promega 1 PP2A and older, relatively inactive Upstate 2
PP2A (Table 2.2) performed on May 29, 2006.
The actual problem, which was later identified by Dr. Kirsten Muller, was inappropriate
storage of the PP2A enzyme. Although the enzyme was housed in a -20oC freezer as per package
instructions, the freezer was frost-free and so underwent cycles of thawing during which the
temperature was raised sufficiently to inactivate the enzyme. After this realization, the enzyme was
stored in a freezer with constant -20oC temperature within a lab-top cooler that maintained the
enzyme at -20oC when it was removed from the freezer for brief use. The main assay problem had
been solved.
2.2.3 Enzyme Supply
Enzyme supply interruptions caused further complications even after the enzyme storage issues were
resolved. We were unable to immediately re-order Promega PP2A when it was needed as the

30
company was having supply problems and forecasted a year-long delay. Although we had yet to be
successful with the Upstate enzyme, it was the only other North American supplier and so it had to
be resorted to. Upon receipt of the new enzyme it was aliquoted into small portions in separate
microcentrifuge tubes so that each volume would only have to be thawed twice. Once the assay was
working well with the Upstate enzyme, Upstate’s supply was interrupted for one year. This problem
was disconcerting due to the possibility that supply interruptions could converge and PP2A would
not be available commercially in North America. PP2A can be isolated from animal tissues by
researchers (Heresztyn and Nicholson 2001), however this is not desirable or feasible in our lab. Both
Upstate and Promega PP2A are isolated from human red blood cells and the reasons for supplier
delay are unknown. To date, seven batches of enzyme have been received from these two companies
(Table 2.2). When switching to a new batch of enzyme, initial optimization of the assay is required to
account for varying levels of enzyme activity.
Table 2.2. PP2A enzyme batches received from Upstate and Promega suppliers over the course of
the study.
Enzyme Batch Approximate Date Received
Upstate 1 July 2005 Upstate 2 April 3, 2006
Promega 1 May 29, 2006 Upstate 3 September 1, 2006
Promega 2 October 2006 Upstate 4 February 2007
Promega 3 July 12, 2007
2.2.4 PP2A Level Optimization
Both Upstate and Promega state the number of enzyme units supplied per µL, where 10 units of
enzyme are approximately equivalent to 5 µg of protein, and where 1 unit of PP2A should liberate 1

31
nmol of phosphate from p-NPP per minute at 30oC. However, the enzyme’s actual activity did not
always match its reported activity. Bouaicha et al. (2002)’s PP2A level in the enzyme solution used
in the assay was 200 mU/mL and this study is referred to as ‘1x PP2A’. After difficulty in
duplicating the curve in Bouaicha et al. (2002), different enzyme concentrations were tried. For
simplicity, these concentrations were called 0.18x, 3x, etc. with reference to the level used in
Bouaicha et al. (2002) and assuming the enzyme concentration stated for that batch was valid. An
example of one such enzyme level trial is represented in Figure 2.5. It can be seen that, with 3x PP2A
0.5 µg/L and 1 µg/L microcystin can be differentiated between, however 0-0.1 µg/L cannot. It
appeared that autofluorescence of the additional enzyme masked subtle differences between these
low standards. On the contrary, the 1x PP2A showed better sensitivity to differences between lower
microcystin concentration but cannot reliably distinguish between 0.5 and 1 µg/L. Heresztyn and
Nicholson (2001) noted that assay sensitivity increases as enzyme concentration decreases, but also
that precision can be compromised by enzyme concentrations that are too low. Carmichael and An
(1999) noted the plasticity of the PPIA standard curve in that the linear section of the curve used for
quantification may be shifted by changing the amount of protein phosphatase enzyme.

32
0.00
20.00
40.00
60.00
80.00
100.00
120.00
0 ug/L 0.01 ug/L 0.05 ug/L 0.1 ug/L 0.25 ug/L 0.5 ug/L 1 ug/L
Microcystin-LR Standard
% o
f Con
trol
's F
luor
oesc
ence
1x PP2A2x PP2A3x PP2A
Figure 2.5. September 5, 2006 comparison of three enzyme concentrations using the Upstate 3
enzyme batch (Table 2.2).
The standard curves that I produced were more like the curve shown in Heresztyn and
Nicholson (2001) (Figure 2.6) than that in Bouaicha et al. (2002) (Figure 2.1). The linear portion of
Heresztyn and Nicholson (2001)’s curve occurs between 80% and 20% of control, which makes the
method detection limit 0.2 µg/L microcystin. Many of the samples in this study contained less than
0.2 µg/L microcystin, so this detection limit would not have yielded sufficiently low results. The
solution to this problem was to reduce the concentration of enzyme in order to shift the linear portion
of the curve to the left thereby detecting the differences between lower microcystin concentrations. In
order to achieve sufficient resolution for samples containing 0.05 µg/L, so little enzyme had to be
used that there was not enough to tease apart higher samples, a complication which can be seen in
Figure 2.7A. However, good resolution of samples between 0.05 and 0.1 µg/L was obtained through

33
interpolation (Figure 2.7B). This led us to develop multiple standard curves with different enzyme
concentrations in order to maximize resolution along different areas of the standard curve. The curve
used for sample concentrations between 0.1 and 0.25 µg/L microcystin is illustrated in Figure 2.8.
Although earlier in sample testing some curves with higher enzyme concentrations were used for
samples with more than 0.25 µg/L, concern over enzyme supply encouraged more frugal use.
Samples with higher microcystin levels were then diluted to within 0.1-0.25 µg/L. Any samples that
tested near 0.1 µg/L were tested on both curves to ensure a valid reading. Samples that approached
0.25 µg/L were diluted in case they were actually over this limit. This precaution proved to be
necessary based on multiple testings of each sample.
Figure 2.6. “Inhibition curve for microcystin-LR standards analysed in four replicates in high-purity
water with error bars representing standard deviation.” Heresztyn and Nicholson (2001). Copyright
Elsevier, reproduced with permission.

34
0
20
40
60
80
100
120
0 0.2 0.4 0.6 0.8 1 1.2
Microcystin-LR (ug/L)
Fluo
ro. a
s %
of C
ontro
l A
y = -685.59x + 107.86R2 = 0.9988
0
10
20
30
40
50
60
70
80
0 0.02 0.04 0.06 0.08 0.1 0.12
Microcystin-LR (ug/L)
Fluo
ro. a
s %
of C
ontr
ol
B
Figure 2.7. A standard curve used to isolate ‘low’ samples between 0.05 and 0.1 µg/L microcystin
performed on July 12, 2007. Upstate 4 enzyme (Table 2.2) was used at a concentration of 0.18x.
Graph ‘A’ shows all of the standards and that the greatest resolution occurred between the desired
0.05 and 0.1 µg/L. Standards lower and higher than those, respectively, could not be differentiated
from each other. Graph ‘B’ shows the interpolation between 0.05 and 0.1 that was used for
quantification of samples.

35
0
20
40
60
80
100
120
0 0.2 0.4 0.6 0.8 1 1.2Microcystin-LR (ug/L)
Fluo
ro. A
s %
of C
ontro
lA
y = -301.91x + 105.3R2 = 0.9984
0
20
40
60
80
100
0 0.05 0.1 0.15 0.2 0.25 0.3
Microcystin-LR (ug/L)
Fluo
ro. A
s %
of C
ontro
l B
Figure 2.8. An example of a standard curve from March 30, 2007 that employed Upstate 4 enzyme
(Table 2.2) at a concentration of 0.4x. This curve was used to test samples between the 0.1 and 0.25
µg/L range. Graph ‘A’ shows all of the standards and the obvious magnification of the 0.1-0.25 area
of the curve. Graph ‘B’ shows the result of interpolation between those points that was used for
sample quantification.
2.3 Method Validation with Microcystis Cultures
Table 2.3 lists the results of PPIA testing of Microcystis aeruginosa UTCC 299 cultures grown under
different P conditions. This testing was undertaken to confirm that the method was valid and could
detect expected differences in toxin concentrations between cultures. All cultures were grown under
the same light conditions and in either P-limited or P-replete BG-11 media (Rippka et al. 1979). As

36
can be seen in Table 2.3, cultures grown in P-replete media had the highest microcystin
concentrations. Dilutions were required on all samples with over 0.25 µg/L microcystin. These
dilutions performed over multiple assays produced consistent results and validated the use of this
technique. For example, when the replicates of P-limited total microcystin samples were diluted,
read, and multiplied up, similar results were of 3.86 µg/L and 4.04 µg/L were obtained (Table 2.3)
Table 2.3. Results of testing of Microcystis cultures maintained by Cindy Wang under different P
conditions. Non-microcystin results used with permission. ‘Lim.’ = limited, ‘Rep.’= replete, ‘Diss.’=
dissolved, and ‘Mcyst’= microcystin.
Code A B C D P-Lim. 1 P-Lim. 2 P-Rep. 1 P-Rep. 2
Date 18-May-07
18-May-07 18-May-07 18-May-07
28-Jun-07
28-Jun-07 28-Jun-07 28-Jun-07
Days into Growth 25 25 65 65 49 49 Light (uE/m/s) 50 50 50 50 50 50 50 50 P (umol/L) 2 (Lim.) 2 (Lim.) 172 (Rep.) 172 (Rep.) 2 (Lim.) 2 (Lim.) 172 (Rep.) 172 (Rep.) Chl a (µg/L) 60.43 60.43 204.46 1455.86 1.43 1.43 2384.98 2384.98 Part P (umol/L) 1.97 1.97 0.56 0.56 PAM Yield 0.17 0.17 0.32 0.32 Total Mcyst (µg/L) 150.89 172.94 168.80 410.58 3.86 4.04 777.59 709.20 N (Total) 4 4 4 3 4 4 4 4 Total Mcyst/Chl a 2.50 2.86 0.83 0.28 2.70 2.83 0.33 0.30 Diss. Mcyst (µg/L) 3.71 2.26 12.69 145.48 0.85 300.53
N (Dissolved) 4 4 4 4 3 4 Diss./ Chl a 0.06 0.04 0.06 0.10 0.59 0.13 % Diss. 2.46 1.31 7.52 35.43 21.91 38.65
2.4 Final PPIA Formulation
2.4.1 Preparation of Buffers, Enzyme, and Substrate Solutions
The buffer and substrate concentrations used in our assay are exactly as detailed in Bouaicha et al.
(2002) and can be found in Table 2.4 It is important to add the dithiothreitol (DTT) to the buffer
shortly preceding each assay as the half-life of DTT with EDTA at room temperature is only 4 hours.
A PP2A aliquot was transported on ice from the -20oC freezer to the assay benchtop, added to the 1X

37
buffer with BSA, and immediately used in the assay to prevent as much enzyme inactivation due to
warm temperatures as possible. Both the powdered and dissolved forms of the MUP substrate were
protected from light as per product insert instructions.
Table 2.4. Details of preparation of assay solutions described in Bouaicha et al. (2002).
Assay Component Constituents Others Details 5x reaction buffer 200 mM Tris-HCl
170 mM MgCl2 20 mM EDTA 20 mM DTT in Milli-Q water
-pH raised to 8.3 -autoclaved then stored at room temperature -DTT preweighed in sterile tubes for quick addition of buffer immediately before use
1x buffer Dilution of 5x buffer in sterile Milli-Q water 40 mM Tris-HCl 34 mM MgCl2 4 mM EDTA 4 mM DTT
Enzyme solution -1x buffer supplemented with 0.5 mg/mL BSA and kept on ice -PP2A added to chilled buffer and used immediately
-10 mg/mL BSA was prepared in Milli-Q water, filter sterilized through a 0.2 µm syringe filter, and frozen in aliquots for assay use
MUP solution -prepared in 1x buffer to concentration of 720 µM
-MUP was preweighed in sterile tubes for quick addition of buffer immediately before use -MUP was protected from light
2.4.2 Preparation of Microcystin-LR Standards
The microcystin-LR standard in methanol (10 µg/mL) was provided in a glass vial with a rubber top
and so a Hamilton Microliter™ glass syringe inserted in the top to extract standard which was then
diluted for use in the assay. Typically 0.1 µL was extracted with the syringe and diluted to 10 mL
with sterile Milli-Q water in a glass volumetric flask. Standards used in the assay were prepared in
autoclaved glass cuvettes. These standards were 1.00 µg/L, 0.50 µg/L, 0.25 µg/L, 0.10 µg/L, 0.05

38
µg/L, 0.01 µg/L, and 0.00 µg/L. Before delivering microcystin solution with a pipette tip, the
solution was aspirated, ejected, and discarded three times as recommended in Hyenstrand et al.
(2001a). This theoretically saturates all microcystin sorption sites on the polypropylene to ensure that
the microcystin solution, when delivered, contains the intended amount of toxin (Hyenstrand et al.
2001). After use, the Hamilton syringe was rinsed 3 times with methanol and stored disassembled to
allow the methanol to evaporate.
2.4.3 Assay Step Sequence
During all steps of the assay and reagent preparation pipette tips were pre-coated to ensure that the
volume dispensed was as accurate as possible. The microcystin standards were prepared first, then
the 5x and 1x buffers were mixed in centrifuge tubes. The assays were performed in new black 96-
well microplates. If enough samples were being run to warrant the use of multiple plates, standards
were only placed on one of the plates. Each standard or sample was given four replicate wells. The
first component added to the wells was 200 µL of standard or sample, which were delivered with a
single-channel pipette. The positive control consisted of the 0 µg/L microcystin standard and the
negative control contained 225 µL of Milli-Q water, no enzyme solution, but regular volumes of
buffer and substrate solution. A volume of 50 µL of 5x buffer was added to each well with a multi-
channel pipette through the use of a disposable reagent well. Care was taken to not touch the pipette
tips to the solution or sample already in the wells.
BSA solution was then added to the 1x buffer which was placed on ice. If Upstate PP2A was
being used, an enzyme aliquot in a microcentrifuge tube was transported on ice to the benchtop. Then
1x buffer was pipetted into the microcentrifuge tube, the tube was shaken, and the buffer was
returned to its tube three times to dissolve the enzyme in the buffer. If Promega PP2A was being
used, a quantity was pipetted from the enzyme tube to 1x buffer on ice. A volume of 25 µL of
enzyme solution was then promptly delivered to each well by submerging the tips of a multi-channel

39
pipette into the liquid already in the wells. This was necessary as the enzyme solution was very
viscous and clung to the tips otherwise. The plates being used were then covered with single-use
plate sealers and placed in an incubator warmed to 37oC for 5 minutes.
While the plates incubated, the MUP substrate was dissolved in 1x buffer and poured into a
reagent reservoir. After the incubation period, 25 µL of substrate solution was promptly add to each
well via multi-channel pipette and the wells were rapidly mixed 3-5 times by pipetting. The plate
covers were reapplied and reinforced with tape to prevent evaporation during the subsequent 60
minute incubation at 37oC. After 60 minutes the plates were transported to the lab of Dr. Neils Bols
for reading on a SPECTRAmax GEMINI XS Dual Scanning Microplate Spectrofluorometer. The
plates were mixed on the fluorometer for 2 seconds and then read on automatic cutoff mode at
excitation and emission levels of 360 nm and 460 nm, respectively, after Bouaicha et al. (2002).
2.5 Data Handling
Four replicate wells were typically performed for each standard and sample. Any wells that had
substantially different results were excluded from data analysis due to a probable error in pipetting.
The fluorescence of a negative control, which contained buffer and enzyme only, was subtracted
from all standards and samples. This negative control was chosen over a seemingly more logical
choice of buffer and substrate only since PP2A appeared to quench some fluorescence and the
control with just buffer and substrate often had a higher fluorescence than some of the standards. All
standards and samples were then calculated as a percentage of the fluorescence of the positive
control, the 0 µg/L standard. The linear portion of the standard curve was interpolated to yield the
equation of the line. The percent fluorescence of each sample was then plugged into the equation and
solved for the microcystin-LR equivalent concentration. Any microcystin results that were below the
lower standard or above the higher standard used for the line were discarded but were used to guide

40
future testing of that sample. Corroborating data from at least two separate assays, which used
different sets of standards, were required for each sample.
2.6 Problems and Cautionary Notes
The main problem in the application of this assay has been a lack of consistency in microcystin
results for the same sample between assay runs. Each assay uses freshly prepared standards, buffers,
enzyme solution, and substrate solution, but variation in the latter three components should be
corrected for through the use of the negative and positive controls. It then appears that differences in
the microcystin standards could be causing unacceptable variability in the results. Other than human
error in reading the meniscus of the Hamilton syringe and volumetric flask used during standard
preparation, it is unclear why these differences are occurring. Repeated freezing and thawing of
samples as they are continually tested has been raised as a potential issue. However, if this were
problematic, one would think that a common pattern in assay result variability, such as consistently
decreasing or increasing values would occur, which is not the case.
The way in which this variability was dealt with was performing many assays on the same
samples until two or three assays showed consistent results. This provided us with confidence that
those results were a true reflection of the toxin content of the sample and not an artifact of a single
assay. With all of the meticulous care that was taken in the execution of this assay it is conceivable
that the problem of inconsistent readings could plague other research groups. It is, therefore,
advisable that studies using PPIA publish the results of more than one assay run.

41
Chapter 3 Bay of Quinte and Maumee Bay
3.1 Introduction
3.1.1 Microcystin Background
Microcystin-producing cyanobacterial blooms have recently become a concern in parts of the Great
Lakes, mainly due to their effects on humans and aquatic organisms. Toxic blooms are particularly
worrisome when they lyse and intracellular microcystin is released. Additional information on
microcystin may be found in Chapter 1 of this thesis.
Field studies have shown associations between microcystin and total P, soluble reactive P,
total N, the N to P ratio, chlorophyll a, light, and dissolved O2 (Billam et al. 2006, Kardinaal and
Visser 2005). The literature shows much variability in these relationships, however (Kardinaal and
Visser 2005). It appears that toxigenic strains generally produce the most microcystin under their
optimal growth conditions, which typically include elevated nutrient concentrations (Kardinaal and
Visser 2005, Sivonen and Jones 1999). However, the exact environmental variables found to best
explain microcystin concentrations appear to be strain-specific (Orr and Jones 1998). It also appears
that the majority of natural microcystin variability can be explained not by environmental conditions
but by the relative abundance of the toxic strains present (Giani et al. 2005, Ozawa et al. 2005). The
seasonal succession of cyanobacterial species and strains is most likely very important to microcystin
concentrations (Billam et al. 2006, Codd et al. 2005).
3.1.2 Dreissenids in the Great Lakes
Decades of reduction in point-source P inputs to the Great Lakes have successfully lowered P levels
to those that would not be expected to promote cyanobacterial blooms (Nicholls and Hopkins 1993),

42
yet they are occurring (ex.: Nicholls 2002). The introduction of invasive Dreissena spp. mussels may
be partly responsible for this by promoting certain cyanobacteria. For instance, Microcystis colonies
are sometimes so large that dreissenids cannot consume them (Vanderploeg et al. 2001) and thus
Microcystis is able to grow while other phytoplankton are grazed down. Secondly, dreissenids may
be able to differentiate between toxic and non-toxic Microcystis and selectively reject toxic cells as
pseudofeces (Raikow et al. 2004). Thirdly, research has shown that dreissenids may indirectly
promote Microcystis by altering the ratio of available N:P (Arnott and Vanni 1996, Bykova et al.
2006).
3.1.3 Study Sites
The Bay of Quinte (Figure 1.3) and Maumee Bay (Figure 1.1) have been sites in the Great Lakes of
recent toxic cyanobacterial blooms (Bridgeman 2005, Conroy et al. 2005). Maumee Bay, which
comprises the westernmost part of Lake Erie’s Western Basin, and the Bay of Quinte on Lake
Ontario are both relatively shallow eutrophic bodies of water (Table 1.2). Both receive nutrient
inputs from agricultural lands and have had surrounding wetlands drained (Minns et al. 1986, U.S.
Army Engineer District, Buffalo 1983). The high turbidity introduced into the bay by the Maumee
River has been attributed with the presence of Microcystis blooms (Bridgeman 2005). The Bay of
Quinte also exhibits elevated turbidity as its ecosystem was pushed from a clearwater state to a turbid
one (Minns 1995). Microcystis-promoting dreissenids are present in both Maumee Bay and the Bay
of Quinte (Nicholls et al. 2002, Sedmak and Kosi 2002). Problems with algal blooms in the Bay of
Quinte date back to the 1930’s (Minns 1995) and the presence of microcystin has been documented
in both western Lake Erie (Rinta-Kanto et al. 2005) and the Bay of Quinte (Ontario Ministry of the
Environment, personal communication).

43
3.1.4 Hypotheses
Microcystin concentrations and various biological, chemical, and physical parameters were
investigated in the Bay of Quinte and Maumee Bay to better understand microcystin dynamics in
those bodies of water. The hypotheses formed prior to the undertaking of this study are as follows:
1) If nutrient status affects microcystin concentrations and favourable growth conditions result in
more microcystin production, then indicators of greater nutrient deficiency will be negatively
associated with microcystin levels.
2) If the abundance of different cyanobacterial groups contributes to microcystin concentrations, then
dominance by particular potentially toxic species will be associated with higher microcystin
concentrations.
3) Greater water column stability, a low N to P ratio, higher soluble reactive P and total P, and
decreased water transparency will all promote the production of microcystin and will be positively
associated with microcystin concentrations.
3.2 Methods
3.2.1 Study Sites
Six stations in the Bay of Quinte, Lake Ontario were surveyed on July 4-5, 2006 and on Sept. 22,
2006. The area sampled, near Deseronto, Ontario, is circled in Figure 1.3 and information about each
station may be found in Table 1.2. Three shallow stations (maximum depth 2.4 m) and three deeper
stations (4.8 m to 6.4 m) were surveyed. The GPS coordinates of these stations can be found in
Appendix A. Six stations were fully surveyed in Maumee Bay from Toledo, Ohio, USA on June 20,
2006 and Aug. 22, 2006 (Figure 1.2 and 3.1). A seventh station, ‘Crib’ was partially surveyed for

44
interest as it was a water intake site. Four of these stations were shallow (1.3-3.8m) and three were
relatively deep (5.5-6m). The GPS coordinates of these stations can be found in Appendix B.
Station Legend
7M
8M
Clear
Crib
MB15
MB18
MB19
Figure 3.1. A map of western Lake Erie showing the seven stations sampled within Maumee Bay.
In 2005, the Bay of Quinte was sampled by lab associates Kim Rattan and Greg Silsbe on
June 28, August 3, August 30, and October 4. Sampling took place near Napanee/Deseronto (where
all of the 2006 stations were located), in Hay Bay, and in Big Bay. The latter two locations are
smaller bays within the Bay of Quinte. Only results of microcystin testing will be discussed here.
3.2.2 Sampling Procedure
At each station secchi depth (an inverse measurement of water transparency: the depth at
which a disk can no longer be seen from the surface) was measured and water was taken for further
processing from 2, 1, or 0.5 metres depending on the station depth (see Appendix A). A Fluoroprobe
was also deployed for an in situ measurement of total chlorophyll and the characteristic pigments of
chlorophytes, cyanophytes, diatoms, and cryptophytes via fluorescence. Upon promptly returning to
the lab, water was filtered with 0.7 µm glass microfibre filters (GF/F) for most analyses or with

45
polycarbonate filters for certain other analyses. Whole water for TN, TP, and PPIA analyses was
prescreened unless phytoplankton colonies were visibly being excluded from the sample, in which
case screening was not performed. Phytoplankton samples were preserved with Lugol’s iodine
solution. All unpreserved water and filters were frozen until analysis with the exception of the PAM
filters. These were read immediately using a Walz DIVING-PAM. Variable fluorescence was
measured on phytoplankton concentrated on a filter to provide a minimum fluorescence reading (Fo)
of 100 relative fluorescence units that had been dark adapated for 30 minutes. Variable fluorescence
is Fv/Fm where Fm is maximum fluorescence and Fv=Fm-Fo (Genty et al. 1989). The maximum
relative electron transport rate (ETRmax) was determined on each filter by measuring the variable
fluorescence of the initially dark adapted filter at increasing light intensities. The ETR is a product of
Fv/Fm and the flux of light energy absorbed by the light harvesting complex of photosystem II.
Because of difficulties in quantifying the amount of energy absorbed by phytoplankton on a filter a
relative ETR is often calculated instead, as the product of incident irradiance and Fv/Fm (Schulze
and Caldwell 1994, Falkowski and Raven 1997).
3.2.3 Nutrient and Chlorophyll Analyses
All analyses were performed using standard operating procedures compiled by Dr. Yuri Kozlov
which were based on Stainton et al. (1977) and Standard Methods for the Examination of Water and
Wastewater (American Public Health Association 1992), and other references mentioned below.
Total dissolved P (TDP), total P (TP), and particulate P (Part P) were measured by potassium
persulfate digestion followed by the ascorbic acid method. TDP samples had been filtered through a
0.2 µm polycarbonate filter while Part P was measured on a 0.7 µm GF/F filter. SRP was also
measured using the ascorbic acid method on GF/F filtrate. Particulate C and N was determined on
pre-combusted GF/F filters that were packed into metal capsules and read in an Exeter CEC-440
Elemental Analyzer by David Depew after Grasshoff et al. (1983). Total N samples were digested by

46
alkaline oxidation, passed through cadmium reduction columns, and read on a spectrophotometer
following colour generation. NH3 samples were first run through a 0.2 µm polycarbonate filter and
were measured with the OPA (orthophtaldialdehyde) method outlined in Holmes et al. (1999).
Filtered samples were measured for nitrate and nitrite on an Ion Chromatograph Dionex ICS 2500.
For the measurement of soluble reactive silica, unfiltered samples were acidified, colour was
generated from the addition of molybdate and stannous chloride, and samples were read on a
spectrophotometer. Particulate silica was collected on a polycarbonate filter, digested with sodium
hydroxide, neutralized, and read as soluble reactive silica. Chlorophyll was protected from light,
extracted cold from GF/F filters with acetone, and read in a Turner fluorometer.
3.2.4 Microcystin Analysis
Whole water was analyzed for total microcystin and GF/F filtrate was analyzed for dissolved
microcystin. The protein phosphatase inhibition assay (PPIA) outlined in Bouaicha et al. (2002) was
employed for toxin analysis except for the enzyme concentration used. For samples with 0.05-0.1
µg/L microcystin 22 mUnits of enzyme was used and for samples with 0.1-0.25 µg/L microcystin
48mUnits of enzyme was used. Samples with greater than 0.25 µg/L microcystin were diluted until
they fit within these ranges. Assays were read in a SPECTRAmax GEMINI XS Dual Scanning
Microplate Spectrofluorometer. In order to be confident in the microcystin data obtained from the
newly established PPIA, samples were retested until multiple assay runs yielded consistent results.
This applied to all samples except those from Maumee Bay in June 2006 as all of these were below
the detection limit of 0.05 µg/L.
3.2.5 Data Analysis
Systat Version 9 (SPSS, 1998) was used to generate graphs and perform statistical analyses. One-
way ANOVA was used with Bonferroni post-hoc tests to look for significant differences among

47
major variables between stations and dates within a water body. All Bay of Quinte variables were
normally distributed except for Part. P, TP, NH3, TN, TN:TP, percent dissolved microcystin,
particulate microcystin per chlorophyll, and ETRmax which were all log-transformed before
statistical analyses. All Maumee Bay variables were normally distributed except for TDP, extracted
chlorophyll a, SRP, C:P, NH3, NO3, NO2, and Part. N which were also log-transformed prior to
analysis.
3.3 Results
3.3.1 Bay of Quinte Results
The full ANOVA results for all variables can be found in Table 3.1.
Table 3.1. All Bay of Quinte ANOVA results. Significant differences and strong trends are
highlighted.
Bay of Quinte ANOVA Results Variable Analyzed Difference Tested df F P
Secchi July vs. Sept. 11 50.380 <0.001 Secchi July Deep vs. Shallow 5 2.024 0.228 Secchi Sept. Deep vs. Shallow 5 1.000 0.374 SRP July vs. Sept. 10 7.431 <0.05 SRP July Deep vs. Shallow 5 5.600 0.077 SRP Sept. Deep vs. Shallow 4 2.976 0.183 TDP July vs. Sept. 10 199.654 <0.001 TDP July Deep vs. Shallow 4 7.350 0.073 TDP Sept. Deep vs. Shallow 5 0.942 0.387 log(Part P) July vs. Sept. 9 21.668 <0.01 log(Part P) July Deep vs. Shallow 4 0.018 0.903 log(Part P) Sept. Deep vs. Shallow 4 0.559 0.509 log(TP) July vs. Sept. 10 0.512 0.492 log(TP) July Deep vs. Shallow 4 0.102 0.771 log(TP) Sept. Deep vs. Shallow 5 0.000 0.99 SRSi July vs. Sept. 10 5.822 <0.05 SRSi July Deep vs. Shallow 4 0.188 0.694 SRSi Sept. Deep vs. Shallow 5 0.077 0.795 Part Si July vs. Sept. 11 0.010 0.921 Part Si July Deep vs. Shallow 5 3.173 0.149 Part Si Sept. Deep vs. Shallow 5 4.729 0.095 log(NH3) July vs. Sept. 11 0.085 0.777

48
log(NH3) July Deep vs. Shallow 5 2.601 0.182 log(NH3) Sept. Deep vs. Shallow 5 1.492 0.289 NO2 July vs. Sept. 11 0.703 0.421 NO2 July Deep vs. Shallow 5 1.800 0.251 NO2 Sept. Deep vs. Shallow 5 10.000 <0.05 NO3 July vs. Sept. 11 1.000 0.341 NO3 July Deep vs. Shallow 5 1.072 0.359 NO3 Sept. Deep vs. Shallow 5 1.000 0.374 TN July vs. Sept. 11 8.232 <0.05 TN July Deep vs. Shallow 5 1.696 0.263 TN Sept. Deep vs. Shallow 5 0.048 0.838 log(TN:TP) July vs. Sept. 10 2.633 0.139 log(TN:TP) July Deep vs. Shallow 4 0.309 0.617 log(TN:TP) Sept. Deep vs. Shallow 5 0.034 0.863 Extracted Chl a July vs. Sept. 11 18.194 <0.01 Extracted Chl a July Deep vs. Shallow 5 10.928 <0.05 Extracted Chl a Sept. Deep vs. Shallow 5 0.927 0.39 Part N July vs. Sept. 11 66.334 <0.001 Part N July Deep vs. Shallow 5 3.894 0.12 Part N Sept. Deep vs. Shallow 5 0.029 0.874 CN July vs. Sept. 11 4.660 0.056 CN July Deep vs. Shallow 5 0.047 0.839 CN Sept. Deep vs. Shallow 5 10.562 <0.05 CP July vs. Sept. 8 5.703 <0.05 CP July Deep vs. Shallow 3 0.398 0.593 CP Sept. Deep vs. Shallow 4 1.250 0.345 Diss. Microcystin July vs. Sept. 11 45.225 <0.001 Diss. Microcystin July Deep vs. Shallow 5 0.227 0.659 Diss. Microcystin Sept. Deep vs. Shallow 5 3.253 0.146 Total Microcystin July vs. Sept. 11 29.432 <0.001 Total Microcystin July Deep vs. Shallow 5 0.198 0.679 Total Microcystin Sept. Deep vs. Shallow 5 0.065 0.812 log(% Diss. Mcyst.) July vs. Sept. 11 45.896 <0.001 log(% Diss. Mcyst.) July Deep vs. Shallow 5 0.750 0.435 log(% Diss. Mcyst.) Sept. Deep vs. Shallow 5 1.757 0.256 log(Part Mcyst./ Chl) July vs. Sept. 11 49.439 <0.001 log(Part Mcyst./ Chl) July Deep vs. Shallow 5 1.094 0.355 log(Part Mcyst./ Chl) Sept. Deep vs. Shallow 5 1.169 0.341 Fv/Fm July vs. Sept. 9 4.962 0.057 Fv/Fm July Deep vs. Shallow 4 0.292 0.626 Fv/Fm Sept. Deep vs. Shallow 4 0.041 0.852 log(ETRmax) July vs. Sept. 8 8.023 <0.05 log(ETRmax) July Deep vs. Shallow 4 1.238 0.347 log(ETRmax) Sept. Deep vs. Shallow 3 0.734 0.482

49
3.3.1.1 Secchi Depth, Extracted Chlorophyll, Phosphorus, and Nitrogen
Water transparency, as measured by Secchi depth, decreased significantly (P<0.001) between July 4,
2006 (hereafter July) and September 22, 2006 (hereafter September) as the mean Secchi depth went
from 2.0m to 1.1m (Table 3.1, Figure 3.2). Secchi depth was not significantly different between
shallow and deep stations within a sampling period (Table 3.1) suggesting that phytoplankton
concentrations did not vary greatly with station depth. This is conditional on the assumption that
Secchi depth mainly represented phytoplankton biomass and not suspended sediments. Greater
phytoplankton biomass was detected in September than in July as is evidenced by significantly
higher extracted chlorophyll a concentrations (Figure 3.3, P<0.01) and significantly higher
particulate P (Figure 3.4, P<0.01) in September. In July, extracted chlorophyll a was found to be
significantly higher at shallow stations than deeper stations (Figure 3.5, P<0.05), but this was not
seen in September (P=0.39). The mean TP was found to be quite similar on both sampling dates
(Figure 3.6, P=0.492). SRP was low in July (mean: 3.7 µg/L) and significantly lower in September
(mean: 2.4 µg/L) (P<0.05, Figure 3.7). An even greater decrease between July and September was
observed in TDP as its mean was approximately halved over that time period (Figure 3.8), a change
that was very statistically significant (P<0.001). In July, both SRP (Figure 3.9) and TDP (Figure
3.10) showed strong trends being higher at deep stations than at shallow stations (SRP: P=0.77, TDP:
P=0.073). This was not the case in September (Table 3.1).

50
July SeptSampling Month
0.5
1.0
1.5
2.0
2.5Se
cchi
Dep
t h (m
)
Figure 3.2. Boxplot of Secchi depth at 6 Bay of Quinte stations sampled in 2006. Variation shown
within a sampling period is that between stations.
July SeptSampling Month
10
15
20
25
30
Ext
ract
ed C
hl a
Figure 3.3. Boxplot of extracted chlorophyll a at six Bay of Quinte stations in 2006. The extracted
chlorophyll values represent the means of duplicate extractions and readings.

51
July SeptSampling Month
0
10
20
30Pa
rticu
late
P (u
g /L)
Figure 3.4. Boxplot of particulate phosphorus measured at six stations in the Bay of Quinte in 2006.
Deep ShallowJuly Station Depth Category
12
13
14
15
16
17
Ext
ract
e d C
hlor
o phy
ll a
(ug/
L)
Figure 3.5. Boxplot of July 4, 2006 Bay of Quinte chlorophyll a levels at three deep and three
shallow stations.

52
July SeptSampling Month
20
30
40
50To
tal P
(ug/
L)
Figure 3.6. Boxplot of TP from six stations in the Bay of Quinte in 2006.
July SeptSampling Month
1
2
3
4
5
6
SRP
( ug/
L)
Figure 3.7. Boxplot of SRP concentration in the Bay of Quinte on July 4, 2006 and Sept. 22, 2006.

53
July SeptSampling Month
5
6
7
8
9
10
11
12
13To
tal D
isso
lved
P (u
g/L)
Figure 3.8. Boxplot of TDP from six Bay of Quinte stations in 2006.
Deep ShallowStation Depth Category
2
3
4
5
6
SR
P (u
g/L)
Figure 3.9. Boxplot of July 4, 2006 SRP concentrations at three deep and three shallow stations in
the Bay of Quinte.

54
Deep ShallowStation Depth Category
11.5
12.0
12.5
13.0TD
P (u
g/L)
Figure 3.10. Boxplot of July 4, 2006 TDP concentrations at three deep and three shallow stations in
the Bay of Quinte.
Ammonia concentrations between July and September showed no significant difference
(P=0.777) (Figure 3.11). The ammonia value for station NA in September is an outlier which may
have resulted from a contaminated sample and so was excluded from Figure 3.11. Nitrate
concentrations in July were much lower than ammonia values for all sites with the exception of DS
which was located near the Deseronto Shore. This much higher outlier may be the result of nitrate-
rich runoff from, for example, fertilizer application. In September, nitrate concentrations at all
stations were below the readable limit of 3.0 µg/L except for station MBO (Figure 3.12). As in July,
the nitrate levels were lower than the ammonia levels at 5 of 6 stations. On both sampling dates
ammonia concentrations were higher than were nitrate levels. July and September nitrate levels were
not significantly different from each other (P=0.341). Nitrite levels showed no overall difference
between July and September (Figure 3.13) but did show a significant difference between deep and
shallow stations in September only (Figure 3.14, P<0.05).

55
July SeptSampling Month
0
10
20
30N
H3
(ug /
L)
Figure 3.11. Boxplot of ammonia levels at six Bay of Quinte stations in 2006.
July SeptSampling Month
-5
5
15
25
NO
3 (u
g/L)
Figure 3.12. Boxplot of nitrate values for July 4, 2006 and Sept. 22, 2006 in the Bay of Quinte. The
line at 0 in September represents 5 of the 6 stations which were below the detection limit.
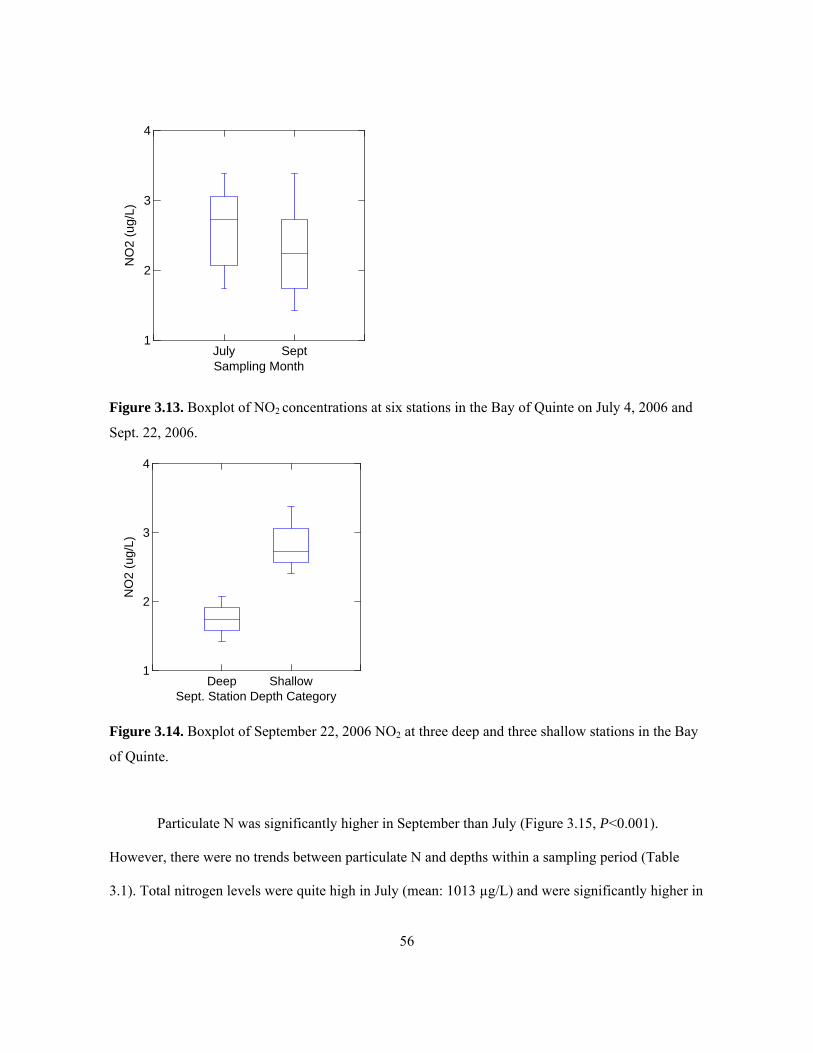
56
July SeptSampling Month
1
2
3
4N
O2
( ug/
L)
Figure 3.13. Boxplot of NO2 concentrations at six stations in the Bay of Quinte on July 4, 2006 and
Sept. 22, 2006.
Deep ShallowSept. Station Depth Category
1
2
3
4
NO
2 (u
g /L)
Figure 3.14. Boxplot of September 22, 2006 NO2 at three deep and three shallow stations in the Bay
of Quinte.
Particulate N was significantly higher in September than July (Figure 3.15, P<0.001).
However, there were no trends between particulate N and depths within a sampling period (Table
3.1). Total nitrogen levels were quite high in July (mean: 1013 µg/L) and were significantly higher in

57
September (mean: 1460 µg/L, P<0.05), as can be seen in Figure 3.16. An estimate of dissolved
organic N (DON) was obtained by subtracting particulate N, nitrate, nitrite, and ammonia from TN
(Figure 3.16), although it should be noted that the error of these five measurements is compounded in
the DON estimate. For all stations and sampling dates (except for DS July) the dissolved organic
nitrogen estimate makes up more than half of TN (Appendix A). The molar TN:TP ratios were
relatively high on both sampling trips (July mean: 79, September mean: 109) (Figure 3.17) but were
not significantly different between months (P=0.139). No relationship between station depth and
TN:TP was found (Table 3.1).
July SeptSampling Month
0
100
200
300
400
500
600
Part.
N (u
g/L)
Figure 3.15. Boxplot of particulate N levels in the Bay of Quinte at six stations on July 4, 2006 and
Sept. 22, 2006.

58
July SeptSampling Month
500
1000
1500
2000To
tal N
(ug/
L )
Figure 3.16. TN values for six stations in the Bay of Quinte in 2006 shown in a boxplot.
July SeptSampling Month
60
70
80
90
100
110
120
130
140
150
160
TN:T
P (m
olar
)
Figure 3.17. Boxplot of TN:TP (molar) from six Bay of Quinte stations in 2006.
3.3.1.2 Silica
Soluble reactive silica levels were significantly higher in July that September (P<0.05, Figure 3.18).
Particulate silica levels were not different between July and September (Figure 3.19), however a
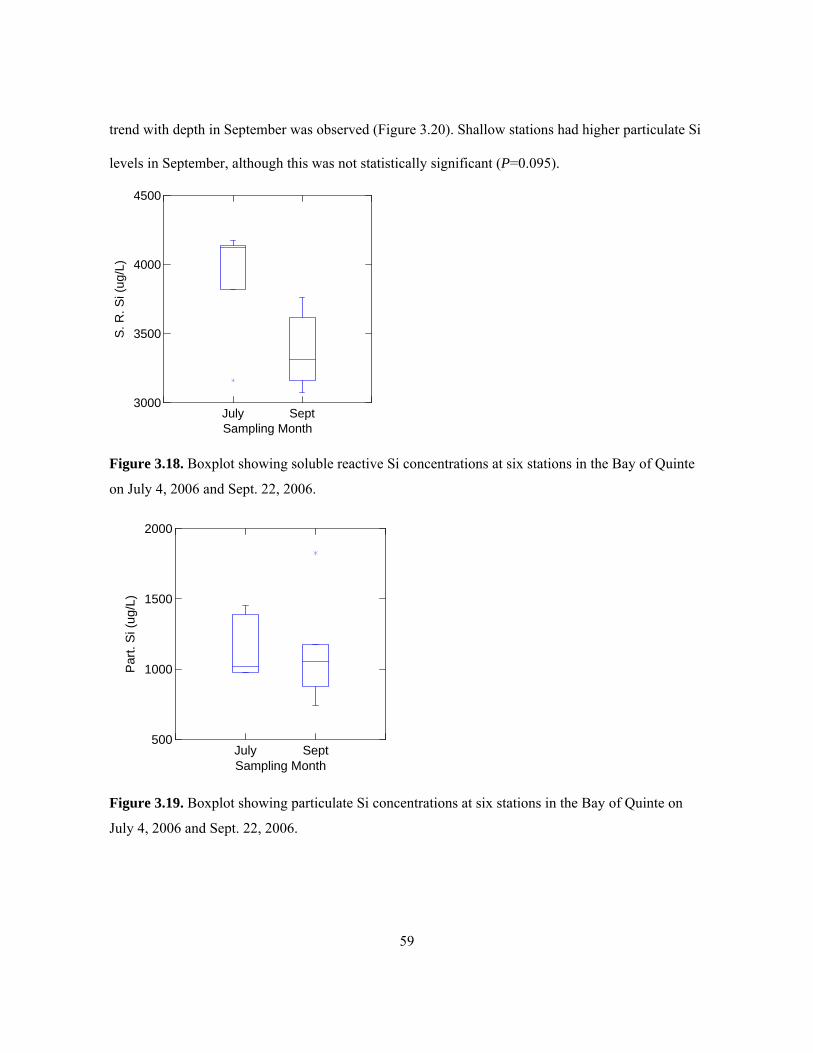
59
trend with depth in September was observed (Figure 3.20). Shallow stations had higher particulate Si
levels in September, although this was not statistically significant (P=0.095).
July SeptSampling Month
3000
3500
4000
4500
S. R
. Si (
ug/L
)
Figure 3.18. Boxplot showing soluble reactive Si concentrations at six stations in the Bay of Quinte
on July 4, 2006 and Sept. 22, 2006.
July SeptSampling Month
500
1000
1500
2000
Par
t. S
i (ug
/L)
Figure 3.19. Boxplot showing particulate Si concentrations at six stations in the Bay of Quinte on
July 4, 2006 and Sept. 22, 2006.

60
Deep ShallowSept. Station Depth Category
500
1000
1500
2000P
art.
Si (
ug/L
)
Figure 3.20. Boxplot showing particulate Si concentrations at three deep and three shallow stations
in the Bay of Quinte on Sept. 22, 2006.
3.3.1.3 Nutrient Status Indicators
The C:N molar ratios of particulate matter in July were relatively low (mean: 8.1) and did not
indicate N deficiency (Guildford et al. 1994). They were even lower in September (mean: 7.2)
(Figure 3.21). This difference was nearly statistically significant (P=0.056). No trend between depth
and C:N could be seen for July (P=0.839) but the ratios in September were significantly lower in the
offshore than the nearshore (P<0.05, Figure 3.22). In July, the C:P molar ratios had a mean of 230
and in September they were significantly higher (P<0.05) with a mean of 360 (Figure 3.23). Ratios
greater than 258 are indicative of severe P deficiency (Guildford et al. 1994). A trend with depth was
not observed (Table 3.1). PAM results showed significantly higher ETRmax values in July than in
September (P<0.05) which indicate greater photosynthetic capacity in July (Figure 3.24). The Green
Point site in July was an outlier and was excluded from Figure 3.24. Dark-adapted Fv/Fm was also
higher in July than in September and this difference was nearly statistically significant (P=0.057).

61
July SeptSampling Month
6
7
8
9
10C
:N (m
ola r
)
Figure 3.21. Boxplot of C:N molar ratios from six Bay of Quinte stations in 2006.
Deep ShallowSite Depth
6.5
7.0
7.5
8.0
C:N
( mol
ar)
Figure 3.22. Boxplot of C to N molar ratios from the Bay of Quinte on September 22, 2006. 3 deep
stations (depth range: 5.2- 6.4m) and 3 shallow stations (depth range: 1.2- 2.4m) are compared.

62
July SeptSampling Month
100
200
300
400
500C
:P (m
olar
)
Figure 3.23. Boxplot showing C to P molar ratios for six Bay of Quinte sites in 2006.
July SeptSampling Month
10
20
30
40
50
60
ETR
max
Figure 3.24. Boxplot of ETRmax measurements from the Bay of Quinte obtained via PAM
fluorometry in 2006. An outlier (station GPt in Sept.) has been excluded.
3.3.1.4 Fluoroprobe Phytoplankton Estimates
The fluoroprobe results (Figure 3.25) indicated that there were higher levels of both cyanobacterial
pigments and total chlorophyll a in September than in July at all stations regardless of depth (Figure

63
3.26). The fluoroprobe also showed that the percentage of total phytoplankton chlorophyll comprised
by cyanobacteria was slightly higher in September (mean: 90.6%) than in July (mean: 83.3%).
Figure 3.25. Below are profiles showing temperature, total chlorophyll, and cyanobacterial
distributions with depth as determined by the Fluoroprobe in the Bay of Quinte in 2006.
July 2006
FI July 2006
0
0.2
0.4
0.6
0.8
1
1.2
1.4
1.6
0 2 4 6 8 10
Pigments (ug/L)
Dep
th (m
)
0 5 10 15 20 25 30
Temperature (oC)
CyanosTotal ChlTemp.
GPt July 2006
0
1
2
3
4
5
6
0 2 4 6 8 10 12 14
Pigments (ug/L)
Dep
th (m
)
0 5 10 15 20 25 30
Temperature (oC)
TotalCyanosTemp.

64
NA July 2006
0
0.5
1
1.5
2
2.5
3
0 2 4 6 8 10 12
Pigments (ug/L)
Dep
th (u
g/L)
15 20 25 30Temperature (oC)
Total Chl.CyanosTemp.
NR July 2006
0
0.2
0.4
0.6
0.8
1
1.2
1.4
1.6
0 5 10 15
Pigments (ug/L)
Dep
th (m
)
15 17 19 21 23 25 27 29
Temperature (oC)
CyanosTotal ChlTemp.

65
September 2006
DS Sept. 2006
0
0.2
0.4
0.6
0.8
1
1.2
1.4
1.6
1.8
0 5 10 15
Pigments (ug/L)
Dep
th (m
)
15 16 17 18 19 20
Temperature (oC)
Total ChlCyanosTemp.
FI Sept. 2006
0
0.5
1
1.5
2
2.5
0 5 10 15 20 25
Pigments (ug/L)
Dep
th (m
)
15 16 17 18 19 20
Temperature (oC)
Total ChlCyanosTemp.
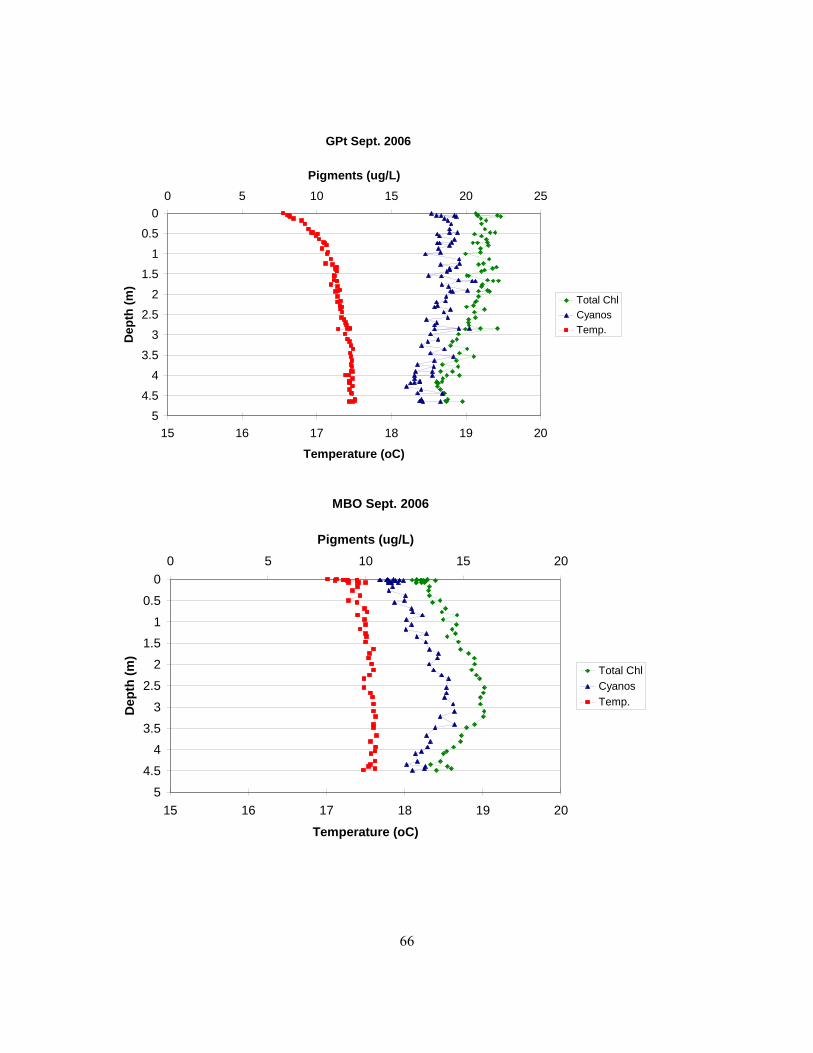
66
GPt Sept. 2006
00.5
11.5
22.5
3
3.54
4.55
0 5 10 15 20 25
Pigments (ug/L)
Dep
th (m
)
15 16 17 18 19 20
Temperature (oC)
Total ChlCyanosTemp.
MBO Sept. 2006
0
0.5
11.5
2
2.5
3
3.54
4.5
5
0 5 10 15 20
Pigments (ug/L)
Dep
th (m
)
15 16 17 18 19 20
Temperature (oC)
Total ChlCyanosTemp.

67
NA Sept. 2006
0
0.5
1
1.5
2
2.5
3
3.5
4
4.5
0 10 20 30 40
Pigments (ug/L)
Dep
th (m
)
15 16 17 18 19 20
Temperature (oC)
CyanosTotal ChlTemp.
NR Sept. 2006
0
0.1
0.2
0.3
0.4
0.5
0.6
0.7
0 5 10 15 20
Pigments (ug/L)
Dep
th (m
)
15 16 17 18 19 20
Temperature (oC)
Total ChlCyanosTemp.

68
July SeptSampling Month
0
5
10
15
20
25Fl
uoro
prob
e P
hyto
. Es t
imat
e (u
g/L)
TotalCyanos
Figure 3.26. Boxplot comparing fluoroprobe results for total chlorophyll and cyanobacterial
pigments from the Bay of Quinte, 2006. Each box represents six stations.
3.3.1.5 Phytoplankton Counts
The results of detailed counts to the species level on station NA (station depth: 5m) performed by
phytoplankton taxonomist Hedy Kling can be found in Tables 3.2 and 3.3. In July, the phytoplankton
was completely dominated by cyanobacteria as they made up 81% of the total phytoplankton
biomass. Of the cyanobacterial biomass, 96.7% was composed of the genus Microcystis (Table 3.2).
In September, cyanobacteria were responsible for even more of the total phytoplankton biomass
(94%) but Microcystis only made up 7.9% of the cyanobacterial biomass (Table 3.3). Instead, a
single species, Anabaena spiroides, made up 82.9% of the cyanobacterial biomass (Table 3.3). A
comparison of the counts with the fluoroprobe profiles for station NA showed a similar pattern. In
July the fluoroprobe estimate of cyanobacteria abundance as a percentage of total phytoplankton was
11.3% lower than the count estimate, and in September it was just 4.1% lower. Although counts were
performed on samples from only one station, there is no evidence that the cyanobacterial community

69
varied throughout the section of the bay that was surveyed. The results of the counts on station NA
station are assumed to apply to other stations since they were all in a small geographical area.
Table 3.2. Preserved phytoplankton count performed by Hedy Kling on a sample from station NA
from July 4, 2006.
Bay of Quinte – July 4, 2006 – Station NA – Sampling Depth: 1m Phytoplankton Group Biomass (mg/m^3) % Total Biomass Cells/L % of Total Cells
Cyanophyta 1614.5 81.2 54334370 95.4 Chlorophyta 43.6 2.2 837760 1.5 Euglenophyta 0 0 0 0 Chrysophyceae 15.5 0.8 1166682 2 Haptophyta 0.3 0 29838 0.1 Diatomeae 288.3 14.5 574000 1 Cryptophyceae 11.9 0.6 11000 0 Peridineae 15.1 0.8 4000 0 Xanthophyta 0 0 0 0
======== ======== ======== ======== ======== TOTAL 1989.4 56957650
Others Biomass (mg/m^3) Cells/L Protozoa 94.7 7000 Rotifers 436.4 2000 Heterocysts 0 10000 # Heterocysts as % of Total Cyanos: 0.018 # Heterocysts as % of Producers: 1.73
Taxon Biomass (mg/m^3) % Total Cyano
Biomass Cells/L Microcystis sp. 682.2 42.3 30294000 Microcystis novacekii 566.4 35.1 12775000 Microcystis wesenbergi 155.4 9.6 2120000 Microcystis novacekii 112.6 7.0 5000000 Microcystis sp 43.2 2.7 745950 Anabaena spiroides 37.4 2.3 510000 Anabaena lemmermannii Rich. 7.8 0.5 68000 Chroococcus minutus (Kutz) Naeg. 4.6 0.3 40000 Microcystis smithi 2.2 0.1 96000 Aphanocapsa minutissima 1.1 0.07 2148336 Pseudanabaena vornichinii 1 0.06 59676 Aphanotheca sp 0.6 0.04 477408 All Microcystis 1562 96.7
Descriptions of States of Selected Taxa

70
Species Description Microcystis sp. Mainly M. aeruginosa loose colonies Microcystis novacekii Bacteria and Pseudanabaena in mucilage Microcystis wesenbergi Tight colonies Microcystis novacekii Old tight colonies, wide mucilage w/ many bacteria, Pseudanabaena Microcystis sp Free cells Anabaena spiroides Some spirals Anabaena lemmermannii Rich. Broken colonies
Table 3.3. Phytoplankton count performed by Hedy Kling on a sample from station NA from
September 22, 2006. Note: Aphanocapsa holsatica specifically refers to Aphanocapsa holsatica
(Lemm) Cronb. & Kom. Data on heterocysts are not available.
Bay of Quinte – September 22, 2006 – Station NA – Sampling Depth: 2m Phytoplantkon Group Biomass (mg/m^3) % of Total Biomass Cells/L % of Total Cells/L
Cyanophytes 15396.5 94.0 368943822 97.6 Chlorophytes 49.0 0.3 394218 0.1 Euglenophytes 0 0 0 0 Chrysophytes 93.6 0.6 6954254 1.8 Haptophytes 0 0 0 0 Bacillariophytes 704.0 4.3 262352 0.1 Cryptophytes 110.7 0.7 1553576 0.4 Dinoflagellates 27.9 0.2 32838 0 Xanthophytes 0 0 0 0
======== ======== ======== ======== ======== TOTAL 16381.7 378141060
Others Biomass (mg/m^3) Cells/L Protozoa 133.7 45838 Mixotrophs 11.6 268542 Zooplankton 3455.7 2000 Heterocysts 0 589084 # Heterocysts as % of Total Cyanos: 0.16 # Heterocysts as % of Producers: 0.335
Taxon Biomass (mg/m^3) % Total Cyano.
Biomass Cells/L Anabaena spiroides 12758.2 82.9 174045054 Microcystis viridis 1054.6 6.8 16112520 Planktolyngbya limnetica 762.5 5.0 4953108 Anabaena crassa 223.1 1.4 604000 Anabaena planctonica 201.0 1.3 462704 Microcystis novacekii 87.8 0.6 2263000 micro bluegreens 65.0 0.4 124126080
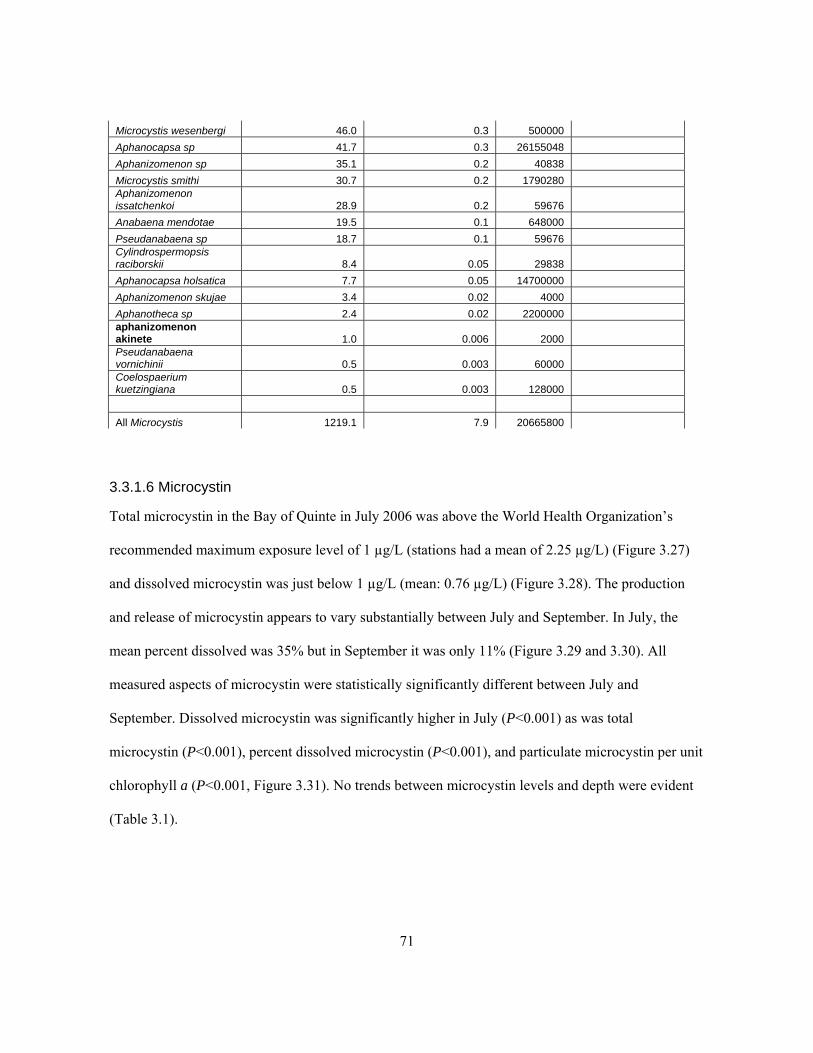
71
Microcystis wesenbergi 46.0 0.3 500000 Aphanocapsa sp 41.7 0.3 26155048 Aphanizomenon sp 35.1 0.2 40838 Microcystis smithi 30.7 0.2 1790280 Aphanizomenon issatchenkoi 28.9 0.2 59676 Anabaena mendotae 19.5 0.1 648000 Pseudanabaena sp 18.7 0.1 59676 Cylindrospermopsis raciborskii 8.4 0.05 29838 Aphanocapsa holsatica 7.7 0.05 14700000 Aphanizomenon skujae 3.4 0.02 4000 Aphanotheca sp 2.4 0.02 2200000 aphanizomenon akinete 1.0 0.006 2000 Pseudanabaena vornichinii 0.5 0.003 60000 Coelospaerium kuetzingiana 0.5 0.003 128000 All Microcystis 1219.1 7.9 20665800
3.3.1.6 Microcystin
Total microcystin in the Bay of Quinte in July 2006 was above the World Health Organization’s
recommended maximum exposure level of 1 µg/L (stations had a mean of 2.25 µg/L) (Figure 3.27)
and dissolved microcystin was just below 1 µg/L (mean: 0.76 µg/L) (Figure 3.28). The production
and release of microcystin appears to vary substantially between July and September. In July, the
mean percent dissolved was 35% but in September it was only 11% (Figure 3.29 and 3.30). All
measured aspects of microcystin were statistically significantly different between July and
September. Dissolved microcystin was significantly higher in July (P<0.001) as was total
microcystin (P<0.001), percent dissolved microcystin (P<0.001), and particulate microcystin per unit
chlorophyll a (P<0.001, Figure 3.31). No trends between microcystin levels and depth were evident
(Table 3.1).

72
July SeptSampling Month
0
1
2
3
4To
tal M
icro
cyst
in (u
g/L)
Figure 3.27. Box-plot showing total microcystin-LR equivalents (both intracellular and extracellular)
for all six stations in the Bay of Quinte in 2006.
July SeptSampling Month
0.0
0.5
1.0
1.5
Dis
solv
ed M
icro
cyst
in (u
g/L)
Figure 3.28. Box-plot showing dissolved microcystin-LR equivalents for six stations in the Bay of
Quinte, 2006.

73
July SeptSampling Month
0
10
20
30
40
50Pe
rc. D
iss.
Mic
rocy
stin
of T
otal
Figure 3.29. Boxplot showing the percentage of total microcystin comprised by dissolved toxin in
the Bay of Quinte in 2006.
0 1 2 3 4Total Microcystin (ug/L)
0
10
20
30
40
50
Per
c. D
isso
lved
Mic
rocy
stin
Sept,ShallowSept,DeepJuly,ShallowJuly,Deep
MONTH,NEAR_OF
Figure 3.30. Scatterplot showing the relationship between percent dissolved microcystin and total
microcystin. The deep vs. shallow and July vs. Sept. samples have been differentiated for
comparison.
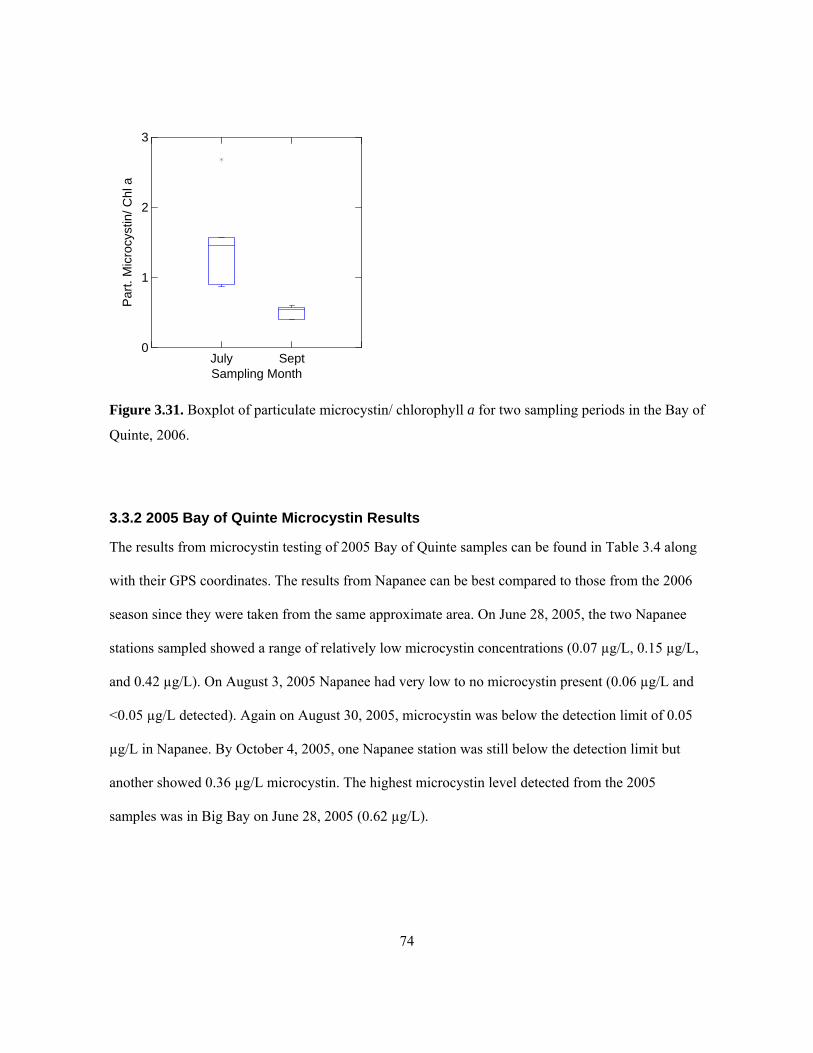
74
July SeptSampling Month
0
1
2
3P
art.
Mic
r ocy
stin
/ Chl
a
Figure 3.31. Boxplot of particulate microcystin/ chlorophyll a for two sampling periods in the Bay of
Quinte, 2006.
3.3.2 2005 Bay of Quinte Microcystin Results
The results from microcystin testing of 2005 Bay of Quinte samples can be found in Table 3.4 along
with their GPS coordinates. The results from Napanee can be best compared to those from the 2006
season since they were taken from the same approximate area. On June 28, 2005, the two Napanee
stations sampled showed a range of relatively low microcystin concentrations (0.07 µg/L, 0.15 µg/L,
and 0.42 µg/L). On August 3, 2005 Napanee had very low to no microcystin present (0.06 µg/L and
<0.05 µg/L detected). Again on August 30, 2005, microcystin was below the detection limit of 0.05
µg/L in Napanee. By October 4, 2005, one Napanee station was still below the detection limit but
another showed 0.36 µg/L microcystin. The highest microcystin level detected from the 2005
samples was in Big Bay on June 28, 2005 (0.62 µg/L).

75
Table 3.4. Bay of Quinte 2005 microcystin results. ‘# Runs’ refers to the number assays from which
results were averaged to yield the total microcystin number listed.
Date Location Samp. Depth (m) Sample Tot. Microcystin (ug/L) SD CV # Runs 28-Jun-05 Napanee 2 Q5099 0.07 0.01 0.21 2 28-Jun-05 Napanee 2 Q5100 0.15 0.03 0.22 2 28-Jun-05 Hay Bay 4.5 Q5101 0.13 0.03 0.19 2 28-Jun-05 Big Bay 2 Q5103 0.62 0.08 0.13 2 28-Jun-05 Napanee 2 Q5104 0.42 0.25 0.59 2 03-Aug-05 Big Bay 2 Q5272 0.06 0.00 0.01 1 03-Aug-05 Napanee 2 Q5273 0.06 0.01 0.09 1 03-Aug-05 Hay Bay 2 Q5274 0.09 0.00 0.03 1 03-Aug-05 Napanee 2 Q5277 BDL 1 30-Aug-05 Big Bay 2 Q5340 0.21 0.00 0.02 1 30-Aug-05 Napanee 2 Q5341 BDL 1 04-Oct-05 Napanee 2 Q5393 BDL 2 04-Oct-05 Napanee 2 Q5395 0.36 0.03 0.08 1
Longitude & Latitude (Decimal Degrees)
Station Long. Lat Napanee 77.03993 44.18035 Hay Bay 77.07205 44.0937 Big Bay 77.25072 44.15342
3.3.3 Maumee Bay 2006 Results
The full ANOVA results for Maumee Bay can be found in Table 3.5.
Table 3.5. All Maumee Bay ANOVA results. Significant differences and strong trends are
highlighted.
Maumee Bay ANOVA Results Variable Analyzed Difference Tested df F P
Secchi June vs. Aug. 13 8.248 <0.05 Secchi June Deep vs. Shallow 6 1.077 0.347 Secchi Aug. Deep vs. Shallow 6 0.017 0.9 log(SRP) June vs. Aug. 11 0.01 0.922 log(SRP) June Deep vs. Shallow 5 8.271 <0.05 log(SRP) Aug. Deep vs. Shallow 5 0 1 log(TDP) June vs. Aug. 12 1.677 0.222 log(TDP) June Deep vs. Shallow 6 7.276 <0.05 log(TDP) Aug. Deep vs. Shallow 5 1.016 0.371 Part P June vs. Aug. 12 4.361 0.061 Part P June Deep vs. Shallow 5 0.137 0.73

76
Part P Aug. Deep vs. Shallow 6 0.592 0.476 TP June vs. Aug. 13 5.209 <0.05 TP June Deep vs. Shallow 6 1.55 0.268 TP Aug. Deep vs. Shallow 6 0.155 0.71 log(NH3) Aug. Deep vs. Shallow 4 1.318 0.334 log(NO2) June vs. Aug. 11 8.304 <0.05 log(NO2) June Deep vs. Shallow 5 1.965 0.234 log(NO2) Aug. Deep vs. Shallow 5 7.899 <0.05 log(NO3) June vs. Aug. 11 11.656 <0.01 log(NO3) June Deep vs. Shallow 5 8.738 <0.05 log(NO3) Aug. Deep vs. Shallow 5 0.226 0.659 TN June vs. Aug. 11 0.867 0.374 TN June Deep vs. Shallow 4 4.28 0.13 TN Aug. Deep vs. Shallow 6 1.115 0.339 TN:TP June vs. Aug. 11 18.726 <0.05 TN:TP June Deep vs. Shallow 4 0.664 0.475 TN:TP Aug. Deep vs. Shallow 6 0.802 0.412 log(Ext. Chl a) June vs. Aug. 12 160.443 <0.0001 log(Ext. Chl a) June Deep vs. Shallow 5 1.231 0.329 log(Ext. Chl a) Aug. Deep vs. Shallow 6 2.846 0.152 log(Part N) June vs. Aug. 12 18.031 <0.005 log(Part N) June Deep vs. Shallow 5 0.059 0.821 log(Part N) Aug. Deep vs. Shallow 6 3.266 0.821 CN June vs. Aug. 12 3.025 0.11 CN June Deep vs. Shallow 5 0.549 0.5 CN Aug. Deep vs. Shallow 6 1.715 0.247 log(CP) June vs. Aug. 10 0.679 0.431 log(CP) June Deep vs. Shallow 3 27.136 <0.05 log(CP) Aug. Deep vs. Shallow 6 1.798 0.238 Diss. Microcystin June vs. Aug. 13 17.864 <0.05 Diss. Microcystin Aug. Deep vs. Shallow 6 1.148 0.333 Total Microcystin June vs. Aug. 13 28.942 <0.001 Total Microcystin Aug. Deep vs. Shallow 6 0.938 0.377 Part Mcyst./ Chl Aug. Deep vs. Shallow 6 0.048 0.835 Fv/Fm June vs. Aug. 9 0.704 0.426 Fv/Fm June Deep vs. Shallow 3 1.353 0.365 Fv/Fm Aug. Deep vs. Shallow 5 3.229 0.147 ETRmax June vs. Aug. 9 1.675 0.232 ETRmax June Deep vs. Shallow 3 0.979 0.427 ETRmax Aug. Deep vs. Shallow 5 4.372 0.105

77
3.3.3.1 Water Transparency, Chlorophyll, and Stratification
Water transparency decreased significantly between June (mean Secchi depth: 2.4m) and August
(mean Secchi depth: 1.4m) ( P<0.05) (Figure 3.32). In both June and August, MB19 (Appendix B)
had the shallowest Secchi depth and was quite similar on both sampling dates (0.55m and 0.6m,
respectively). For the other three shallow stations in June Secchi depth was down to the sediment
surface (Appendix B). The three deep stations had similar Secchi depths to those at shallower
stations in June (deep vs. shallow: P=0.347). Again in August, both shallow and deep stations had
similar Secchi depths (P=0.9) (Appendix B). Chlorophyll was extremely low in June (mean: 0.3
µg/L) but increased significantly by August ( P<0.001) (Figure 3.33). The shallow MB19 had the
highest level (0.9 µg/L) but otherwise deep and shallow stations had similar concentrations
(P=0.329). By August, chlorophyll concentrations had risen to a mean of 17.4 µg/L although a trend
with depth was not evident (P=0.152). In June, a stratified water column with a deep thermocline
was evident in the three fluoroprobe profiles taken (Figure 3.34). However, in August, the nearshore
station MB15 and offshore station Crib appear to be mixed to the bottom with a shallow layer of
warm surface water that may be due to diel heating rather than stratification. The offshore station,
Clear, also appears to be mixed to the bottom but with cooler surface water (Figure 3.34).

78
Aug.JuneSampling Month
0
1
2
3
4S
ecch
i (m
)
Figure 3.32. Boxplot of secchi depth from 7 stations in Maumee Bay on June 20, 2006 and Aug. 22,
2006.
Aug.JuneSampling Month
0
10
20
30
Ext
ract
ed C
h l (u
g/L)
Figure 3.33. Boxplot of extracted chlorophyll a from 7 stations in Maumee Bay on Aug. 22, 2006
and from all stations except Crib on June 20, 2006. The Aug. data is an average of 2 extractions and
analyses.

79
Figure 3.34. Below are the Maumee Bay 2006 Fluoroprobe profiles.
June 2006
7M June 2006
0.00
1.00
2.00
3.00
4.00
5.00
6.00
0 0.5 1 1.5 2 2.5 3
Pigments (ug/L)
Dep
th (m
)
21 21.5 22 22.5 23 23.5 24
Temp. (oC)
Total ChlCyanosTemp.
8M June 2006
0
1
2
3
4
5
6
0 0.2 0.4 0.6 0.8 1 1.2 1.4
Pigments (ug/L)
Dep
th (m
)
21 21.5 22 22.5 23 23.5 24Temp. (oC)
Total ChlCyanosTemp.

80
Crib June 2006
0
1
2
3
4
5
6
0 1 2 3 4 5
Pigments (ug/L)
Dep
th (m
)
21.5 22 22.5 23 23.5 24Temp. (oC)
Total ChlCyanosTemp.

81
August 2006
7M Aug. 2006
0
1
2
3
4
5
6
0 5 10 15 20
Pigments (ug/L)
Dep
th (m
)
24 25 26 27 28 29 30
Temp. (oC)
Total ChlCyanosTemp.
8M Aug. 2006
0
0.5
11.5
2
2.5
3
3.54
4.5
5
0 5 10 15 20 25
Pigments (ug/L)
Dep
th (m
)
22 23 24 25 26 27 28
Temp. (oC)
Total Chl.CyanosTemp.

82
Clear Aug. 2006
0
0.5
1
1.5
2
2.5
3
0 5 10 15 20
Pigments (ug/L)
Dep
th (m
)
21 22 23 24 25 26
Temp. (oC)
Total Chl.CyanosTemp. (oC)
MB15 Aug. 2006
0
0.2
0.4
0.6
0.8
1
1.2
1.4
1.6
0 10 20 30 40
Pigments (ug/L)
Dep
th (m
)
23 23.5 24 24.5 25
Temp. (oC)
CyanosTotal Chl.Temp.
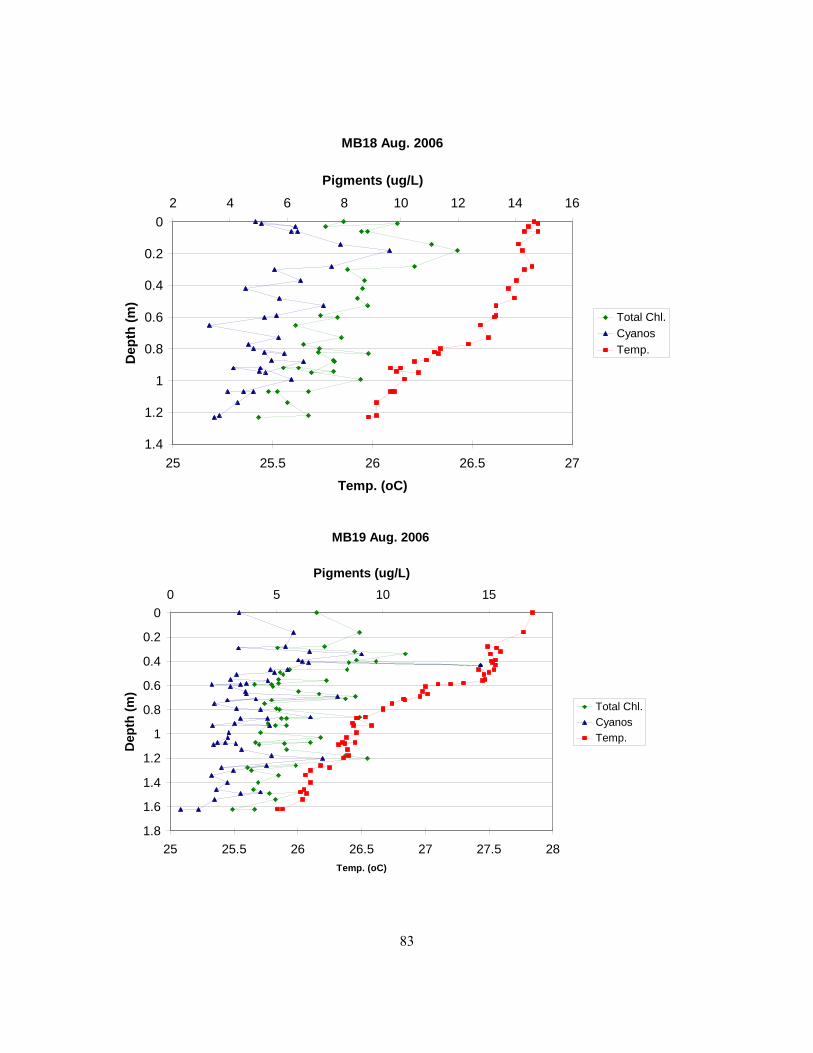
83
MB18 Aug. 2006
0
0.2
0.4
0.6
0.8
1
1.2
1.4
2 4 6 8 10 12 14 16
Pigments (ug/L)
Dep
th (m
)
25 25.5 26 26.5 27
Temp. (oC)
Total Chl.CyanosTemp.
MB19 Aug. 2006
0
0.2
0.4
0.6
0.8
1
1.2
1.4
1.6
1.8
0 5 10 15
Pigments (ug/L)
Dep
th (m
)
25 25.5 26 26.5 27 27.5 28Temp. (oC)
Total Chl.CyanosTemp.
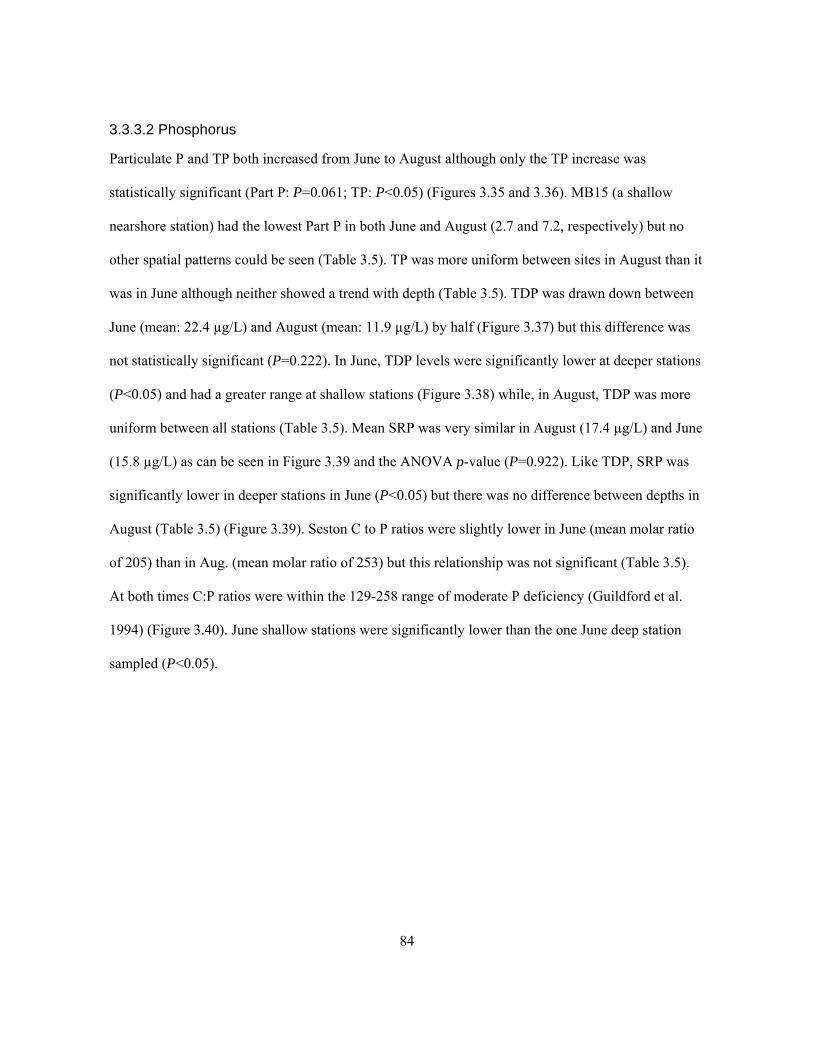
84
3.3.3.2 Phosphorus
Particulate P and TP both increased from June to August although only the TP increase was
statistically significant (Part P: P=0.061; TP: P<0.05) (Figures 3.35 and 3.36). MB15 (a shallow
nearshore station) had the lowest Part P in both June and August (2.7 and 7.2, respectively) but no
other spatial patterns could be seen (Table 3.5). TP was more uniform between sites in August than it
was in June although neither showed a trend with depth (Table 3.5). TDP was drawn down between
June (mean: 22.4 µg/L) and August (mean: 11.9 µg/L) by half (Figure 3.37) but this difference was
not statistically significant (P=0.222). In June, TDP levels were significantly lower at deeper stations
(P<0.05) and had a greater range at shallow stations (Figure 3.38) while, in August, TDP was more
uniform between all stations (Table 3.5). Mean SRP was very similar in August (17.4 µg/L) and June
(15.8 µg/L) as can be seen in Figure 3.39 and the ANOVA p-value (P=0.922). Like TDP, SRP was
significantly lower in deeper stations in June (P<0.05) but there was no difference between depths in
August (Table 3.5) (Figure 3.39). Seston C to P ratios were slightly lower in June (mean molar ratio
of 205) than in Aug. (mean molar ratio of 253) but this relationship was not significant (Table 3.5).
At both times C:P ratios were within the 129-258 range of moderate P deficiency (Guildford et al.
1994) (Figure 3.40). June shallow stations were significantly lower than the one June deep station
sampled (P<0.05).

85
Aug.JuneSampling Month
0
10
20
30
40Pa
rt. P
(ug/
L)
Figure 3.35. Boxplot of particulate P. No data from June for MB18 was available.
Aug.JuneSampling Month
10
20
30
40
50
TP (u
g/L)
Figure 3.36. Boxplot of total P from 7 stations in Maumee Bay on June 20, 2006 and Aug. 22, 2006.
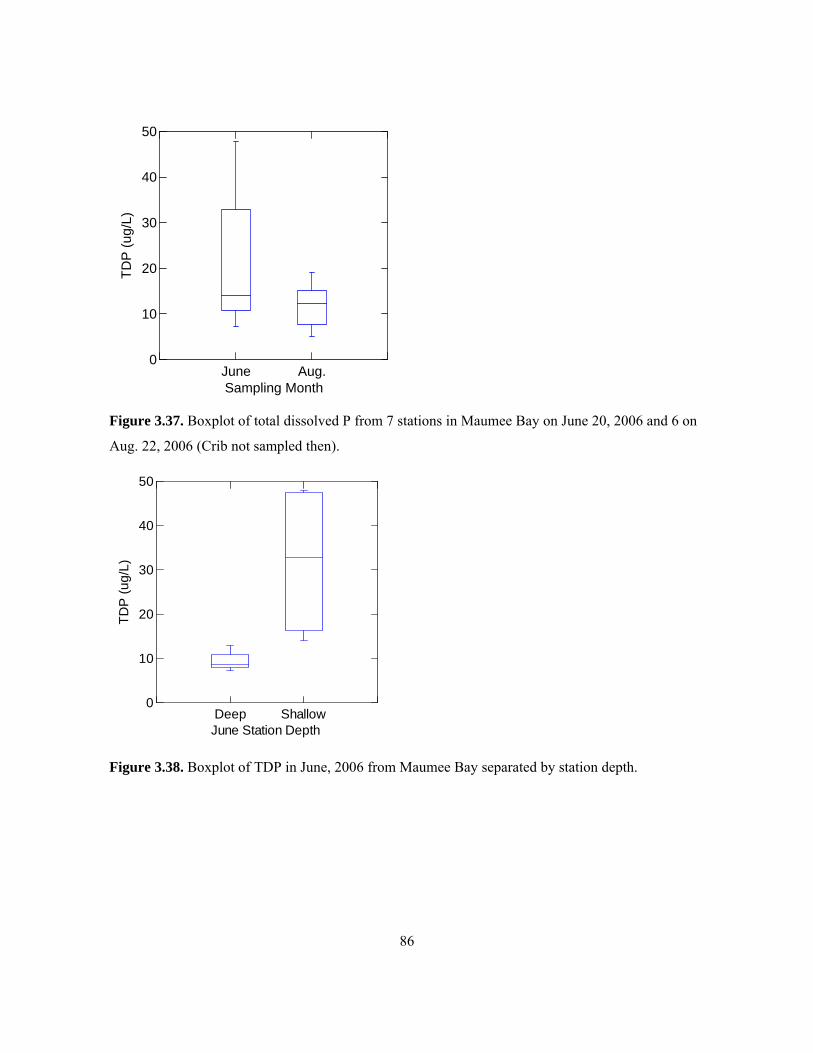
86
Aug.JuneSampling Month
0
10
20
30
40
50TD
P (u
g /L)
Figure 3.37. Boxplot of total dissolved P from 7 stations in Maumee Bay on June 20, 2006 and 6 on
Aug. 22, 2006 (Crib not sampled then).
Deep ShallowJune Station Depth
0
10
20
30
40
50
TDP
(ug /
L)
Figure 3.38. Boxplot of TDP in June, 2006 from Maumee Bay separated by station depth.

87
Deep ShallowStation Depth Category
0
10
20
30
40
50S
RP
(ug/
L)
JuneAug.
MONTH
Figure 3.39. Boxplots showing distribution of SRP by depth and month in 2006 in Maumee Bay.
Crib was not sampled on either date.
Aug.JuneSampling Month
100
200
300
400
500
600
C:P
(mol
ar)
Figure 3.40. Boxplot of C to P molar ratios from 7 stations in Maumee Bay on Aug. 22, 2006 and 5
stations in June 20, 2006 (Crib and MB18 not sampled).

88
3.3.3.3 Nitrogen and N to P Ratios
There are no NH3 data for June due to a laboratory error. In August, NH3 from station 7M is the
outlier that can be seen in Figure 3.41. With the outlier removed no depth-related pattern with NH3
was found (Table 3.5). NO3 levels were significantly drawn down between June and August (P<0.01)
from a mean of 1616 µg/L to a mean of 277.7 µg/L (Figure 3.42). As with other variables, deep
stations in June, but not August, had significantly lower NO3 than shallow stations (Table 3.5)
(Figure 3.42). NO2 was evenly distributed among depths in June (Table 3.5) but was significantly
lower in deep station in August (P<0.05) (Figure 3.43). NO2 was always negligible in comparison to
NO3 levels. A highly significant increase in particulate N values in August (P<0.01) (Figure 3.44)
corresponded to the decrease in NO3 and the increase in phytoplankton biomass as estimated by
chlorophyll a.
Aug.Sampling Month
0
50
100
150
NH
3 (u
g /L)
Figure 3.41. Boxplot of NH3 measured from 6 Maumee Bay stations on Aug. 22, 2006 (Crib not
sampled). No June data is available.

89
Deep ShallowStation Depth Category
0
1000
2000
3000
4000N
O3
(ug/
L)
JuneAug.
MONTH
Figure 3.42. Boxplot of NO3 from 6 Maumee Bay stations on June 20, 2006 and Aug. 22, 2006
(Crib not sampled either time).
Aug.JuneSampling Month
0
10
20
30
40
NO
2 (u
g/L)
Figure 3.43. Boxplot of NO2 from 6 Maumee Bay stations on June 20, 2006 and Aug. 22, 2006
(Crib not sampled either time).

90
Aug.JuneSampling Month
0
100
200
300
400
500
600Pa
rt. N
(ug/
L )
Figure 3.44. Boxplot of particulate N in Maumee Bay on June 20, 2006 and Aug. 22, 2006. Crib was
not sampled in June.
TN appeared to be higher at shallow stations in both June and August (Figure 3.45) but there
were no statistically significant differences (Table 3.5). The three deeper stations in August showed
little variation in TN (Figure 3.45). Shallow stations had a mean TN that was higher in June (2571
µg/L, N=3) than in August (1852 µg/L, N=4) but this trend was not statistically significant
(P=0.128). DON was calculated by subtracting DIN and particulate N from TN. Because NH3 values
were unavailable for June, June DON estimates were unable to be reliably computed. DON for
August had a mean of 1076 µg/L which represented 62% of the mean TN from August. One outlier,
from station Clear (Appendix B), had a quite high DON. C to N seston ratios were higher in June
than August (Figure 3.46) but this was not a statistically significant difference (P=0.110). C to N
ratios were evenly distributed among shallow and deep stations (Table 3.5). In June, Clear
constituted an outlier with the highest C:N ratio observed in Maumee Bay (14.7 molar ratio,
indicative of extreme N deficiency) but in August had the lowest C:N ratio of any station observed
(6.5 molar ratio, indicative of no N deficiency). Excluding station Clear, in June two stations were

91
showing signs of moderate N deficiency while the three others had C:N ratios suggesting no
deficiency. In August, the C:N ratios indicated that no N deficiency was being experienced. TN to TP
ratios exhibited a significant decrease between June and August of approximately half (P<0.01)
(Figure 3.47). Clear was again an outlier in August (Figure 3.47) with a high TN:TP in comparison to
other stations. TN:TP were uniform between deep and shallow stations (Table 3.5).
Deep ShallowStation Depth Category
0
1000
2000
3000
4000
TN (u
g/L)
JuneAug.
MONTH
Figure 3.45. Boxplot comparing Total N on June 20, 2006 and Aug. 22, 2006 at deep and shallow
stations in Maumee Bay. Note: Crib and MB18 were not sampled in June.
Aug.JuneSampling Month
6
7
8
9
10
11
12
13
14
15
C to
N M
o lar
Rat
io
Figure 3.46. C to N molar ratio from Maumee Bay on June 20, 2006 (6 stations: Crib not sampled)
and Aug. 22, 2006 (7 stations).

92
Aug.JuneSampling Month
0
100
200
300TN
:TP
(mol
a r)
Figure 3.47. Boxplot of TN to TP ratio for Maumee Bay on June 20, 2006 and Aug. 22, 2006. June
MB18 and June Crib data were unattainable.
3.3.3.4 Phytoplankton Count
The results of a detailed count to the species level on station 8M from August (station depth: 5.8m)
performed by phytoplankton taxonomist Hedy Kling can be found in Table 3.6. A count on a sample
from June was not performed. The majority of phytoplankton biomass in August was comprised by
cyanobacteria (76%). Of the cyanophytes, almost half were Aphanizomenon flos aquae forma (48%),
a distinctive morphotype of Aphanizomenon flos aquae. All Microcystis species comprised 22% of
the cyanophyte biomass. All Aphanocapsa species represented a further 19% of the cyanophyte
biomass. Data on heterocysts are not available.

93
Table 3.6. Phytoplankton count performed by Hedy Kling on a sample from station 8M from Aug.
21, 2006. Please note: Aphanocapsa holsatica specifically refers to Aphanocapsa holsatica (Lemm)
Cronb. & Kom. And Chroococcus minutus specifically refers to Chroococcus minutus (Kutz) Naeg.
Maumee Bay - Aug. 21, 2006 - Station 8M Phytoplantkon Group Biomass (mg/m^3) % of Total Biomass Cells/L % of Tot. Cells/L
Cyanophyta 1354.5 75.8 630801254 96.5 Chlorophyta 42.2 2.4 21616360 3.3 Euglenophyta 0 0 0 0 Chrysophyceae 2.4 0.1 179028 0 Haptophyta 0 0 0 0 Diatomeae 61.5 3.4 37000 0 Cryptophyceae 316.1 17.7 1320872 0.2 Peridineae 10.6 0.6 29838 0 Xanthophyta 0 0 0 0
========== ======== ========== ======= ======== TOTAL 1787.3 653984352
Others Biomass (mg/m^3) Cells/L Protozoa 50 17000 Mixotrophs 25 387894 Zooplankton 523.5 1000
Taxon Biomass (mg/m^3) % Total Cyano.
Biomass Cells/L Aphanizomenon flos aquae forma 654.4 48.3 135000 Microcystis novacekii 269 19.9 5200000 Aphanocapsa sp 218.7 16.1 417732000 micro bluegreens 66.1 4.9 126274416 Aphanizomenon klebanii 62.8 4.6 32000 Aphanocapsa holsatica 41.9 3.1 80000000 Microcystis flos aquae 22.5 1.7 1000000 aphanizomenon akinete 7.3 0.5 10000 Planktolyngbya limnetica 6.4 0.5 29838 Microcystis ichthyoblabe 4.5 0.3 208000 Chroococcus minutus 0.5 0.04 4000 Chroococcus dispersus 0.3 0.02 8000 Pseudanabaena mucioli 0.1 0.007 18000 Aphanocapsa minutissima 0.1 0.007 150000 All Aphanizomenon 717.2 52.9 All Microcystis 296 21.9 All Aphanocapsa 260.7 19.2

94
3.3.3.5 Fluoroprobe Phytoplankton Estimates
The three Fluoroprobe profiles performed in June, all on deep stations, show very little chlorophyll
with a mean of 1.4 µg/L (Appendix B). The percent cyanobacteria is also very low at 4% (Appendix
B). As can be seen in the Fluoroprobe profiles (Figure 3.34) the distribution of chlorophyll follows
the pattern of stratification with more phytoplankton in the epilimnion. At the stations profiled,
cryptophytes were the largest phytoplankton group identified by the Fluoroprobe.
In August, the proportion of cyanobacteria within the total phytoplankton community, as
measured by the Fluoroprobe, was 68% (Appendix B) which is near the 76% level from the
phytoplankton count. Station 7M had the lowest concentration of both cyanobacterial pigments and
total chlorophyll of all stations in August (Appendix B). The estimate of percentage of total
chlorophyll attributed to cyanobacteria by the Fluoroprobe can be seen in Figure 3.48. The increase
in percent cyanobacteria from a mean of 4.3% in June to a mean of 73.3% in August is substantial.
Figure 3.49 shows a comparison of chlorophyll values obtained through extraction and the
Fluoroprobe. In June, the extraction method and Fluoroprobe chlorophyll estimates were similar
(extraction mean: 0.34 µg/L, Fluoroprobe mean: 1.41 µg/L). However, in August the Fluoroprobe
(mean: 6.52 µg/L) estimated much less chlorophyll than did the extraction method (mean: 17.39
µg/L).

95
Aug.JuneSampling Month
0
10
20
30
40
50
60
70
80
90%
Cya
n os
Acco
rdin
g to
Flu
orop
robe
Figure 3.48. Percent cyanobacteria as detected by the Fluoroprobe on June 20, 2006 and August 22,
2006 in Maumee Bay.
Aug.JuneSampling Month
0
10
20
30
Tota
l Chl
( ug/
L)
ExtractedFluoroprobe
Figure 3.49. Comparison of Maumee Bay chlorophyll estimates from laboratory acetone extraction
of samples from 1m or the surface (Appendix B) and in situ Fluoroprobe chlorophyll estimates
averaged over the mixed layer.

96
3.3.3.6 Microcystin
In June, both dissolved and total microcystin were below the PPIA detection limit of 0.05 µg/L
microcystin (Figures 3.50 and 3.51) and so levels in August were significantly higher (dissolved:
P<0.01; total: P<0.001). In August, total microcystin levels were all above the W.H.O.’s 1 µg/L
maximum allowable exposure level with values ranging from 2.0 to 7.6 µg/L (Figure 3.51). There
was no statistical difference between deep and shallow sites in August (P=0.39). Crib, the water
intake site, had the lowest total microcystin. Percent dissolved microcystin in August had a wide
range (Figure 3.52) and a mean of 13.7%. Only one station in August, MB19, had a dissolved
microcystin level above 1 µg/L.
Aug.JuneSampling Month
-1
0
1
2
Dis
s.M
i cro
cyst
in (u
g/L)
Figure 3.50. Boxplot of dissolved microcystin in Maumee Bay on June 20, 2006 and Aug. 22, 2006.
Data is in equivalents of microcystin-LR.

97
Aug.JuneSampling Month
-1
0
1
2
3
4
5
6
7
8To
tal M
icro
cyst
in (u
g/L)
Figure 3.51. Boxplot of total microcystin in Maumee Bay on June 20, 2006 and Aug. 22, 2006. Data
is in equivalents of microcystin-LR and includes both intracellular and extracellular toxin.
Aug.Sampling Month
5
10
15
20
Per
cent
Dis
solv
ed M
icr o
cyst
in
Figure 3.52. Boxplot showing distribution of percent dissolved microcystin values for Aug. 22, 2006
in Maumee Bay. June data is not presented as microcystin was below detection.
3.3.3.7 Photosynthetic Efficiency
ETRmax values had a wide range in June (Figure 3.53) but there was no trend with depth (P=0.427).
In August, the two deep stations sampled showed very little variation in ETRmax and were lower

98
than the shallow stations, although this relationship was not significant (P=0.105) (Figure 3.54).
Neither ETRmax nor Fv/Fm (Figure 3.55) was significantly different between June and August
(Table 3.5).
Aug.JuneSampling Month
10
20
30
40
50
60
70
80
90
100
ETR
max
Figure 3.53. Boxplot of the PAM’s ETRmax values from Maumee Bay. June 8M, June Crib, and
Aug. Crib were not sampled.
DeepShallowDepth Category for August
30
40
50
60
70
80
90
100
ETR
max
Figure 3.54. Boxplot of ETRmax, a PAM parameter, at two depth categories in Maumee Bay in
August, 2006.

99
Aug.JuneSampling Month
0.2
0.3
0.4
0.5
0.6Fv
/Fm
Figure 3.55. Boxplot of Fv/Fm values from the PAM. N=4 for June and N=6 for August.
3.4 Discussion
3.4.1 Bay of Quinte Discussion
3.4.1.1 Water Transparency, Chlorophyll, Phosphorus, and Water Column Stability
The significant decrease in Secchi depth in September was a symptom of higher phytoplankton
biomass. This was evidenced by higher extracted chlorophyll a values (Figure 3.3), higher
Fluoroprobe total chlorophyll estimates, and higher phytoplankton biomass as estimated through
counts on station NA (Tables 3.1 and 3.2). It was expected that lower water transparency would
promote microcystin production, so this hypothesis was refuted in the Bay of Quinte. Although
particulate P significantly increased between July and September, TP remained similar (Figures 3.2
and 3.3). With such a marked increase in phytoplankton biomass but the same TP supply, it is not
surprising that phytoplankton cells were less P rich in September, as was seen in the significantly
higher C to P ratio (Figure 3.16). Since Guildford et al. (1994) lists a C to P ratio of over 258 as
indicative of extreme nutrient deficiency, the September C to P ratio suggests that the phytoplankton

100
were severely P limited. The July C to P ratio then suggests that phytoplankton at that time were
moderately P deficient. When P limitation was lower in the Bay of Quinte, microcystin
concentrations were higher. Therefore, the hypothesis that cells with lower nutrient deficiency will be
associated with higher microcystin is, therefore, supported. Because TP did not vary significantly
between July and September, higher TP was not associated with higher microcystin concentrations.
Both SRP and TDP were significantly drawn down in September in comparison to July. This
is likely attributable to the higher phytoplankton biomass in September. As was hypothesized, higher
SRP was associated with higher microcystin levels. SRP and TDP showed a strong trend of being
significantly lower at shallow stations in July. This corresponded to significantly higher levels of
chlorophyll at those shallow stations and, therefore, higher P demands by phytoplankton. It is unclear
exactly why there was higher phytoplankton biomass at shallow stations since no other variables
showed a major difference with depth in July. Perhaps N runoff was being taken up by the
phytoplankton at the shallow stations so that it promoted the growth of additional biomass and was
not present in the water to be detected. Or, perhaps higher mean irradiance occurred at shallow
stations which may have given phytoplankton there an advantage over deeper stations. The
Fluoroprobe temperature profiles for stations in July (Figure 3.25) show mixing to the bottom or
nearly the bottom (in the case of station GPt) so higher mean irradiance at shallow stations would
have been possible. There was little evidence for stratification in either July or September, therefore
increased water column stability was not associated with higher microcystin concentrations.
3.4.1.2 Nitrogen Levels
Ammonia levels were always higher than nitrate levels for all stations, with the exception of the DS
(shoreline) station in July and the MBO station in September. One would expect ammonia to be
lower than nitrate for two main reasons. Firstly, because the Bay of Quinte is shallow and usually
mixed to the bottom, conditions should be oxic under which the majority of inorganic N is found in

101
its most oxidized form, nitrate (Kalff 2003). Secondly, it is more energetically efficient for
phytoplankton to take up reduced ammonium than it is to take up nitrate, so phytoplankton uptake
usually drives down ammonia levels (Kalff 2003).
It is possible that the ammonia values were high because of human and livestock sewage
inputs, since these are known to be rich in ammonia (Kalff 2003). Furthermore, cows were observed
drinking directly from the bay on certain sampling trips (Stephanie Guildford, personal
communication). No major differences were observed in DIN between or within sampling periods
with the exception of significantly higher NO2 at shallow stations in September. This could have
resulted from manure runoff from land.
Lower C to N ratios in September (Figure 3.12) suggest that phytoplankton were more N rich
then than they were in July. One deep and one shallow station in July had C:N ratios high enough
that moderate N deficiency was indicated (Guildford et al. 1994). The significantly higher TN and
particulate N values in September could explain how the phytoplankton contained more N at that
time period. In September, deep stations had significantly lower C:N ratios than did shallow stations.
The reasons for this pattern are unclear. Differences among TN:TP ratios between July and
September were not seen.
Based on the measurements of particulate N and dissolved inorganic N, the majority of the
nitrogen making up the TN appears to be DON (Appendix A). This is not surprising as DON is
known to commonly exceed dissolved inorganic N (DIN) (Berman 2001). High productivity in the
Bay of Quinte could contribute to this DON pool since phytoplankton have been shown to release
DON (Bronk et al. 1994). It should be noted that the DON pool may also be used as a source of N by
phytoplankton (McCarthy 1972).
Remarkably, the particulate N mean for July 4, 2006 of 161.4 µg/L (with an outlier removed)
was equivalent to a July 17, 1974 measurement from the Bay of Quinte of 161 µg/L (Liao 1977).

102
This shows a high level of continuity in the nitrogen environment over 33 years. This could be
expected given that the Bay of Quinte Remedial Action Plan targeted P reduction and not N levels
(Johnson and Hurley 1986).
3.4.1.3 Phytoplankton Community
Historically, diatoms and cyanophytes were the two most important phytoplankton groups in the Bay
of Quinte, with diatoms typically being the most dominant (Nicholls and Heintsch 1986). Data from
1945, before phosphorus abatement, show this trend, as well as data from 1981, after phosphorus
abatement (Nicholls and Heintsch 1986). The data presented here contrasts with that pattern as
cyanobacteria were the predominant group and diatoms were hardly represented (Tables 3.2 and 3.3).
Nonetheless, evidence of diatom biomass changes was observed. Soluble reactive Si was
significantly lower in September than it was in July, which corresponds to an increase in diatom
biomass (based on the phytoplankton counts) from 288 mg/m3 in July to 704 mg/m3 in September
(Tables 3.2 and 3.3).
The switch to cyanobacterial dominance has widely been attributed to selective feeding by
dreissenids, which had become abundant in the Bay of Quinte by 1995 (Nicholls et al. 2002).
Microcystis colonies are often too large to be filtered out by dreissenids (Vanderploeg et al. 2001)
and so dreissenids could certainly have contributed to the dominance of the various Microcystis
species observed in July by grazing down their competitors.
To understand phytoplankton community dynamics one can look to the characteristics and
tolerances of individual species. It is notable that Anabaena spiroides, which dominated in
September, is a known N-fixer. The number of heterocysts as a percentage of total potential
producers was 1.73 in July but actually decreased 5-fold to 0.335 in September. Therefore, it appears
that less nitrogen fixation was occurring in September and that the possession of heterocysts does not
explain how Anabaena spiroides came to dominate over Microcystis.

103
Another member of the Anabaena genus, Anabaena flos-aquae, has been shown to have a
maximum P uptake rate that is over five times higher than that of Microcystis aeruginosa (Holm and
Armstrong 1981, Nalewajko and Lean 1978, Reynolds 1988, Reynolds 2006). It is plausible that
Anabaena spiroides also has a higher maximum P uptake rate which may have given it a competitive
advantage in September when it appears that P was extremely limited.
3.4.1.4 2006 Microcystin
Total microcystin, dissolved microcystin, percent dissolved microcystin, and particulate microcystin
per unit chlorophyll a were all significantly higher in July than September. With the overall
cyanobacterial biomass and percent cyanobacteria being greater in September, one might expect
higher microcystin at that time, but this was not the case. The multiple Microcystis species and
Anabaena spiroides, which dominated in July and September, respectively, are all potential toxin
producers. Therefore, the hypothesis that dominance by potentially toxic species will be positively
associated with microcystin concentrations cannot be supported. It is possible, however, that the
strain(s) of Anabaena spiroides in the Bay of Quinte has a lower toxin producing capacity than the
strains of Microcystis present there, as it is known that toxin production per unit cyanobacteria varies
with species (Reynolds 2006). The high percentage of dissolved toxin in July suggests that the
Microcystis cells were lysing at the time of sampling. This may have been due to photoinhibition
(Reynolds 2006) as the Microcystis had formed a visible scum on the surface. Microcystis has the
potential to exhibit twice the positive buoyancy of Anabaena, therefore Microcystis has a greater
potential for surface scum formation (Reynolds 2006). Once exposed to high light intensities for an
extended period of time, many types of cyanobacteria do not survive (Sabour et al. 2005)

104
3.4.1.5 Comparison of 2005 and 2006 Microcystin
Microcystin levels were much higher in 2006 than they were in 2005. Detected microcystin was
relatively low in 2005 (Table 3.4), but its presence shows that potential microcystin producers were
still thriving in the Bay of Quinte.
3.4.2 Maumee Bay Discussion
3.4.2.1 Chlorophyll and Water Transparency
The extremely low chlorophyll observed in June may have been due to seasonal growth just
beginning or due to a clearwater phase brought about by heavy grazing by zooplankton. The increase
in phytoplankton biomass, as indicated by higher chlorophyll concentrations, in August was
immediately obvious when sampling due to the surface scum that had accumulated. The decreased
Secchi depth and increased particulate P in August can be attributed to this increase in biomass. The
very low water transparency observed at station MB19 in both June and August was likely due to
sediment loading from the Maumee River as MB19 is the station closest to the river mouth.
Sediment-rich water was observed at MB19 while sampling. The decreased light caused by the
Maumee River sediment plume has been proposed as a factor that promotes Microcystis over other
phytoplankton types (Bridgeman 2005), presumably by limiting light and giving buoyancy-regulating
Microcystis an advantage. At all stations, decreased water transparency was associated with higher
microcystin concentrations.
3.4.2.2 Stratification, Dissolved Nutrients and Particulate N and P
The stratification present in June may have prevented water column mixing and likely contributed to
the significant differences in TDP, SRP, and NO3 concentrations that were seen between sites in
June. Typically deeper stations had lower nutrient levels in June, as measured from the epilimnion.
This may have been because runoff was supplying shallower stations with additional nutrients while

105
nutrient renewal was prevented at deeper stations. It is unlikely that greater phytoplankton biomass
was drawing down nutrients more quickly in deeper stations because the chlorophyll a levels were
similar for all depths. In August, when stratification was weak or absent, stations exhibited greater
uniformity in nutrient concentrations, with the exception of NO2. Since microcystin levels were
higher in August, greater water column stability was not directly associated with higher toxin
concentrations in Maumee Bay.
Between June and August, the significant decreases in the dissolved nutrients (TDP, SRP,
NO3, and NO2) can likely be attributed to nutrient uptake by the greatly augmented phytoplankton
biomass. This nutrient drawdown was observed in spite of the water column mixing that may have
accompanied the weakly stratified conditions in August. Therefore, higher SRP was not associated
with elevated microcystin concentrations. The significantly higher particulate N and strong trend of
higher particulate P in August illustrate the movement of nutrients from the dissolved fraction to the
particulate fraction as a result of having been incorporated into phytoplankton tissue.
3.4.2.3 TP and TN:TP Ratios
The significantly higher TP in August was likely the result of the mixing of the water column that
could have occurred when stratification broke. The average TP found in June 2006 in Maumee Bay
(25.6 µg/L) and the average August 2006 TP (36.7 µg/L) are comparable to western Lake Erie TP
values in the literature. Holland and collaborators (1995) observed concentrations similar to June’s in
1990-1993 in western Lake Erie and concentrations similar to August’s in 1984-1987. Higher TP was
associated with greater microcystin levels as was hypothesized.
The significant decrease in the TN to TP ratio between June and August was accompanied by
a 69% mean increase in percentage cyanobacteria present. The TN:TP decrease also coincided with
an increase in microcystin levels, as was hypothesized. The TN:TP ratios were still relatively high in
August with a mean of 107. For instance, Smith (1982) considered TN:TP ratios over 35 to indicate

106
that chlorophyll a concentrations were no longer influenced by TN. The TN:TP ratios were always
well over the level of 20 listed in Guildford and Hecky (2000) as being suggestive of the potential for
N deficiency and always in the range indicative of the potential for P deficiency (> 50).
3.4.2.4 Nutrient Status Indicators and Photosynthetic Parameters
Even with the differences in dissolved and particulate nutrients observed over the season in Maumee
Bay, there were no significant differences between June and August in the nutrient status indicators
(C:P and C:N). The extreme fluctuation in station Clear’s C to N ratio from being indicative of
extreme N deficiency to no deficiency at all may have been the result of interference by sediment in
the elemental readings. The C to N ratios indicate that likely no N deficiency was occurring in
Maumee Bay. The C to P ratios indicate the presence of moderate P deficiency, which had worsened
by August. Because these nutrient deficiency indicators did not change significantly over the
summer, the hypothesis that indicators of greater nutrient deficiency will be negatively associated
with microcystin levels is not supported in Maumee Bay.
Fv/Fm and ETRmax also did not vary significantly between June and August, but they were,
on average, higher in August. Based on the Fv/Fm values published in Behrenfeld et al. (1996), the
Fv/Fm values observed in Maumee Bay (June mean: 0.37, August mean: 0.43) would not be
considered low but they are below the 0.5 to 0.6 Fv/Fm range recorded upon fertilization with a
limiting nutrient.
3.4.2.5 Phytoplankton Community
Most of the cyanobacteria present in August were Aphanizomenon, a potential N fixer but not a
potential microcystin producer (Falconer 2005). In contrast, many other recent cyanobacterial blooms
in western Lake Erie have been mainly composed of Microcystis (Budd et al. 2001, Conroy et al.
2005, Vincent et al. 2004). Of the phytoplankton species identified in the August 8M sample, only

107
the Microcystis species present are known to be capable of producing microcystin (Falconer 2005). If
75.8% of the phytoplankton biomass at 8M were cyanobacteria and only 21.9% of those were
Microcystis, relatively little Microcystis biomass was producing 5.9 µg/L total microcystin. This
suggests that the Microcystis strains present in Maumee Bay have a high capacity for microcystin
production. The hypothesis that an increased abundance of toxic cyanobacteria will be associated
with greater microcystin concentrations is supported on the basis of the Fluoroprobe cyanobacteria
estimates.
3.4.2.6 Microcystin
Microcystin levels well over the World Health Organization’s 1.0 µg/L exposure level are not a new
phenomenon in western Lake Erie. In 2003, Rinta-Kanto et al. (2005) measured 15.4 µg/L
microcystin-LR equivalents with PPIA near the mouth of the Maumee River. The MB19 station near
the Maumee River in this study had the highest total microcystin concentration in August 2006 with
7.6 µg/L. In 2004 Rinta-Kanto et al. (2005) observed microcystin levels up to 1.0 µg/L at other
western Lake Erie sites. In both 2003 and 2004, Microcystis spp. containing the mcyD (microcystin-
producing) gene were detected in Western Lake Erie (Rinta-Kanto et al. 2005). The August 2006
microcystin concentrations displayed consistency between stations in that all were above 2 µg/L.
This was not found in the work by Rinta-Kanto et al. (2005), but they surveyed a larger area than this
study. The persistent presence of microcystin over the years supports the need for consistent
monitoring of microcystin levels in western Lake Erie, particularly because it is a source of drinking
water.
3.5 Conclusion
It is possible that correspondence between microcystin levels and various environmental variables is
coincidental since these data comprise only two snapshots of the 2006 season in both the Bay of

108
Quinte and Maumee Bay. Nonetheless, distinctive patterns have emerged from the significant
differences found in the Bay of Quinte and Maumee Bay datasets. In the Bay of Quinte, the
cyanobacteria in July produced more microcystin and experienced lower nutrient (P) stress and had
more TDP and SRP available to them than in September. In July, the dominant cyanobacteria were
Microcystis spp. whereas in September Anabaena spiroides dominated. Significant differences were
found that were contrary to expectations: there was more microcystin present when there was greater
water transparency, there was some apparent N deficiency, and there was a lower potentially toxic
cyanobacterial biomass. In Maumee Bay, more microcystin was produced in August when there was
a higher cyanobacterial biomass, decreased water transparency, increased TP, and decreased TN:TP
ratios in comparison to June. Maumee Bay and the Bay of Quinte exhibit very distinctive patterns in
the environmental variables that appear to influence their microcystin concentrations.

109
Cha
pter 4 Grand River Reservoirs
4.1 Study Sites
Belwood Lake, Constogo Lake, and Guelph Lake are reservoirs in the Grand River basin in southern
Ontario. Belwood Lake resulted from the damming of the Grand River near Fergus, Ontario in 1942.
Conestogo Lake resulted from the damming of the Conestogo River in 1958. Guelph Lake resulted
from the damming of the Speed River near Guelph, Ontario in 1975 (Grand River Conservation
Authority 1980). Because discharge from the reservoirs is carefully regulated, their depths vary
dramatically throughout the year (Grand River Conservation Authority 1980). Agricultural and urban
uses in the Grand River catchment basin have contributed to the eutrophic state of these reservoirs.
Their warm, stratified, calm waters provide ideal conditions for excess algal growth (Grand River
Conservation Authority 1980). All three reservoirs had reported hypolimnetic oxygen depletion
problems in a 1980 assessment (Grand River Conservation Authority 1980). Recently, a massive
cyanobacterial bloom occurred on Belwood Lake in the late summer of 2004, warranting a study into
environmental variables that may be predictors of blooms as well as potential microcystin
production. The field work for this study was performed by Miss Lesley-Ann Chiavaroli and
assistants in conjunction with her Biol 499 project with Dr. Guildford. Miss Chiavaroli performed all
PAM work and analyzed physical parameters and Fluoroprobe profiles. Miss Chiavaroli also
compiled the majority of the data presented here for her Biol 499 report (2006) which was used with
permission. Dr. Yuri Kozlov performed all chemical analyses with the exception of phosphorus and
microcystin which were measured by myself. Dr. Stephanie Guildford prepared the fluoroprobe
profile graphs. We are grateful to Miss Chiavaroli and Dr. Kozlov for their substantial contributions

110
to this chapter and their work will be acknowledged through authorship on any publication of this
study.
4.1.1 Microcystin Background
A detailed background of microcystin can be found in Chapter 1. In other studies, high
microcystin concentrations have been associated with environmental variables such as TP, SRP, TN,
the N to P ratio, chlorophyll a, light, and dissolved O2, although results have been varied (Billam et
al. 2006, Kardinaal and Visser 2005). Microcystin dynamics can be somewhat unique in different
water bodies. It is theorized that toxigenic strains generally produce the most microcystin under their
optimal growth conditions, which typically include elevated nutrient concentrations (Kardinaal and
Visser 2005, Sivonen and Jones 1999). The exact environmental variables found to best explain
microcystin concentrations may be strain-specific, however (Orr and Jones 1998). The seasonal
succession of cyanobacterial species and strains is likely very important to microcystin
concentrations and can vary between study sites (Billam et al. 2006, Codd et al. 2005).
4.1.2 Hypotheses
Microcystin concentrations and various biological, chemical, and physical parameters were
investigated in Belwood Lake, Conestogo Lake, and Guelph Lake to better understand cyanobacterial
dynamics and to identify any microcystin production. This work was carried out under the following
hypotheses:
1) If nutrient status affects microcystin concentrations and favourable growth conditions result in
more microcystin production, then indicators of greater nutrient deficiency will be negatively
associated with microcystin levels.

111
2) If the abundance of different cyanobacterial groups contributes to microcystin concentrations, then
dominance by particular potentially toxic species will be associated with higher microcystin
concentrations.
3) Greater water column stability, a low N to P ratio, higher SRP and TP, and decreased water
transparency all promote the production of microcystin and that they will be positively associated
with microcystin concentrations.
4.2 Methods
4.2.1 Sampling Procedure
Both Belwood and Conestogo Lakes were sampled biweekly between July 6 and September 22,
2005. Belwood was additionally sampled on Oct. 13, 2005 following the appearance of an
unexpected cyanobacterial bloom. Guelph Lake was sampled biweekly between July 6 and Sept. 5,
2005.
On each sampling occasion, secchi depth was read and pH was measured using a portable pH
meter. A Fluoroprobe was deployed for an in situ measurement of total chlorophyll and the
characteristic pigments of chlorophytes, cyanophytes, diatoms, and cryptophytes. A CTD profiler
was also deployed to measure photosynthetically available radiation (PAR) throughout the water
column. Using a 5L Niskin bottle, 20L of water was collected from a depth of 2m and again from a
depth of 6-7m to be representative of the epilimnion and hypolimnion, respectively. Upon returning
to the lab, whole water was prescreened through 200 µm mesh in order to remove large grazers.
Water was then filtered, through either a 0.7 µm glass microfibre filter (GF/F) or 0.2 µm
polycarbonate filter as required for analysis. All water and filters were frozen until analysis with the
exception of the PAM filters. These were read immediately using a Walz Diving-PAM.

112
4.2.2 Light Calculations
The light attenuation coefficient (Kd) was determined by taking the slope of the line of the regression
between ln(PAR) and depth. The depth of the euphotic zone was then determined through the
equation: zeu= ln(100)/ kd. Mean irradiance within the mixed layer as a percentage of surface PAR
was calculated through the equation:
Mean I (%) = (Surface PAR- Mixing Depth PAR)*100
ln(Surface PAR/ Mixing Depth PAR)
Equations can be found in Kalff (2003).
4.2.3 Nutrient and Chlorophyll Analyses
All analyses were performed using standard operating procedures compiled by Dr. Yuri Kozlov
which were based on Stainton et al. (1977) and Standard Methods for the Examination of Water and
Wastewater (American Public Health Association 1992), and other references mentioned below.
TDP, TP, and Part P were measured by potassium persulfate digestion followed by the ascorbic acid
method. TDP samples had been run through a 0.2-µm polycarbonate filter while Part P was measured
on a 0.7-µm GF/F filter. SRP was also measured using the ascorbic acid method on GF/F filtrate.
Particulate C and N was determined on pre-combusted GF/F filters that were packed into metal
capsules and read in an Exeter CEC-440 Elemental Analyzer by David Depew after Grasshoff et al.
(1983). Total N samples were digested by alkaline oxidation, passed through cadmium reduction
columns, and read on a spectrophotometer following colour generation. NH3 samples were first run
through a 0.2-µm polycarbonate filter then measured with the orthophtaldialdehyde method outlined
in Holmes et al. (1999). Filtered samples were measured for nitrate and nitrite on an Ion
Chromatograph Dionex ICS 2500. For the measurement of soluble reactive silica, unfiltered samples
were acidified, colour was generated from the addition of molybdate and stannous chloride, and
samples were read on a spectrophotometer. Particulate silica was collected on a polycarbonate filter,

113
digested with sodium hydroxide, neutralized, and read as soluble reactive silica. Chlorophyll was
protected from light, extracted cold from GF/F filters with acetone, and read in a Turner fluorometer.
4.2.4 Microcystin Analysis
Whole water was analyzed for total microcystin and GF/F filtrate was analyzed for dissolved
microcystin. The protein phosphatase inhibition assay (PPIA) outlined in Bouaicha et al. (2002) was
followed for toxin analysis except for the enzyme concentration used. For samples with 0.05-0.1
µg/L microcystin, 22 mUnits of enzyme were used and for samples with 0.1-0.25 µg/L microcystin,
48mUnits of enzyme were used. Samples with greater than 0.25 µg/L microcystin were diluted until
they fit on the standard line. Assays were read in a SPECTRAmax GEMINI XS Dual Scanning
Microplate Spectrofluorometer. In order to be confident in the microcystin data obtained from the
newly established PPIA, samples were retested until multiple assay runs yielded consistent results.
4.2.5 Data Analysis
Systat Version 9 (SPSS, 1998) was used to generate most graphs and to perform statistical analyses.
Microsoft Excel 2002 was used to generate some graphs. One-way ANOVA was used with
Bonferroni post-hoc tests to look for significant differences among major variables between stations
and dates within a water body. All data were tested for normality prior to statistical analysis and were
log-transformed if they were not normally distributed. Table 4.1 lists which variables were log-
transformed. In the figures, sampling trips are numbered 1 through 7. The dates that correspond to
these trips are listed in Table 4.2.

114
Table 4.1. GRCA variables that were normal or required log-transformations prior to statistical
analysis.
Variable Belwood Conestogo Guelph pH normal normal normal Temperature normal normal normal Secchi normal log normal Kd normal normal log Euphotic Depth normal normal log Mixing Depth normal normal normal Mean Irradiance normal normal log Fv/Fm Log normal normal Ext. Chl normal normal log SRP Log normal normal TDP Log log normal Part. P normal normal normal TP normal normal log NH3 normal normal log NO2 Log normal normal NO3 Log normal normal TN Log normal log DON Log log normal TN:TP Log log log Part N normal normal normal C:N normal normal normal C:P Log normal normal SRSi Log normal normal Microcystin Log normal log
Table 4.2. Numbered sampling trips as they appear in the GRCA figures and their corresponding
dates.
GRCA Figure Legend Sampling Trip Date
1 06-Jul-05 2 21-Jul-05 3 11-Aug-05 4 23-Aug-05 5 05-Sep-05 6 22-Sep-05 7 13-Oct-05

115
4.3 Results
4.3.1 Physical Characteristics
Because the sampling stations were intended to be the deepest points of each reservoir, the sampling
station depth can be used as a proxy for lake depth at the time of sampling. Reservoir depth did not
vary much as the water levels are highly regulated. An examination of Figure 4.1 shows that
Belwood Lake was the deepest reservoir and Guelph Lake was the shallowest. The mixing depth of
Guelph Lake stayed the most constant of all the three reservoirs (Figure 4.2). All showed a dramatic
increase in mixing depth on the August 23, 2005 following a strong storm that eroded the
thermocline. Evidence of this can also be found in the fluoroprobe profiles for August 23 (Figure
4.3).
0 1 2 3 4 5 6 7 8Sampling Trip
0
5
10
15
20
Lake
Dep
th a
t Cen
tre (m
)
GuelphConestogoBelwood
RESERVOIR
Figure 4.1. Depth of stations on each sampling trip. One station was sampled from each reservoir
and it was chosen at the seemingly deepest point of the reservoir.

116
0 1 2 3 4 5 6 7 8Sampling Trip
0
2
4
6
8
10
12M
ixin
g D
epth
( m)
GuelphConestogoBelwood
RESERVOIR
Figure 4.2. Mixing depths in Belwood, Conestogo, and Guelph lakes in 2005 as determined by
fluoroprobe temperature profiles. Sampling dates are listed in Table 4.2.

117
Figure 4.3. GRCA Fluoroprobe profiles below.
Belwood Jul 6, 2005
02468
10121416
0 1 2 3 4 5 6
Chl (ug/L)
Dep
th (m
)
12 13 14 15 16 17 18 19 20 21 22 23 24Temperature (C)
Tot
Cyan
Temp
Conestogo Jul 6, 2005
0369
0 0.5 1 1.5 2 2.5
Chl (ug/L)
Dep
th (m
)
17 18 19 20 21 22 23 24Temperature (C)
Tot
Cyan
Temp
Guelph Jul 6, 2005
0
3
6
9
0 1 2 3 4 5 6
Chl (ug/L)
Dep
th (m
)
17 18 19 20 21 22 23 24Temperature (C)
TotCyanTemp
118
Belwood July 21, 2005
02468
101214
0 5 10 15 20 25
Chl (ug/L)
Dep
th (m
)
19 20 21 22 23 24 25 26Temperature (C)
TotCyanTemp
Conestogo July 21, 2005
02468
101214
0 5 10 15 20 25
Chl (ug/L)
Dep
th (m
)
15 16 17 18 19 20 21 22 23 24 25 26Temperature (C)
TotCyanTemp
Guelph July 21, 2005
0
2
4
6
8
0 2 4 6 8
Chl (ug/L)
Dep
th (m
)
22 23 24 25 26 27 28Temperature (C)
TotCyanTemp
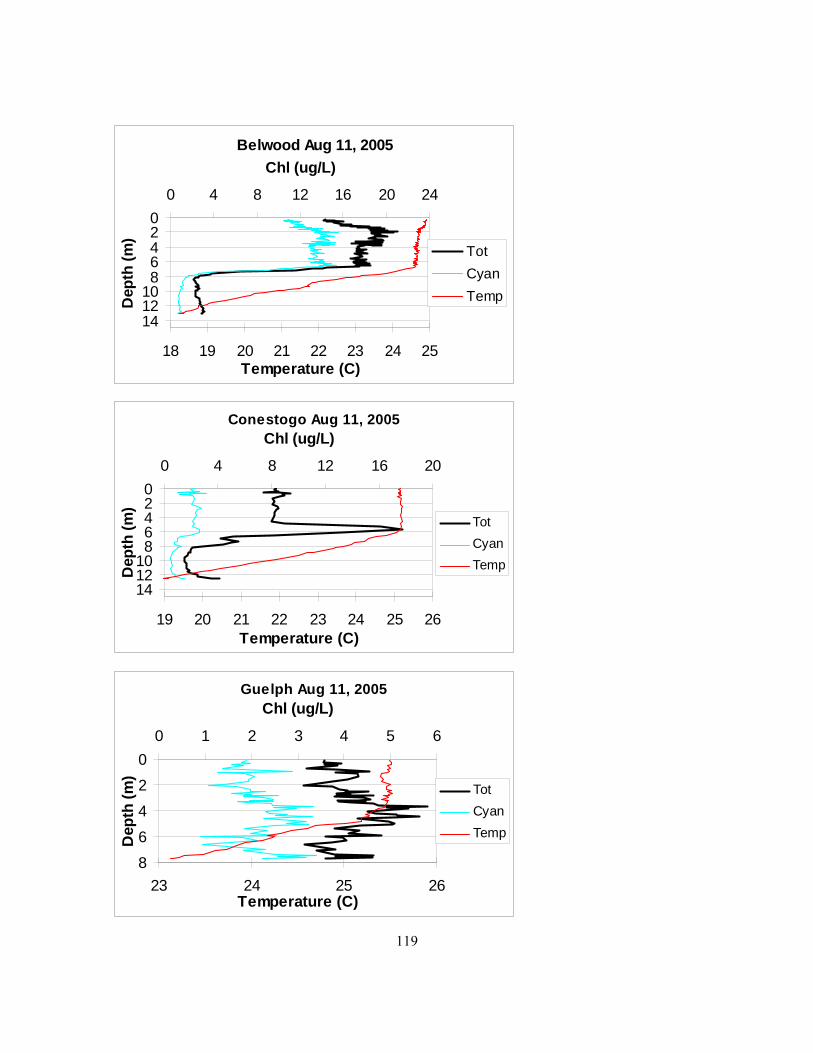
119
Belwood Aug 11, 2005
02468
101214
0 4 8 12 16 20 24
Chl (ug/L)
Dep
th (m
)
18 19 20 21 22 23 24 25Temperature (C)
TotCyanTemp
Conestogo Aug 11, 2005
02468
101214
0 4 8 12 16 20
Chl (ug/L)
Dep
th (m
)
19 20 21 22 23 24 25 26Temperature (C)
TotCyanTemp
Guelph Aug 11, 2005
0
2
4
6
8
0 1 2 3 4 5 6
Chl (ug/L)
Dep
th (m
)
23 24 25 26Temperature (C)
TotCyanTemp

120
Belwood Aug 23, 2005
02468
1012
0 4 8 12 16
Chl (ug/L)
Dep
th (m
)
21.7 21.8 21.9 22 22.1Temperature (C)
Tot
Cyan
Temp
Conestogo Aug 23, 2005
02468
101214
0 4 8 12 16
Chl (ug/L)
Dep
th (m
)
21 21.5 22 22.5Temperature (C)
TotCyanTemp
Guelph Aug 23, 2005
0
2
4
6
8
0 2 4 6 8 10
Chl (ug/L)
Dep
th (m
)
21.6 21.8 22 22.2 22.4Temperature (C)
TotCyanTemp

121
Belwood Sept 05, 2005
02468
101214
0 15 30 45 60 75 90
Chl (ug/L)
Dep
th (m
)
20.8 21 21.2 21.4 21.6 21.8Temperature (C)
TotCyanTemp
Conestogo Sept 05, 2005
02468
1012
0 2 4 6 8 10 12
Chl (ug/L)
Dep
th (m
)
21 22 23 24 25 26Temperature (C)
Tot
Cyan
Temp
Guelph Sept 05, 2005
02468
0 2 4 6 8 10
Chl (ug/L)
Dep
th (m
)
21 21.5 22 22.5
Temperature (C)
Tot
Cyan
Temp
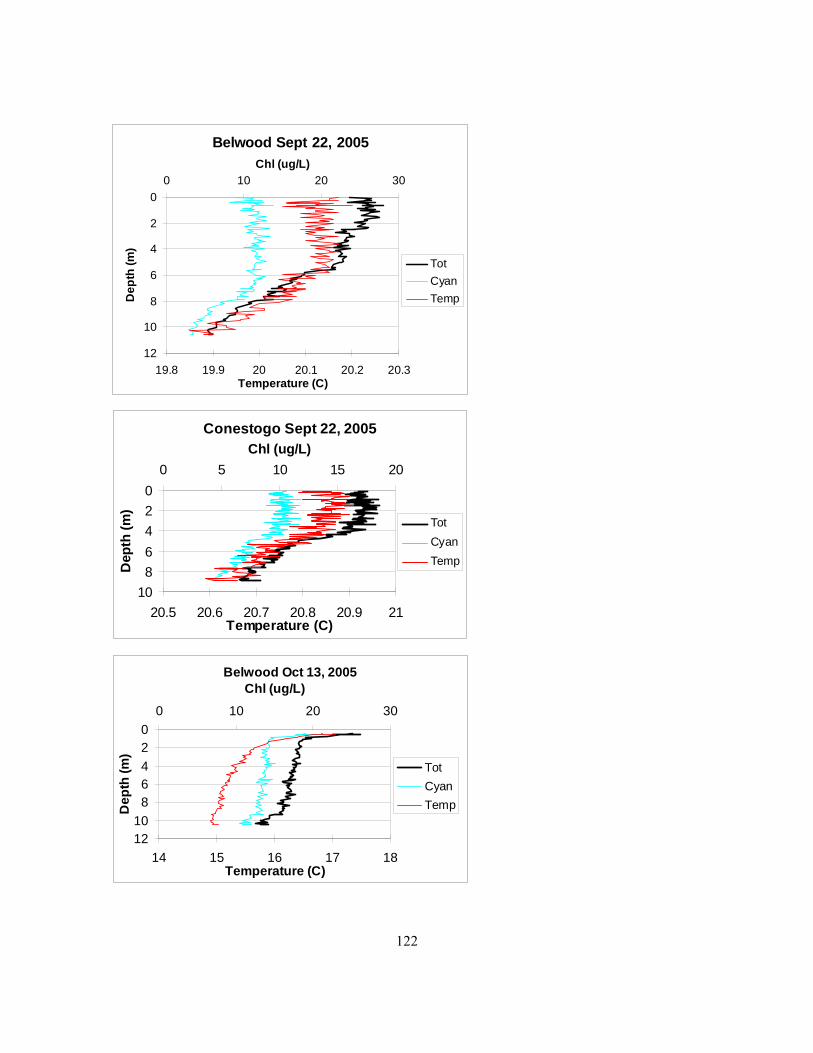
122
Belwood Sept 22, 2005
0
2
4
6
8
10
12
0 10 20 30Chl (ug/L)
Dep
th (m
)
19.8 19.9 20 20.1 20.2 20.3Temperature (C)
TotCyanTemp
Conestogo Sept 22, 2005
02468
10
0 5 10 15 20Chl (ug/L)
Dep
th (m
)
20.5 20.6 20.7 20.8 20.9 21Temperature (C)
TotCyanTemp
Belwood Oct 13, 2005
02468
1012
0 10 20 30
Chl (ug/L)
Dep
th (m
)
14 15 16 17 18Temperature (C)
TotCyanTemp
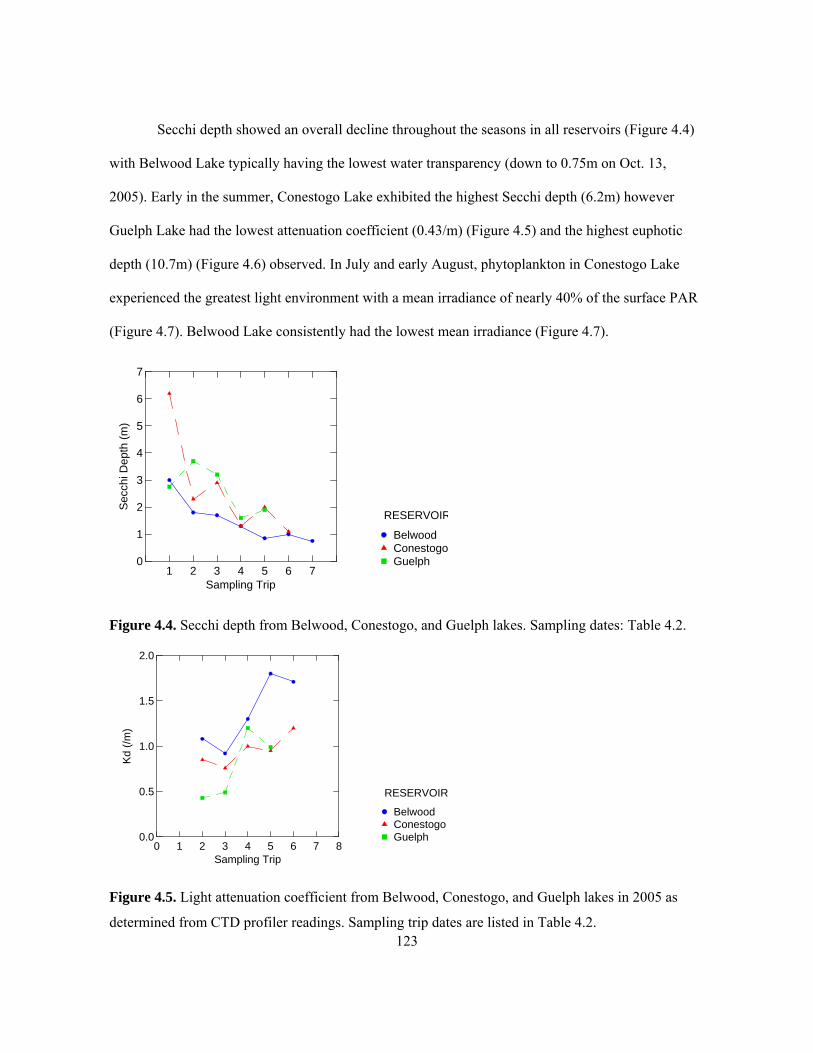
123
Secchi depth showed an overall decline throughout the seasons in all reservoirs (Figure 4.4)
with Belwood Lake typically having the lowest water transparency (down to 0.75m on Oct. 13,
2005). Early in the summer, Conestogo Lake exhibited the highest Secchi depth (6.2m) however
Guelph Lake had the lowest attenuation coefficient (0.43/m) (Figure 4.5) and the highest euphotic
depth (10.7m) (Figure 4.6) observed. In July and early August, phytoplankton in Conestogo Lake
experienced the greatest light environment with a mean irradiance of nearly 40% of the surface PAR
(Figure 4.7). Belwood Lake consistently had the lowest mean irradiance (Figure 4.7).
1 2 3 4 5 6 7Sampling Trip
0
1
2
3
4
5
6
7
Secc
hi D
epth
(m)
GuelphConestogoBelwood
RESERVOIR
Figure 4.4. Secchi depth from Belwood, Conestogo, and Guelph lakes. Sampling dates: Table 4.2.
0 1 2 3 4 5 6 7 8Sampling Trip
0.0
0.5
1.0
1.5
2.0
Kd (/
m)
GuelphConestogoBelwood
RESERVOIR
Figure 4.5. Light attenuation coefficient from Belwood, Conestogo, and Guelph lakes in 2005 as
determined from CTD profiler readings. Sampling trip dates are listed in Table 4.2.

124
0 1 2 3 4 5 6 7 8Sampling Trip
2
3
4
5
6
7
8
9
10
11E
uph o
tic D
epth
(m)
GuelphConestogoBelwood
RESERVOIR
Figure 4.6. Euphotic depth in Belwood, Conestogo, and Guelph lakes in 2005. Sampling trip dates
are listed in Table 4.2.
0 1 2 3 4 5 6 7 8Sampling Trip
0
10
20
30
40
Mea
n Ir r
adia
nce
(% S
urfa
ce P
AR
)
GuelphConestogoBelwood
RESERVOIR
Figure 4.7. Mean irradiance from Belwood, Conestogo, and Guelph lakes in 2005. Dates of sampling
trips are listed in Table 4.2.
4.3.2 Chlorophyll
Extracted chlorophyll a steadily increased in the epilimnia of all three reservoirs throughout the
summer (Figure 4.8) although the chlorophyll decline was captured in Belwood Lake on October 13,
2005. Although all reservoirs had approximately the same chlorophyll levels in early summer, for the

125
rest of the summer Belwood Lake had the greatest epilimnetic chlorophyll concentration followed by
Conestogo Lake and finally Guelph Lake (Figure 4.8). Hypolimnetic chlorophyll levels were much
more similar between the three reservoirs (Figure 4.9) but also showed a net increase throughout the
growing season.
0 1 2 3 4 5 6 7 8Sampling Trip
0
10
20
30
40
50
Epi
limne
tic E
xt. C
hl. a
(ug/
L)
GuelphConestogoBelwood
RESERVOIR
Figure 4.8. Epilimnetic extracted chlorophyll a levels from Belwood, Conestogo, and Guelph lakes
from 2005. All samples were taken at a depth of 2m with the exception of that from Belwood Lake
on trip #7. Sampling trip dates are listed in Table 4.2.
0 1 2 3 4 5 6 7Sampling Trip
0
10
20
30
Hyp
olim
netic
Ex t
. Chl
. a ( u
g/L)
GuelphConestogoBelwood
RESERVOIR
Figure 4.9. Hypolimnetic extracted chlorophyll a from Belwood, Conestogo, and Guelph lakes in
2005. Depths sampled were typically 10m for Belwood Lake, 7m for Conestogo Lake, and 6m for
Guelph Lake. Sampling trip dates are listed in Table 4.2.

126
4.3.3 Phosphorus
The SRP levels show variation between sampling dates but were always relatively low (<5 µg/L)
(Figure 4.10). All three reservoirs had undetectable SRP on Aug. 11 but this was followed by the
peak SRP of each reservoir. Conestogo and Guelph lakes showed their peak measured SRP levels on
August 23, 2005 and Belwood showed its peak on September 5, 2005. TDP displayed a similar
pattern in that Conestogo and Guelph lakes had their highest measured levels on August 23 but
Belwood had its highest level on September 5 (Figure 4.11). Particulate P steadily increased in all
reservoirs until August 11 after which time some fluctuation occurred in all reservoirs (Figure 4.12).
Both epilimnetic and hypolimnetic TP were very similar between reservoirs on the first sampling
date, July 6, 2005 (Figures 4.13 and 4.14). In the hypolimnion, all reservoirs showed a net increase in
TP over the summer but always stayed within the same range, with one exception. On September 5,
2005, Belwood Lake’s hypolimnetic TP was considerably higher at 36 µg/L than the TP of the other
two reservoirs (Figure 4.14). Conestogo and Guelph lakes both had a peak TP of 27 µg/L which was
reached on September 22, 2005 and September 5, 2005, respectively. Epilimnetic TP in Conestogo
and Guelph lakes were similar to each other on all sampling dates and never surpassed 25 µg/L
(Figure 4.13). Belwood Lake showed a dramatic increase in TP which commenced August 23, 2005,
and continued to increase until sampling ceased (Figure 4.13). By October 13, 2005 Belwood Lake
had reached an epilimnetic TP of 54 µg/L (Figure 4.13).

127
0 1 2 3 4 5 6 7 8Sampling Trip
0
1
2
3
4
5SR
P (u
g /L)
GuelphConestogoBelwood
RESERVOIR
Figure 4.10. Epilimnetic soluble reactive P levels from Belwood, Conestogo, and Guelph lakes in
2005. Sampling trip dates are listed in Table 4.2.
0 1 2 3 4 5 6 7 8Sampling Trip
0
10
20
30
40
TDP
(ug/
L)
GuelphConestogoBelwood
RESERVOIR
Figure 4.11. Epilimnetic total dissolved P levels from Belwood, Conestogo, and Guelph lakes in
2005. Sampling trip dates are listed in Table 4.2.

128
0 1 2 3 4 5 6 7 8Sampling Trip
0
5
10
15
20
25P
art P
(ug/
L)
GuelphConestogoBelwood
RESERVOIR
Figure 4.12. Epilimnetic particulate P levels in Belwood, Conestogo, and Guelph lakes in 2005.
Sampling trip dates are listed in Table 4.2.
0 1 2 3 4 5 6 7 8Sampling Trip
10
20
30
40
50
60
Epi
limne
tic T
P (u
g/L)
GuelphConestogoBelwood
RESERVOIR
Figure 4.13. Epilimnetic total P levels in Belwood, Conestogo, and Guelph lakes in 2005. Samples
were always taken from 2m with the exception of the Belwood sample on trip #7. Sampling trip dates
are listed in Table 4.2.
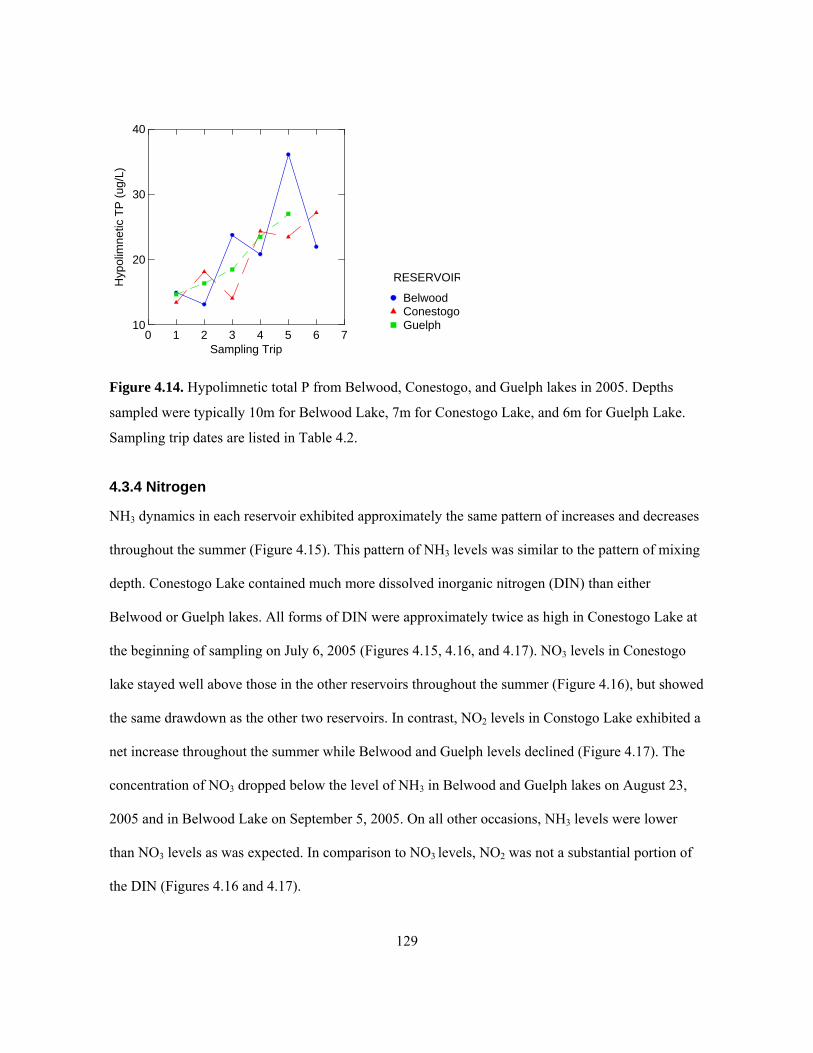
129
0 1 2 3 4 5 6 7Sampling Trip
10
20
30
40H
ypol
imne
ti c T
P (u
g /L)
GuelphConestogoBelwood
RESERVOIR
Figure 4.14. Hypolimnetic total P from Belwood, Conestogo, and Guelph lakes in 2005. Depths
sampled were typically 10m for Belwood Lake, 7m for Conestogo Lake, and 6m for Guelph Lake.
Sampling trip dates are listed in Table 4.2.
4.3.4 Nitrogen
NH3 dynamics in each reservoir exhibited approximately the same pattern of increases and decreases
throughout the summer (Figure 4.15). This pattern of NH3 levels was similar to the pattern of mixing
depth. Conestogo Lake contained much more dissolved inorganic nitrogen (DIN) than either
Belwood or Guelph lakes. All forms of DIN were approximately twice as high in Conestogo Lake at
the beginning of sampling on July 6, 2005 (Figures 4.15, 4.16, and 4.17). NO3 levels in Conestogo
lake stayed well above those in the other reservoirs throughout the summer (Figure 4.16), but showed
the same drawdown as the other two reservoirs. In contrast, NO2 levels in Constogo Lake exhibited a
net increase throughout the summer while Belwood and Guelph levels declined (Figure 4.17). The
concentration of NO3 dropped below the level of NH3 in Belwood and Guelph lakes on August 23,
2005 and in Belwood Lake on September 5, 2005. On all other occasions, NH3 levels were lower
than NO3 levels as was expected. In comparison to NO3 levels, NO2 was not a substantial portion of
the DIN (Figures 4.16 and 4.17).

130
0 1 2 3 4 5 6 7 8Sampling Trip
0
50
100
150N
H3
(ug/
L)
GuelphConestogoBelwood
RESERVOIR
Figure 4.15. Epilimnetic ammonia levels in Belwood, Conestogo, and Guelph lakes in 2005.
Sampling trip dates are listed in Table 4.2.
0 1 2 3 4 5 6 7 8Sampling Trip
0
1000
2000
3000
NO
3 (u
g/L)
GuelphConestogoBelwood
RESERVOIR
Figure 4.16. Epilimnetic nitrate levels in Belwood, Conestogo, and Guelph lakes in 2005. Sampling
trip dates are listed in Table 4.2.

131
0 1 2 3 4 5 6 7 8Sampling Trip
0
10
20
30
40
50
60
70
80N
O2
(ug/
L)
GuelphConestogoBelwood
RESERVOIR
Figure 4.17. Epilimnetic nitrite levels in Belwood, Conestogo, and Guelph lakes in 2005. Sampling
trip dates are listed in Table 4.2.
Particulate N increased in all three reservoirs in similar increments and proportions to
epilimnetic chlorophyll a (Figures 4.18 and 4.8). As with chlorophyll, particulate N was highest in
Belwood Lake, then Conestogo Lake, and finally Guelph Lake. Epilimnetic TN peaked in each
reservoir early in the season (Conestogo: July 6, 2005, 5744 µg/L; Belwood: July 21, 2005, 5340
µg/L; Guelph: July 21, 2005, 4120 µg/L). Following these peaks, TN declined and remained between
440 and 1970 µg/L in all reservoirs at all times (Figure 4.19). From August 11 on, TN was higher in
the hypolimnion than it was in the epilimnion (Figures 4.20 and 4.19).

132
0 1 2 3 4 5 6 7 8Sampling Trip
0
100
200
300
400
500Pa
rtic u
late
N (u
g/L)
GuelphConestogoBelwood
RESERVOIR
Figure 4.18. Epilimnetic particulate N in Belwood, Conestogo, and Guelph lakes in 2005. Sampling
trip dates are listed in Table 4.2.
0 1 2 3 4 5 6 7 8Sampling Trip
0
1000
2000
3000
4000
5000
6000
Epili
mn e
tic T
N ( u
g/L)
GuelphConestogoBelwood
RESERVOIR
Figure 4.19. Epilimnetic total N levels in Belwood, Conestogo, and Guelph lakes in 2005. Samples
were always taken from 2m with the exception of the Belwood sample on trip #7. Sampling trip dates
are listed in Table 4.2.

133
0 1 2 3 4 5 6 7Sampling Trip
0
1000
2000
3000H
ypo l
imne
tic T
N (u
g/L )
GuelphConestogoBelwood
RESERVOIR
Figure 4.20. Hypolimnetic total N levels in Belwood, Conestogo, and Guelph lakes in 2005. Depths
sampled were typically 10m for Belwood Lake, 7m for Conestogo Lake, and 6m for Guelph Lake.
Sampling trip dates are listed in Table 4.2.
4.3.5 Nutrient Ratios
Epilimnetic TN:TP ratios follow nearly the same pattern as epilimnetic TN over the sampling period
(Figures 4.21 and 4.19). TN:TP in the epilimnion was extremely high in July (350 - 1000 molar ratio)
in all reservoirs. In August and September, TN:TP dropped in the epilimnion and Conestogo Lake
consistently had the highest TN:TP followed by Guelph Lake and finally Belwood Lake. In the
hypolimnion, Belwood and Guelph lakes showed a remarkably similar pattern of TN:TP that had a
modest range of 79-105 molar ratio (Figure 4.22). The pattern of TN:TP in the hypolimnion in
Conestogo Lake was distinct from the other two reservoirs and ranged widely from 136 to 388 molar
ratio (Figure 4.22).
Particulate C to N ratios were relatively low in the three reservoirs throughout the sampling
period (Figure 4.23). Belwood Lake C to N ratio were always in the range indicative of no N
deficiency (Guildford et al. 1994). In July and early August, three samples from Conestogo Lake and
two from Guelph Lake were just above the threshold of moderate N deficiency and all other samples
from Conestogo and Guelph reservoirs showed no signs of deficiency. The particulate C to P ratios

134
were relatively high and all indicated some level of P deficiency (Figure 4.24). Belwood Lake
showed signs of extreme P deficiency throughout the entire sampling period. Conestogo Lake seston
had C to P ratios suggesting extreme deficiency on three trips and moderate deficiency on two trips.
Guelph Lake showed extreme P deficiency on July 21 and September 5 but moderate P deficiency in
August.
0 1 2 3 4 5 6 7 8Sampling Trip
0
200
400
600
800
1000
1200
Epili
mne
tic T
N:T
P (m
o lar
)
GuelphConestogoBelwood
RESERVOIR
Figure 4.21. Epilimnetic TN to TP molar ratios from Belwood, Conestogo, and Guelph lakes in
2005. Samples were taken from 2m with the exception of the Belwood sample on trip #7. Sampling
trip dates are listed in Table 4.2.

135
0 1 2 3 4 5 6 7Sampling Trip
0
100
200
300
400H
ypol
imne
tic T
N:T
P ( m
olar
)
GuelphConestogoBelwood
RESERVOIR
Figure 4.22. Hypolimnetic TN to TP molar ratios from Belwood, Conestogo, and Guelph lakes in
2005. Depths sampled were typically 10m for Belwood Lake, 7m for Conestogo Lake, and 6m for
Guelph Lake. Sampling trip dates are listed in Table 4.2.
Figure 4.23. Epilimnetic particulate C to N molar ratios from Belwood, Conestogo and Guelph lakes
from 2005. The line indicates a ratio of 8.3 above which moderate N deficiency is suggested.
Sampling dates can be found in Table 4.2.
0 1 2 3 4 5 6 7 8Sampling Trip
6
7
8
9
10
C:N
(mol
ar)
GuelphConestogoBelwood
RESERVOIR
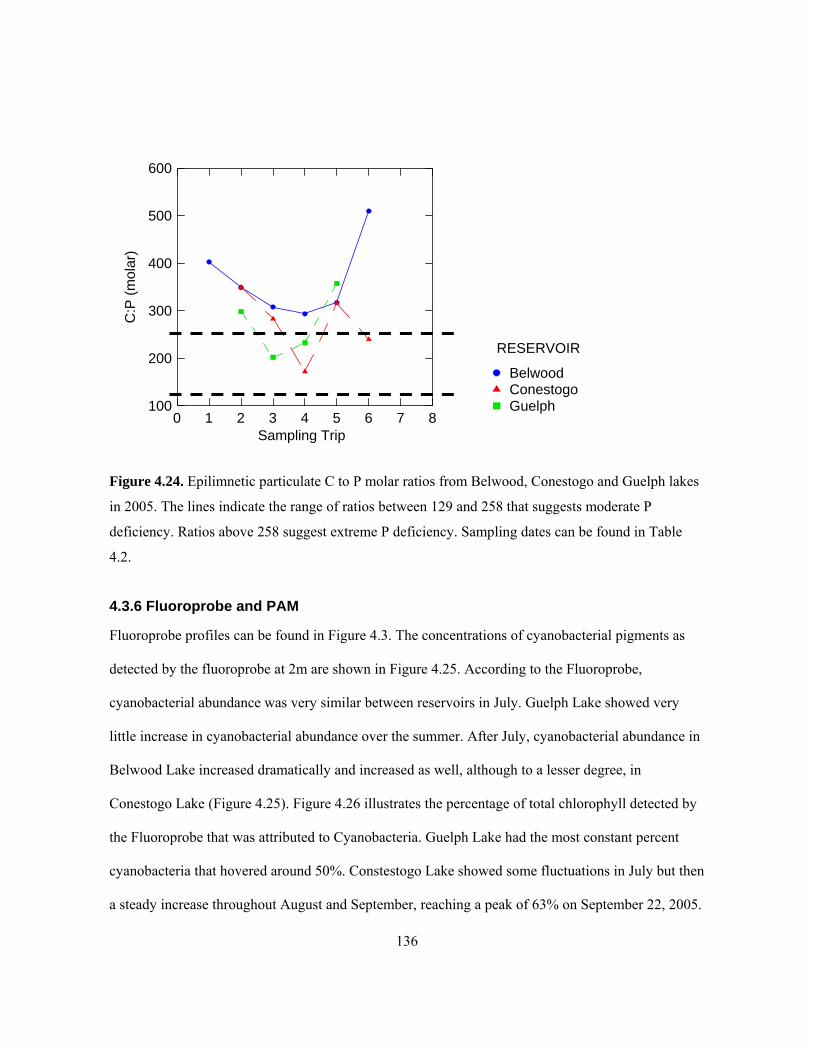
136
Figure 4.24. Epilimnetic particulate C to P molar ratios from Belwood, Conestogo and Guelph lakes
in 2005. The lines indicate the range of ratios between 129 and 258 that suggests moderate P
deficiency. Ratios above 258 suggest extreme P deficiency. Sampling dates can be found in Table
4.2.
4.3.6 Fluoroprobe and PAM
Fluoroprobe profiles can be found in Figure 4.3. The concentrations of cyanobacterial pigments as
detected by the fluoroprobe at 2m are shown in Figure 4.25. According to the Fluoroprobe,
cyanobacterial abundance was very similar between reservoirs in July. Guelph Lake showed very
little increase in cyanobacterial abundance over the summer. After July, cyanobacterial abundance in
Belwood Lake increased dramatically and increased as well, although to a lesser degree, in
Conestogo Lake (Figure 4.25). Figure 4.26 illustrates the percentage of total chlorophyll detected by
the Fluoroprobe that was attributed to Cyanobacteria. Guelph Lake had the most constant percent
cyanobacteria that hovered around 50%. Constestogo Lake showed some fluctuations in July but then
a steady increase throughout August and September, reaching a peak of 63% on September 22, 2005.
0 1 2 3 4 5 6 7 8Sampling Trip
100
200
300
400
500
600
C:P
( mol
ar)
GuelphConestogoBelwood
RESERVOIR
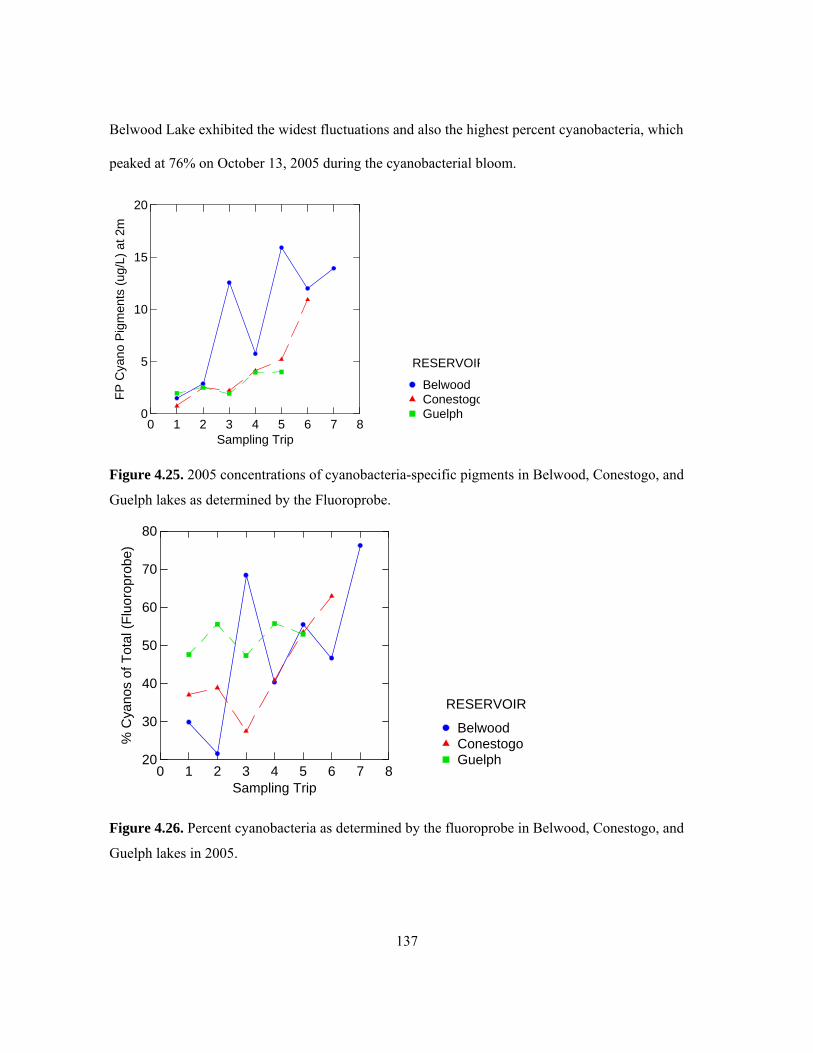
137
Belwood Lake exhibited the widest fluctuations and also the highest percent cyanobacteria, which
peaked at 76% on October 13, 2005 during the cyanobacterial bloom.
0 1 2 3 4 5 6 7 8Sampling Trip
0
5
10
15
20
FP C
yano
Pi g
men
ts (u
g/L)
at 2
m
GuelphConestogoBelwood
RESERVOIR
Figure 4.25. 2005 concentrations of cyanobacteria-specific pigments in Belwood, Conestogo, and
Guelph lakes as determined by the Fluoroprobe.
0 1 2 3 4 5 6 7 8Sampling Trip
20
30
40
50
60
70
80
% C
yano
s of
Tot
al (F
luor
o pro
be)
GuelphConestogoBelwood
RESERVOIR
Figure 4.26. Percent cyanobacteria as determined by the fluoroprobe in Belwood, Conestogo, and
Guelph lakes in 2005.

138
From the Fluoroprobe profiles it can be seen that all reservoirs were strongly stratified on
July 6, 2005 and all had epilimnia of approximately 6m in depth (Figure 4.3). Only Belwood shows a
hypolimnion of uniform depth, however. Guelph and Conestogo lakes exhibit steadily decreasing
temperatures from the bottom of the epilimnion until the profile ends. On July 21, 2005 Conestogo
remained strongly stratified but Belwood and Guelph lakes show a temperature gradient in the
epilimnion. By August 11, 2005, strong stratification had been restored in all three reservoirs. The
August 23, 2005 profiles show the effects of strong winds from the recent storm. Belwood Lake
mixed deeply as did Guelph Lake although Conestogo still possessed a thermocline and shallow
hypolimnion. Stratification was partially restored in all reservoirs by September 5, 2005 and
continued through September 22. When Belwood Lake was profiled on October 13, 2005 the water
column showed some temperature structure and the surface bloom which was comprised mainly of
cyanobacteria is evident from 0 to 1m.
The Fv/Fm values (Figure 4.27) are quite variable temporally and between reservoirs. One
pattern that can be seen is that all three reservoirs had relatively high variable fluorescence on August
23, 2005. This coincides with the major storm and the peak concentrations of TDP and SRP.
0 1 2 3 4 5 6 7 8Sampling Trip
0.1
0.2
0.3
0.4
0.5
Fv/F
m
GuelphConestogoBelwood
RESERVOIR
Figure 4.27. Variable fluorescence (Fv/Fm) as determined by the Diving-PAM in Belwood,
Conestogo, and Guelph lakes in 2005. Sampling trip dates are listed in Table 4.2.

139
4.3.7 Microcystin
Microcystin dynamics, which are illustrated in Figure 4.28, were distinct in each reservoir. The data
presented are total microcystin concentrations (particulate and dissolved) in microcystin-LR
equivalents. Only Belwood Lake surpassed the World Health Organization’s safety threshold level of
1 µg/L (on September 22, 2005). Conestogo Lake had consistently low levels of microcystin which
never exceeded 0.2 µg/L. Guelph Lake exhibited a nearly linear increase in microcystin from July 21
to September 5, 2005 but measured levels still did not exceed 0.6 µg/L. Because sampling past
September 5 did not occur in Guelph Lake possible further increases in microcystin concentrations
were not observed. Microcystin levels in Belwood Lake increased in an exponential fashion from
July 6 to September 22, 2005, after which the microcystin concentration dramatically dropped off.
Linear regression was performed with total microcystin as the dependent variable to identify
statistical relationships. The statistically significant and nearly significant results are listed in Table
4.3. Microcystin had significant positive regressions (P<0.05) with chlorophyll a (Figure 4.29), the
attenuation coefficient, C:P ratios, the cyanobacteria estimate at 2m by the Fluoroprobe, and TP.
Microcystin had significant negative regressions (P<0.05) with TN, the TN:TP ratio, and NO3.
Microcystin had nearly statistically significant negative regressions with DON (P=0.051) and Secchi
depth (P=0.55).
Table 4.3. Summary of linear regressions performed with total microcystin as the dependent
variable. Significant regressions are in bold. Regressions that neared statistical significance are also
listed. ‘Epi. Avg.’= average of entire mixed layer.
Independent Variable R2 P-value Chlorophyll a 0.53 <0.01Kd 0.50 <0.01TN 0.34 <0.05TN:TP 0.30 <0.05C:P 0.28 <0.05NO3 0.28 <0.05FP Cyanos - 2m 0.23 <0.05

140
TP 0.22 <0.05DON 0.23 0.051Secchi 0.21 0.055
0 1 2 3 4 5 6 7 8Sampling Trip
0.0
0.2
0.4
0.6
0.8
1.0
1.2
Tota
l Mic
r ocy
stin
( ug/
L)
GuelphConestogoBelwood
RESERVOIR
Figure 4.28. Total microcystin levels (epilimnetic) in Belwood, Conestogo, and Guelph lakes in
2005. Sampling trip dates are listed in Table 4.2.
GRCA 2005
-0.20
0.00
0.20
0.40
0.60
0.80
1.00
1.20
0 5 10 15 20 25 30 35 40 45 50
Epilimnetic Chl. a (ug/L)
Mic
rocy
stin
(ug/
L)
Figure 4.29. Linear regression of epilimnetic microcystin and epilimnetic chlorophyll in all three
GRCA reservoirs on all dates in 2005, R2=0.53, P<0.01.

141
4.4 Discussion
Because Belwood, Conestogo, and Guelph reservoirs are in close proximity, they experience very
similar climatic influences. Also, because they are all managed by the GRCA, they presumably
experience similar discharge regimes. Many parameters presented here follow a similar pattern in all
three reservoirs. In particular, the same pattern in mixing depth seen in all reservoirs shows the effect
of commonly experienced weather patterns. Comparing these reservoirs is, therefore, valid and
useful, particularly to better understand how and why they differ. Belwood Lake stands out from the
other two reservoirs in that it had the highest microcystin and cyanobacteria levels. Observing which
variables separate Belwood Lake from the other reservoirs could help explain the occurrence of
microcystin and blooms.
4.4.1 Light and Water Column Stability
The steady decline in Secchi depth observed follows the steady increase in chlorophyll a, therefore
water transparency decreases can mainly be attributed to increased phytoplankton biomass and not
suspended sediment. Belwood Lake had the lowest light environment for phytoplankton as indicated
by mean irradiance. Buoyancy-regulating cyanobacteria in Belwood Lake may then have had an
advantage over other phytoplankton if light was limiting as they could migrate closer to the surface
(Ganf and Oliver 1982). In fact, microcystin had a highly significant positive relationship with the
light attenuation coefficient (R2=0.5, P<0.01). Therefore, microcystin-producing cyanobacteria
thrived under low light conditions. This phenomenon has been observed in other studies such as
Sabour and coworkers (2005) who found that the occurrence of an Anabaena bloom coincided with
strong light attenuation.
For the majority of the summer, the water columns of these reservoirs were stratified, which
is a condition known to promote cyanobacteria. It is unlikely that water column stability was
important in controlling cyanobacterial abundance and microcystin levels, however, because all
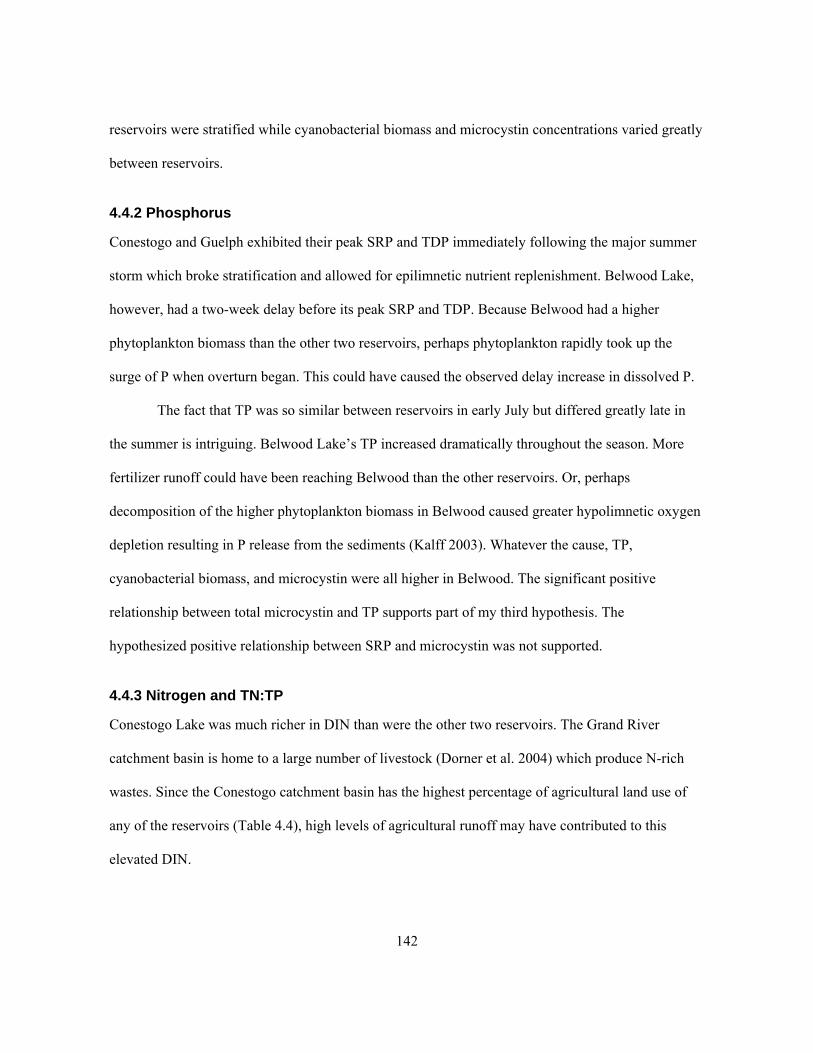
142
reservoirs were stratified while cyanobacterial biomass and microcystin concentrations varied greatly
between reservoirs.
4.4.2 Phosphorus
Conestogo and Guelph exhibited their peak SRP and TDP immediately following the major summer
storm which broke stratification and allowed for epilimnetic nutrient replenishment. Belwood Lake,
however, had a two-week delay before its peak SRP and TDP. Because Belwood had a higher
phytoplankton biomass than the other two reservoirs, perhaps phytoplankton rapidly took up the
surge of P when overturn began. This could have caused the observed delay increase in dissolved P.
The fact that TP was so similar between reservoirs in early July but differed greatly late in
the summer is intriguing. Belwood Lake’s TP increased dramatically throughout the season. More
fertilizer runoff could have been reaching Belwood than the other reservoirs. Or, perhaps
decomposition of the higher phytoplankton biomass in Belwood caused greater hypolimnetic oxygen
depletion resulting in P release from the sediments (Kalff 2003). Whatever the cause, TP,
cyanobacterial biomass, and microcystin were all higher in Belwood. The significant positive
relationship between total microcystin and TP supports part of my third hypothesis. The
hypothesized positive relationship between SRP and microcystin was not supported.
4.4.3 Nitrogen and TN:TP
Conestogo Lake was much richer in DIN than were the other two reservoirs. The Grand River
catchment basin is home to a large number of livestock (Dorner et al. 2004) which produce N-rich
wastes. Since the Conestogo catchment basin has the highest percentage of agricultural land use of
any of the reservoirs (Table 4.4), high levels of agricultural runoff may have contributed to this
elevated DIN.

143
Microcystin showed a significant negative relationship with TN:TP as was hypothesized. In
general, the TN to TP ratios in these reservoirs were not sensitive to changes in TP since the levels of
TN were so high. The decreased TN:TP reflects a substantial drop in TN.
Table 4.4. Breakdown of Belwood, Conestogo, and Guelph watersheds by land type. 2005 data was
used with permission of Luis Leon and originally compiled by Lesley-Ann Chiavaroli.
Watershed Characteristic Belwood Conestogo Guelph Agricultural (%) 80.8 89.9 69.7 Forested (%) 9.2 7 20.7 Water (%) 5.4 2.1 1.7 Wetlands (%) 3.2 0.1 0.4 Urban (%) 1.2 0.8 0.7
4.4.4 Chlorophyll and Fluoroprobe Results
Epilimnetic chlorophyll a had the strongest positive relationship with microcystin that was observed
(R2=0.53, P<0.01). This association is a useful finding which, if confirmed in other years, could be
used to identify lakes in need of microcystin testing.
The percent cyanobacteria, as determined by the Fluoroprobe, in Guelph and Conestogo
lakes declined between July 21 and August 11 while the percent cyanobacteria in Belwood Lake
increased from 22% to 68% during the same period. This occurred when NH3 and NO3 were low in
all reservoirs, but were lowest in Belwood Lake. Perhaps N fixation or migration to N sources by
cyanobacteria gave them an advantage over other types of phytoplankton in Belwood Lake. This is
plausible since microcystin had significant negative relationships with both TN and NO3.
Although percent cyanobacteria was not related to microcystin levels, cyanobacterial
biomass at 2m, as detected by Fluoroprobe, had a significant positive regression with microcystin.
This supports my second hypothesis that higher microcystin levels will be associated with potentially

144
toxic species. Because no microscopic identification was performed on the GRCA samples, no more
is known about the predominant cyanobacterial species present.
4.4.5 Nutrient Status Indicators
Based on the C:N molar ratios, it appears that there was little to no N deficiency in Guelph and
Conestogo lakes and no N deficiency in Belwood Lake. In contrast, the C:P ratios suggest that there
was moderate and extreme P limitation in Guelph and Conestogo lakes and always extreme P
limitation in Belwood Lake. The C:P ratio had a significant positive relationship with microcystin
concentrations. This means that more microcystin was found when phytoplankton was relatively poor
in P. This is contrary to my first hypothesis that cells in favourable growth conditions will be
associated with higher microcystin levels. If lower C:P is correlated with higher growth rate in the
GRCA reservoirs, then this observation suggests that cyanobacteria with slower growth rates
produced more microcystin. This would be contrary to the assertions of some researchers that growth
rate and microcystin production rate are positively related (Oh et al. 2000). However, the microcystin
was relatively low in the reservoirs.
4.5 Conclusion
In these three reservoirs, a gradient of environmental variables was observed between sampling dates
and between reservoirs. This allowed for the comparison of reservoirs and the conditions that
affected microcystin conditions in all of them. Regressions between microcystin and environmental
parameters across all three reservoirs revealed that chlorophyll a (epilimnetic) concentrations
explained the greatest amount of variation in microcystin. Differences in light attenuation, TN,
TN:TP ratios, C:P ratios, NO3, cyanobacterial biomass, and TP also exhibited significant
relationships with microcystin concentrations. Even though it appears that little to no N limitation

145
was occurring, N levels were still associated with microcystin levels. Extreme P limitation was
observed in Belwood Lake, the reservoir with the highest microcystin concentrations.
The major summer storm that occurred in 2005 appears to have strongly affected the
concentrations of nutrients, namely dissolved P and NH3, that were available for phytoplankton
uptake. As this likely affected microcystin concentrations, the potential importance of external
physical drivers must be considered when studying microcystin in a system.
These data suggest that the occurrence of a cyanobacterial surface bloom does not
necessarily indicate worrisome levels of microcystin. However, cyanobacteria with the potential to
produce microcystin do occur in all three of these reservoirs and cyanobacteria were seen to make up
a large portion of the total phytoplankton biomass throughout the summer.

146
Chapter 5 Conclusions
5.1 Summary of Hypothesis Testing for Individual Water Bodies
1) If nutrient status affects microcystin concentrations and favourable growth conditions result in
more microcystin production, then indicators of greater nutrient deficiency will be negatively
associated with microcystin levels.
Using the C:P and C:N seston ratios to indicate nutrient status, all study sites showed
evidence that likely no N limitation was taking place. The C:P ratios suggest that in the GRCA
reservoirs there was moderate and extreme P limitation, in the Bay of Quinte there was moderate P
limitation in July and extreme P limitation in September, and in Maumee Bay there was moderate P
limitation.
Hypothesis #1 was supported by the C to P ratio data from the Bay of Quinte. In July when
C:P indicated moderate P deficiency a mean of 2.3 µg/L microcystin was detected, but in September
when ratios suggested extreme P deficiency the microcystin level was a mere 0.58 µg/L. No
relationship with PAM parameters was seen. A trend suggested that lower C:N ratios were seen when
microcystin concentrations were lower. If this trend is valid, it is in the opposite direction as was
hypothesized.
With the Maumee Bay data no significant differences between sampling dates in C:N ratios,
C:P ratios, or PAM parameters were found.
Data from the Grand River reservoirs show the opposite pattern of what was expected.
Higher microcystin concentrations were associated with higher C:P ratios. This occurred while P
limitation was likely present in all three reservoirs.
147
2) If the abundance of different cyanobacterial groups contributes to microcystin concentrations,
then dominance by particular potentially toxic species will be associated with higher microcystin
concentrations.
In the Bay of Quinte potentially toxic cyanobacterial biomass in general was not associated
with higher microcystin concentrations. It may be that Microcystis in the Bay of Quinte is
particularly toxic and that its biomass is associated with higher microcystin levels but further testing
would be required to address this.
In Maumee Bay increased potentially toxic cyanobacterial abundance (Microcystis) was
associated with higher microcystin levels. One must be cautious, however, to not overemphasize this
result since there were only two time points sampled and one had extremely low phytoplankton
biomass.
In the GRCA reservoirs, microcystin concentrations were positively correlated with
cyanobacterial biomass, but it is not known how much of that cyanobacteria was potential toxin
producers.
3) Greater water column stability, a low N to P ratio, higher SRP and TP, the presence of
dreissenids, and decreased water transparency all promote the production of microcystin and that
they will be positively associated with microcystin concentrations.
Table 5.1 lists several of the above measured parameters and whether or not they were
positively associated with microcystin concentrations. Maumee Bay and the GRCA reservoirs shared
the same pattern of variables which were potential promoters of elevated microcystin concentrations:
low TN:TP, high TP, and low water transparency. The Bay of Quinte showed the opposite pattern
and only high SRP was associated with increased microcystin levels. Although none of the study
sites showed a positive relationship between water column stability and microcystin concentrations,
all of these sites are sheltered and relatively calm.

148
Table 5.1. Summary of variables hypothesized to be associated with higher microcystin
concentrations and the results hypothesis testing.
Association with Higher Microcystin? Variable Bay of Quinte Maumee Bay GRCA Reservoirs
Greater Water Column Stability No No No Decreased TN:TP No Yes Yes Increased SRP Yes No No Increased TP No Yes Yes Decreased Transparency No Yes Yes
The presence of dreissenids was not analyzed, however some observations can be made. The
Bay of Quinte and Maumee Bay both have problems with high Microcystis abundance that is likely
promoted by dreissenids (Nicholls and Hopkins 1993, Nicholls et al. 2002, Vanderploeg et al. 2001).
These bays also had the highest microcystin levels observed in this study. The Grand River reservoirs
are not known to contain dreissenids and they contained much less microcystin than the Bay of
Quinte and Maumee Bay.
5.2 Bloom Formation and Implications for Toxicity
In each of the Bay of Quinte, Maumee Bay, and Belwood Lake a surface cyanobacterial bloom was
observed. These blooms represented a gradient of toxicity, with Belwood Lake’s October 2005
bloom being barely toxic (0.16 ug/L total microcystin, Appendix C), the Bay of Quinte’s July 2006
bloom being moderately toxic (mean total microcystin: 2.25 ug/L, Appendix A) and Maumee Bay’s
August 2006 bloom being the most toxic (mean total microcystin: 4.65 ug/L, Appendix B). The
occurrence of a bloom cannot be used as a proxy for microcystin measurement, although concern
over toxicity is warranted given the high concentration of potentially toxic species. The Bay of
Quinte’s bloom was dominated by Microcystis (97%) but Maumee Bay’s bloom was dominated by a
non-microcystin producer, Aphanizomenon, and had only 22% Microcystis, so even detailed counts
cannot necessarily indicate toxicity.
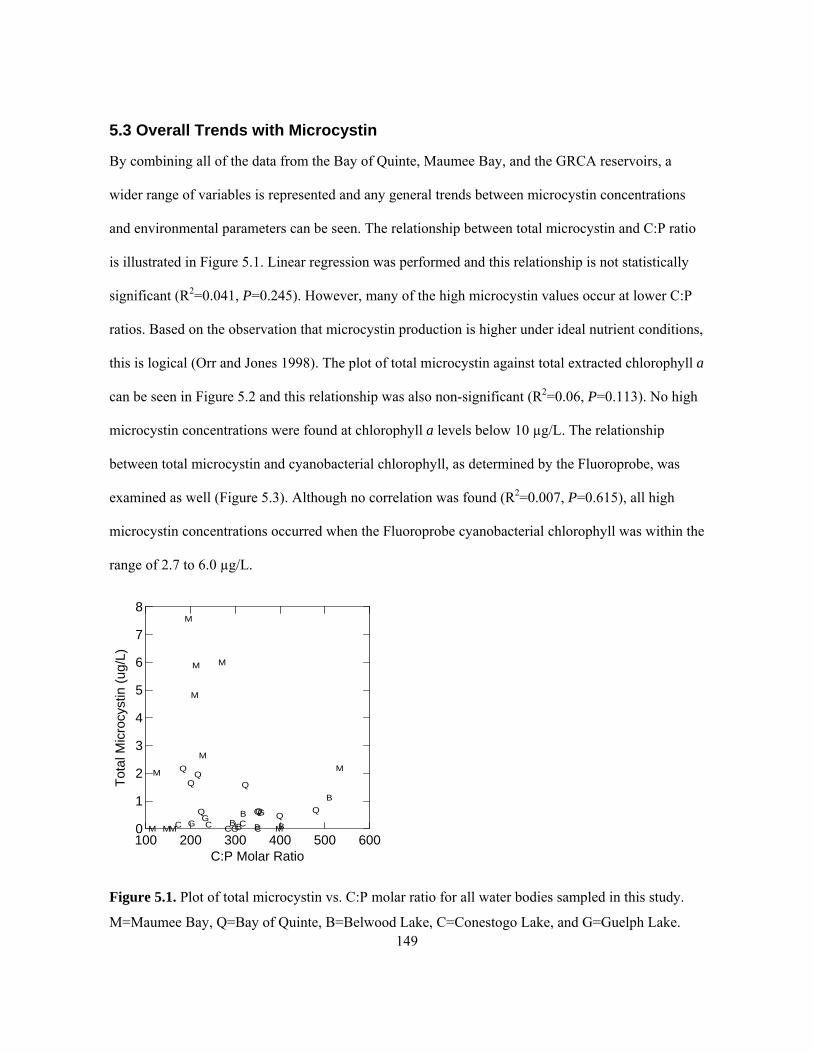
149
5.3 Overall Trends with Microcystin
By combining all of the data from the Bay of Quinte, Maumee Bay, and the GRCA reservoirs, a
wider range of variables is represented and any general trends between microcystin concentrations
and environmental parameters can be seen. The relationship between total microcystin and C:P ratio
is illustrated in Figure 5.1. Linear regression was performed and this relationship is not statistically
significant (R2=0.041, P=0.245). However, many of the high microcystin values occur at lower C:P
ratios. Based on the observation that microcystin production is higher under ideal nutrient conditions,
this is logical (Orr and Jones 1998). The plot of total microcystin against total extracted chlorophyll a
can be seen in Figure 5.2 and this relationship was also non-significant (R2=0.06, P=0.113). No high
microcystin concentrations were found at chlorophyll a levels below 10 µg/L. The relationship
between total microcystin and cyanobacterial chlorophyll, as determined by the Fluoroprobe, was
examined as well (Figure 5.3). Although no correlation was found (R2=0.007, P=0.615), all high
microcystin concentrations occurred when the Fluoroprobe cyanobacterial chlorophyll was within the
range of 2.7 to 6.0 µg/L.
100 200 300 400 500 600C:P Molar Ratio
0
1
2
3
4
5
6
7
8
Tota
l Mic
rocy
stin
( ug/
L)
BBBBB
B
CCC CC GG GG
M MM M
M
M
M
M
M
M
M Q
QQQ
QQQQ Q
Figure 5.1. Plot of total microcystin vs. C:P molar ratio for all water bodies sampled in this study.
M=Maumee Bay, Q=Bay of Quinte, B=Belwood Lake, C=Conestogo Lake, and G=Guelph Lake.

150
0 10 20 30 40 50Chl a (ug/L)
0
1
2
3
4
5
6
7
8To
tal M
icro
cys t
in (u
g/L )
B B B BB
B
BC C CC C CGG G GG
MMMMMM
M
M
M
M
M
M
M Q
QQQ
Q
Q
Q Q QQ QQ
Figure 5.2. Total microcystin plotted against extracted chlorophyll a for all Maumee Bay, Bay of
Quinte, and GRCA data. Symbols are as in Figure 5.1.
0 5 10 15 20Fluoroprobe's Cyano Chl. Estimate (ug/L)
0
1
2
3
4
5
6
7
8
Tota
l Mic
rocy
stin
(ug/
L)
B B BBB
B
BC CC C C CGGG GG
MMM
M
M
M
M
M
M
MQQ
Q
Q
Q Q QQ QQ
Figure 5.3. Total microcystin plotted against the Fluoroprobe’s estimate of chlorophyll attributable
to cyanobacteria for all water bodies in this study. Symbols are as in Figure 5.1.
A nearly significant negative relationship between total microcystin and TN:TP molar ratios
is illustrated in Figure 5.4 (R2=0.118, P=0.063). This graph is presented on a log x-axis to show the
spread of data at lower TN:TP ratios where all of the higher microcystin concentrations occurred.

151
This relationship may not have been very strong because many of the TN:TP ratios encountered were
relatively high whereas the reported optimal N:P ratio for Microcystis spp. is 4.1 (Smith 1982, Rhee
and Gotham 1980). Another nearly significant relationship was observed between total microcystin
and Fv/Fm for all pooled data (Figure 5.5). This positive relationship had an R2 of 0.104 and a P-
value of 0.059. The high microcystin values are clustered around the middle of the x-axis, just above
0.4. High microcystin values did not occur at low Fv/Fm values that are indicative of poor
physiological health. This observation also supports the hypothesis that microcystin production is
greater when phytoplankton are in better physiological condition.
200 400 6008001000
TN:TP Molar Ratio
0
1
2
3
4
5
6
7
8
Tota
l Mic
rocy
stin
( ug/
L)
B BBBB
B
B CCCCCC G GGGG
MMMM M
M
M
M
M
M
M
M
Figure 5.4. Total microcystin plotted against TN:TP molar ratios in all study sites. The x-axis in a
log scale. Symbols are as in Figure 5.1.

152
0.0 0.2 0.4 0.6 0.8 1.0Fv/Fm
0
1
2
3
4
5
6
7
8To
tal M
icro
cyst
in (u
g/L)
BB BBB
BCC CC CG GGG
MMMM
M
M
M
M
M
M
B BB
B
B
BBBBB
Figure 5.5. Total microcystin plotted against Fv/Fm variable fluorescence ratios for all study sites.
Symbols are as in Figure 5.1.
The relationship between total microcystin and TP (Figure 5.6) was the most statistically
significant found. Because of the non-linear nature of this relationship, the logarithms of the
variables are presented. The log plus one transformation was used for total microcystin as some data
points were 0.00 and could not be transformed by log alone. Linear regression on the transformed
data revealed a highly significant relationship with an R2 value of 0.290 and a P-value below 0.001.
This relationship between TP and microcystin is similar to the results of Giani et al. (2005) who
found that TP and TN were the best predictors of microcystin concentrations along a trophic gradient
of southern Quebec lakes. Total microcystin was also significantly related to water temperature
(Figure 5.7), although not as highly as were total microcystin and TP. This positive correlation had
an R2 of 0.131 and a P-value less than 0.05. High microcystin concentrations were typically found
around 25oC with some high levels occurring at temperatures just over 25oC. This slightly exceeds
the general temperature range of 18oC to 25oC in which toxic content was found to be highest in most
studies reviewed by Sivonen and Jones (1999).
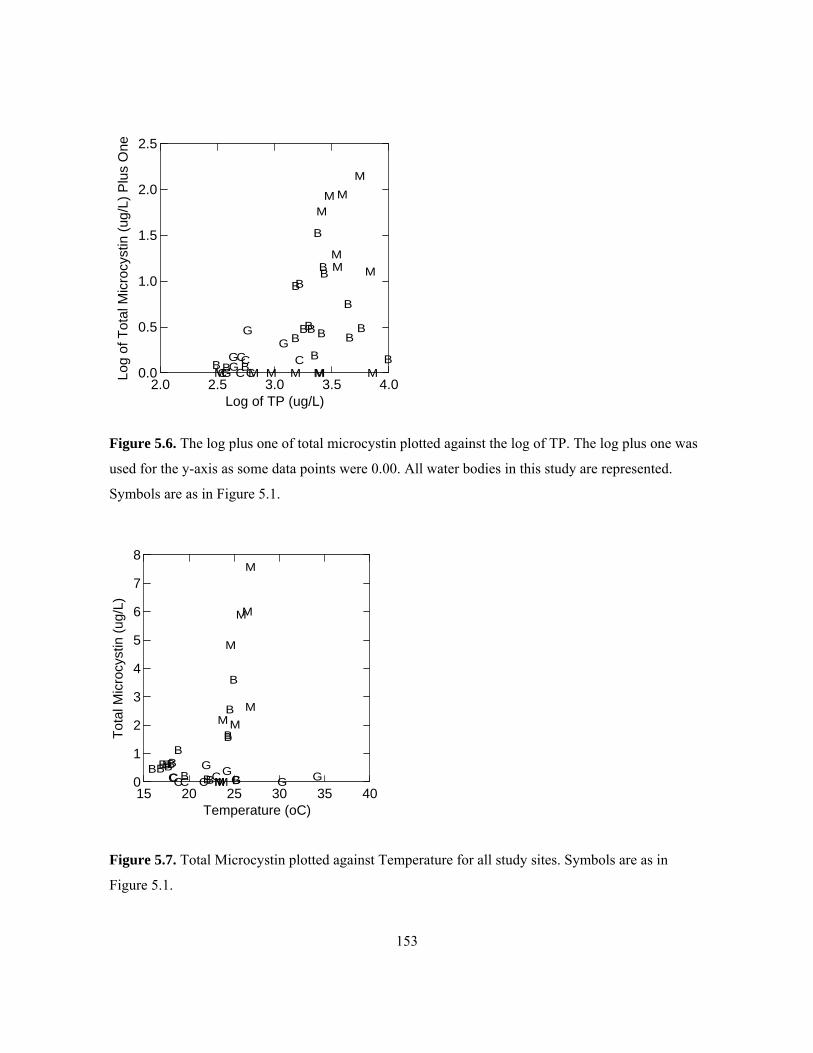
153
2.0 2.5 3.0 3.5 4.0Log of TP (ug/L)
0.0
0.5
1.0
1.5
2.0
2.5Lo
g of
Tot
al M
icro
cyst
in (u
g/L)
Plu
s O
n e
BB BB
B
B
BC CC
CC CGGG
GG
MM MMM M M
M
MM
M
M
M
MBBB
B
B
B BBBBB
Figure 5.6. The log plus one of total microcystin plotted against the log of TP. The log plus one was
used for the y-axis as some data points were 0.00. All water bodies in this study are represented.
Symbols are as in Figure 5.1.
15 20 25 30 35 40Temperature (oC)
0
1
2
3
4
5
6
7
8
Tota
l Mic
r ocy
stin
(ug/
L)
B BBBB
B
C CCC CC G G GGGMMM
M
M
M
M
M
M
MBB
B
B
BBBBBB
Figure 5.7. Total Microcystin plotted against Temperature for all study sites. Symbols are as in
Figure 5.1.

154
5.4 Final Thoughts
Over the water bodies studied, TP was the best predictor of total microcystin concentrations,
explaining 29% of the variation in toxin levels. Total microcystin’s significant relationship with
temperature and its nearly significant relationships with Fv/Fm and TN:TP ratios suggest that
multiple variables were influencing microcystin levels at the same time. A multivariate analysis of
these data is the next logical step. This approach would wisely be applied to future studies as well
due to the complexity of factors that likely affect microcystin production. Because of the risks
associated with microcystin exposure to people, aquatic ecosystems, and terrestrial animals,
consistent microcystin testing is recommended, at least until this toxin’s production is better
understood.

155
Literature Cited
American Public Health Association. 1992. Standard Methods for the Examination of Water and Wastewater. American Public Health Association, Washington.
An J., W. W. Carmichael. 1994. Use of a colorimetric protein phosphatase inhibition assay and enzyme linked immunosorbent assay for the study of microcystins and nodularins. Toxicon 32:1495-1507.
Arnott D. L., M. J. A. Vanni. 1996. Nitrogen and phosphorus recycling by the zebra mussel (Dreissena polymorpha) in the western basin of Lake Erie. Canadian Journal of Fisheries and Aquatic Sciences 53:646-659.
Baganz D., G. Staaks, S. Pflugmacher, and C. E. W. Steinberg. 2004. Comparative study of microcystin-LR-induced behavioral changes of two fish species, Danio rerio and Leucaspius delineatus. Environmental Toxicology 19:564-570.
Bailey R. C., L. Grapentine, T. J. Stewart, T. Schaner, M. E. Chase, J. S. Mitchell, and R. A. Coulas. 1999. Dreissenidae in Lake Ontario: Impact assessment at the whole lake and Bay of Quinte spatial scales. Journal of Great Lakes Research 25:482-491.
Behrenfeld M. J., A. J. Bale, Z. S. Kolber, J. Aiken, and P. G. Falkowski. 1996. Confirmation of iron limitation of phytoplankton photosynthesis in the Equatorial Pacific Ocean. Nature 383:508-511.
Berman T. 2001. The role of DON and the effect of N:P ratios on occurrence of cyanobacterial blooms: Implications from the outgrowth of Aphanizomenon in Lake Kinneret. Limnology and Oceanography 46:443-447.
Billam M., L. L. Tang, Q. S. Cai, S. Mukhi, H. X. Guan, P. W. Wang, Z. M. Wang, C. W. Theodorakis, R. T. Kendall, and J. S. Wang. 2006. Seasonal variations in the concentration of microcystin-LR in two lakes in western Texas, USA. Environmental Toxicology and Chemistry 25:349-355.

156
Blomqvist P., A. Pettersson, and P. Hyenstrand. 1994. Ammonium-nitrogen: A key regulatory factor causing dominance of non-nitrogen-fixing cyanobacteria in aquatic systems. Archiv fur Hydrobiologie.Stuttgart 132:141-164.
Bouaicha N., I. Maatouk, G. Vincent, and Y. Levi. 2002. A colorimetric and fluorometric microplate assay for the detection of microcystin-LR in drinking water without preconcentration. Food and Chemical Toxicology 40:1677-1683.
Bridgeman T. B. 2005. The Microcystis blooms of western Lake Erie (2003-2004). Annual Conference on Great Lakes Research [Ann.Conf.Great Lakes Res.].Vol.48 .
Bronk D. A., P. M. Glibert, and B. B. Ward. 1994. Nitrogen uptake, dissolved organic nitrogen release, and anew production. Science 265:1843-1846.
Budd J. W., A. M. Beeton, R. P. Stumpf, D. A. Culver, and W. C. Kerfoot. 2001. Satellite observations of Microcystis blooms in western Lake Erie. Verhandlungen Internationale Vereinigung fur Theorestische und Angewandte Limnologie 27:3787-3793.
Bur M., J. Deller, D. Einhouse, B. Hass, T. Johnson, J. Markham, C. Murray, L. Rudstam, M. Thomas, B. Trometer, J. Tyson, and L. Witzel. 2002. Report of the Lake Erie Forage Task Group: March 2002. State of New York.
Bykova O., A. Laursen, V. Bostan, J. Bautista, and L. McCarthy. 2006. Do zebra mussels (Dreissena polymorpha) alter lake water chemistry in a way that favours Microcystis growth? Science of the Total Environment 371:362-372.
Carmichael W. W. 1992. Cyanobacteria Secondary Metabolites - the Cyanotoxins. Journal of Applied Bacteriology 72:445-459.
Carmichael W. W., J. An. 1999. Using an Enzyme Linked Immunosorbent Assay (ELISA) and a Protein Phosphatase Inhibition Assay (PPIA) for the Detection of Microcystins and Nodularins. Natural Toxins 7:377-385.
Chorus I., J. Bartram. 1999. Toxic Cyanobacteria in Water: A guide to their public health consequences, monitoring, and management. E & FN Spon, London.

157
Codd G. A., J. Lindsay, F. M. Young, L. F. Morrison, and J. S. Metcalf. 2005. Harmful Cyanobacteria: From mass mortalities to management measures. Pages 1-24 In J. Huisman, H. C. P. Matthijs, and P. M. Visser, editors. Harmful Cyanobacteria, Springer, Dordrecht, The Netherlands.
Conroy J. D., W. J. Edwards, R. A. Pontius, D. D. Kane, H. Zhang, J. F. Shea, J. N. Richey, and D. A. Culver. 2005. Soluble nitrogen and phosphorus excretion of exotic freshwater mussels (Dreissena spp.): potential impacts for nutrient remineralisation in western Lake Erie. Freshwater Biology 50:1146-1162.
Dorner S. M., P. M. Huck, and R. M. Slawson. 2004. Estimating Potential Environmental Loadings of Cryptosporidium spp. and Campylobacter spp. from Livestock in the Grand River Watershed, Ontario, Canada. Environmental Science & Technology 38:3370-3380.
Downing J. A., S. B. Watson, and E. McCauley. 2001. Predicting cyanobacteria dominance in lakes. Canadian Journal of Fisheries and Aquatic Sciences 58:1905-1908.
Engelke C. J., L. A. Lawton, and M. Jaspars. 2003. Elevated microcystin and nodularin levels in cyanobacteria growing in spent medium of Planktothrix agardhii. Archiv fuer Hydrobiologie 158:541-550.
Falconer I. R. 2005. Cyanobacterial toxins of drinking water supplies: cylindrospermopsins and microcystins. CRC Press, Boca Raton.
Falconer I. R. 1993. Mechanism of toxicity of cyclic peptide toxins from blue-green algae. Pages 177-186 In I. R. Falconer, editor. Algal Toxins in Seafood and Drinking Water, Academic Press, Cambridge.
Falkowski P. G., J. A. Raven. 1997. Aquatic photosynthesis, Blackwell Science, Malden, Mass.
Ferber L. R., S. N. Levine, A. Lini, and G. P. Livingston. 2004. Do cyanobacteria dominate in eutrophic lakes because they fix atmospheric nitrogen? Freshwater Biology 49:690-708.
Figueredo C. C., A. Giani, and D. F. Bird. 2007. Does allelopathy contribute to Cylindrospermopsis raciborskii (cyanobacteria) bloom occurrence and geographic expansion? Journal of Phycology
158
43:256-265.
Fontal O. I., M. R. Vieytes, J. M. V. B. de Sousa, M. C. Louzao, and L. M. Botana. 1999. A fluorescent microplate assay for microcystin-LR. Analytical Biochemistry 269:289-296.
Fraleigh P. C., P. L. Klerks, and R. C. Stevenson. 1991. Temporal changes in zebra mussel (Dreissena polymorpha Pall.) veliger densities and veliger settling rates in western Lake Erie near Maumee Bay. Journal of Shellfish Research 10:248.
Ganf G. G., R. L. Oliver. 1982. Vertical separation of light and available nutrients as a factor causing replacement of green algae by blue-green algae in the plankton of a stratified lake. Journal of Ecology 70:829-844.
Genty B., J.M. Briantais, and N.R. Baker. 1989. The relationship between the quantum yield of photosynthetic electron transport and quenching of chlorophyll fluorescence. Biochimica et Biophysica Acta 990:87-92.
Giani A., D. F. Bird, Y. T. Prairie, and J. F. Lawrence. 2005. Empirical study of cyanobacterial toxicity along a trophic gradient of lakes. Canadian Journal of Fisheries and Aquatic Sciences 62:2100-2109.
Goldberg J., H. B. Huang, Y. G. Kwon, P. Greengard, A. C. Nairn, and J. Kuriyan. 1995. 3-Dimensional structure of the catalytic subunit of protein serine/threonine phosphatase-1. Nature 376:745-753.
Graham L. E., L. W. Wilcox. 2000. Algae. Prentice-Hall, Inc., Upper Saddle River, NJ. Grand River Conservation Authority. 1984. Guelph Lake Conservation Area: Times Past to Times Present. Grand River Conservation Authority, Cambridge.
Grand River Conservation Authority. 1980. Reservoirs: Water Quality. GRCA 1:1-91.
Grasshoff K., M. Erhardt, and K. Kremling. 1983. Methods of Seawater Analysis 2.
159
Guildford S. J., L. L. Hendzel, H. J. Kling, E. J. Fee, G. G. C. Robinson, R. E. Hecky, and S. E. M. Kasian. 1994. Effects of lake size on phytoplankton nutrient status. Canadian Journal of Fisheries and Aquatic Sciences 51:2769-2783.
Guildford S. J. and R. E. Hecky. 2000. Total nitrogen, total phosphorus, and nutrient limitation in lakes and oceans: Is there a common relationship? Limnology and Oceanography 45:1213-1223.
Harada K., K. Tsuji. 1998. Persistence and decomposition of hepatotoxic microcystins produced by cyanobacteria in natural environment. Journal of Toxicology: Toxin Reviews 17:385-403.
Hartman WL. 1978. Effects of Exploitation, Environmental Changes, and New Species on the Fish Habitats and Resources of Lake Erie. Report nr 22.
Heresztyn T., B. C. Nicholson. 2001. Determination of cyanobacterial hepatotoxins directly in water using a protein phosphatase inhibition assay. Water Research 35:3049-3056.
Holland R. E., T. H. Johengen, and A. M. Beeton. 1995. Trends in nutrient concentrations in Hatchery Bay, western Lake Erie, before and after Dreissena polymorpha. Canadian Journal of Fisheries and Aquatic Sciences 52:1202-1209.
Holm N. P., D. E. Armstrong. 1981. Role of nutrient limitation and competition in controlling the populations of Asterionella formosa and Microcystis aeruginosa in semicontinuous culture. Limnology and Oceanography 26:622-634.
Holmes R. M., A. Aminot, R. Kerouel, B. A. Hooker, and B. J. Peterson. 1999. A simple and precise method for measuring ammonium in marine and freshwater ecosystems. Canadian Journal of Fisheries and Aquatic Sciences 56:1801-1808.
Honkanen R. E., J. Zwiller, R. E. Moore, S. L. Daily, B. S. Khatra, M. Dukelow, and A. L. Boynton. 1990. Characterization of microcystin-LR, a potent inhibitor of type 1 and type 2A protein phosphatases. Journal of Biological Chemistry 265:19401-19404.
Huisman J., J. Sharples, J. M. Stroom, P. M. Visser, W. E. A. Kardinaal, J. M. H. Verspagen, and B. Sommeijer. 2004. Changes in turbulent mixing shift competition for light between phytoplankton species. Ecology 85:2960-2970.

160
Hyenstrand P., J. S. Metcalf, K. A. Beattie, and G. A. Codd. 2001. Losses of the cyanobacterial toxin microcystin-LR from aqueous solution by adsorption during laboratory manipulations. Toxicon 39:589-594.
Ibelings B. W., L. R. Mur, and A. E. Walsby. 1991. Diurnal changes in buoyancy and vertical distribution in populations of Microcystis in two shallow lakes. Journal of Plankton Research 13:419-436.
Johnson M. G., D. A. Hurley. 1986. Overview of Project Quinte - 1972-82. Pages 1-6 In C. K. Minns, D. A. Hurley, and K. H. Nicholls, editors. Project Quinte: Point-Source Phosphorus Control and Ecosystem Response in the Bay of Quinte, Lake Ontario, Canadian Special Publication of Fisheries and Aquatic Sciences 86, Ottawa.
Jones G. J., P. T. Orr. 1994. Release and degradation of microcystin following algicide treatment of a Microcystis aeruginosa bloom in a recreational lake, as determined by HPLC and protein phosphatase inhibition assay. Water Research 28:871-876.
Kaebernick M., B. A. Neilan. 2001. Ecological and molecular investigations of cyanotoxin production. FEMS Microbiology Ecology 35:1-9.
Kaebernick M., B. A. Neilan, T. Boerner, and E. Dittmann. 2000. Light and the Transcriptional Response of the Microcystin Biosynthesis Gene Cluster. Applied and Environmental Microbiology 66:3387-3392.
Kalff J. 2003. Limnology. Prentice-Hall, Upper Saddle River.
Kardinaal W. E. A., P. M. Visser. 2005. Dynamics of Cyanobacterial Toxins: Sources of variability in microcystin concentrations. Pages 41-64 In J. Huisman, C. P. Matthijs, and P. M. Visser, editors. Harmful Cyanobacteria, Springer, Dordrecht, The Netherlands.
Kearns K. D., M. D. Hunter. 2001. Toxin-producing Anabaena flos-aquae Induces Settling of Chlamydomonas reinhardtii, a competing motile alga. Microbial Ecology 42:80-86.
Kemeny D. M., S. J. Challacombe. 1988. ELISA and Other Solid Phase Immunoassays. John Wiley and Sons, Chichester, Great Britain.

161
Kotak B.G., A.K.-Y. Lam, E.E. Prepas, and S.E. Hrudey. 2000. Role of chemical and physical variables in regulating microcystin-LR concentration in phytoplankton of eutrophic lakes. Canadian Journal of Fisheries and Aquatic Sciences 57:1584-1593.
Lam A. K.-Y., P. M. Fedorak, and E. E. Prepas. 1995. Biotransformation of the cyanobacterial hepatotoxin microcystin-LR, as determined by HPLC and protein phosphatase bioassay. Environmental Science and Technology 29:242-246.
Lambert T. W., M. P. Boland, C. F. B. Holmes, and S. E. Hrudey. 1994. Quantitation of the microcystin hepatotoxins in water at environmentally relevant concentrations with the protein phosphatase bioassay. Environmental Science & Technology 28:753-755.
Levine S. N., D. W. Schindler. 1999. Influence of nitrogen to phosphorus supply ratios and physicochemical conditions on cyanobacteria and phytoplankton species composition in the Experimental Lakes Area, Canada. Canadian Journal of Fisheries and Aquatic Sciences 56:451-466.
Liao C. F. 1977. The effect of nutrient enrichment of nitrogen fixation activity in the Bay of Quinte, Lake Ontario. Hydrobiologia 56:273-279.
Lukac M., R. Aegerter. 1993. Influence of trace metals on growth and toxin production of Microcystis aeruginosa. Toxicon 31:293-305.
Lyck S. 2004. Simultaneous changes in cell quotas of microcystin, chlorophyll a, protein and carbohydrate during different growth phases of a batch culture experiment with Microcystis aeruginosa. Journal of Plankton Research 26:727-736.
MacIsaac H. J. 1996. Potential abiotic and biotic impacts of zebra mussels on the inland waters of North America. American Zoologist 36:287-299.
MacKintosh C., K. A. Beattie, S. Klumpp, P. Cohen, and G. A. Codd. 1990. Cyanobacterial microcystin-LR is a potent and specific inhibitor of protein phosphatases 1 and 2A from both mammals and higher plants. FEBS Letters 264:187-192.
Mazur H., M. Plinski. 2001. Stability of cyanotoxins, microcystin-LR, microcystin-RR and nodularin in seawater and BG-11 medium of different salinity. Oceanologia 43:329-339.

162
McCarthy J. J. 1972. The uptake of urea by natural populations of marine phytoplankton. Limnology and Oceanography 17:738-748.
McElhiney J., L. A. Lawton, and C. Leifert. 2001. Investigations into the inhibitory effects of microcystins on plant growth, and the toxicity of plant tissues following exposure. Toxicon 39:1411-1420.
Meisner K., E. Dittmann, and T. Borner. 1996. Toxic and non-toxic strains of the cyanobacterium Microcystis aeruginosa contain sequences homologous to peptide synthetase genes. FEMS Microbiology Letters 135:295-303.
Minns C. K. 1995. Approaches to assessing and managing cumulative ecosystem change, with the Bay of Quinte as a case study: an essay. Journal of Aquatic Ecosystem Health 4:1-24.
Minns C. K., D. A. Hurley, and K. H. Nicholls. 1986. Project Quinte: Point-Source Phosphorus Control and Ecosystem Response in the Bay of Quinte, Lake Ontario. Canadian Special Publication of Fisheries and Aquatic Sciences 86, Ottawa.
Mountfort, D. P. Holland, J. Sprosen. 2005. Method for detecting classes of microcystins by combination of protein phosphatase inhibition assay and ELISA: comparison with LC-MS. Toxicon 45:199-206.
Mountfort D. O., G. Kennedy, I. Garthwaite, M. Quilliam, P. Truman, and D. J. Hannah. 1999. Evaluation of the fluorometric protein phosphatase inhibition assay in the determination of okadaic acid in mussels. Toxicon 37:909-922.
Nalewajko C., D. R. S. Lean. 1978. Phosphorus kinetics-algal growth relationships in batch cultures. Mitteilungen der internationale Vereinigung fur theoretische und angewandte Limnologie 21:184-192.
Nicholls K. H., L. Heintsch, and E. Carney. 2002. Univariate step-trend and multivariate assessments of the apparent effects of P loading reductions and zebra mussels on the phytoplankton of the Bay of Quinte, Lake Ontario. Journal of Great Lakes Research 28:15-31.
Nicholls K. H., G. J. Hopkins. 1993. Recent changes in Lake Erie (north shore) phytoplankton: Cumulative impacts of phosphorus loading reductions and the zebra mussel introduction.

163
Journal of Great Lakes Research 19:637-647.
Nicholls K. H., L. Heintsch. 1986. A Comparison of the Net Phytoplankton in the Lower Bay of Quinte Near Indian Point, 1945 and 1981. Pages 159-176 In C. K. Minns, D. A. Hurley, and K. H. Nicholls, editors. Project Quinte: Point-Source Phosphorus Control and Ecosystem Response in the Bay of Quinte, Lake Ontario, Canadian Special Publication of Fisheries and Aquatic Sciences 86, Ottawa.
Nicholls K. H., L. Heintsch, and E. C. Carney. 2004. A multivariate approach for evaluating progress towards phytoplankton community restoration targets: Examples from eutrophication and acidification case histories. Aquatic Ecosystem Health & Management 7:15-30.
Niessan W. M. A., J. van der Greef. 1992. Liquid Chromatography- Mass Spectrometry. Marcel Dekker, Inc., New York.
Nizan S., C. Dimentman, and M. Shilo. 1986. Acute toxic effects of the cyanobacterium Microcystis aeruginosa on Daphnia magna. Limnology and Oceanography 31:497-502.
Oh H. M., S. J. Lee, M. H. Jang, and B. D. Yoon. 2000. Microcystin production of Microcystis aeruginosa in P-limited chemostat. Applied Environmental Microbiology. 66:176-179.
Orr P. T., G. J. Jones. 1998. Relationship between microcystin production and cell division rates in nitrogen-limited Microcystis aeruginosa cultures. Limnology and Oceanography 43:1604-1614.
Ozawa K., H. Fujioka, M. Muranaka, A. Yokoyama, Y. Katagami, T. Homma, K. Ishikawa, S. Tsujimura, M. Kumagai, M. F. Watanabe, and H. Park. 2005. Spatial distribution and temporal variation of Microcystis species composition and microcystin concentration in Lake Biwa. Environmental Toxicology 20:270-276.
Pflugmacher S. 2002. Possible allelopathic effects of cyanotoxins, with reference to microcystin-LR, in aquatic ecosystems. Environmental Toxicology 17:407-413.
Porta D., M. A. J. Fitzpatrick, and G. D. Haffner. 2005. Annual variability of phytoplankton primary production in the western basin of Lake Erie (2002-2003). Journal of Great Lakes Research

164
31:63-71.
Porter K. G. 1976. Enhancement of algal growth and productivity by grazing zooplankton. Science 192:1332-1334.
Raikow D. F., O. Sarnelle, A. E. Wilson, and S. K. Hamilton. 2004. Dominance of the noxious cyanobacterium Microcystis aeruginosa in low-nutrient lakes is associated with exotic zebra mussels. Limnology and Oceanography 49:482-487.
Rapala J., K. Erkomaa, J. Kukkonen, K.Sivonen, K. Lahti. 2002. Detection of microcystins with protein phosphatase inhibition assay, high-performance liquid chromatography-UV detection and enzyme-linked immunosorbent assay - Comparison of methods. Anal. Chim. Acta 466:213-231.
Reynolds C. S. 2006. Ecology of Phytoplankton. Cambridge University Press, Cambridge.
Reynolds C. S. 1988. Functional morphology and the adaptive strategies of freshwater phytoplankton. Pages 338-433 In C. D. Sandgren, editor. Growth and Reproductive Strategies of Freshwater Phytoplankton, Cambridge University Press, Cambridge.
Rhee G. -Y., I. J. Gotham. 1980. Optimum N:P ratios and coexistence of planktonic algae. Journal of Phycology 16:486-489.
Rinta-Kanto J. M., A. J. A. Ouellette, G. L. Boyer, M. R. Twiss, T. B. Bridgeman, and S. W. Wilhelm. 2005. Quantification of toxic Microcystis spp. during the 2003 and 2004 blooms in western Lake Erie using quantitative real-time PCR. Environmental Science and Technology 39:4198-4205.
Rippka, R., J. Deruelles, J. Waterbury, M. Herdman, and R. Stanier. 1979. Generic assignments, strain histories and properties of pure cultures of cyanobacteria. Journal of General Microbiology 111:1-61.
Robarts R. D., T. Zohary. 1987. Temperature effects on photosynthetic capacity, respiration, and growth rates of bloom-forming cyanobacteria. New Zealand Journal of Marine and Freshwater Research 21:391-399.
Rott E., H. C. Duthie, and E. Pipp. 1998. Monitoring organic pollution and eutrophication in the Grand River, Ontario, by means of diatoms. Canadian Journal of Fisheries and Aquatic Sciences

165
55:1443-1453.
Sabour B., M. Loudiki, B. Oudra, V. Vasconcelos, S. Oubraim, and B. Fawzi. 2005. Dynamics and toxicity of Anabaena aphanizomenoides (cyanobacteria) waterblooms in the shallow brackish Oued Mellah lake (Morocco). Aquatic Ecosystem Health & Management 8:95-104.
Sarnelle O., A. E. Wilson, S. K. Hamilton, L. B. Knoll, and D. F. Raikow. 2005. Complex interactions between the zebra mussel, Dreissena polymorpha, and the harmful phytoplankter, Microcystis aeruginosa. Limnology and Oceanography 50:896-904.
Schindler D. W. 1977. Evolution of phosphorus limitation in lakes. Science 195:260-262.
Schulze E. -D., M. M. Caldwell. 1994. Ecophysiology of photosynthesis. Springer-Verlag, Berlin.
Sedmak B., T. Elersek. 2005. Microcystins induce morphological and physiological changes in selected representative phytoplanktons. Microbial Ecology 50:298-305.
Sedmak B., G. Kosi. 2002. Harmful cyanobacterial blooms in Slovenia- bloom types and microcystin producers. Acta Biologica Slovenica 45:17-30.
Sim A. T. R., L. Mudge. 1993. Protein phosphatase activity in cyanobacteria: Consequences for microcystin toxicity analysis. Toxicon 31:1179-1186.
Sivonen K. 1990. Effects of light, temperature, nitrate, orthophosphate and bacteria on growth of and hepatoxin production by Oscillatoria agardhii strains. Applied Environmental Microbiology 56:2658-2666.
Sivonen K., G. Jones. 1999. Cyanobacterial Toxins. Pages 41-112 In I. Chorus and J. Bartram, editors. Toxic Cyanobacteria in Water: A Guide to Their Public Health Consequences, Monitoring and Management, E and FN Spon, London.
Smith V. H. 1982. The nitrogen and phosphorus dependence of algal biomass in lakes: An empirical and theoretical analysis. Limnology and Oceanography 27:1101-1112.
166
Stainton M. P., M. J. Capel, and A. J. Armstrong. 1977. The Chemical Analysis of Freshwater. Freshwater Institute, Winnipeg.
Thostrup L., K. Christoffersen. 1999. Accumulation of microcystin in Daphnia magna feeding on toxic Microcystis. Archiv fuer Hydrobiologie 145:447-467.
U.S. Army Engineer District, Buffalo. Maumee Bay State Park, Ohio: Shoreline Erosion, Beach Restoration Study: Volume 2: Appendices. US Army Corps of Engineers; 1983. Report nr 2.
Utkilen H., N. Gjolme. 1995. Iron-stimulated toxin production in Microcystis aeruginosa. Applied and Environmental Microbiology 61:797-800.
Vanderploeg H. A., J. R. Liebig, W. W. Carmichael, M. A. Agy, T. H. Johengen, G. L. Fahnenstiel, and T. F. Nalepa. 2001. Zebra mussel (Dreissena polymorpha) selective filtration promoted toxic Microcystis blooms in Saginaw Bay (Lake Huron) and Lake Erie. Canadian Journal of Fisheries and Aquatic Sciences 58:1208-1221.
Vincent R. K., X. Qin, R. M. L. McKay, J. Miner, K. Czajkowski, J. Savino, and T. Bridgeman. 2004. Phycocyanin detection from LANDSAT TM data for mapping cyanobacterial blooms in Lake Erie. Remote Sensing of Environment 89:381-392.
Vogt C. 1999. Creating Long Documents using Microsoft Word. Published on the Web at the University of Waterloo.
Wiegand C., S. Pflugmacher. 2005. Ecotoxicological effects of selected cyanobacterial secondary metabolites a short review. Toxicology and Applied Pharmacology 203:201-218.
Zurawell R.W., H. Chen, J.M. Burke, and E.E. Prepas. 2005. Hepatotoxic cyanobacteria: a review of the biological importance of microcystins in freshwater environments. Journal of Toxicology and Environmental Health, Part B 8:1-37.

167
Appendix A Bay of Quinte 2006 Dataset
Parameter July 4, 2006
Shallow Deep
Station DS FI NR GPt MBO NA Avg.
Date July 5/06 July 4/06 July 4/06 July 4/06 July 5/06 July 4/06
GPS Latitude 44.188140 44.180230 44.180300 44.170150 44.186800 44.191300
GPS Longitude -77.053642 -77.053300 -77.039950 -77.049690 -77.047370 -77.025810
Sampling Depth (m) 1 1 1 2 2 1
Station Depth (m) 2.4 2 1.7 6 6.1 4.8
Secchi Depth (m) 1.85 2.1 1.5 2.25 1.95 2.08 1.96
SRP (ug/L) 3.4 2.8 2.8 4.0 5.4 3.7 3.68
TDP (ug/L) 11.8 12.4 N/A 13.0 12.7 12.7 12.51
Part P (ug/L) 13.5 9.5 N/A 11.1 10.4 11.8 11.26
TP (ug/L) 30.7 24.1 N/A 25.0 31.0 29.3 28.01
TP (umol/L) 0.991 0.779 N/A 0.807 1.00 0.945 0.90
SrSi (ug/L) 3817 4178 N/A 4121 4141 3162 3883.85
PartSi (ug/L) 978 1388 1452 1012 974 1033 1139.45
NH3 (ug/L) 10.7 21.8 14.8 18.1 28.9 21.8 19.35
NO2 (ug/L) 2.40 3.39 3.06 2.08 3.06 1.75 2.62
NO3 (ug/L) 454.1 5.0 7.7 bdl bdl 3.1 117.45
Part N (ug/L) 151 179 207 135 135 19 137.63
N Arith. (ug/L) 617.7 209.6 232.2 155.0 167.0 45.9
TN (ug/L) 923 1144 1133 978 1006 895 1013.04
TN (umol/L) 65.9 81.7 80.9 69.8 71.8 63.9 72.31
TN:TP (molar) 66.4 105 N/A 86.5 71.7 67.6 79.43
F (ug/L) 62.7 27.5 29.1 29.0 31.1 28.0 34.56
Cl (mg/L) 12.5 7.2 5.6 7.8 7.8 5.2 7.69
SO4 (mg/L 16.0 5.0 3.8 5.2 5.1 3.5 6.41
Ext. Chl (ug/L) 13.76 14.69 16.41 12.31 12.46 12.38 13.67
Part C (ug/L) 954 1185 1562 866 868 156 931.89
Part N (ug/L) 151 179 207 135 135 19 137.63
CN (molar) 7.39 7.71 8.82 7.50 7.50 9.42 8.05
CP (molar) 183 322 N/A 200 216 230.29 Mean Diss. Mcyst (ug/L) 0.61 0.68* 1.16** 0.77* 0.44* 0.92 0.76
CV for Diss. Mcyst 8.67 7.26 10.71 7.38 1.36 5.36 6.79 Mean Total Mcyst (ug/L) 2.17 1.58* 2.55 1.64*** 1.96** 3.60* 2.25
CV for Total Mcyst 9.91 9.23 2.46 20.60 17.43 5.99 10.94
% Dissolved Mcyst 27.88 42.98 45.56 46.79 22.31 25.57 35.18 Part. Mcyst (arith.) ug/L 1.57 0.90 1.39 0.87 1.52 2.68 1.49
Part Mcyst/Chl 0.11 0.06 0.08 0.07 0.12 0.22 0.11
Dark Adapted fv/fm n/a 0.58 0.72 0.78 0.47 0.47 0.60
Etrm n/a 56.6 25.8 196.5 55.1 46.3 76.07
Temp. (oC) n/a 24.31 24.51 24.31 n/a 24.92 24.51
FP Green (ug/L) n/a 0.00 0.07 0.00 n/a 0.00 0.02
FP Cyanos (ug/L) n/a 3.37 4.61 3.38 n/a 4.46 3.95
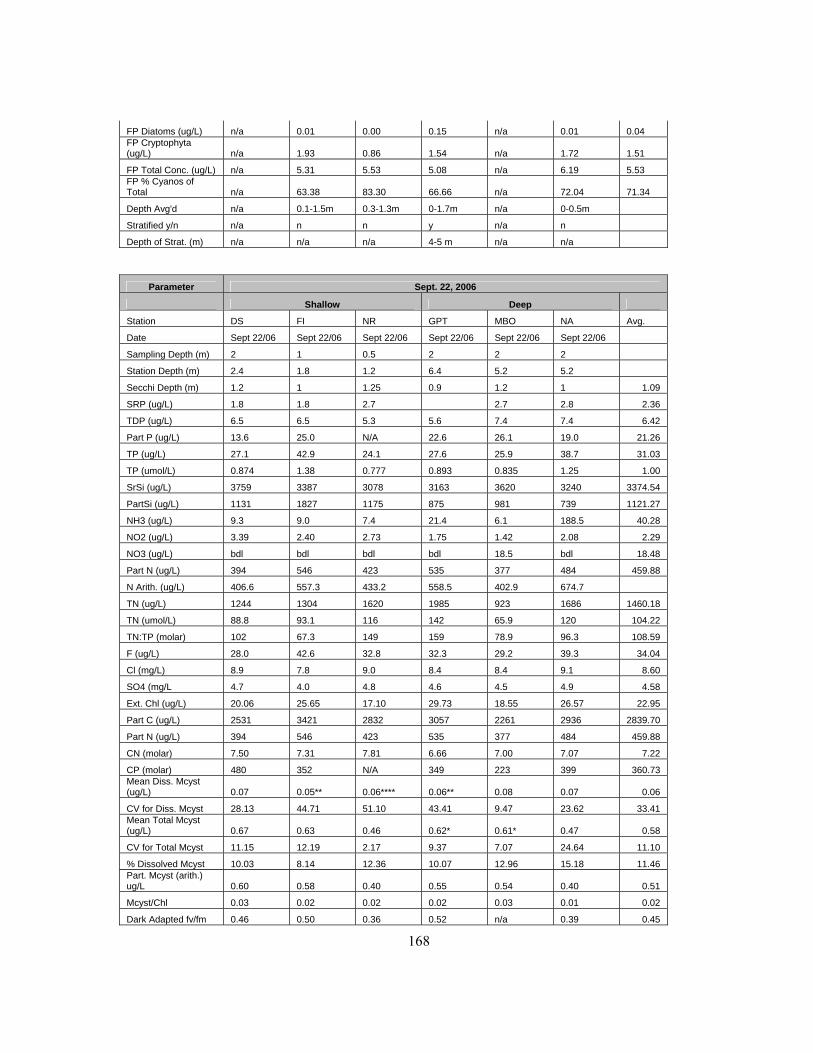
168
FP Diatoms (ug/L) n/a 0.01 0.00 0.15 n/a 0.01 0.04 FP Cryptophyta (ug/L) n/a 1.93 0.86 1.54 n/a 1.72 1.51
FP Total Conc. (ug/L) n/a 5.31 5.53 5.08 n/a 6.19 5.53 FP % Cyanos of Total n/a 63.38 83.30 66.66 n/a 72.04 71.34
Depth Avg'd n/a 0.1-1.5m 0.3-1.3m 0-1.7m n/a 0-0.5m
Stratified y/n n/a n n y n/a n
Depth of Strat. (m) n/a n/a n/a 4-5 m n/a n/a
Parameter Sept. 22, 2006
Shallow Deep
Station DS FI NR GPT MBO NA Avg.
Date Sept 22/06 Sept 22/06 Sept 22/06 Sept 22/06 Sept 22/06 Sept 22/06
Sampling Depth (m) 2 1 0.5 2 2 2
Station Depth (m) 2.4 1.8 1.2 6.4 5.2 5.2
Secchi Depth (m) 1.2 1 1.25 0.9 1.2 1 1.09
SRP (ug/L) 1.8 1.8 2.7 2.7 2.8 2.36
TDP (ug/L) 6.5 6.5 5.3 5.6 7.4 7.4 6.42
Part P (ug/L) 13.6 25.0 N/A 22.6 26.1 19.0 21.26
TP (ug/L) 27.1 42.9 24.1 27.6 25.9 38.7 31.03
TP (umol/L) 0.874 1.38 0.777 0.893 0.835 1.25 1.00
SrSi (ug/L) 3759 3387 3078 3163 3620 3240 3374.54
PartSi (ug/L) 1131 1827 1175 875 981 739 1121.27
NH3 (ug/L) 9.3 9.0 7.4 21.4 6.1 188.5 40.28
NO2 (ug/L) 3.39 2.40 2.73 1.75 1.42 2.08 2.29
NO3 (ug/L) bdl bdl bdl bdl 18.5 bdl 18.48
Part N (ug/L) 394 546 423 535 377 484 459.88
N Arith. (ug/L) 406.6 557.3 433.2 558.5 402.9 674.7
TN (ug/L) 1244 1304 1620 1985 923 1686 1460.18
TN (umol/L) 88.8 93.1 116 142 65.9 120 104.22
TN:TP (molar) 102 67.3 149 159 78.9 96.3 108.59
F (ug/L) 28.0 42.6 32.8 32.3 29.2 39.3 34.04
Cl (mg/L) 8.9 7.8 9.0 8.4 8.4 9.1 8.60
SO4 (mg/L 4.7 4.0 4.8 4.6 4.5 4.9 4.58
Ext. Chl (ug/L) 20.06 25.65 17.10 29.73 18.55 26.57 22.95
Part C (ug/L) 2531 3421 2832 3057 2261 2936 2839.70
Part N (ug/L) 394 546 423 535 377 484 459.88
CN (molar) 7.50 7.31 7.81 6.66 7.00 7.07 7.22
CP (molar) 480 352 N/A 349 223 399 360.73 Mean Diss. Mcyst (ug/L) 0.07 0.05** 0.06**** 0.06** 0.08 0.07 0.06
CV for Diss. Mcyst 28.13 44.71 51.10 43.41 9.47 23.62 33.41 Mean Total Mcyst (ug/L) 0.67 0.63 0.46 0.62* 0.61* 0.47 0.58
CV for Total Mcyst 11.15 12.19 2.17 9.37 7.07 24.64 11.10
% Dissolved Mcyst 10.03 8.14 12.36 10.07 12.96 15.18 11.46 Part. Mcyst (arith.) ug/L 0.60 0.58 0.40 0.55 0.54 0.40 0.51
Mcyst/Chl 0.03 0.02 0.02 0.02 0.03 0.01 0.02
Dark Adapted fv/fm 0.46 0.50 0.36 0.52 n/a 0.39 0.45

169
Etrm 21.3 13.5 26.7 n/a 18.0 19.89
Temp. (oC) 18.15 18.00 15.92 17.07 17.50 16.84 17.25
FP Green (ug/L) 0.00 0.00 0.00 0.00 0.00 0.00 0.00
FP Cyanos (ug/L) 11.10 15.79 12.41 18.78 13.03 17.18 14.71
FP Diatoms (ug/L) 0.00 0.00 0.00 0.00 0.00 0.00 0.00 FP Cryptophyta (ug/L) 1.52 2.63 1.29 2.38 1.80 1.88 1.92
FP Total Conc. (ug/L) 12.62 18.42 13.70 21.16 14.83 19.06 16.63 FP % Cyanos of Total 87.94 85.69 90.63 88.77 87.86 90.13 88.50
Depth Avg'd 0-1.6m 0.3-2.1m 0-0.5m 0-2.2m 0.2-3.2m 0-2.1m
Stratified y/n n overturn start n
overturn start n
overturn start
Depth of Strat. (m) n/a n/a n/a n/a n/a n/a
Bay of Quinte Appendix Legend
Term Used Definition/ Explanation
T Total
SR or Sr Soluble reactive
Part Particulate
Extracted Chl a Average of 2 measurements of extracted chlorophyll a
Diss. Dissolved
Mcyst Microcystin-LR equivalents
CV Coefficient of Variation
Part Mcyst Particulate Microcystin estimated from equation: (Total MCYST - Diss. MCYST)
% Diss. Mcyst Percentage of Total Microcystin made up by Dissolved Microcystin
Fv/Fm PAM: Variable fluorescence (optimal quantum yield)
ETRmax PAM: Maximum electron transport rate (photosynthetic capacity)
FP Fluoroprobe estimate of pigment concentrations
Depth Avg'd Fluoroprobe values were averaged over these depths to represent
the mixed portion of the water column
* Mean from 2 PPIA runs
** Mean from 4 PPIA runs
*** Mean from 5 PPIA runs
**** Mean from 6 PPIA runs
bdl Below detection limit (below 3 ug/L for NO3)

170
Appendix B Maumee Bay 2006 Dataset
Parameter June 20, 2006
Shallow Deep Mean
Station MB19 Clear MB18 MB15 7M 8M Crib
Sampling Depth (m) 1 1 1 1 1 1 1
Station Depth (m) 2.2 2.3 2.6 3 5.5 6 5.8
GPS Latitude (N) 41.72933 41.73324 41.74223 41.70636 41.73345 41.78897 41.70031
GPS Longitude (W) -83.43099 -83.32628 -83.40189 -83.33385 -83.29715 -83.33506 -83.26189
Secchi Depth (m) 0.55 2.3 2.6 3 2.5 3.2 2.7 2.4
Secchi Depth (m) 0.55 2.3 2.6 3 2.5 3.2 2.7 2.4
SRP (ug/L) 29.6 9.5 33.1 12.7 4.3 5.4 n/a 15.8
TDP (ug/L) 47.9 14.1 47.3 18.4 7.2 8.7 13.0 22.4
Part P (ug/L) 15.2 15.2 n/a 2.7 20.3 5.3 14.2 12.2
TP (ug/L) 29.6 19.5 47.3 24.1 12.4 16.7 29.8 25.6
TP (umol/L) 0.954 0.631 1.53 0.779 0.400 0.539 0.964 0.828
SrSi (ug/L) 2054 1319 2086 1513 1533 1221 n/a 1621
PartSi (ug/L) 1967 744 620 610 347 598 n/a 814
NH3 (ug/L) n/a n/a n/a n/a n/a n/a n/a
NO2 (ug/L) 24.0 13.2 38.4 13.2 12.6 10.6 n/a 18.7
NO3 (ug/L) 2076 1322 3096 1547 782.4 871.8 n/a 1616
Part N (ug/L) 88 68 118 24 22 130 n/a 75
DON Arith. (ug/L) n/a n/a n/a n/a n/a n/a n/a
TN (ug/L) 3224 2383 n/a 2106 757 1885 n/a 2071
TN (umol/L) 230 170 n/a 150 54.0 135 n/a 148
TN:TP (molar) 241 270 n/a 193 135 250 n/a 218
F (ug/L) 58.3 61.0 60.8 57.5 34.9 57.0 n/a 54.9
Cl (mg/L) 14.1 11.2 18.2 11.3 9.2 10.1 n/a 12.4
SO4 (mg/L 19.6 15.3 24.8 16.0 13.0 13.7 n/a 17.0
Ext. Chl (ug/L) 0.8902 0.2132 0.4144 0.1607 0.2637 0.1030 n/a 0.3409
Part C (ug/L) 674 857 772 166 164 816 n/a 575
Part N (ug/L) 88 68 118 24 22 130 n/a 75
CN (molar) 8.93 14.69 7.62 8.09 8.63 7.34 n/a 9.22
CP (molar) 114 146 n/a 160 21 398 n/a 168 Mean Diss. Mcyst (ug/L) BDL* BDL BDL* BDL* BDL* BDL* BDL
CV for Diss. Mcyst n/a n/a n/a n/a n/a n/a n/a Mean Total Mcyst (ug/L) BDL BDL BDL BDL BDL BDL BDL*
CV for Total Mcyst n/a n/a n/a n/a n/a n/a n/a
% Dissolved Mcyst n/a n/a n/a n/a n/a n/a n/a Part. Mcyst (arith.) ug/L n/a n/a n/a n/a n/a n/a n/a
Part Mcyst/Chl n/a n/a n/a n/a n/a n/a n/a
Dark Adapted fv/fm 0.52 0.51 0.24 0.21 n/a n/a 0.37
ETRmax 69.7 54.2 14.5 13.6 n/a n/a 38.0
Temp. (oC) n/a n/a n/a n/a 23.39 23.37 23.76 23.50

171
FP Green (ug/L) n/a n/a n/a n/a 0.21 0.08 0.44 0.24
FP Cyanos (ug/L) n/a n/a n/a n/a 0.04 0.06 0.00 0.03
FP Diatoms (ug/L) n/a n/a n/a n/a 0.24 0.14 0.41 0.26 FP Cryptophyta (ug/L) n/a n/a n/a n/a 0.95 0.32 1.34 0.87
FP Total Conc. (ug/L) n/a n/a n/a n/a 1.44 0.60 2.19 1.41 FP % Cyanos of Total n/a n/a n/a n/a 2.86 9.72 0.00 4.20
Depth Avg'd n/a n/a n/a n/a 0.51-2.31m
0.43-2.35m 0.37-1.5m
Stratified y/n n/a n/a n/a n/a y y y
Depth of Strat. (m) n/a n/a n/a n/a 2.3 2.4 2
Parameter Aug. 22, 2006
Shallow Deep Mean
Station MB15 MB18 MB19 Clear 7M 8M Crib
Sampling Depth (m) 0 0 0 1 2 2 2
Station Depth (m) 1.3 1.9 2.2 3.8 5.7 5.8 5.8
GPS Latitude (N) 41.70636 41.74223 41.72933 41.73324 41.73345 41.78897 41.70031
GPS Longitude (W) -83.33385 -83.40189 -83.43099 -83.32628 -83.29715 -83.33506 -83.26189
Secchi Depth (m) 0.6 1.7 1.45 1.6 1.75 1 1.4 1.4
Secchi Depth (m) 0.6 1.7 1.45 1.6 1.75 1 1.4 1.4
SRP (ug/L) 48.9 3.3 19.1 7.8 10.4 14.9 n/a 17.4
TDP (ug/L) 10.9 5.0 19.0 7.7 13.9 15.1 n/a 11.9
Part P (ug/L) 7.2 22.2 33.9 37.0 20.0 20.9 15.6 22.4
TP (ug/L) 34.8 36.3 42.3 30.3 34.5 32.4 46.4 36.7
TP (umol/L) 1.12 1.17 1.36 0.979 1.11 1.05 1.50 1.19
SrSi (ug/L) 2453 1048 1327 665 694 847 n/a 1172
PartSi (ug/L) 1779 729 1177 556 606 618 n/a 911
NH3 (ug/L) 24.6 12.1 23.6 10.3 131.1 29.2 n/a 38.5
NO2 (ug/L) 7.97 8.96 10.6 12.6 5.35 6.99 n/a 8.74
NO3 (ug/L) 481.6 134.8 491.8 10.7 188.5 358.9 n/a 277.7
Part N (ug/L) 240 362 410 541 274 285 102 316.32
DON Arith. (ug/L) 1159 792 806 1869 982 851 n/a 1076
TN (ug/L) 1913 1310 1741 2444 1581 1531 1564 1726
TN (umol/L) 137 93.5 124 174 113 109 112 123
TN:TP (molar) 121 79.8 91.1 178 101 104 74.5 107
F (ug/L) 65.8 30.0 66.4 25.9 38.3 61.4 n/a 48.0
Cl (mg/L) 15.4 6.6 18.0 7.5 4.7 9.3 n/a 10.2
SO4 (mg/L 18.9 9.6 21.7 5.1 6.8 12.9 n/a 12.5
Ext. Chl (ug/L) 11.55 17.27 25.65 28.88 12.55 15.02 10.81 17.39
Part C (ug/L) 1485 2318 2560 2994 1758 1724 755 1942
Part N (ug/L) 240 362 410 541 274 285 102 316
CN (molar) 7.22 7.46 7.29 6.46 7.49 7.06 8.59 7.37
CP (molar) 533 270 195 209 227 212 124 253 Mean Diss. Mcyst (ug/L) 0.17** 0.86** 1.34*** 0.62** 0.40 0.51** 0.40** 0.61
CV for Diss. Mcyst 0.06 0.08 0.06 0.06 0.15 0.10 0.11 0.09 Mean Total Mcyst (ug/L) 2.18 6.00 8.97 4.82 2.64 5.89 2.02** 4.65
CV for Total Mcyst 0.11 0.09 0.05 0.05 0.08 0.08 0.02 0.07

172
% Dissolved Mcyst 7.70 14.38 14.97 12.88 15.08 8.67 19.64 13.33 Part. Mcyst (arith.) ug/L 2.01 5.14 7.63 4.20 2.24 5.38 1.62 4.03
Part Mcyst/Chl 0.17 0.30 0.30 0.15 0.18 0.36 0.15 0.23
Dark Adapted fv/fm 0.50 0.43 0.48 0.40 0.36 0.41 n/a 0.43
Etrm 53.9 52.6 94.6 75.4 38.0 37.7 n/a 58.7
Temp. (oC) 23.73 26.45 26.80 24.60 26.79 25.76 25.08 25.60
FP Green (ug/L) 0.00 0.00 0.05 0.00 0.00 0.00 0.00 0.01
FP Cyanos (ug/L) 6.36 5.47 4.04 4.43 2.69 5.98 4.51 4.79
FP Diatoms (ug/L) 0.01 0.01 0.25 0.00 0.00 0.00 0.05 0.05 FP Cryptophyta (ug/L) 0.79 2.28 1.82 2.13 1.36 2.75 0.66 1.68
FP Total Conc. (ug/L) 7.16 7.76 6.16 6.57 4.06 8.74 5.22 6.52 FP % Cyanos of Total 88.92 70.49 65.64 67.46 66.36 68.48 86.46 73.40
Depth Avg'd 0.59-1.82m
0.61-2.23m 0.1-2.4m 0.13-3.0m 0.6-3.0m
Stratified y/n n n n n y y y?
Depth of Strat. (m) n/a n/a n/a n/a 1 1.2 3
Maumee Bay Appendix Legend Term Used Explanation All as per Bay of Quinte Appendix except for... * Mean from 1 PPIA run ** Mean from 3 PPIA runs *** Mean from 4 PPIA runs

173
Appendix C GRCA Dataset by Date
Belwood Belwood Conestogo Conestogo Guelph Guelph Station # GR5109 GR5110 GR5107 GR5108 GR5105 GR5106 Date 6-Jul-05 6-Jul-05 6-Jul-05 6-Jul-05 6-Jul-05 6-Jul-05 Time (24hr) 11:19:00 11:19:00 8:45:00 9:24:00 13:15:00 13:15:00 Lake Depth (m) 17 17 9 9 10.5 10.5 Sample Depth (m) 2 10 2 7 2 8 pH 8.61 8.69 8.67 Temp. (oC) 22 18.8 25.2 Secchi (m) 3 6.2 2.75 Kd (m-1) Euphotic Depth (m) Mixed Depth (m) 6.69 6.36 5.88 Mean Irradiance (% PAR) FP Chl (ug/L) - 2m 4.96 2 4.12 FP Green (ug/L) - 2m 0 0 0 FP Cyano (ug/L) - 2m 1.48 0.74 1.96 FP Diatoms (ug/L) - 2m 1.32 0.68 1.68 FP Crypto (ug/L) -2m 2.16 0.58 0.48 FP CDOM (ug/L) -2m 2.11 1.09 1.98 FB CDOM - avg. (ug/L) 2.55 1.12 1.7 FP Chl. Avg. (ug/L) 2.70 1.43 3.77 FB Cyano Avg. (ug/L) 0.82 0.44 2.24 Fv/Fm (PAM) 0.228 0.144 0.231 SRP (ug/L) 0.87 0.00 2.49 TDP (ug/L) 16.43 8.19 9.33 PartP (ug/L) 3.78 TP (ug/L) 12.06 14.92 12.70 13.45 14.04 14.70 NH3 (ug/L) 40.5 126.5 63.0 SrSi (ug/L) 1698 881 1730 NO2 (ug/L) 8.26 48.47 22.98 NO3 (ug/L) 1027.9 2277.3 942.8 TN (ug/L) 2505 5744 2491 Ext. Chl. a (ug/L) 7.26 1.28 2.13 0.37 5.17 3.83 TN (mM/L) 178.91 410.26 179.11 TP (mM/L) 0.39 0.48 0.41 0.43 0.45 0.47 TN:TP (molar) 458 1000 398 Norg (ug/L) 1428.06 3291.41 1462.05 Part C (mg/L) 590 333 813 Part N (mg/L) 98.6 44.4 104 C:N (molar) 7.0 8.8 9.1 C:P (molar) 403.1

174
Total Microcystin (ug/L) 0.09 BDL 0.07
# PPIA Runs 3 3 6 CV - Microcystin 0.11 9.60 0.22
Belwood Belwood Conestogo Conestogo Guelph Guelph Station # GR5143 GR5146 GR5144 GR5145 GR5142 GR5147
Date 21-Jul-05 21-Jul-05 21-Jul-05 21-Jul-05 21-Jul-
05 21-Jul-
05
Time (24hr) 10:19:00 10:19:00 8:25:00 8:25:00 12:35:00 12:35:00 Lake Depth (m) 11 11 11 11 7.5 7.5 Sample Depth (m) 2 8 2 7 2 6 pH 8.91 8.91 8.71 Temp. (oC) 25.2 21.6 30.3 Secchi (m) 1.8 2.3 3.7 Kd (m-1) 1.08 0.85 0.43 Euphotic Depth (m) 4.3 5.4 10.7 Mixed Depth (m) 4.51 5.01 5.21 Mean Irradiance (% PAR) 21.2 23.1 39.8 FP Chl (ug/L) - 2m 13.32 6.51 4.52 FP Green (ug/L) - 2m 3.4 0 0 FP Cyano (ug/L) - 2m 2.87 2.53 2.51 FP Diatoms (ug/L) - 2m 2.56 0 0 FP Crypto (ug/L) -2m 4.48 3.98 2.01 FP CDOM (ug/L) -2m 1.37 0.9 1.03 FB CDOM - avg. (ug/L) 1.94 1.24 1.33 FP Chl. Avg. (ug/L) 11.75 6.64 4.06 FB Cyano Avg. (ug/L) 5.74 1.77 2.16 Fv/Fm (PAM) 0.17 0.159 0.329 SRP (ug/L) 0.95 0.44 0.41 TDP (ug/L) 6.02 9.17 6.27 PartP (ug/L) 7.51 8.22 4.86 TP (ug/L) 13.17 13.16 16.26 18.16 13.16 16.39 NH3 (ug/L) 24.1 35.8 31.9 SrSi (ug/L) 1742 1034 1692 NO2 (ug/L) 11.85 41.29 21.54 NO3 (ug/L) 467.4 1821.2 714.8 TN (ug/L) 5340 2546 2991 4120 Ext. Chl. a (ug/L) 9.24 6.82 11.67 4.58 2.1 3.32 TN (mM/L) 381.45 181.83 213.61 294.3 TP (mM/L) 0.42 0.42 0.52 0.59 0.42 0.53 TN:TP (molar) 908 350 362 700 Norg (ug/L) 4837.04 647.46 3351.76 Part C (mg/L) 1016 1115 562 Part N (mg/L) 159 150 80.2 C:N (molar) 7.5 8.7 8.2 C:P (molar) 348.9 349.6 298.3

175
Total Microcystin (ug/L) 0.06 BDL BDL
# PPIA Runs 3 3 3 CV - Microcystin 0.09 5.30 0.69
Belwood Belwood Conestogo Conestogo Guelph Guelph Station # GR5290 GR5295 GR5292 GR5294 GR5291 GR5293 Date 11-Aug-05 11-Aug-05 11-Aug-05 11-Aug-05 11-Aug-05 11-Aug-05 Time (24hr) 11:20:00 11:20:00 8:51:00 8:51:00 13:42:00 13:42:00 Lake Depth (m) 14 14 13 13 8 8 Sample Depth (m) 2 10 2 7 2 6 pH 8.88 9.02 8.66 Temp. (oC) 22.3 19.5* 34.2 Secchi (m) 1.7 2.9 3.2 Kd (m-1) 0.92 0.76 0.49 Euphotic Depth (m) 5.0 6.0 9.5 Mixed Depth (m) 7.37 6.67 5.20 Mean Irradiance (% PAR) 14.8 19.6 36.4 FP Chl (ug/L) - 2m 18.36 8.08 4.08 FP Green (ug/L) - 2m 1.27 1.8 1.32 FP Cyano (ug/L) - 2m 12.56 2.22 1.93 FP Diatoms (ug/L) - 2m 0 2.4 0 FP Crypto (ug/L) -2m 4.53 1.66 0.83 FP CDOM (ug/L) -2m 1.7 0.69 1.01 FB CDOM - avg. (ug/L) 2.02 1.09 1.32 FP Chl. Avg. (ug/L) 14.71 6.08 4.35 FB Cyano Avg. (ug/L) 10.73 1.52 2.29 Fv/Fm (PAM) SRP (ug/L) 0.00 0.00 0.00 TDP (ug/L) 7.61 6.48 5.08 PartP (ug/L) 12.65 10.25 7.66 TP (ug/L) 15.51 23.78 14.85 14.09 13.99 18.50 NH3 (ug/L) 24.9 49.5 45.4 SrSi (ug/L) 1596 1376 1593 NO2 (ug/L) 11.13 48.11 18.67 NO3 (ug/L) 93.0 919.2 457.8 TN (ug/L) 1323 1109 1876 2445 1572 829 Ext. Chl. a (ug/L) 23.84 4.88 14.63 10.2 4.29 6.03 TN (mM/L) 94.51 79.2 133.98 174.65 112.26 59.22 TP (mM/L) 0.5 0.77 0.48 0.45 0.45 0.6 TN:TP (molar) 189 103 279 388 249 99 Norg (ug/L) 1194.03 858.94 1049.73 Part C (mg/L) 1510 1125 600 Part N (mg/L) 245 152 79.9 C:N (molar) 7.2 8.7 8.8 C:P (molar) 307.9 283.0 202.0

176
Total Microcystin (ug/L) 0.07 BDL 0.19
# PPIA Runs 3 3 2 CV - Microcystin 0.11 1.74 0.04
Belwood Belwood Conestogo Conestogo Guelph Guelph Station # GR5299 GR5301 GR5298 GR5300 GR5297 GR5302 Date 23-Aug-05 23-Aug-05 23-Aug-05 23-Aug-05 23-Aug-05 23-Aug-05 Time (24hr) 11:21:00 11:21:00 8:37:00 8:37:00 13:22:00 13:22:00 Lake Depth (m) 11 11 13 13 8.5 8.5 Sample Depth (m) 2 9 2 7 2 6 pH 8.52 8.52 8.36 Temp. (oC) 19.5 18.3 24.2 Secchi (m) 1.3 1.3 1.6 Kd (m-1) 1.30 1.00 1.20 Euphotic Depth (m) 3.7 4.4 3.8 Mixed Depth (m) 11.00 9.68 7.21 Mean Irradiance (% PAR) 7.2 9.9 11.4 FP Chl (ug/L) - 2m 14.2 10.11 7.09 FP Green (ug/L) - 2m 1.84 0.98 0.76 FP Cyano (ug/L) - 2m 5.73 4.12 3.95 FP Diatoms (ug/L) - 2m 0.26 0 0 FP Crypto (ug/L) -2m 6.37 5 2.38 FP CDOM (ug/L) -2m 1.84 1.55 1.45 FB CDOM - avg. (ug/L) 1.91 1.61 1.49 FP Chl. Avg. (ug/L) 12.58 8.73 6.06 FB Cyano Avg. (ug/L) 6.24 3.95 3.70 Fv/Fm (PAM) 0.313 0.477 0.471 SRP (ug/L) 0.08 1.81 3.48 TDP (ug/L) 11.45 13.51 16.15 PartP (ug/L) 14.08 14.72 11.55 TP (ug/L) 28.48 20.85 15.56 24.37 21.73 23.49 NH3 (ug/L) 62.6 70.7 112.6 SrSi (ug/L) 1894 1321 2319 NO2 (ug/L) 4.67 74.67 14.36 NO3 (ug/L) 11.5 938.0 66.7 TN (ug/L) 1084 745 1775 1505 1365 854 Ext. Chl. a (ug/L) 27.09 15.5 16.18 14.4 10.49 8.95 TN (mM/L) 77.46 53.23 126.79 107.53 97.5 61.03 TP (mM/L) 0.92 0.67 0.5 0.79 0.7 0.76 TN:TP (molar) 84 79 254 136 139 80 Norg (ug/L) 1005.65 692.23 1171.37 Part C (mg/L) 1602 983 1042 Part N (mg/L) 265 180 154 C:N (molar) 7.1 6.4 7.9 C:P (molar) 293.4 172.2 232.7

177
Total Microcystin (ug/L) 0.21 0.15 0.38
# PPIA Runs 2 2 1 CV - Microcystin 0.06 0.10 0.04
Belwood Belwood Conestogo Conestogo Guelph Guelph Station # GR5346 GR5349 GR5347 GR5348 GR5345 GR5350 Date 5-Sep-05 5-Sep-05 5-Sep-05 5-Sep-05 5-Sep-05 5-Sep-05 Time (24hr) 8:35:00 8:35:00 13:15:00 13:15:00 10:40:00 10:40:00 Lake Depth (m) 15 15 12 12 10 10 Sample Depth (m) 2 10 2 7 2 6 pH 9.04 8.64 8.64 Temp. (oC) 17.7 23 21.9 Secchi (m) 0.85 2 1.9 Kd (m-1) 1.80 0.95 0.99 Euphotic Depth (m) 2.5 4.8 4.6 Mixed Depth (m) 3.42 2.90 5.88 Mean Irradiance (% PAR) 15.9 33.9 17.1 FP Chl (ug/L) - 2m 28.69 9.73 7.56 FP Green (ug/L) - 2m 0 0 1.12 FP Cyano (ug/L) - 2m 15.91 5.2 4 FP Diatoms (ug/L) - 2m 6.71 0 0.68 FP Crypto (ug/L) -2m 6.07 4.52 1.76 FP CDOM (ug/L) -2m 1.01 0 0.91 FB CDOM - avg. (ug/L) 1.34 0.92 1.17 FP Chl. Avg. (ug/L) 20.89 5.23 6.35 FB Cyano Avg. (ug/L) 11.56 3.42 4.28 Fv/Fm (PAM) 0.155 0.3 0.418 SRP (ug/L) 4.94 1.60 0.92 TDP (ug/L) 34.65 4.70 13.80 PartP (ug/L) 22.49 12.74 10.37 TP (ug/L) 30.24 36.12 14.97 23.49 15.86 27.01 NH3 (ug/L) 17.5 48.9 43.7 SrSi (ug/L) 1982 313 2407 NO2 (ug/L) 1.44 63.90 4.67 NO3 (ug/L) 0.0 924.6 154.1 TN (ug/L) 900 1648 1528 2116 804 1277 Ext. Chl. a (ug/L) 41.2 13.8 20.19 5.13 14.54 12.41 TN (mM/L) 64.3 117.7 109.16 151.13 57.42 91.22 TP (mM/L) 0.98 1.165 0.48 0.76 0.51 0.87 TN:TP (molar) 66 101 227 199 113 105 Norg (ug/L) 881.32 490.89 601.45 Part C (mg/L) 2766 1562 1437 Part N (mg/L) 457 255 214 C:N (molar) 7.1 7.1 7.9 C:P (molar) 317.1 316.1 357.3

178
Total Microcystin (ug/L) 0.54 0.19 0.59
# PPIA Runs 2 2 2 CV - Microcystin 0.14 0.13 0.09
Belwood Belwood Conestogo Conestogo Belwood Station # GR5388 GR5390 GR5387 GR5391 GR5404 Date 22-Sep-05 22-Sep-05 22-Sep-05 22-Sep-05 13-Oct-05 Time (24hr) 11:15:00 11:15:00 8:45:00 8:45:00 10:30:00 Lake Depth (m) 13 13 10.5 10.5 0 Sample Depth (m) 2 6 2 5 0 pH 8.5 8.74 Temp. (oC) 18.8 18.2 Secchi (m) 1 1.1 0.75 Kd (m-1) 1.71 1.20 Euphotic Depth (m) 2.7 3.9 Mixed Depth (m) 5.79 5.09 1.00 Mean Irradiance (% PAR) 10.1 16.4 FP Chl (ug/L) - 2m 25.73 17.37 18.28 FP Green (ug/L) - 2m 0 0.14 0 FP Cyano (ug/L) - 2m 12 10.93 13.93 FP Diatoms (ug/L) - 2m 3.01 0 0 FP Crypto (ug/L) -2m 10.71 6.3 4.34 FP CDOM (ug/L) -2m 1.75 1.3 1.47 FB CDOM - avg. (ug/L) 1.85 1.34 1.61 FP Chl. Avg. (ug/L) 19.38 13.76 17.63 FB Cyano Avg. (ug/L) 10.15 8.68 13.98 Fv/Fm (PAM) 0.182 0.35 0.378 SRP (ug/L) 0.24 0.33 0.44 TDP (ug/L) 9.40 6.47 10.97 PartP (ug/L) 13.11 19.01 22.23 TP (ug/L) 38.17 21.97 24.93 27.20 54.20 NH3 (ug/L) 50.3 81.5 45.1 SrSi (ug/L) 2372 750 2720 NO2 (ug/L) 0.72 63.54 3.23 NO3 (ug/L) 112.7 648.0 85.5 TN (ug/L) 443 2070 1964 813 1658 Ext. Chl. a (ug/L) 46.58 22.67 23.07 17.75 17.75 TN (mM/L) 31.61 58.09 140.27 58.09 118.43 TP (mM/L) 1.23 0.88 0.8 0.71 1.75 TN:TP (molar) 26 66 175 208 68 Norg (ug/L) 278.83 1170.7 1524.3 Part C (mg/L) 2591 1768 Part N (mg/L) 431 340 C:N (molar) 7.0 6.1 C:P (molar) 509.6 239.8

179
Total Microcystin (ug/L) 1.12 0.15 0.16
# PPIA Runs 2 2 3 CV - Microcystin 0.17 0.09 0.06
Related Documents