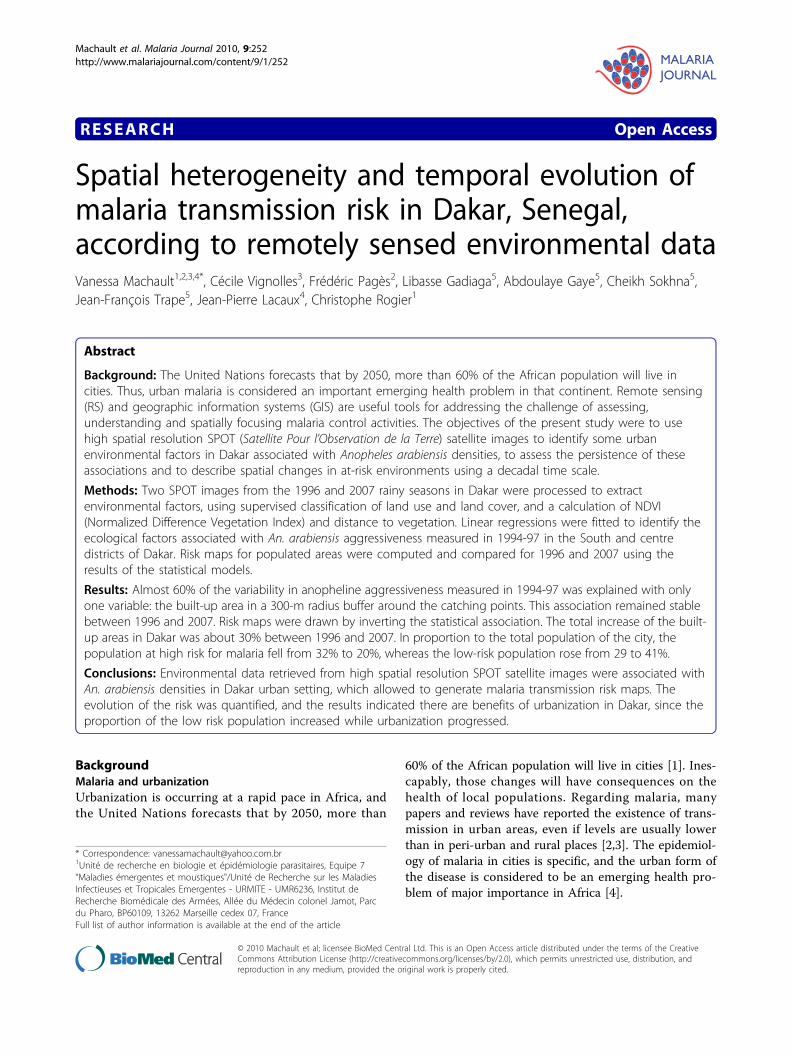
RESEARCH Open Access Spatial heterogeneity and temporal evolution of malaria transmission risk in Dakar, Senegal, according to remotely sensed environmental data Vanessa Machault 1,2,3,4* , Cécile Vignolles 3 , Frédéric Pagès 2 , Libasse Gadiaga 5 , Abdoulaye Gaye 5 , Cheikh Sokhna 5 , Jean-François Trape 5 , Jean-Pierre Lacaux 4 , Christophe Rogier 1 Abstract Background: The United Nations forecasts that by 2050, more than 60% of the African population will live in cities. Thus, urban malaria is considered an important emerging health problem in that continent. Remote sensing (RS) and geographic information systems (GIS) are useful tools for addressing the challenge of assessing, understanding and spatially focusing malaria control activities. The objectives of the present study were to use high spatial resolution SPOT (Satellite Pour l’Observation de la Terre) satellite images to identify some urban environmental factors in Dakar associated with Anopheles arabiensis densities, to assess the persistence of these associations and to describe spatial changes in at-risk environments using a decadal time scale. Methods: Two SPOT images from the 1996 and 2007 rainy seasons in Dakar were processed to extract environmental factors, using supervised classification of land use and land cover, and a calculation of NDVI (Normalized Difference Vegetation Index) and distance to vegetation. Linear regressions were fitted to identify the ecological factors associated with An. arabiensis aggressiveness measured in 1994-97 in the South and centre districts of Dakar. Risk maps for populated areas were computed and compared for 1996 and 2007 using the results of the statistical models. Results: Almost 60% of the variability in anopheline aggressiveness measured in 1994-97 was explained with only one variable: the built-up area in a 300-m radius buffer around the catching points. This association remained stable between 1996 and 2007. Risk maps were drawn by inverting the statistical association. The total increase of the built- up areas in Dakar was about 30% between 1996 and 2007. In proportion to the total population of the city, the population at high risk for malaria fell from 32% to 20%, whereas the low-risk population rose from 29 to 41%. Conclusions: Environmental data retrieved from high spatial resolution SPOT satellite images were associated with An. arabiensis densities in Dakar urban setting, which allowed to generate malaria transmission risk maps. The evolution of the risk was quantified, and the results indicated there are benefits of urbanization in Dakar, since the proportion of the low risk population increased while urbanization progressed. Background Malaria and urbanization Urbanization is occurring at a rapid pace in Africa, and the United Nations forecasts that by 2050, more than 60% of the African population will live in cities [1]. Ines- capably, those changes will have consequences on the health of local populations. Regarding malaria, many papers and reviews have reported the existence of trans- mission in urban areas, even if levels are usually lower than in peri-urban and rural places [2,3]. The epidemiol- ogy of malaria in cities is specific, and the urban form of the disease is considered to be an emerging health pro- blem of major importance in Africa [4]. * Correspondence: [email protected] 1 Unité de recherche en biologie et épidémiologie parasitaires, Equipe 7 “Maladies émergentes et moustiques"/Unité de Recherche sur les Maladies Infectieuses et Tropicales Emergentes - URMITE - UMR6236, Institut de Recherche Biomédicale des Armées, Allée du Médecin colonel Jamot, Parc du Pharo, BP60109, 13262 Marseille cedex 07, France Full list of author information is available at the end of the article Machault et al. Malaria Journal 2010, 9:252 http://www.malariajournal.com/content/9/1/252 © 2010 Machault et al; licensee BioMed Central Ltd. This is an Open Access article distributed under the terms of the Creative Commons Attribution License (http://creativecommons.org/licenses/by/2.0), which permits unrestricted use, distribution, and reproduction in any medium, provided the original work is properly cited.

Welcome message from author
This document is posted to help you gain knowledge. Please leave a comment to let me know what you think about it! Share it to your friends and learn new things together.
Transcript
RESEARCH Open Access
Spatial heterogeneity and temporal evolution ofmalaria transmission risk in Dakar, Senegal,according to remotely sensed environmental dataVanessa Machault1,2,3,4*, Cécile Vignolles3, Frédéric Pagès2, Libasse Gadiaga5, Abdoulaye Gaye5, Cheikh Sokhna5,Jean-François Trape5, Jean-Pierre Lacaux4, Christophe Rogier1
Abstract
Background: The United Nations forecasts that by 2050, more than 60% of the African population will live incities. Thus, urban malaria is considered an important emerging health problem in that continent. Remote sensing(RS) and geographic information systems (GIS) are useful tools for addressing the challenge of assessing,understanding and spatially focusing malaria control activities. The objectives of the present study were to usehigh spatial resolution SPOT (Satellite Pour l’Observation de la Terre) satellite images to identify some urbanenvironmental factors in Dakar associated with Anopheles arabiensis densities, to assess the persistence of theseassociations and to describe spatial changes in at-risk environments using a decadal time scale.
Methods: Two SPOT images from the 1996 and 2007 rainy seasons in Dakar were processed to extractenvironmental factors, using supervised classification of land use and land cover, and a calculation of NDVI(Normalized Difference Vegetation Index) and distance to vegetation. Linear regressions were fitted to identify theecological factors associated with An. arabiensis aggressiveness measured in 1994-97 in the South and centredistricts of Dakar. Risk maps for populated areas were computed and compared for 1996 and 2007 using theresults of the statistical models.
Results: Almost 60% of the variability in anopheline aggressiveness measured in 1994-97 was explained with onlyone variable: the built-up area in a 300-m radius buffer around the catching points. This association remained stablebetween 1996 and 2007. Risk maps were drawn by inverting the statistical association. The total increase of the built-up areas in Dakar was about 30% between 1996 and 2007. In proportion to the total population of the city, thepopulation at high risk for malaria fell from 32% to 20%, whereas the low-risk population rose from 29 to 41%.
Conclusions: Environmental data retrieved from high spatial resolution SPOT satellite images were associated withAn. arabiensis densities in Dakar urban setting, which allowed to generate malaria transmission risk maps. Theevolution of the risk was quantified, and the results indicated there are benefits of urbanization in Dakar, since theproportion of the low risk population increased while urbanization progressed.
BackgroundMalaria and urbanizationUrbanization is occurring at a rapid pace in Africa, andthe United Nations forecasts that by 2050, more than
60% of the African population will live in cities [1]. Ines-capably, those changes will have consequences on thehealth of local populations. Regarding malaria, manypapers and reviews have reported the existence of trans-mission in urban areas, even if levels are usually lowerthan in peri-urban and rural places [2,3]. The epidemiol-ogy of malaria in cities is specific, and the urban form ofthe disease is considered to be an emerging health pro-blem of major importance in Africa [4].
* Correspondence: [email protected]é de recherche en biologie et épidémiologie parasitaires, Equipe 7“Maladies émergentes et moustiques"/Unité de Recherche sur les MaladiesInfectieuses et Tropicales Emergentes - URMITE - UMR6236, Institut deRecherche Biomédicale des Armées, Allée du Médecin colonel Jamot, Parcdu Pharo, BP60109, 13262 Marseille cedex 07, FranceFull list of author information is available at the end of the article
Machault et al. Malaria Journal 2010, 9:252http://www.malariajournal.com/content/9/1/252
© 2010 Machault et al; licensee BioMed Central Ltd. This is an Open Access article distributed under the terms of the CreativeCommons Attribution License (http://creativecommons.org/licenses/by/2.0), which permits unrestricted use, distribution, andreproduction in any medium, provided the original work is properly cited.
The urban malaria burden, as well as its spatial andtemporal distribution, is closely related to a wide rangeof factors, such as the degree and type of urbanization,the density of the human population, vector controlmeasures, access to health care [2,5] and adaptation ofthe vector to new or polluted breeding sites [6-9]. Urba-nization has a great impact on the composition of thevector system and malaria transmission dynamics [10].Moreover, in urban settings, blood meal sources areabundant, dispersion of the vectors is low and malariatransmission is highly driven by the proximity of breed-ing sites [11,12]. Malaria risk is heterogeneous oversmall distances, and transmission can vary among differ-ent districts of the same city, as shown in Brazzaville[13] and Dakar [14].
Malaria and remote sensingRisk maps can be useful for decision-makers who areseeking to address the challenge of assessing, under-standing and spatially focusing malaria control activities[15]. Over the last several decades, remote sensing (RS)and geographic information systems (GIS) have becomepopular tools for evaluating the environmental, meteor-ological and climatic factors leading to the geographicaland temporal distribution of malaria risk [16-20]. Themajority of studies have been conducted in rural set-tings, but some research has focused on cities. Forexample, previous studies have conducted direct andindirect identification of Anopheles breeding sites,sought to predict malariometric indices and assessedimpact of environmental changes on malaria risk[21-24].
Malaria in DakarIn Dakar, the capital city of Senegal, parasite rates andincidences of clinical malaria attacks in the city and itsperiphery have been at low levels relative to continent-wide rates [2,11,25,26]. Nevertheless, some malaria caseshave been recognized as autochthonous [26], and severecases have been reported [27-29]. Additionally, placentalmalaria infections have been associated with preeclamp-sia in pregnant women with poor malaria immunity[30]. In this clinical context, local malaria transmissionhas been studied for several decades and has beenassessed in Dakar [14,31] and its close suburb Pikine[11,32].
ObjectivesThe objectives of the present study were to use highspatial resolution SPOT (Satellite Pour l’Observation dela Terre) satellite images to identify some urban envir-onmental factors associated with Anopheles arabiensisdensities in Dakar, to assess the persistence of these
associations and to describe spatial changes in at-riskenvironments at a decadal time scale.
MethodsStudy siteDakar (14°40’20” North, 17°25’22” West), the capital cityof Senegal, is located in the Cap-Vert peninsula at thewesternmost point of Africa. The altitude peaks at 104m above sea level (Mamelles). The climate is mild sahe-lian. The hot and wet season lasts from June to Novem-ber with average temperatures between 24 and 30°C.The cool and dry season lasts from December to Maywith average temperatures between 19 and 25°C. Thefirst rains generally occur at the end of June or thebeginning of July, and the last ones at the beginning ofOctober. In 1994, 1996 and 2007, the annual rainfallswere 252, 350 [25,26] and 178 mm (data from thenational weather forecast), respectively. The estimatedpopulation of the Dakar urban area was close to 1 mil-lion inhabitants in 2005, accounting for about 20% ofthe country’s population. The population density wasabout 12,000 inhabitants per km2.
Entomological data from the literaturePart of the entomological data used in the present studywere from two studies of Diallo et al, which were con-ducted in both the south [25] and centre [26] sanitarydistricts of Dakar, and published in 1998 and 2000,respectively.The first paper described entomological fieldwork
from June 1994 to May 1995 in 13 sites, and the secondpaper reported mosquito prospecting from March 1996to February 1997 in 12 sites. In both studies, each sitewas 1.5 km (North-South) and 1 km (East-West) distantfrom the adjacent ones. Adult mosquito sampling wascarried out once every month during the studied periodby human landing catch, both indoors (one catchingpoint) and outdoors (one catching point).In the southern district, a total of 308 person/nights of
adult mosquito captures were undertaken. Among the16 637 females collected, 83 (0.5%) were Anopheles, 81were An. arabiensis and two were Anopheles pharoensis.Anopheles arabiensis densities were low, peaking at 1.76bites per person per night in October 1994 (mean valuefor all sites). In the centre district, a total of 308 person/nights of capture were also conducted. Among 6 157collected female mosquitoes, 92 (1.5%) were Anopheles,and all of them were An. arabiensis. Maximum aggres-siveness was 2.25 bites per person per night in Septem-ber 1996 (mean value for all sites). In both districts,none of the An. arabiensis were CSP antigen positive.For the purpose of the present study, the mean num-
ber of An. arabiensis bites per person per night for both
Machault et al. Malaria Journal 2010, 9:252http://www.malariajournal.com/content/9/1/252
Page 2 of 14
of the 12-month study periods was considered and here-after is called the “1994-97 aggressiveness”. Each sitewas surveyed between 22 and 24 nights so the full trans-mission season (September-October) was covered. Thus,even if the study periods for the two sanitary districtswere a little bit staggered, it was considered that the fig-ures from the two studies were comparable.
Field entomological data collectionThe field work in the present study has been describedelsewhere [14]. Briefly, it was conducted in Dakar andPikine, a nearby suburb. The studied sites were sampledin order to cover as many diverse environments as pos-sible in terms of type of urbanization and vegetation.The results for nine studied areas are reported in thepresent paper. Adult mosquito sampling was carried outonce every two weeks during September and October2007. Human landing catch of adult mosquitoes wasconducted both indoors (one catching point) and out-doors (two catching points) for a total of four nights ofcapture in each of the studied areas. Published An. ara-biensis densities were calculated as the mean aggressive-ness for two months of mosquito collection [14]. Inorder to compare those data with the data from the cen-tre and south districts, aggressiveness values were aver-aged over a 12-month period for the present study,assuming that most of the annual Anopheles density wascaught during the September-October period.
Geolocation of study sitesThe geolocations of the catching points of the south andcentre districts were not reported in the published arti-cles. Therefore, a member of the team who had partici-pated in the fieldwork in 1994-95 and 1996-97 wentback to the capture houses with a GPS (global position-ing system) receiver to record appropriate geographiccoordinates. Between both districts, 22 sites out of 25were successfully geolocated on the ground, and threepoints were approximated. The “Hann - Village” and“Caserne Gendarmerie de Potou” catching houses couldnot be relocated, so the point was located in the neigh-bourhood. In “Bop-CerfVolant”, the slum existing in1996-97 was destroyed, so the point was set in the for-merly built-up area identified on available aerial photo-graphs from 1997. For the 2007 sites, precise geographiccoordinates were available for every capture location.The geographic centre of the three catching points wasused for each of the nine sites as the unique location. Adescription of all the sampled areas is available in thethree original articles.
Satellite images and aerial photographsSPOT View imagery products were acquired for the fol-lowing dates: 30 October 1996 and 26 September 2007.
Images were “Level 3” pre-processed (orthoimages), sothey were already georeferenced, and their map projec-tion (UTM zone 28, WGS 84 datum) was based onground control points and a digital elevation model(DEM). The location accuracy of the images was lessthan 10 m [33]. For 1996, the SPOT-4 image had a 20-m spatial resolution and three spectral bands: two in thevisible (green and red) and one in the near infrared(NIR). For 2007, one SPOT-5 image had a 2.5-m spatialresolution and the same three spectral bands than the1996 image. A second SPOT-5 image had one band at a10-m spatial resolution for short wave infrared (SWIR).These SPOT images covered a large area of the Cap-Vert Peninsula, so views were resized to cover Dakarcity and its suburbs until Pikine (lower left corner: 17°31’44"W 14°38’44"N; upper right corner: 17°23’21,95"W14°47’26,23"N).A panchromatic QuickBird image (0.61 m resolution,
projection UTM zone 28, WGS 84 datum) from 2005was also available for the studied urban area. Finally,aerial photographs from 1997 were scanned from paperat the “IGN France International - Bureau de Coordina-tion Projet Cartographie du Sénégal 1/200 000” inDakar. Quickbird image and aerial photographs weregeoreferenced on the SPOT images using control pointsin ENVI 4.3 (ITTVIS software). QuickBird image andaerial photographs were used for visual support only,whereas SPOT images were processed for the analysis.
Pre-processing of SPOT imagesAll image processing was conducted with ENVI 4.3. Acommon mask of the sea was digitized and applied toall the images, whereas specific cloud masks were digi-tized for each date. Clouds and their shadows covered379 Ha on the 2007 image but did not hide any of theentomological sampling zones. No clouds were observedin the studied zone on the 1996 image. To reach theobjective of comparing images of different spatial resolu-tions, the 2007 views were resampled at 20 m, averagingvalues of the pixels contributing to the output pixel.Both resulting images were stacked to produce a newmultiband image encompassing the full spectral resolu-tion, hereafter called the 2007 image. Because compari-sons of multi-date images could be impeded bydifferences in atmospheric conditions from one date toanother, internal average relative reflectance (IARR) cali-bration was undertaken to normalize images to a sceneaverage spectrum [34,35]. All further image processingwas based on these calibrated images.
NDVI and distance to vegetationThe NDVI is the ratio of two spectral bands available inSPOT imagery and is calculated as follow: NDVI = (NIR- Red)/(NIR + Red). The result can range from -1 to +1,
Machault et al. Malaria Journal 2010, 9:252http://www.malariajournal.com/content/9/1/252
Page 3 of 14
where high values correspond to a dense and activevegetation cover. The NDVI images were calculatedfrom both the 1996 and 2007 images. A threshold of 0.1was used to best separate vegetated from non-vegetatedpixels and to produce binary images for 1996 and 2007.This step was conducted by an operator with goodknowledge of Dakar city, who was aided by the exami-nation of the QuickBird image and the aerial photo-graphs. To eliminate isolated pixels, a majority filter wasapplied to the resulting binary images. All pixels werereplaced by the majority class in a passing window (62.5× 62.5 m).
Land use and land cover classificationVarious classification techniques were investigated.Unsupervised classification (ISODATA) was ignored asmany confusions occurred, e.g., between water and darkasphalt. Supervised maximum likelihood classificationwas chosen to generate maps of land use and landcover. Each pixel was assigned to the class having thehighest probability to be the correct one based on a setof training areas. No exclusion threshold was defined, soevery pixel of the studied zone was classified.Training polygons were digitized by an operator with
good knowledge of the town who photo-interpreted andexamined the SPOT and QuickBird images and aerialphotographs. Separability of the different classes wasregularly computed to assist the definition of the poly-gons. Training sets were chosen exclusively where novisible land changes occurred between 1996 and 2007.Thus classifications were done in 1996 and 2007 withthe same training polygons, which should maximize thecomparability of the results. Three-hundred forty-ninetraining polygons were digitized in the 1996 and 2007images. They covered 127 ha, representing about 1% ofthe total zone (excluding the sea). Thirteen land coverclasses were defined, which were distributed as fiveurban classes (depending of the type of buildings andsoils), one vegetation class, one water class and six baresoil classes (asphalt, sand, other types of soils, mixed ornot with vegetation) (Additional File 1).The quality of the resulting supervised classified
images was assessed by calculating the kappa statistics,which provide a measurement of the agreement betweenthe classes issued from the classification and the trainingpolygons. The majority filter (62.5 × 62.5 m) was alsoapplied to the resulting images to eliminate isolated pix-els. The sea coast was masked as the classification qual-ity was low for this particular land cover.
Geographic information system (GIS)A GIS was built in ArcGIS 9.2 (Environmental ResearchSystems Institute, Redlands, CA). The layers were addedas follows: map of vegetation (corresponding to the
filtered map of NDVI > 0.1) for 1996 and 2007, resultsof the filtered supervised classifications for 1996 and2007, 23 points corresponding to the 1994-97 samplinglocations with related aggressiveness values and ninepoints for 2007 also with aggressiveness values. Forevery catching point, the Euclidian distance to the firstvegetated pixel was computed, and the number of pixelsof each of the 13 land use and land cover classes at sev-eral radius buffers (from 100 m to 500 m) was calcu-lated. Spatial autocorrelations between aggressivenesseswere investigated using the Moran’s I index.
Statistical analysisStatistical associations between the 1994-97 aggressive-ness and the data issued from the 1996 image were firstinvestigated to identify which environmental factorswere associated with the An. arabiensis densities (Step1). Then, associations between the 1994-97 aggressive-ness and the data issued from the 2007 image wereexamined in order to assess the persistence of the asso-ciations over time (Step 2). Finally, external validation(Step 3) was undertaken by researching the associationsbetween the 2007 aggressiveness and the 2007 image,using the variables found to be significantly associatedin Step 1. Thus, the quality of the predictions of An.arabiensis densities from Step 1 was assessed. Thedependent variables were square root transformed, andlinear regression models were fitted. All combinations ofclasses in the 100-m to 500-m radius buffers were testedas independent variables in order to obtain the bestassociation. All statistical analyses were performed usingSTATA 9.0 (Stata-Corp LP). Spatial autocorrelation wasresearched among the residuals of the fitted regressionsusing the Moran’s I index in ArcGIS 9.2.
Risk mapsFollowing the results of the statistical analysis, risk mapswere drawn for 1996 and 2007 by computing for everypixel of the studied zone the environmental factorsfound to be statistically associated with aggressiveness.This calculation was done for populated areas only.Masks were applied specifically on the 1996 and 2007images to hide any non-urban pixels, such as vegetation,water, swamp areas and bare soils. The masks wereissued from the results of the supervised classificationand assisted by a manual digitisation. The areas thatwere not masked depicted the built-up areas andallowed the urban evolution in the 11 years to bedescribed and quantified.
ResultsImage processingAll satellite image pre-processing was successfully con-ducted and enabled the generation of vegetation images
Machault et al. Malaria Journal 2010, 9:252http://www.malariajournal.com/content/9/1/252
Page 4 of 14
as well as land use and land cover maps for 1996 and2007. The quality of the supervised classification wasvalidated thanks to the high kappa coefficient (0.85 forthe 1996 image and 0.95 for the 2007 image). The built-up area was defined as the total surface of all urbanclasses plus the asphalt class.
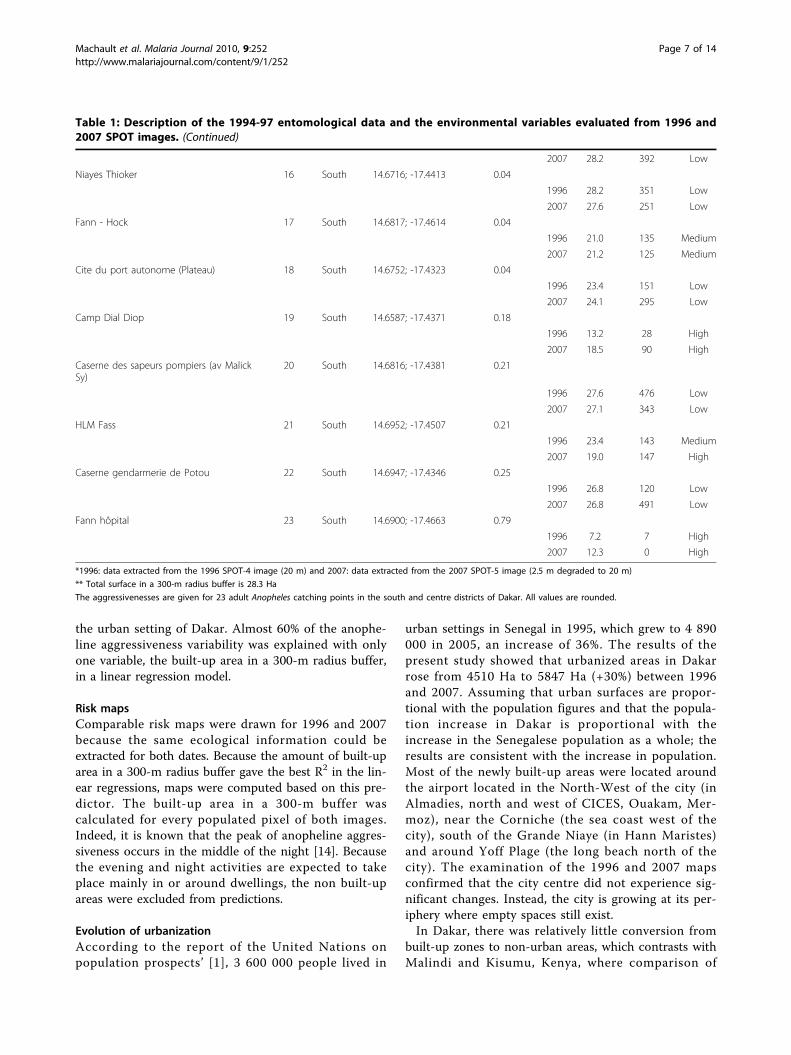
GIS and statistical analysisAll entomological data are presented in the five first col-umns of Tables 1 and 2 for the 1994-97 and 2007 stu-dies respectively.Step 1. Processing of ecological and entomological
data in the GIS allowed the environmental variables tobe extracted from the 1996 image for the 23 Anophelescatching points from the 1994-97 studies. Results arepresented in Table 1. The Moran’s I index was -0.01,indicating that the pattern where neither clustered nordispersed. The z-score was equal to 0.9 standard devia-tions so it was associated with a high p-value. Thoseresults were not statistically significant, possibly due tothe small number of observations. In the absence of evi-dence of spatial autocorrelation between the 23 aggres-siveness values from 1994-97, no cluster parameter wastaken into account in the statistical analyses. In the uni-variate analyses, the anopheline aggressiveness measuredin 1994-97 was significantly negatively associated withthe distance to the vegetation (R2 = 0.38) and the built-up area in a 300-m radius buffer (R2 = 0.42) in the 1996images (Table 3). When excluding one by one theobservations for which the geographical locations wereapproximated, the parameters did not differ from theones estimated in models including all the observations.Thus, all the observations where kept in the models.Step 2. The GIS also allowed the extraction of the
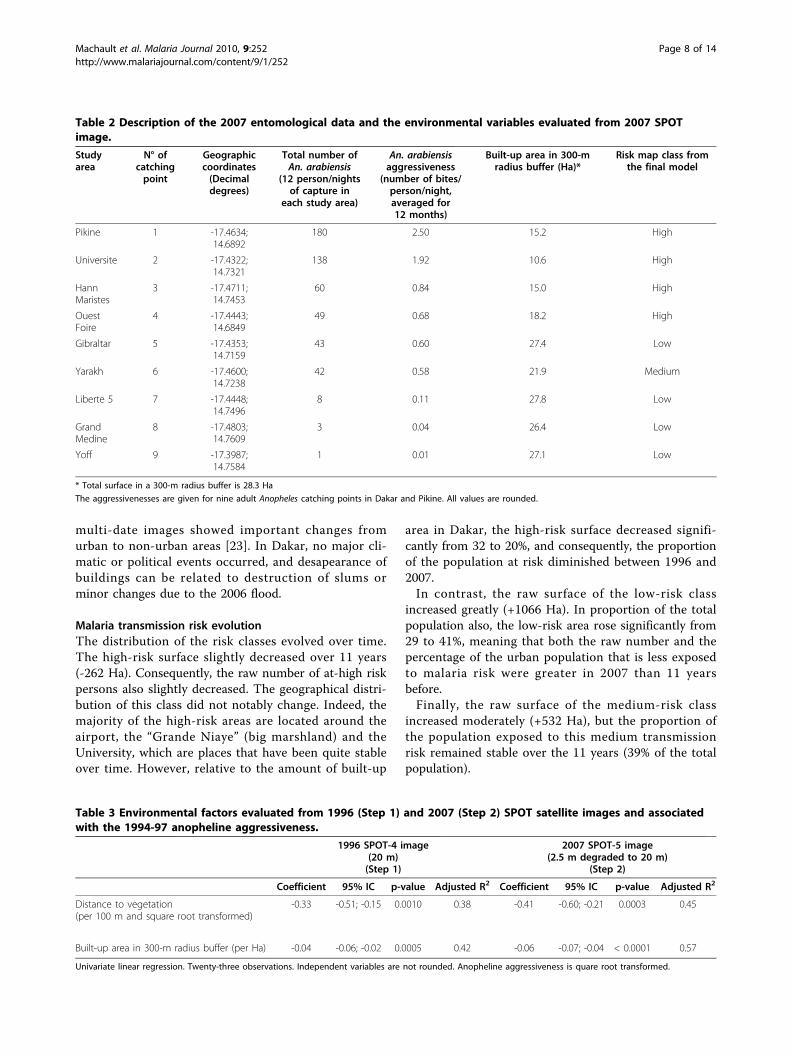
environmental variables from the 2007 image for the 23Anopheles catching points from the 1994-97 studies(Table 1). The R2 was 0.45 for the linear regressionincluding the distance to vegetation and the R2 was 0.57for the linear regression including the built-up area in a300-m radius buffer (Table 3). The statistical associa-tions found in Step 1 persisted over time. Table 4 con-tains the statistical parameters for buffers of differentsizes and indicates that the 300-m buffer fit the best.Step 3. The GIS was used to extract the environmen-
tal values from the 2007 image at the 2007 catchingpoint locations (Table 2). The Moran’s I index was -0.07with a z-score equal to 0.84 standard deviations. Thoseresults were not statistically significant but in theabsence of evidence of spatial autocorrelation betweenthe 9 aggressiveness values from 2007, no cluster para-meter was taken into account in the statistical analyses.Table 5 provides the parameters of the linear regressionfitted for validation using the independent set of data(R2 = 0.68).
Following the results of the Moran’s I statistics at eachof those 3 steps, no significant spatial autocorrelationscould have been showed among the residuals of thefitted regressions.
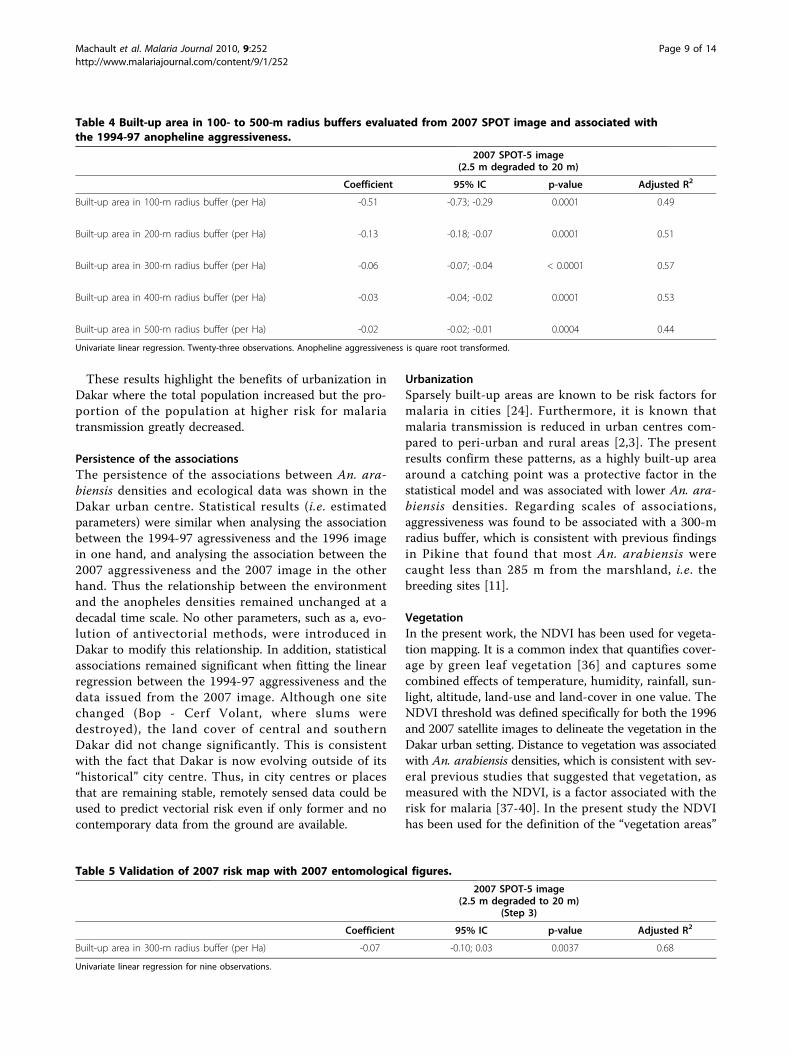
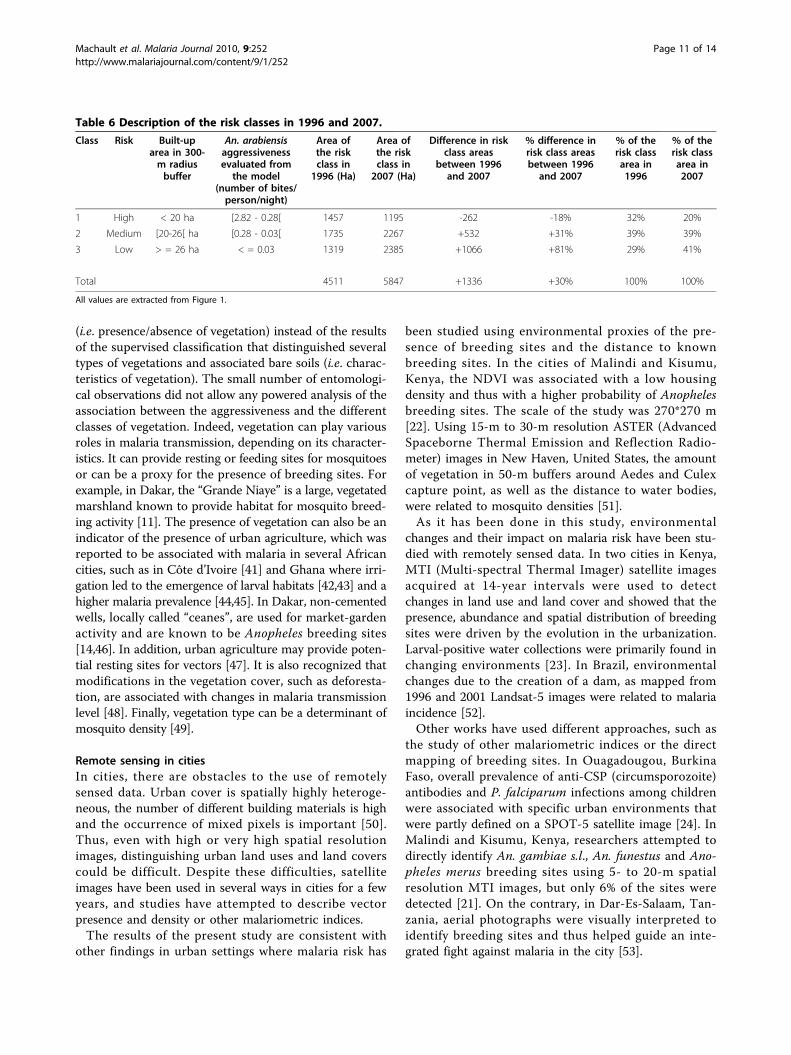
Risk mapsAs the built-up area was found to be the factor moststrongly associated with Anopheles density in the statis-tical analysis, risk maps were derived from the built-uparea in a 300-m radius buffer for every pixel of thepopulated areas, using the results of the fitted regressionmodel. Continuous values of the computed risk mapwere discretized to generate three classes, which werebased on a calculation of the terciles of the built-up sur-face in the 300-m radius buffer, followed by a manualadjustment. Breaking values were chosen at 20 and 26Ha around every pixel. Figures 1a and 1b show the 1996and 2007 risk maps overlaid with the measured 1994-97and 2007 An. arabiensis densities. A comparison of themaps indicated an increase in built-up surfaces in 11years (about 1 300 ha), and also depicted the evolutionof the areas of each risk class in Dakar and its suburb.Table 6 gives a summary of the information provided bythe risk maps. The built-up area, the related anophelineaggressiveness predicted by inverting the best statisticalassociation (R2 = 0.57), the total surface of the risk classand the proportional surface of the risk class withrespect to the total built-up area is given for each class.Table 1 and Table 2 provide the risk class at each catch-ing point for the 1994-97 and 2007 studies, respectively.
DiscussionAssociation between remotely sensed environmental dataand An. arabiensis densitiesStatistical associations were found between 1994-97 Ano-pheles aggressiveness [25,26] and 1996 and 2007 SPOTimages. Even with the relatively small number of observa-tions, aggressiveness values were statistically associatedwith the distance between the vegetation and the catch-ing points and the built-up area in a 300-m radius bufferaround the catching points. No multivariate model couldbe implemented because both ecological variables werehighly correlated. Indeed, the presence of built-up areaswas mainly colinear with the absence of vegetation. Thevalidity of the model was assessed by fitting the modelwith an independent set of data. The aggressivenessrecorded in 2007 was significantly associated with envir-onmental data extracted from the 2007 image. Theresulting agreement (R2 = 0.68) improves our confidencein the statistical results from the present study.The results of the present study provide evidence that
environmental data retrieved from high spatial resolu-tion SPOT satellite images (acquired for the rainy sea-son) can be associated with An. arabiensis densities in
Machault et al. Malaria Journal 2010, 9:252http://www.malariajournal.com/content/9/1/252
Page 5 of 14
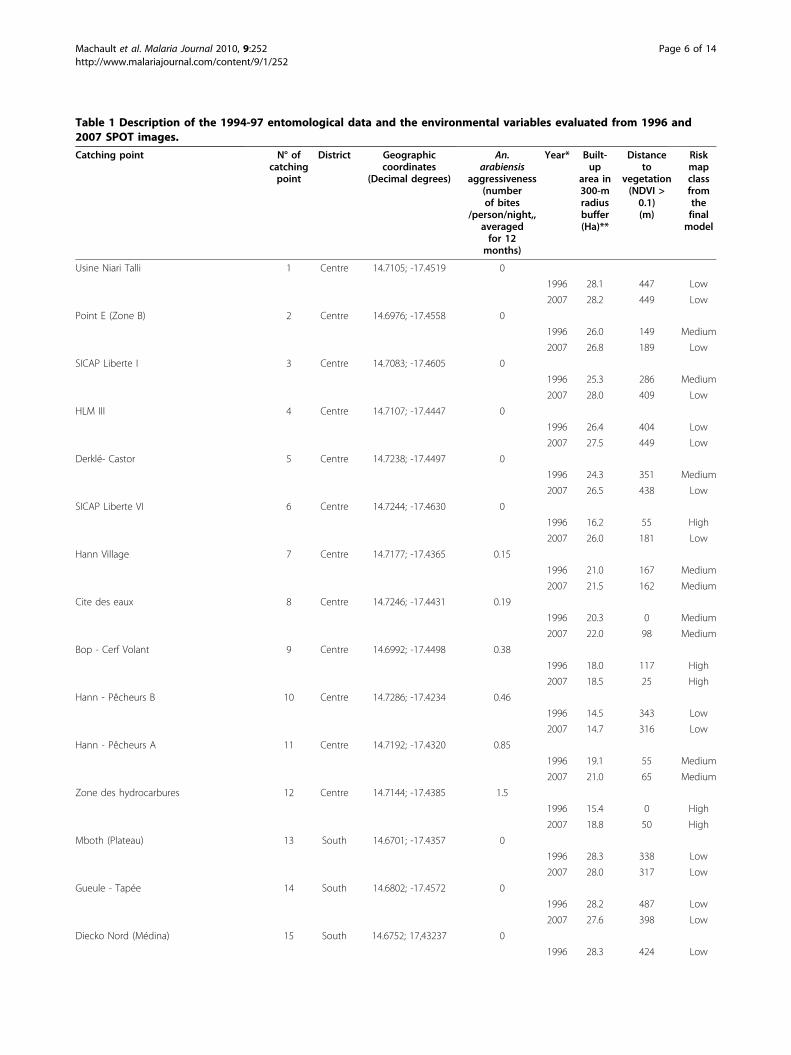
Table 1 Description of the 1994-97 entomological data and the environmental variables evaluated from 1996 and2007 SPOT images.
Catching point N° ofcatchingpoint
District Geographiccoordinates
(Decimal degrees)
An.arabiensis
aggressiveness(numberof bites
/person/night,,averagedfor 12months)
Year* Built-up
area in300-mradiusbuffer(Ha)**
Distanceto
vegetation(NDVI >0.1)(m)
Riskmapclassfromthefinalmodel
Usine Niari Talli 1 Centre 14.7105; -17.4519 0
1996 28.1 447 Low
2007 28.2 449 Low
Point E (Zone B) 2 Centre 14.6976; -17.4558 0
1996 26.0 149 Medium
2007 26.8 189 Low
SICAP Liberte I 3 Centre 14.7083; -17.4605 0
1996 25.3 286 Medium
2007 28.0 409 Low
HLM III 4 Centre 14.7107; -17.4447 0
1996 26.4 404 Low
2007 27.5 449 Low
Derklé- Castor 5 Centre 14.7238; -17.4497 0
1996 24.3 351 Medium
2007 26.5 438 Low
SICAP Liberte VI 6 Centre 14.7244; -17.4630 0
1996 16.2 55 High
2007 26.0 181 Low
Hann Village 7 Centre 14.7177; -17.4365 0.15
1996 21.0 167 Medium
2007 21.5 162 Medium
Cite des eaux 8 Centre 14.7246; -17.4431 0.19
1996 20.3 0 Medium
2007 22.0 98 Medium
Bop - Cerf Volant 9 Centre 14.6992; -17.4498 0.38
1996 18.0 117 High
2007 18.5 25 High
Hann - Pêcheurs B 10 Centre 14.7286; -17.4234 0.46
1996 14.5 343 Low
2007 14.7 316 Low
Hann - Pêcheurs A 11 Centre 14.7192; -17.4320 0.85
1996 19.1 55 Medium
2007 21.0 65 Medium
Zone des hydrocarbures 12 Centre 14.7144; -17.4385 1.5
1996 15.4 0 High
2007 18.8 50 High
Mboth (Plateau) 13 South 14.6701; -17.4357 0
1996 28.3 338 Low
2007 28.0 317 Low
Gueule - Tapée 14 South 14.6802; -17.4572 0
1996 28.2 487 Low
2007 27.6 398 Low
Diecko Nord (Médina) 15 South 14.6752; 17,43237 0
1996 28.3 424 Low
Machault et al. Malaria Journal 2010, 9:252http://www.malariajournal.com/content/9/1/252
Page 6 of 14
the urban setting of Dakar. Almost 60% of the anophe-line aggressiveness variability was explained with onlyone variable, the built-up area in a 300-m radius buffer,in a linear regression model.
Risk mapsComparable risk maps were drawn for 1996 and 2007because the same ecological information could beextracted for both dates. Because the amount of built-uparea in a 300-m radius buffer gave the best R2 in the lin-ear regressions, maps were computed based on this pre-dictor. The built-up area in a 300-m buffer wascalculated for every populated pixel of both images.Indeed, it is known that the peak of anopheline aggres-siveness occurs in the middle of the night [14]. Becausethe evening and night activities are expected to takeplace mainly in or around dwellings, the non built-upareas were excluded from predictions.
Evolution of urbanizationAccording to the report of the United Nations onpopulation prospects’ [1], 3 600 000 people lived in
urban settings in Senegal in 1995, which grew to 4 890000 in 2005, an increase of 36%. The results of thepresent study showed that urbanized areas in Dakarrose from 4510 Ha to 5847 Ha (+30%) between 1996and 2007. Assuming that urban surfaces are propor-tional with the population figures and that the popula-tion increase in Dakar is proportional with theincrease in the Senegalese population as a whole; theresults are consistent with the increase in population.Most of the newly built-up areas were located aroundthe airport located in the North-West of the city (inAlmadies, north and west of CICES, Ouakam, Mer-moz), near the Corniche (the sea coast west of thecity), south of the Grande Niaye (in Hann Maristes)and around Yoff Plage (the long beach north of thecity). The examination of the 1996 and 2007 mapsconfirmed that the city centre did not experience sig-nificant changes. Instead, the city is growing at its per-iphery where empty spaces still exist.In Dakar, there was relatively little conversion from
built-up zones to non-urban areas, which contrasts withMalindi and Kisumu, Kenya, where comparison of
Table 1: Description of the 1994-97 entomological data and the environmental variables evaluated from 1996 and2007 SPOT images. (Continued)
2007 28.2 392 Low
Niayes Thioker 16 South 14.6716; -17.4413 0.04
1996 28.2 351 Low
2007 27.6 251 Low
Fann - Hock 17 South 14.6817; -17.4614 0.04
1996 21.0 135 Medium
2007 21.2 125 Medium
Cite du port autonome (Plateau) 18 South 14.6752; -17.4323 0.04
1996 23.4 151 Low
2007 24.1 295 Low
Camp Dial Diop 19 South 14.6587; -17.4371 0.18
1996 13.2 28 High
2007 18.5 90 High
Caserne des sapeurs pompiers (av MalickSy)
20 South 14.6816; -17.4381 0.21
1996 27.6 476 Low
2007 27.1 343 Low
HLM Fass 21 South 14.6952; -17.4507 0.21
1996 23.4 143 Medium
2007 19.0 147 High
Caserne gendarmerie de Potou 22 South 14.6947; -17.4346 0.25
1996 26.8 120 Low
2007 26.8 491 Low
Fann hôpital 23 South 14.6900; -17.4663 0.79
1996 7.2 7 High
2007 12.3 0 High
*1996: data extracted from the 1996 SPOT-4 image (20 m) and 2007: data extracted from the 2007 SPOT-5 image (2.5 m degraded to 20 m)
** Total surface in a 300-m radius buffer is 28.3 Ha
The aggressivenesses are given for 23 adult Anopheles catching points in the south and centre districts of Dakar. All values are rounded.
Machault et al. Malaria Journal 2010, 9:252http://www.malariajournal.com/content/9/1/252
Page 7 of 14
multi-date images showed important changes fromurban to non-urban areas [23]. In Dakar, no major cli-matic or political events occurred, and desapearance ofbuildings can be related to destruction of slums orminor changes due to the 2006 flood.
Malaria transmission risk evolutionThe distribution of the risk classes evolved over time.The high-risk surface slightly decreased over 11 years(-262 Ha). Consequently, the raw number of at-high riskpersons also slightly decreased. The geographical distri-bution of this class did not notably change. Indeed, themajority of the high-risk areas are located around theairport, the “Grande Niaye” (big marshland) and theUniversity, which are places that have been quite stableover time. However, relative to the amount of built-up
area in Dakar, the high-risk surface decreased signifi-cantly from 32 to 20%, and consequently, the proportionof the population at risk diminished between 1996 and2007.In contrast, the raw surface of the low-risk class
increased greatly (+1066 Ha). In proportion of the totalpopulation also, the low-risk area rose significantly from29 to 41%, meaning that both the raw number and thepercentage of the urban population that is less exposedto malaria risk were greater in 2007 than 11 yearsbefore.Finally, the raw surface of the medium-risk class
increased moderately (+532 Ha), but the proportion ofthe population exposed to this medium transmissionrisk remained stable over the 11 years (39% of the totalpopulation).
Table 3 Environmental factors evaluated from 1996 (Step 1) and 2007 (Step 2) SPOT satellite images and associatedwith the 1994-97 anopheline aggressiveness.
1996 SPOT-4 image(20 m)(Step 1)
2007 SPOT-5 image(2.5 m degraded to 20 m)
(Step 2)
Coefficient 95% IC p-value Adjusted R2 Coefficient 95% IC p-value Adjusted R2
Distance to vegetation(per 100 m and square root transformed)
-0.33 -0.51; -0.15 0.0010 0.38 -0.41 -0.60; -0.21 0.0003 0.45
Built-up area in 300-m radius buffer (per Ha) -0.04 -0.06; -0.02 0.0005 0.42 -0.06 -0.07; -0.04 < 0.0001 0.57
Univariate linear regression. Twenty-three observations. Independent variables are not rounded. Anopheline aggressiveness is quare root transformed.
Table 2 Description of the 2007 entomological data and the environmental variables evaluated from 2007 SPOTimage.
Studyarea
N° ofcatchingpoint
Geographiccoordinates(Decimaldegrees)
Total number ofAn. arabiensis
(12 person/nightsof capture in
each study area)
An. arabiensisaggressiveness
(number of bites/person/night,averaged for12 months)
Built-up area in 300-mradius buffer (Ha)*
Risk map class fromthe final model
Pikine 1 -17.4634;14.6892
180 2.50 15.2 High
Universite 2 -17.4322;14.7321
138 1.92 10.6 High
HannMaristes
3 -17.4711;14.7453
60 0.84 15.0 High
OuestFoire
4 -17.4443;14.6849
49 0.68 18.2 High
Gibraltar 5 -17.4353;14.7159
43 0.60 27.4 Low
Yarakh 6 -17.4600;14.7238
42 0.58 21.9 Medium
Liberte 5 7 -17.4448;14.7496
8 0.11 27.8 Low
GrandMedine
8 -17.4803;14.7609
3 0.04 26.4 Low
Yoff 9 -17.3987;14.7584
1 0.01 27.1 Low
* Total surface in a 300-m radius buffer is 28.3 Ha
The aggressivenesses are given for nine adult Anopheles catching points in Dakar and Pikine. All values are rounded.
Machault et al. Malaria Journal 2010, 9:252http://www.malariajournal.com/content/9/1/252
Page 8 of 14
These results highlight the benefits of urbanization inDakar where the total population increased but the pro-portion of the population at higher risk for malariatransmission greatly decreased.
Persistence of the associationsThe persistence of the associations between An. ara-biensis densities and ecological data was shown in theDakar urban centre. Statistical results (i.e. estimatedparameters) were similar when analysing the associationbetween the 1994-97 agressiveness and the 1996 imagein one hand, and analysing the association between the2007 aggressiveness and the 2007 image in the otherhand. Thus the relationship between the environmentand the anopheles densities remained unchanged at adecadal time scale. No other parameters, such as a, evo-lution of antivectorial methods, were introduced inDakar to modify this relationship. In addition, statisticalassociations remained significant when fitting the linearregression between the 1994-97 aggressiveness and thedata issued from the 2007 image. Although one sitechanged (Bop - Cerf Volant, where slums weredestroyed), the land cover of central and southernDakar did not change significantly. This is consistentwith the fact that Dakar is now evolving outside of its“historical” city centre. Thus, in city centres or placesthat are remaining stable, remotely sensed data could beused to predict vectorial risk even if only former and nocontemporary data from the ground are available.
UrbanizationSparsely built-up areas are known to be risk factors formalaria in cities [24]. Furthermore, it is known thatmalaria transmission is reduced in urban centres com-pared to peri-urban and rural areas [2,3]. The presentresults confirm these patterns, as a highly built-up areaaround a catching point was a protective factor in thestatistical model and was associated with lower An. ara-biensis densities. Regarding scales of associations,aggressiveness was found to be associated with a 300-mradius buffer, which is consistent with previous findingsin Pikine that found that most An. arabiensis werecaught less than 285 m from the marshland, i.e. thebreeding sites [11].
VegetationIn the present work, the NDVI has been used for vegeta-tion mapping. It is a common index that quantifies cover-age by green leaf vegetation [36] and captures somecombined effects of temperature, humidity, rainfall, sun-light, altitude, land-use and land-cover in one value. TheNDVI threshold was defined specifically for both the 1996and 2007 satellite images to delineate the vegetation in theDakar urban setting. Distance to vegetation was associatedwith An. arabiensis densities, which is consistent with sev-eral previous studies that suggested that vegetation, asmeasured with the NDVI, is a factor associated with therisk for malaria [37-40]. In the present study the NDVIhas been used for the definition of the “vegetation areas”
Table 4 Built-up area in 100- to 500-m radius buffers evaluated from 2007 SPOT image and associated withthe 1994-97 anopheline aggressiveness.
2007 SPOT-5 image(2.5 m degraded to 20 m)
Coefficient 95% IC p-value Adjusted R2
Built-up area in 100-m radius buffer (per Ha) -0.51 -0.73; -0.29 0.0001 0.49
Built-up area in 200-m radius buffer (per Ha) -0.13 -0.18; -0.07 0.0001 0.51
Built-up area in 300-m radius buffer (per Ha) -0.06 -0.07; -0.04 < 0.0001 0.57
Built-up area in 400-m radius buffer (per Ha) -0.03 -0.04; -0.02 0.0001 0.53
Built-up area in 500-m radius buffer (per Ha) -0.02 -0.02; -0.01 0.0004 0.44
Univariate linear regression. Twenty-three observations. Anopheline aggressiveness is quare root transformed.
Table 5 Validation of 2007 risk map with 2007 entomological figures.
2007 SPOT-5 image(2.5 m degraded to 20 m)
(Step 3)
Coefficient 95% IC p-value Adjusted R2
Built-up area in 300-m radius buffer (per Ha) -0.07 -0.10; 0.03 0.0037 0.68
Univariate linear regression for nine observations.
Machault et al. Malaria Journal 2010, 9:252http://www.malariajournal.com/content/9/1/252
Page 9 of 14
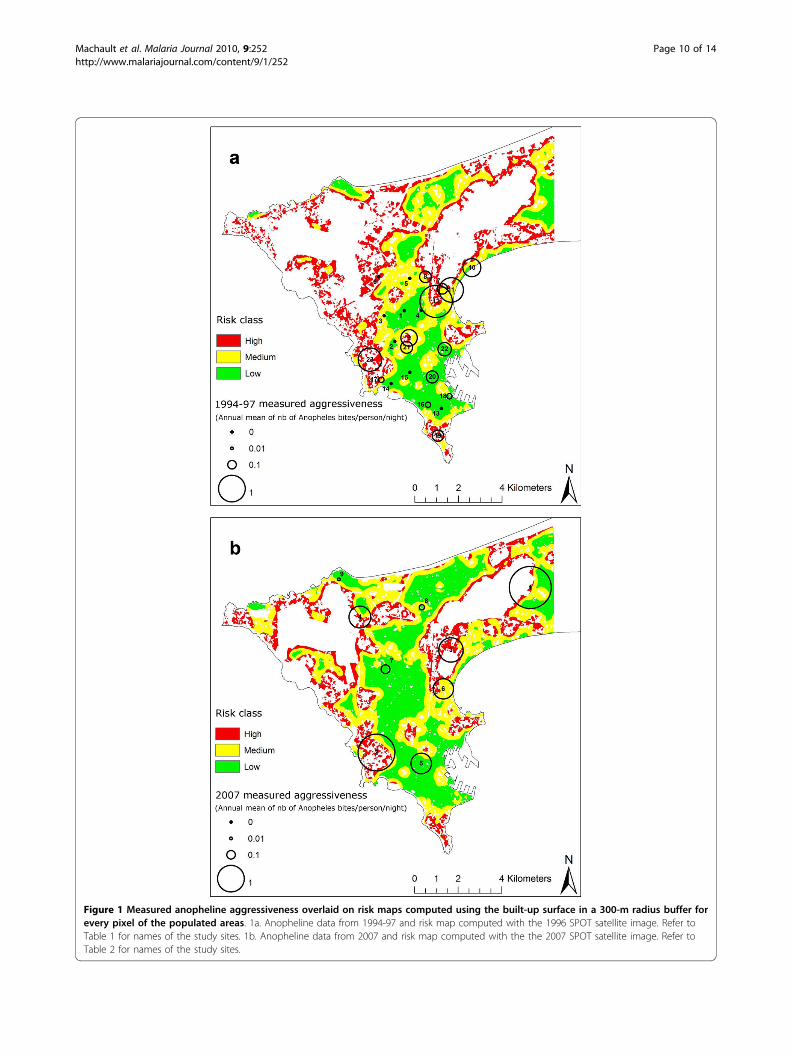
Figure 1 Measured anopheline aggressiveness overlaid on risk maps computed using the built-up surface in a 300-m radius buffer forevery pixel of the populated areas. 1a. Anopheline data from 1994-97 and risk map computed with the 1996 SPOT satellite image. Refer toTable 1 for names of the study sites. 1b. Anopheline data from 2007 and risk map computed with the the 2007 SPOT satellite image. Refer toTable 2 for names of the study sites.
Machault et al. Malaria Journal 2010, 9:252http://www.malariajournal.com/content/9/1/252
Page 10 of 14
(i.e. presence/absence of vegetation) instead of the resultsof the supervised classification that distinguished severaltypes of vegetations and associated bare soils (i.e. charac-teristics of vegetation). The small number of entomologi-cal observations did not allow any powered analysis of theassociation between the aggressiveness and the differentclasses of vegetation. Indeed, vegetation can play variousroles in malaria transmission, depending on its character-istics. It can provide resting or feeding sites for mosquitoesor can be a proxy for the presence of breeding sites. Forexample, in Dakar, the “Grande Niaye” is a large, vegetatedmarshland known to provide habitat for mosquito breed-ing activity [11]. The presence of vegetation can also be anindicator of the presence of urban agriculture, which wasreported to be associated with malaria in several Africancities, such as in Côte d’Ivoire [41] and Ghana where irri-gation led to the emergence of larval habitats [42,43] and ahigher malaria prevalence [44,45]. In Dakar, non-cementedwells, locally called “ceanes”, are used for market-gardenactivity and are known to be Anopheles breeding sites[14,46]. In addition, urban agriculture may provide poten-tial resting sites for vectors [47]. It is also recognized thatmodifications in the vegetation cover, such as deforesta-tion, are associated with changes in malaria transmissionlevel [48]. Finally, vegetation type can be a determinant ofmosquito density [49].
Remote sensing in citiesIn cities, there are obstacles to the use of remotelysensed data. Urban cover is spatially highly heteroge-neous, the number of different building materials is highand the occurrence of mixed pixels is important [50].Thus, even with high or very high spatial resolutionimages, distinguishing urban land uses and land coverscould be difficult. Despite these difficulties, satelliteimages have been used in several ways in cities for a fewyears, and studies have attempted to describe vectorpresence and density or other malariometric indices.The results of the present study are consistent with
other findings in urban settings where malaria risk has
been studied using environmental proxies of the pre-sence of breeding sites and the distance to knownbreeding sites. In the cities of Malindi and Kisumu,Kenya, the NDVI was associated with a low housingdensity and thus with a higher probability of Anophelesbreeding sites. The scale of the study was 270*270 m[22]. Using 15-m to 30-m resolution ASTER (AdvancedSpaceborne Thermal Emission and Reflection Radio-meter) images in New Haven, United States, the amountof vegetation in 50-m buffers around Aedes and Culexcapture point, as well as the distance to water bodies,were related to mosquito densities [51].As it has been done in this study, environmental
changes and their impact on malaria risk have been stu-died with remotely sensed data. In two cities in Kenya,MTI (Multi-spectral Thermal Imager) satellite imagesacquired at 14-year intervals were used to detectchanges in land use and land cover and showed that thepresence, abundance and spatial distribution of breedingsites were driven by the evolution in the urbanization.Larval-positive water collections were primarily found inchanging environments [23]. In Brazil, environmentalchanges due to the creation of a dam, as mapped from1996 and 2001 Landsat-5 images were related to malariaincidence [52].Other works have used different approaches, such as
the study of other malariometric indices or the directmapping of breeding sites. In Ouagadougou, BurkinaFaso, overall prevalence of anti-CSP (circumsporozoite)antibodies and P. falciparum infections among childrenwere associated with specific urban environments thatwere partly defined on a SPOT-5 satellite image [24]. InMalindi and Kisumu, Kenya, researchers attempted todirectly identify An. gambiae s.l., An. funestus and Ano-pheles merus breeding sites using 5- to 20-m spatialresolution MTI images, but only 6% of the sites weredetected [21]. On the contrary, in Dar-Es-Salaam, Tan-zania, aerial photographs were visually interpreted toidentify breeding sites and thus helped guide an inte-grated fight against malaria in the city [53].
Table 6 Description of the risk classes in 1996 and 2007.
Class Risk Built-uparea in 300-m radiusbuffer
An. arabiensisaggressivenessevaluated from
the model(number of bites/person/night)
Area ofthe riskclass in
1996 (Ha)
Area ofthe riskclass in
2007 (Ha)
Difference in riskclass areas
between 1996and 2007
% difference inrisk class areasbetween 1996
and 2007
% of therisk classarea in1996
% of therisk classarea in2007
1 High < 20 ha [2.82 - 0.28[ 1457 1195 -262 -18% 32% 20%
2 Medium [20-26[ ha [0.28 - 0.03[ 1735 2267 +532 +31% 39% 39%
3 Low > = 26 ha < = 0.03 1319 2385 +1066 +81% 29% 41%
Total 4511 5847 +1336 +30% 100% 100%
All values are extracted from Figure 1.
Machault et al. Malaria Journal 2010, 9:252http://www.malariajournal.com/content/9/1/252
Page 11 of 14
Finally, radar images have been useful in the study ofmalaria in tropical areas [54,55], even in urban settings[56]. Indeed, they have a powerful capacity for detectingwater and do not have cloud cover acquisition problems.
Validity of image classificationThe kappa coefficient calculated following the supervisedclassification step was 0.85 in 1996 and 0.95 in 2007,indicating a strong agreement between ground-trutheddata and the classes from the supervised classification.Most of the confusions were not of major importancebecause they occurred mainly between different urbantypes, which were further aggregated in the built-upclass. However, other confusions could not be totallyerased, such as water and some types of asphalt.
Comparison of multi-date imagesComparing images can be difficult because some differ-ences are not due to actual ecological differences;instead, they are related to the specificity of the images,such as differences in atmospheric conditions, solarangle, sensor calibration, period of the view or the regis-tration of images [57]. The method used in the presentstudy improved the validity of the comparison in severalways. First, comparisons between images were not donedirectly on the images but rather on the results of classi-fications and calculations of the vegetation index, thustaking into account intrinsic parameters for each image.Furthermore, images were acquired in level 3 pre-pro-cessing, thereby avoiding all problems of spatial misre-gistration. Finally, differences in atmospheric conditionswere taken into account thanks to the IARR pre-proces-sing. This was of particular importance because itallowed an NDVI common threshold to be chosen forthe 1996 and 2007 images, which was not feasible with-out this pre-processing step.Comparison of environmental data from multi-date
images was also made possible because views wereacquired from the same period of the year (during thewet season). This was of major importance, especiallyfor vegetation measurement. Rainfall was 350 mm in1996 and 178 mm in 2007, but images were both takenjust a few days after the last rain (13 days in 1996 and10 days in 2007). At that time, the vegetation shouldhave been at its maximum growth so vegetation devel-opments were considered comparable.The validity of the comparison of the supervised clas-
sifications in 1996 and 2007 was inescapably related todifferences in spatial and spectral resolutions. The 1996SPOT-4 image has three bands at 20 m whereas the2007 SPOT-5 image had three bands at 2.5 m and oneband at 10 m. Even if the 2007 image was resampled to20 m to allow comparison with the 1996 image, everyaveraged 20-m pixel may contain more information
than pixels initially aqcuired at 20-m spatial resolution.In Korea, it was shown that about 20% of a scene couldhave been classified into different classes based on twoimages at different spatial resolutions (Ikonos and Land-sat) [58]. Whereas this could impede the validity ofmulti-date comparisons, choosing common trainingpolygons for supervised classification of both imagesshould have improved this quality.
ConclusionRemotely sensed environmental data were statisticallyassociated with the An. arabiensis densities in Dakarcity. Accordingly, risks maps were drawn for the years1996 and 2007. Based on these maps, urbanization ledto an increase in the proportion of the population atlow risk for malaria transmission, i.e., when urbaniza-tion increased, malaria risk was reduced. These mapsshould be seen as a first step towards creating opera-tional risk maps that could drive antivectorial control inthe city.
Additional material
Additional file 1: Spatial repartition of the training polygonsdigitized for supervised classification process.
AcknowledgementsThis study received financial support from the Direction Générale del’Armement (DGA - Contrat d’Objectif n°07CO402) and the Centre Nationald’Etudes Spatiales (CNES).We thank Dr. Antonio Güell and Murielle Lafaye, director and head of tele-epidemiology applications, respectively, at the Applications and ValorisationOffice at CNES, for supporting this study.We acknowledge the CNES ISIS program, which provided access to highspatial resolution SPOT5 images, as well as the Centre Militaire d’Observationpar Satellites for having provided imagery.We warmly thank Dr. Pierre Gazin (IRD) for commitment in the geolocationof studied sites in Dakar, Dr. Jacques-André Ndione (Centre de SuiviEcologique - Dakar) for providing meteorological data and expertise and Mr.Pape Ndiaye (IRD) for field data collection.Finally, we sincerely thank all the members of the team having carried outthe studies in 1994-97 for having allowed this work to be undertaken.
Author details1Unité de recherche en biologie et épidémiologie parasitaires, Equipe 7“Maladies émergentes et moustiques"/Unité de Recherche sur les MaladiesInfectieuses et Tropicales Emergentes - URMITE - UMR6236, Institut deRecherche Biomédicale des Armées, Allée du Médecin colonel Jamot, Parcdu Pharo, BP60109, 13262 Marseille cedex 07, France. 2Unité d’entomologiemédicale, Equipe 7 “Maladies émergentes et moustiques"/Unité deRecherche sur les Maladies Infectieuses et Tropicales Emergentes - URMITE -UMR6236, Institut de Recherche Biomédicale des Armées, Allée du Médecincolonel Jamot, Parc du Pharo, BP60109, 13262 Marseille cedex 07, France.3Centre National d’Etudes Spatiales - Service Applications et Valorisation - 18avenue Edouard Belin, 31401 Toulouse Cedex 9, France. 4Observatoire Midi-Pyrénées, Université Paul Sabatier, 14 avenue Edouard Belin, 31400 Toulouse,France. 5Institut de Recherche pour le Développement, UMR198 “Paludismeet maladies émergentes en Afrique de l’Ouest: détection, épidémiologie etlutte"/Unité de Recherche sur les Maladies Infectieuses et TropicalesEmergentes - URMITE, Route des Pères Maristes, BP 1386, 18524 Dakar,Sénégal.
Machault et al. Malaria Journal 2010, 9:252http://www.malariajournal.com/content/9/1/252
Page 12 of 14
Authors’ contributionsVM was responsible for study design, analysis, remotely sensed imagesprocessing, interpretation, production of the final manuscript and revisions.CV contributed to the study design, remotely sensed images processing,analysis, interpretation and production of the final manuscript and revisions.LG was co-responsible for field data collection. FP was responsible for overallscientific management, study design, analysis, interpretation, preparation ofthe final manuscript and revisions. CS contributed to overall scientificmanagement. JFT contributed to overall scientific management. JPL wasresponsible for overall scientific management, study design, analysis,interpretation, preparation of the final manuscript and revisions. CR wasresponsible for overall scientific management, study design, analysis,interpretation, preparation of the final manuscript and revisions. All authorsread and approved the final manuscript.
Competing interestsThe authors declare that they have no competing interests.
Received: 21 May 2010 Accepted: 3 September 2010Published: 3 September 2010
References1. Nations U: Word Urbanization prospects: the 2007 revision. New York:
United Nations: Population Division of the Department of Economic andSocial Affairs of the United Nations Secretariat 2003.
2. Robert V, Macintyre K, Keating J, Trape JF, Duchemin JB, M W, Beier JC:Malaria transmission in urban sub-saharan Africa. Am J Trop Med Hyg2003, 68:169-176.
3. Keiser J, Utzinger J, Caldas de Castro M, Smith TA, Tanner M, Singer BH:Urbanization in sub-saharan Africa and implication for malaria control.Am J Trop Med Hyg 2004, 71:118-127.
4. Donnelly MJ, McCall PJ, Lengeler C, Bates I, D’Alessandro U, Barnish G,Konradsen F, Klinkenberg E, Townson H, Trape JF, Hastings IM, Mutero C:Malaria and urbanization in sub-Saharan Africa. Malar J 2005, 4:12.
5. Wang SJ, Lengeler C, Smith TA, Vounatsou P, Cisse G, Diallo DA,Akogbeto M, Mtasiwa D, Teklehaimanot A, Tanner M: Rapid urban malariaappraisal (RUMA) in sub-Saharan Africa. Malar J 2005, 4:40.
6. Chinery WA: Effects of ecological changes on the malaria vectorsAnopheles funestus and the Anopheles gambiae complex of mosquitoesin Accra, Ghana. J Trop Med Hyg 1984, 87:75-81.
7. Sattler MA, Mtasiwa D, Kiama M, Premji Z, Tanner M, Killeen GF, Lengeler C:Habitat characterization and spatial distribution of Anopheles sp.mosquito larvae in Dar es Salaam (Tanzania) during an extended dryperiod. Malar J 2005, 4:4.
8. Awolola TS, Oduola AO, Obansa JB, Chukwurar NJ, Unyimadu JP:Anopheles gambiae s.s. breeding in polluted water bodies in urbanLagos, southwestern Nigeria. J Vector Borne Dis 2007, 44:241-244.
9. Omlin FX, Carlson JC, Ogbunugafor CB, Hassanali A: Anopheles gambiaeexploits the treehole ecosystem in western Kenya: a new urban malariarisk? Am J Trop Med Hyg 2007, 77:264-269.
10. Antonio-Nkondjio C, Simard F, Awono-Ambene P, Ngassam P, Toto JC,Tchuinkam T, Fontenille D: Malaria vectors and urbanization in theequatorial forest region of south Cameroon. Trans R Soc Trop Med Hyg2005, 99:347-354.
11. Trape JF, Lefebvre-Zante E, Legros F, Ndiaye G, Bouganali H, Druilhe P,Salem G: Vector density gradients and the epidemiology of urbanmalaria in Dakar, Senegal. Am J Trop Med Hyg 1992, 47:181-189.
12. Staedke SG, Nottingham EW, Cox J, et al: Short report: proximity tomosquito breeding sites as a risk factor for clinical malaria episodes inan urban cohort of Ugandan children. Am J Trop Med Hyg 2003,69:244-246.
13. Trape JF, Zoulani A: Malaria and urbanization in central Africa: theexample of Brazzaville. Part II: Results of entomological surveys andepidemiological analysis. Trans R Soc Trop Med Hyg 1987, 81(Suppl2):10-18.
14. Machault V, Gadiaga L, Vignolles C, Jarjaval F, Bouzid S, Sokhna C,Lacaux JP, Trape JF, Rogier C, Pages F: Highly focused anophelinebreeding sites and malaria transmission in Dakar. Malar J 2009, 8:138.
15. Carter R, Mendis KN, Roberts D: Spatial targeting of interventions againstmalaria. Bull World Health Organ 2000, 78:1401-1411.
16. Thomson MC, Connors SJ, Milligan PJM, Flasse SP: The ecology of malaria -as seen from Earth-observation satellites. Ann Trop Med Parasitol 1996,90:243-264.
17. Rogers DJ, Randolph SE, Snow RW, Hay SI: Satellite imagery in the studyand forecast of malaria. Nature 2002, 415:710-715.
18. Ceccato P, Connor S, Jeanne I, Thomson M: Application of GeographicalInformation Systems and Remote Sensing technologies for assessingand monitoring malaria risk. Parassitologia 2005, 47:81-96.
19. Beck LR, Lobitz BM, Wood BL: Remote Sensing and Human Health: NewSensors and New Opportunities. Emerg Infect Dis 2000, 6:217-226.
20. Machault V, Pages F, Rogier C: [Contribution of remote sensing to malariacontrol]. Med Trop (Mars) 2009, 69:151-159.
21. Jacob BG, Regens JL, Mbogos CM, Githeko AK, Swalm CM, Githure JI,Beier JC: Capabilities of multispectral thermal data for identification ofAnopheles gambiae mosquito larval habitats in African urbanenvironments. Int J Remote Sens 2005, 26:523-534.
22. Eisele TP, Keating J, Swalm C, Mbogo CM, Githeko AK, Regens JL, Githure JI,Andrews L, Beier JC: Linking field-based ecological data with remotelysensed data using a geographic information system in two malariaendemic urban areas of Kenya. Malar J 2003, 2:44.
23. Jacob B, Regens JL, Mbogo CM, Githeko AK, Keating J, Swalm CM,Gunter JT, Githure JI, Beier JC: Occurrence and distribution of Anopheles(Diptera: Culicidae) larval habitats on land cover change sites in urbanKisumu and urban Malindi, Kenya. J Med Entomol 2003, 40:777-784.
24. Baragatti M, Fournet F, Henry MC, Assi S, Ouedraogo H, Rogier C, Salem G:Social and environmental malaria risk factors in urban areas ofOuagadougou, Burkina Faso. Malar J 2009, 8:13.
25. Diallo S, Konate L, Faye O, Ndir O, Faye M, Gueye A, Diouf M: [Malaria inthe southern sanitary district of Dakar (Senegal). 2. Entomologic data].Bull Soc Pathol Exot 1998, 91:259-263.
26. Diallo S, Konate L, Ndir O, Dieng T, Dieng Y, Bah IB, Faye O, Gaye O:[Malaria in the central health district of Dakar (Senegal). Entomological,parasitological and clinical data]. Sante 2000, 10:221-229.
27. Rey M, Camerlynck P, Mar ID, Lafaix C, Sow A: [Paludism in the Dakarmetropolitan area (from hospital experience)]. Bull Soc Med Afr Noire LangFr 1968, 13:353-365.
28. Soumare M, Seydi M, Diop SA, Ba TA, Ndour CT, Dieng Y, Diop BM, Sow PS:[The place of malaria in an infectious disease department in Dakar,Senegal]. Med Trop (Mars) 2008, 68:485-490.
29. Imbert P, Candito D, Ka S, Sartelet I, Baujat G, Rogier C: [Severe malaria inchildren from the seasonal low-transmission zone of Senegal: effect ofage on the clinical manifestations]. Dakar Med 1997, 42:44-48.
30. Sartelet H, Rogier C, Milko-Sartelet I, Angel G, Michel G: Malaria associatedpre-eclampsia in Senegal. Lancet 1996, 347:1121.
31. Pages F, Texier G, Pradines B, Gadiaga L, Machault V, Jarjaval F, Penhoat K,Berger F, Trape JF, Rogier C, Sokhna C: Malaria transmission in Dakar: atwo-year survey. Malar J 2008, 7:178.
32. Vercruysse J, Jancloes M: Etude entomologique sur la transmission dupaludisme humain dans la zone de Pikine (Sénégal). Cah Orstom, Ser EntMed Parasitol 1981, 19:165-178.
33. SPOT IMAGE. [http://www.spotimage.com].34. Kruse FA, Raines Gl, Watson K: Analytical techniques for extracting
geologic information from multichannel airborne spectroradiometer andairborne imaging spectrometer data. Proceedings, 4th Thematic Conferenceon Remote Sensing for Exploration Geology, Environmental Research Instituteof Michigan (ERIM): 1985; Ann Arbor 1985.
35. Kruse FA: use of Airborne Imaging Spectrometer data to map mineralsassociated with hydrothermally altered rocks in the northern GrapevineMountains, Nevada and California. Rem Sens Environ 1988, 24:31-51.
36. Britch SC, Linthicum KJ, Anyamba A, Tucker CJ, Pak EW, Maloney FA,Cobb K, Stanwix E, Humphries J, Spring A, Pagac B, Miller M: Satellitevegetation index data as a tool to forecast population dynamics ofmedically important mosquitoes at military installations in thecontinental Unites States. Military Med 2008, 173:677-683.
37. Patz JA, Strzepek K, Lele S, Hedden M, Greene S, Noden B, Hay SI,Kalkstein L, Beier JC: Predicting key malaria transmission factors, bitingand entomological inoculation rates, using modelled soil moisture inKenya. Trop Med Int Health 1998, 3:818-827.
38. Thomson MC, Connor SJ, d’Allessandro U, Rowlingson B, Diggle P,Cresswell M, Greenwood B: Predicting malaria infection in gambianchildren from satellite data and bed net use surveys: the importance of
Machault et al. Malaria Journal 2010, 9:252http://www.malariajournal.com/content/9/1/252
Page 13 of 14
spatial correlation in the interpretation of results. Am J Trop Med Hyg1999, 61:2-8.
39. Hay SI, Snow RW, Rogers DJ: Predicting malaria seasons in Kenya usingmutitemporal meteorological satellite sensor data. Trans R Soc Trop MedHyg 1998, 92:12-20.
40. Nihei N, Hashida Y, Kobayashi M, Ishii A: Analysis of malaria endemic areason the Indochina peninsula using remote sensing. Jpn J Infect Dis 2002,55:160-166.
41. Girod R, Orlandi-Pradines E, Rogier C, Pages F: Malaria transmission andinsecticide resistance of Anopheles gambiae (Diptera: Culicidae) in theFrench military camp of Port-Bouet, Abidjan (Cote d’Ivoire): implicationsfor vector control. J Med Entomol 2006, 43:1082-1087.
42. Matthys B, N’Goran EK, Kone M, Koudou BG, Vounatsou P, Cisse G,Tschannen AB, Tanner M, Utzinger J: Urban agricultural land use andcharacterization of mosquito larval habitats in a medium-sized town ofCote d’Ivoire. J Vector Ecol 2006, 31:319-333.
43. Afrane YA, Klinkenberg E, Drechsel P, Owusu-Daaku K, Garms R, Kruppa T:Does irrigated urban agriculture influence the transmission of malaria inthe city of Kumasi, Ghana? Acta Trop 2004, 89:125-134.
44. Klinkenberg E, McCall PJ, Hastings IM, Wilson MD, Amerasinghe FP,Donnelly MJ: Malaria and irrigated crops, Accra, Ghana. Emerg Infect Dis2005, 11:1290-1293.
45. Wang SJ, Lengeler C, Smith TA, Vounatsou P, Diadie DA, Pritroipa X,Convelbo N, Kientga M, Tanner M: Rapid urban malaria appraisal (RUMA)I: epidemiology of urban malaria in Ouagadougou. Malar J 2005, 4:43.
46. Awono-Ambéné HP, Robert V: Survival and emergence of immatureAnopheles arabiensis mosquitoes in market-gardener wells in Dakar,Senegal. Parasite 1999, 6:179-184.
47. Klinkenberg E, McCall P, Wilson MD, Amerasinghe FP, Donnelly MJ: Impactof urban agriculture on malaria vectors in Accra, Ghana. Malar J 2008,7:151.
48. Walsh J-F, Molyneux D-H, Birley M-H: Deforestation: effects on vector-borne disease. Parasitology 1993, 106:S55-75.
49. Beck LR, Rodriguez MH, Dister SW, Rodriguez AD, Rejmankova E, Ulloa A,Meza RA, Roberts DR, Paris JF, Spanner MA, Washino RK, Hacker C,Legters LJ: Remote sensing as a landscape epidemiologic tool to identifyvillages at high risk for malaria transmission. Am J Trop Med Hyg 1994,51:271-280.
50. Tatem AJ, Hay SI: Measuring urbanization pattern and extent for malariaresearch: a review of remote sensing approaches. J Urban Health 2004,81:363-376.
51. Brown H, Duik-Wasser M, Andreadis T, Fish D: Remotely-sensed vegetationindices identify mosquito clusters of West Nile virus vectors in an urbanlandscape in the northeastern United States. Vector Borne Zoonotic Dis2008, 8:197-206.
52. Vasconcelos CH, Novo EM, Donalisio MR: [Use of remote sensing to studythe influence of environmental changes on malaria distribution in theBrazilian Amazon]. Cad Saude Publica 2006, 22:517-526.
53. Caldas de Castro M, Yamagata Y, Mtasiwa D, Tanner M, Utzinger J, Keiser J,Singer BH: Integrated urban malaria control: a case study in Dar esSalaam, Tanzania. Am J Trop Med Hyg 2004, 71:103-117.
54. Kaya S, Pultz TJ, Mbogo CM, Beier JC, Mushinzimana E: The use of radarremote sensing for identifying environmental factors associated withmalaria risk in coastal Kenya. International Geoscience and Remote SensingSymposium (IGARSS ‘02): June 24-28 2002; Toronto 2002.
55. Diuk-Wasser MA, Dolo G, Bagayoko M, Sogoba N, Toure MB,Moghaddam M, Manoukis N, Rian S, Traore SF, Taylor CE: Patterns ofirrigated rice growth and malaria vector breeding in Mali using multi-temporal ERS-2 synthetic aperture radar. Int J Remote Sens 2006,27:535-548.
56. Rakotomanana F, Jolivet L, Randremanana RV, Rudant JP: Remote sensingand urban malaria: radar Envisat contribution for the determination ofpotential Anopheles breeding site in Antananarivo (Madagascar). EnvisatSymposium Montreux, Switzerland 2007.
57. Singh A: Digital change detection techniques using remotely-senseddata. Int J Remote Sens 1989, 10:989-1003.
58. Masuoka PM, Claborn DM, Andre RG, Nigro J, Gordon SW, Klein TA, Kim H-C: Use of IKONOS and Landsat for malaria control in the Republic ofKorea. Rem Sens Environ 2003, 88:187-194.
doi:10.1186/1475-2875-9-252Cite this article as: Machault et al.: Spatial heterogeneity and temporalevolution of malaria transmission risk in Dakar, Senegal, according toremotely sensed environmental data. Malaria Journal 2010 9:252.
Submit your next manuscript to BioMed Centraland take full advantage of:
• Convenient online submission
• Thorough peer review
• No space constraints or color figure charges
• Immediate publication on acceptance
• Inclusion in PubMed, CAS, Scopus and Google Scholar
• Research which is freely available for redistribution
Submit your manuscript at www.biomedcentral.com/submit
Machault et al. Malaria Journal 2010, 9:252http://www.malariajournal.com/content/9/1/252
Page 14 of 14
Related Documents