See discussions, stats, and author profiles for this publication at: https://www.researchgate.net/publication/316549039 Spatial analysis of housing quality in Nigeria Article · April 2017 DOI: 10.1016/j.ijsbe.2017.03.008 CITATIONS 12 READS 529 6 authors, including: Some of the authors of this publication are also working on these related projects: Spatial Analysis of Housing Quality in Nigeria View project conference paper View project Oluwole Morenikeji Federal University of Technology Minna 38 PUBLICATIONS 76 CITATIONS SEE PROFILE Emmanuel Tanko Umaru Federal University of Technology Minna 7 PUBLICATIONS 32 CITATIONS SEE PROFILE Solomon Jiya 2 PUBLICATIONS 17 CITATIONS SEE PROFILE Idowu Owoeye Federal University of Technology Minna 5 PUBLICATIONS 15 CITATIONS SEE PROFILE All content following this page was uploaded by Idowu Owoeye on 17 June 2020. The user has requested enhancement of the downloaded file.

Welcome message from author
This document is posted to help you gain knowledge. Please leave a comment to let me know what you think about it! Share it to your friends and learn new things together.
Transcript

See discussions, stats, and author profiles for this publication at: https://www.researchgate.net/publication/316549039
Spatial analysis of housing quality in Nigeria
Article · April 2017
DOI: 10.1016/j.ijsbe.2017.03.008
CITATIONS
12READS
529
6 authors, including:
Some of the authors of this publication are also working on these related projects:
Spatial Analysis of Housing Quality in Nigeria View project
conference paper View project
Oluwole Morenikeji
Federal University of Technology Minna
38 PUBLICATIONS 76 CITATIONS
SEE PROFILE
Emmanuel Tanko Umaru
Federal University of Technology Minna
7 PUBLICATIONS 32 CITATIONS
SEE PROFILE
Solomon Jiya
2 PUBLICATIONS 17 CITATIONS
SEE PROFILE
Idowu Owoeye
Federal University of Technology Minna
5 PUBLICATIONS 15 CITATIONS
SEE PROFILE
All content following this page was uploaded by Idowu Owoeye on 17 June 2020.
The user has requested enhancement of the downloaded file.
International Journal of Sustainable Built Environment (2017) xxx, xxx–xxx
HO ST E D BYGulf Organisation for Research and Development
International Journal of Sustainable Built Environment
ScienceDirectwww.sciencedirect.com
Spatial analysis of housing quality in Nigeria
Wole Morenikeji a,⇑, Emmanuel Umaru a, Halilu Pai b, Solomon Jiya b, Owoeye Idowu a,B.M. Adeleye a
aFederal University of Technology, Minna, Nigeriab Ibrahim Badamasi Babangida University, Lapai, Nigeria
Received 26 May 2016; accepted 31 March 2017
Abstract
The study examined the factors responsible for the spatial variation in housing quality across the 36 states and the Federal CapitalTerritory in Nigeria using 33 housing characteristics. The data used are the 2006 Housing Characteristics and Amenities tables whichwere sourced from Nigeria’s National Population Commission (National Population Commission, 2006). Principal Component Analysisextracted three components. Component 1 accounting for 38% has electricity, water closet toilet, hygienic sources of water and high qual-ity roofing, walling and flooring materials highly loaded on it. Component 2 (31%) comprised inferior walling, roofing and flooring mate-rials, pit toilet, traditional and semi-detached house types, while component 3 (7%) had mainly zinc wall and public toilet highly loadedon it. Using these factor loadings as variables in discriminant analysis, three distinct regions of differing housing quality emerged cor-responding to the western, eastern and northern geographical regions of the country with 97.3% of the states correctly classified and withthe western (high) and northern (low) states at the opposite ends of the quality scale. It is recommended that non-conforming buildings,particularly, residential, and insanitary environment should be put in check through very strict and proactive enforcement of develop-ment control edicts and sanitary laws.� 2017 The Gulf Organisation for Research and Development. Production and hosting by Elsevier B.V.
Keywords: Housing quality; Spatial variation; Regional differentiation
1. Introduction
Housing quality studies can be justified because it is anindispensable, social and physical infrastructure whosequality and quantity, serves as an instrument for measuringthe standard of living, the level of technological advance-ment, culture and civilization (Mbina, 2007). The problem
http://dx.doi.org/10.1016/j.ijsbe.2017.03.008
2212-6090/� 2017 The Gulf Organisation for Research and Development. Pro
⇑ Corresponding author.E-mail address: [email protected] (W. Morenikeji).
Peer review under responsibility of The Gulf Organisation for Researchand Development.
Please cite this article in press as: Morenikeji, W. et al. Spatial analysis of houonment (2017), http://dx.doi.org/10.1016/j.ijsbe.2017.03.008
of deficiency in housing quality in Nigeria is common bothin urban and rural areas. The situation is very severe inurban areas due to the fact that most people live in housesthat are poor in terms of quality with unsatisfactory envi-ronments. The population growth resulting from rural–ur-ban migration and rapid urbanization is the cause whichleads to homelessness, the growth of slums and overcrowd-ing (Mabogunje, 1975; Olotuah and Adesiji, 2005;Lawanson, 2006; Adeleye and Anofojie, 2011).
Quite a lot of studies have been conducted in Nigeria onhousing condition and quality with only few undertaken atthe national scale. Comprehensive surveys both at local
duction and hosting by Elsevier B.V.
sing quality in Nigeria. International Journal of Sustainable Built Envir-
Wole
Typewritten text
© <2017>. This manuscript version is made available under the CC-BY-NC-ND 4.0 license http://creativecommons.org/licenses/by-nc-nd/4.0/
2 W. Morenikeji et al. / International Journal of Sustainable Built Environment xxx (2017) xxx–xxx
and national scales have also not been attempted as whatexist are purely sample surveys which, of course, are sub-ject to sampling errors. Furthermore, the majority of thesestudies are centred on urban area where interests in identi-fying slum areas within the cities have taken the centrestage. Some of the recent studies include correlates of hous-ing problems in slum areas (Ekop, 2012; Ogunleye, 2013;Uwadiegwu, 2013), spatial structure of housing quality(Aderamo and Ayobolu, 2010) and perception of housingquality (Adeleye et al., 2014).
The work of Abumere (1987) is an example of studiescarried out at the national scale. He studied 40 cities cut-ting across various Nigerian city typologies – traditional,non-traditional and modern cities, cities serving as statecapitals, industrial and non-industrial cities, metropolitan,large, medium and small cities reflecting ecological condi-tions. He noted that as a result of low building technologyand absence of durable building materials, no more thannine percent of the houses surveyed were built of mudand bricks which had very short life spans. He furtherobserved that the only cities with a reasonable percentageof buildings older than 80 years were the coastal townslocated on sea and river ports and few other hinterlandcities that formed contact points for colonial trade andadministration. These cities include Sapele, Oshogbo,Kano, Owerri, Forcados, Bururtu, Calabar, Warri, Benin,Lagos, Ibadan, Onitsha and Asaba.
Another comprehensive survey with emphasis on ruralareas across southern Nigeria was that of the FederalMinistry of Housing and Environment (1982) whichobserved a marked variation in the character and structureof rural settlement. The study noted that in some states likeImo, Anambra and Bendel (now Edo and Delta) stateswhere it is often quite difficult to differentiate the ruralareas from the urban centres the housing type, commercialstructure and land use pattern in even the smallest rural set-tlements are quite similar to those of the urban centres.This is in contradistinction with the south western statesof Ogun, Oyo, Ondo and Lagos, where rural settlementsare in many respects different from urban centres. Thesedifferences are attributed by the report to the traditionalsocial organization of the people in the two groups ofstates.
In terms of quality of total housing stock in the country,NISER (2005) estimated that as at 2000, the proportion ofhousing units with sound structure (44.5%) was less thanhalf of the total stock in the country. These findings havebeen corroborated by a micro study at Yenagoa by Edeet al. (2007) who concluded that only 9% of the houses sur-veyed are older than 21 years yet only 14% are well main-tained and need no repairs.
From these studies, certain factors begin to emergewhich are germane to explaining the spatial variations ofhousing quality across Nigeria and these include age, qual-ity of building materials, location, early contact with colo-nial administration, maintenance culture and socio-culturalfactors.
Please cite this article in press as: Morenikeji, W. et al. Spatial analysis of houonment (2017), http://dx.doi.org/10.1016/j.ijsbe.2017.03.008
The Principal Components Analysis (PCA) has beenemployed to construct environmental quality index, extractfactors to explain housing quality and spatial distributionover space. In their study in Ilorin, Nigeria, Aderamoand Ayobolu (2010) identified five most important factorsthat can be used to describe housing quality in Ilorin. Theseare internal facilities; major materials for roofing and mate-rials for external walls; the type of toilet and bathroomfacilities available and if the centrally provided electricityby the Power Holding Company of Nigeria (PHCN) isavailable.
The type of variables included in housing quality analy-sis varies across studies and this depends on the focus ofstudy. The literature contains various environmental qual-ity studies. It is remarkable that researchers have beenfocussing on three main areas when examining environ-mental quality as it relates to housing and its environment.The first area is examining the relationship between envi-ronmental quality of housing areas and users’ well-being,the second is by focusing on housing and its environmentvia user satisfaction and perception while the third is con-cerned with environmental quality as a factor in housingprice structure (Alkay, 2009).
Studies that belong to these groups include housing andsales prices (Alkay, 2009), housing and inequality in socio-economic characteristics (Odoi et al., 2005; Owens, 2012),Environmental quality and malaria and diarrhoea mortal-ity (Fobil et al., 2011), public housing and users’ satisfac-tion (Ojo and Oloruntoba, 2012) and urbanenvironmental quality and human well-being (Pacione,2003), among others. Yet, there are other studies concernedwith measuring housing quality or deterioration alone(Fiadzo, 1982; Bunch, 1996; Craig et al., 2001; Khatun,2007).
Consequently, variables used range from flooring,walling and roofing materials to type of toilet facility,sources of water and lighting, drainage, street quality,proximity to other facilities and socio-economic variableslike education, income, religion and race. This currentstudy examines the physical quality of houses and theirdistribution across the states and regions in Nigeria inthe light of comprehensive data provided by the 2006housing and amenities survey by the National PopulationCommission as opposed to opinion surveys typified byAnofojie et al. (2014) study of Lagos. The aim is to iden-tify the underlying characteristics of housing thataccount for the spatial housing quality distribution inNigeria.
The objectives of this study are threefold. First, theattempt was to identify the various dimensions thataccount for the distribution of housing quality in Nigeriausing the method of Principal Component Analysis. Sec-ond, the study examined how the housing quality variesacross the states based on the extracted components andfinally the regional clustering, pattern that emerged basedon the housing quality analysis was identified.
sing quality in Nigeria. International Journal of Sustainable Built Envir-
W. Morenikeji et al. / International Journal of Sustainable Built Environment xxx (2017) xxx–xxx 3
2. Methodology
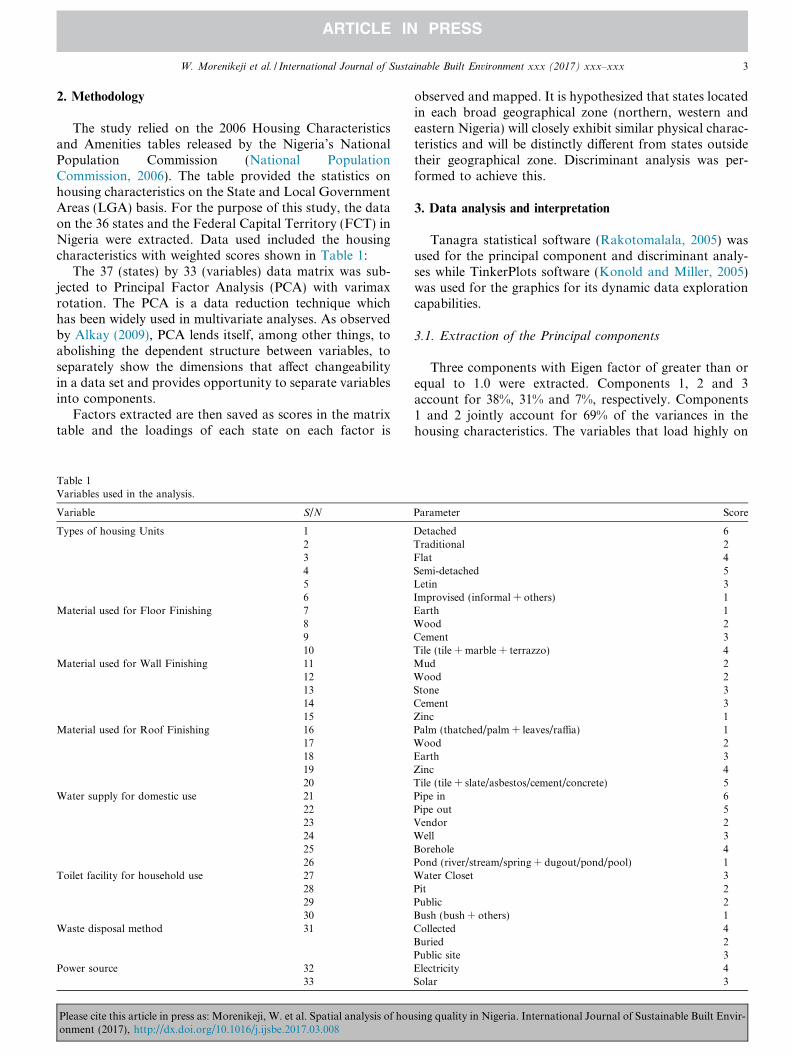
The study relied on the 2006 Housing Characteristicsand Amenities tables released by the Nigeria’s NationalPopulation Commission (National PopulationCommission, 2006). The table provided the statistics onhousing characteristics on the State and Local GovernmentAreas (LGA) basis. For the purpose of this study, the dataon the 36 states and the Federal Capital Territory (FCT) inNigeria were extracted. Data used included the housingcharacteristics with weighted scores shown in Table 1:
The 37 (states) by 33 (variables) data matrix was sub-jected to Principal Factor Analysis (PCA) with varimaxrotation. The PCA is a data reduction technique whichhas been widely used in multivariate analyses. As observedby Alkay (2009), PCA lends itself, among other things, toabolishing the dependent structure between variables, toseparately show the dimensions that affect changeabilityin a data set and provides opportunity to separate variablesinto components.
Factors extracted are then saved as scores in the matrixtable and the loadings of each state on each factor is
Table 1Variables used in the analysis.
Variable S/N
Types of housing Units 123456
Material used for Floor Finishing 78910
Material used for Wall Finishing 1112131415
Material used for Roof Finishing 1617181920
Water supply for domestic use 212223242526
Toilet facility for household use 27282930
Waste disposal method 31
Power source 3233
Please cite this article in press as: Morenikeji, W. et al. Spatial analysis of houonment (2017), http://dx.doi.org/10.1016/j.ijsbe.2017.03.008
observed and mapped. It is hypothesized that states locatedin each broad geographical zone (northern, western andeastern Nigeria) will closely exhibit similar physical charac-teristics and will be distinctly different from states outsidetheir geographical zone. Discriminant analysis was per-formed to achieve this.
3. Data analysis and interpretation
Tanagra statistical software (Rakotomalala, 2005) wasused for the principal component and discriminant analy-ses while TinkerPlots software (Konold and Miller, 2005)was used for the graphics for its dynamic data explorationcapabilities.
3.1. Extraction of the Principal components
Three components with Eigen factor of greater than orequal to 1.0 were extracted. Components 1, 2 and 3account for 38%, 31% and 7%, respectively. Components1 and 2 jointly account for 69% of the variances in thehousing characteristics. The variables that load highly on
Parameter Score
Detached 6Traditional 2Flat 4Semi-detached 5Letin 3Improvised (informal + others) 1Earth 1Wood 2Cement 3Tile (tile + marble + terrazzo) 4Mud 2Wood 2Stone 3Cement 3Zinc 1Palm (thatched/palm + leaves/raffia) 1Wood 2Earth 3Zinc 4Tile (tile + slate/asbestos/cement/concrete) 5Pipe in 6Pipe out 5Vendor 2Well 3Borehole 4Pond (river/stream/spring + dugout/pond/pool) 1Water Closet 3Pit 2Public 2Bush (bush + others) 1Collected 4Buried 2Public site 3Electricity 4Solar 3
sing quality in Nigeria. International Journal of Sustainable Built Envir-
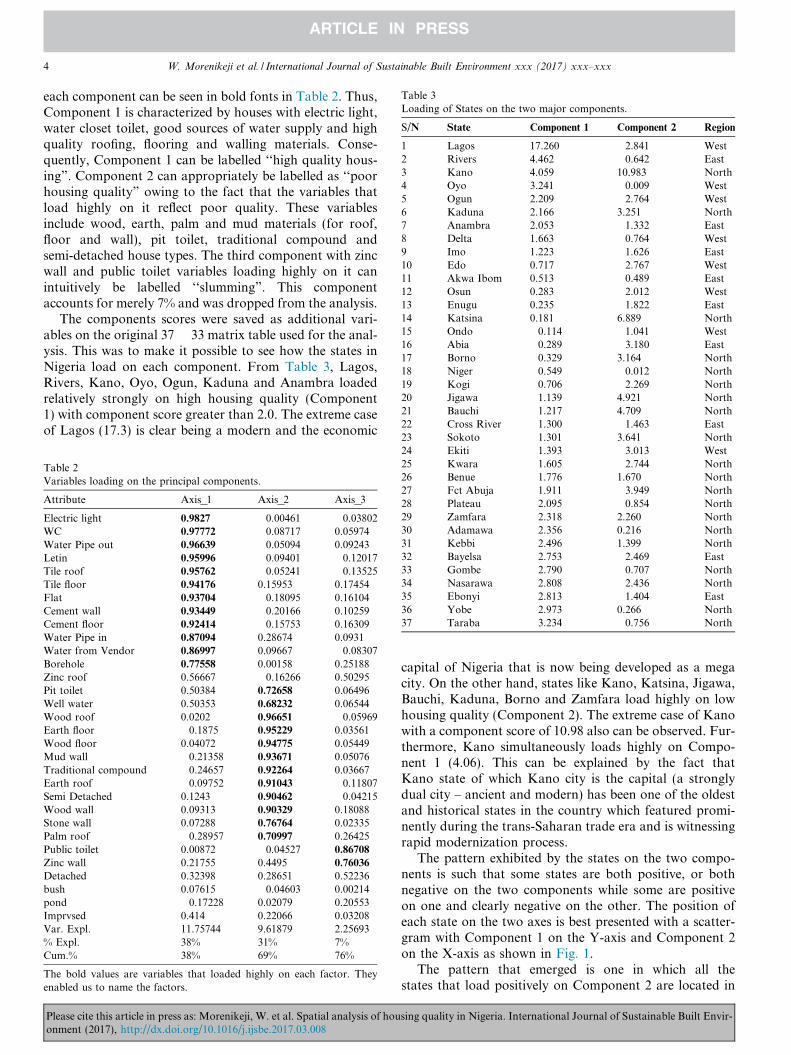
Table 3Loading of States on the two major components.
S/N State Component 1 Component 2 Region
1 Lagos 17.260 �2.841 West2 Rivers 4.462 �0.642 East3 Kano 4.059 10.983 North4 Oyo 3.241 �0.009 West5 Ogun 2.209 �2.764 West6 Kaduna 2.166 3.251 North7 Anambra 2.053 �1.332 East8 Delta 1.663 �0.764 West9 Imo 1.223 �1.626 East10 Edo 0.717 �2.767 West11 Akwa Ibom 0.513 �0.489 East12 Osun 0.283 �2.012 West13 Enugu 0.235 �1.822 East14 Katsina 0.181 6.889 North15 Ondo �0.114 �1.041 West16 Abia �0.289 �3.180 East17 Borno �0.329 3.164 North18 Niger �0.549 �0.012 North19 Kogi �0.706 �2.269 North20 Jigawa �1.139 4.921 North21 Bauchi �1.217 4.709 North22 Cross River �1.300 �1.463 East23 Sokoto �1.301 3.641 North
4 W. Morenikeji et al. / International Journal of Sustainable Built Environment xxx (2017) xxx–xxx
each component can be seen in bold fonts in Table 2. Thus,Component 1 is characterized by houses with electric light,water closet toilet, good sources of water supply and highquality roofing, flooring and walling materials. Conse-quently, Component 1 can be labelled ‘‘high quality hous-ing”. Component 2 can appropriately be labelled as ‘‘poorhousing quality” owing to the fact that the variables thatload highly on it reflect poor quality. These variablesinclude wood, earth, palm and mud materials (for roof,floor and wall), pit toilet, traditional compound andsemi-detached house types. The third component with zincwall and public toilet variables loading highly on it canintuitively be labelled ‘‘slumming”. This componentaccounts for merely 7% and was dropped from the analysis.
The components scores were saved as additional vari-ables on the original 37 � 33 matrix table used for the anal-ysis. This was to make it possible to see how the states inNigeria load on each component. From Table 3, Lagos,Rivers, Kano, Oyo, Ogun, Kaduna and Anambra loadedrelatively strongly on high housing quality (Component1) with component score greater than 2.0. The extreme caseof Lagos (17.3) is clear being a modern and the economic
Table 2Variables loading on the principal components.
Attribute Axis_1 Axis_2 Axis_3
Electric light 0.9827 �0.00461 �0.03802WC 0.97772 �0.08717 0.05974Water Pipe out 0.96639 �0.05094 0.09243Letin 0.95996 �0.09401 �0.12017Tile roof 0.95762 �0.05241 �0.13525Tile floor 0.94176 0.15953 0.17454Flat 0.93704 �0.18095 0.16104Cement wall 0.93449 �0.20166 0.10259Cement floor 0.92414 �0.15753 0.16309Water Pipe in 0.87094 0.28674 0.0931Water from Vendor 0.86997 0.09667 �0.08307Borehole 0.77558 0.00158 0.25188Zinc roof 0.56667 �0.16266 0.50295Pit toilet 0.50384 0.72658 0.06496Well water 0.50353 0.68232 0.06544Wood roof 0.0202 0.96651 �0.05969Earth floor �0.1875 0.95229 0.03561Wood floor 0.04072 0.94775 0.05449Mud wall �0.21358 0.93671 0.05076Traditional compound �0.24657 0.92264 0.03667Earth roof �0.09752 0.91043 �0.11807Semi Detached 0.1243 0.90462 �0.04215Wood wall 0.09313 0.90329 0.18088Stone wall 0.07288 0.76764 0.02335Palm roof �0.28957 0.70997 0.26425Public toilet 0.00872 �0.04527 0.86708
Zinc wall 0.21755 0.4495 0.76036
Detached 0.32398 0.28651 0.52236bush 0.07615 �0.04603 0.00214pond �0.17228 0.02079 0.20553Imprvsed 0.414 0.22066 0.03208Var. Expl. 11.75744 9.61879 2.25693% Expl. 38% 31% 7%Cum.% 38% 69% 76%
The bold values are variables that loaded highly on each factor. Theyenabled us to name the factors.
24 Ekiti �1.393 �3.013 West25 Kwara �1.605 �2.744 North26 Benue �1.776 1.670 North27 Fct Abuja �1.911 �3.949 North28 Plateau �2.095 �0.854 North29 Zamfara �2.318 2.260 North30 Adamawa �2.356 0.216 North31 Kebbi �2.496 1.399 North32 Bayelsa �2.753 �2.469 East33 Gombe �2.790 �0.707 North34 Nasarawa �2.808 �2.436 North35 Ebonyi �2.813 �1.404 East36 Yobe �2.973 0.266 North37 Taraba �3.234 �0.756 North
Please cite this article in press as: Morenikeji, W. et al. Spatial analysis of houonment (2017), http://dx.doi.org/10.1016/j.ijsbe.2017.03.008
capital of Nigeria that is now being developed as a megacity. On the other hand, states like Kano, Katsina, Jigawa,Bauchi, Kaduna, Borno and Zamfara load highly on lowhousing quality (Component 2). The extreme case of Kanowith a component score of 10.98 also can be observed. Fur-thermore, Kano simultaneously loads highly on Compo-nent 1 (4.06). This can be explained by the fact thatKano state of which Kano city is the capital (a stronglydual city – ancient and modern) has been one of the oldestand historical states in the country which featured promi-nently during the trans-Saharan trade era and is witnessingrapid modernization process.
The pattern exhibited by the states on the two compo-nents is such that some states are both positive, or bothnegative on the two components while some are positiveon one and clearly negative on the other. The position ofeach state on the two axes is best presented with a scatter-gram with Component 1 on the Y-axis and Component 2on the X-axis as shown in Fig. 1.
The pattern that emerged is one in which all thestates that load positively on Component 2 are located in
sing quality in Nigeria. International Journal of Sustainable Built Envir-
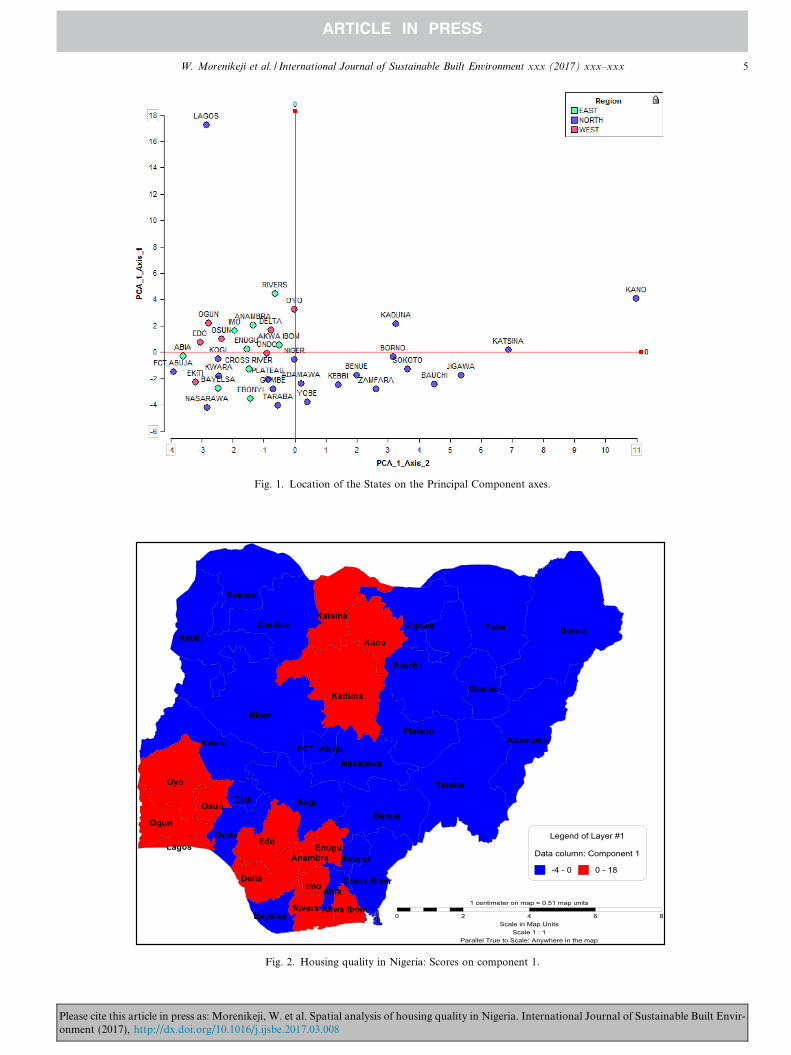
Fig. 1. Location of the States on the Principal Component axes.
Abia
Adamawa
Akwa Ibom
Anambra
Bauchi
Bayelsa
Benue
Borno
Cross RiverDelta
Ebonyi
Edo
Ekiti
Enugu
FCT, Abuja
Gombe
Imo
Jigawa
Kaduna
Kano
Katsina
Kebbi
Kogi
Kwara
Lagos
Nasarawa
Niger
OgunOndo
Osun
Oyo
Plateau
Rivers
Sokoto
Taraba
YobeZamfara
0 2 4 6 8Scale in Map Units
Scale 1 : 1Parallel True to Scale: Anywhere in the map
1 centimeter on map = 0.51 map units
Legend of Layer #1
Data column: Component 1
-4 - 0 0 - 18
Fig. 2. Housing quality in Nigeria: Scores on component 1.
W. Morenikeji et al. / International Journal of Sustainable Built Environment xxx (2017) xxx–xxx 5
Please cite this article in press as: Morenikeji, W. et al. Spatial analysis of housing quality in Nigeria. International Journal of Sustainable Built Envir-onment (2017), http://dx.doi.org/10.1016/j.ijsbe.2017.03.008
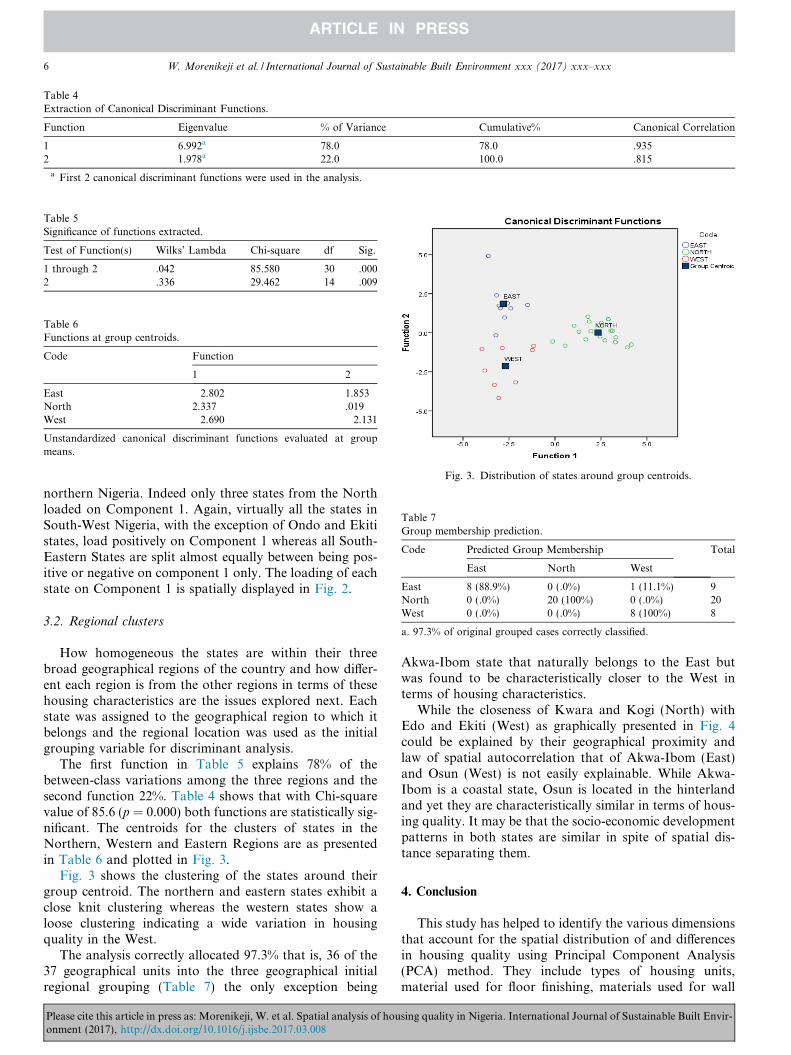
Table 5Significance of functions extracted.
Test of Function(s) Wilks’ Lambda Chi-square df Sig.
1 through 2 .042 85.580 30 .0002 .336 29.462 14 .009
Table 4Extraction of Canonical Discriminant Functions.
Function Eigenvalue % of Variance Cumulative% Canonical Correlation
1 6.992a 78.0 78.0 .9352 1.978a 22.0 100.0 .815
a First 2 canonical discriminant functions were used in the analysis.
Table 6Functions at group centroids.
Code Function
1 2
East �2.802 1.853North 2.337 .019West �2.690 �2.131
Unstandardized canonical discriminant functions evaluated at groupmeans.
Fig. 3. Distribution of states around group centroids.
Table 7Group membership prediction.
Code Predicted Group Membership Total
East North West
East 8 (88.9%) 0 (.0%) 1 (11.1%) 9North 0 (.0%) 20 (100%) 0 (.0%) 20West 0 (.0%) 0 (.0%) 8 (100%) 8
a. 97.3% of original grouped cases correctly classified.
6 W. Morenikeji et al. / International Journal of Sustainable Built Environment xxx (2017) xxx–xxx
northern Nigeria. Indeed only three states from the Northloaded on Component 1. Again, virtually all the states inSouth-West Nigeria, with the exception of Ondo and Ekitistates, load positively on Component 1 whereas all South-Eastern States are split almost equally between being pos-itive or negative on component 1 only. The loading of eachstate on Component 1 is spatially displayed in Fig. 2.
3.2. Regional clusters
How homogeneous the states are within their threebroad geographical regions of the country and how differ-ent each region is from the other regions in terms of thesehousing characteristics are the issues explored next. Eachstate was assigned to the geographical region to which itbelongs and the regional location was used as the initialgrouping variable for discriminant analysis.
The first function in Table 5 explains 78% of thebetween-class variations among the three regions and thesecond function 22%. Table 4 shows that with Chi-squarevalue of 85.6 (p = 0.000) both functions are statistically sig-nificant. The centroids for the clusters of states in theNorthern, Western and Eastern Regions are as presentedin Table 6 and plotted in Fig. 3.
Fig. 3 shows the clustering of the states around theirgroup centroid. The northern and eastern states exhibit aclose knit clustering whereas the western states show aloose clustering indicating a wide variation in housingquality in the West.
The analysis correctly allocated 97.3% that is, 36 of the37 geographical units into the three geographical initialregional grouping (Table 7) the only exception being
Please cite this article in press as: Morenikeji, W. et al. Spatial analysis of houonment (2017), http://dx.doi.org/10.1016/j.ijsbe.2017.03.008
Akwa-Ibom state that naturally belongs to the East butwas found to be characteristically closer to the West interms of housing characteristics.
While the closeness of Kwara and Kogi (North) withEdo and Ekiti (West) as graphically presented in Fig. 4could be explained by their geographical proximity andlaw of spatial autocorrelation that of Akwa-Ibom (East)and Osun (West) is not easily explainable. While Akwa-Ibom is a coastal state, Osun is located in the hinterlandand yet they are characteristically similar in terms of hous-ing quality. It may be that the socio-economic developmentpatterns in both states are similar in spite of spatial dis-tance separating them.
4. Conclusion
This study has helped to identify the various dimensionsthat account for the spatial distribution of and differencesin housing quality using Principal Component Analysis(PCA) method. They include types of housing units,material used for floor finishing, materials used for wall
sing quality in Nigeria. International Journal of Sustainable Built Envir-
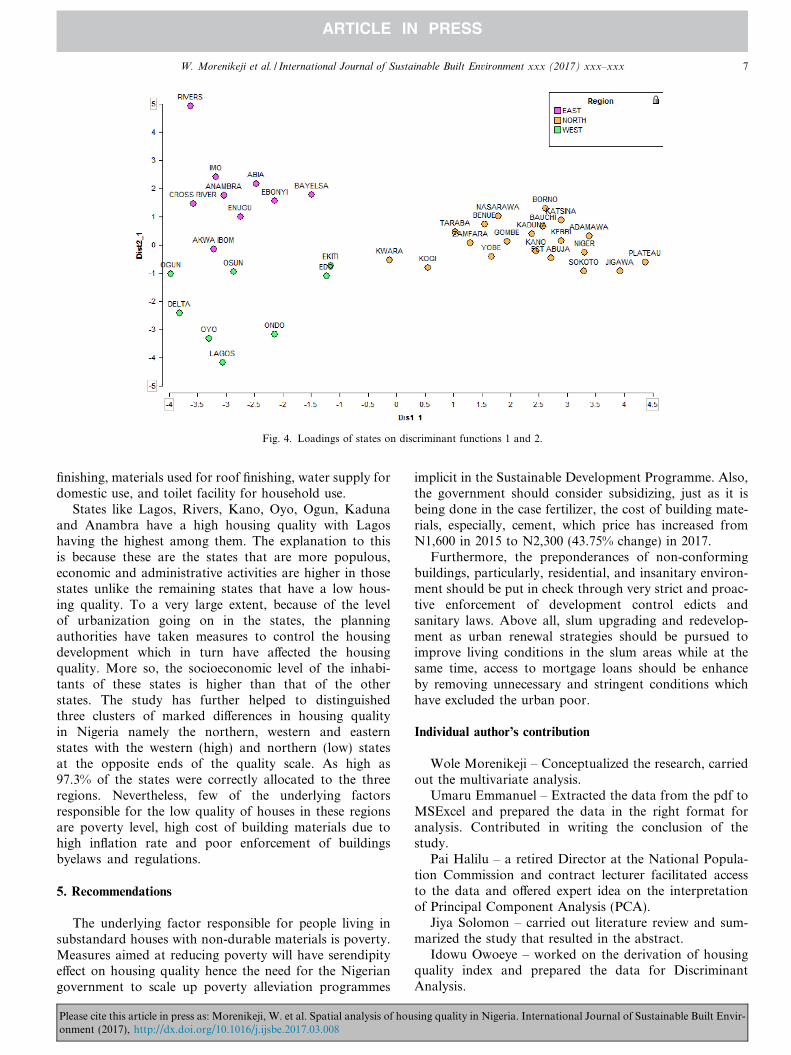
Fig. 4. Loadings of states on discriminant functions 1 and 2.
W. Morenikeji et al. / International Journal of Sustainable Built Environment xxx (2017) xxx–xxx 7
finishing, materials used for roof finishing, water supply fordomestic use, and toilet facility for household use.
States like Lagos, Rivers, Kano, Oyo, Ogun, Kadunaand Anambra have a high housing quality with Lagoshaving the highest among them. The explanation to thisis because these are the states that are more populous,economic and administrative activities are higher in thosestates unlike the remaining states that have a low hous-ing quality. To a very large extent, because of the levelof urbanization going on in the states, the planningauthorities have taken measures to control the housingdevelopment which in turn have affected the housingquality. More so, the socioeconomic level of the inhabi-tants of these states is higher than that of the otherstates. The study has further helped to distinguishedthree clusters of marked differences in housing qualityin Nigeria namely the northern, western and easternstates with the western (high) and northern (low) statesat the opposite ends of the quality scale. As high as97.3% of the states were correctly allocated to the threeregions. Nevertheless, few of the underlying factorsresponsible for the low quality of houses in these regionsare poverty level, high cost of building materials due tohigh inflation rate and poor enforcement of buildingsbyelaws and regulations.
5. Recommendations
The underlying factor responsible for people living insubstandard houses with non-durable materials is poverty.Measures aimed at reducing poverty will have serendipityeffect on housing quality hence the need for the Nigeriangovernment to scale up poverty alleviation programmes
Please cite this article in press as: Morenikeji, W. et al. Spatial analysis of houonment (2017), http://dx.doi.org/10.1016/j.ijsbe.2017.03.008
implicit in the Sustainable Development Programme. Also,the government should consider subsidizing, just as it isbeing done in the case fertilizer, the cost of building mate-rials, especially, cement, which price has increased fromN1,600 in 2015 to N2,300 (43.75% change) in 2017.
Furthermore, the preponderances of non-conformingbuildings, particularly, residential, and insanitary environ-ment should be put in check through very strict and proac-tive enforcement of development control edicts andsanitary laws. Above all, slum upgrading and redevelop-ment as urban renewal strategies should be pursued toimprove living conditions in the slum areas while at thesame time, access to mortgage loans should be enhanceby removing unnecessary and stringent conditions whichhave excluded the urban poor.
Individual author’s contribution
Wole Morenikeji – Conceptualized the research, carriedout the multivariate analysis.
Umaru Emmanuel – Extracted the data from the pdf toMSExcel and prepared the data in the right format foranalysis. Contributed in writing the conclusion of thestudy.
Pai Halilu – a retired Director at the National Popula-tion Commission and contract lecturer facilitated accessto the data and offered expert idea on the interpretationof Principal Component Analysis (PCA).
Jiya Solomon – carried out literature review and sum-marized the study that resulted in the abstract.
Idowu Owoeye – worked on the derivation of housingquality index and prepared the data for DiscriminantAnalysis.
sing quality in Nigeria. International Journal of Sustainable Built Envir-
8 W. Morenikeji et al. / International Journal of Sustainable Built Environment xxx (2017) xxx–xxx
Adeleye B.M. – Applied his knowledge of GeographicInformation System to produce the map of spatial distribu-tion of housing quality in Nigeria. He compiled thereferences.
References
Abumere, S.I., 1987. Urbanization and urban decay in Nigeria in urbanrenewal in Nigeria. In: Onibokun, Adepoju, Olokesusi, Femi, Egun-jobi, Layi (Eds.), NISER/CURP Urban and Regional Planning Series,Vol IV.
Adeleye, O.A., Anofojie, A.E., 2011. Housing in Festac Town, LagosState, Nigeria. Ife Research Publication in Geography 10 (1), 154–163.
Adeleye, O.A., Azeez, T.O., Yusuff, I.O., 2014. Perception of housingquality by residents and non residents of Ibara housing estate,Abeokuta, Ogun State, Nigeria. American Journal of Human Ecology3 (3), 35–42. http://dx.doi.org/10.11634/216796221403586.
Aderamo, A.J., Ayobolu, D.F., 2010. Spatial structure of housing qualityin Ilorin, Nigeria. Research Journal of Social Sciences 1 (5), 12–21,INSI net Publication.
Alkay E. (2009). The relationship between environmental quality level andhousing sale.
Anofojie, A.E., Adeleye, O.A., Kadiri, M.A., 2014. Housing qualityassessment in selected public residential estates in Amuwo-Odofin L.G.A. Lagos, Nigeria. Int. J. Res. Earth Environ. Sci. 2 (6).
Bunch, J.M., 1996. The physical ecology of slums in Madras: A GISanalysis of the 1986 survey of slums. Indian Geogr. J. 71 (1), 12–32.
Craig, A.M., Patricia, C.B., Fernando, R.B., Mauricio, L.B., 2001.Evaluating sanitary quality and classifying urban sectors according toenvironmental conditions. Environ. Urbanization 13 (1).
Ede, P.N., Andrew, E.E., Eleoke, C.C., 2007. Determinants of housingand neighbourhood quality for Yenagoa, Balyesa State of Nigeria.Journal of the Nigerian Institute of Town Planners XX (1).
Ekop, G., 2012. An assessment of the interrelationships among housingquality variable sets in calabar metropolis. Journal of Geography andRegional Planning 5 (14), 375–380.
Fiadzo, E., 1982. On the estimation of determinants of housing quality: thecase of Ghana. Joint Centre for Housing Studies, Harvard University.
FMHE, 1982. Rural Housing in Southern States of Nigeria. Final Reportjointly prepared by the Physical Planning & Dev Division of NISERand Faculty of Environmental Design and Management, University ofIfe. jchs.harvard.edu/sites/jchs.harvard.edu/files/w04-6.pdf. Accessed16th November 2015.
Fobil, J.N., Kraema, Alexander, Meyer, Christian G., May, Juergan,2011. Neighbourhood Urban Environmental Quality Conditions arelikely to Drive Malaria and Diarrhea Mortality in Accra, Ghana. J.Environ. Public Health.
Khatun, T., 2007. Measuring environmental degradation by usingprincipal component analysis. Environment Development Sustainabil-ity 11 (2), 439–457.
Please cite this article in press as: Morenikeji, W. et al. Spatial analysis of houonment (2017), http://dx.doi.org/10.1016/j.ijsbe.2017.03.008
View publication statsView publication stats
Konold, Clifford, Miller, Craig D., 2005. TinkerPlots: dynamic dataexploration. Key Curriculum Press; University of Massachusetts,Emeryville, Calif. [MA].
Lawanson, T.O., 2006. Challenges of Sustainability and Urban Develop-ment in Nigeria: Reviewing theMillenniumDevelopment Goals. AfricaInsight (submitted for publication). http://scholar.google.com/scholar_url?url=http://www.academia.edu/download/22902400/print_-_2.doc&hl=en&sa=X&scisig=AAGBfm1oEDbjVCMXkRc4jnHPkXx-Gr5OhUg&nossl=1&oi=scholarr. Accessed on 8th February, 2016.
Mabogunje, A.L., 1975. Prolegomenon to urban poverty in Nigeria, inPoverty in Nigeria. In: Proceedings of the 1975 Annual Conference ofthe Nigerian Economic Society, 1975, pp. 69–91.
Mbina, A.A., 2007. Assessing the housing delivery services in Nigeria. In:Ekop, O.B. et al. (Eds.), Physical development of urban settlements inNigeria. Development Universal Consortia, Ikot Ekpene, Nigeria, pp.1–2.
National Population Commission, 2006. Housing Characteristics andAmenities Tables: 2006 Census Census Priority Tables (Vol. 2). Abuja,Nigeria.
NISER, 2005. Review of Nigerian Development (2003/2004): Public –Private Partnership in Nigerian Development. NISER, Ibadan.
Odoi, Agricola, Wray, Ron, Emo, Marion, Birch, Stephen, Hutchinson,Brian, Eyles, John, Abernathy, Tom, 2005. Inequalities in neighbour-hood socio-economic characteristics: potential evidence-base forneighbourhood health planning. Int. J. Health Geogr. 4, 20, http://www.ij-healthgeographics.com/content/4/1/20.
Ogunleye, M.B., 2013. Analysis of the socio-economic Characteristics andHousing Condition in the Core Neighbourhood of Akure, Nigeria. J.Geogr. Reg. Plan. 6 (6), 229–236.
Ojo, I.C., Oloruntoba, K., 2012. Public housing provision and usersatisfaction in Ondo State, Nigeria. British Journal of Arts and SocialSciences, 2046-9578 8 (1).
Olotuah, A.O., Adesiji, O.S., 2005. Housing poverty, slum formation, anddeviant behaviour. Online Proceedings of the Housing StudiesAssociation Conference, University of Lincoln, Lincoln, UK. 8–9September 2005.
Owens, A., 2012. Neighbourhoods on the rise: a typology of neighbour-hoods experiencing socioeconomic. Ascent City Community 11 (4),345–369.
Pacione, M., 2003. Urban environmental quality and human wellbeing—asocial geographical perspective. Landsc. Urban Plan. 65 (2003), 19–30.
Rakotomalala, R., 2005. TANAGRA: a free software for research andacademic purposes. In: Proceedings of EGC’, RNTI-E-3, vol. 2, pp.697–702, 2005Tanagra Data Mining Software v. 1.4.50.
Uwadiegwu, B.O., 2013. The structural profile of the socio economic andhousing problems of the slum areas in Enugu City, Nigeria: AnInsider’s Perception. Int. J. Eng. Sci. 2 (3), 08–14.
sing quality in Nigeria. International Journal of Sustainable Built Envir-
Related Documents