|| Bioinfo Publications || 69 International Journal of Zoology Research ISSN : 2231-3516 & E-ISSN : 2231-3524, Volume 4, Issue 1, 2014, pp.-069-081. Available online at http://www.bioinfopublication.org/jouarchive.php?opt=&jouid=BPJ0000254 ODO G.E. 1 *, AVOAJA D.A. 2 , DIBUA U.E.M. 3 , EJERE V.C. 1 , AGWU E.J. 1 , NGWU G. 1 , AGAORU C.G. 3 , NNAMONU E.I. 1 AND HARUNA A.S. 1 1 Department of Zoology and Environmental Biology, Faculty of Biological Sciences, University of Nigeria, Nsukka, Nigeria. 2 Department of Zoology and Environmental Biology, College of Natural Sciences, Michael Okpara University of Agriculture, Umudike, Umuahia, Abia State, Nigeria. 3 Department of Microbiology, Faculty of Biological Sciences, University of Nigeria, Nsukka, Nigeria. *Corresponding Author: Email- [email protected] Received: September 18, 2013; Accepted: January 27, 2014 Introduction The Anambra River channel has a total length of approximately 207.4 km. The River rises from Ankpa hills in the Benue State of Nigeria, from where it flows in a southerly direction through a nar- row trough that gradually broadens as it courses down. It crosses the Benue/ Anambra State boundary a bit north of Ogurugu, and then meanders through the Ogurugu station to Otuocha. From there it flows down to its confluence with the Niger at Onitsha. The Anam- bra river system is known to support a rich and thriving fishery [1]. The area it drains is one of the agriculturally rich areas of the coun- try. Agriculture and fishing thus form the dominant occupations of the local people and these two major economic activities are closely tied up to the two seasons of the year. The basin drained by the Anambra River and its principal tributaries, the Okutu, Adada, Mamur, Oji and Ajalli rivers constitute the area covered by the study. It is roughly 18122.2 square Kilometers in area and includes the western parts of the Udi Hills and the Western parts of Benue State (i.e. The Igalla and Idoma areas), and it supports a population of one million people who are mainly farmers and fishermen. There are also varieties of flora and fauna in the River basin including invertebrates. The aquatic invertebrates are important food items for the young and some adult of many fishes and are extensively used in the rearing of larva and fry of commercially important fishes and other aquatic life. These communities are very important as they have been identified as possible indicators of ecological integ- rity for Basin [2]. The use of invertebrates in aquatic ecosystems as indicators, including the community structure and species composi- tion, began over a century ago [3-5] and is now well established in many countries around the world [6]. There are two main approach- es to using invertebrates as indicators. Firstly, there is the taxonom- ic approach, with the focus on diversity or taxa richness. The taxo- nomic approach requires considerable effort to separate organisms into the correct taxonomic groups [7]. The second approach is fo- cused on the ecological functions (traits) of the taxa that makeup a given community and is more useful in determining the ecological condition of system [7]. Although it has been suggested that identifi- cation of invertebrates to species level has many benefits [4] the functional approach is more rapid. A functional approach is also relatively independent of factors like natural variation in diversity due to seasonal and geographical patterns [8]. There has been scanty information on invertebrate spatial and distribution in the Anambra river basin. Apart from that Eyo & Ekwonnye [9] worked on composition and abundance of macro invertebrates of (fadama) flood plain system of International Journal of Zoology Research ISSN : 2231-3516 & E-ISSN : 2231-3524, Volume 4, Issue 1, 2014 Abstract- Invertebrates, physiochemical, wild animals and aquatic vegetation of Anambra River were assessed for the 2010-2011 flooding season using standard methods. A total of 109 taxa belonging to 15 orders and 20 families made up of 1406 individuals were collected from the basin. The dominant organisms were Hemiptera, 386 and Coleopterans, 337. Crustaceans were of 38% (±14) of the assemblage with 18- 47% of these crustaceans considered as zooplankton. Insects comprised 51% (±13) of the assemblage. Gyrinus sp, Hydrophilus sp, Metadi- aptomus traavenlsid, Velia sp, Lepesthestheria rubidgei, Nepa sp and Macrobranchium sp were the most abundant invertebrates species. The most abundant animal utilizing the basin was the Ardea cinerea with 22.2% occurrence and this was followed by Caprini sp., with 13.51%, and Varanus niloticus with 10.04%. The cations were dominated by magnesium (40-43%), followed by calcium (22.4%) and Sodium (22.2-22.6%) while potassium was the least cation in the sites. The distribution of invertebrate species could be attributed to invertebrate - plant association and to chemical factors such as ammonia, conductivity, dissolved oxygen and NO3-N.It is concluded that low in invertebrate diversity at Anam- bra River may be induced by sewage and other domestic pollutant discharged in it. Keywords- Invertebrates, Anambra River, distribution, Nigeria, Cation, Anion SPATIAL AND TEMPORAL DISTRIBUTION OF INVERTEBRATES IN ANAMBRA RIVER BASIN, NIGERIA Citation: Odo G.E., et al (2014) Spatial and Temporal Distribution of Invertebrates in Anambra River Basin, Nigeria. International Journal of Zoology Research, ISSN : 2231-3516 & E-ISSN : 2231-3524, Volume 4, Issue 1, pp.-069-081. Copyright: Copyright©2014 Odo G.E., et al. This is an open-access article distributed under the terms of the Creative Commons Attribution License, which permits unrestricted use, distribution and reproduction in any medium, provided the original author and source are credited.

Welcome message from author
This document is posted to help you gain knowledge. Please leave a comment to let me know what you think about it! Share it to your friends and learn new things together.
Transcript
|| Bioinfo Publications || 69
International Journal of Zoology Research ISSN : 2231-3516 & E-ISSN : 2231-3524, Volume 4, Issue 1, 2014, pp.-069-081.
Available online at http://www.bioinfopublication.org/jouarchive.php?opt=&jouid=BPJ0000254
ODO G.E.1*, AVOAJA D.A.2, DIBUA U.E.M.3, EJERE V.C.1, AGWU E.J.1, NGWU G.1, AGAORU C.G.3, NNAMONU E.I.1 AND HARUNA A.S.1
1Department of Zoology and Environmental Biology, Faculty of Biological Sciences, University of Nigeria, Nsukka, Nigeria. 2Department of Zoology and Environmental Biology, College of Natural Sciences, Michael Okpara University of Agriculture, Umudike, Umuahia, Abia State, Nigeria. 3Department of Microbiology, Faculty of Biological Sciences, University of Nigeria, Nsukka, Nigeria. *Corresponding Author: Email- [email protected]
Received: September 18, 2013; Accepted: January 27, 2014
Introduction
The Anambra River channel has a total length of approximately 207.4 km. The River rises from Ankpa hills in the Benue State of Nigeria, from where it flows in a southerly direction through a nar-row trough that gradually broadens as it courses down. It crosses the Benue/ Anambra State boundary a bit north of Ogurugu, and then meanders through the Ogurugu station to Otuocha. From there it flows down to its confluence with the Niger at Onitsha. The Anam-bra river system is known to support a rich and thriving fishery [1]. The area it drains is one of the agriculturally rich areas of the coun-try. Agriculture and fishing thus form the dominant occupations of the local people and these two major economic activities are closely tied up to the two seasons of the year. The basin drained by the Anambra River and its principal tributaries, the Okutu, Adada, Mamur, Oji and Ajalli rivers constitute the area covered by the study. It is roughly 18122.2 square Kilometers in area and includes the western parts of the Udi Hills and the Western parts of Benue State (i.e. The Igalla and Idoma areas), and it supports a population of one million people who are mainly farmers and fishermen. There are also varieties of flora and fauna in the River basin including invertebrates. The aquatic invertebrates are important food items for the young and some adult of many fishes and are extensively
used in the rearing of larva and fry of commercially important fishes and other aquatic life. These communities are very important as they have been identified as possible indicators of ecological integ-rity for Basin [2]. The use of invertebrates in aquatic ecosystems as indicators, including the community structure and species composi-tion, began over a century ago [3-5] and is now well established in many countries around the world [6]. There are two main approach-es to using invertebrates as indicators. Firstly, there is the taxonom-ic approach, with the focus on diversity or taxa richness. The taxo-nomic approach requires considerable effort to separate organisms into the correct taxonomic groups [7]. The second approach is fo-cused on the ecological functions (traits) of the taxa that makeup a given community and is more useful in determining the ecological condition of system [7]. Although it has been suggested that identifi-cation of invertebrates to species level has many benefits [4] the functional approach is more rapid. A functional approach is also relatively independent of factors like natural variation in diversity due to seasonal and geographical patterns [8]. There has been scanty information on invertebrate spatial and distribution in the
Anambra river basin.
Apart from that Eyo & Ekwonnye [9] worked on composition and abundance of macro invertebrates of (fadama) flood plain system of
International Journal of Zoology Research ISSN : 2231-3516 & E-ISSN : 2231-3524, Volume 4, Issue 1, 2014
Abstract- Invertebrates, physiochemical, wild animals and aquatic vegetation of Anambra River were assessed for the 2010-2011 flooding season using standard methods. A total of 109 taxa belonging to 15 orders and 20 families made up of 1406 individuals were collected from the basin. The dominant organisms were Hemiptera, 386 and Coleopterans, 337. Crustaceans were of 38% (±14) of the assemblage with 18-47% of these crustaceans considered as zooplankton. Insects comprised 51% (±13) of the assemblage. Gyrinus sp, Hydrophilus sp, Metadi-aptomus traavenlsid, Velia sp, Lepesthestheria rubidgei, Nepa sp and Macrobranchium sp were the most abundant invertebrates species. The most abundant animal utilizing the basin was the Ardea cinerea with 22.2% occurrence and this was followed by Caprini sp., with 13.51%, and Varanus niloticus with 10.04%. The cations were dominated by magnesium (40-43%), followed by calcium (22.4%) and Sodium (22.2-22.6%) while potassium was the least cation in the sites. The distribution of invertebrate species could be attributed to invertebrate - plant association and to chemical factors such as ammonia, conductivity, dissolved oxygen and NO3-N.It is concluded that low in invertebrate diversity at Anam-
bra River may be induced by sewage and other domestic pollutant discharged in it.
Keywords- Invertebrates, Anambra River, distribution, Nigeria, Cation, Anion
SPATIAL AND TEMPORAL DISTRIBUTION OF INVERTEBRATES IN ANAMBRA RIVER BASIN, NIGERIA
Citation: Odo G.E., et al (2014) Spatial and Temporal Distribution of Invertebrates in Anambra River Basin, Nigeria. International Journal of
Zoology Research, ISSN : 2231-3516 & E-ISSN : 2231-3524, Volume 4, Issue 1, pp.-069-081.
Copyright: Copyright©2014 Odo G.E., et al. This is an open-access article distributed under the terms of the Creative Commons Attribution
License, which permits unrestricted use, distribution and reproduction in any medium, provided the original author and source are credited.
|| Bioinfo Publications || 70
Anambra River basin, no other studies have been carried out on the invertebrates of the River basin. Such scanty information hinders effective management and utilization of the aquatic resources. Proper management of any aquatic system demands base line information not only on the water chemistry but also on the dynamic interactions among the various components of the system hence the studies on the spatial- temporal distribution, and abundance of invertebrate of Anambra River basin. The aim of the present study was to characterize the invertebrate communities of Anambra river basin using both a taxonomic and a functional approach and to determine which of these would be most suitable for identifying the environmental factors responsible for differences in the aquatic invertebrate community structures of the River basin. Also the ani-mal utilizing the basin, chemical variables influencing the inverte-brates as well as aquatic vegetation prevailing in spatial and tem-
poral distribution will be characterized.
Materials and Methods
The Study Area
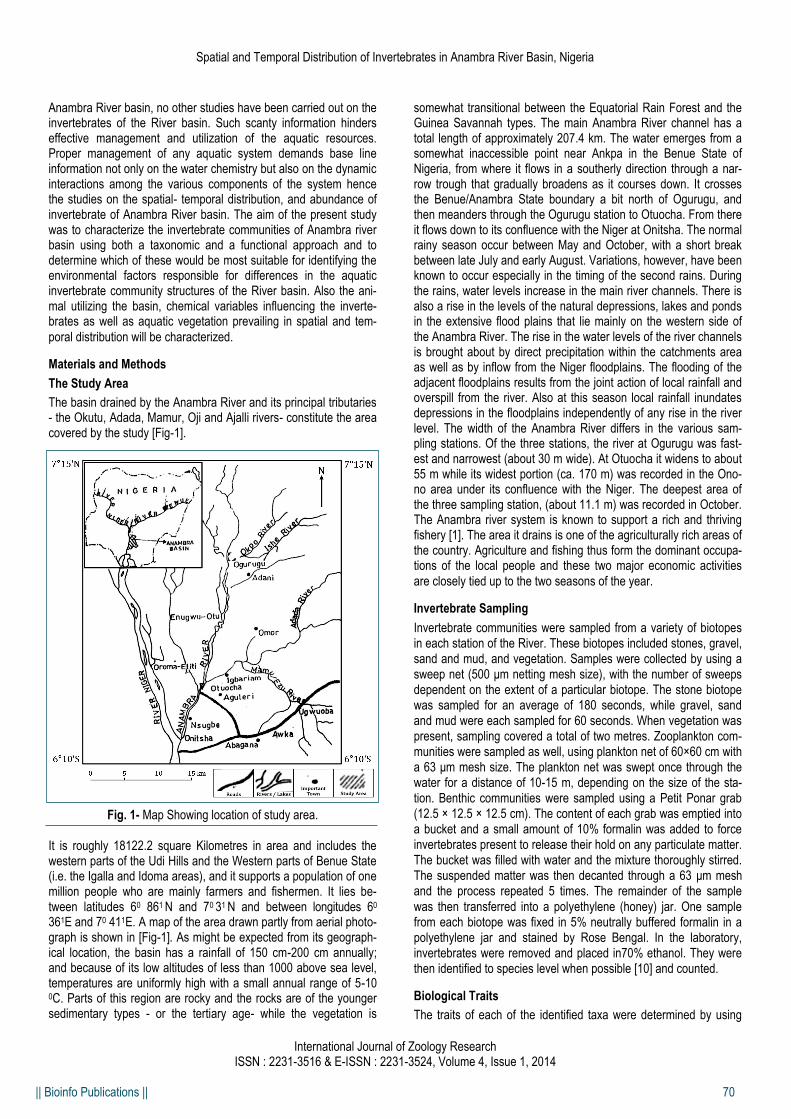
The basin drained by the Anambra River and its principal tributaries- the Okutu, Adada, Mamur, Oji and Ajalli rivers- constitute the area covered by the study [Fig-1].
Fig. 1- Map Showing location of study area.
It is roughly 18122.2 square Kilometres in area and includes the western parts of the Udi Hills and the Western parts of Benue State (i.e. the Igalla and Idoma areas), and it supports a population of one million people who are mainly farmers and fishermen. It lies be-tween latitudes 60 861 N and 70 31 N and between longitudes 60 361E and 70 411E. A map of the area drawn partly from aerial photo-graph is shown in [Fig-1]. As might be expected from its geograph-ical location, the basin has a rainfall of 150 cm-200 cm annually; and because of its low altitudes of less than 1000 above sea level, temperatures are uniformly high with a small annual range of 5-10 0C. Parts of this region are rocky and the rocks are of the younger sedimentary types - or the tertiary age- while the vegetation is
somewhat transitional between the Equatorial Rain Forest and the Guinea Savannah types. The main Anambra River channel has a total length of approximately 207.4 km. The water emerges from a somewhat inaccessible point near Ankpa in the Benue State of Nigeria, from where it flows in a southerly direction through a nar-row trough that gradually broadens as it courses down. It crosses the Benue/Anambra State boundary a bit north of Ogurugu, and then meanders through the Ogurugu station to Otuocha. From there it flows down to its confluence with the Niger at Onitsha. The normal rainy season occur between May and October, with a short break between late July and early August. Variations, however, have been known to occur especially in the timing of the second rains. During the rains, water levels increase in the main river channels. There is also a rise in the levels of the natural depressions, lakes and ponds in the extensive flood plains that lie mainly on the western side of the Anambra River. The rise in the water levels of the river channels is brought about by direct precipitation within the catchments area as well as by inflow from the Niger floodplains. The flooding of the adjacent floodplains results from the joint action of local rainfall and overspill from the river. Also at this season local rainfall inundates depressions in the floodplains independently of any rise in the river level. The width of the Anambra River differs in the various sam-pling stations. Of the three stations, the river at Ogurugu was fast-est and narrowest (about 30 m wide). At Otuocha it widens to about 55 m while its widest portion (ca. 170 m) was recorded in the Ono-no area under its confluence with the Niger. The deepest area of the three sampling station, (about 11.1 m) was recorded in October. The Anambra river system is known to support a rich and thriving fishery [1]. The area it drains is one of the agriculturally rich areas of the country. Agriculture and fishing thus form the dominant occupa-tions of the local people and these two major economic activities
are closely tied up to the two seasons of the year.
Invertebrate Sampling
Invertebrate communities were sampled from a variety of biotopes in each station of the River. These biotopes included stones, gravel, sand and mud, and vegetation. Samples were collected by using a sweep net (500 μm netting mesh size), with the number of sweeps dependent on the extent of a particular biotope. The stone biotope was sampled for an average of 180 seconds, while gravel, sand and mud were each sampled for 60 seconds. When vegetation was present, sampling covered a total of two metres. Zooplankton com-munities were sampled as well, using plankton net of 60×60 cm with a 63 μm mesh size. The plankton net was swept once through the water for a distance of 10-15 m, depending on the size of the sta-tion. Benthic communities were sampled using a Petit Ponar grab (12.5 × 12.5 × 12.5 cm). The content of each grab was emptied into a bucket and a small amount of 10% formalin was added to force invertebrates present to release their hold on any particulate matter. The bucket was filled with water and the mixture thoroughly stirred. The suspended matter was then decanted through a 63 μm mesh and the process repeated 5 times. The remainder of the sample
was then transferred into a polyethylene (honey) jar. One sample from each biotope was fixed in 5% neutrally buffered formalin in a polyethylene jar and stained by Rose Bengal. In the laboratory, invertebrates were removed and placed in70% ethanol. They were then identified to species level when possible [10] and counted.
Biological Traits
The traits of each of the identified taxa were determined by using
International Journal of Zoology Research ISSN : 2231-3516 & E-ISSN : 2231-3524, Volume 4, Issue 1, 2014
Spatial and Temporal Distribution of Invertebrates in Anambra River Basin, Nigeria
|| Bioinfo Publications || 71
relevant literature [11-13]. Pollution tolerance traits [14] were calcu-lated by taking into account the number of sensitive taxa (number of Ephemeroptera, Odonata and Trichoptera taxa). Traits based on taxon habit [15] and Functional Feeding Groups (FFGs) [16] were expressed both as richness of a given habit or FFGs (i.e. total num-ber of taxa in a given habit or FFGs) and as richness of a given habit or FFGs relative to total assemblage richness (i.e. the propor-tion of total richness of a given habit or FFGs relative to overall taxa
richness of the basin).
Spatial and Temporal Analysis
To determine which environmental variables were possibly respon-sible for the various groupings based on diversity and biological traits, a Redundancy Analysis (RDA) was completed using Canoco version 4.5. Interpretation of RDA is through tri-plots. These tri-plots produce a map of the samples analyzed on a 2-dimensional basis, where the placements of the samples reflect the (dis)similarities between the samples; in this case the sampling sites. Indices of diversity and evenness were also applied to describe the species abundance relationships among the invertebrate communities. These included the Shannon-Wiener diversity index [17] Simpson’s index [18] Margalef’s species richness index [19] and Pielou’s even-
ness index [20].
Aquatic and domestic wildlife animals sighted during the periods of data collection were counted and recorded. Droppings of domesti-
cated animals utilizing the flood plain were evaluated and identified.
Physicochemical
Physicochemical parameters of the Anambra River were taken monthly for 12 months. In each station at least five sample collec-tions were taken at different locations. All in situ determinations and collections of water samples were made during mid-morning (10-11am) local time. The water depth was measured using a graduat-ed sounding line. A “HACH” conductivity meter (model 6300) was used for the conductivity measurement. The hydrogen ion concen-tration was measured using a compensated pH meter Kent Model 6025. Transparency was measured using a secchi disc. Total ions, Hardness, Total alkalinity, Calcium, colour, turbidity, were analysed using ‘HACH’ portable laboratory test kits. The current (Ms-1) was estimated at the different aforementioned stations by noting the time taken when a piece of lead fixed cork was allowed to drift from one predetermined point to the other. Free C02 was determined in the field titrimetrically using 0.0027 N NaOH and phenolphthalein indicator. The Chemical Oxygen Demand (COD) was estimated by running blank 70 ml (double distilled water to 50 ml of water. This was heated to boiling point. Then 5 ml of KMnO4 plus 5 ml KI+10 ml 2 M H2SO4 +1 ml of starch solution. These combinations were titrat-ed with 0.IM Na2S2O until blue colour disappeared which was the end point. Temperature was measured immediately in the field us-ing mercury in -glass bulb thermometer and read to the nearest 0.10C. Dissolved oxygen (DO) was also determined in the field us-ing a dissolved oxygen meter. Samples for the measurement of BOD were collected in 250ml opaque (BOD) reagent bottles, and measured with the dissolved oxygen meter after five days of incu-bation in the dark. Samples for the analysis of other variables were then taken to the laboratory in clean 2.51 polyethylene bottles, and preserved in a deep freezer until analysed. The concentrations of sodium (Na+), Potassium (K+), Calcium (Ca2+) Magnesium (Mg2+), Zinc (Zn) and Lead (Pb) in the samples were determined using atomic absorption spectrophotometer (Buck 200A mode) at their
characteristic wavelengths of 589, 766, 422, 285, 214 and 283p.m respectively. The concentrations of SO2-, NO3
-, PO43- and CI‑ were
determined using the colorimetric method (M201 Ccam Spec Visi-ble Spectrophotometer) as described by APHA [21]. Ammonia was determined by phenate method. Total dissolved solids (TDS) was measured by the filtration, evaporation (at 1050C) and weighing
method [21].
Vegetation
At the commencement of study, samples of each aquatic and mar-
ginal vegetation types were collected from the River basin and de-posited with the Herbarium of the Department of Plant Science and
Biotechnology, University of Nigeria, Nsukka for identification. The macrophyte species were subsequently monitored in each station for presence, coverage (density) and relative association with mac-
ro invertebrates. Coverage in percentage was determined by a rough estimate of the area of a station covered by each plant spe-cies during each monthly site visit. These were scored as O for
<5%; 2 for 5-25%; 3 for 26-50%; 4 for 51-75% and 5 for >75 cover-age.
Statistical Analyses
Data were first tested for normality, and those which did not con-form to the assumptions were transformed to logarithms. Since an initial comparison of station means in the various water stations
investigated, showed no significant variation, all subsequent anal-yses were based on the overall mean of stations in each water body, henceforth referred to as sites. One- way analysis of variance
(one-way ANOVA) was used to determine the differences in each physical and chemical variable between season, and between sites, while multiple comparisons of sites was performed with the Scheffe
test. The least squares regression analysis was used to determine the nature of down- stream changes in each variable (i.e. whether it increased or decreased in value). Unlike the other tests, upstream
data were excluded from this analysis and regression was based on individual station distance from the Ogurugu (fixed at 0-point). The importance of the differences in the value of each variable between
sites was determined using the discriminate analysis. All analyses were performed on SPSS 10 software. Differences in Invertebrate density between stations were determined using the Friedman two-
way analysis of variance. Kendal coefficient of concordance was used to test for agreement in monthly and seasonal fluctuation pat-terns, while strength of invertebrate-plant association was deter-
mined using the Spearman ranked-order correlation coefficient. The total and relative abundance of aquatic and other animals utilizing the basin were calculated.
Results
Invertebrate diversity
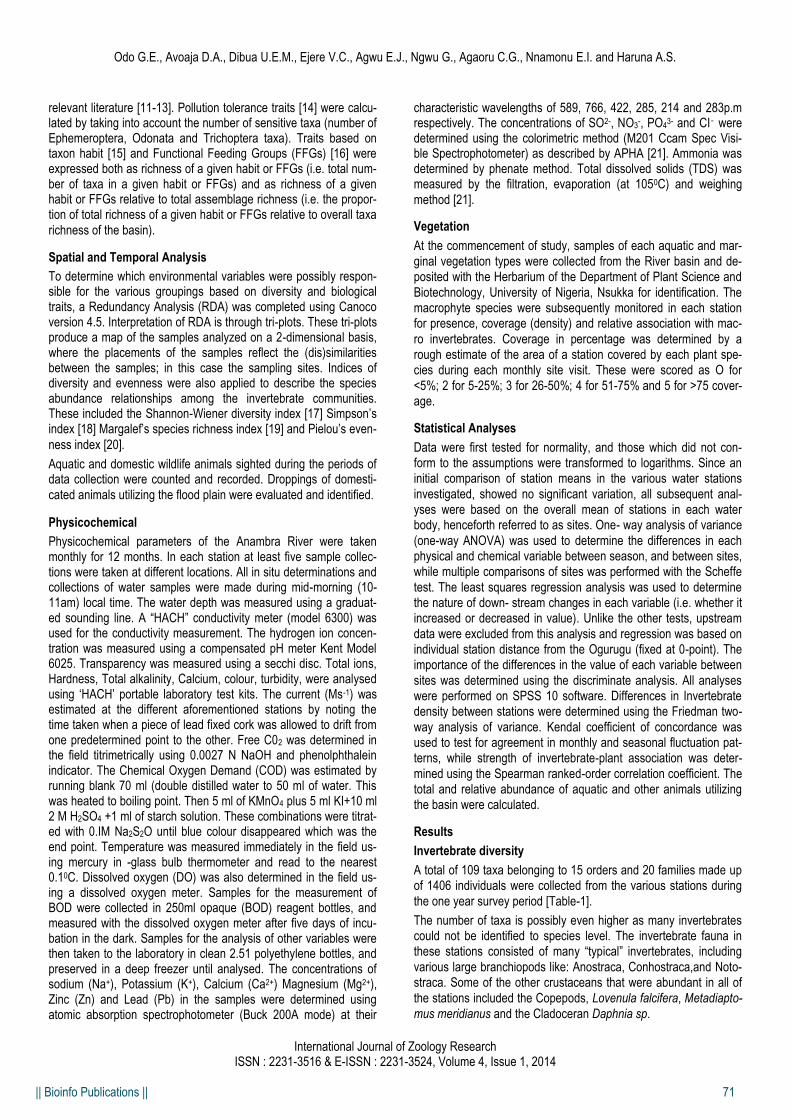
A total of 109 taxa belonging to 15 orders and 20 families made up of 1406 individuals were collected from the various stations during
the one year survey period [Table-1].
The number of taxa is possibly even higher as many invertebrates could not be identified to species level. The invertebrate fauna in these stations consisted of many “typical” invertebrates, including
various large branchiopods like: Anostraca, Conhostraca,and Noto-straca. Some of the other crustaceans that were abundant in all of
the stations included the Copepods, Lovenula falcifera, Metadiapto-
mus meridianus and the Cladoceran Daphnia sp.
International Journal of Zoology Research ISSN : 2231-3516 & E-ISSN : 2231-3524, Volume 4, Issue 1, 2014
Odo G.E., Avoaja D.A., Dibua U.E.M., Ejere V.C., Agwu E.J., Ngwu G., Agaoru C.G., Nnamonu E.I. and Haruna A.S.
|| Bioinfo Publications || 72
Table 1- List of aquatic invertebrate taxa recorded in the Anambra River basin
International Journal of Zoology Research ISSN : 2231-3516 & E-ISSN : 2231-3524, Volume 4, Issue 1, 2014
Spatial and Temporal Distribution of Invertebrates in Anambra River Basin, Nigeria
Ogurugu Otuocha Nsugbe Total Ogurugu Otuocha Nsugbe Total
N N N N N N N N
Crustacean:Anostaca Crustacea: Ostracoda
Acroperus sp 0 1 0 1 Cyprideis sp. 3 0 1 4
Chydrorus sp 0 1 2 Darwinula sp. 1 2 0 3
Streptocephalus sp. 1 2 0 3 Gomphocythere obtusata 0 1 0 1
Crustacean: Cladocera Limnocyther sp. 0 2 0 2
Alona sp 2 3 2 7 Oncocypris sp 1 0 1 2
Ceriodaphnia dubia (Richard, 1895) 0 1 0 1 Vestalenula sp 0 1 0 1
Ceriodaphnia quandrangula (Mulluer, 1785) 1 1 2 4 Macrobranchium 2 3 6 11
Ceruidaogbua reticulata (Jurine 1920) 0 2 1 3 Mollusca:Gastropoda
Ceruidaogbua rugyadu (Richard 1985) 2 1 0 3 Afrogyrus sp 5 6 2 13
Daphnia barbata (Waltner, 1897) 4 0 0 9 Bulinus africanus (Krauss, 1948) 2 1 1 4
Daphnia leavis (Birge, 1874) 1 2 0 3 Bulinus natalensis (Kuste, 1841) 1 2 0 3
Daphnia longispina (Muller 1785) 0 3 4 7 Cyraulus connollyi 2 0 2 4
Daphnia obtusta (Kurz, 1874) 3 1 2 6 Lymnea natalensis (Krauss, 1848) 2 0 2 4
Diaphanosoma excisum (Sara, 1886) 0 1 1 2 Insecta:Coleoptera Cureulionidae
Eurycecus lamellatus (Muller, 1776) 8 2 1 9 Cyrtobagous sp 3 0 1 4
Moina micrura (Kurz, 1874) 3 1 2 6 Dytiscidae
Simocephalus ezpinosus (Koch, 1842) 4 6 1 11 Hybius 10 9 0 19
Crustacea: conhostraea Dytiscus 16 11 3 30
Cyzicus sp 2 1 0 3 Dytiscidae larvae 1 0 1 2
Lepthestheria rubidgei (Baird, 1962) 3 1 2 6 Agabus sp 3 19 20 42
Lynecus pachydactylus (Barnard, 1929) 1 2 1 4 Copelatus sp 1 4 2 7
Crustacea: Copepoda Cybister sp 4 0 7 11
Thermocydops neglect (Sars 1909) 2 1 0 3 Hydrovatus sp 1 0 2 3
Cucyclops sp 1 0 0 1 Laccobius sp 0 0 1 1
T. emni (Mrazek 1895) 2 1 0 3 Methles sp 1 3 0 4
Lovenula excellens (Kiefer 1929) 20 15 16 51 Peeshetisu sp 2 0 1 3
T. elecipieus (Kiefer, 1929) 0 1 2 3 Philaccolus sp 0 3 3 6
Lovenula falcidera (Loven, 1845) 14 16 4 34 Philodytes sp 1 0 1 2
Macrocyclops albidus (Jurine 1820) 2 0 1 3 Rhantus sp 1 2 0 3
Metadiaptomus meridianus (van Douwe, 1912) 18 21 26 65 Cyrinidae
Metadiaptomus transvaalensis (Methuen 1919) Gyrinus 16 18 10 44
Microcyclops Sp 2 1 0 3 Aulongyrus sp 2 0 3 5
T. consimilis (Kiefer 1934) 3 1 0 4 Haliplidae haliplus sp 1 0 2 3
Mesocyclps ogunnus (Onabanio 1957) 1 2 1 4 Hydrophilidae
M. dusarti (van De Velde, 1957) 1 2 1 4 Hydrophilidae larvae 0 3 2 5
Tropodiatomus and banforanus 1 0 1 2 Berosus sp 4 3 0 7
Themodiaptomus galebibarrois 1891 0 1 0 1 Laccophilus sp. 7 2 3 12
Hydrophilus 63 59 9 131 Crustaeea: Notostraca
Triops granarus (Lucas, 1864) 0 1 0 1 Hydrobius 6 21 0 27
Insect: Ephemeroptera Baetidae Paracymus sp 3 0 3 6
Baetis 3 1 7 11 Paracymus sp 3 0 3 6
Cleon sp 1 2 1 4 Insect: Dipera (all larvae Culicidae)
Canidae Anopheles sp 10 7 6 23
Cleons 8 16 7 31 Malaya sp 0 1 2 4
Insect: Hemiptera Belostomatidae Muscidae
Appasus sp 1 0 2 3 Chironomidae chironominae chironomus 4 7 0 11
Limnogeton sp 3 1 4 8 Insect: Trichoptera
Corixidae Ecomus thomasseti (Mosley, 1932) 2 0 1 3
Agraptocorixa sp 2 1 0 3 Oecetis sp 1 1 0 2
Micronecta sp 0 1 3 4 Oxyethira Sp 1 1 0 2
Sigara sp 0 1 3 4 Oecetis sp 1 1 0 2
Mesovelidae Mesoovelia sp 0 31 0 31 Oxyethira Sp 1 1 0 2
Velidae Insect: Odonata
Velia 5 87 34 126 Aeshna sp 1 0 2 3
Naucoridae Anax sp. 0 3 0 3
Macrocoris sp 7 1 0 8 Caragrion sp 4 6 0 10
Nepidae nepa 20 71 58 149 Pantala sp 1 0 1 2
Ranatra sp 17 11 16 44 Annelid: Hirudinea
Notonectidae Anisops sp. 0 1 2 3 Hirudo 8 11 12 31
Notonecta sp 1 0 1 2 Batracobdelloides tricarinata 1 0 1 2
Nychia sp 0 2 1 3 Helobdella confier (Moore, 1933) 1 0 2 3
Pleidae Plead piccanina (Hutchinson 1925) 0 1 0 1 Helobdella stagnalla stagnalis (Linnaeus, 1758) 0 1 0 1
Plea pullua (Stal, 1855) 1 0 1 2 Grand total 1488 Families = 20
Total no of individuals = 1407
|| Bioinfo Publications || 73
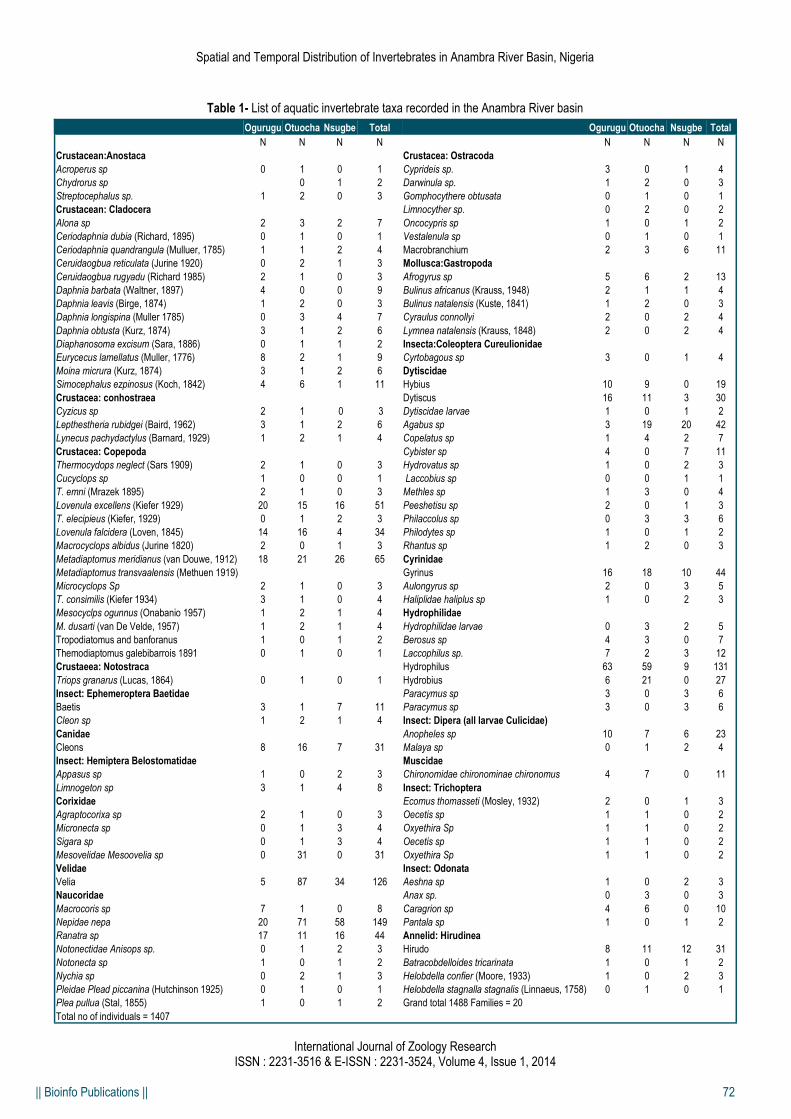
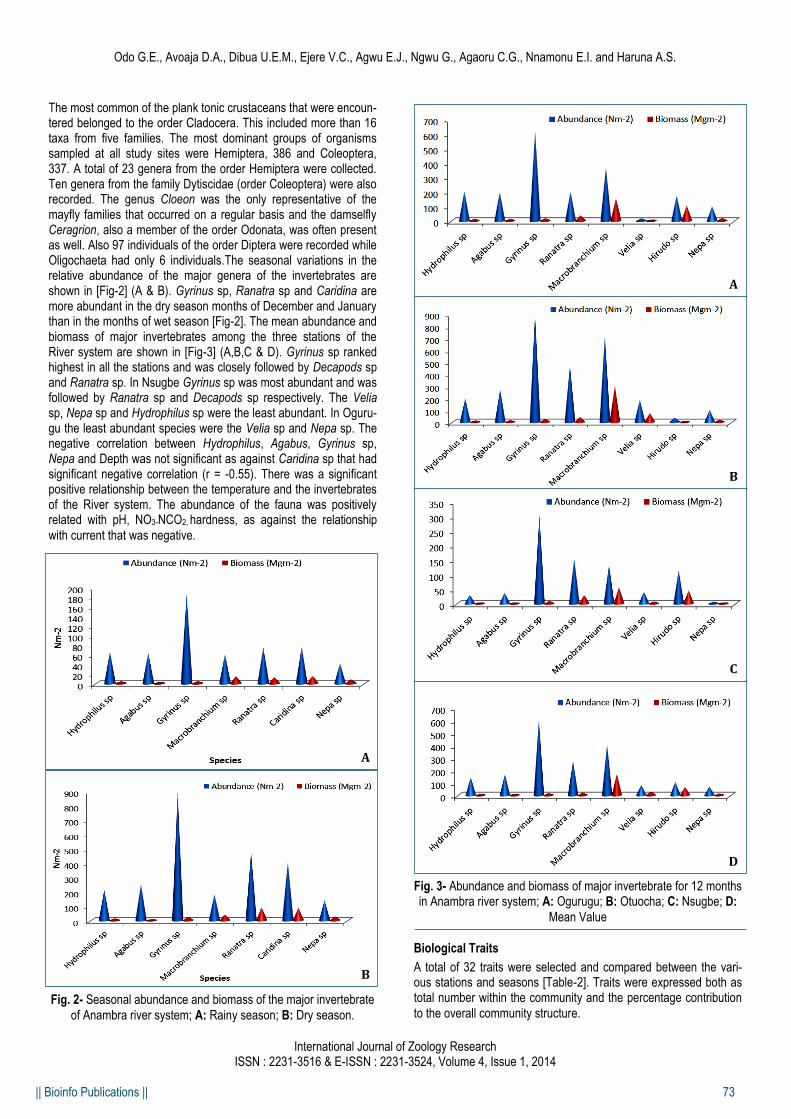
The most common of the plank tonic crustaceans that were encoun-tered belonged to the order Cladocera. This included more than 16 taxa from five families. The most dominant groups of organisms sampled at all study sites were Hemiptera, 386 and Coleoptera, 337. A total of 23 genera from the order Hemiptera were collected. Ten genera from the family Dytiscidae (order Coleoptera) were also recorded. The genus Cloeon was the only representative of the mayfly families that occurred on a regular basis and the damselfly Ceragrion, also a member of the order Odonata, was often present as well. Also 97 individuals of the order Diptera were recorded while Oligochaeta had only 6 individuals.The seasonal variations in the relative abundance of the major genera of the invertebrates are shown in [Fig-2] (A & B). Gyrinus sp, Ranatra sp and Caridina are more abundant in the dry season months of December and January than in the months of wet season [Fig-2]. The mean abundance and biomass of major invertebrates among the three stations of the River system are shown in [Fig-3] (A,B,C & D). Gyrinus sp ranked highest in all the stations and was closely followed by Decapods sp and Ranatra sp. In Nsugbe Gyrinus sp was most abundant and was followed by Ranatra sp and Decapods sp respectively. The Velia sp, Nepa sp and Hydrophilus sp were the least abundant. In Oguru-gu the least abundant species were the Velia sp and Nepa sp. The negative correlation between Hydrophilus, Agabus, Gyrinus sp, Nepa and Depth was not significant as against Caridina sp that had significant negative correlation (r = -0.55). There was a significant positive relationship between the temperature and the invertebrates of the River system. The abundance of the fauna was positively related with pH, NO3-NCO2, hardness, as against the relationship
with current that was negative.
Fig. 2- Seasonal abundance and biomass of the major invertebrate
of Anambra river system; A: Rainy season; B: Dry season.
Fig. 3- Abundance and biomass of major invertebrate for 12 months in Anambra river system; A: Ogurugu; B: Otuocha; C: Nsugbe; D:
Mean Value
Biological Traits
A total of 32 traits were selected and compared between the vari-ous stations and seasons [Table-2]. Traits were expressed both as total number within the community and the percentage contribution
to the overall community structure.
International Journal of Zoology Research ISSN : 2231-3516 & E-ISSN : 2231-3524, Volume 4, Issue 1, 2014
Odo G.E., Avoaja D.A., Dibua U.E.M., Ejere V.C., Agwu E.J., Ngwu G., Agaoru C.G., Nnamonu E.I. and Haruna A.S.
A
B
A
C
B
D

|| Bioinfo Publications || 74
Table 2- List of biological traits that were included during the study
[14,25].
All the traits were expressed both as the number of taxa that display a specific trait and the percentage contribution of a trait to the over-all assemblage. From the results, it became evident that during all the seasons most of the stations were dominated by crustaceans and insect taxa. Crustaceans made up 38% (± 14) of the total as-semblage in certain stations, with 18-47% of these crustacean com-
munities considered as zooplankton species. Insects comprised 51% (± 13) of the overall assemblage. As mentioned above, most of these insects belonged to the orders Hemiptera and Coleoptera. As a result of the percentage contribution of these insects, the FFGs were dominated by predators (66%± 8). Because many of the crustaceans were zooplankton, filter feeders were the other dominant FFG observed in the stations. The majority of the taxa found were air breathers. Most of the invertebrates that were pre-sent in the stations were also free-swimming, with swimmers mak-ing up 68% (± 13) of the community. In addition, clingers (18% ± 9)
made up a large proportion.
Spatial and Temporal Analysis
Results of the of the Shannon diversity index [Fig-4] indicate a loss in diversity at Ogurugu sample1 when compared to Otuocha sam-ple 5, which was similar in physical habitat and trophic state. Re-sults for Simpson’s index were also lower at Ogurugu sample 1 as compared to the other stations. Results of Margalef’s species rich-ness index show higher species richness at Ogurugu sample 3, Otuocha sample 4 and Otuocha sample 6 in comparison with the
other stations.
The mean was obtained from the results of the various sampling surveys and as a result, the standard deviation indicates seasonal variation. (1,2,3 rep samples at Ogurugu; 4,5,6 rep samples at
Otuocha; and 7,8,9 rep sample at Nsugbe).
International Journal of Zoology Research ISSN : 2231-3516 & E-ISSN : 2231-3524, Volume 4, Issue 1, 2014
Spatial and Temporal Distribution of Invertebrates in Anambra River Basin, Nigeria
Abundances Functional Feeding Groups
Number of taxa (families/orders included) Collectors
Number of individuals Scrapers
Mean number of individuals Shredders
Crustacea Predators
Mollusca Habits
ETO (Ephemeroptera, Trichoptera, Odonata) Burrowers
Ephemeroptera Skaters
Trichoptera Clingers
Odonata Climbers
Non-insects (excluding crustaceans & mollusk) Sprawlers
Non-insects Swimmers
Insects Swimmers (excluding zooplankton)
Oligochaeta Flyers
Coleoptera (larvae and adults) Breathing Mechanisms
Diptera (excluding Chironomidae) Air breathers
Diptera (including Chironimidae) Gills
Zooplankton Other
Fig. 4- Mean and standard deviation of the Shannon diversity index, Simpson’s index, Margalef’s species richness index, and Pielou’s even-ness index for each of the stations of the River. The mean was obtained from the results of the various sampling surveys and as a result, the standard deviation indicates seasonal variation. (1,2,3 rep samples @ Ogurugu; 4,5,6 rep samples @ Otuocha; and 7,8,9 rep sample @ Nsug-
be).
|| Bioinfo Publications || 75
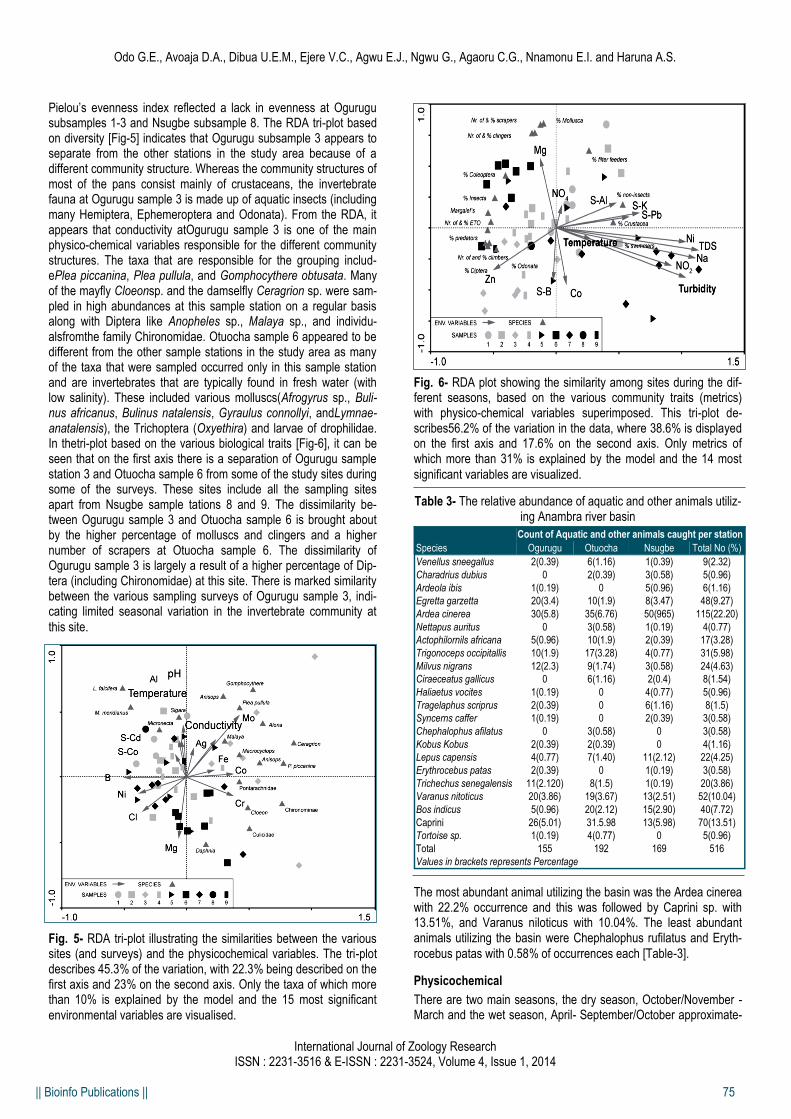
Pielou’s evenness index reflected a lack in evenness at Ogurugu subsamples 1-3 and Nsugbe subsample 8. The RDA tri-plot based on diversity [Fig-5] indicates that Ogurugu subsample 3 appears to separate from the other stations in the study area because of a different community structure. Whereas the community structures of most of the pans consist mainly of crustaceans, the invertebrate fauna at Ogurugu sample 3 is made up of aquatic insects (including many Hemiptera, Ephemeroptera and Odonata). From the RDA, it appears that conductivity atOgurugu sample 3 is one of the main physico-chemical variables responsible for the different community structures. The taxa that are responsible for the grouping includ-ePlea piccanina, Plea pullula, and Gomphocythere obtusata. Many of the mayfly Cloeonsp. and the damselfly Ceragrion sp. were sam-pled in high abundances at this sample station on a regular basis along with Diptera like Anopheles sp., Malaya sp., and individu-alsfromthe family Chironomidae. Otuocha sample 6 appeared to be different from the other sample stations in the study area as many of the taxa that were sampled occurred only in this sample station and are invertebrates that are typically found in fresh water (with low salinity). These included various molluscs(Afrogyrus sp., Buli-nus africanus, Bulinus natalensis, Gyraulus connollyi, andLymnae-anatalensis), the Trichoptera (Oxyethira) and larvae of drophilidae. In thetri-plot based on the various biological traits [Fig-6], it can be seen that on the first axis there is a separation of Ogurugu sample station 3 and Otuocha sample 6 from some of the study sites during some of the surveys. These sites include all the sampling sites apart from Nsugbe sample tations 8 and 9. The dissimilarity be-tween Ogurugu sample 3 and Otuocha sample 6 is brought about by the higher percentage of molluscs and clingers and a higher number of scrapers at Otuocha sample 6. The dissimilarity of Ogurugu sample 3 is largely a result of a higher percentage of Dip-tera (including Chironomidae) at this site. There is marked similarity between the various sampling surveys of Ogurugu sample 3, indi-cating limited seasonal variation in the invertebrate community at
this site.
Fig. 5- RDA tri-plot illustrating the similarities between the various sites (and surveys) and the physicochemical variables. The tri-plot describes 45.3% of the variation, with 22.3% being described on the first axis and 23% on the second axis. Only the taxa of which more than 10% is explained by the model and the 15 most significant
environmental variables are visualised.
Fig. 6- RDA plot showing the similarity among sites during the dif-ferent seasons, based on the various community traits (metrics) with physico-chemical variables superimposed. This tri-plot de-scribes56.2% of the variation in the data, where 38.6% is displayed on the first axis and 17.6% on the second axis. Only metrics of which more than 31% is explained by the model and the 14 most
significant variables are visualized.
Table 3- The relative abundance of aquatic and other animals utiliz-ing Anambra river basin
The most abundant animal utilizing the basin was the Ardea cinerea with 22.2% occurrence and this was followed by Caprini sp. with 13.51%, and Varanus niloticus with 10.04%. The least abundant animals utilizing the basin were Chephalophus rufilatus and Eryth-
rocebus patas with 0.58% of occurrences each [Table-3].
Physicochemical
There are two main seasons, the dry season, October/November - March and the wet season, April- September/October approximate-
International Journal of Zoology Research ISSN : 2231-3516 & E-ISSN : 2231-3524, Volume 4, Issue 1, 2014
Odo G.E., Avoaja D.A., Dibua U.E.M., Ejere V.C., Agwu E.J., Ngwu G., Agaoru C.G., Nnamonu E.I. and Haruna A.S.
Count of Aquatic and other animals caught per station
Species Ogurugu Otuocha Nsugbe Total No (%)
Venellus sneegallus 2(0.39) 6(1.16) 1(0.39) 9(2.32)
Charadrius dubius 0 2(0.39) 3(0.58) 5(0.96)
Ardeola ibis 1(0.19) 0 5(0.96) 6(1.16)
Egretta garzetta 20(3.4) 10(1.9) 8(3.47) 48(9.27)
Ardea cinerea 30(5.8) 35(6.76) 50(965) 115(22.20)
Nettapus auritus 0 3(0.58) 1(0.19) 4(0.77)
Actophilornils africana 5(0.96) 10(1.9) 2(0.39) 17(3.28)
Trigonoceps occipitallis 10(1.9) 17(3.28) 4(0.77) 31(5.98)
Milvus nigrans 12(2.3) 9(1.74) 3(0.58) 24(4.63)
Ciraeceatus gallicus 0 6(1.16) 2(0.4) 8(1.54)
Haliaetus vocites 1(0.19) 0 4(0.77) 5(0.96)
Tragelaphus scriprus 2(0.39) 0 6(1.16) 8(1.5)
Syncerns caffer 1(0.19) 0 2(0.39) 3(0.58)
Chephalophus afilatus 0 3(0.58) 0 3(0.58)
Kobus Kobus 2(0.39) 2(0.39) 0 4(1.16)
Lepus capensis 4(0.77) 7(1.40) 11(2.12) 22(4.25)
Erythrocebus patas 2(0.39) 0 1(0.19) 3(0.58)
Trichechus senegalensis 11(2.120) 8(1.5) 1(0.19) 20(3.86)
Varanus nitoticus 20(3.86) 19(3.67) 13(2.51) 52(10.04)
Bos indicus 5(0.96) 20(2.12) 15(2.90) 40(7.72)
Caprini 26(5.01) 31.5.98 13(5.98) 70(13.51)
Tortoise sp. 1(0.19) 4(0.77) 0 5(0.96)
Total 155 192 169 516
Values in brackets represents Percentage
|| Bioinfo Publications || 76
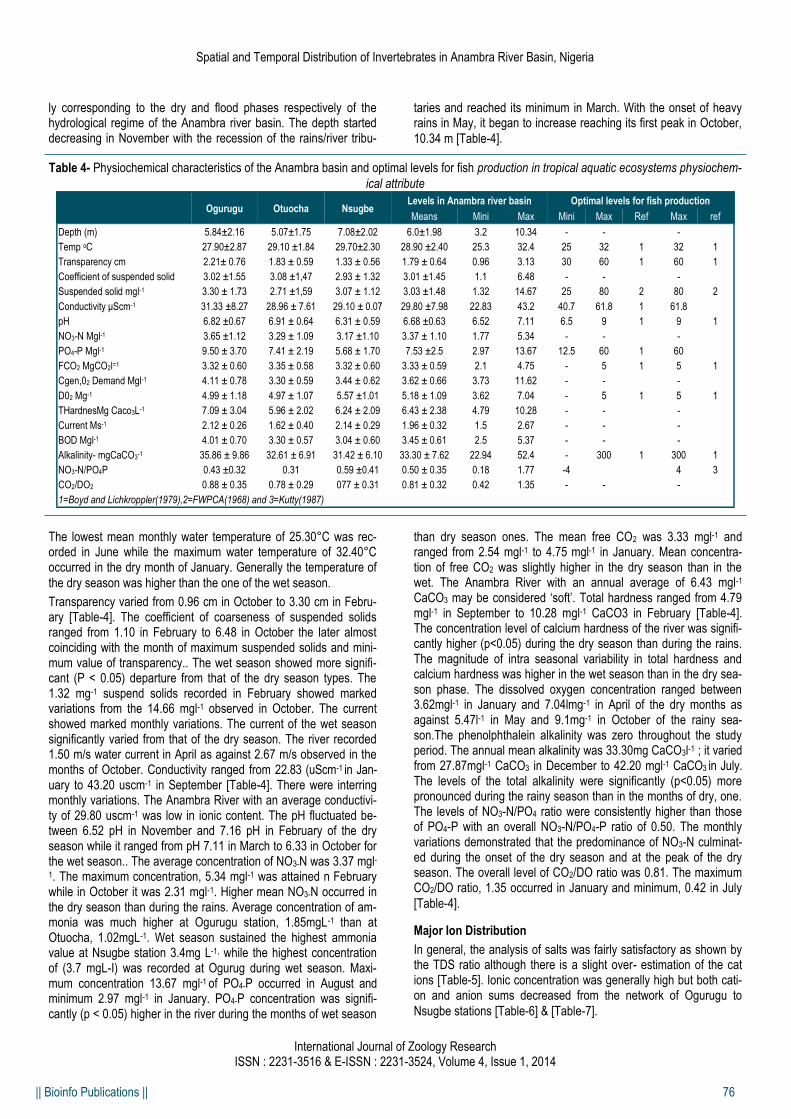
ly corresponding to the dry and flood phases respectively of the hydrological regime of the Anambra river basin. The depth started decreasing in November with the recession of the rains/river tribu-
taries and reached its minimum in March. With the onset of heavy rains in May, it began to increase reaching its first peak in October,
10.34 m [Table-4].
International Journal of Zoology Research ISSN : 2231-3516 & E-ISSN : 2231-3524, Volume 4, Issue 1, 2014
Spatial and Temporal Distribution of Invertebrates in Anambra River Basin, Nigeria
Table 4- Physiochemical characteristics of the Anambra basin and optimal levels for fish production in tropical aquatic ecosystems physiochem-
ical attribute
Ogurugu Otuocha Nsugbe Levels in Anambra river basin Optimal levels for fish production
Means Mini Max Mini Max Ref Max ref
Depth (m) 5.84±2.16 5.07±1.75 7.08±2.02 6.0±1.98 3.2 10.34 - - -
Temp oC 27.90±2.87 29.10 ±1.84 29.70±2.30 28.90 ±2.40 25.3 32.4 25 32 1 32 1
Transparency cm 2.21± 0.76 1.83 ± 0.59 1.33 ± 0.56 1.79 ± 0.64 0.96 3.13 30 60 1 60 1
Coefficient of suspended solid 3.02 ±1.55 3.08 ±1,47 2.93 ± 1.32 3.01 ±1.45 1.1 6.48 - - -
Suspended solid mgl-1 3.30 ± 1.73 2.71 ±1,59 3.07 ± 1.12 3.03 ±1.48 1.32 14.67 25 80 2 80 2
Conductivity μScm-1 31.33 ±8.27 28.96 ± 7.61 29.10 ± 0.07 29.80 ±7.98 22.83 43.2 40.7 61.8 1 61.8
pH 6.82 ±0.67 6.91 ± 0.64 6.31 ± 0.59 6.68 ±0.63 6.52 7.11 6.5 9 1 9 1
NO3-N Mgl-1 3.65 ±1.12 3.29 ± 1.09 3.17 ±1.10 3.37 ± 1.10 1.77 5.34 - - -
PO4-P Mgl-1 9.50 ± 3.70 7.41 ± 2.19 5.68 ± 1.70 7.53 ±2.5 2.97 13.67 12.5 60 1 60
FCO2 MgCO2l=1 3.32 ± 0.60 3.35 ± 0.58 3.32 ± 0.60 3.33 ± 0.59 2.1 4.75 - 5 1 5 1
Cgen,02 Demand Mgl-1 4.11 ± 0.78 3.30 ± 0.59 3.44 ± 0.62 3.62 ± 0.66 3.73 11.62 - - -
D02 Mg-1 4.99 ± 1.18 4.97 ± 1.07 5.57 ±1.01 5.18 ± 1.09 3.62 7.04 - 5 1 5 1
THardnesMg Caco3L-1 7.09 ± 3.04 5.96 ± 2.02 6.24 ± 2.09 6.43 ± 2.38 4.79 10.28 - - -
Current Ms-1 2.12 ± 0.26 1.62 ± 0.40 2.14 ± 0.29 1.96 ± 0.32 1.5 2.67 - - -
BOD Mgl-1 4.01 ± 0.70 3.30 ± 0.57 3.04 ± 0.60 3.45 ± 0.61 2.5 5.37 - - -
Alkalinity- mgCaCO3-1 35.86 ± 9.86 32.61 ± 6.91 31.42 ± 6.10 33.30 ± 7.62 22.94 52.4 - 300 1 300 1
NO3-N/PO4P 0.43 ±0.32 0.31 0.59 ±0.41 0.50 ± 0.35 0.18 1.77 -4 4 3
CO2/DO2 0.88 ± 0.35 0.78 ± 0.29 077 ± 0.31 0.81 ± 0.32 0.42 1.35 - - -
1=Boyd and Lichkroppler(1979),2=FWPCA(1968) and 3=Kutty(1987)
The lowest mean monthly water temperature of 25.30°C was rec-orded in June while the maximum water temperature of 32.40°C occurred in the dry month of January. Generally the temperature of
the dry season was higher than the one of the wet season.
Transparency varied from 0.96 cm in October to 3.30 cm in Febru-ary [Table-4]. The coefficient of coarseness of suspended solids ranged from 1.10 in February to 6.48 in October the later almost coinciding with the month of maximum suspended solids and mini-mum value of transparency.. The wet season showed more signifi-cant (P < 0.05) departure from that of the dry season types. The 1.32 mg-1 suspend solids recorded in February showed marked variations from the 14.66 mgl-1 observed in October. The current showed marked monthly variations. The current of the wet season significantly varied from that of the dry season. The river recorded 1.50 m/s water current in April as against 2.67 m/s observed in the months of October. Conductivity ranged from 22.83 (uScm-1 in Jan-uary to 43.20 uscm-1 in September [Table-4]. There were interring monthly variations. The Anambra River with an average conductivi-ty of 29.80 uscm-1 was low in ionic content. The pH fluctuated be-tween 6.52 pH in November and 7.16 pH in February of the dry season while it ranged from pH 7.11 in March to 6.33 in October for the wet season.. The average concentration of NO3-N was 3.37 mgl-1. The maximum concentration, 5.34 mgl-1 was attained n February while in October it was 2.31 mgl-1. Higher mean NO3-N occurred in the dry season than during the rains. Average concentration of am-monia was much higher at Ogurugu station, 1.85mgL-1 than at Otuocha, 1.02mgL-1. Wet season sustained the highest ammonia value at Nsugbe station 3.4mg L-1, while the highest concentration of (3.7 mgL-I) was recorded at Ogurug during wet season. Maxi-mum concentration 13.67 mgl-1 of PO4-P occurred in August and minimum 2.97 mgl-1 in January. PO4-P concentration was signifi-cantly (p < 0.05) higher in the river during the months of wet season
than dry season ones. The mean free CO2 was 3.33 mgl-1 and ranged from 2.54 mgl-1 to 4.75 mgl-1 in January. Mean concentra-tion of free CO2 was slightly higher in the dry season than in the wet. The Anambra River with an annual average of 6.43 mgl-1 CaCO3 may be considered ‘soft’. Total hardness ranged from 4.79 mgl-1 in September to 10.28 mgl-1 CaCO3 in February [Table-4]. The concentration level of calcium hardness of the river was signifi-cantly higher (p<0.05) during the dry season than during the rains. The magnitude of intra seasonal variability in total hardness and calcium hardness was higher in the wet season than in the dry sea-son phase. The dissolved oxygen concentration ranged between 3.62mgl-1 in January and 7.04lmg-1 in April of the dry months as against 5.47l-1 in May and 9.1mg-1 in October of the rainy sea-son.The phenolphthalein alkalinity was zero throughout the study period. The annual mean alkalinity was 33.30mg CaCO3l-1 ; it varied from 27.87mgl-1 CaCO3 in December to 42.20 mgl-1 CaCO3 in July. The levels of the total alkalinity were significantly (p<0.05) more pronounced during the rainy season than in the months of dry, one. The levels of NO3-N/PO4 ratio were consistently higher than those of PO4-P with an overall NO3-N/PO4-P ratio of 0.50. The monthly variations demonstrated that the predominance of NO3-N culminat-ed during the onset of the dry season and at the peak of the dry season. The overall level of CO2/DO ratio was 0.81. The maximum CO2/DO ratio, 1.35 occurred in January and minimum, 0.42 in July
[Table-4].
Major Ion Distribution
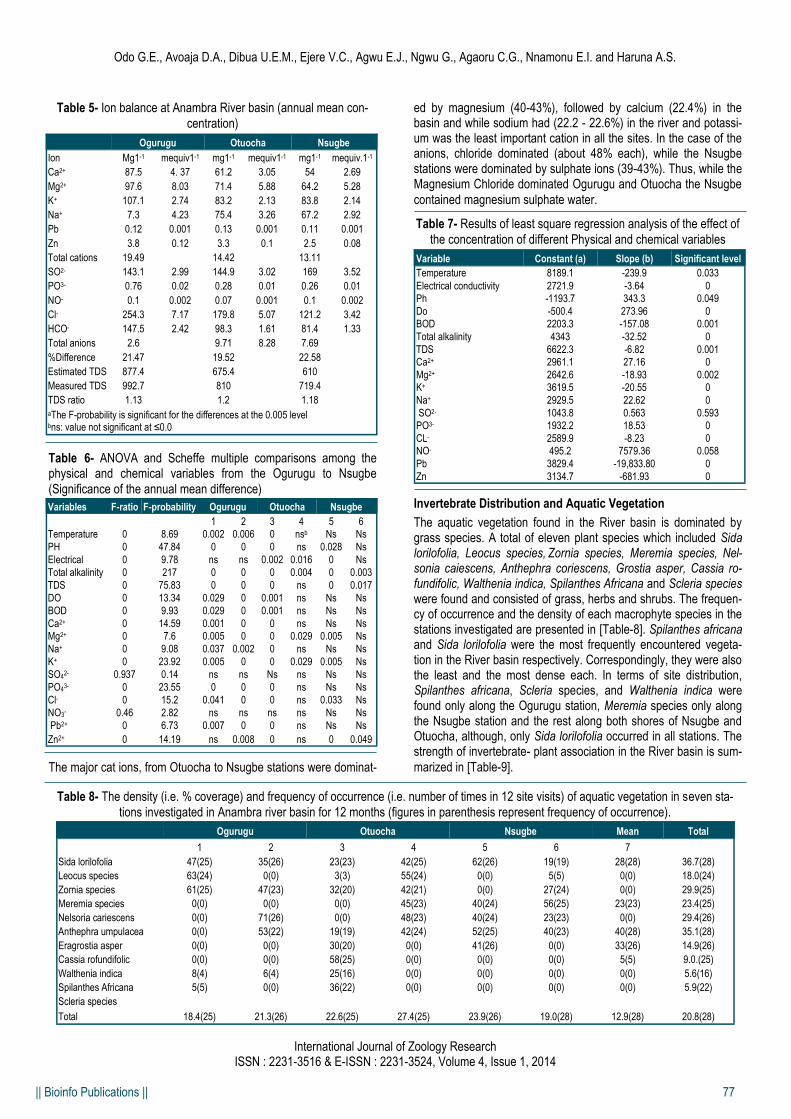
In general, the analysis of salts was fairly satisfactory as shown by the TDS ratio although there is a slight over- estimation of the cat ions [Table-5]. Ionic concentration was generally high but both cati-on and anion sums decreased from the network of Ogurugu to
Nsugbe stations [Table-6] & [Table-7].
|| Bioinfo Publications || 77
Table 5- Ion balance at Anambra River basin (annual mean con-
centration)
Table 6- ANOVA and Scheffe multiple comparisons among the physical and chemical variables from the Ogurugu to Nsugbe
(Significance of the annual mean difference)
The major cat ions, from Otuocha to Nsugbe stations were dominat-
ed by magnesium (40-43%), followed by calcium (22.4%) in the basin and while sodium had (22.2 - 22.6%) in the river and potassi-um was the least important cation in all the sites. In the case of the anions, chloride dominated (about 48% each), while the Nsugbe stations were dominated by sulphate ions (39-43%). Thus, while the Magnesium Chloride dominated Ogurugu and Otuocha the Nsugbe
contained magnesium sulphate water.
Table 7- Results of least square regression analysis of the effect of
the concentration of different Physical and chemical variables
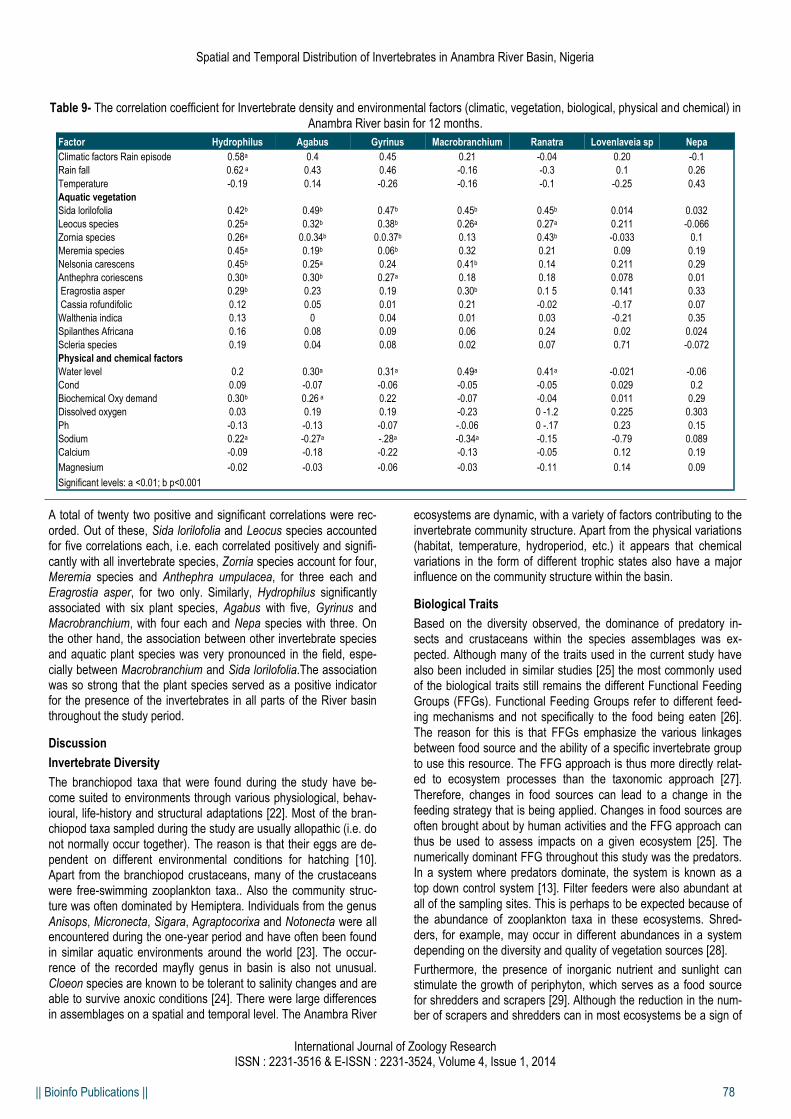
Invertebrate Distribution and Aquatic Vegetation
The aquatic vegetation found in the River basin is dominated by grass species. A total of eleven plant species which included Sida lorilofolia, Leocus species, Zornia species, Meremia species, Nel-sonia caiescens, Anthephra coriescens, Grostia asper, Cassia ro-fundifolic, Walthenia indica, Spilanthes Africana and Scleria species were found and consisted of grass, herbs and shrubs. The frequen-cy of occurrence and the density of each macrophyte species in the stations investigated are presented in [Table-8]. Spilanthes africana and Sida lorilofolia were the most frequently encountered vegeta-tion in the River basin respectively. Correspondingly, they were also the least and the most dense each. In terms of site distribution, Spilanthes africana, Scleria species, and Walthenia indica were found only along the Ogurugu station, Meremia species only along the Nsugbe station and the rest along both shores of Nsugbe and Otuocha, although, only Sida lorilofolia occurred in all stations. The strength of invertebrate- plant association in the River basin is sum-
marized in [Table-9].
International Journal of Zoology Research ISSN : 2231-3516 & E-ISSN : 2231-3524, Volume 4, Issue 1, 2014
Odo G.E., Avoaja D.A., Dibua U.E.M., Ejere V.C., Agwu E.J., Ngwu G., Agaoru C.G., Nnamonu E.I. and Haruna A.S.
Variable Constant (a) Slope (b) Significant level
Temperature 8189.1 -239.9 0.033
Electrical conductivity 2721.9 -3.64 0
Ph -1193.7 343.3 0.049
Do -500.4 273.96 0
BOD 2203.3 -157.08 0.001
Total alkalinity 4343 -32.52 0
TDS 6622.3 -6.82 0.001
Ca2+ 2961.1 27.16 0
Mg2+ 2642.6 -18.93 0.002
K+ 3619.5 -20.55 0
Na+ 2929.5 22.62 0
SO2- 1043.8 0.563 0.593
PO3- 1932.2 18.53 0
CL- 2589.9 -8.23 0
NO- 495.2 7579.36 0.058
Pb 3829.4 -19,833.80 0
Zn 3134.7 -681.93 0
Ogurugu Otuocha Nsugbe
Ion Mg1-1 mequiv1-1 mg1-1 mequiv1-1 mg1-1 mequiv.1-1
Ca2+ 87.5 4. 37 61.2 3.05 54 2.69
Mg2+ 97.6 8.03 71.4 5.88 64.2 5.28
K+ 107.1 2.74 83.2 2.13 83.8 2.14
Na+ 7.3 4.23 75.4 3.26 67.2 2.92
Pb 0.12 0.001 0.13 0.001 0.11 0.001
Zn 3.8 0.12 3.3 0.1 2.5 0.08
Total cations 19.49 14.42 13.11
SO2- 143.1 2.99 144.9 3.02 169 3.52
PO3- 0.76 0.02 0.28 0.01 0.26 0.01
NO- 0.1 0.002 0.07 0.001 0.1 0.002
Cl- 254.3 7.17 179.8 5.07 121.2 3.42
HCO- 147.5 2.42 98.3 1.61 81.4 1.33
Total anions 2.6 9.71 8.28 7.69
%Difference 21.47 19.52 22.58
Estimated TDS 877.4 675.4 610
Measured TDS 992.7 810 719.4
TDS ratio 1.13 1.2 1.18 aThe F-probability is significant for the differences at the 0.005 level bns: value not significant at ≤0.0
Variables F-ratio F-probability Ogurugu Otuocha Nsugbe
1 2 3 4 5 6
Temperature 0 8.69 0.002 0.006 0 nsb Ns Ns
PH 0 47.84 0 0 0 ns 0.028 Ns
Electrical 0 9.78 ns ns 0.002 0.016 0 Ns
Total alkalinity 0 217 0 0 0 0.004 0 0.003
TDS 0 75.83 0 0 0 ns 0 0.017
DO 0 13.34 0.029 0 0.001 ns Ns Ns
BOD 0 9.93 0.029 0 0.001 ns Ns Ns
Ca2+ 0 14.59 0.001 0 0 ns Ns Ns
Mg2+ 0 7.6 0.005 0 0 0.029 0.005 Ns
Na+ 0 9.08 0.037 0.002 0 ns Ns Ns
K+ 0 23.92 0.005 0 0 0.029 0.005 Ns
SO42- 0.937 0.14 ns ns Ns ns Ns Ns
PO43- 0 23.55 0 0 0 ns Ns Ns
Cl- 0 15.2 0.041 0 0 ns 0.033 Ns
NO3- 0.46 2.82 ns ns ns ns Ns Ns
Pb2+ 0 6.73 0.007 0 0 ns Ns Ns
Zn2+ 0 14.19 ns 0.008 0 ns 0 0.049
Table 8- The density (i.e. % coverage) and frequency of occurrence (i.e. number of times in 12 site visits) of aquatic vegetation in seven sta-
tions investigated in Anambra river basin for 12 months (figures in parenthesis represent frequency of occurrence).
Ogurugu Otuocha Nsugbe Mean Total
1 2 3 4 5 6 7
Sida lorilofolia 47(25) 35(26) 23(23) 42(25) 62(26) 19(19) 28(28) 36.7(28)
Leocus species 63(24) 0(0) 3(3) 55(24) 0(0) 5(5) 0(0) 18.0(24)
Zornia species 61(25) 47(23) 32(20) 42(21) 0(0) 27(24) 0(0) 29.9(25)
Meremia species 0(0) 0(0) 0(0) 45(23) 40(24) 56(25) 23(23) 23.4(25)
Nelsoria cariescens 0(0) 71(26) 0(0) 48(23) 40(24) 23(23) 0(0) 29.4(26)
Anthephra umpulacea 0(0) 53(22) 19(19) 42(24) 52(25) 40(23) 40(28) 35.1(28)
Eragrostia asper 0(0) 0(0) 30(20) 0(0) 41(26) 0(0) 33(26) 14.9(26)
Cassia rofundifolic 0(0) 0(0) 58(25) 0(0) 0(0) 0(0) 5(5) 9.0.(25)
Walthenia indica 8(4) 6(4) 25(16) 0(0) 0(0) 0(0) 0(0) 5.6(16)
Spilanthes Africana 5(5) 0(0) 36(22) 0(0) 0(0) 0(0) 0(0) 5.9(22)
Scleria species
Total 18.4(25) 21.3(26) 22.6(25) 27.4(25) 23.9(26) 19.0(28) 12.9(28) 20.8(28)
|| Bioinfo Publications || 78
Table 9- The correlation coefficient for Invertebrate density and environmental factors (climatic, vegetation, biological, physical and chemical) in
Anambra River basin for 12 months.
Factor Hydrophilus Agabus Gyrinus Macrobranchium Ranatra Lovenlaveia sp Nepa
Climatic factors Rain episode 0.58a 0.4 0.45 0.21 -0.04 0.20 -0.1
Rain fall 0.62 a 0.43 0.46 -0.16 -0.3 0.1 0.26
Temperature -0.19 0.14 -0.26 -0.16 -0.1 -0.25 0.43
Aquatic vegetation
Sida lorilofolia 0.42b 0.49b 0.47b 0.45b 0.45b 0.014 0.032
Leocus species 0.25a 0.32b 0.38b 0.26a 0.27a 0.211 -0.066
Zornia species 0.26a 0.0.34b 0.0.37b 0.13 0.43b -0.033 0.1
Meremia species 0.45a 0.19b 0.06b 0.32 0.21 0.09 0.19
Nelsonia carescens 0.45b 0.25a 0.24 0.41b 0.14 0.211 0.29
Anthephra coriescens 0.30b 0.30b 0.27a 0.18 0.18 0.078 0.01
Eragrostia asper 0.29b 0.23 0.19 0.30b 0.1 5 0.141 0.33
Cassia rofundifolic 0.12 0.05 0.01 0.21 -0.02 -0.17 0.07
Walthenia indica 0.13 0 0.04 0.01 0.03 -0.21 0.35
Spilanthes Africana 0.16 0.08 0.09 0.06 0.24 0.02 0.024
Scleria species 0.19 0.04 0.08 0.02 0.07 0.71 -0.072
Physical and chemical factors
Water level 0.2 0.30a 0.31a 0.49a 0.41a -0.021 -0.06
Cond 0.09 -0.07 -0.06 -0.05 -0.05 0.029 0.2
Biochemical Oxy demand 0.30b 0.26 a 0.22 -0.07 -0.04 0.011 0.29
Dissolved oxygen 0.03 0.19 0.19 -0.23 0 -1.2 0.225 0.303
Ph -0.13 -0.13 -0.07 -.0.06 0 -.17 0.23 0.15
Sodium 0.22a -0.27a -.28a -0.34a -0.15 -0.79 0.089
Calcium -0.09 -0.18 -0.22 -0.13 -0.05 0.12 0.19
Magnesium -0.02 -0.03 -0.06 -0.03 -0.11 0.14 0.09
Significant levels: a <0.01; b p<0.001
International Journal of Zoology Research ISSN : 2231-3516 & E-ISSN : 2231-3524, Volume 4, Issue 1, 2014
Spatial and Temporal Distribution of Invertebrates in Anambra River Basin, Nigeria
A total of twenty two positive and significant correlations were rec-
orded. Out of these, Sida lorilofolia and Leocus species accounted for five correlations each, i.e. each correlated positively and signifi-
cantly with all invertebrate species, Zornia species account for four, Meremia species and Anthephra umpulacea, for three each and Eragrostia asper, for two only. Similarly, Hydrophilus significantly associated with six plant species, Agabus with five, Gyrinus and Macrobranchium, with four each and Nepa species with three. On the other hand, the association between other invertebrate species and aquatic plant species was very pronounced in the field, espe-
cially between Macrobranchium and Sida lorilofolia.The association was so strong that the plant species served as a positive indicator for the presence of the invertebrates in all parts of the River basin throughout the study period.
Discussion
Invertebrate Diversity
The branchiopod taxa that were found during the study have be-come suited to environments through various physiological, behav-ioural, life-history and structural adaptations [22]. Most of the bran-chiopod taxa sampled during the study are usually allopathic (i.e. do not normally occur together). The reason is that their eggs are de-pendent on different environmental conditions for hatching [10]. Apart from the branchiopod crustaceans, many of the crustaceans were free-swimming zooplankton taxa.. Also the community struc-ture was often dominated by Hemiptera. Individuals from the genus
Anisops, Micronecta, Sigara, Agraptocorixa and Notonecta were all encountered during the one-year period and have often been found in similar aquatic environments around the world [23]. The occur-rence of the recorded mayfly genus in basin is also not unusual.
Cloeon species are known to be tolerant to salinity changes and are able to survive anoxic conditions [24]. There were large differences in assemblages on a spatial and temporal level. The Anambra River
ecosystems are dynamic, with a variety of factors contributing to the invertebrate community structure. Apart from the physical variations (habitat, temperature, hydroperiod, etc.) it appears that chemical variations in the form of different trophic states also have a major influence on the community structure within the basin.
Biological Traits
Based on the diversity observed, the dominance of predatory in-sects and crustaceans within the species assemblages was ex-
pected. Although many of the traits used in the current study have
also been included in similar studies [25] the most commonly used of the biological traits still remains the different Functional Feeding
Groups (FFGs). Functional Feeding Groups refer to different feed-ing mechanisms and not specifically to the food being eaten [26].
The reason for this is that FFGs emphasize the various linkages between food source and the ability of a specific invertebrate group
to use this resource. The FFG approach is thus more directly relat-ed to ecosystem processes than the taxonomic approach [27].
Therefore, changes in food sources can lead to a change in the feeding strategy that is being applied. Changes in food sources are
often brought about by human activities and the FFG approach can thus be used to assess impacts on a given ecosystem [25]. The
numerically dominant FFG throughout this study was the predators. In a system where predators dominate, the system is known as a
top down control system [13]. Filter feeders were also abundant at
all of the sampling sites. This is perhaps to be expected because of the abundance of zooplankton taxa in these ecosystems. Shred-
ders, for example, may occur in different abundances in a system depending on the diversity and quality of vegetation sources [28].
Furthermore, the presence of inorganic nutrient and sunlight can stimulate the growth of periphyton, which serves as a food source for shredders and scrapers [29]. Although the reduction in the num-ber of scrapers and shredders can in most ecosystems be a sign of
|| Bioinfo Publications || 79
environmental stress, these groups simply do not occur in high numbers in basin due to a lack of suitable habitat and food sources. Only in those stations where suitable conditions were present did representatives of these groups occur. Because individual FFGs react differently to human impacts, ratios between various FFGs have been suggested as possible indicators of ecological integrity [13]. Very few of the other FFGs (like scrapers and shredders) were present during the different sampling surveys. It is clear that the presence of certain FFGs is driven by the availability of food sources and quality of the biotope. It became apparent that the biological traits reflected the available biotopes and not necessarily the impacts of human activities. The habitat available to the various invertebrates can thus be seen as one of the most important driving variables of biological traits displayed by the community [30]. This explains the occurrence of so many free-swimming and air-breathing taxa, aquatic macrophytes in these systems also contrib-
utes to the presence of certain traits [31].
Spatial and Temporal Analysis
The Shannon diversity index [17] incorporates both the species richness and equitability components and has long been used as an index of diversity together with the Simpson index [18], which is an index of concentration or dominance. Simpson’s index measures the probability that two individuals selected at random from a sam-ple will belong to the same species. The results for both these indi-ces show that there have been definite changes in the invertebrate community at Otuocha. It should be noted that a very low number of taxa was sampled at this site and as diversity indices take into ac-count species richness (number of taxa) and evenness (number of individuals per taxa) [32], the lower abundances clearly had an influence on the results for this site. Margalef’s species richness index [19] measures the number of individuals present for a given number of species, incorporating both the total number of species and the total number of individuals. Pielou’s evenness index [20] is an indication of how the individuals in a sample are distributed over the various species that make up a community and gives an indica-tion of dominance. It became evident that the invertebrate commu-nity structure might become altered as a result of the agricultural activities at the representative sites. A lack of evenness is often considered a sign of dominance within a given biotic community. The community at Nsugbe was dominated by zooplankton and oli-gochaetes, while zooplankton (Lovenula falcifera, Metadiaptomus meridianusand Daphnia sp) dominated at Ogurug and Otuocha.The invertebrate community at Ogurugu (in the vicinity of agricultural activity) showed several alterations, with Gomphocythereobtusata, Lovenula falcifera and Plea piccanina dominating the community structure. Dominance is often seen as a sign of pollution, although zooplankton communities are expected to dominate in lotic environ-ment. The habitat is dominated by Sida lorilofolia and Anthreohra umpidacea and various submerged macrophytes. The changes in the diversity and biological traits displayed by the taxa in Nsubge appeared to be the result of a change in habitat. The occurrence of many of these taxa (Cloeon sp. and Plea sp.) may thus be related to the presence of aquatic macrophytes as a habitat in an ecosys-tem where vegetation is usually restricted. The change in habitat may be a direct result of anthropogenic inputs from the agricultural activities. This includes eutrophication and a change in substrate caused by siltation. In addition to the fish species found in the river, there are some other forms of aquatic fauna. The crab Su-danonantes Africa occurs in large quantity, as well as snails, croco-
diles, and snakes. Both the numbers and distribution of large mam-mals on the River basin have been greatly reduced due increased human influence such as hunting, burning. Fish eating birds, always the most abundant species, were confined largely only to the vicini-ty of River Anambra and shoreline. Domestic animal populations are on the increase. The moist and easily saturated soil condition for some months of the year might favor growth of herbaceous grasses and forbs which could serve as fodder to the livestock. In fact more than 300 domestic animals were counted during the dry season utilizing the plain. The availability of forage species coupled with perennial fodder shortage for the Nigeria livestock population indicate the River basin might serve a good dry season grazing areas for both resident animals. This confirms that natural aquatic environment houses a variety of aquatic lives. The surface tempera-ture undergoes relatively small fluctuations, there was a fairly con-sistent thermal regime of about 29.5°C and the pH range was be-tween 6.8 and 7.7. This range fell within the recommended range that supports aquatic life including fishes [33]. The water quality of the river can be improved further by controlling and / or prohibiting the discharge of municipal effluents and domestic garbage into the river as well as the use of the riparian zone for crop agriculture. The maintenance of 50 -60 m thick riparian vegetation can act as a buff-
er strip to check erosion by acting as sediment break/filter.
Physiochemical
The density diversity indices vary both spatially and temporally. The pattern of temporal dynamics in the density of fauna was affected by the variability of the physicochemical parameters of the river. The long-term monitoring of anthropogenic pollution in aquatic eco-system is of environmental and human health concern even nowa-days, when numerous effective measures were undertaken to re-duce the pollution impact of natural water bodies. In these aquatic organisms are used for biological monitoring of variations in the environmental levels of anthropogenic pollutants [16]. Both ecologi-cal and toxicological factors influenced invertebrate assemblages at the studied area. Among ecological factors, DO, N03-N, ammonia, conductivities, were the most significant variables to explain varia-tions in invertebrates. The concentration of dissolved oxygen is one of the most important key factors in controlling aquatic life.The low O2 levels was an important factor in limiting species distribution. In response to decrease O2 concentration, species richness and diver-sity both decrease, and the species composition is largely deter-mined by the tolerance to O2 deficiency [25]. The Otuocha station was more oxygenated as compared to Ogurugu and Nsugbe sta-tions. This may be one major factor responsible for increasing diver-sity with invertebrates in these stations. Total ammonia nitrogen (TAN) is composed of toxic (un-ionized) ammonia (NH3) and non-toxic ionized ammonia NH4. Only a fraction of the TAN exists as toxic (un-ionized) ammonia, and a balance exists between it and the non-toxic ionized ammonia: The proportion of TAN in the toxic form increases as the temp and the pH of the water increases. For every pH increase of one unit, the amount of toxic un-ionized am-monia increases about 10 times [6]. Anambra River is characterized by high concentration of ammonia which may result from the large amount of domestic, agric input and sewage input. Result of pre-sent study was substantiated by the findings of Beketov, et al [8]. They stated that ammonia is toxic not only to fish but to all aquatic animals. The invertebrates prefer pH range of 6.5 to 8.5.In this study pH ranged from 6.52 in November to 7.16 in February of the dry season while pH 6.33 in March to 7.11 in October was regis-
International Journal of Zoology Research ISSN : 2231-3516 & E-ISSN : 2231-3524, Volume 4, Issue 1, 2014
Odo G.E., Avoaja D.A., Dibua U.E.M., Ejere V.C., Agwu E.J., Ngwu G., Agaoru C.G., Nnamonu E.I. and Haruna A.S.
|| Bioinfo Publications || 80
tered for the wet season which fall closes the recorded preference. The pH showed negative correlation (Pearson) in relation to the population dynamics (density and diversity), of invertebrates in all the three study stations. Conductivity is considered to be an im-portant indicator of trophic states. Conductivity ranged from 22.83 (uScm-1 in January to 43.20 uscm-1 in September. There were inter-ring monthly variations. The Anambra River with an average con-ductivity of 29.80 uscm-1 was low in ionic content and positively correlated with invertebrate density and diversity in all the three study stations. It conforms to the studies of Haase & Nolte [3] who observed the seasonal samples of invertebrate in the Salado River basin (Argentina). He found that there were differences in number and diversity of species in relation to conductivity, and species which might tolerate high conductivity. According to the most recent literature, nitrogen compounds which are included in artificial fertiliz-er are one major factor responsible for accelerating the eutrophica-tion of surface waters [31]. This influences the quality of inland wa-ters, which are endangered by the increase of trophic condition as a result of enrichment from the catchments area [5]. The Anambra River showed high, enrichment with nutrients and the dominant invertebrate’s species in this river, Gyrinus, Ranatra, and Caridina are abundant in their basin. The abundance and biomass of the
invertebrates’ communities suggest a high trophy in this river.
Conclusion
The study revealed a large degree of variation when the inverte-
brate communities of different stations of the basin were compared
taxonomicallyThe strong invertebrate-plant association recorded in
this study agrees with similar reports from many parts of Africa
[11,34,35]. However, while in Lake Volta Ceratophyllum dermersum
was the most important vegetation found in association with inverte-
brate [35] and in Egypt, Potamogeton crispus and Eichhornia cras-
sipes were commonly associated with invertebrate fauna [36] in
Anambra River basin, Sida lorilofolia which significantly associated
with all invertebrates fauna is the most important vegetation. These
results highlight the importance of aquatic plants in invertebrate
distribution, although the importance of each species may vary
between regions and even between water bodies within a give re-
gion. The above considerations suggest that local distribution of
invertebrate species in Anambra River basin could be attributed to
invertebrate - plant association and to chemical factors such as
conductivity, dissolved oxygen and biochemical oxygen demand,
while seasonal trends depended mainly on rainfall and water level
patterns. Although the study may not have exhausted all factors
which influence local distribution of invertebrate in River basins, it
has provided the necessary baseline data for planning future re-
search programmes. Finally, according to the criteria adopted by
the European Union, the United States of America’s Environmental
Protection Agency (EPA), the United Nations Food and Agricultural
Organization (FAO) and the Inland Waters Directorate of Canada
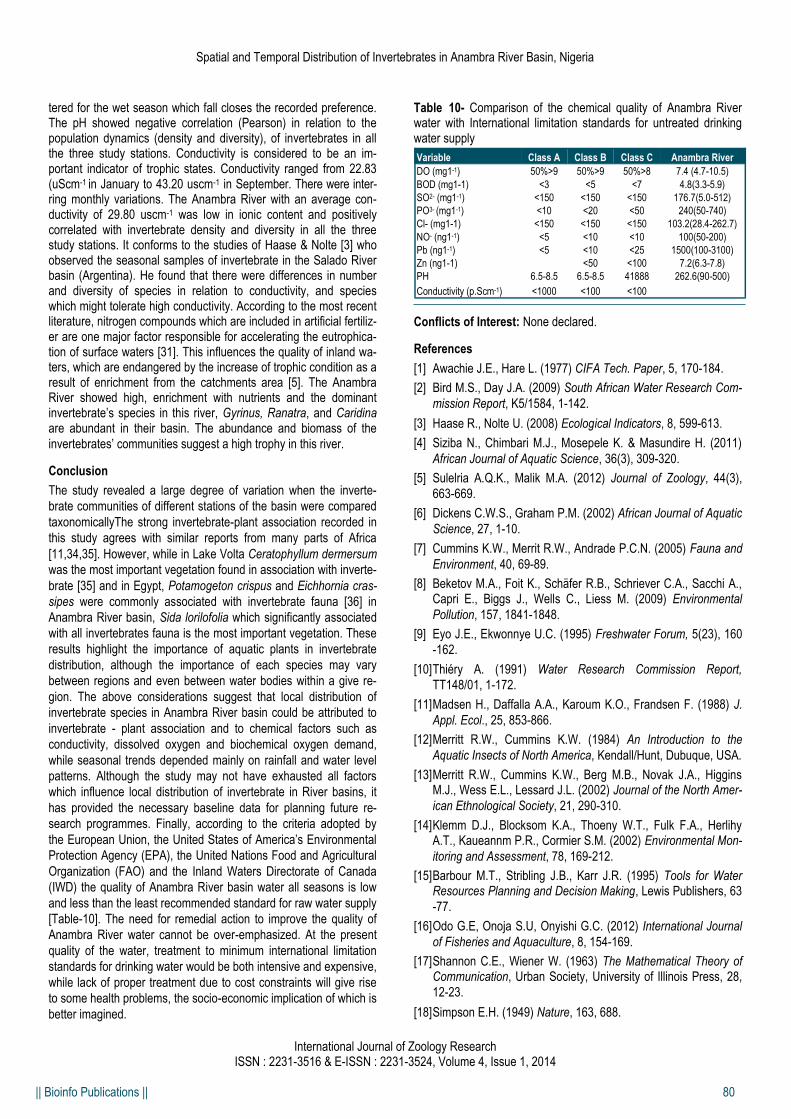
(IWD) the quality of Anambra River basin water all seasons is low
and less than the least recommended standard for raw water supply
[Table-10]. The need for remedial action to improve the quality of
Anambra River water cannot be over-emphasized. At the present
quality of the water, treatment to minimum international limitation
standards for drinking water would be both intensive and expensive,
while lack of proper treatment due to cost constraints will give rise
to some health problems, the socio-economic implication of which is
better imagined.
Table 10- Comparison of the chemical quality of Anambra River water with International limitation standards for untreated drinking water supply
Conflicts of Interest: None declared.
References
[1] Awachie J.E., Hare L. (1977) CIFA Tech. Paper, 5, 170-184.
[2] Bird M.S., Day J.A. (2009) South African Water Research Com-
mission Report, K5/1584, 1-142.
[3] Haase R., Nolte U. (2008) Ecological Indicators, 8, 599-613.
[4] Siziba N., Chimbari M.J., Mosepele K. & Masundire H. (2011)
African Journal of Aquatic Science, 36(3), 309-320.
[5] Sulelria A.Q.K., Malik M.A. (2012) Journal of Zoology, 44(3),
663-669.
[6] Dickens C.W.S., Graham P.M. (2002) African Journal of Aquatic
Science, 27, 1-10.
[7] Cummins K.W., Merrit R.W., Andrade P.C.N. (2005) Fauna and
Environment, 40, 69-89.
[8] Beketov M.A., Foit K., Schäfer R.B., Schriever C.A., Sacchi A., Capri E., Biggs J., Wells C., Liess M. (2009) Environmental
Pollution, 157, 1841-1848.
[9] Eyo J.E., Ekwonnye U.C. (1995) Freshwater Forum, 5(23), 160
-162.
[10] Thiéry A. (1991) Water Research Commission Report,
TT148/01, 1-172.
[11] Madsen H., Daffalla A.A., Karoum K.O., Frandsen F. (1988) J.
Appl. Ecol., 25, 853-866.
[12] Merritt R.W., Cummins K.W. (1984) An Introduction to the
Aquatic Insects of North America, Kendall/Hunt, Dubuque, USA.
[13] Merritt R.W., Cummins K.W., Berg M.B., Novak J.A., Higgins M.J., Wess E.L., Lessard J.L. (2002) Journal of the North Amer-
ican Ethnological Society, 21, 290-310.
[14] Klemm D.J., Blocksom K.A., Thoeny W.T., Fulk F.A., Herlihy A.T., Kaueannm P.R., Cormier S.M. (2002) Environmental Mon-
itoring and Assessment, 78, 169-212.
[15] Barbour M.T., Stribling J.B., Karr J.R. (1995) Tools for Water Resources Planning and Decision Making, Lewis Publishers, 63
-77.
[16] Odo G.E, Onoja S.U, Onyishi G.C. (2012) International Journal
of Fisheries and Aquaculture, 8, 154-169.
[17] Shannon C.E., Wiener W. (1963) The Mathematical Theory of Communication, Urban Society, University of Illinois Press, 28,
12-23.
[18] Simpson E.H. (1949) Nature, 163, 688.
International Journal of Zoology Research ISSN : 2231-3516 & E-ISSN : 2231-3524, Volume 4, Issue 1, 2014
Spatial and Temporal Distribution of Invertebrates in Anambra River Basin, Nigeria
Variable Class A Class B Class C Anambra River
DO (mg1-1) 50%>9 50%>9 50%>8 7.4 (4.7-10.5)
BOD (mg1-1) <3 <5 <7 4.8(3.3-5.9)
SO2- (mg1-1) <150 <150 <150 176.7(5.0-512)
PO3- (mg1-1) <10 <20 <50 240(50-740)
Cl- (mg1-1) <150 <150 <150 103.2(28.4-262.7)
NO- (ng1-1) <5 <10 <10 100(50-200)
Pb (ng1-1) <5 <10 <25 1500(100-3100)
Zn (ng1-1) <50 <100 7.2(6.3-7.8)
PH 6.5-8.5 6.5-8.5 41888 262.6(90-500)
Conductivity (p.Scm-1) <1000 <100 <100
|| Bioinfo Publications || 81
[19] Margalef R. (1968) Perspectives in Ecological Theory, Universi-
ty of Chicago Press, Chicago.
[20] Pielou E.C. (1971) Ecosystem Structure and Function, Oregon
State University Press.
[21] APHA, AWWA, WPCF (2005) Standard Methods for the Exami-nation of Water and Wastewater, Washington, DC, 21st ed.,
401.
[22] De roeck E.R., Vanschoenwinkel B.J., Day J.A., Xu Y., Raitt L.,
Brendonck L. (2007) Wetlands, 27, 162-173.
[23] Wissinger S.A., Greig H., Mcintosh A. (2009) Bentholological
Society, 28, 12-23.
[24] Hassell K.L., Kefford B.J., Nugegoda D. (2006) Journal of Ex-
perimental Biology, 209, 4024-4032.
[25] Solimini A.G., Bazzanti M., Ruggiero A., Carchini G. (2008)
Hydrobiologia, 597, 109-123.
[26] Cummins K.W., Klug M.J. (1979) Annual Review of Ecology
Systematic, 10, 147-172.
[27] Yoshimura C., Tockner K., Omura T., Moog O. (2006) Limnolo-
gy, 7, 63-74.
[28] Zilli F.L., Montalto L., Marchese M.R. (2008) Limnologica, 38,
159-171.
[29] Rezanka K.M., Hershey I.E. (2003) Journal of the North Ameri-
can Ethnological Society, 22, 371-387.
[30] Lamouroux N., Dolédec S., Gayraud S. (2004) Benthological
Society, 23, 449-466.
[31] Brainwood M., Burgin S. (2006) Environmental Monitoring and
Assessment, 119, 459-480.
[32] Hill M.O. (1973) Ecology, 54, 427-432.
[33] Boyd. E., Lickroppler F. (1979) Water Quality Management in pond fish culture, Auburns University Research and DEPT Se-
ries No 22 project AID/ASANG 0039, 30.
[34] Hillali A.M.H., Desouqi L.A., Wassila M., Daffalla A.A., Fenwick
A. (1985) J. Trop. Med. Hyg., 88, 75-81.
[35] Klumpp R.K., Chu K.Y. (1980) Bull. WHO, 58, 791-798.
[36] Dazo B.C., Hairston N.G., Dawood I.K. (1966) Bull. WHO, 35,
339-356.
[37] Dickens C.W.S., Graham P.M. (2002) Rapid Ecological Indica-
tors, 8, 599-613.
[38] Hutchinson G.E. (1981) Bio Science, 31, 495-500.
[39] Schmidt-Kloiber A., Nijboer R.C. (2004) Hydrobiologia, 516, 269
-283.
[40] Stals R. & De Moor I.J. (2007) Guides to the Freshwater Inver-tebrates of Southern Africa, Coleoptera, Water Research Com-
mission, Pretoria.
[41] Statzner B., Bonada N., Dolédec S. (2007) Biodiversity and
Conservation, 16, 3609-3632.
International Journal of Zoology Research ISSN : 2231-3516 & E-ISSN : 2231-3524, Volume 4, Issue 1, 2014
Odo G.E., Avoaja D.A., Dibua U.E.M., Ejere V.C., Agwu E.J., Ngwu G., Agaoru C.G., Nnamonu E.I. and Haruna A.S.
Related Documents