THE UNIVERSITY OF ZAMBIA SCHOOL OF HUMANITIES AND SOCIAL SCIENCES DEPARTMENT OF POPULATION STUDIES DEM 4110 (Advanced Techniques of Demographic Analysis and Data Evaluation) SOUTHERN PROVINCE DEMOGRAPHIC PROJECTIONS REPORT, 2011-2035 GROUP 5 NAME COMPUTER NO. 1. Daisy Kabwe 11019531 2. Marylene Kaunda 11018941 3. Anna Chikopela 11019441 4. Davies Bwalya 11080906 5. Chilufya Mwelwa 11069341 6. Trevor Machila 11089148 Lecturer: MR. M. PHIRI © 15 st June, 2015

Southern province demographic and population projections 2011 2035
Apr 12, 2017
Welcome message from author
This document is posted to help you gain knowledge. Please leave a comment to let me know what you think about it! Share it to your friends and learn new things together.
Transcript
THE UNIVERSITY OF ZAMBIA SCHOOL OF HUMANITIES AND SOCIAL SCIENCES
DEPARTMENT OF POPULATION STUDIES
DEM 4110
(Advanced Techniques of Demographic Analysis and Data Evaluation)
SOUTHERN PROVINCE DEMOGRAPHIC PROJECTIONS REPORT, 2011-2035
GROUP 5
NAME COMPUTER NO. 1. Daisy Kabwe 11019531 2. Marylene Kaunda 11018941 3. Anna Chikopela 11019441 4. Davies Bwalya 11080906 5. Chilufya Mwelwa 11069341 6. Trevor Machila 11089148
Lecturer:
MR. M. PHIRI
© 15st June, 2015

ii
TABLE OF CONTENT
List Of Tables ............................................................................................................................................. iii
List Of Figures ............................................................................................................................................ iv
Acronyms ..................................................................................................................................................... v
1.0 Background ........................................................................................................................................... 1
2.0 Projection Objectives And Scope ......................................................................................................... 2
2.1 Objectives ........................................................................................................................................... 2
2.2 Scope .................................................................................................................................................. 2
3.0 Methodology .......................................................................................................................................... 3
3.1 Data Source ....................................................................................................................................... 3
3.2 Description Of Software ................................................................................................................... 3
3.3 Base Population ................................................................................................................................. 4
3.3.1. Determination Of The Extent Of Error ...................................................................................... 4
3.3.1. Data Smoothing .......................................................................................................................... 4
3.3.2 Moving Population To Mid-Year Population. ............................................................................ 5
3.4 Assumptions ...................................................................................................................................... 5
3.4.1 Fertility Assumptions .................................................................................................................. 6
3.4.2 Mortality Assumptions ................................................................................................................ 6
3.4.3 Migration Assumptions ............................................................................................................... 7
3.4.4 Other Assumptions ...................................................................................................................... 8
4.0 Projection Results ................................................................................................................................. 8
4.1 Population Projection, 2011-2035 ........................................................................................................... 8
4.2 Fertility Projections, 2011-2035 ........................................................................................................... 16
4.3 Mortality Projections, 2011-2035. ........................................................................................................ 17
5.0 Conclusion And Recommendations ................................................................................................... 19
5.1 Conclusion ............................................................................................................................................ 19
5.1 Recommendations ................................................................................................................................. 19
Bibliography ............................................................................................................................................. xxi
Appendices ............................................................................................................................................... xxii
Appendix A: Population, by Age and Sex, and United Nations Age-Sex Accuracy Index, .................... xxii
Appendix B: Reported and Smoothed Population by Age and Sex ......................................................... xxiii
Appendix C: Interpolation and Extrapolation of TFR Using a Logistic Function. .................................. xxiv
Appendix D: Interpolation and Extrapolation of Life Expectancies at Birth. ........................................... xxv

iii
List of Tables
Figure 1: Projected Population of Southern Province (medium variant), 2011-2035 ................................... 8
Figure 2 Projected annual number of births and deaths by selected Year of Projection (medium variant), Southern Province 2011-2035 ....................................................................................................................... 9
Figure 3 Projected CDR per 1000 and CBR ER 1000 by selected Year of Projection (medium variant), Southern Province 2011-2035 ..................................................................................................................... 10
Figure 4: Projected Growth rate of Southern Province by sex, 2011-2035 ................................................ 11
Figure 5: Projected percenage of population aged 0-14, 15-64 and 65+ in Southern Province, 2011-2035 .................................................................................................................................................................... 11
Figure 5: Projected dependency ratios in Southern Province, 2011-2035 .................................................. 12
Figure 6: Projected Population by age ( 5-Year Age Groups) and Age-Sex Structure of Southern Province (medium variant), 2015. .............................................................................................................................. 13
Figure 7: Projected Population by age ( 5-Year Age Groups) and Age-Sex Structure of Southern Province (medium variant), 2025. .............................................................................................................................. 14
Figure 8: Projected Population by age ( 5-Year Age Groups) and Age-Sex Structure of Southern Province (medium variant), 2035. .............................................................................................................................. 15
Figure 9: Projected percentage of females aged 15-49 in Southern Province, 2011-2035 ......................... 16
Figure 10: Projected Total Fertility Rates (TFR) for Southern Province and Year of Projection (Medium Variant), 2011-2035 .................................................................................................................................... 16
Figure 11: Projected Infant Mortality Rate (IMR) per 1000 (medium variant), 2011-2015 ....................... 18
Figure 12: Projected Under-Five Mortality Rate (U5MRS) per 1000, 2011-2015 ..................................... 18

iv
List of Figures Table 1: Base Population of Southern Province, 2010. ................................................................................ 5
Table 2: Projected Population of Southern Province by sex (medium variant), 2011-2035. ........................ 9
Table 3: GRR, NRR, Mean Age of Childbearing and Child-Woman Ratio Projected for Southern Province and Year of Projection (Medium Variant), 2011-2035 ................................................................ 17
Table 4: Projected Life Expectancy at Birth, (medium variant), 2011-2035 .............................................. 17

v
ACRONYMS TFR : Total Fertility Rate
CBR : Crude Birth Rate
CDR : Crude Death Rate
ASFR : Age Specific Fertility Rate
SR : Sex Ratio
LEB : Life Expectancy at Birth
MX : Age Specific Fertility Rate
U5MR : Under-Five Mortality rate
IMR : Infant Mortality Rate
NRR : Net Reproductive Rate
GRR : Gross Reproductive Rate

1
1.0 BACKGROUND
Southern Province is one of Zambia's ten provinces, located in the deep southern region of Zambia. The Zambezi River is the province's southern border, and Lake Kariba, formed by the Kariba Dam, lies along the province's south-eastern edge. The eastern border is the Kariba Gorge and Zambezi, and the north-east border is the Kafue River and its gorge, dividing it from Lusaka Province (ZAD, 2013). The provincial capital is Choma. Until 2011 the provincial capital was Livingstone City. The other administrative districts include: Gwembe, Itezhi-tezhi, Kalomo, Khazungula, Livingstone, Mazabuka, Monze, Namwala, Siavonga and Sinazongwe districts.
Southern province home to 1,589,926 people as of 2010 census. The population has increased from 965,591 people in 1990 to 1,212,124 as of 2000.This represents a population growth rate of 3% from 2000 to 2010, and 6.5% from 1990 to 2010 (CPH, 2011). The average life expectancy at birth has maintained a range of 52, 53, 54 and 55 years respectively for the years 1980, 1990, 2000 and 2010. The Batonga are the largest ethnic group in the province headed by chief Monze in monze District, chief Chikanta in Kalomo, and Chief Siachitema in Kalomo. The other ethnic tribe is Toka Leya headed by chief Mukuni and chief Musokotwane in Livingstone and Kalomo respectively.
Southern province hosts the country’s most treasured tourist attractions like the county’s premier tourist attraction, Mosi-oa-Tunya (Victoria Falls), shared with Zimbabwe. In the north-west lies part of the famous Kafue National Park, the largest in Zambia, and the lake formed by the Itezhi-Tezhi Dam (MLGH, 2014).
Apart from tourism, the province also enhances farming as an economic activity due to the Southern Plateau, the large area of commercial farmland and a good transport network. In addition to maize, other commercial farming activities include sugar cane plantations and cattle ranching. Southern Province also has the only large source of fossil fuel in Zambia, the Maamba coal mine in the Zambezi valley (ZAD, 2013).
The province has been undergoing rapid urbanization and population growth since the 1900 and there is need for strategic and informed planning in as far as the education, health and other social aspects are concerned, and hence population projection is necessary for the province (MLGH, 2014).
Population projections of southern province will give better position to assess the need for new jobs, teachers, schools, doctors, nurses, housing, and requirements for resources. Population projections are also important for raising awareness of issues among policymakers. They also provide an important tool for planning and policy formulation. The projections provided in this report will form input into national and local planning during the current inter-censal period and beyond.

2
2.0 PROJECTION OBJECTIVES AND SCOPE
2.1 Objectives
1. To project future pattern and trends of the population from 2010 through to 2035 in
southern province.
2. To project future pattern and trends of the annual growth rate from 2010 through to 2035
in southern province.
3. To project future pattern and trends of fertility from 2010 through to 2035 in southern
province.
4. To project future pattern and trends of the mortality from 2010 through to 2035 in southern
province.
5. To project future pattern and trends of the vital events from 2010 through to 2035 in
southern province.
2.2 Scope
The projections are made for the period 2010 to 2035 in southern province Zambia. Because
Southern province has shown some decline in TFR from about seven children per woman (ZDHS,
2007), to about six children per women (Census Report, 2010) but above a TFR of 2.1; Projections
are based on the medium variant assumption as similar trends and patterns will be expected until
2035. Life expectancy is also assumed to be increasing moderately except when affected by
HIV/AIDS.
The projections were made using the cohort component approach. The strength of the cohort
component approach is that it reflects the actual process of demographic change and a variety of
demographic indicators (such as infant mortality, life expectancy at birth, fertility rates, and
percent above or below particular ages) are readily available from the output of such models,
(CSO, 2013).

3
3.0 METHODOLOGY
3.1 Data Source
Projections were based on the 2010 Zambian census of population and housing, conducted
between 16th October and 15th November 2010. Complete enumeration in all parts of the country
was achieved by 30th November 2010. The 2010 Census of Population and Housing marked the
fifth national population census that Zambia has successfully conducted since independence in
1964. Previous censuses were conducted in 1969, 1980, 1990 and 2000.
The main objective of the census was to provide accurate and reliable information on the size,
composition and distribution of the population of Zambia at the time of the census. Further, it also
provided information on the demographic and socio-economic characteristics of the population of
Zambia at provincial level, demographic characteristics including TFR, Mortality fertility,
mortality and migration.
3.2 Description of Software
All projections were made using the SPECTRUM model. DemProj (the main projections software
in SEPCTRUM) calculations are based on the standard cohort component projection modified to
produce projection for each year from 2010 to 20135. This is excluding urban/rural projections
and the scaling is in units. The input data to the demographic projection with the use of a model
life table are:
5P(a, s) Population by five year age groups (a) and sex (s) in the base year
TFR(t) Total fertility rate by year obtained by the PASEX spread sheet TFRLGST
using three data points from past censuses and data from current census. It
requires upper and lower asymptotes
Migration(a, s, t) Net in-migrants by age, sex and time
ASFR(s, t) Distribution of fertility by age by year
SR(t) Sex ratio at birth by year obtained when calculating for base population
LEB(s, t) Life expectancy at birth with AIDS by sex and year obtained by the
PASEX spread sheet E0LGST using two census data points (past and
current). It also requires upper and lower asymptotes, SR(t)
MX(s, t) Age specific Mortality rates by sex and year

4
The outputs of the demographic projection are
Fertility indicators TFR, NRR, GRR, Mean age of children and child-woman Ratio
Mortality indicators IMR, Life expectancy, MX , under-five mortality rate, Deaths by age
Population indicators Total Population, population aged 0-4, 5–14, 15– 24, 15–49, 15–64, 64+ and Immigration.
Ratios Sex ratios and Dependency ratio. Vital Events CBR,CDR,RNI, Births, Deaths (by age), Doubling
Time and Annual Growth rate
3.3 Base population
3.3.1. Determination of the Extent of Error
The UN-Joint score was used to determine extent of census errors. The Joint Score Index (JS) is
defined as;
)
Where SRS is the Sex-Ratio Score, ARSM and ARSF are age-ratio scores for males and
females, respectively
Based on empirical analysis, if the UNJS is less than 20, the population structure is considered
accurate; if the UNJS is between 20 and 40, the population structure is considered inaccurate; for
any JS score greater than 40, the population structure is considered highly inaccurate, (Siegel and
Swanson, 2004).
An AGESEX PASEX spreadsheet, adopted from U.S. Bureau of the Census, was used to compute
the Joint-score or age-sex accuracy index (see appendix A). This spreadsheet computes age ratios,
sex ratios by age, and the United Nations age-ratio score, sex-ratio score and age-sex accuracy
indexes. The analysis revealed a UN-JS of 24.1. This implies that the data was inaccurate.
3.3.1. Data Smoothing
An AGESMTH PASEX spreadsheet, developed by the U.S. Census Bureau (1994), was used to
smooth the 5-year totals of the population. This spreadsheet smooths the age distribution of a
population using five different smoothing methods. The smoothing methods are: Carrier-Farrag,

5
Karup-King Newton, Ariaga, United Nations, and a strong moving average. In order to smooth
the data (correct for errors), United Nations method was used (see appendix B).
3.3.2 Moving population to Mid-Year population.
Census data was collected as at 16th October, 2010 (2010.79), therefore, it was moved to mid-year
(that is, 30th June or 1st July or 2010.50). A MOVPOP PASEX spreadsheet was use to estimate the
base population by sex and age at mid-year based on the reported population at a specified date,
age-specific central death rates (MX) by sex, ASFR, and the annual net number of migrants. Annual
net number of migrants is assumed to be zero due to unavailability of reliable data. Table 1 shows
the base population use for the projection.
Table 1: Base Population for Projections.
Age Both sexes Male Female Sex ratio All ages 1,575,231 772,458 802,773 0.9622 0-4 288,520 143,711 144,809 0.9924 5-9 242,215 120,718 121,497 0.9936 10-14 216,834 108,072 108,762 0.9937 15-19 186,367 91,983 94,384 0.9746 20-24 148,210 70,671 77,539 0.9114 25-29 118,999 55,969 63,030 0.8880 30-34 97,542 47,865 49,677 0.9635 35-39 75,040 38,138 36,902 1.0335 40-44 54,287 27,314 26,973 1.0126 45-49 40,712 19,743 20,969 0.9415 50-54 30,161 14,343 15,818 0.9068 55-59 20,738 9,741 10,997 0.8858 60-64 16,265 7,191 9,074 0.7925 65-69 13,601 5,689 7,912 0.7190 70-74 10,521 4,393 6,128 0.7169 75-79 7,231 3,356 3,875 0.8661 80+ 7,988 3,561 4,427 0.8044
3.4 Assumptions
Prior to the projections were, a few assumptions taken into account. These assumptions are based on
local conditions in southern province taking into account the United Nations assumptions for making
future population.

6
3.4.1 Fertility Assumptions
Southern Province has experienced a steady decline in fertility. Evidence of this is taken from
estimates obtained in the Census of Population and Housing reports. Total Fertility Rate declined
from 7.0 births per woman in 1990 to 6.1 births per woman in the year 2010 with 6.3 births per
woman in the year 2000. The fertility rate is assumed to be moderately reducing and hence the
projection adopts a medium projection variant with further moderate reduction in the TFR. TFR
was projected based on adjusted fertility estimates from the 1980, 1990, 2000, and 2010 censuses
(see Appendix C).
A number of factors have contributed to this decline in fertility. Levels of family planning
knowledge and use have increased significantly. There have also been efforts to increase education
levels, as it is widely recognized that improving access to education for girls has many positive
benefits for development, including reducing fertility.
The success of family planning programs in Southern Province shows the potential impact of
research that is well-designed and implemented. The 1995 Contraceptive Needs Assessment and
the 1996 DHS both emphasized needs such as enhancing contraceptive choices, improving the
clinical and counseling skills of providers, strengthening the contraceptive logistics system and
addressing misperceptions and biases in the community and among providers. These studies then
led to appropriate interventions to address the identified needs. The interventions were guided by
a focus on scaling up successful pilot projects, and involved stakeholders and communities in a
variety of innovative ways.
Following up on the Contraceptive Needs Assessment and the DHS, projects in Southern Province
expanded contraceptive choice through training, provision of equipment and supplies, and
community involvement and outreach. This resulted in increased uptake of all methods and scaling
up of pilot projects; for this reason, the range of methods encouraged women to come forward
because they had a wide range to choose from.
3.4.2 Mortality Assumptions
Trends for the province show a significant drop in both child and under-five mortality. For
example, in the year 2000, child mortality was 65 deaths per 1000 live births. This dropped to 40
deaths per 1000 live births in 2010. The incidence of under-five mortality has reduced by 61 from

7
155 deaths per 1000 live births in 2000 to 94 deaths per 1000 live births in 2010. The drop may be
attributed to an increase in health facilities in the province, increased uptake of family planning
and increased number of births delivered within hospital settings. However, inequalities with
regard to access to health care services still exist in rural communities.
On the other hand, the province’s maternal mortality ratio stands high at 34,320 deaths per 100,000
live births. One of the major causes is the high incidence of unsupervised deliveries. According to
the Ministry of Health 2010 annual statistical bulletin, 47% of all deliveries were unsupervised,
while traditional birth attendants attended to 14% deliveries and institutional deliveries accounted
for 39% of total deliveries in the province. As of 2010, the province had a total of 109 doctors, 234
clinical officers and 1,123 nurses supported by 524 midwives. The health worker ratio in the
province also remains low at 129 health workers per 100,000 deliveries.
Antenatal coverage dropped slightly from 91 in 2008 to 83 in 2010. The slight reduction may be
attributed to uneven coverage of sensitization programmes, limited knowledge among pregnant
women, and decrease in outreach and Prevention of Mother-to-Child Transmission (PMTCT)
Programmes. Antenatal visits have remained relatively low but stable from the period 2008 to
2012. Thus, the interaction of decreasing child mortality and constant maternal mortality has led
to moderate life expectancies at birth for the province. The moderate increasing life expectancy,
except when affected by HIV/AIDS, is an assumption critical in making projections on Southern
province since the province has an HIV prevalence greater than one per cent.
Based on these characteristics, the province has adopted and will maintain a Coale & Demney
North Model which is characterized by low infant mortality rate and high mortality rates in ages
45-80. Life expectancy at Birth (LEB) was projected based on adjusted LEB estimates from the
1980, 1990, 2000, and 2010 censuses (see Appendix D).
3.4.3 Migration Assumptions
Southern province’s internal migration data is very difficult to derive due to poor data collection.
Current data on internal migration is not usable and the collection of this data is very unreliable.
Migration is thus assumed to be zero migration.

8
3.4.4 Other Assumptions
The base population is assumed to be a mid-year estimate of the population of southern province
and that the rates (TFR, life expectancy and migration) are calendar year averages. The sex ratio
(102.5 Males per 100 Females) is assumed to be constant until 2035 with the ASFR estimated
using the UN Sub-Saharan model.
4.0 PROJECTION RESULTS
4.1 Population Projection, 2011-2035
Figure 1: Projected Population of Southern Province (medium variant), 2011-2035
Figure 1 shows the total population change of southern province during the projection years 2011-
2035. The province’s total population is expected to grow from 1.7 million in 2011 to 2.3 million
in 2020 and to 3.6 million in 2035. The population is therefore expected to almost double during
the 25-year projection period. Table XX below shows population change in total population by
sex during the years 2011-2035.
1,660,9351,906,199
2,253,150
2,640,333
3,072,033
3,574,638
0
500,000
1,000,000
1,500,000
2,000,000
2,500,000
3,000,000
3,500,000
4,000,000
2011 2015 2020 2025 2030 2035
Pop
ula
tion
siz
e
Year

9
Table 2: Projected Population of Southern Province by sex (medium variant), 2011-2035.
2011 2015 2020 2025 2030 2035
Total 1,660,935 1,906,199 2,253,150 2,640,333 3,072,033 3,574,638
Male 815,071 935,303 1,104,154 1,290,624 1,496,255 1,733,526
Female 845,864 970,896 1,148,997 1,349,709 1,575,778 1,841,112
Percent Male 49.1% 49.1% 49.0% 48.9% 48.7% 48.5%
Percent Female 50.9% 50.9% 51.0% 51.1% 51.3% 51.5%
Table 2 shows that Southern Province’s population is projected to reach 3.6 million by 2035 and
about 1.8 million of this figure are female. In addition, table xx further suggests that females will
outnumber males by close to about 3 percentage points (49 and 52 per cent, respectively).
Figure 2 Projected annual number of births and deaths by selected Year of Projection (medium variant), Southern Province 2011-2035
Figure 2 presents the annual number of births and deaths for selected projection years from 2011
to 2035. By 2035, births in Southern Province are expected to increase to approximately 146,986
77,932
88,149
99,845
111,759
127,481
146,986
20,910
23,468
26,905
30,548
34,792
40,228
0 50,000 100,000 150,000 200,000
2011
2015
2020
2025
2030
2035
Number of Births, Deaths
Yea
r
DEATHS BIRTHS

10
births from 77,932 births in 2011 while deaths are projected to increase to 40,288 in 2035 from
the estimated 20,910 deaths in 2011.
Figure 3 Projected CDR per 1000 and CBR ER 1000 by selected Year of Projection (medium variant), Southern Province 2011-2035.
Figure 3 shows the projected CDR and CBR of southern province between 2011 and 2035. The
CBR expected to gradually reduce from about 47 per 1000 in 2011 to 44 per 1000 in 2020 to 42
per 1000 in 2035.
The figure further shows that the CDR is estimated to reduce by about 1 per 1000 between the
projection period 2011 and 2035, (13 deaths per 1000 population in 2011 to 12 deaths per 1000
population in 2035).
46.9 46.344.4
42.5 41.8 41.6
12.8 12.5 12.2 11.9 11.8 11.8
0
5
10
15
20
25
30
35
40
45
50
2011 2015 2020 2025 2030 2035
Per
cen
tage
Year
CBR per 1000 CDR per 1000

11
Figure 4: Projected Growth rate of Southern Province by sex, 2011-2035
In terms of growth rates for the period 2011 to 2015, the population growth rate is expected to
reduce from about 3.4 in 2011 to just below 3.0 per cent in 2035. Generally the growth rate
oscillates around 3 percent per annum during the entire period.
Figure 5: Projected percenage of population aged 0-14, 15-64 and 65+ in Southern Province, 2011-2035
3.413.38
3.22
3.063.00 2.98
2.70
2.80
2.90
3.00
3.10
3.20
3.30
3.40
3.50
2011 2015 2020 2025 2030 2035
Per
cen
t G
row
th r
ate
(p
er a
nn
um
)
Year
2.4 2.0 1.8 1.9 2.0 2.2
48.2 47.6 47.6 47.3 45.9 45.0
49.5 50.3 50.6 50.9 52.1 52.8
0.0
10.0
20.0
30.0
40.0
50.0
60.0
2011 2015 2020 2025 2030 2035
Per
cen
t
Year
65+ 0-14 15-64

12
Figure 5 shows the percentage of population aged 15-64 years. The figures shows that the
percentage of population aged 15-64 will increase from 50 percent in 2011 to 51 percent in 2020
and 51 percent in 2025 to 53 percent in 2035.
The figure further shows that population aged 15 and below will decline by the year 2035. It is
expected that this population will reduce from 48 percent in 2011 to 45 percent in 2035. This is
attributed to the estimated reduction in TFR between the two periods.
Furthermore, the aged population is also expected to reduce from 2.4 percent in 2011 to 1.8 percent
in 2020. However the percentage of the aged population will increase to 2.2 percent. Generally,
the aged population is expected to reduce between the year 2011 and 2035.
Figure 5: Projected dependency ratios in Southern Province, 2011-2035
Figure 5 shows that dependency ratio will reduce by the year 2035. Dependency Ratio is the
number of children below 15 years and elderly persons aged 65 and older years per 100 persons
aged between 15 and 64 years. This is due to the reduction of the percentage of population aged
0-4 year and the population aged 5-15 years from 19.80 and 28.39, respectively, to 17.63 and 27.4,
respectively in 2035. The figure further shows that the percentage of population aged 65 and above
reduced from 2.4 percent in 2011 to 2.2 percent by 2035.
96.36 96.3396.1
95.62
94.95
94.16
93
93.5
94
94.5
95
95.5
96
96.5
97
2011 2015 2020 2025 2030 2035
PER
CEN
T
YEAR

13
Figure 6: Projected Population by age ( 5-Year Age Groups) and Age-Sex Structure of Southern Province (medium variant), 2015.
Population in 5-year Age Groups, 2015 Age-Sex Structure 2015
Age Both Sexes Male Female
0 - 4 389,249 194,140 195,109
5 - 9 280,991 139,089 141,902
10 - 14 237,583 118,245 119,337
15 - 19 213,264 106,126 107,139
20 - 24 182,265 89,678 92,587
25 - 29 144,325 68,490 75,835
30 - 34 115,598 54,129 61,469
35 - 39 94,463 46,162 48,301
40 - 44 72,298 36,576 35,723
45 - 49 51,947 25,971 25,976
50 - 54 38,545 18,516 20,029
55 - 59 27,992 13,180 14,812
60 - 64 18,803 8,673 10,130
65 - 69 13,989 6,061 7,928
70 - 74 10,776 4,386 6,389
75 - 79 7,258 2,914 4,344
80+ 6,854 2,967 3,887
All ages 1,906,200 935,303 970,897
250 200 150 100 50 0 50 100 150 200 250
0 - 4
5 - 9
10 - 14
15 - 19
20 - 24
25 - 29
30 - 34
35 - 39
40 - 44
45 - 49
50 - 54
55 - 59
60 - 64
65 - 69
70 - 74
75 - 79
80+
Thousands
Female Male

14
Figure 7: Projected Population by age ( 5-Year Age Groups) and Age-Sex Structure of Southern Province (medium variant), 2025.
Population in 5-year Age Groups, 2025 Age-Sex Structure 2025
Age Both Sexes Male Female 0 - 4 481,552 238,650 242,901
5 - 9 403,693 198,678 205,015
10 - 14 362,227 178,641 183,586
15 - 19 271,118 133,544 137,574
20 - 24 228,350 113,046 115,304
25 - 29 201,972 99,824 102,148
30 - 34 170,938 83,367 87,571
35 - 39 134,600 63,129 71,471
40 - 44 107,133 49,458 57,674
45 - 49 86,667 41,673 44,994
50 - 54 65,222 32,356 32,866
55 - 59 45,439 22,241 23,198
60 - 64 32,448 15,062 17,386
65 - 69 21,911 9,856 12,055
70 - 74 12,898 5,637 7,261
75 - 79 7,720 3,100 4,620
80+ 6,444 2,361 4,082
All ages 2,640,332 1,290,623 1,349,706
300 200 100 0 100 200 300
0 - 4
5 - 9
10 - 14
15 - 19
20 - 24
25 - 29
30 - 34
35 - 39
40 - 44
45 - 49
50 - 54
55 - 59
60 - 64
65 - 69
70 - 74
75 - 79
80+
Thousands
Female Male

15
Figure 8: Projected Population by age ( 5-Year Age Groups) and Age-Sex Structure of Southern Province (medium variant), 2035.
Population in 5-year Age Groups, 2025 Age-Sex Structure 2025
Age Both Sexes Male Female
0 - 4 630,276 310,590 319,685
5 - 9 524,857 255,907 268,950
10 - 14 455,127 221,942 233,184
15 - 19 389,708 190,375 199,333
20 - 24 332,164 162,523 169,640
25 - 29 256,443 125,104 131,339
30 - 34 213,891 104,829 109,061
35 - 39 187,555 91,641 95,913
40 - 44 157,443 75,616 81,827
45 - 49 122,743 56,307 66,436
50 - 54 96,294 43,197 53,097
55 - 59 75,747 35,349 40,398
60 - 64 54,733 26,144 28,589
65 - 69 35,611 16,531 19,080
70 - 74 22,373 9,725 12,648
75 - 79 12,244 5,029 7,216
80+ 7,429 2,716 4,713
All ages 3,574,638 1,733,525 1,841,109
The population age structure is depicted in Figures 6-8 for 2015, 2025 and 2035. The age-sex structure remains relatively the same.
However there is a 3 percentage point decline in the proportion of the population aged 0-4 during the period between 2011 and 2035
(48 percent and 45 percent, respectively). This is due to the of mortality and fertility effects that prevailed during the projection period
400,000 300,000 200,000 100,000 0 100,000 200,000 300,000 400,000
0 - 4
5 - 9
10 - 14
15 - 19
20 - 24
25 - 29
30 - 34
35 - 39
40 - 44
45 - 49
50 - 54
55 - 59
60 - 64
65 - 69
70 - 74
75 - 79
80+
Female Male

16
4.2 Fertility Projections, 2011-2035
Figure 9: Projected percentage of females aged 15-49 in Southern Province, 2011-2035
Figure 9 shows the percentage of women of reproduction age in southern province during the
projection years 2011-2035. The country’s total population is expected to grow from 45 percent in
2011 to 46 percent in 2035. The population of females in the childbearing age is expected to
increase.
Figure 10: Projected Total Fertility Rates (TFR) for Southern Province and Year of Projection (Medium Variant), 2011-2035
45.22
45.8645.72
45.48
46.11
46.44
44.6
44.8
45
45.2
45.4
45.6
45.8
46
46.2
46.4
46.6
2011 2015 2020 2025 2030 2035
PER
CEN
T
YEAR
6.02
5.88
5.73
5.605.49
5.39
5.05.15.25.35.45.55.65.75.85.96.06.1
2011 2015 2020 2025 2030 2035Ave
rage
nu
mb
er o
f ch
ild
ren
per
w
oman
Year of Projection
TFR

17
Figure 10 presents projected total fertility rates (TFR) for the projected period. By 2035, southern
province is expected to have a TFR of at least five children per woman. The Total Fertility Rate
(TFR) is expected to drop by almost one child per woman (0.63) over the next 25 years, from 6.02
in 2011 to 5.39 by 2035. Between 1980 and 2010, the TFR for southern province declined also by
only one child per woman from a TFR of 7.1 in 1980 to a TFR of 6.1 in 2010.
Table 3: GRR, NRR, Mean Age of Childbearing and Child-Woman Ratio Projected for Southern Province and Year of Projection (Medium Variant), 2011-2035
2011 2015 2020 2025 2030 2035GRR 2.97 2.91 2.83 2.77 2.71 2.66NRR 2.39 2.32 2.28 2.25 2.22 2.20
Mean age of childbearing 27.90 27.90 27.90 27.90 27.90 27.90Child-woman ratio 0.86 0.87 0.81 0.78 0.76 0.74
Table 3 shows other factors of fertility that have been projected in this project which include the
GRR, NRR, Mean Age of Childbearing and the Child-Woman Ratio. There is a slight gradual
decline of 0.31 from 2.97 in 2011 to 2.66 in 2035. When women are subjected to given age-specific
mortality rates too (calculates the NRR), it slightly lowers to a 0.19 decline from 2.39 in 2011 to
2.20 in 2035. The child-woman ratio on the other hand shows 74 women will be expected to have
at least one child in 2035 compared to the 86 women having a child in 2011 per 100 women whilst
the Mean Age of Childbearing is 27.90 from 2010 to 2035.
4.3 Mortality Projections, 2011-2035.
Table 4: Projected Life Expectancy at Birth, (medium variant), 2011-2035 Year 2011 2015 2020 2025 2030 2035
Male life expectancy 51.4 51.4 50.7 50.2 50 49.6
Female life expectancy 56.4 57.2 57.5 58.1 58.8 59.4
Total life expectancy 53.9 54.3 54.1 54.2 54.5 54.6 Table 4 presents the projected life expectancy at birth for southern province. The overall life
expectancy is expected to increase by 0.7 during the period 2011 to 2035.This is an average of the
male and female expected change in life expectancy, that is, a decrease of 1.8 for males and an

18
increase of 3 years for females. The highest in total life expectancy is expected to be between
2011 and 2015 represented by a 0.7% increase.
Figure 11: Projected Infant Mortality Rate (IMR) per 1000 (medium variant), 2011-2015
The figure above shows the estimated infant mortality rates for the province. There is a substantial
expected decrease in infant mortality of 15.5% during the period 2011 to 2035, from 97.7 infant
deaths per 1000 live births to 82.7 infant deaths per 1000 live births. The highest decline is between
2011 and 2015 with 10.6% decline, followed by the period 2020 to 2025 with 2% decline.
Figure 12: Projected Under-Five Mortality Rate (U5MRS) per 1000, 2011-2015
97.7
87.386.3
84.6 83.982.7
75
80
85
90
95
100
2011 2015 2020 2025 2030 2035
IMR
per
100
0
Year
155.5
140.9139
136.1134.6
132.5
120
125
130
135
140
145
150
155
160
2011 2015 2020 2025 2030 2035
U5M
R p
er 1
000
Year
19
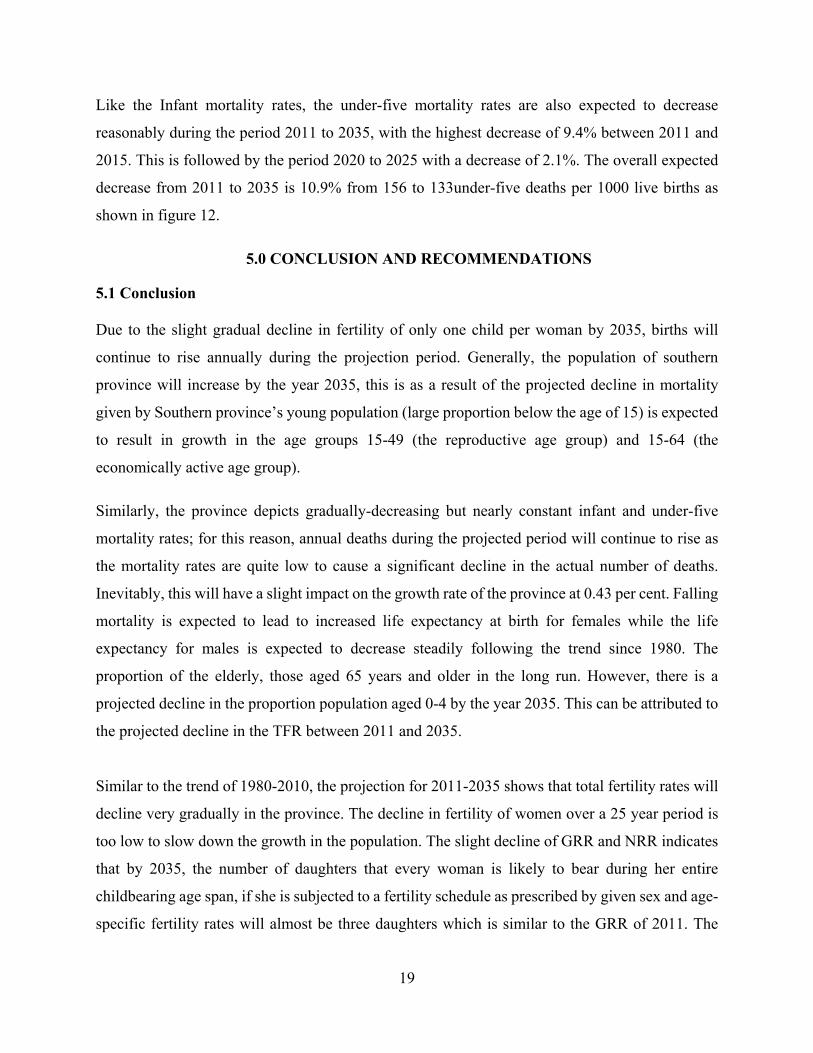
Like the Infant mortality rates, the under-five mortality rates are also expected to decrease
reasonably during the period 2011 to 2035, with the highest decrease of 9.4% between 2011 and
2015. This is followed by the period 2020 to 2025 with a decrease of 2.1%. The overall expected
decrease from 2011 to 2035 is 10.9% from 156 to 133under-five deaths per 1000 live births as
shown in figure 12.
5.0 CONCLUSION AND RECOMMENDATIONS
5.1 Conclusion Due to the slight gradual decline in fertility of only one child per woman by 2035, births will
continue to rise annually during the projection period. Generally, the population of southern
province will increase by the year 2035, this is as a result of the projected decline in mortality
given by Southern province’s young population (large proportion below the age of 15) is expected
to result in growth in the age groups 15-49 (the reproductive age group) and 15-64 (the
economically active age group).
Similarly, the province depicts gradually-decreasing but nearly constant infant and under-five
mortality rates; for this reason, annual deaths during the projected period will continue to rise as
the mortality rates are quite low to cause a significant decline in the actual number of deaths.
Inevitably, this will have a slight impact on the growth rate of the province at 0.43 per cent. Falling
mortality is expected to lead to increased life expectancy at birth for females while the life
expectancy for males is expected to decrease steadily following the trend since 1980. The
proportion of the elderly, those aged 65 years and older in the long run. However, there is a
projected decline in the proportion population aged 0-4 by the year 2035. This can be attributed to
the projected decline in the TFR between 2011 and 2035.
Similar to the trend of 1980-2010, the projection for 2011-2035 shows that total fertility rates will
decline very gradually in the province. The decline in fertility of women over a 25 year period is
too low to slow down the growth in the population. The slight decline of GRR and NRR indicates
that by 2035, the number of daughters that every woman is likely to bear during her entire
childbearing age span, if she is subjected to a fertility schedule as prescribed by given sex and age-
specific fertility rates will almost be three daughters which is similar to the GRR of 2011. The

20
child-woman ratio means that the number of women having a child will decrease by 12. However,
the average age of mothers at the birth of their children, if women are subjected throughout their
lives to the age-specific fertility rates observed in a projected year, remains constant at 28 years.
This trend can be attributed to the programs and policies that have been implemented in the
province with similar effective activities taking place in future.
5.2 Recommendations
Based on the projections between 2011 and 2035, the following recommendations were made;
1) The government through the Ministry of local government and housing to plan for housing
projects to carter for the increasing population.
2) The government through the southern province provincial administration to strive for job
creation and other employment opportunities to absorb the growing economically active
population.
3) There is need for the retirement age policy to be in line with the population age structure.
4) Better implementation of programmes and policies in services provided for reproductive
health to help in the reduction of fertility.
5) There is need for improved health service delivery packages in the province by the
government through the Ministry of Health, owing to the projected declining male life
expectancy and the gradual increase in female life expectancy.
6) There is need to intensify the current pre-natal and post-natal health service delivery so
speed up the gradual decline in Infant Mortality Rate and Under-five Mortality rates.

xxi
BIBLIOGRAPHY
Central Statistical Office (2011) 2010 Census of Population and Housing. CSO: Lusaka.
Ministry of Local Government and Housing (2014): Southern Province. Available at
http://www.SouthernProvinceMinistryofLocalGovernmentandHousing.htm Viewed on
5/06/15
Siegel, J., S. and Swanson D., A. (2004). The Methods and Materials of Demography. Elsevier
Academic Press: Lusaka.
UNDP (2013) Millennium Development Goals: southern province. UN House, Lusaka
Zambia Administrative Division (2013) http://www.citypopulation.de 5/06/15
Zambia Demographic and Health Survey, (2007). Final Report. CSO: Lusaka

xxii
APPENDICES
Appendix A: Population, by Age and Sex, and United Nations Age-Sex Accuracy Index, Southern Province 2010
Age
Population
Age ratio --------------
Age ratio deviation
Sex ratio (males per
100 females)
Sex ratiodifferenceMale Female Male Female Male Female
- - - - - - - - - All ages 779,659 810,267 96.2 0-4 144,914 146,021 99.2 5-9 121,728 122,514 95.8 95.6 -4.2 -4.4 99.4 0.1 10-14 109,086 110,306 100.7 100.9 0.7 0.9 98.9 -0.5 15-19 94,967 96,123 106.6 102.7 6.6 2.7 98.8 -0.1 20-24 69,112 76,838 91.1 95.7 -8.9 -4.3 89.9 -8.9 25-29 56,689 64,505 96.4 102.0 -3.6 2.0 87.9 -2.1 30-34 48,451 49,591 101.1 97.0 1.1 -3.0 97.7 9.8 35-39 39,185 37,711 104.4 99.2 4.4 -0.8 103.9 6.2 40-44 26,634 26,462 89.7 89.5 -10.3 -10.5 100.6 -3.3 45-49 20,185 21,447 97.7 99.9 -2.3 -0.1 94.1 -6.5 50-54 14,696 16,478 99.2 104.1 -0.8 4.1 89.2 -4.9 55-59 9,446 10,199 85.3 77.9 -14.7 -22.1 92.6 3.4 60-64 7,453 9,697 98.4 107.6 -1.6 7.6 76.9 -15.8 65-69 5,708 7,824 96.1 98.6 -3.9 -1.4 73.0 -3.9 70-74 4,430 6,180 #N/A #N/A 0.0 0.0 71.7 -1.3 75+ 6,975 8,371 #N/A #N/A #N/A #N/A 83.3 #N/A
Age ratio score for males 4.8 Age ratio score for females 4.9 Sex ratio score 4.8 Age-sex accuracy index 24.1 Sample size X Corrected for population (sample) size X X Not applicable. Source: Census of Population and housing 2010

xxiii
Appendix B: Reported and Smoothed Population by Age and Sex, Southern Province 2010
Reported UN Smoothed
Male Female
Total, 0-79 776068 805803
Total, 10-69 501612 527181 500875 526405
0-4 144914 146021
5-9 121728 122514
10-14 109086 110306 108976 109672
15-19 94967 96123 92752.8 95174.2
20-24 69112 76838 71262.9 78187.2
25-29 56689 64505 56436.9 63558.3
30-34 48451 49591 48266.3 50092.1
35-39 39185 37711 38457.3 37210.6
40-44 26634 26462 27542.1 27198.9
45-49 20185 21447 19908.7 21145
50-54 14696 16478 14462.3 15950.3
55-59 9446 10199 9822.69 11088.7
60-64 7453 9697 7251.25 9150.25
65-69 5708 7824 5736.38 7977.63
70-74 4430 6180
75-79 3384 3907
80+ 3591 4464

xxiv
Appendix c: Interpolation and Extrapolation of TFR Using a Logistic Function. - - - - - - - -
Item/ | |
Year Value | Year TFR | Year TFR
- - | - - | - -
Asymptotes: | 2010.50 6.05 | 2010.50 6.05
| 2011.50 6.02 | 2015.50 5.88
Lower 5.00 | 2012.50 5.98 | 2020.50 5.73
Upper 8.00 | 2013.50 5.95 | 2025.50 5.60
| 2014.50 5.92 | 2030.50 5.49
Initial TFR's | 2015.50 5.88 | 2035.50 5.39
| 2016.50 5.85 | 2040.50 5.31
1980.00 7.10 | 2017.50 5.82 | 2045.50 5.25
1990.00 7.00 | 2018.50 5.79 | 2050.50 5.19
2000.00 6.30 | 2019.50 5.76 | 2055.50 5.15
2010.00 6.10 | 2020.50 5.73 | 2060.50 5.12
| 2021.50 5.70 | 2065.50 5.09
| 2022.50 5.68 | 2070.50 5.07
| 2023.50 5.65 | 2075.50 5.06
| 2024.50 5.62 | 2080.50 5.04
| 2025.50 5.60 | 2085.50 5.03
| 2026.50 5.58 | 2090.50 5.03
| 2027.50 5.55 | 2095.50 5.02
| 2028.50 5.53 | 2100.50 5.02
| 2029.50 5.51 | 2105.50 5.01
| 2030.50 5.49 | 2110.50 5.01
| 2031.50 5.47 | 2115.50 5.01
| 2032.50 5.45 | 2120.50 5.01
| 2033.50 5.43 | 2125.50 5.00
- - | 2034.50 5.41 | 2130.50 5.00
| 2035.50 5.39 | 2135.50 5.00
| 2036.50 5.37 | 2140.50 5.00
| 2037.50 5.36 | 2145.50 5.00
Beginning date for | 2038.50 5.34 | 2150.50 5.00
results: 2010.50 | 2039.50 5.33 | 2155.50 5.00
- - - - - - - -
TFR - Total fertility rate.
Source:

xxv
Appendix D: Interpolation and Extrapolation of Life Expectancies at Birth, by Sex Using a Logistic Function.
| Annual life expectancy at birth | Life expectancy at birth every 5 years Item or | Both Female | Both FemaleYear Male Female | Year Male Female sexes - male | Year Male Female sexes - maleAsymptotes: | 2010.50 52.17 57.14 54.62 4.97 | 2010.50 52.17 57.14 54.62 4.97
| 2011.50 52.14 57.33 54.70 5.19 | 2015.50 52.03 58.10 55.03 6.07 Lower 25.00 25.00 | 2012.50 52.11 57.52 54.78 5.41 | 2020.50 51.89 59.06 55.43 7.17 Upper 82.56 88.40 | 2013.50 52.08 57.72 54.86 5.63 | 2025.50 51.75 60.01 55.83 8.26
| 2014.50 52.05 57.91 54.94 5.85 | 2030.50 51.61 60.96 56.23 9.35 Life expectancy at birth: | 2015.50 52.03 58.10 55.03 6.07 | 2035.50 51.47 61.90 56.62 10.43
| 2016.50 52.00 58.29 55.11 6.29 | 2040.50 51.33 62.83 57.01 11.50 1980.00 54.00 52.00 | 2017.50 51.97 58.48 55.19 6.51 | 2045.50 51.19 63.75 57.39 12.55 1990.00 51.10 52.70 | 2018.50 51.94 58.67 55.27 6.73 | 2050.50 51.05 64.65 57.77 13.60 2000.00 52.80 54.10 | 2019.50 51.92 58.87 55.35 6.95 | 2055.50 50.92 65.55 58.14 14.63 2010.00 52.50 57.90 | 2020.50 51.89 59.06 55.43 7.17 | 2060.50 50.78 66.43 58.51 15.65
| 2021.50 51.86 59.25 55.51 7.39 | 2065.50 50.64 67.29 58.86 16.65 | 2022.50 51.83 59.44 55.59 7.61 | 2070.50 50.50 68.13 59.21 17.63 | 2023.50 51.80 59.63 55.67 7.83 | 2075.50 50.36 68.96 59.55 18.60 | 2024.50 51.78 59.82 55.75 8.04 | 2080.50 50.23 69.77 59.88 19.54 | 2025.50 51.75 60.01 55.83 8.26 | 2085.50 50.09 70.56 60.20 20.47 | 2026.50 51.72 60.20 55.91 8.48 | 2090.50 49.95 71.32 60.51 21.37 | 2027.50 51.69 60.39 55.99 8.70 | 2095.50 49.81 72.07 60.80 22.25 | 2028.50 51.67 60.58 56.07 8.91 | 2100.50 49.68 72.79 61.09 23.12 | 2029.50 51.64 60.77 56.15 9.13 | 2105.50 49.54 73.50 61.37 23.96 | 2030.50 51.61 60.96 56.23 9.35 | 2110.50 49.40 74.18 61.64 24.77 | 2031.50 51.58 61.15 56.30 9.56 | 2115.50 49.27 74.83 61.89 25.57 | 2032.50 51.55 61.33 56.38 9.78 | 2120.50 49.13 75.47 62.14 26.34 | 2033.50 51.53 61.52 56.46 10.00 | 2125.50 48.99 76.08 62.37 27.09
- - - - | 2034.50 51.50 61.71 56.54 10.21 | 2130.50 48.86 76.67 62.59 27.81 Sex ratio | 2035.50 51.47 61.90 56.62 10.43 | 2135.50 48.72 77.24 62.81 28.52 at birth: 1.03 | 2036.50 51.44 62.08 56.70 10.64 | 2140.50 48.59 77.79 63.01 29.20
| 2037.50 51.42 62.27 56.78 10.86 | 2145.50 48.45 78.31 63.20 29.86 Beginning date for | 2038.50 51.39 62.46 56.85 11.07 | 2150.50 48.32 78.82 63.38 30.50 results: 2010.50 | 2039.50 51.36 62.64 56.93 11.28 | 2155.50 48.18 79.30 63.55 31.12 Source: Southern Province Census provincial Report, 2000 ; Census of population and housing analytical Report, 2010
Related Documents


