Source profiles for industrial, mobile, and area sources in the Big Bend Regional Aerosol Visibility and Observational study Judith C. Chow * , John G. Watson, Hampden Kuhns, Vicken Etyemezian, Douglas H. Lowenthal, Dale Crow, Steven D. Kohl, Johann P. Engelbrecht, Mark C. Green Division of Atmospheric Sciences, Desert Research Institute, 2215 Raggio Parkway, Reno, NV 89512-1095, USA Received 3 February 2003; received in revised form 18 July 2003; accepted 31 July 2003 Abstract Representative PM 2:5 and PM 10 source emissions were sampled in Texas during the Big Bend Regional Aerosol Visibility and Observational (BRAVO) study. Chemical source profiles for elements, ions, and carbon fractions of 145 samples are reported for paved and unpaved road dust, soil dust, motor vehicle exhaust, vegetative burning, four coal- fired power stations, an oil refinery catalytic cracker, two cement kilns, and residential meat cooking. Several samples were taken from each emitter and source type, and these were averaged by source type, and in source subgroups based on commonality of chemical composition. The standard deviation represents the variability of the chemical mass fractions. BRAVO profiles differed in some respects from profiles measured elsewhere. High calcium abundances in geological dust, high selenium abundances in coal-fired power stations, and high antimony abundances in oil refinery catalytic cracker emissions were found. Abundances of eight thermally evolved carbon fractions [Atmos. Environ. 28 (15) (1994) 2493] differ among combustion sources, and a Monte Carlo simulation demonstrates that these differences are sufficient to differentiate among several carbon-emitters. Ó 2003 Elsevier Ltd. All rights reserved. Keywords: Source profiles; Chemical mass balance receptor model; BRAVO; Carbon fractions; Combustion emissions 1. Introduction The big bend regional aerosol and visibility observa- tional (BRAVO) study (Green et al., 2000) was designed to understand the long-range, transboundary transport of visibility-reducing particles from regional sources in the US and Mexico and to quantify the contributions of specific US and Mexican source regions and source types responsible for poor visibility at Big Bend National Park in Texas. Analyses conducted during the study design phase identified several sources of particular interest: the Carbon I and Carbon II coal-fired power plants located about 270 km east-southeast of Big Bend National Park, coal-fired power plants along the lignite belt in Texas, and other urban and industrial sources in east Texas and northern Mexico. The field study conducted from July 1999 through October 1999 included many gaseous, aerosol, meteorological, and optical measurements as well as emission source sampling and analysis. The study also included release of perfluorocarbon gases at four locations, a network of 37 PM 2:5 and SO 2 samplers, and 24 perfluorocarbon sampling sites collocated with the * Corresponding author. Tel.: +1-775-674-7050; fax: +1-775- 674-7009. E-mail address: [email protected] (J.C. Chow). 0045-6535/$ - see front matter Ó 2003 Elsevier Ltd. All rights reserved. doi:10.1016/j.chemosphere.2003.07.004 Chemosphere 54 (2004) 185–208 www.elsevier.com/locate/chemosphere

Welcome message from author
This document is posted to help you gain knowledge. Please leave a comment to let me know what you think about it! Share it to your friends and learn new things together.
Transcript
Chemosphere 54 (2004) 185–208
www.elsevier.com/locate/chemosphere
Source profiles for industrial, mobile, and area sourcesin the Big Bend Regional Aerosol Visibility
and Observational study
Judith C. Chow *, John G. Watson, Hampden Kuhns, Vicken Etyemezian,Douglas H. Lowenthal, Dale Crow, Steven D. Kohl, Johann P. Engelbrecht,
Mark C. Green
Division of Atmospheric Sciences, Desert Research Institute, 2215 Raggio Parkway, Reno, NV 89512-1095, USA
Received 3 February 2003; received in revised form 18 July 2003; accepted 31 July 2003
Abstract
Representative PM2:5 and PM10 source emissions were sampled in Texas during the Big Bend Regional Aerosol
Visibility and Observational (BRAVO) study. Chemical source profiles for elements, ions, and carbon fractions of 145
samples are reported for paved and unpaved road dust, soil dust, motor vehicle exhaust, vegetative burning, four coal-
fired power stations, an oil refinery catalytic cracker, two cement kilns, and residential meat cooking. Several samples
were taken from each emitter and source type, and these were averaged by source type, and in source subgroups based
on commonality of chemical composition. The standard deviation represents the variability of the chemical mass
fractions. BRAVO profiles differed in some respects from profiles measured elsewhere. High calcium abundances in
geological dust, high selenium abundances in coal-fired power stations, and high antimony abundances in oil refinery
catalytic cracker emissions were found. Abundances of eight thermally evolved carbon fractions [Atmos. Environ. 28
(15) (1994) 2493] differ among combustion sources, and a Monte Carlo simulation demonstrates that these differences
are sufficient to differentiate among several carbon-emitters.
� 2003 Elsevier Ltd. All rights reserved.
Keywords: Source profiles; Chemical mass balance receptor model; BRAVO; Carbon fractions; Combustion emissions
1. Introduction
The big bend regional aerosol and visibility observa-
tional (BRAVO) study (Green et al., 2000) was designed
to understand the long-range, transboundary transport
of visibility-reducing particles from regional sources in
the US and Mexico and to quantify the contributions of
specific US and Mexican source regions and source types
*Corresponding author. Tel.: +1-775-674-7050; fax: +1-775-
674-7009.
E-mail address: [email protected] (J.C. Chow).
0045-6535/$ - see front matter � 2003 Elsevier Ltd. All rights reserv
doi:10.1016/j.chemosphere.2003.07.004
responsible for poor visibility at Big Bend National Park
in Texas. Analyses conducted during the study design
phase identified several sources of particular interest: the
Carbon I and Carbon II coal-fired power plants located
about 270 km east-southeast of Big Bend National Park,
coal-fired power plants along the lignite belt in Texas,
and other urban and industrial sources in east Texas and
northern Mexico. The field study conducted from July
1999 through October 1999 included many gaseous,
aerosol, meteorological, and optical measurements as
well as emission source sampling and analysis. The study
also included release of perfluorocarbon gases at four
locations, a network of 37 PM2:5 and SO2 samplers, and
24 perfluorocarbon sampling sites collocated with the
ed.
186 J.C. Chow et al. / Chemosphere 54 (2004) 185–208
aerosol sites. Extensive data analysis and modeling is
being performed; a final report is expected in 2003.
Particulate source profiles (the mass fractions of
designated chemical species) from primary emissions are
needed: (1) to create speciated emissions inventories
used in source-oriented models, (2) as input to receptor-
oriented source attribution models, and (3) to estimate
toxic and hazardous pollutant emissions. US EPA
emission inventory guidance (US EPA, 1999a) requires
speciation, and modeling guidance (US EPA, 2001) uses
a ‘‘weight of evidence’’ approach that normalizes mod-
eled source contributions to the geological, organic
carbon (OC), elemental carbon (EC), sulfate (SO¼4 ), and
nitrate (NO�3 ) components of speciated ambient receptor
samples. The Regional Haze Rule (US EPA, 1999b;
Chow, 2002; Chow et al., 2002a,b; Watson, 2002a,b)
places great reliance on comparable speciated measure-
ments at source and receptor. Receptor models that
derive profiles from ambient measurements (Hopke,
1999; Chow and Watson, 2002; Watson et al., 2002;
Brook et al., 2003) require compatible source measure-
ments for verification.
The profiles in SPECIATE (US EPA, 1999c) are
mostly for tests taken before 1990, even though profiles
representing modern source technology, fuels, and op-
erating conditions have been published. Comparisons of
BRAVO profiles and those from similar SPECIATE
source types are made below. In addition to commonly
measured elements (Na, Mg, Al, Si, P, S, Cl, K, Ca, Ti,
V, Cr, Mn, Fe, Co, Ni, Cu, Zn, Ga, As, Se, Br, Rb, Sr,
Y, Zr, Mo, Pd, Ag, Cd, In, Sn, Sb, Ba, La, Au, Hg, Tl,
Pb, U), ions (water-soluble chloride [Cl�], NO�3 , SO
¼4 ,
sodium [Naþ], potassium [Kþ], and ammonium [NHþ4 ]),
and OC and EC fractions (OC1, OC2, OC3, OC4, OP
[pyrolyzed carbon], EC1, EC2, EC3), specific organic
compounds (e.g., polycyclic aromatic hydrocarbons
[PAHs], hopanes, steranes, guaiacols, syringols, organic
acids, lactones, alcohols, sugars, etc.), isotopic abun-
dances (e.g., 34S, 14C), and individual particle properties
(e.g., morphology, size, elemental composition) are
showing promise to differentiate among source types
and subtypes.
This paper adds to current knowledge of chemical
source profiles for geological material, motor vehicle
exhaust, vegetative burning, coal-fired boilers, oil refin-
ery catalytic cracker, cement kilns, and meat cooking.
These profiles are contemporary, from tests taken in
1999 and 2000. They are specific to the PM2:5 size frac-
tion as well as providing PM2:5, PM10, and PMcoarse
(difference between PM2:5 and PM10) profiles for geo-
logical material. They include species measured at IM-
PROVE (Interagency Monitoring of Protected Visual
Environments) and EPA speciation trends network
PM2:5 monitoring sites, as well as water-soluble Kþ and
Naþ (which are markers for vegetative burning and sea
salt, respectively), and eight thermally derived carbon
fractions that may further discriminate among different
source contributions (Chow et al., 1993, 2001; Watson
et al., 1994).
2. Methods
The potential source types that contribute to PM
concentrations in southwest Texas were identified from
emission inventories and observations. Source samples
were taken from 09/23/99, through 02/25/00, to repre-
sent: (1) Texas fugitive dust (e.g., paved roads, unpaved
roads, and soil) (termed geological material), (2) motor
vehicle exhaust from gasoline- and diesel-fueled vehicles
operated in Texas and Mexico, (3) wildfires simulated by
controlled burns of wood and grass typical of Big Bend
National Park, (4) coal-fired power station effluent and
coal fly ash, (5) a refinery fluidized bed catalyst cracker,
(6) cement kilns fired by coal, coke, scrap tires, and used
oil filters, and (7) residential meat cooking.
Hot stack, dilution stack, airborne plume, ground-
based source-dominated, and grab/resuspension sam-
pling methods have been applied to source profile
characterization (Gordon et al., 1984; Chow et al., 1988;
Hildemann et al., 1989; Houck, 1991; Watson and
Chow, 2001; Watson et al., 2001a, 2002). Dilution stack,
ground-based source-dominated, and grab/resuspension
methods were used for these profiles. Geological samples
were obtained by the grab/resuspension method (Chow
et al., 1994; Carvacho et al., 1996). Geological source
locations representing various soil types and land uses
were chosen from US Department of Agriculture Soil
Conservation Service maps. Site surveys around BRAVO
sampling sites and in major Texas cities identified
additional sampling locations. Samples included paved
road dust from busy traffic intersections, unpaved roads,
and soil. Fifteen geological samples and three fly ash
samples from the electrostatic precipitator residue of a
coal-fired power station were collected by grab sampling
or vacuuming at the locations shown in Fig. 1. Samples
were air-dried in the laboratory under a low-relative-
humidity (approximately 20–30%) atmosphere, sieved
through a Tyler 400-mesh screen (<38 lm geometric
diameter), resuspended in a laboratory chamber, and
collected on filters through PM2:5 and PM10 impactor
inlets at a flow rate of 10 l/min (Chow et al., 1994).
The ground-based source-dominated method ob-
tained motor vehicle exhaust samples at seven locations
in San Antonio and Laredo, Texas (Fig. 1). A portable,
groundbased sampling system was located on a median,
sidewalk or shoulder within 2 m of the nearest high
density traffic lane, with the sampling inlet placed at 1.5
m above ground level. The sampler consisted of a Ben-
dix/Sensidyne 240 cyclone followed by parallel 47-mm
Teflon-membrane and quartz-fiber filter channels. The
flow rate through each channel was 70 l/min, resulting
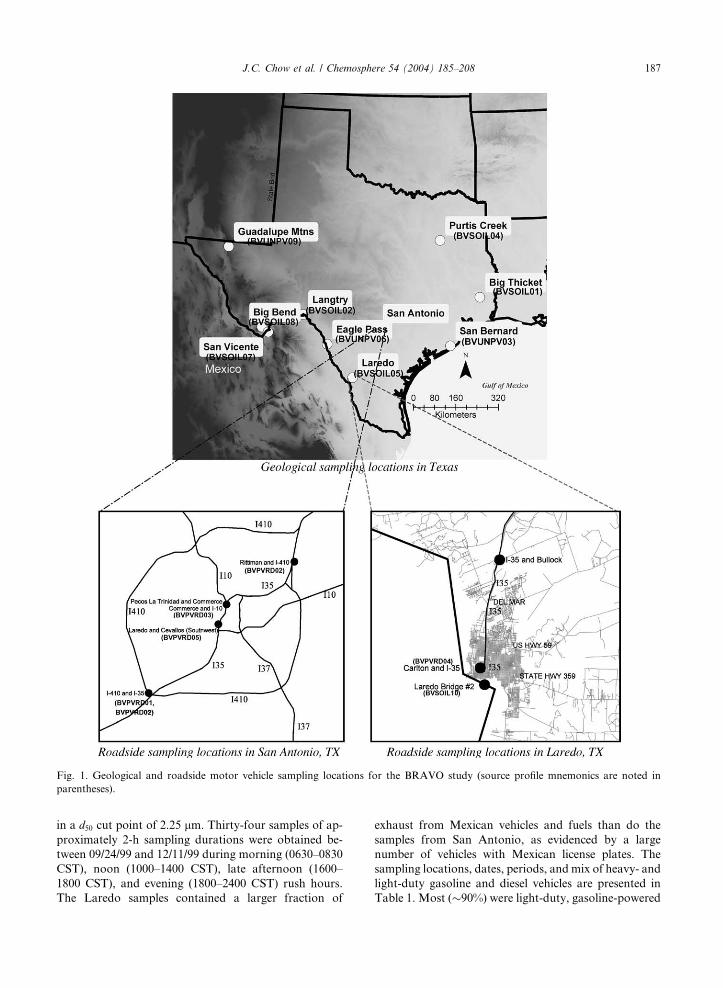
Fig. 1. Geological and roadside motor vehicle sampling locations for the BRAVO study (source profile mnemonics are noted in
parentheses).
J.C. Chow et al. / Chemosphere 54 (2004) 185–208 187
in a d50 cut point of 2.25 lm. Thirty-four samples of ap-
proximately 2-h sampling durations were obtained be-
tween 09/24/99 and 12/11/99 during morning (0630–0830
CST), noon (1000–1400 CST), late afternoon (1600–
1800 CST), and evening (1800–2400 CST) rush hours.
The Laredo samples contained a larger fraction of
exhaust from Mexican vehicles and fuels than do the
samples from San Antonio, as evidenced by a large
number of vehicles with Mexican license plates. The
sampling locations, dates, periods, and mix of heavy- and
light-duty gasoline and diesel vehicles are presented in
Table 1. Most (�90%) were light-duty, gasoline-powered
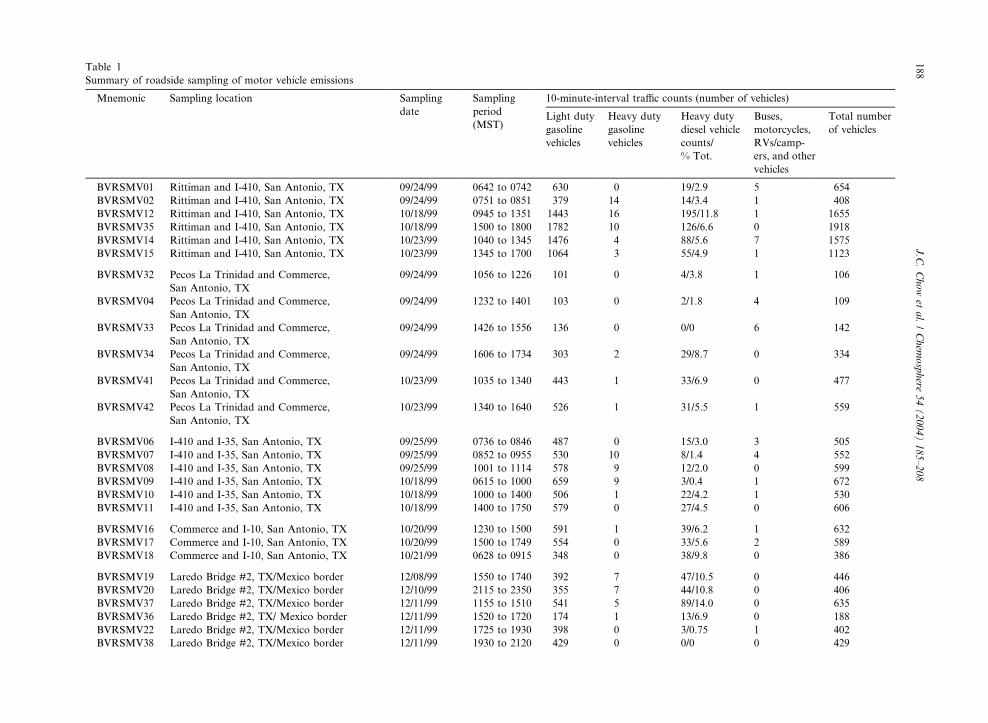
Table 1
Summary of roadside sampling of motor vehicle emissions
Mnemonic Sampling location Sampling
date
Sampling
period
(MST)
10-minute-interval traffic counts (number of vehicles)
Light duty
gasoline
vehicles
Heavy duty
gasoline
vehicles
Heavy duty
diesel vehicle
counts/
% Tot.
Buses,
motorcycles,
RVs/camp-
ers, and other
vehicles
Total number
of vehicles
BVRSMV01 Rittiman and I-410, San Antonio, TX 09/24/99 0642 to 0742 630 0 19/2.9 5 654
BVRSMV02 Rittiman and I-410, San Antonio, TX 09/24/99 0751 to 0851 379 14 14/3.4 1 408
BVRSMV12 Rittiman and I-410, San Antonio, TX 10/18/99 0945 to 1351 1443 16 195/11.8 1 1655
BVRSMV35 Rittiman and I-410, San Antonio, TX 10/18/99 1500 to 1800 1782 10 126/6.6 0 1918
BVRSMV14 Rittiman and I-410, San Antonio, TX 10/23/99 1040 to 1345 1476 4 88/5.6 7 1575
BVRSMV15 Rittiman and I-410, San Antonio, TX 10/23/99 1345 to 1700 1064 3 55/4.9 1 1123
BVRSMV32 Pecos La Trinidad and Commerce,
San Antonio, TX
09/24/99 1056 to 1226 101 0 4/3.8 1 106
BVRSMV04 Pecos La Trinidad and Commerce,
San Antonio, TX
09/24/99 1232 to 1401 103 0 2/1.8 4 109
BVRSMV33 Pecos La Trinidad and Commerce,
San Antonio, TX
09/24/99 1426 to 1556 136 0 0/0 6 142
BVRSMV34 Pecos La Trinidad and Commerce,
San Antonio, TX
09/24/99 1606 to 1734 303 2 29/8.7 0 334
BVRSMV41 Pecos La Trinidad and Commerce,
San Antonio, TX
10/23/99 1035 to 1340 443 1 33/6.9 0 477
BVRSMV42 Pecos La Trinidad and Commerce,
San Antonio, TX
10/23/99 1340 to 1640 526 1 31/5.5 1 559
BVRSMV06 I-410 and I-35, San Antonio, TX 09/25/99 0736 to 0846 487 0 15/3.0 3 505
BVRSMV07 I-410 and I-35, San Antonio, TX 09/25/99 0852 to 0955 530 10 8/1.4 4 552
BVRSMV08 I-410 and I-35, San Antonio, TX 09/25/99 1001 to 1114 578 9 12/2.0 0 599
BVRSMV09 I-410 and I-35, San Antonio, TX 10/18/99 0615 to 1000 659 9 3/0.4 1 672
BVRSMV10 I-410 and I-35, San Antonio, TX 10/18/99 1000 to 1400 506 1 22/4.2 1 530
BVRSMV11 I-410 and I-35, San Antonio, TX 10/18/99 1400 to 1750 579 0 27/4.5 0 606
BVRSMV16 Commerce and I-10, San Antonio, TX 10/20/99 1230 to 1500 591 1 39/6.2 1 632
BVRSMV17 Commerce and I-10, San Antonio, TX 10/20/99 1500 to 1749 554 0 33/5.6 2 589
BVRSMV18 Commerce and I-10, San Antonio, TX 10/21/99 0628 to 0915 348 0 38/9.8 0 386
BVRSMV19 Laredo Bridge #2, TX/Mexico border 12/08/99 1550 to 1740 392 7 47/10.5 0 446
BVRSMV20 Laredo Bridge #2, TX/Mexico border 12/10/99 2115 to 2350 355 7 44/10.8 0 406
BVRSMV37 Laredo Bridge #2, TX/Mexico border 12/11/99 1155 to 1510 541 5 89/14.0 0 635
BVRSMV36 Laredo Bridge #2, TX/ Mexico border 12/11/99 1520 to 1720 174 1 13/6.9 0 188
BVRSMV22 Laredo Bridge #2, TX/Mexico border 12/11/99 1725 to 1930 398 0 3/0.75 1 402
BVRSMV38 Laredo Bridge #2, TX/Mexico border 12/11/99 1930 to 2120 429 0 0/0 0 429
188
J.C.Chowet
al./Chem
osphere
54(2004)185–208

BVRSMV25
SW
ofSanAntonio,TX
10/21/99
1140to
1430
661
360/8.3
0724
BVRSMV39
SW
ofSanAntonio,TX
10/21/99
1437to
1750
831
044/5.0
0875
BVRSMV40
SW
ofSanAntonio,TX
10/22/99
0630to
0930
621
169/10.0
0691
BVRSMV28
I-35andCarlton,Laredo,TX
12/08/99
1330to
1615
1397
14
165/10.5
01576
BVRSMV29
I-35andCarlton,Laredo,TX
12/08/99
1615to
1900
1296
14
120/8.4
01430
BVRSMV31
I-35andCarlton,Laredo,TX
12/11/99
1245to
1445
1029
758/5.3
01094
BVRSMV30
I-35andCarlton,Laredo,TX
12/11/99
1445to
1645
706
318/2.5
0727
J.C. Chow et al. / Chemosphere 54 (2004) 185–208 189
vehicles, although the cross-border diesel truck volume
was larger in Laredo than in other parts of Texas.
Vegetative burning profiles were obtained by ground-
based source-dominated sampling in the plumes of small
controlled burns of wood debris at Big Bend National
Park. Most of the vegetative cuttings were collected as
part of a habitat restoration project that removed non-
native trees and shrubs from a high-elevation section of
the park that had been used for grazing cattle. These
areas were often subject to wildfires. Fuels included
three abundant species from the area (mesquite, tama-
risk, and huisache), native dry grass, and pine fence
posts treated with creosote. The wood was dried for
several months prior to burning. Approximately 5–10 kg
of fuel was lit using a torch and allowed to burn for 10
min prior to sampling. The sampler inlet was inserted
into the plume �5 m downwind of the fires where the
temperature was slightly above ambient. Twenty-one
simulated wildfire samples of 10–15 min duration each
were acquired.
Dilution stack sampling (Hildemann et al., 1989) was
applied to four coal-fired power plant boilers, a petro-
leum refinery catalytic cracker, and two cement kilns
burning coal, coke, scrap tires, woodchips, and used oil
filters. Between tests of different source types, the dilu-
tion tube and aging chamber were cleaned with a water
power spray followed by an acetone spray, then wrap-
ped with heating blankets, and baked at 150 �C for at
least eight hours with filtered air flowing through it.
Emissions were withdrawn from the stack or duct
through an isokinetic button hook nozzle, then through
a heated copper line to a 12.5 cm diameter · 2.7 m length
u-tube where the exhaust was mixed with clean dilution
air at ambient temperature under turbulent flow condi-
tions. Ambient dilution air was filtered through a high
efficiency particulate air (HEPA) filter to remove parti-
cles and through an activated carbon bed to remove gas-
phase organics. Dilution ratios ranged from 9 to 60, with
a typical ratio of 30 parts of clean air to each part of
exhaust. The diluted air was aged for �80 s to allow for
condensation, coagulation, and rapid reactions to occur
prior to being drawn through three Bendix/Sensidyne
cyclones (2.5 lm cutpoint at 113 l/min) to a multi-port
sampling manifold that accommodated different collec-
tion substrates.
Twenty-six coal-fired boiler samples were acquired
from three electrical generating stations that supplied
power for domestic use and from one station that sup-
plied power to an aluminum processing facility. Exhaust
emission controls included a baghouse at one plant, a
baghouse backed up by a wet limestone scrubber at
another plant, an electrostatic precipitator followed by a
baghouse at a third plant, and a dry limestone scrubber
to remove acidity and fluorine from added potliner
material at the aluminum facility. Bottom fly ash sam-
ples were acquired from three of the power plants to

190 J.C. Chow et al. / Chemosphere 54 (2004) 185–208
represent a potential fugitive dust source resulting from
ash disposal.
Five samples were taken of emissions from a petro-
leum refinery’s heavy oil catalytic cracker unit equipped
with an electrostatic precipitator. Six samples were taken
of stack emissions from a Texas cement kiln equipped
with an electrostatic precipitator and fueled by coal,
coke, and scrap tires. Five samples were taken of stack
emissions from another Texas cement kiln equipped
with a baghouse and fueled by coal, wood chips, and
used oil filters. Depending on particle loadings, sampling
durations varied from 240 to 1190 min at the coal-fired
power plant boilers, from 300 to 960 min at the refinery,
and from 180 to 900 min at the cement kilns. Dilution
ratios varied from 9 to 60 at the coal-fired power plant
boilers, from 30 to 60 at the refinery, and from 27 to 54
at the cement kilns.
Meat cooking tests were conducted under controlled
conditions at the University of California at Riverside’s
College of Engineering––Center for Environmental
Research and Technology’s (CE-CERT) commercial
kitchen test facility, following its standard testing
methods (Norbeck, 1997). Test protocols specify the
properties of the meats (e.g., fat content, moisture con-
tent, thickness and diameter), cooking conditions (e.g.,
grate and griddle temperature, load capacity), and
cooking procedure (e.g., method of loading the meat,
cooking time) (Welch, 1997). Meat was obtained from a
local supermarket, and its fat and moisture content were
measured (AOAC, 2000). The cooking exhaust was
ducted through cleaned grease baffles in a ventilation
hood operating at a velocity of 8 m/s, corresponding to a
flow rate of 11.3 m3/min. The exhaust stream was iso-
kinetically sampled by the dilution sampler and mixed
with 25–28 times its volume of clean air. Sampling du-
rations ranged from 60 to 152 min for 12 tests with
charcoal and mesquite smoked chicken, propane grilled
chicken, charcoal grilled hamburger, and Chinese-style
pan stir-fry.
Samples were acquired from two parallel sampling
channels fitted with Teflon-membrane and quartz-fiber
filter packs. In the first channel, a Teflon-membrane
front filter (2 lm pore size, R2PJ047, Pall Life Sciences,
Ann Arbor, MI) was followed by a potassium-carbon-
ate-impregnated cellulose-fiber filter (31ET, Whatman,
Clifton, NJ). The Teflon filter was analyzed for mass by
gravimetry and for 40 elements by X-ray fluorescence
spectrometry (XRF, Watson et al., 1999). Sulfur dioxide
(SO2) absorbed by the cellulose-fiber backup filter was
analyzed as SO¼4 by ion chromatography (Chow and
Watson, 1999). In the second channel, a quartz-fiber
front filter (2500 QAT-UP, Pall) was followed by a
citric-acid-impregnated cellulose-fiber filter (Whatman
41ET). The quartz filter was analyzed for Cl�, NO�3 , and
SO¼4 by ion chromatography; for NHþ
4 by automated
colorimetry; for water-soluble Naþ and Kþ by atomic
absorption spectrophotometry; and for OC, EC, and
eight organic, elemental, and pyrolyzed carbon frac-
tions following the IMPROVE thermal/optical protocol
(Chow et al., 1993, 2001). The organic carbon fractions,
OC1–OC4, were measured in a pure helium atmosphere
at 120, 250, 450, and 550 �C, respectively, and the ele-
mental carbon fractions, EC1–EC3, were measured in a
2% oxygen, 98% helium atmosphere at 550, 700, and 800
�C, respectively. A He–Ne laser beam (633 nm) was used
to monitor filter reflectance for pyrolysis correction.
Ammonia (NH3) absorbed on the cellulose-fiber backup
filter was analyzed as NHþ4 by automated colorimetry.
The PM2:5 (fine) fraction was collected for all sources.
The PM10 fraction was also collected and chemically
characterized for the resuspension (geological and fly
ash) samples and a ‘‘coarse’’ fraction was determined as
the difference between PM10 and PM2:5 concentrations.
Gaseous SO2 and NH3 were acquired in all but the re-
suspension samples.
Though dominated by motor vehicle exhaust, road-
side motor vehicle samples also contain suspended road
dust and particles from other ‘‘background’’ sources.
The chemical mass balance (CMB) model (Watson et al.,
1990) was used to adjust the motor vehicle samples for
background source contributions using the technique
described by Watson et al. (1994). Each roadside source
sample was submitted to CMB with the following
sources: paved road dust, secondary ammonium sulfate
and ammonium nitrate, and vegetative (grass) burning.
Only chemical species assumed to come from the back-
ground but not the motor vehicle sources (i.e., Al, Si, K,
Ca, Ti, Rb, and Sr from paved road dust, NHþ4 , SO
¼4 ,
and NO�3 from secondary ammonium sulfate and am-
monium nitrate, and water-soluble Kþ from vegetative
burning) were used as CMB fitting species. The contri-
butions of the background sources to mass and all
chemical species were subtracted from the motor vehicle
profile concentrations and the differences were used to
calculate the adjusted motor vehicle source profiles with
appropriate error propagation.
3. Results and discussion
Chemical abundances for each sample were blank
subtracted and calculated by dividing each chemical
concentration by the mass concentration, with error
propagation by addition in quadrature (Watson et al.,
2001b). Dilution sampling of coal-fired power plant
boilers, cement kilns, residential cooking, open burning,
and roadside sampling for motor vehicle exhaust fre-
quently resulted in low measured masses (typically less
than 0.5 mg/sample). At lower mass concentrations, the
effect of gaseous organic carbon adsorption on quartz-
fiber filters becomes apparent as the sum-of-chemical-
J.C. Chow et al. / Chemosphere 54 (2004) 185–208 191
species-to-measured-mass ratios exceed unity. The pro-
files were normalized to the sum of species in these cases.
Because refinery catalytic cracker emissions were color-
less, samples were inadvertently overloaded (16–19 mg/
sample), with consequent inconsistencies between mass
collected on the Teflon-membrane and quartz-fiber fil-
ters. These samples were also normalized to the sum
of species rather than to measured mass.
Individual source profiles are averaged to represent
emissions compositions for a source category. The
variability of the average is estimated as the larger of
the standard deviation of the averaged abundances or
the root mean square of the analytical precisions for the
individual profiles. The rationale for this approach is
illustrated in the extreme case with several values at the
[same] detection limit; the standard deviation of the
average is zero but the analytical uncertainty is 100%.
The individual sample profiles were composited by
source type and sub-type based on commonality of
composition of the chemical species most indicative of
those sources: (1) geological: Al, Si, Ca, Fe, OC; (2)
motor vehicle: sulfur (S), OC, EC, carbon fractions; (3)
vegetative burning: water-soluble Kþ, OC, EC; (4) coal-
fired boilers: S, OC, EC, Se; and (5) cement kilns: Si, K,
Ca, Fe, S, OC. While an average profile for a source type
may be relevant to long-term average emissions inven-
tories, sub-type profiles may be more suitable for re-
ceptor model source apportionment of the short-term
daily samples collected during the BRAVO study and
other air quality studies. The composites reported here
are described in Table 2. Individual profiles are available
(Chow et al., 2002a,b) for alternative composites based
on other criteria. Table 3 presents the average chemical
abundances and their variabilities. Included in these
profiles are eight carbon fractions (OC1, OC2, OC3,
OC4, OP, EC1, EC2, and EC3) (Chow et al., 1993, 2001;
Watson et al., 1994) and ratios of SO2 and NH3 gas
abundances relative to PM2:5 mass emissions. The car-
bon fractions are reported in several ambient data sets
(ARB, 2003; IMPROVE, 2003) and have been used in
receptor models (Engelbrecht et al., 2002). The fractions
are thus relevant for use in CMB modeling where carbon
in the ambient samples and other source profiles was
measured using the same methodology.
The geological profiles are dominated by Si, Ca, and
OC (road dust). PM2:5 Si varies fourfold from 7.8± 0.7%
in unpaved road dust (BVUNPV2) to 29.4 ± 2.5% in
eastern Texas soil (BVSOIL1). Conversely, PM2:5 Ca
varies sixfold from 4.1± 1.3% in soil (BVSOIL1) to
24.0± 1.7% in unpaved road dust (BVUNPV2). Houck
et al. (1989) measured the chemical compositions of
various types of geological material in California and
found no Ca abundances higher than 11.6 ± 1.3% (ag-
ricultural soil from Kern Wildlife Refuge). The carbon
(OC and EC) content is highest in paved road dust
(BVPVRD1) and eastern Texas soil (BVSOIL1), with
large variabilities (i.e., high uncertainties). The major
element compositions do not appear to vary significantly
between the fine and coarse fractions, i.e., they overlap
within twice their uncertainties (Chow et al., 1994).
Perry et al. (1997) found that PM2:5 Al/Ca ratios of
>3.8 were indicators of Sahara dust transport at eastern
US IMPROVE monitors. Al/Ca ratios in the PM2:5
dust samples range from 0.1 in unpaved road dust
(BVUNPV2) to 0.76 in soil from the Purtis Creek and
Big Thicket samples (BVSOIL1) from eastern Texas.
This implies that Sahara dust incursions, if they occur,
should be recognizably different from Texas geological
contributions.
The four vehicle exhaust profiles are dominated
(>95%) by OC and EC, although EC varies from
18.4± 2.9% in BVRDMV3 to 46.6 ± 14.3% in
BVRDMV1. This is similar to the 36± 11% EC and
39± 19% OC in 1989 Phoenix, AZ, profiles (Watson
et al., 1994). The EC-to-OC ratios for BVRDMV1–4
were 0.97, 0.53, 0.23, and 0.66, respectively (average EC-
to-OC ratio ¼ 0.60± 0.30). EC-to-OC ratios in vehicle
exhaust from the Imperial Valley, CA and Las Vegas,
NV, ranged from 0.25 to 1.67 with an average ratio of
0.67± 0.29 (Chow et al., 1999; Watson and Chow, 2001).
There was no apparent relationship between the fraction
of diesel vehicles in BVRDMV1–4 (5.1%, 9.6%, 4.4%,
and 2.5%) and the corresponding EC-to-OC ratios (R-squared ¼ 0.0002).
The vegetative burning chemical abundances are
highly variable, even for the same fuel. For the pine
fence burns, the compositions in BURN1 and BURN2
were 43.4± 5.6% and 87.7± 17.0% for OC, 55.2± 6.4%
and 11.6± 8.3% for EC, and 0.12 ± 0.02% and 0.02±
0.004% for Kþ, respectively. Kþ abundances ranged
from 0.02± 0.004% for pine fence (BURN2) to 13.6 ±
3.1% for Mesquite (BURN3). Fine et al. (2002) reported
profiles for fireplace burns of softwoods and hardwoods.
They found that OC constituted 77% and 100% of PM2:5
mass for white ash and slash pine, respectively. These
abundances may be high relative to those presented
here, as Fine et al. (2002) used transmission, rather than
reflectance to correct for pyrolysis (Chow et al., 2001),
which results higher OC and lower EC concentrations.
The highest total K content (1.75%) was reported for
white ash.
The OC content of coal-fired power plant emissions
range from 0.9± 1.2% in CFPP6 to 62.9 ± 14.8% in
CFPP1. CFPP1 had very low mass emissions, and its
OC content is probably dominated by adsorbed organic
vapors on the quartz filter. CFPP6 is distinguished from
CFPP1 by its low OC and high Se composition. EC
abundances were variable. The highest SO¼4 abundances
were found for CFPP4, CFPP5 and CFPP6 (45.6 ±
18.7%, 46.2± 6.8%, and 62.2± 12.5%, respectively). The
ratios of SO2 relative to PM2:5 mass emissions were high
and variable from sample to sample, ranging from
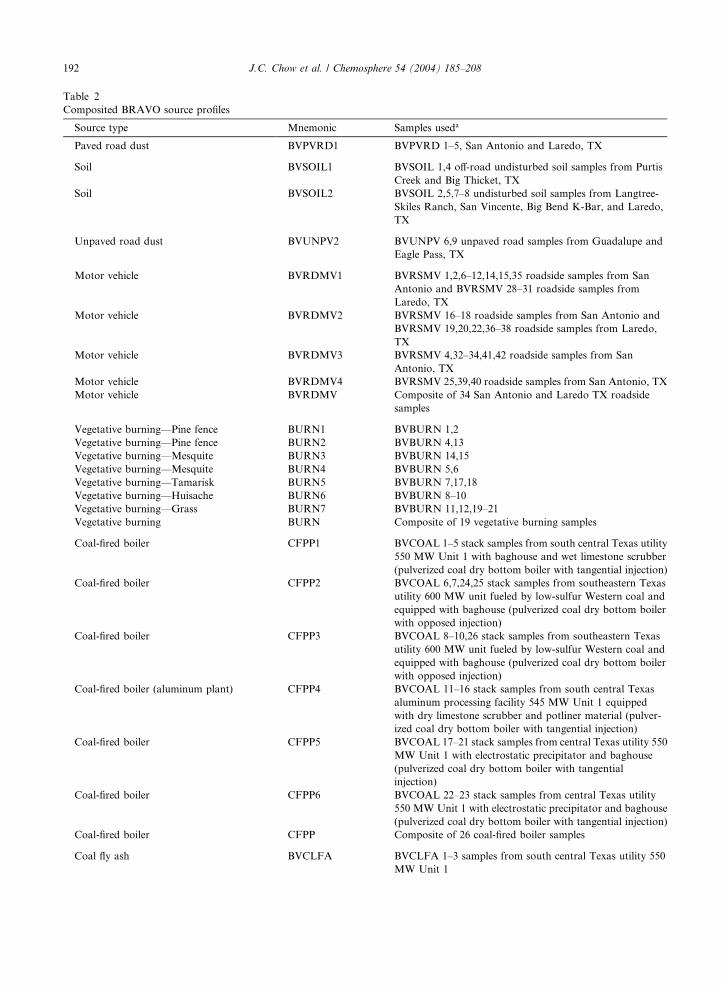
Table 2
Composited BRAVO source profiles
Source type Mnemonic Samples useda
Paved road dust BVPVRD1 BVPVRD 1–5, San Antonio and Laredo, TX
Soil BVSOIL1 BVSOIL 1,4 off-road undisturbed soil samples from Purtis
Creek and Big Thicket, TX
Soil BVSOIL2 BVSOIL 2,5,7–8 undisturbed soil samples from Langtree-
Skiles Ranch, San Vincente, Big Bend K-Bar, and Laredo,
TX
Unpaved road dust BVUNPV2 BVUNPV 6,9 unpaved road samples from Guadalupe and
Eagle Pass, TX
Motor vehicle BVRDMV1 BVRSMV 1,2,6–12,14,15,35 roadside samples from San
Antonio and BVRSMV 28–31 roadside samples from
Laredo, TX
Motor vehicle BVRDMV2 BVRSMV 16–18 roadside samples from San Antonio and
BVRSMV 19,20,22,36–38 roadside samples from Laredo,
TX
Motor vehicle BVRDMV3 BVRSMV 4,32–34,41,42 roadside samples from San
Antonio, TX
Motor vehicle BVRDMV4 BVRSMV 25,39,40 roadside samples from San Antonio, TX
Motor vehicle BVRDMV Composite of 34 San Antonio and Laredo TX roadside
samples
Vegetative burning––Pine fence BURN1 BVBURN 1,2
Vegetative burning––Pine fence BURN2 BVBURN 4,13
Vegetative burning––Mesquite BURN3 BVBURN 14,15
Vegetative burning––Mesquite BURN4 BVBURN 5,6
Vegetative burning––Tamarisk BURN5 BVBURN 7,17,18
Vegetative burning––Huisache BURN6 BVBURN 8–10
Vegetative burning––Grass BURN7 BVBURN 11,12,19–21
Vegetative burning BURN Composite of 19 vegetative burning samples
Coal-fired boiler CFPP1 BVCOAL 1–5 stack samples from south central Texas utility
550 MW Unit 1 with baghouse and wet limestone scrubber
(pulverized coal dry bottom boiler with tangential injection)
Coal-fired boiler CFPP2 BVCOAL 6,7,24,25 stack samples from southeastern Texas
utility 600 MW unit fueled by low-sulfur Western coal and
equipped with baghouse (pulverized coal dry bottom boiler
with opposed injection)
Coal-fired boiler CFPP3 BVCOAL 8–10,26 stack samples from southeastern Texas
utility 600 MW unit fueled by low-sulfur Western coal and
equipped with baghouse (pulverized coal dry bottom boiler
with opposed injection)
Coal-fired boiler (aluminum plant) CFPP4 BVCOAL 11–16 stack samples from south central Texas
aluminum processing facility 545 MW Unit 1 equipped
with dry limestone scrubber and potliner material (pulver-
ized coal dry bottom boiler with tangential injection)
Coal-fired boiler CFPP5 BVCOAL 17–21 stack samples from central Texas utility 550
MW Unit 1 with electrostatic precipitator and baghouse
(pulverized coal dry bottom boiler with tangential
injection)
Coal-fired boiler CFPP6 BVCOAL 22–23 stack samples from central Texas utility
550 MW Unit 1 with electrostatic precipitator and baghouse
(pulverized coal dry bottom boiler with tangential injection)
Coal-fired boiler CFPP Composite of 26 coal-fired boiler samples
Coal fly ash BVCLFA BVCLFA 1–3 samples from south central Texas utility 550
MW Unit 1
192 J.C. Chow et al. / Chemosphere 54 (2004) 185–208
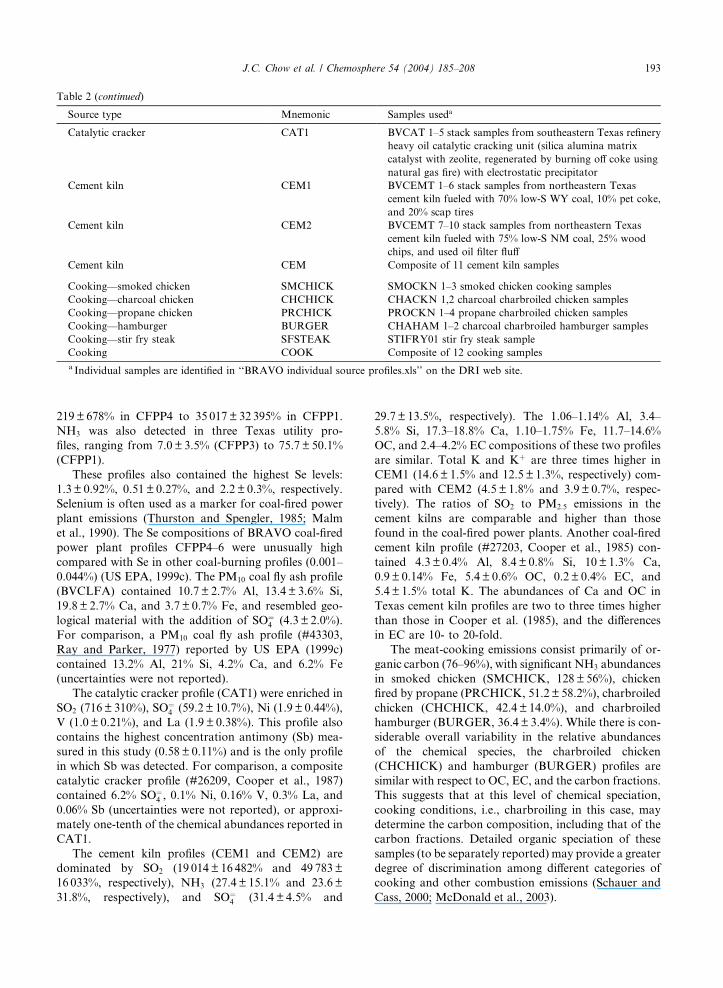
Table 2 (continued)
Source type Mnemonic Samples useda
Catalytic cracker CAT1 BVCAT 1–5 stack samples from southeastern Texas refinery
heavy oil catalytic cracking unit (silica alumina matrix
catalyst with zeolite, regenerated by burning off coke using
natural gas fire) with electrostatic precipitator
Cement kiln CEM1 BVCEMT 1–6 stack samples from northeastern Texas
cement kiln fueled with 70% low-S WY coal, 10% pet coke,
and 20% scap tires
Cement kiln CEM2 BVCEMT 7–10 stack samples from northeastern Texas
cement kiln fueled with 75% low-S NM coal, 25% wood
chips, and used oil filter fluff
Cement kiln CEM Composite of 11 cement kiln samples
Cooking––smoked chicken SMCHICK SMOCKN 1–3 smoked chicken cooking samples
Cooking––charcoal chicken CHCHICK CHACKN 1,2 charcoal charbroiled chicken samples
Cooking––propane chicken PRCHICK PROCKN 1–4 propane charbroiled chicken samples
Cooking––hamburger BURGER CHAHAM 1–2 charcoal charbroiled hamburger samples
Cooking––stir fry steak SFSTEAK STIFRY01 stir fry steak sample
Cooking COOK Composite of 12 cooking samples
a Individual samples are identified in ‘‘BRAVO individual source profiles.xls’’ on the DRI web site.
J.C. Chow et al. / Chemosphere 54 (2004) 185–208 193
219±678% in CFPP4 to 35 017± 32 395% in CFPP1.
NH3 was also detected in three Texas utility pro-
files, ranging from 7.0 ± 3.5% (CFPP3) to 75.7 ± 50.1%
(CFPP1).
These profiles also contained the highest Se levels:
1.3 ± 0.92%, 0.51 ± 0.27%, and 2.2 ± 0.3%, respectively.
Selenium is often used as a marker for coal-fired power
plant emissions (Thurston and Spengler, 1985; Malm
et al., 1990). The Se compositions of BRAVO coal-fired
power plant profiles CFPP4–6 were unusually high
compared with Se in other coal-burning profiles (0.001–
0.044%) (US EPA, 1999c). The PM10 coal fly ash profile
(BVCLFA) contained 10.7± 2.7% Al, 13.4± 3.6% Si,
19.8± 2.7% Ca, and 3.7± 0.7% Fe, and resembled geo-
logical material with the addition of SO¼4 (4.3 ± 2.0%).
For comparison, a PM10 coal fly ash profile (#43303,
Ray and Parker, 1977) reported by US EPA (1999c)
contained 13.2% Al, 21% Si, 4.2% Ca, and 6.2% Fe
(uncertainties were not reported).
The catalytic cracker profile (CAT1) were enriched in
SO2 (716± 310%), SO¼4 (59.2 ± 10.7%), Ni (1.9 ± 0.44%),
V (1.0 ± 0.21%), and La (1.9 ± 0.38%). This profile also
contains the highest concentration antimony (Sb) mea-
sured in this study (0.58± 0.11%) and is the only profile
in which Sb was detected. For comparison, a composite
catalytic cracker profile (#26209, Cooper et al., 1987)
contained 6.2% SO¼4 , 0.1% Ni, 0.16% V, 0.3% La, and
0.06% Sb (uncertainties were not reported), or approxi-
mately one-tenth of the chemical abundances reported in
CAT1.
The cement kiln profiles (CEM1 and CEM2) are
dominated by SO2 (19 014± 16 482% and 49 783±
16 033%, respectively), NH3 (27.4 ± 15.1% and 23.6±
31.8%, respectively), and SO¼4 (31.4 ± 4.5% and
29.7± 13.5%, respectively). The 1.06–1.14% Al, 3.4–
5.8% Si, 17.3–18.8% Ca, 1.10–1.75% Fe, 11.7–14.6%
OC, and 2.4–4.2% EC compositions of these two profiles
are similar. Total K and Kþ are three times higher in
CEM1 (14.6 ± 1.5% and 12.5 ± 1.3%, respectively) com-
pared with CEM2 (4.5 ± 1.8% and 3.9± 0.7%, respec-
tively). The ratios of SO2 to PM2:5 emissions in the
cement kilns are comparable and higher than those
found in the coal-fired power plants. Another coal-fired
cement kiln profile (#27203, Cooper et al., 1985) con-
tained 4.3± 0.4% Al, 8.4 ± 0.8% Si, 10 ± 1.3% Ca,
0.9 ± 0.14% Fe, 5.4 ± 0.6% OC, 0.2± 0.4% EC, and
5.4± 1.5% total K. The abundances of Ca and OC in
Texas cement kiln profiles are two to three times higher
than those in Cooper et al. (1985), and the differences
in EC are 10- to 20-fold.
The meat-cooking emissions consist primarily of or-
ganic carbon (76–96%), with significant NH3 abundances
in smoked chicken (SMCHICK, 128± 56%), chicken
fired by propane (PRCHICK, 51.2± 58.2%), charbroiled
chicken (CHCHICK, 42.4± 14.0%), and charbroiled
hamburger (BURGER, 36.4± 3.4%). While there is con-
siderable overall variability in the relative abundances
of the chemical species, the charbroiled chicken
(CHCHICK) and hamburger (BURGER) profiles are
similar with respect to OC, EC, and the carbon fractions.
This suggests that at this level of chemical speciation,
cooking conditions, i.e., charbroiling in this case, may
determine the carbon composition, including that of the
carbon fractions. Detailed organic speciation of these
samples (to be separately reported) may provide a greater
degree of discrimination among different categories of
cooking and other combustion emissions (Schauer and
Cass, 2000; McDonald et al., 2003).
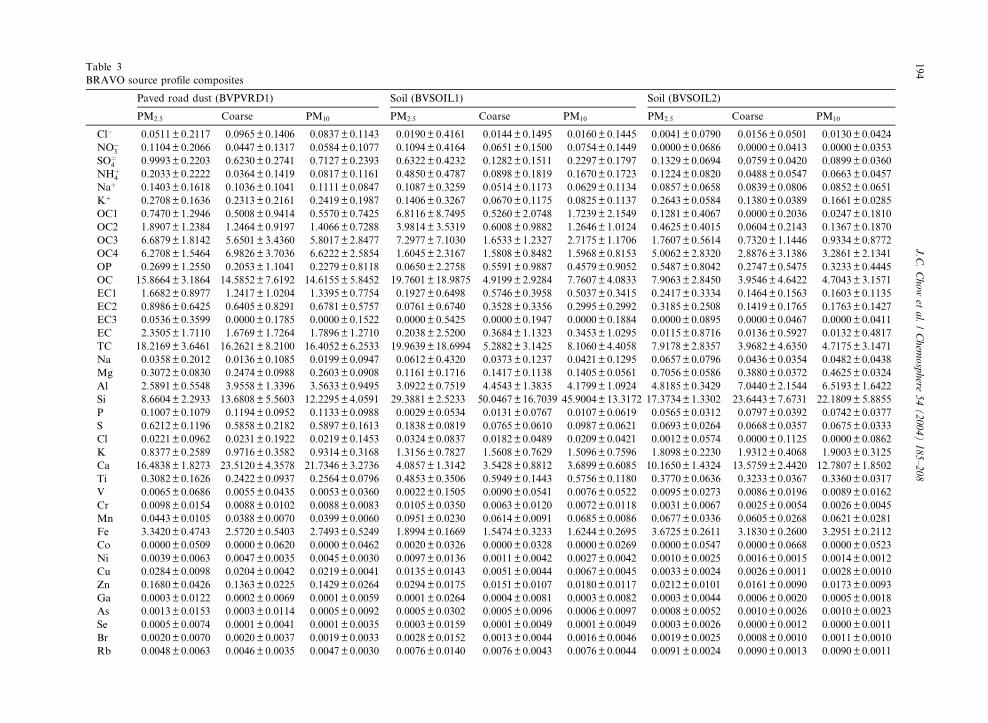
Table 3
BRAVO source profile composites
Paved road dust (BVPVRD1) Soil (BVSOIL1) Soil (BVSOIL2)
PM2:5 Coarse PM10 PM2:5 Coarse PM10 PM2:5 Coarse PM10
Cl� 0.0511± 0.2117 0.0965± 0.1406 0.0837± 0.1143 0.0190± 0.4161 0.0144±0.1495 0.0160± 0.1445 0.0041± 0.0790 0.0156± 0.0501 0.0130± 0.0424
NO�3 0.1104± 0.2066 0.0447± 0.1317 0.0584± 0.1077 0.1094± 0.4164 0.0651±0.1500 0.0754± 0.1449 0.0000± 0.0686 0.0000± 0.0413 0.0000± 0.0353
SO¼4 0.9993± 0.2203 0.6230± 0.2741 0.7127± 0.2393 0.6322± 0.4232 0.1282±0.1511 0.2297± 0.1797 0.1329± 0.0694 0.0759± 0.0420 0.0899± 0.0360
NHþ4 0.2033± 0.2222 0.0364± 0.1419 0.0817± 0.1161 0.4850± 0.4787 0.0898±0.1819 0.1670± 0.1723 0.1224± 0.0820 0.0488± 0.0547 0.0663± 0.0457
Naþ 0.1403± 0.1618 0.1036± 0.1041 0.1111± 0.0847 0.1087± 0.3259 0.0514±0.1173 0.0629± 0.1134 0.0857± 0.0658 0.0839± 0.0806 0.0852± 0.0651
Kþ 0.2708± 0.1636 0.2313± 0.2161 0.2419± 0.1987 0.1406± 0.3267 0.0670±0.1175 0.0825± 0.1137 0.2643± 0.0584 0.1380± 0.0389 0.1661± 0.0285
OC1 0.7470± 1.2946 0.5008± 0.9414 0.5570± 0.7425 6.8116± 8.7495 0.5260±2.0748 1.7239± 2.1549 0.1281± 0.4067 0.0000± 0.2036 0.0247± 0.1810
OC2 1.8907± 1.2384 1.2464± 0.9197 1.4066± 0.7288 3.9814± 3.5319 0.6008±0.9882 1.2646± 1.0124 0.4625± 0.4015 0.0604± 0.2143 0.1367± 0.1870
OC3 6.6879± 1.8142 5.6501± 3.4360 5.8017± 2.8477 7.2977± 7.1030 1.6533±1.2327 2.7175± 1.1706 1.7607± 0.5614 0.7320± 1.1446 0.9334± 0.8772
OC4 6.2708± 1.5464 6.9826± 3.7036 6.6222± 2.5854 1.6045± 2.3167 1.5808±0.8482 1.5968± 0.8153 5.0062± 2.8320 2.8876± 3.1386 3.2861± 2.1341
OP 0.2699± 1.2550 0.2053± 1.1041 0.2279± 0.8118 0.0650± 2.2758 0.5591±0.9887 0.4579± 0.9052 0.5487± 0.8042 0.2747± 0.5475 0.3233± 0.4445
OC 15.8664± 3.1864 14.5852± 7.6192 14.6155± 5.8452 19.7601± 18.9875 4.9199±2.9284 7.7607± 4.0833 7.9063± 2.8450 3.9546± 4.6422 4.7043± 3.1571
EC1 1.6682± 0.8977 1.2417± 1.0204 1.3395± 0.7754 0.1927± 0.6498 0.5746±0.3958 0.5037± 0.3415 0.2417± 0.3334 0.1464± 0.1563 0.1603± 0.1135
EC2 0.8986± 0.6425 0.6405± 0.8291 0.6781± 0.5757 0.0761± 0.6740 0.3528±0.3356 0.2995± 0.2992 0.3185± 0.2508 0.1419± 0.1765 0.1763± 0.1427
EC3 0.0536± 0.3599 0.0000± 0.1785 0.0000± 0.1522 0.0000± 0.5425 0.0000±0.1947 0.0000± 0.1884 0.0000± 0.0895 0.0000± 0.0467 0.0000± 0.0411
EC 2.3505± 1.7110 1.6769± 1.7264 1.7896± 1.2710 0.2038± 2.5200 0.3684±1.1323 0.3453± 1.0295 0.0115± 0.8716 0.0136± 0.5927 0.0132± 0.4817
TC 18.2169± 3.6461 16.2621± 8.2100 16.4052± 6.2533 19.9639± 18.6994 5.2882±3.1425 8.1060± 4.4058 7.9178± 2.8357 3.9682± 4.6350 4.7175± 3.1471
Na 0.0358± 0.2012 0.0136± 0.1085 0.0199± 0.0947 0.0612± 0.4320 0.0373±0.1237 0.0421± 0.1295 0.0657± 0.0796 0.0436± 0.0354 0.0482± 0.0438
Mg 0.3072± 0.0830 0.2474± 0.0988 0.2603± 0.0908 0.1161± 0.1716 0.1417±0.1138 0.1405± 0.0561 0.7056± 0.0586 0.3880± 0.0372 0.4625± 0.0324
Al 2.5891± 0.5548 3.9558± 1.3396 3.5633± 0.9495 3.0922± 0.7519 4.4543±1.3835 4.1799± 1.0924 4.8185± 0.3429 7.0440± 2.1544 6.5193± 1.6422
Si 8.6604± 2.2933 13.6808± 5.5603 12.2295± 4.0591 29.3881± 2.5233 50.0467±16.7039 45.9004± 13.3172 17.3734± 1.3302 23.6443± 7.6731 22.1809± 5.8855
P 0.1007± 0.1079 0.1194± 0.0952 0.1133± 0.0988 0.0029± 0.0534 0.0131±0.0767 0.0107± 0.0619 0.0565± 0.0312 0.0797± 0.0392 0.0742± 0.0377
S 0.6212± 0.1196 0.5858± 0.2182 0.5897± 0.1613 0.1838± 0.0819 0.0765±0.0610 0.0987± 0.0621 0.0693± 0.0264 0.0668± 0.0357 0.0675± 0.0333
Cl 0.0221± 0.0962 0.0231± 0.1922 0.0219± 0.1453 0.0324± 0.0837 0.0182±0.0489 0.0209± 0.0421 0.0012± 0.0574 0.0000± 0.1125 0.0000± 0.0862
K 0.8377± 0.2589 0.9716± 0.3582 0.9314± 0.3168 1.3156± 0.7827 1.5608±0.7629 1.5096± 0.7596 1.8098± 0.2230 1.9312± 0.4068 1.9003± 0.3125
Ca 16.4838± 1.8273 23.5120± 4.3578 21.7346± 3.2736 4.0857± 1.3142 3.5428±0.8812 3.6899± 0.6085 10.1650± 1.4324 13.5759± 2.4420 12.7807± 1.8502
Ti 0.3082± 0.1626 0.2422± 0.0937 0.2564± 0.0796 0.4853± 0.3506 0.5949±0.1443 0.5756± 0.1180 0.3770± 0.0636 0.3233± 0.0367 0.3360± 0.0317
V 0.0065± 0.0686 0.0055± 0.0435 0.0053± 0.0360 0.0022± 0.1505 0.0090±0.0541 0.0076± 0.0522 0.0095± 0.0273 0.0086± 0.0196 0.0089± 0.0162
Cr 0.0098± 0.0154 0.0088± 0.0102 0.0088± 0.0083 0.0105± 0.0350 0.0063±0.0120 0.0072± 0.0118 0.0031± 0.0067 0.0025± 0.0054 0.0026± 0.0045
Mn 0.0443± 0.0105 0.0388± 0.0070 0.0399± 0.0060 0.0951± 0.0230 0.0614±0.0091 0.0685± 0.0086 0.0677± 0.0336 0.0605± 0.0268 0.0621± 0.0281
Fe 3.3420± 0.4743 2.5720± 0.5403 2.7493± 0.5249 1.8994± 0.1669 1.5474±0.3233 1.6244± 0.2695 3.6725± 0.2611 3.1830± 0.2600 3.2951± 0.2112
Co 0.0000± 0.0509 0.0000± 0.0620 0.0000± 0.0462 0.0020± 0.0326 0.0000±0.0328 0.0000± 0.0269 0.0000± 0.0547 0.0000± 0.0668 0.0000± 0.0523
Ni 0.0039± 0.0063 0.0047± 0.0035 0.0045± 0.0030 0.0097± 0.0136 0.0011±0.0042 0.0027± 0.0042 0.0010± 0.0025 0.0016± 0.0015 0.0014± 0.0012
Cu 0.0284± 0.0098 0.0204± 0.0042 0.0219± 0.0041 0.0135± 0.0143 0.0051±0.0044 0.0067± 0.0045 0.0033± 0.0024 0.0026± 0.0011 0.0028± 0.0010
Zn 0.1680± 0.0426 0.1363± 0.0225 0.1429± 0.0264 0.0294± 0.0175 0.0151±0.0107 0.0180± 0.0117 0.0212± 0.0101 0.0161± 0.0090 0.0173± 0.0093
Ga 0.0003± 0.0122 0.0002± 0.0069 0.0001± 0.0059 0.0001± 0.0264 0.0004±0.0081 0.0003± 0.0082 0.0003± 0.0044 0.0006± 0.0020 0.0005± 0.0018
As 0.0013± 0.0153 0.0003± 0.0114 0.0005± 0.0092 0.0005± 0.0302 0.0005±0.0096 0.0006± 0.0097 0.0008± 0.0052 0.0010± 0.0026 0.0010± 0.0023
Se 0.0005± 0.0074 0.0001± 0.0041 0.0001± 0.0035 0.0003± 0.0159 0.0001±0.0049 0.0001± 0.0049 0.0003± 0.0026 0.0000± 0.0012 0.0000± 0.0011
Br 0.0020± 0.0070 0.0020± 0.0037 0.0019± 0.0033 0.0028± 0.0152 0.0013±0.0044 0.0016± 0.0046 0.0019± 0.0025 0.0008± 0.0010 0.0011± 0.0010
Rb 0.0048± 0.0063 0.0046± 0.0035 0.0047± 0.0030 0.0076± 0.0140 0.0076±0.0043 0.0076± 0.0044 0.0091± 0.0024 0.0090± 0.0013 0.0090± 0.0011
194
J.C.Chowet
al./Chem
osphere
54(2004)185–208
Sr 0.0851± 0.0455 0.0714± 0.0312 0.0742±0.0336 0.0128± 0.0153 0.0129± 0.0048 0.0129± 0.0048 0.0411± 0.0091 0.0459± 0.0121 0.0449± 0.0114
Y 0.0016± 0.0087 0.0019± 0.0048 0.0018±0.0041 0.0032± 0.0187 0.0028± 0.0057 0.0029± 0.0058 0.0036± 0.0030 0.0033± 0.0014 0.0034± 0.0013
Zr 0.0090± 0.0102 0.0089± 0.0058 0.0088±0.0050 0.0151± 0.0220 0.0207± 0.0070 0.0196± 0.0070 0.0155± 0.0039 0.0147± 0.0021 0.0149± 0.0018
Mo 0.0018± 0.0182 0.0015± 0.0099 0.0010±0.0086 0.0009± 0.0392 0.0017± 0.0118 0.0016± 0.0121 0.0007± 0.0065 0.0005± 0.0029 0.0004± 0.0027
Pd 0.0000± 0.0572 0.0000± 0.0318 0.0000±0.0273 0.0000± 0.1232 0.0000± 0.0379 0.0000± 0.0385 0.0000± 0.0206 0.0000± 0.0094 0.0000± 0.0087
Ag 0.0011± 0.0690 0.0002± 0.0383 0.0002±0.0329 0.0000± 0.1488 0.0032± 0.0456 0.0026± 0.0465 0.0006± 0.0249 0.0002± 0.0113 0.0002± 0.0104
Cd 0.0007± 0.0733 0.0006± 0.0407 0.0005±0.0350 0.0000± 0.1581 0.0019± 0.0484 0.0015± 0.0494 0.0006± 0.0264 0.0002± 0.0120 0.0002± 0.0110
In 0.0004± 0.0819 0.0000± 0.0455 0.0000±0.0391 0.0000± 0.1768 0.0000± 0.0541 0.0000± 0.0552 0.0000± 0.0295 0.0000± 0.0134 0.0000± 0.0123
Sn 0.0070± 0.1040 0.0040± 0.0581 0.0046±0.0498 0.0191± 0.2241 0.0063± 0.0685 0.0090± 0.0699 0.0023± 0.0374 0.0033± 0.0168 0.0031± 0.0156
Sb 0.0102± 0.1184 0.0032± 0.0655 0.0049±0.0563 0.0255± 0.2552 0.0000± 0.0783 0.0000± 0.0798 0.0011± 0.0425 0.0014± 0.0192 0.0012± 0.0178
Ba 0.1703± 0.4115 0.1088± 0.2275 0.1237±0.1957 0.1904± 0.8908 0.0328± 0.2717 0.0608± 0.2776 0.0480± 0.1492 0.0502± 0.0657 0.0495± 0.0612
La 0.0262± 0.1438 0.0082± 0.2088 0.0102±0.1498 0.1790± 0.2942 0.0011± 0.2470 0.0057± 0.2074 0.0102± 0.0517 0.0079± 0.0620 0.0082± 0.0477
Au 0.0005± 0.0073 0.0000± 0.0098 0.0000±0.0073 0.0075± 0.0101 0.0000± 0.0088 0.0000± 0.0074 0.0002± 0.0019 0.0000± 0.0024 0.0000± 0.0018
Hg 0.0004± 0.0042 0.0002± 0.0061 0.0002±0.0044 0.0001± 0.0082 0.0019± 0.0071 0.0016± 0.0059 0.0005± 0.0015 0.0000± 0.0018 0.0001± 0.0014
Tl 0.0002± 0.0042 0.0009± 0.0060 0.0007±0.0043 0.0018± 0.0081 0.0000± 0.0068 0.0001± 0.0057 0.0011± 0.0015 0.0001± 0.0018 0.0002± 0.0014
Pb 0.0396± 0.0100 0.0397± 0.0117 0.0391±0.0104 0.0184± 0.0166 0.0104± 0.0105 0.0120± 0.0115 0.0071± 0.0055 0.0051± 0.0049 0.0056± 0.0050
U 0.0004± 0.0040 0.0008± 0.0058 0.0007±0.0042 0.0007± 0.0078 0.0005± 0.0069 0.0005± 0.0058 0.0013± 0.0019 0.0003± 0.0023 0.0004± 0.0018
SO2 0.0000± 0.0000 0.0000± 0.0000 0.0000±0.0000 0.0000± 0.0000 0.0000± 0.0000 0.0000± 0.0000 0.0000± 0.0000 0.0000± 0.0000 0.0000± 0.0000
NH3 0.0000± 0.0000 0.0000± 0.0000 0.0000±0.0000 0.0000± 0.0000 0.0000± 0.0000 0.0000± 0.0000 0.0000± 0.0000 0.0000± 0.0000 0.0000± 0.0000
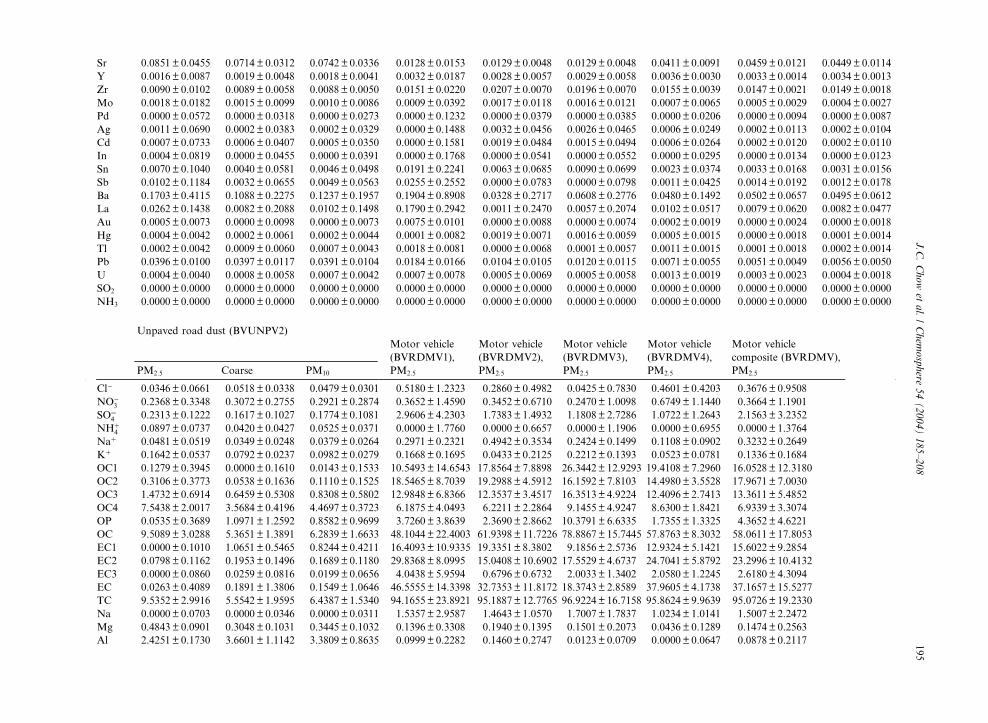
Unpaved road dust (BVUNPV2)
Motor vehicle
(BVRDMV1),
PM2:5
Motor vehicle
(BVRDMV2),
PM2:5
Motor vehicle
(BVRDMV3),
PM2:5
Motor vehicle
(BVRDMV4),
PM2:5
Motor vehicle
composite (BVRDMV),
PM2:5PM2:5 Coarse PM10
Cl� 0.0346± 0.0661 0.0518± 0.0338 0.0479±0.0301 0.5180± 1.2323 0.2860± 0.4982 0.0425± 0.7830 0.4601± 0.4203 0.3676± 0.9508
NO�3 0.2368± 0.3348 0.3072± 0.2755 0.2921±0.2874 0.3652± 1.4590 0.3452± 0.6710 0.2470± 1.0098 0.6749± 1.1440 0.3664± 1.1901
SO¼4 0.2313± 0.1222 0.1617± 0.1027 0.1774±0.1081 2.9606± 4.2303 1.7383± 1.4932 1.1808± 2.7286 1.0722± 1.2643 2.1563± 3.2352
NHþ4 0.0897± 0.0737 0.0420± 0.0427 0.0525±0.0371 0.0000± 1.7760 0.0000± 0.6657 0.0000± 1.1906 0.0000± 0.6955 0.0000± 1.3764
Naþ 0.0481± 0.0519 0.0349± 0.0248 0.0379±0.0264 0.2971± 0.2321 0.4942± 0.3534 0.2424± 0.1499 0.1108± 0.0902 0.3232± 0.2649
Kþ 0.1642± 0.0537 0.0792± 0.0237 0.0982±0.0279 0.1668± 0.1695 0.0433± 0.2125 0.2212± 0.1393 0.0523± 0.0781 0.1336± 0.1684
OC1 0.1279± 0.3945 0.0000± 0.1610 0.0143±0.1533 10.5493± 14.6543 17.8564± 7.8898 26.3442± 12.9293 19.4108± 7.2960 16.0528± 12.3180
OC2 0.3106± 0.3773 0.0538± 0.1636 0.1110±0.1525 18.5465± 8.7039 19.2988± 4.5912 16.1592± 7.8103 14.4980± 3.5528 17.9671± 7.0030
OC3 1.4732± 0.6914 0.6459± 0.5308 0.8308±0.5802 12.9848± 6.8366 12.3537± 3.4517 16.3513± 4.9224 12.4096± 2.7413 13.3611± 5.4852
OC4 7.5438± 2.0017 3.5684± 0.4196 4.4697±0.3723 6.1875± 4.0493 6.2211± 2.2864 9.1455± 4.9247 8.6300± 1.8421 6.9339± 3.3074
OP 0.0535± 0.3689 1.0971± 1.2592 0.8582±0.9699 3.7260± 3.8639 2.3690± 2.8662 10.3791± 6.6335 1.7355± 1.3325 4.3652± 4.6221
OC 9.5089± 3.0288 5.3651± 1.3891 6.2839±1.6633 48.1044± 22.4003 61.9398± 11.7226 78.8867± 15.7445 57.8763± 8.3032 58.0611± 17.8053
EC1 0.0000± 0.1010 1.0651± 0.5465 0.8244±0.4211 16.4093± 10.9335 19.3351± 8.3802 9.1856± 2.5736 12.9324± 5.1421 15.6022± 9.2854
EC2 0.0798± 0.1162 0.1953± 0.1496 0.1689±0.1180 29.8368± 8.0995 15.0408± 10.6902 17.5529± 4.6737 24.7041± 5.8792 23.2996± 10.4132
EC3 0.0000± 0.0860 0.0259± 0.0816 0.0199±0.0656 4.0438± 5.9594 0.6796± 0.6732 2.0033± 1.3402 2.0580± 1.2245 2.6180± 4.3094
EC 0.0263± 0.4089 0.1891± 1.3806 0.1549±1.0646 46.5555± 14.3398 32.7353± 11.8172 18.3743± 2.8589 37.9605± 4.1738 37.1657± 15.5277
TC 9.5352± 2.9916 5.5542± 1.9595 6.4387±1.5340 94.1655± 23.8921 95.1887± 12.7765 96.9224± 16.7158 95.8624± 9.9639 95.0726± 19.2330
Na 0.0000± 0.0703 0.0000± 0.0346 0.0000±0.0311 1.5357± 2.9587 1.4643± 1.0570 1.7007± 1.7837 1.0234± 1.0141 1.5007± 2.2472
Mg 0.4843± 0.0901 0.3048± 0.1031 0.3445±0.1032 0.1396± 0.3308 0.1940± 0.1395 0.1501± 0.2073 0.0436± 0.1289 0.1474± 0.2563
Al 2.4251± 0.1730 3.6601± 1.1142 3.3809±0.8635 0.0999± 0.2282 0.1460± 0.2747 0.0123± 0.0709 0.0000± 0.0647 0.0878± 0.2117
J.C.Chowet
al./Chem
osphere
54(2004)185–208
195

Table 3 (continued)
Unpaved road dust (BVUNPV2)
Motor vehicle
(BVRDMV1),
Motor vehicle
(BVRDMV2),
Motor vehicle
(BVRDMV3),
Mo r vehicle
(BV DMV4),
Motor vehicle
composite (BVRDMV),
PM2:5 Coarse PM10 PM2:5 PM2:5 PM2:5 PM PM2:5
Si 7.7908± 0.6772 11.5266± 3.7007 10.6855± 2.8749 0.3575± 0.3502 0.3564± 0.5285 0.2967± 0.1820 0.3 1± 0.1740 0.3430±0.3707
P 0.0427± 0.0303 0.0529± 0.0267 0.0506± 0.0273 0.0089± 0.0884 0.0000± 0.0433 0.0000± 0.0494 0.0 0± 0.0311 0.0042±0.0685
S 0.1522± 0.0167 0.1738± 0.0614 0.1689± 0.0478 1.6162± 1.4715 1.3533± 0.9329 0.8334± 0.8696 0.7 6± 0.3345 1.3358±1.1940
Cl 0.0000± 0.1243 0.0000± 0.2336 0.0000± 0.1841 0.0000± 0.2517 0.0763± 0.1634 0.0000± 0.1549 0.0 0± 0.0783 0.0202±0.1949
K 0.8706± 0.1790 1.0375± 0.3973 0.9987± 0.3461 0.0000± 0.1258 0.0020± 0.0792 0.0000± 0.0695 0.0 0± 0.0426 0.0005±0.1006
Ca 24.0198± 1.7061 29.8027± 5.2089 28.5589± 4.0727 0.0369± 0.7585 0.4648± 0.7276 0.0000± 0.3500 0.7 2± 0.7775 0.2105±0.6048
Ti 0.1607± 0.0541 0.1283± 0.0397 0.1351± 0.0303 0.0618± 0.2689 0.0300± 0.2143 0.0169± 0.1816 0.0 2± 0.0954 0.0419±0.2298
V 0.0037± 0.0283 0.0071± 0.0277 0.0061± 0.0227 0.0307± 0.1188 0.0247± 0.0911 0.0088± 0.0787 0.0 5± 0.0454 0.0234±0.1005
Cr 0.0046± 0.0056 0.0051± 0.0045 0.0049± 0.0037 0.0361± 0.0543 0.0028± 0.0201 0.0062± 0.0128 0.0 5± 0.0237 0.0209±0.0403
Mn 0.0209± 0.0070 0.0192± 0.0032 0.0195± 0.0041 0.0278± 0.0228 0.0237± 0.0130 0.0471± 0.0195 0.0 7± 0.0066 0.0295±0.0202
Fe 1.6978± 0.1207 1.5336± 0.1964 1.5683± 0.1511 0.7203± 0.3612 0.5032± 0.4537 0.4451± 0.0944 0.6 3± 0.1216 0.6096±0.3545
Co 0.0000± 0.0254 0.0000± 0.0310 0.0000± 0.0248 0.0037± 0.0437 0.0017± 0.0357 0.0028± 0.0196 0.0 4± 0.0267 0.0027±0.0370
Ni 0.0047± 0.0020 0.0100± 0.0010 0.0088± 0.0009 0.0401± 0.0794 0.0056± 0.0089 0.0062± 0.0074 0.0 7± 0.0375 0.0248±0.0572
Cu 0.0030± 0.0021 0.0025± 0.0009 0.0026± 0.0008 0.0393± 0.0147 0.0468± 0.0453 0.0309± 0.0128 0.0 1± 0.0150 0.0409±0.0258
Zn 0.0131± 0.0023 0.0100± 0.0011 0.0106± 0.0010 0.3324± 0.3322 0.2282± 0.1651 0.1746± 0.0593 0.2 9± 0.0819 0.2657±0.2492
Ga 0.0000± 0.0039 0.0000± 0.0016 0.0000± 0.0015 0.0007± 0.0375 0.0002± 0.0196 0.0007± 0.0251 0.0 6± 0.0129 0.0006±0.0298
As 0.0010± 0.0045 0.0011± 0.0017 0.0010± 0.0017 0.0030± 0.0218 0.0001± 0.0215 0.0012± 0.0142 0.0 0± 0.0092 0.0019±0.0197
Se 0.0004± 0.0024 0.0000± 0.0010 0.0000± 0.0009 0.0017± 0.0092 0.0008± 0.0097 0.0034± 0.0057 0.0 4± 0.0034 0.0018±0.0085
Br 0.0063± 0.0041 0.0074± 0.0069 0.0072± 0.0063 0.0275± 0.0182 0.0160± 0.0092 0.0206± 0.0141 0.0 4± 0.0035 0.0224±0.0150
Rb 0.0043± 0.0020 0.0045± 0.0009 0.0044± 0.0008 0.0001± 0.0101 0.0011± 0.0087 0.0007± 0.0068 0.0 4± 0.0037 0.0005±0.0088
Sr 0.0477± 0.0156 0.0508± 0.0187 0.0502± 0.0180 0.0435± 0.1234 0.0000± 0.0097 0.0000± 0.0071 0.0 0± 0.0040 0.0205±0.0860
Y 0.0022± 0.0027 0.0019± 0.0011 0.0019± 0.0010 0.0001± 0.0145 0.0005± 0.0119 0.0013± 0.0096 0.0 3± 0.0055 0.0004±0.0125
Zr 0.0083± 0.0033 0.0075± 0.0032 0.0076± 0.0014 0.0044± 0.2947 0.0021± 0.0970 0.0019± 0.1980 0.0 5± 0.0957 0.0032±0.2260
Mo 0.0008± 0.0058 0.0000± 0.0023 0.0000± 0.0022 0.0007± 0.0311 0.0005± 0.0249 0.0008± 0.0205 0.0 4± 0.0112 0.0009±0.0266
Pd 0.0000± 0.0183 0.0000± 0.0074 0.0000± 0.0071 0.0064± 0.0668 0.0002± 0.0744 0.0103± 0.0467 0.0 0± 0.0280 0.0049±0.0634
Ag 0.0012± 0.0220 0.0000± 0.0088 0.0000± 0.0084 0.0047± 0.0800 0.0024± 0.0899 0.0113± 0.0559 0.0 9± 0.0340 0.0050±0.0762
Cd 0.0002± 0.0234 0.0000± 0.0093 0.0000± 0.0090 0.0022± 0.0840 0.0039± 0.0953 0.0027± 0.0587 0.0 0± 0.0356 0.0026±0.0802
In 0.0000± 0.0262 0.0000± 0.0104 0.0000± 0.0100 0.0229± 0.0969 0.0067± 0.1068 0.0263± 0.0666 0.0 2± 0.0408 0.0178±0.0915
Sn 0.0033± 0.0331 0.0029± 0.0129 0.0029± 0.0124 0.0239± 0.1374 0.0088± 0.1367 0.0204± 0.0924 0.0 6± 0.0559 0.0174±0.1250
Sb 0.0013± 0.0377 0.0011± 0.0149 0.0011± 0.0143 0.0326± 0.1584 0.0111± 0.1559 0.0131± 0.1078 0.0 4± 0.0634 0.0206±0.1437
Ba 0.2883± 0.3178 0.3459± 0.4302 0.3341± 0.4062 0.0481± 0.6922 0.0086± 0.5764 0.0606± 0.4566 0.0 7± 0.2650 0.0357±0.5970
La 0.0258± 0.0468 0.0008± 0.0497 0.0050± 0.0401 0.0263± 0.9237 0.0171± 0.3496 0.0174± 0.5996 0.0 9± 0.2986 0.0216±0.7108
Au 0.0004± 0.0017 0.0000± 0.0019 0.0000± 0.0015 0.0012± 0.0412 0.0033± 0.0178 0.0016± 0.0266 0.0 2± 0.0150 0.0020±0.0320
Hg 0.0004± 0.0014 0.0000± 0.0015 0.0000± 0.0012 0.0013± 0.0185 0.0002± 0.0078 0.0010± 0.0123 0.0 0± 0.0054 0.0008±0.0144
Tl 0.0006± 0.0014 0.0001± 0.0015 0.0002± 0.0012 0.0002± 0.0183 0.0000± 0.0078 0.0000± 0.0123 0.0 0± 0.0054 0.0001±0.0142
Pb 0.0054± 0.0008 0.0031± 0.0016 0.0035± 0.0013 0.0248± 0.0372 0.0456± 0.0465 0.0130± 0.0176 0.0 1± 0.0081 0.0279±0.0362
U 0.0009± 0.0014 0.0000± 0.0016 0.0000± 0.0013 0.0009± 0.0257 0.0000± 0.0097 0.0018± 0.0163 0.0 4± 0.0081 0.0008±0.0197
196
J.C.Chowet
al./Chem
osphere
54(2004)185–208
to
R
2:5
18
00
92
00
00
94
21
09
23
20
67
00
37
51
04
00
03
02
18
00
00
00
02
03
00
01
00
07
02
00
00
18
03
00
00
21
00
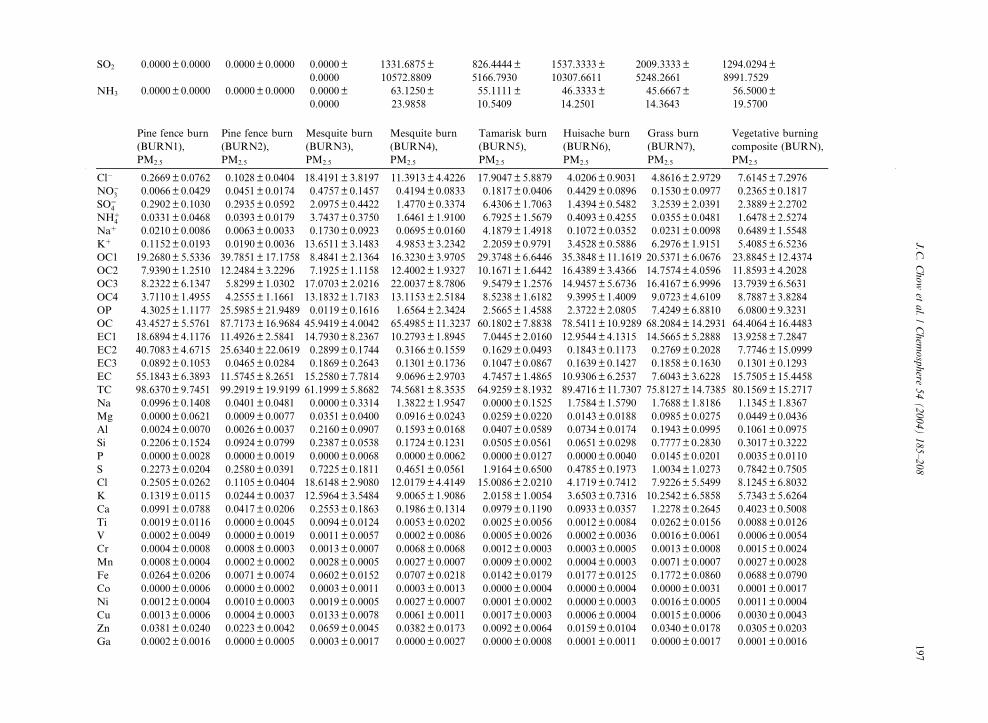
SO2 0.0000± 0.0000 0.0000± 0.0000 0.0000±
0.0000
1331.6875±
10572.8809
826.4444±
5166.7930
1537.3333±
10307.6611
2009.3333±
5248.2661
1294.0294±
8991.7529
NH3 0.0000± 0.0000 0.0000± 0.0000 0.0000±
0.0000
63.1250±
23.9858
55.1111±
10.5409
46.3333±
14.2501
45.6667±
14.3643
56.5000±
19.5700
Pine fence burn
(BURN1),
PM2:5
Pine fence burn
(BURN2),
PM2:5
Mesquite burn
(BURN3),
PM2:5
Mesquite burn
(BURN4),
PM2:5
Tamarisk burn
(BURN5),
PM2:5
Huisache burn
(BURN6),
PM2:5
Grass burn
(BURN7),
PM2:5
Vegetative burning
composite (BURN),
PM2:5
Cl� 0.2669± 0.0762 0.1028± 0.0404 18.4191± 3.8197 11.3913± 4.4226 17.9047± 5.8879 4.0206±0.9031 4.8616± 2.9729 7.6145± 7.2976
NO�3 0.0066± 0.0429 0.0451± 0.0174 0.4757± 0.1457 0.4194± 0.0833 0.1817± 0.0406 0.4429±0.0896 0.1530± 0.0977 0.2365± 0.1817
SO¼4 0.2902± 0.1030 0.2935± 0.0592 2.0975± 0.4422 1.4770± 0.3374 6.4306± 1.7063 1.4394±0.5482 3.2539± 2.0391 2.3889± 2.2702
NHþ4 0.0331± 0.0468 0.0393± 0.0179 3.7437± 0.3750 1.6461± 1.9100 6.7925± 1.5679 0.4093±0.4255 0.0355± 0.0481 1.6478± 2.5274
Naþ 0.0210± 0.0086 0.0063± 0.0033 0.1730± 0.0923 0.0695± 0.0160 4.1879± 1.4918 0.1072±0.0352 0.0231± 0.0098 0.6489± 1.5548
Kþ 0.1152± 0.0193 0.0190± 0.0036 13.6511± 3.1483 4.9853± 3.2342 2.2059± 0.9791 3.4528±0.5886 6.2976± 1.9151 5.4085± 6.5236
OC1 19.2680± 5.5336 39.7851± 17.1758 8.4841± 2.1364 16.3230± 3.9705 29.3748± 6.6446 35.3848±11.1619 20.5371± 6.0676 23.8845± 12.4374
OC2 7.9390± 1.2510 12.2484± 3.2296 7.1925± 1.1158 12.4002± 1.9327 10.1671± 1.6442 16.4389±3.4366 14.7574± 4.0596 11.8593± 4.2028
OC3 8.2322± 6.1347 5.8299± 1.0302 17.0703± 2.0216 22.0037± 8.7806 9.5479± 1.2576 14.9457±5.6736 16.4167± 6.9996 13.7939± 6.5631
OC4 3.7110± 1.4955 4.2555± 1.1661 13.1832± 1.7183 13.1153± 2.5184 8.5238± 1.6182 9.3995±1.4009 9.0723± 4.6109 8.7887± 3.8284
OP 4.3025± 1.1177 25.5985± 21.9489 0.0119± 0.1616 1.6564± 2.3424 2.5665± 1.4588 2.3722±2.0805 7.4249± 6.8810 6.0800± 9.3231
OC 43.4527± 5.5761 87.7173± 16.9684 45.9419± 4.0042 65.4985± 11.3237 60.1802± 7.8838 78.5411±10.9289 68.2084± 14.2931 64.4064± 16.4483
EC1 18.6894± 4.1176 11.4926± 2.5841 14.7930± 8.2367 10.2793± 1.8945 7.0445± 2.0160 12.9544±4.1315 14.5665± 5.2888 13.9258± 7.2847
EC2 40.7083± 4.6715 25.6340± 22.0619 0.2899± 0.1744 0.3166± 0.1559 0.1629± 0.0493 0.1843±0.1173 0.2769± 0.2028 7.7746± 15.0999
EC3 0.0892± 0.1053 0.0465± 0.0284 0.1869± 0.2643 0.1301± 0.1736 0.1047± 0.0867 0.1639±0.1427 0.1858± 0.1630 0.1301± 0.1293
EC 55.1843± 6.3893 11.5745± 8.2651 15.2580± 7.7814 9.0696± 2.9703 4.7457± 1.4865 10.9306±6.2537 7.6043± 3.6228 15.7505± 15.4458
TC 98.6370± 9.7451 99.2919± 19.9199 61.1999± 5.8682 74.5681± 8.3535 64.9259± 8.1932 89.4716±11.7307 75.8127± 14.7385 80.1569± 15.2717
Na 0.0996± 0.1408 0.0401± 0.0481 0.0000± 0.3314 1.3822± 1.9547 0.0000± 0.1525 1.7584±1.5790 1.7688± 1.8186 1.1345± 1.8367
Mg 0.0000± 0.0621 0.0009± 0.0077 0.0351± 0.0400 0.0916± 0.0243 0.0259± 0.0220 0.0143±0.0188 0.0985± 0.0275 0.0449± 0.0436
Al 0.0024± 0.0070 0.0026± 0.0037 0.2160± 0.0907 0.1593± 0.0168 0.0407± 0.0589 0.0734±0.0174 0.1943± 0.0995 0.1061± 0.0975
Si 0.2206± 0.1524 0.0924± 0.0799 0.2387± 0.0538 0.1724± 0.1231 0.0505± 0.0561 0.0651±0.0298 0.7777± 0.2830 0.3017± 0.3222
P 0.0000± 0.0028 0.0000± 0.0019 0.0000± 0.0068 0.0000± 0.0062 0.0000± 0.0127 0.0000±0.0040 0.0145± 0.0201 0.0035± 0.0110
S 0.2273± 0.0204 0.2580± 0.0391 0.7225± 0.1811 0.4651± 0.0561 1.9164± 0.6500 0.4785±0.1973 1.0034± 1.0273 0.7842± 0.7505
Cl 0.2505± 0.0262 0.1105± 0.0404 18.6148± 2.9080 12.0179± 4.4149 15.0086± 2.0210 4.1719±0.7412 7.9226± 5.5499 8.1245± 6.8032
K 0.1319± 0.0115 0.0244± 0.0037 12.5964± 3.5484 9.0065± 1.9086 2.0158± 1.0054 3.6503±0.7316 10.2542± 6.5858 5.7343± 5.6264
Ca 0.0991± 0.0788 0.0417± 0.0206 0.2553± 0.1863 0.1986± 0.1314 0.0979± 0.1190 0.0933±0.0357 1.2278± 0.2645 0.4023± 0.5008
Ti 0.0019± 0.0116 0.0000± 0.0045 0.0094± 0.0124 0.0053± 0.0202 0.0025± 0.0056 0.0012±0.0084 0.0262± 0.0156 0.0088± 0.0126
V 0.0002± 0.0049 0.0000± 0.0019 0.0011± 0.0057 0.0002± 0.0086 0.0005± 0.0026 0.0002±0.0036 0.0016± 0.0061 0.0006± 0.0054
Cr 0.0004± 0.0008 0.0008± 0.0003 0.0013± 0.0007 0.0068± 0.0068 0.0012± 0.0003 0.0003±0.0005 0.0013± 0.0008 0.0015± 0.0024
Mn 0.0008± 0.0004 0.0002± 0.0002 0.0028± 0.0005 0.0027± 0.0007 0.0009± 0.0002 0.0004±0.0003 0.0071± 0.0007 0.0027± 0.0028
Fe 0.0264± 0.0206 0.0071± 0.0074 0.0602± 0.0152 0.0707± 0.0218 0.0142± 0.0179 0.0177±0.0125 0.1772± 0.0860 0.0688± 0.0790
Co 0.0000± 0.0006 0.0000± 0.0002 0.0003± 0.0011 0.0003± 0.0013 0.0000± 0.0004 0.0000±0.0004 0.0000± 0.0031 0.0001± 0.0017
Ni 0.0012± 0.0004 0.0010± 0.0003 0.0019± 0.0005 0.0027± 0.0007 0.0001± 0.0002 0.0000±0.0003 0.0016± 0.0005 0.0011± 0.0004
Cu 0.0013± 0.0006 0.0004± 0.0003 0.0133± 0.0078 0.0061± 0.0011 0.0017± 0.0003 0.0006±0.0004 0.0015± 0.0006 0.0030± 0.0043
Zn 0.0381± 0.0240 0.0223± 0.0042 0.0659± 0.0045 0.0382± 0.0173 0.0092± 0.0064 0.0159±0.0104 0.0340± 0.0178 0.0305± 0.0203
Ga 0.0002± 0.0016 0.0000± 0.0005 0.0003± 0.0017 0.0000± 0.0027 0.0000± 0.0008 0.0001±0.0011 0.0000± 0.0017 0.0001± 0.0016
J.C.Chowet
al./Chem
osphere
54(2004)185–208
197

Table 3 (continued)
Pine fence burn
(BURN1),
PM2:5
Pine fence burn
(BURN2),
PM2:5
Mesquite burn
(BURN3),
PM2:5
Mesquite burn
(BURN4),
PM2:5
Tamarisk burn
(BURN5),
PM2:5
Huisache burn
(BURN6),
PM2:5
Grass burn
(BURN7),
PM2:5
Vegetative burning
composite (BURN),
PM2:5
As 0.2198± 0.1252 0.0134±0.0081 0.0000± 0.0016 0.0003± 0.0013 0.0044± 0.0006 0.0002± 0.0007 0.0009± 0.0008 0.0243±0.0711
Se 0.0000± 0.0005 0.0000±0.0002 0.0036± 0.0004 0.0009± 0.0006 0.0031± 0.0003 0.0009± 0.0002 0.0002± 0.0004 0.0012±0.0004
Br 0.0000± 0.0053 0.0021±0.0004 0.1964± 0.0282 0.0966± 0.0347 0.2148± 0.0678 0.0248± 0.0129 0.0443± 0.0395 0.0827±0.0900
Rb 0.0003± 0.0007 0.0000±0.0002 0.0112± 0.0025 0.0063± 0.0014 0.0035± 0.0078 0.0037± 0.0005 0.0028± 0.0008 0.0037±0.0035
Sr 0.0003± 0.0004 0.0001±0.0002 0.0033± 0.0005 0.0032± 0.0007 0.0007± 0.0002 0.0017± 0.0003 0.0218± 0.0067 0.0064±0.0094
Y 0.0000± 0.0006 0.0000±0.0002 0.0009± 0.0013 0.0004± 0.0011 0.0002± 0.0012 0.0000± 0.0005 0.0000± 0.0008 0.0001±0.0009
Zr 0.0000± 0.0124 0.0000±0.0043 0.0014± 0.0142 0.0008± 0.0218 0.0002± 0.0059 0.0009± 0.0089 0.0029± 0.0128 0.0012±0.0129
Mo 0.0000± 0.0012 0.0000±0.0005 0.0010± 0.0012 0.0002± 0.0021 0.0000± 0.0007 0.0000± 0.0009 0.0000± 0.0016 0.0001±0.0013
Pd 0.0000± 0.0024 0.0000±0.0009 0.0014± 0.0024 0.0000± 0.0043 0.0000± 0.0012 0.0000± 0.0017 0.0000± 0.0029 0.0001±0.0026
Ag 0.0001± 0.0030 0.0002±0.0011 0.0009± 0.0034 0.0000± 0.0053 0.0000± 0.0015 0.0007± 0.0021 0.0008± 0.0035 0.0004±0.0032
Cd 0.0025± 0.0031 0.0006±0.0012 0.0015± 0.0034 0.0000± 0.0053 0.0026± 0.0014 0.0005± 0.0022 0.0003± 0.0036 0.0010±0.0033
In 0.0012± 0.0036 0.0002±0.0014 0.0023± 0.0039 0.0027± 0.0063 0.0003± 0.0018 0.0006± 0.0026 0.0007± 0.0043 0.0010±0.0039
Sn 0.0021± 0.0053 0.0000±0.0021 0.0010± 0.0062 0.0054± 0.0075 0.0008± 0.0028 0.0008± 0.0039 0.0013± 0.0064 0.0014±0.0055
Sb 0.0010± 0.0060 0.0004±0.0023 0.0007± 0.0070 0.0028± 0.0105 0.0001± 0.0031 0.0003± 0.0043 0.0010± 0.0073 0.0009±0.0066
Ba 0.0000± 0.0283 0.0019±0.0110 0.0000± 0.0321 0.0111± 0.0491 0.0027± 0.0146 0.0008± 0.0204 0.0022± 0.0345 0.0034±0.0307
La 0.0000± 0.0379 0.0011±0.0147 0.0000± 0.0430 0.0000± 0.0653 0.0012± 0.0195 0.0006± 0.0273 0.0000± 0.0459 0.0004±0.0410
Au 0.0001± 0.0022 0.0000±0.0010 0.0010± 0.0030 0.0000± 0.0031 0.0000± 0.0009 0.0002± 0.0013 0.0001± 0.0022 0.0002±0.0021
Hg 0.0000± 0.0011 0.0000±0.0003 0.0006± 0.0008 0.0008± 0.0012 0.0005± 0.0003 0.0008± 0.0004 0.0007± 0.0007 0.0005±0.0007
Tl 0.0000± 0.0070 0.0000±0.0005 0.0001± 0.0008 0.0002± 0.0012 0.0001± 0.0004 0.0000± 0.0005 0.0000± 0.0008 0.0000±0.0023
Pb 0.0105± 0.0088 0.0008±0.0004 0.0059± 0.0035 0.0015± 0.0018 0.0018± 0.0007 0.0016± 0.0008 0.0001± 0.0015 0.0025±0.0039
U 0.0000± 0.0011 0.0000±0.0004 0.0003± 0.0048 0.0000± 0.0030 0.0006± 0.0048 0.0000± 0.0011 0.0000± 0.0019 0.0001±0.0029
SO2 6.3073±
913.4648
5.9053±
320.1829
46.2498±
1045.7844
16.3571±
1615.0380
113.7057±
434.6846
27.5726±
654.9965
6.8115±
948.3355
32.6666±
951.5014
NH3 0.5203±
0.2220
1.6362±
0.3852
12.3088±
12.4892
34.7671±
4.2325
20.0665±
18.8168
25.6610±
17.7356
19.6718±
10.9509
16.1732±
14.7677
550 MW utility
coal-fired boiler
(CFPP1),
PM2:5
600 MW utility
coal-fired boiler
(CFPP2),
PM2:5
600 MW utility
coal-fired boiler
(CFPP3),
PM2:5
545 MW alumin-
um plant coal-fired
boiler (CFPP4),
PM2:5
550 MW utility
coal-fired boiler
(CFPP5),
PM2:5
550 MW utility
coal-fired boiler
(CFPP6),
PM2:5
Coal-firedboiler
composite
(CFPP),
PM2:5
Cl� 3.0578± 1.0603 0.3132±0.5237 0.0680± 0.1927 0.0287± 0.0616 1.1291± 2.4369 0.3017± 0.2130 0.8937± 1.5668
NO�3 2.5397± 1.0346 0.9998±0.6741 0.0735± 0.1819 0.0676± 0.0514 0.0904± 0.0844 0.0000± 0.0802 0.6865± 1.0917
SO¼4 11.4070± 2.0918 5.7416±1.9133 9.4809± 2.7967 45.6284± 18.6921 46.2367± 6.8494 62.2238± 12.5122 28.7433± 22.5634
NHþ4 0.6778± 0.6024 0.4654±0.5648 0.2780± 0.2759 0.6595± 0.2337 5.1146± 0.5016 5.3068± 0.5913 1.7887± 2.1280
Naþ 4.4339± 0.7313 0.4267±0.1073 0.5269± 0.2015 0.5770± 0.5289 0.1233± 0.0647 0.0719± 0.0168 1.1618± 1.6832
Kþ 0.5435± 0.1075 0.0946±0.0607 0.1168± 0.0387 0.2565± 0.1129 0.1009± 0.0207 0.1180± 0.0166 0.2247± 0.1809
OC1 22.0535± 10.6466 13.7789±8.0167 3.5677± 3.0068 0.0366± 0.3779 3.2015± 6.1608 0.0000± 0.9418 7.5339± 10.1529
OC2 16.0144± 5.4063 24.2508±8.3395 12.2643± 2.3013 1.0910± 0.7891 2.1621± 2.0245 0.0720± 0.5470 9.3705± 9.6312
OC3 12.8867± 4.1185 10.7561±6.1436 4.1661± 1.8714 0.8772± 0.3556 0.9090± 0.7468 0.0000± 0.4438 5.1512± 5.8271
OC4 6.5048± 2.3423 4.2146±2.1548 1.3902± 0.6525 1.1480± 0.3861 1.5422± 0.7923 0.1891± 0.2703 2.6892± 2.4109
OP 5.3910± 3.4418 2.6746±3.1625 1.4200± 1.8571 1.0172± 0.3889 2.4896± 0.9384 0.6664± 0.3168 2.4314± 2.5173
198
J.C.Chowet
al./Chem
osphere
54(2004)185–208
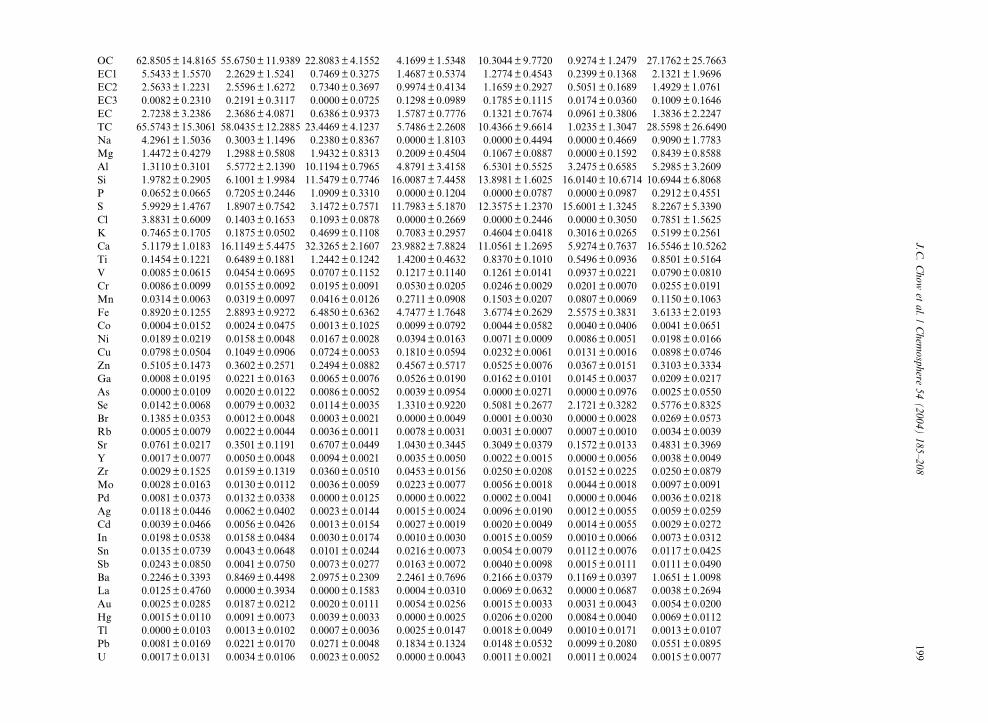
OC 62.8505± 14.8165 55.6750± 11.9389 22.8083± 4.1552 4.1699± 1.5348 10.3044± 9.7720 0.9274± 1.2479 27.1762±25.7663
EC1 5.5433± 1.5570 2.2629± 1.5241 0.7469± 0.3275 1.4687± 0.5374 1.2774± 0.4543 0.2399± 0.1368 2.1321±1.9696
EC2 2.5633± 1.2231 2.5596± 1.6272 0.7340± 0.3697 0.9974± 0.4134 1.1659± 0.2927 0.5051± 0.1689 1.4929±1.0761
EC3 0.0082± 0.2310 0.2191± 0.3117 0.0000± 0.0725 0.1298± 0.0989 0.1785± 0.1115 0.0174± 0.0360 0.1009±0.1646
EC 2.7238± 3.2386 2.3686± 4.0871 0.6386± 0.9373 1.5787± 0.7776 0.1321± 0.7674 0.0961± 0.3806 1.3836±2.2247
TC 65.5743± 15.3061 58.0435± 12.2885 23.4469± 4.1237 5.7486± 2.2608 10.4366± 9.6614 1.0235± 1.3047 28.5598±26.6490
Na 4.2961± 1.5036 0.3003± 1.1496 0.2380± 0.8367 0.0000± 1.8103 0.0000± 0.4494 0.0000± 0.4669 0.9090±1.7783
Mg 1.4472± 0.4279 1.2988± 0.5808 1.9432± 0.8313 0.2009± 0.4504 0.1067± 0.0887 0.0000± 0.1592 0.8439±0.8588
Al 1.3110± 0.3101 5.5772± 2.1390 10.1194± 0.7965 4.8791± 3.4158 6.5301± 0.5525 3.2475± 0.6585 5.2985±3.2609
Si 1.9782± 0.2905 6.1001± 1.9984 11.5479± 0.7746 16.0087± 7.4458 13.8981± 1.6025 16.0140± 10.6714 10.6944±6.8068
P 0.0652± 0.0665 0.7205± 0.2446 1.0909± 0.3310 0.0000± 0.1204 0.0000± 0.0787 0.0000± 0.0987 0.2912±0.4551
S 5.9929± 1.4767 1.8907± 0.7542 3.1472± 0.7571 11.7983± 5.1870 12.3575± 1.2370 15.6001± 1.3245 8.2267±5.3390
Cl 3.8831± 0.6009 0.1403± 0.1653 0.1093± 0.0878 0.0000± 0.2669 0.0000± 0.2446 0.0000± 0.3050 0.7851±1.5625
K 0.7465± 0.1705 0.1875± 0.0502 0.4699± 0.1108 0.7083± 0.2957 0.4604± 0.0418 0.3016± 0.0265 0.5199±0.2561
Ca 5.1179± 1.0183 16.1149± 5.4475 32.3265± 2.1607 23.9882± 7.8824 11.0561± 1.2695 5.9274± 0.7637 16.5546±10.5262
Ti 0.1454± 0.1221 0.6489± 0.1881 1.2442± 0.1242 1.4200± 0.4632 0.8370± 0.1010 0.5496± 0.0936 0.8501±0.5164
V 0.0085± 0.0615 0.0454± 0.0695 0.0707± 0.1152 0.1217± 0.1140 0.1261± 0.0141 0.0937± 0.0221 0.0790±0.0810
Cr 0.0086± 0.0099 0.0155± 0.0092 0.0195± 0.0091 0.0530± 0.0205 0.0246± 0.0029 0.0201± 0.0070 0.0255±0.0191
Mn 0.0314± 0.0063 0.0319± 0.0097 0.0416± 0.0126 0.2711± 0.0908 0.1503± 0.0207 0.0807± 0.0069 0.1150±0.1063
Fe 0.8920± 0.1255 2.8893± 0.9272 6.4850± 0.6362 4.7477± 1.7648 3.6774± 0.2629 2.5575± 0.3831 3.6133±2.0193
Co 0.0004± 0.0152 0.0024± 0.0475 0.0013± 0.1025 0.0099± 0.0792 0.0044± 0.0582 0.0040± 0.0406 0.0041±0.0651
Ni 0.0189± 0.0219 0.0158± 0.0048 0.0167± 0.0028 0.0394± 0.0163 0.0071± 0.0009 0.0086± 0.0051 0.0198±0.0166
Cu 0.0798± 0.0504 0.1049± 0.0906 0.0724± 0.0053 0.1810± 0.0594 0.0232± 0.0061 0.0131± 0.0016 0.0898±0.0746
Zn 0.5105± 0.1473 0.3602± 0.2571 0.2494± 0.0882 0.4567± 0.5717 0.0525± 0.0076 0.0367± 0.0151 0.3103±0.3334
Ga 0.0008± 0.0195 0.0221± 0.0163 0.0065± 0.0076 0.0526± 0.0190 0.0162± 0.0101 0.0145± 0.0037 0.0209±0.0217
As 0.0000± 0.0109 0.0020± 0.0122 0.0086± 0.0052 0.0039± 0.0954 0.0000± 0.0271 0.0000± 0.0976 0.0025±0.0550
Se 0.0142± 0.0068 0.0079± 0.0032 0.0114± 0.0035 1.3310± 0.9220 0.5081± 0.2677 2.1721± 0.3282 0.5776±0.8325
Br 0.1385± 0.0353 0.0012± 0.0048 0.0003± 0.0021 0.0000± 0.0049 0.0001± 0.0030 0.0000± 0.0028 0.0269±0.0573
Rb 0.0005± 0.0079 0.0022± 0.0044 0.0036± 0.0011 0.0078± 0.0031 0.0031± 0.0007 0.0007± 0.0010 0.0034±0.0039
Sr 0.0761± 0.0217 0.3501± 0.1191 0.6707± 0.0449 1.0430± 0.3445 0.3049± 0.0379 0.1572± 0.0133 0.4831±0.3969
Y 0.0017± 0.0077 0.0050± 0.0048 0.0094± 0.0021 0.0035± 0.0050 0.0022± 0.0015 0.0000± 0.0056 0.0038±0.0049
Zr 0.0029± 0.1525 0.0159± 0.1319 0.0360± 0.0510 0.0453± 0.0156 0.0250± 0.0208 0.0152± 0.0225 0.0250±0.0879
Mo 0.0028± 0.0163 0.0130± 0.0112 0.0036± 0.0059 0.0223± 0.0077 0.0056± 0.0018 0.0044± 0.0018 0.0097±0.0091
Pd 0.0081± 0.0373 0.0132± 0.0338 0.0000± 0.0125 0.0000± 0.0022 0.0002± 0.0041 0.0000± 0.0046 0.0036±0.0218
Ag 0.0118± 0.0446 0.0062± 0.0402 0.0023± 0.0144 0.0015± 0.0024 0.0096± 0.0190 0.0012± 0.0055 0.0059±0.0259
Cd 0.0039± 0.0466 0.0056± 0.0426 0.0013± 0.0154 0.0027± 0.0019 0.0020± 0.0049 0.0014± 0.0055 0.0029±0.0272
In 0.0198± 0.0538 0.0158± 0.0484 0.0030± 0.0174 0.0010± 0.0030 0.0015± 0.0059 0.0010± 0.0066 0.0073±0.0312
Sn 0.0135± 0.0739 0.0043± 0.0648 0.0101± 0.0244 0.0216± 0.0073 0.0054± 0.0079 0.0112± 0.0076 0.0117±0.0425
Sb 0.0243± 0.0850 0.0041± 0.0750 0.0073± 0.0277 0.0163± 0.0072 0.0040± 0.0098 0.0015± 0.0111 0.0111±0.0490
Ba 0.2246± 0.3393 0.8469± 0.4498 2.0975± 0.2309 2.2461± 0.7696 0.2166± 0.0379 0.1169± 0.0397 1.0651±1.0098
La 0.0125± 0.4760 0.0000± 0.3934 0.0000± 0.1583 0.0004± 0.0310 0.0069± 0.0632 0.0000± 0.0687 0.0038±0.2694
Au 0.0025± 0.0285 0.0187± 0.0212 0.0020± 0.0111 0.0054± 0.0256 0.0015± 0.0033 0.0031± 0.0043 0.0054±0.0200
Hg 0.0015± 0.0110 0.0091± 0.0073 0.0039± 0.0033 0.0000± 0.0025 0.0206± 0.0200 0.0084± 0.0040 0.0069±0.0112
Tl 0.0000± 0.0103 0.0013± 0.0102 0.0007± 0.0036 0.0025± 0.0147 0.0018± 0.0049 0.0010± 0.0171 0.0013±0.0107
Pb 0.0081± 0.0169 0.0221± 0.0170 0.0271± 0.0048 0.1834± 0.1324 0.0148± 0.0532 0.0099± 0.2080 0.0551±0.0895
U 0.0017± 0.0131 0.0034± 0.0106 0.0023± 0.0052 0.0000± 0.0043 0.0011± 0.0021 0.0011± 0.0024 0.0015±0.0077
J.C.Chowet
al./Chem
osphere
54(2004)185–208
199
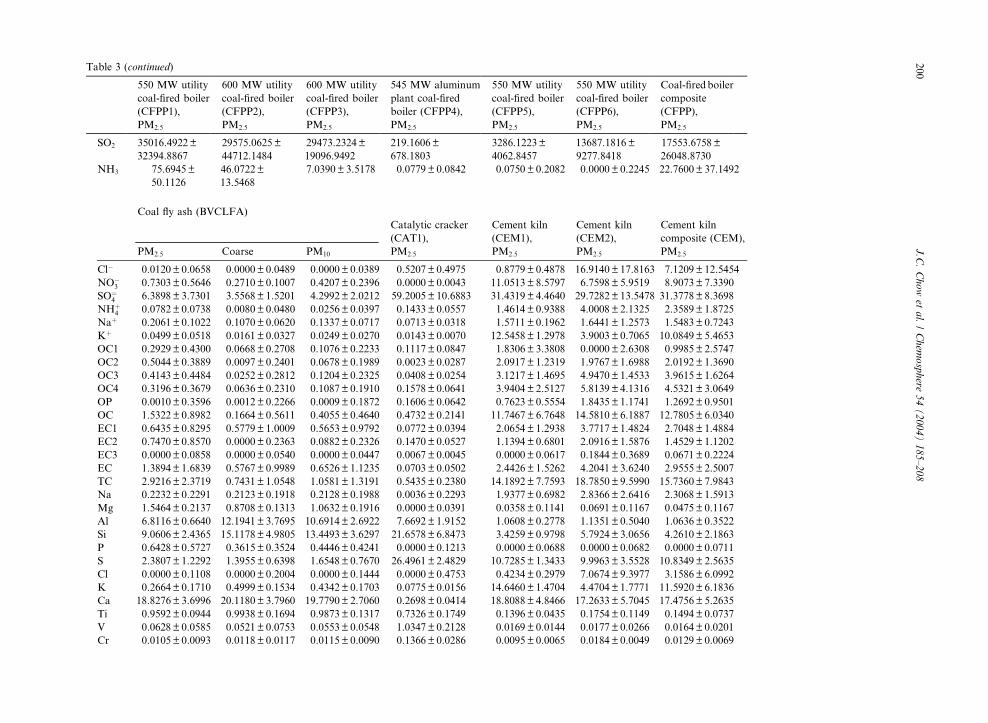
Table 3 (continued)
550 MW utility
coal-fired boiler
(CFPP1),
PM2:5
600 MW utility
coal-fired boiler
(CFPP2),
PM2:5
600 MW utility
coal-fired boiler
(CFPP3),
PM2:5
545 MW aluminum
plant coal-fired
boiler (CFPP4),
PM2:5
550 MW utility
coal-fired boiler
(CFPP5),
PM2:5
550 MW utility
coal-fired boiler
(CFPP6),
PM2:5
Coal-firedboiler
composite
(CFPP),
PM2:5
SO2 35016.4922±
32394.8867
29575.0625±
44712.1484
29473.2324±
19096.9492
219.1606±
678.1803
3286.1223±
4062.8457
13687.1816±
9277.8418
17553.6758±
26048.8730
NH3 75.6945±
50.1126
46.0722±
13.5468
7.0390± 3.5178 0.0779± 0.0842 0.0750± 0.2082 0.0000±0.2245 22.7600± 37.1492
Coal fly ash (BVCLFA)
Catalytic cracker
(CAT1),
Cement kiln
(CEM1),
Cement kiln
(CEM2),
Cement kiln
composite (CEM),
PM2:5 Coarse PM10 PM2:5 PM2:5 PM2:5 PM2:5
Cl� 0.0120± 0.0658 0.0000± 0.0489 0.0000± 0.0389 0.5207± 0.4975 0.8779± 0.4878 16.9140±17.8163 7.1209± 12.5454
NO�3 0.7303± 0.5646 0.2710± 0.1007 0.4207± 0.2396 0.0000± 0.0043 11.0513± 8.5797 6.7598±5.9519 8.9073± 7.3390
SO¼4 6.3898± 3.7301 3.5568± 1.5201 4.2992± 2.0212 59.2005± 10.6883 31.4319± 4.4640 29.7282±13.5478 31.3778± 8.3698
NHþ4 0.0782± 0.0738 0.0080± 0.0480 0.0256± 0.0397 0.1433± 0.0557 1.4614± 0.9388 4.0008±2.1325 2.3589± 1.8725
Naþ 0.2061± 0.1022 0.1070± 0.0620 0.1337± 0.0717 0.0713± 0.0318 1.5711± 0.1962 1.6441±1.2573 1.5483± 0.7243
Kþ 0.0499± 0.0518 0.0161± 0.0327 0.0249± 0.0270 0.0143± 0.0070 12.5458± 1.2978 3.9003±0.7065 10.0849± 5.4653
OC1 0.2929± 0.4300 0.0668± 0.2708 0.1076± 0.2233 0.1117± 0.0847 1.8306± 3.3808 0.0000±2.6308 0.9985± 2.5747
OC2 0.5044± 0.3889 0.0097± 0.2401 0.0678± 0.1989 0.0023± 0.0287 2.0917± 1.2319 1.9767±1.6988 2.0192± 1.3690
OC3 0.4143± 0.4484 0.0252± 0.2812 0.1204± 0.2325 0.0408± 0.0254 3.1217± 1.4695 4.9470±1.4533 3.9615± 1.6264
OC4 0.3196± 0.3679 0.0636± 0.2310 0.1087± 0.1910 0.1578± 0.0641 3.9404± 2.5127 5.8139±4.1316 4.5321± 3.0649
OP 0.0010± 0.3596 0.0012± 0.2266 0.0009± 0.1872 0.1606± 0.0642 0.7623± 0.5554 1.8435±1.1741 1.2692± 0.9501
OC 1.5322± 0.8982 0.1664± 0.5611 0.4055± 0.4640 0.4732± 0.2141 11.7467± 6.7648 14.5810±6.1887 12.7805± 6.0340
EC1 0.6435± 0.8295 0.5779± 1.0009 0.5653± 0.9792 0.0772± 0.0394 2.0654± 1.2938 3.7717±1.4824 2.7048± 1.4884
EC2 0.7470± 0.8570 0.0000± 0.2363 0.0882± 0.2326 0.1470± 0.0527 1.1394± 0.6801 2.0916±1.5876 1.4529± 1.1202
EC3 0.0000± 0.0858 0.0000± 0.0540 0.0000± 0.0447 0.0067± 0.0045 0.0000± 0.0617 0.1844±0.3689 0.0671± 0.2224
EC 1.3894± 1.6839 0.5767± 0.9989 0.6526± 1.1235 0.0703± 0.0502 2.4426± 1.5262 4.2041±3.6240 2.9555± 2.5007
TC 2.9216± 2.3719 0.7431± 1.0548 1.0581± 1.3191 0.5435± 0.2380 14.1892± 7.7593 18.7850±9.5990 15.7360± 7.9843
Na 0.2232± 0.2291 0.2123± 0.1918 0.2128± 0.1988 0.0036± 0.2293 1.9377± 0.6982 2.8366±2.6416 2.3068± 1.5913
Mg 1.5464± 0.2137 0.8708± 0.1313 1.0632± 0.1916 0.0000± 0.0391 0.0358± 0.1141 0.0691±0.1167 0.0475± 0.1167
Al 6.8116± 0.6640 12.1941± 3.7695 10.6914± 2.6922 7.6692± 1.9152 1.0608± 0.2778 1.1351±0.5040 1.0636± 0.3522
Si 9.0606± 2.4365 15.1178± 4.9805 13.4493± 3.6297 21.6578± 6.8473 3.4259± 0.9798 5.7924±3.0656 4.2610± 2.1863
P 0.6428± 0.5727 0.3615± 0.3524 0.4446± 0.4241 0.0000± 0.1213 0.0000± 0.0688 0.0000±0.0682 0.0000± 0.0711
S 2.3807± 1.2292 1.3955± 0.6398 1.6548± 0.7670 26.4961± 2.4829 10.7285± 1.3433 9.9963±3.5528 10.8349± 2.5635
Cl 0.0000± 0.1108 0.0000± 0.2004 0.0000± 0.1444 0.0000± 0.4753 0.4234± 0.2979 7.0674±9.3977 3.1586± 6.0992
K 0.2664± 0.1710 0.4999± 0.1534 0.4342± 0.1703 0.0775± 0.0156 14.6460± 1.4704 4.4704±1.7771 11.5920± 6.1836
Ca 18.8276± 3.6996 20.1180± 3.7960 19.7790± 2.7060 0.2698± 0.0414 18.8088± 4.8466 17.2633±5.7045 17.4756± 5.2635
Ti 0.9592± 0.0944 0.9938± 0.1694 0.9873± 0.1317 0.7326± 0.1749 0.1396± 0.0435 0.1754±0.1149 0.1494± 0.0737
V 0.0628± 0.0585 0.0521± 0.0753 0.0553± 0.0548 1.0347± 0.2128 0.0169± 0.0144 0.0177±0.0266 0.0164± 0.0201
Cr 0.0105± 0.0093 0.0118± 0.0117 0.0115± 0.0090 0.1366± 0.0286 0.0095± 0.0065 0.0184±0.0049 0.0129± 0.0069
200
J.C.Chowet
al./Chem
osphere
54(2004)185–208
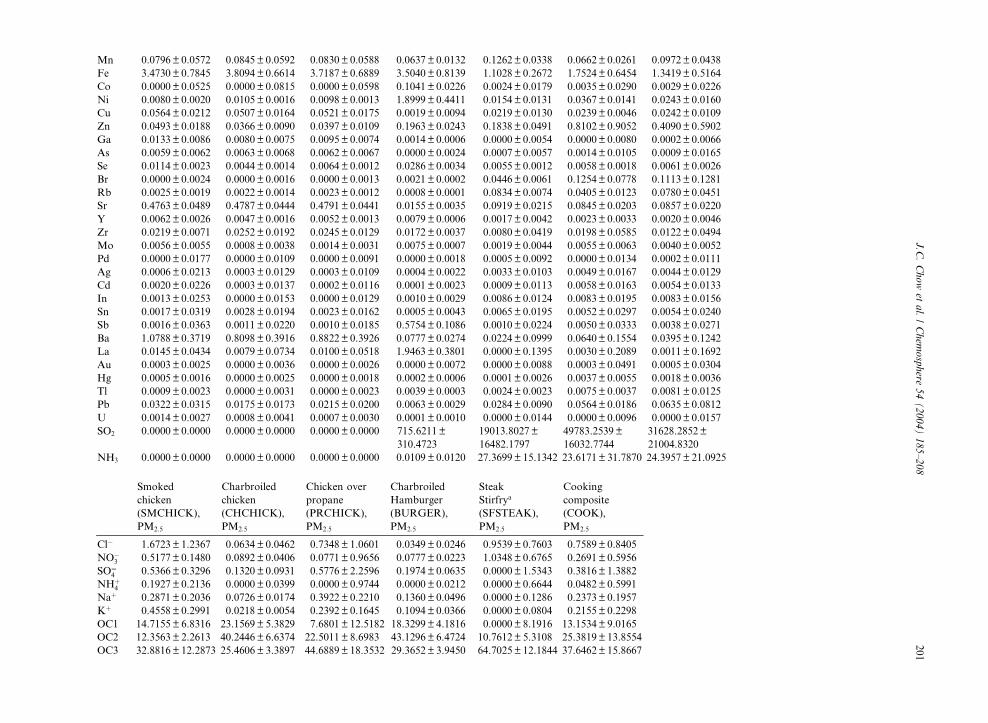
Mn 0.0796± 0.0572 0.0845± 0.0592 0.0830± 0.0588 0.0637±0.0132 0.1262± 0.0338 0.0662± 0.0261 0.0972± 0.0438
Fe 3.4730± 0.7845 3.8094± 0.6614 3.7187± 0.6889 3.5040±0.8139 1.1028± 0.2672 1.7524± 0.6454 1.3419± 0.5164
Co 0.0000± 0.0525 0.0000± 0.0815 0.0000± 0.0598 0.1041±0.0226 0.0024± 0.0179 0.0035± 0.0290 0.0029± 0.0226
Ni 0.0080± 0.0020 0.0105± 0.0016 0.0098± 0.0013 1.8999±0.4411 0.0154± 0.0131 0.0367± 0.0141 0.0243± 0.0160
Cu 0.0564± 0.0212 0.0507± 0.0164 0.0521± 0.0175 0.0019±0.0094 0.0219± 0.0130 0.0239± 0.0046 0.0242± 0.0109
Zn 0.0493± 0.0188 0.0366± 0.0090 0.0397± 0.0109 0.1963±0.0243 0.1838± 0.0491 0.8102± 0.9052 0.4090± 0.5902
Ga 0.0133± 0.0086 0.0080± 0.0075 0.0095± 0.0074 0.0014±0.0006 0.0000± 0.0054 0.0000± 0.0080 0.0002± 0.0066
As 0.0059± 0.0062 0.0063± 0.0068 0.0062± 0.0067 0.0000±0.0024 0.0007± 0.0057 0.0014± 0.0105 0.0009± 0.0165
Se 0.0114± 0.0023 0.0044± 0.0014 0.0064± 0.0012 0.0286±0.0034 0.0055± 0.0012 0.0058± 0.0018 0.0061± 0.0026
Br 0.0000± 0.0024 0.0000± 0.0016 0.0000± 0.0013 0.0021±0.0002 0.0446± 0.0061 0.1254± 0.0778 0.1113± 0.1281
Rb 0.0025± 0.0019 0.0022± 0.0014 0.0023± 0.0012 0.0008±0.0001 0.0834± 0.0074 0.0405± 0.0123 0.0780± 0.0451
Sr 0.4763± 0.0489 0.4787± 0.0444 0.4791± 0.0441 0.0155±0.0035 0.0919± 0.0215 0.0845± 0.0203 0.0857± 0.0220
Y 0.0062± 0.0026 0.0047± 0.0016 0.0052± 0.0013 0.0079±0.0006 0.0017± 0.0042 0.0023± 0.0033 0.0020± 0.0046
Zr 0.0219± 0.0071 0.0252± 0.0192 0.0245± 0.0129 0.0172±0.0037 0.0080± 0.0419 0.0198± 0.0585 0.0122± 0.0494
Mo 0.0056± 0.0055 0.0008± 0.0038 0.0014± 0.0031 0.0075±0.0007 0.0019± 0.0044 0.0055± 0.0063 0.0040± 0.0052
Pd 0.0000± 0.0177 0.0000± 0.0109 0.0000± 0.0091 0.0000±0.0018 0.0005± 0.0092 0.0000± 0.0134 0.0002± 0.0111
Ag 0.0006± 0.0213 0.0003± 0.0129 0.0003± 0.0109 0.0004±0.0022 0.0033± 0.0103 0.0049± 0.0167 0.0044± 0.0129
Cd 0.0020± 0.0226 0.0003± 0.0137 0.0002± 0.0116 0.0001±0.0023 0.0009± 0.0113 0.0058± 0.0163 0.0054± 0.0133
In 0.0013± 0.0253 0.0000± 0.0153 0.0000± 0.0129 0.0010±0.0029 0.0086± 0.0124 0.0083± 0.0195 0.0083± 0.0156
Sn 0.0017± 0.0319 0.0028± 0.0194 0.0023± 0.0162 0.0005±0.0043 0.0065± 0.0195 0.0052± 0.0297 0.0054± 0.0240
Sb 0.0016± 0.0363 0.0011± 0.0220 0.0010± 0.0185 0.5754±0.1086 0.0010± 0.0224 0.0050± 0.0333 0.0038± 0.0271
Ba 1.0788± 0.3719 0.8098± 0.3916 0.8822± 0.3926 0.0777±0.0274 0.0224± 0.0999 0.0640± 0.1554 0.0395± 0.1242
La 0.0145± 0.0434 0.0079± 0.0734 0.0100± 0.0518 1.9463±0.3801 0.0000± 0.1395 0.0030± 0.2089 0.0011± 0.1692
Au 0.0003± 0.0025 0.0000± 0.0036 0.0000± 0.0026 0.0000±0.0072 0.0000± 0.0088 0.0003± 0.0491 0.0005± 0.0304
Hg 0.0005± 0.0016 0.0000± 0.0025 0.0000± 0.0018 0.0002±0.0006 0.0001± 0.0026 0.0037± 0.0055 0.0018± 0.0036
Tl 0.0009± 0.0023 0.0000± 0.0031 0.0000± 0.0023 0.0039±0.0003 0.0024± 0.0023 0.0075± 0.0037 0.0081± 0.0125
Pb 0.0322± 0.0315 0.0175± 0.0173 0.0215± 0.0200 0.0063±0.0029 0.0284± 0.0090 0.0564± 0.0186 0.0635± 0.0812
U 0.0014± 0.0027 0.0008± 0.0041 0.0007± 0.0030 0.0001±0.0010 0.0000± 0.0144 0.0000± 0.0096 0.0000± 0.0157
SO2 0.0000± 0.0000 0.0000± 0.0000 0.0000± 0.0000 715.6211±
310.4723
19013.8027±
16482.1797
49783.2539±
16032.7744
31628.2852±
21004.8320
NH3 0.0000± 0.0000 0.0000± 0.0000 0.0000± 0.0000 0.0109±0.0120 27.3699± 15.1342 23.6171± 31.7870 24.3957± 21.0925
Smoked
chicken
(SMCHICK),
PM2:5
Charbroiled
chicken
(CHCHICK),
PM2:5
Chicken over
propane
(PRCHICK),
PM2:5
Charbroiled
Hamburger
(BURGER),
PM2:5
Steak
Stirfrya
(SFSTEAK),
PM2:5
Cooking
composite
(COOK),
PM2:5
Cl� 1.6723± 1.2367 0.0634± 0.0462 0.7348± 1.0601 0.0349±0.0246 0.9539± 0.7603 0.7589± 0.8405
NO�3 0.5177± 0.1480 0.0892± 0.0406 0.0771± 0.9656 0.0777±0.0223 1.0348± 0.6765 0.2691± 0.5956
SO¼4 0.5366± 0.3296 0.1320± 0.0931 0.5776± 2.2596 0.1974±0.0635 0.0000± 1.5343 0.3816± 1.3882
NHþ4 0.1927± 0.2136 0.0000± 0.0399 0.0000± 0.9744 0.0000±0.0212 0.0000± 0.6644 0.0482± 0.5991
Naþ 0.2871± 0.2036 0.0726± 0.0174 0.3922± 0.2210 0.1360±0.0496 0.0000± 0.1286 0.2373± 0.1957
Kþ 0.4558± 0.2991 0.0218± 0.0054 0.2392± 0.1645 0.1094±0.0366 0.0000± 0.0804 0.2155± 0.2298
OC1 14.7155± 6.8316 23.1569± 5.3829 7.6801± 12.5182 18.3299±4.1816 0.0000± 8.1916 13.1534± 9.0165
OC2 12.3563± 2.2613 40.2446± 6.6374 22.5011± 8.6983 43.1296±6.4724 10.7612± 5.3108 25.3819± 13.8554
OC3 32.8816± 12.2873 25.4606± 3.3897 44.6889± 18.3532 29.3652±3.9450 64.7025± 12.1844 37.6462± 15.8667
J.C.Chowet
al./Chem
osphere
54(2004)185–208
201
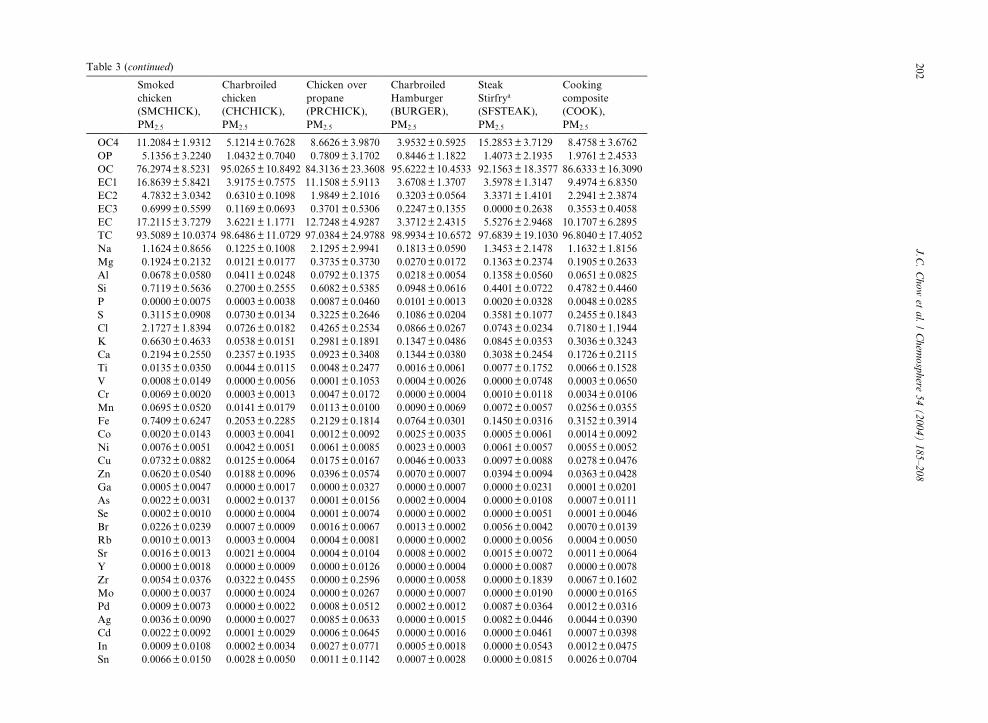
Table 3 (continued)
Smoked
chicken
(SMCHICK),
PM2:5
Charbroiled
chicken
(CHCHICK),
PM2:5
Chicken over
propane
(PRCHICK),
PM2:5
Charbroiled
Hamburger
(BURGER),
PM2:5
Steak
Stirfrya
(SFSTEAK),
PM2:5
Cooking
composite
(COOK),
PM2:5
OC4 11.2084± 1.9312 5.1214± 0.7628 8.6626± 3.9870 3.9532± 0.5925 15.2853±3.7129 8.4758± 3.6762
OP 5.1356± 3.2240 1.0432± 0.7040 0.7809± 3.1702 0.8446± 1.1822 1.4073±2.1935 1.9761± 2.4533
OC 76.2974± 8.5231 95.0265± 10.8492 84.3136± 23.3608 95.6222± 10.4533 92.1563±18.3577 86.6333± 16.3090
EC1 16.8639± 5.8421 3.9175± 0.7575 11.1508± 5.9113 3.6708± 1.3707 3.5978±1.3147 9.4974± 6.8350
EC2 4.7832± 3.0342 0.6310± 0.1098 1.9849± 2.1016 0.3203± 0.0564 3.3371±1.4101 2.2941± 2.3874
EC3 0.6999± 0.5599 0.1169± 0.0693 0.3701± 0.5306 0.2247± 0.1355 0.0000±0.2638 0.3553± 0.4058
EC 17.2115± 3.7279 3.6221± 1.1771 12.7248± 4.9287 3.3712± 2.4315 5.5276±2.9468 10.1707± 6.2895
TC 93.5089± 10.0374 98.6486± 11.0729 97.0384± 24.9788 98.9934± 10.6572 97.6839±19.1030 96.8040± 17.4052
Na 1.1624± 0.8656 0.1225± 0.1008 2.1295± 2.9941 0.1813± 0.0590 1.3453±2.1478 1.1632± 1.8156
Mg 0.1924± 0.2132 0.0121± 0.0177 0.3735± 0.3730 0.0270± 0.0172 0.1363±0.2374 0.1905± 0.2633
Al 0.0678± 0.0580 0.0411± 0.0248 0.0792± 0.1375 0.0218± 0.0054 0.1358±0.0560 0.0651± 0.0825
Si 0.7119± 0.5636 0.2700± 0.2555 0.6082± 0.5385 0.0948± 0.0616 0.4401±0.0722 0.4782± 0.4460
P 0.0000± 0.0075 0.0003± 0.0038 0.0087± 0.0460 0.0101± 0.0013 0.0020±0.0328 0.0048± 0.0285
S 0.3115± 0.0908 0.0730± 0.0134 0.3225± 0.2646 0.1086± 0.0204 0.3581±0.1077 0.2455± 0.1843
Cl 2.1727± 1.8394 0.0726± 0.0182 0.4265± 0.2534 0.0866± 0.0267 0.0743±0.0234 0.7180± 1.1944
K 0.6630± 0.4633 0.0538± 0.0151 0.2981± 0.1891 0.1347± 0.0486 0.0845±0.0353 0.3036± 0.3243
Ca 0.2194± 0.2550 0.2357± 0.1935 0.0923± 0.3408 0.1344± 0.0380 0.3038±0.2454 0.1726± 0.2115
Ti 0.0135± 0.0350 0.0044± 0.0115 0.0048± 0.2477 0.0016± 0.0061 0.0077±0.1752 0.0066± 0.1528
V 0.0008± 0.0149 0.0000± 0.0056 0.0001± 0.1053 0.0004± 0.0026 0.0000±0.0748 0.0003± 0.0650
Cr 0.0069± 0.0020 0.0003± 0.0013 0.0047± 0.0172 0.0000± 0.0004 0.0010±0.0118 0.0034± 0.0106
Mn 0.0695± 0.0520 0.0141± 0.0179 0.0113± 0.0100 0.0090± 0.0069 0.0072±0.0057 0.0256± 0.0355
Fe 0.7409± 0.6247 0.2053± 0.2285 0.2129± 0.1814 0.0764± 0.0301 0.1450±0.0316 0.3152± 0.3914
Co 0.0020± 0.0143 0.0003± 0.0041 0.0012± 0.0092 0.0025± 0.0035 0.0005±0.0061 0.0014± 0.0092
Ni 0.0076± 0.0051 0.0042± 0.0051 0.0061± 0.0085 0.0023± 0.0003 0.0061±0.0057 0.0055± 0.0052
Cu 0.0732± 0.0882 0.0125± 0.0064 0.0175± 0.0167 0.0046± 0.0033 0.0097±0.0088 0.0278± 0.0476
Zn 0.0620± 0.0540 0.0188± 0.0096 0.0396± 0.0574 0.0070± 0.0007 0.0394±0.0094 0.0363± 0.0428
Ga 0.0005± 0.0047 0.0000± 0.0017 0.0000± 0.0327 0.0000± 0.0007 0.0000±0.0231 0.0001± 0.0201
As 0.0022± 0.0031 0.0002± 0.0137 0.0001± 0.0156 0.0002± 0.0004 0.0000±0.0108 0.0007± 0.0111
Se 0.0002± 0.0010 0.0000± 0.0004 0.0001± 0.0074 0.0000± 0.0002 0.0000±0.0051 0.0001± 0.0046
Br 0.0226± 0.0239 0.0007± 0.0009 0.0016± 0.0067 0.0013± 0.0002 0.0056±0.0042 0.0070± 0.0139
Rb 0.0010± 0.0013 0.0003± 0.0004 0.0004± 0.0081 0.0000± 0.0002 0.0000±0.0056 0.0004± 0.0050
Sr 0.0016± 0.0013 0.0021± 0.0004 0.0004± 0.0104 0.0008± 0.0002 0.0015±0.0072 0.0011± 0.0064
Y 0.0000± 0.0018 0.0000± 0.0009 0.0000± 0.0126 0.0000± 0.0004 0.0000±0.0087 0.0000± 0.0078
Zr 0.0054± 0.0376 0.0322± 0.0455 0.0000± 0.2596 0.0000± 0.0058 0.0000±0.1839 0.0067± 0.1602
Mo 0.0000± 0.0037 0.0000± 0.0024 0.0000± 0.0267 0.0000± 0.0007 0.0000±0.0190 0.0000± 0.0165
Pd 0.0009± 0.0073 0.0000± 0.0022 0.0008± 0.0512 0.0002± 0.0012 0.0087±0.0364 0.0012± 0.0316
Ag 0.0036± 0.0090 0.0000± 0.0027 0.0085± 0.0633 0.0000± 0.0015 0.0082±0.0446 0.0044± 0.0390
Cd 0.0022± 0.0092 0.0001± 0.0029 0.0006± 0.0645 0.0000± 0.0016 0.0000±0.0461 0.0007± 0.0398
In 0.0009± 0.0108 0.0002± 0.0034 0.0027± 0.0771 0.0005± 0.0018 0.0000±0.0543 0.0012± 0.0475
Sn 0.0066± 0.0150 0.0028± 0.0050 0.0011± 0.1142 0.0007± 0.0028 0.0000±0.0815 0.0026± 0.0704
202
J.C.Chowet
al./Chem
osphere
54(2004)185–208
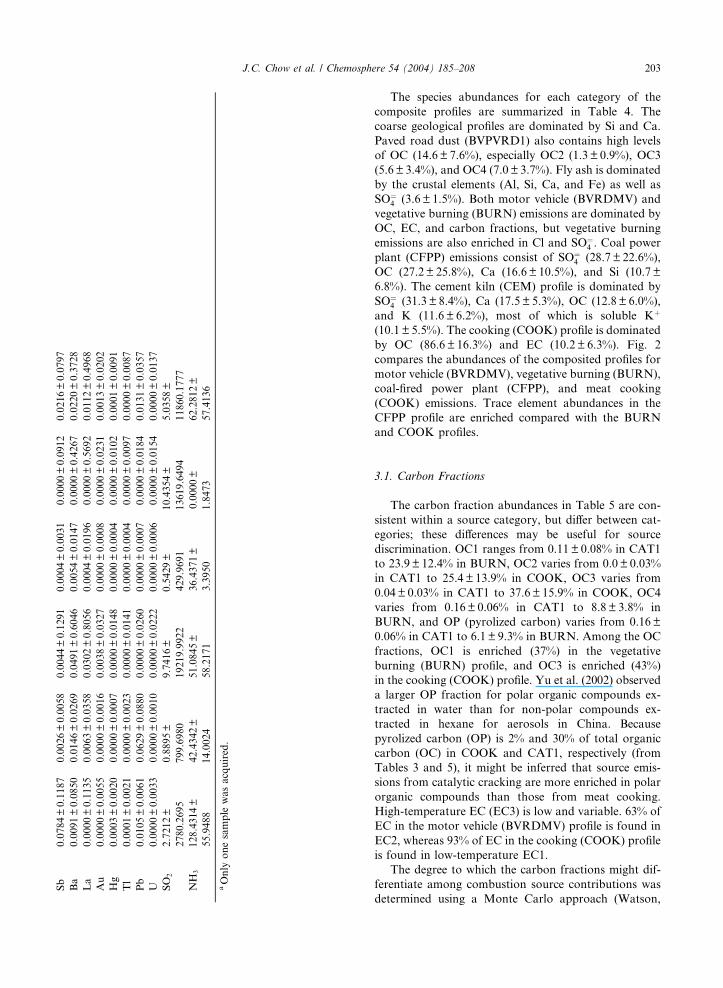
Sb
0.0784±0.1187
0.0026±0.0058
0.0044±0.1291
0.0004±0.0031
0.0000±0.0912
0.0216±0.0797
Ba
0.0091±0.0850
0.0146±0.0269
0.0491±0.6046
0.0054±0.0147
0.0000±0.4267
0.0220±0.3728
La
0.0000±0.1135
0.0063±0.0358
0.0302±0.8056
0.0004±0.0196
0.0000±0.5692
0.0112±0.4968
Au
0.0000±0.0055
0.0000±0.0016
0.0038±0.0327
0.0000±0.0008
0.0000±0.0231
0.0013±0.0202
Hg
0.0003±0.0020
0.0000±0.0007
0.0000±0.0148
0.0000±0.0004
0.0000±0.0102
0.0001±0.0091
Tl
0.0001±0.0021
0.0000±0.0023
0.0000±0.0141
0.0000±0.0004
0.0000±0.0097
0.0000±0.0087
Pb
0.0105±0.0061
0.0629±0.0880
0.0000±0.0260
0.0000±0.0007
0.0000±0.0184
0.0131±0.0357
U0.0000±0.0033
0.0000±0.0010
0.0000±0.0222
0.0000±0.0006
0.0000±0.0154
0.0000±0.0137
SO
22.7212±
2780.2695
0.8895±
799.6980
9.7416±
19219.9922
0.5429±
429.9691
10.4354±
13619.6494
5.0358±
11860.1777
NH
3128.4314±
55.9488
42.4342±
14.0024
51.0845±
58.2171
36.4371±
3.3950
0.0000±
1.8473
62.2812±
57.4136
aOnly
onesample
wasacquired.
J.C. Chow et al. / Chemosphere 54 (2004) 185–208 203
The species abundances for each category of the
composite profiles are summarized in Table 4. The
coarse geological profiles are dominated by Si and Ca.
Paved road dust (BVPVRD1) also contains high levels
of OC (14.6 ± 7.6%), especially OC2 (1.3 ± 0.9%), OC3
(5.6 ± 3.4%), and OC4 (7.0 ± 3.7%). Fly ash is dominated
by the crustal elements (Al, Si, Ca, and Fe) as well as
SO¼4 (3.6 ± 1.5%). Both motor vehicle (BVRDMV) and
vegetative burning (BURN) emissions are dominated by
OC, EC, and carbon fractions, but vegetative burning
emissions are also enriched in Cl and SO¼4 . Coal power
plant (CFPP) emissions consist of SO¼4 (28.7 ± 22.6%),
OC (27.2 ± 25.8%), Ca (16.6 ± 10.5%), and Si (10.7 ±
6.8%). The cement kiln (CEM) profile is dominated by
SO¼4 (31.3 ± 8.4%), Ca (17.5 ± 5.3%), OC (12.8 ± 6.0%),
and K (11.6 ± 6.2%), most of which is soluble Kþ
(10.1 ± 5.5%). The cooking (COOK) profile is dominated
by OC (86.6 ± 16.3%) and EC (10.2 ± 6.3%). Fig. 2
compares the abundances of the composited profiles for
motor vehicle (BVRDMV), vegetative burning (BURN),
coal-fired power plant (CFPP), and meat cooking
(COOK) emissions. Trace element abundances in the
CFPP profile are enriched compared with the BURN
and COOK profiles.
3.1. Carbon Fractions
The carbon fraction abundances in Table 5 are con-
sistent within a source category, but differ between cat-
egories; these differences may be useful for source
discrimination. OC1 ranges from 0.11± 0.08% in CAT1
to 23.9± 12.4% in BURN, OC2 varies from 0.0± 0.03%
in CAT1 to 25.4 ± 13.9% in COOK, OC3 varies from
0.04± 0.03% in CAT1 to 37.6± 15.9% in COOK, OC4
varies from 0.16± 0.06% in CAT1 to 8.8± 3.8% in
BURN, and OP (pyrolized carbon) varies from 0.16±
0.06% in CAT1 to 6.1± 9.3% in BURN. Among the OC
fractions, OC1 is enriched (37%) in the vegetative
burning (BURN) profile, and OC3 is enriched (43%)
in the cooking (COOK) profile. Yu et al. (2002) observed
a larger OP fraction for polar organic compounds ex-
tracted in water than for non-polar compounds ex-
tracted in hexane for aerosols in China. Because
pyrolized carbon (OP) is 2% and 30% of total organic
carbon (OC) in COOK and CAT1, respectively (from
Tables 3 and 5), it might be inferred that source emis-
sions from catalytic cracking are more enriched in polar
organic compounds than those from meat cooking.
High-temperature EC (EC3) is low and variable. 63% of
EC in the motor vehicle (BVRDMV) profile is found in
EC2, whereas 93% of EC in the cooking (COOK) profile
is found in low-temperature EC1.
The degree to which the carbon fractions might dif-
ferentiate among combustion source contributions was
determined using a Monte Carlo approach (Watson,

Table 4
Summary of chemical species abundancesa in BRAVO source profiles
Composite source
profilebParticle size Chemical abundances in percent mass
<0.1% 0.1–1% 1–10% >10%
Paved road dust
(BVPVRD1)
Coarse Rb, Ni, Zr, Cu,
Mn, Pb, Sr
P, Zn, Kþ, Ti, S,
SO¼4 , K
EC1, OC2, Fe, Al,
OC3, OC4
Si, OC, Ca
Soil (BVSOIL1) Coarse Cu, Rb, Sr, Zn, Zr,
Mn, S
EC1, EC2, Ti Fe, K, OC3, OC4,
Al, Ca, OC
Si
Soil (BVSOIL2) Coarse Ni, Cu, Y, Pb, Rb,
Zr, Zn, Sr, Mn, S,
SO¼4 , P
Kþ, Ti K, Fe, Al Ca, Si
Unpaved road dust
(BVUNPV2)
Coarse Y, Cu, Pb, Rb, Cr,
Br, Zr, Ni, Zn, Mn,
Sr, Cl�, P, Kþ
Ti, SO¼4 , S, EC2,
NO�3 , OC3
K, EC1, Fe, OC4,
Al, OC
Si, Ca
Coal fly ash
(BVCLFA)
Coarse Rb, Se, Y, Ga, Ni,
Cr, Pb, Zr, Zn, Cu,
Mn
Naþ, NO�3 , P, Sr,
K, Ba, Ti
S, SO¼4 , Fe Al, Si, Ca
Coal fly ash
(BVCLFA)
Fine Rb, Mo, Y, Cr, Se,
Ga, Zr, Pb, Zn, Cu,
V, NHþ4 , Mn
Naþ, K, Sr, OC2,
P, NO�3 , Ti
Ba, OC, S, Fe,
SOþ4 , Al, Si
Ca
Motor vehicle
composite
(BVRDMV)
Fine Br, Mn, Cu Naþ, Zn, Fe S, OC4 OC1, OC2, OC3,
OC, EC1, EC2, EC
Vegetative burning
composite (BURN)
Fine Ni, Se, Rb, Zn Al, EC3, NO�3 , S SO¼
4 , K, Cl�, Cl,
OC4
OC1, OC2, OC3,
OC, EC1, EC
Coal-fired boiler
composite (CFPP)
Fine Mo, Ni, Cr, Cu Mn, Kþ, Sr, K, Ti Ba, EC1, EC2,
OC4, Fe, Al, S
Si, Ca, OC, SO¼4
Cement kiln com-
posite (CEM)
Fine Se, Cr, Cu, Ni, Rb,
Sr, Mn
Ti Al, OP, Fe, EC2,
Naþ, NHþ4 , EC1,
EC, OC3, Si, OC4,
NO�3
Kþ, S, K, OC, Ca,
SO¼4
Cooking composite
(COOK)
Fine Ni S, Si OC4, EC1 EC, OC1, OC2,
OC3, OC
Catalytic cracker
(CAT1)
Fine Rb, Ga, Br, Tl, Pb,
EC3, Mo, Y, Kþ,
Sr, Zr, Se, OC3,
Mn, EC, EC1, Ba
Co, OC1, Cr, NHþ4 ,
EC2, OC4, OP, Zn,
Ca, OC, Cl�, Sb, Ti
V, Ni, La, Fe, Al Si, S, SO¼4
a For species with abundances greater than their variabilities.b Samples in composite source profiles are identified in Table 2.
204 J.C. Chow et al. / Chemosphere 54 (2004) 185–208
1979; Chow, 1985; Javitz et al., 1988; Lowenthal et al.,
1992). Synthetic ambient data sets were generated from
the BVRDMV, BURN, CFPP, CEM, COOK, and
CAT1 profiles, ‘‘true’’ contributions of 10 lg/m3 from
each source, and random ambient and source uncer-
tainties were generated according to Eq. (1) in Lowen-
thal et al. (1992). Ambient measurement uncertainty for
all chemical species was assumed to be 10%.
The CMB receptor model with effective variance
weighting (Watson et al., 1984) was applied to each of
two synthetic data sets of 100 samples each, one con-
structed with random lognormal uncertainties corre-
sponding to a coefficient of variation of 30% for all
species for comparison with Javitz et al. (1988), and the
second with the measured source uncertainties in Table
3. The source contribution estimates (SCE) were con-
strained to values greater than or equal to zero. The es-
timated and true source contributions were compared
using the average absolute error (AAE), i.e., the average
of the absolute difference between the estimated and true
values divided by the true value, expressed as a percent
(Javitz et al., 1988). CMB analysis was conducted with all
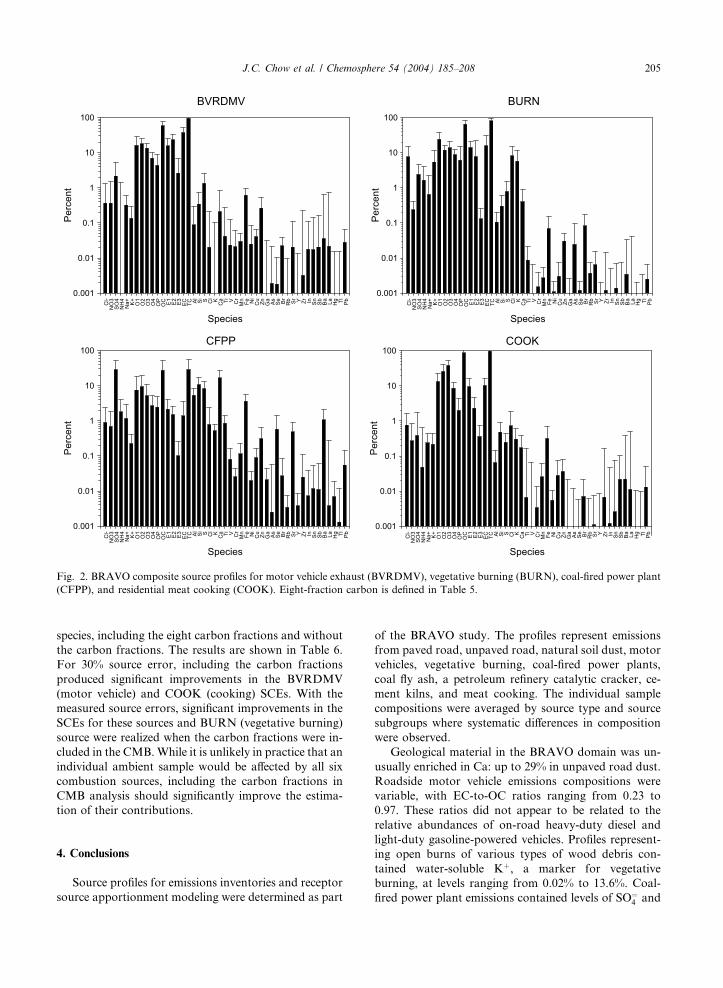
BVRDMV
Species
Cl-
NO3
SO4
NH4
Na+ K+ O1
O2
O3
O4
OP
OC E1 E2 E3 EC TC Al Si S Cl K Ca Ti V Cr
Mn Fe Ni
Cu Zn Ga As Se Br
Rb Sr Y Zr In Sn Sb Ba La Hg Tl Pb
Percent
0.001
0.01
0.1
1
10
100
BURN
Species
Cl-
NO3
SO4
NH4
Na+ K+ O1
O2
O3
O4
OP
OC E1 E2 E3 EC TC Al Si S Cl K Ca Ti V Cr
Mn Fe Ni
Cu Zn Ga As Se Br
Rb Sr Y Zr In Sn Sb Ba La Hg Tl Pb
Percent
0.001
0.01
0.1
1
10
100
CFPP
Species
Cl-
NO3
SO4
NH4
Na+ K+ O1
O2
O3
O4
OP
OC E1 E2 E3 EC TC Al Si S Cl K Ca Ti V Cr
Mn Fe Ni
Cu Zn Ga As Se Br
Rb Sr Y Zr In Sn Sb Ba La Hg Tl Pb
Percent
0.001
0.01
0.1
1
10
100COOK
Species
Cl-
NO3
SO4
NH4
Na+ K+ O1
O2
O3
O4
OP
OC E1 E2 E3 EC TC Al Si S Cl K Ca Ti V Cr
Mn Fe Ni
Cu Zn Ga As Se Br
Rb Sr Y Zr In Sn Sb Ba La Hg Tl Pb
Percent
0.001
0.01
0.1
1
10
100
Fig. 2. BRAVO composite source profiles for motor vehicle exhaust (BVRDMV), vegetative burning (BURN), coal-fired power plant
(CFPP), and residential meat cooking (COOK). Eight-fraction carbon is defined in Table 5.
J.C. Chow et al. / Chemosphere 54 (2004) 185–208 205
species, including the eight carbon fractions and without
the carbon fractions. The results are shown in Table 6.
For 30% source error, including the carbon fractions
produced significant improvements in the BVRDMV
(motor vehicle) and COOK (cooking) SCEs. With the
measured source errors, significant improvements in the
SCEs for these sources and BURN (vegetative burning)
source were realized when the carbon fractions were in-
cluded in the CMB.While it is unlikely in practice that an
individual ambient sample would be affected by all six
combustion sources, including the carbon fractions in
CMB analysis should significantly improve the estima-
tion of their contributions.
4. Conclusions
Source profiles for emissions inventories and receptor
source apportionment modeling were determined as part
of the BRAVO study. The profiles represent emissions
from paved road, unpaved road, natural soil dust, motor
vehicles, vegetative burning, coal-fired power plants,
coal fly ash, a petroleum refinery catalytic cracker, ce-
ment kilns, and meat cooking. The individual sample
compositions were averaged by source type and source
subgroups where systematic differences in composition
were observed.
Geological material in the BRAVO domain was un-
usually enriched in Ca: up to 29% in unpaved road dust.
Roadside motor vehicle emissions compositions were
variable, with EC-to-OC ratios ranging from 0.23 to
0.97. These ratios did not appear to be related to the
relative abundances of on-road heavy-duty diesel and
light-duty gasoline-powered vehicles. Profiles represent-
ing open burns of various types of wood debris con-
tained water-soluble Kþ, a marker for vegetative
burning, at levels ranging from 0.02% to 13.6%. Coal-
fired power plant emissions contained levels of SO¼4 and
Table 5
Carbon fractiona composition of BRAVO combustion profiles
Source Carbon fraction (%)
OC1 OC2 OC3 OC4 OP EC1 EC2 EC3
Motor vehicle
composite
(BVRDMV)
16.0± 12.3 18.0± 7.0 13.4± 5.5 6.9± 3.3 4.4± 4.6 15.6± 9.3 23.3± 10.4 2.6 ± 4.3
Vegetative burning
composite (BURN)
23.9± 12.4 11.9± 4.2 13.8± 6.6 8.8± 3.8 6.1± 9.3 13.9± 7.3 7.8± 15.1 0.13± 0.13
Coal-fired boiler
composite (CFPP)
7.5± 10.1 9.4± 9.6 5.2± 5.8 2.7± 2.4 2.4± 2.5 2.1± 2.0 1.5± 1.1 0.10± 0.16
Cement kiln composite
(CEM)
1.0± 2.6 2.0± 1.4 4.0± 1.6 4.5± 3.1 1.3± 1.0 2.7± 1.5 1.5± 1.1 0.07± 0.22
Cooking composite
(COOK)
13.2± 9.0 25.4± 13.9 37.6± 15.9 8.5± 3.7 2.0± 2.5 9.5± 6.8 2.3± 2.4 0.35± 0.40
Catalytic cracker
(CAT1)
0.11± 0.08 0.00± 0.03 0.04± 0.02 0.16± 0.06 0.16± 0.06 0.08± 0.04 0.15± 0.05 0.007± 0.005
a Eight carbon fractions including: OC1 (120 �C), OC2 (250 �C), OC3 (450 �C), and OC4 (550 �C) combusted in a 100% helium
atmosphere; and EC1 (550 �C), EC2 (700 �C), and EC3 (800 �C) combusted in a mixture of 2% oxygen and 98% helium atmosphere. A
630 nm helium–neon laser is used to monitor pyrolyzed carbon (OP) based on the IMPROVE thermal/optical reflectance (TOR)
carbon analysis protocol (Chow et al., 1993, 2001).
Table 6
Effect of using eight carbon fractionsa to resolve combustion source contributions by CMB
Source 30% source errors Actual source errors
AAEb (without
carbon fractions)
AAE (with carbon
fractions)
AAE (without
carbon fractions)
AAE (with carbon
fractions)
Motor vehicle composite (BVRDMV) 20.9 13.5 53.0 38.4
Vegetative burning composite (BURN) 15.1 14.0 54.5 45.0
Coal-fired boiler composite (CFPP) 10.1 9.9 22.9 22.0
Cement kiln composite (CEM) 10.6 10.2 25.5 24.1
Cooking composite (COOK) 40.4 24.4 74.1 44.5
Catalytic cracker (CAT1) 8.6 8.6 11.1 11.0
aCarbon fractions are identified in Table 5.b Percent.
206 J.C. Chow et al. / Chemosphere 54 (2004) 185–208
Se as high as 62% and 2.2%, respectively. An oil-refinery
catalytic cracker profile was characterized by relatively
high levels of SO¼4 (59%), V (1.03%), Ni (1.90%), La
(1.95%), and Sb (0.58%). Cement kiln emissions were
comprised mainly of SO¼4 (30–31%), Ca (17.3–18.8%),
total K (4.5–14.6%), and OC (11.7–14.6%). Meat
cooking emissions were dominated by OC (76–96%).
The eight carbon fractions of organic and elemental
carbon provide additional discrimination between
combustion source emissions.
Acknowledgements
This study was jointly sponsored by the US Envi-
ronmental Protection Agency (EPA) and the National
Park Service as part of the BRAVO study through an
agreement with the Cooperative Institute for Atmo-
spheric Sciences and Terrestrial Applications (CI-
ASTA). The results and conclusions presented in this
paper are solely those of the authors and do not repre-
sent BRAVO study findings. The authors are grateful to
Mr. James Yarbrough of EPA for coordinating the
source testing; to the rangers at Big Bend National Park
for assisting with the logistics of the source testing; to
Dr. Marc Pitchford of the National Oceanic and At-
mospheric Administration and Dr. Lowell Ashbaugh of
the University of California at Davis for performing site
surveys and collecting samples; and to Mr. William
Welch at the University of California at Riverside,
CE-CERT, for the use of their cooking test facility.
References
AOAC, 2000. Official Methods of Analysis of AOAC Interna-
tional, 17th ed. Association of Analytical Chemists, Arling-
ton, VA.
J.C. Chow et al. / Chemosphere 54 (2004) 185–208 207
ARB, 2003. Central California air quality studies––CCOS and
CRPAQS. California Air Resources Board, Sacramento,
CA. Available from <http://www.arb.ca.gov/airways/ccaqs.
htm>.
Brook, J.R., Vega, E., Watson, J.G., 2003. Chapter 7: Receptor
methods. In: Particulate Matter Science for Policy Makers,
A NARSTO Assessment, Part 2. NARSTO, Pasco, WA,
pp. 7-1–7-48.
Carvacho, O.F., Ashbaugh, L.L., Matsumura, R.T., Southard,
R.J., Flocchini, R.G., 1996. Measurement of PM10 potential
from agricultural soils using a dust resuspension test
chamber. In: Proceedings, International Conference on Air
Pollution from Agricultural Operations. Midwest Plan
Service, Kansas City, MO.
Chow, J.C., 1985. A composite modeling approach to assess air
pollution source/receptor relationships. Sc.D. Dissertation,
Harvard University, Cambridge, MA.
Chow, J.C., 2002. 2002 Critical review introduction––visibility:
science and regulation. J. Air Waste Manage. Assoc. 52 (6),
626–627.
Chow, J.C., Watson, J.G., 1999. Ion chromatography in
elemental analysis of airborne particles. In: Landsberger,
S., Creatchman, M. (Eds.), Elemental Analysis of Airborne
Particles, vol. 1. Gordon and Breach Science, Amsterdam,
pp. 97–137.
Chow, J.C., Watson, J.G., 2002. Review of PM2:5 and PM10
apportionment for fossil fuel combustion and other sources
by the chemical mass balance receptor model. Energy Fuels
16 (2), 222–260.
Chow, J.C., Frazier, C.A., Watson, J.G., 1988. A survey of
existing fugitive/area source characterization methods for
receptor modeling. In: Hoffnagle, G.F., Lebowitz, M.
(Eds.), Proceedings, Particulate Matter/Fugitive Dusts:
Measurements and Control in Western Arid Regions. Air
Pollution Control Association, Pittsburgh, PA, pp. 176–
189.
Chow, J.C., Watson, J.G., Pritchett, L.C., Pierson, W.R.,
Frazier, C.A., Purcell, R.G., 1993. The DRI thermal/optical
reflectance carbon analysis system: description, evaluation
and applications in US air quality studies. Atmos. Environ.
27 (8), 1185–1201.
Chow, J.C., Watson, J.G., Houck, J.E., Pritchett, L.C., Rogers,
C.F., Frazier, C.A., Egami, R.T., Ball, B.M., 1994. A
laboratory resuspension chamber to measure fugitive dust
size distributions and chemical compositions. Atmos. Envi-
ron. 28 (21), 3463–3481.
Chow, J.C., Watson, J.G., Green, M.C., Lowenthal, D.H.,
DuBois, D.W., Kohl, S.D., Egami, R.T., Gillies, J.A.,
Rogers, C.F., Frazier, C.A., Cates, W., 1999. Middle- and
neighborhood-scale variations of PM10 source contributions
in Las Vegas, Nevada. J. Air Waste Manage. Assoc. 49 (6),
641–654.
Chow, J.C., Watson, J.G., Crow, D., Lowenthal, D.H.,
Merrifield, T., 2001. Comparison of IMPROVE and
NIOSH carbon measurements. Aerosol Sci. Technol. 34
(1), 23–34.
Chow, J.C., Bachmann, J.D., Wierman, S.S.G., Mathai, C.V.,
Malm, W.C., White, W.H., Mueller, P.K., Kumar, N.,
Watson, J.G., 2002a. 2002 Critical review discussion––
visibility: science and regulation. J. Air Waste Manage.
Assoc. 52 (9), 973–999.
Chow, J.C., Watson, J.G., Crow, D., Kohl, S.D., Kuhns, H.D.,
Etyemezian, V., Engelbrecht, J.P., 2002b. Source profiles for
the big bend regional aerosol visibility and observational
(BRAVO) source characterization study, Draft report.
Prepared for CIASTA, NOAA, Las Vegas, NV, by Desert
Research Institute, Reno, NV.
Cooper, J.A., Frazier, C.A., Houck, J.E., 1985. Seattle-Tacoma
Aerosol Characterization Study (STACS): Final report.
NEA, Inc., Tigard, OR.
Cooper, J.A., Redline, D.C., Sherman, J.R., Valdovinos, L.M.,
Pollard, W.L., Scavone, L.C., West, C.R., 1987. PM10
source composition library for the South Coast Air Basin.
vol. I: Source profile development documentation. Final
report. South Coast Air Quality Management District, El
Monte, CA.
Engelbrecht, J.P., Swanepoel, L., Chow, J.C., Watson, J.G.,
Egami, R.T., 2002. The comparison of source contributions
from residential coal and low-smoke fuels, using CMB
modeling, in South Africa. Environ. Sci. Policy 5 (2), 157–
167.
Fine, P.M., Cass, G.R., Simoneit, B.R.T., 2002. Chemical
characterization of fine particle emissions from the fireplace
combustion of woods grown in the southern United States.
Environ. Sci. Technol. 36 (7), 1442–1451.
Gordon, G.E., Pierson, W.R., Daisey, J.M., Lioy, P.J., Cooper,
J.A., Watson, J.G., Cass, G.R., 1984. Considerations for
design of source apportionment studies. Atmos. Environ. 18
(8), 1567–1582.
Green, M.C., Kuhns, H.D., Etyemezian, V., 2000. Final
Program Plan for the Big Bend Regional Aerosol and
Visibility Observational Study (BRAVO). Desert Research
Institute, Las Vegas, NV.
Hildemann, L.M., Cass, G.R., Markowski, G.R., 1989. A
dilution stack sampler for collection of organic aerosol
emissions: design, characterization and field tests. Aerosol
Sci. Technol. 10 (10–11), 193–204.
Hopke, P.K., 1999. An introduction to source receptor mod-
eling. In: Landsberger, S., Creatchman, M. (Eds.), Elemen-
tal Analysis of Airborne Particles. Gordon and Breach
Science, Amsterdam, pp. 273–315.
Houck, J.E., 1991. Source sampling for receptor modeling. In:
Hopke, P.K. (Ed.), Receptor Modeling for Air Quality
Management. Elsevier, Amsterdam, The Netherlands,
pp. 45–82.
Houck, J.E., Chow, J.C., Watson, J.G., Simons, C.A., Pritch-
ett, L.C., Goulet, J.M., Frazier, C.A., 1989. Determination
of particle size distribution and chemical composition of
particulate matter from selected sources in California.
Report no. A6-175-32. Prepared for California Air Re-
sources Board, Sacramento, CA, by OMNI Environmental
Services Inc. and Desert Research Institute, Beaverton, OR
and Reno, NV.
IMPROVE, 2003. Interagency monitoring of protected visual
environments––data resources. National Park Service, Ft.
Collins, CO. Available from <http://vista.cira.colostate.edu/
IMPROVE/Data/data.htm>.
Javitz, H.S., Watson, J.G., Robinson, N.F., 1988. Performance
of the chemical mass balance model with simulated local-
scale aerosols. Atmos. Environ. 22 (10), 2309–2322.
Lowenthal, D.H., Chow, J.C., Watson, J.G., Neuroth, G.R.,
Robbins, R.B., Shafritz, B.P., Countess, R.J., 1992. The
208 J.C. Chow et al. / Chemosphere 54 (2004) 185–208
effects of collinearity on the ability to determine aerosol
contributions from diesel- and gasoline-powered vehicles
using the chemical mass balance model. Atmos. Environ. 26
(13), 2341–2351.
Malm, W.C., Iyer, H.K., Gebhart, K.A., 1990. Application of
tracer mass balance regression to WHITEX data. In:
Mathai, C.V. (Ed.), Transactions, Visibility and Fine
Particles. Air Waste Management Association, Pittsburgh,
PA, pp. 806–818.
McDonald, J.D., Zielinska, B., Fujita, E.M., Sagebiel, J.C.,
Chow, J.C., Watson, J.G., 2003. Emissions from charbroil-
ing and grilling of chicken and beef. J. Air Waste Manage.
Assoc. 53 (2), 185–194.
Norbeck, J., 1997. Standardized test kitchen and screening tools
evaluation for South Coast Air Quality Management
Districtn Proposed Rule 1138. Report No. S-C95073.
Prepared for South Coast Air Quality Management District,
El Monte, CA, by University of California CE-CERT,
Riverside, CA.
Perry, K.D., Cahill, T.A., Eldred, R.A., Dutcher, D.D., 1997.
Long-range transport of North African dust to the eastern
United States. J. Geophys. Res. 102 (D10), 11225–11238.
Ray, S.S., Parker, F.G., 1977. Characterization of ash from
coal-fired power plants. Report No. EPA-600/7-77/010. US
Environmental Protection Agency, Washington, DC.
Schauer, J.J., Cass, G.R., 2000. Source apportionment of
wintertime gas-phase and particle-phase air pollutants using
organic compounds as tracers. Environ. Sci. Technol. 34 (9),
1821.
Thurston, G.D., Spengler, J.D., 1985. A quantitative assess-
ment of source contributions to inhalable particulate matter
pollution in metropolitan Boston. Atmos. Environ. 19 (1),
9–25.
US EPA, 1999a. Emissions inventory guidance for implemen-
tation of ozone and particulate matter National Ambient
Air Quality Standards (NAAQS) and regional haze regula-
tions. Report no. EPA-454/R-99-006. US Environmental
Protection Agency, Research Triangle Park, NC. Available
from <http://www.epa.gov/ttn/chief/eidocs/eidocfnl.pdf>.
US EPA, 1999b. 40 CFR Part 51––Regional haze regulations:
Final rule. Federal Register, vol. 64, no. 126, pp. 35714–
35774. Available from <http://frwebgate.access.gpo.gov/
cgi-bin/getpage.cgi?position¼ all&page¼ 35714&dbname¼1999_register>.
US EPA, 1999c. SPECIATE: EPA’s repository of total organic
compound and particulate matter speciated profiles for a
variety of sources for use in source apportionment studies.
US Environmental Protection Agency, Office of Air Quality
Planning and Standards, Research Triangle Park, NC.
Available from <http://www.epa.gov/ttn/chief/software/spe-
ciate/>.
US EPA, 2001. Draft guidance for demonstrating attainment of
air quality goals for PM2:5 and regional haze. US Environ-
mental Protection Agency, Research Triangle Park,
NC. Available from <http://vistas-sesarm.org/tech/draftpm.
pdf>.
Watson, J.G., 1979. Chemical element balance receptor model
methodology for assessing the sources of fine and total
suspended particulate matter in Portland, Oregon. Ph.D.
Dissertation, Oregon Graduate Center, Beaverton, OR.
Watson, J.G., 2002a. Visibility: science and regulation. J. Air
Waste Manage. Assoc. 52 (6), 628–713.
Watson, J.G., 2002b. Visibility: science and regulation––a
summary of the 2002 critical review. EM (June), pp. 36–43.
Watson, J.G., Chow, J.C., 2001. Source characterization of
major emission sources in the Imperial and Mexicali valleys
along the US/Mexico border. Sci. Total Environ. 276 (1–3),
33–47.
Watson, J.G., Cooper, J.A., Huntzicker, J.J., 1984. The
effective variance weighting for least squares calculations
applied to the mass balance receptor model. Atmos.
Environ. 18 (7), 1347–1355.
Watson, J.G., Robinson, N.F., Chow, J.C., Henry, R.C., Kim,
B.M., Pace, T.G., Meyer, E.L., Nguyen, Q., 1990. The
USEPA/DRI chemical mass balance receptor model, CMB
7.0. Environ. Software 5 (1), 38–49.
Watson, J.G., Chow, J.C., Lowenthal, D.H., Pritchett, L.C.,
Frazier, C.A., Neuroth, G.R., Robbins, R., 1994. Differ-
ences in the carbon composition of source profiles for diesel-
and gasoline-powered vehicles. Atmos. Environ. 28 (15),
2493–2505.
Watson, J.G., Chow, J.C., Frazier, C.A., 1999. X-ray fluores-
cence analysis of ambient air samples. In: Landsberger, S.,
Creatchman, M. (Eds.), Elemental Analysis of Airborne
Particles, vol. 1. Gordon and Breach Science, Amsterdam,
pp. 67–96.
Watson, J.G., Chow, J.C., Houck, J.E., 2001a. PM2:5 chemical
source profiles for vehicle exhaust, vegetative burning,
geological material, and coal burning in northwestern
Colorado during 1995. Chemosphere 43 (8), 1141–1151.
Watson, J.G., Turpin, B.J., Chow, J.C., 2001b. The measure-
ment process: precision, accuracy, and validity. In: Cohen,
B.S., McCammon, C.S.J. (Eds.), Air Sampling Instruments
for Evaluation of Atmospheric Contaminants, 9th ed.
American Conference of Governmental Industrial Hygien-
ists, Cincinnati, OH, pp. 201–216.
Watson, J.G., Zhu, T., Chow, J.C., Engelbrecht, J.P., Fujita,
E.M., Wilson, W.E., 2002. Receptor modeling application
framework for particle source apportionment. Chemosphere
49 (9), 1093–1136.
Welch, W., 1997. Standardized test kitchen and screening tools
evaluation for South Coast Air Quality Management Dis-
trict proposed rule 1138. Report no. S-C95073. Prepared for
South Coast Air Quality Management District, El Monte,
CA, by CE-CERT, University of California, Riverside, CA.
Yu, J.Z., Xu, J.H., Yang, H., 2002. Charring characteristics of
atmospheric organic particulate matter in thermal analysis.
Environ. Sci. Technol. 36 (4), 754–761.
Related Documents