Some Possibly Useful Graphics Functions Lunch presentation

Some Possibly Useful Graphics Functions Lunch presentation.
Dec 24, 2015
Welcome message from author
This document is posted to help you gain knowledge. Please leave a comment to let me know what you think about it! Share it to your friends and learn new things together.
Transcript

Some Possibly Useful Graphics Functions
Lunch presentation

GGPlot2
• Hadley Wickham• Grammar Of Graphics• GGPlot2 Website• If I see it on the GGPlot2 page it might be
easier/better looking to use than using R plot function

Syntax
• What I’m used to:– Plot(x,y, col=whatever, main=whatever)
– Legend(…)
– par(mfrow=c(1,2))
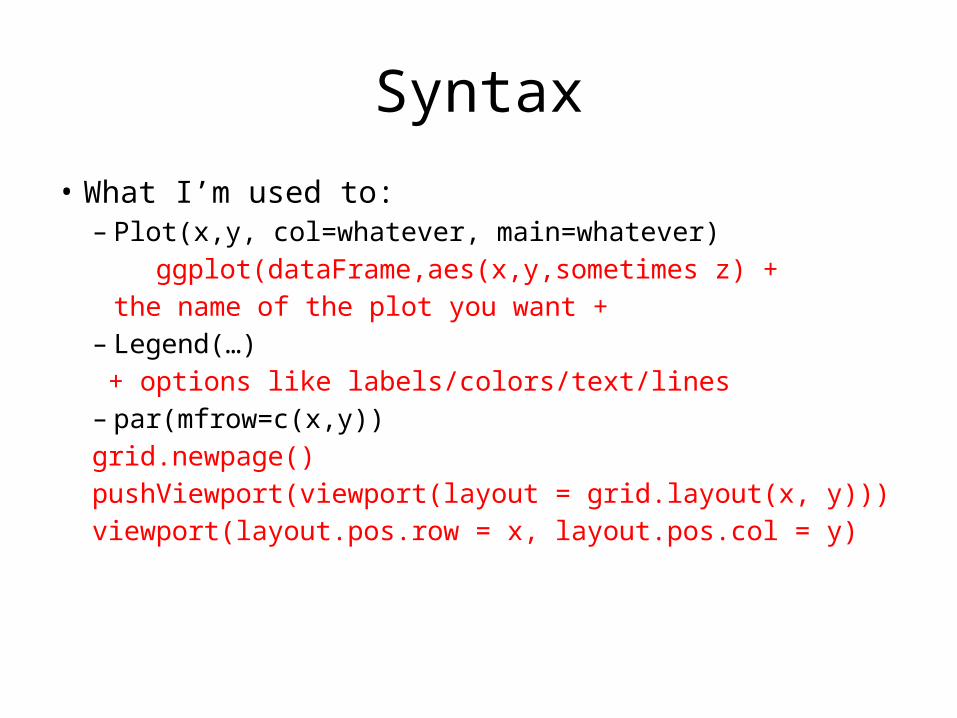
Syntax
• What I’m used to:– Plot(x,y, col=whatever, main=whatever) ggplot(dataFrame,aes(x,y,sometimes z) +
the name of the plot you want +– Legend(…) + options like labels/colors/text/lines– par(mfrow=c(x,y))grid.newpage()pushViewport(viewport(layout = grid.layout(x, y)))viewport(layout.pos.row = x, layout.pos.col = y)

How Might it be Useful
1) Do you have your data in a data.frame?2) Are you ok with acceding control of the
details?3) Do you anticipate summarizing your data by
one or more variables in your data frame?4) Do you see your plot or something like it on
Hadley’s page?
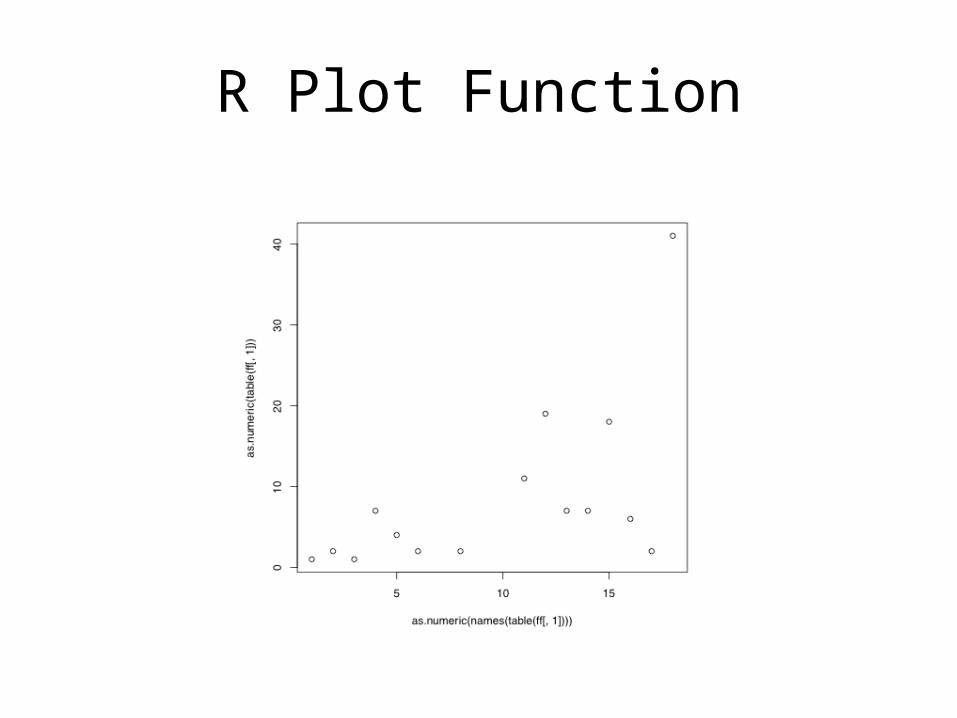
R Plot Function

R Plot Function Again
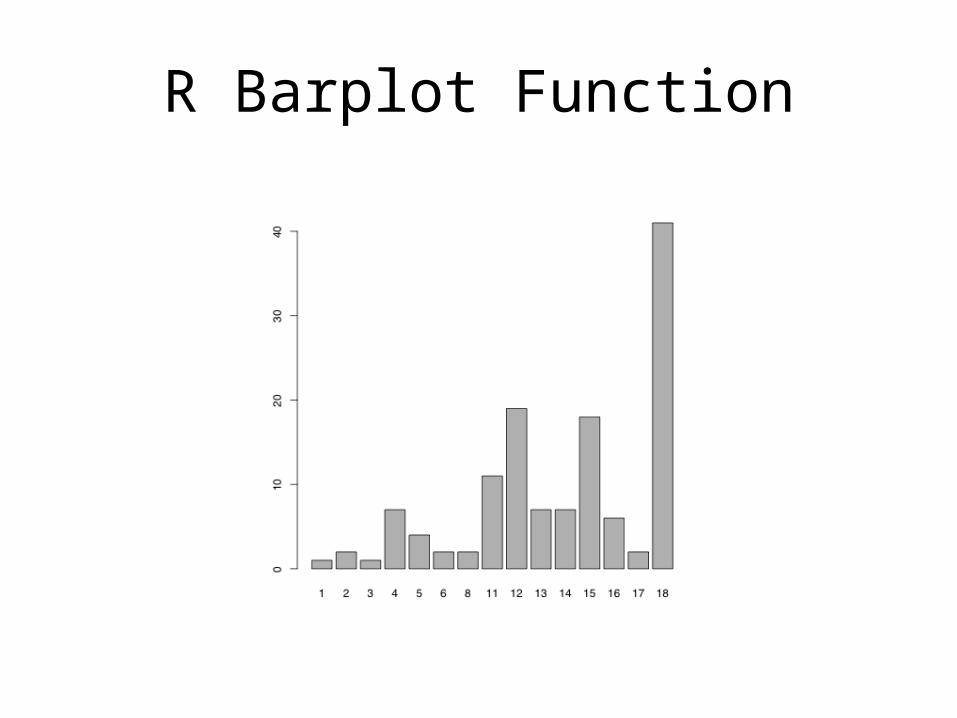
R Barplot Function
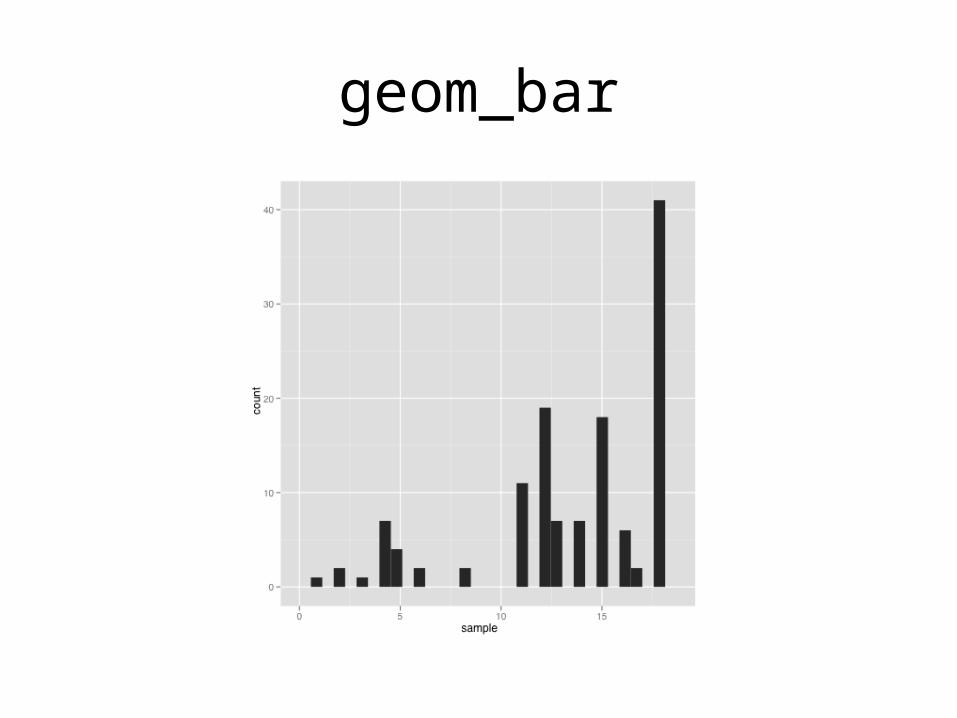
geom_bar

Specify Factor Levels

Specify Arbitrary Factor Levels
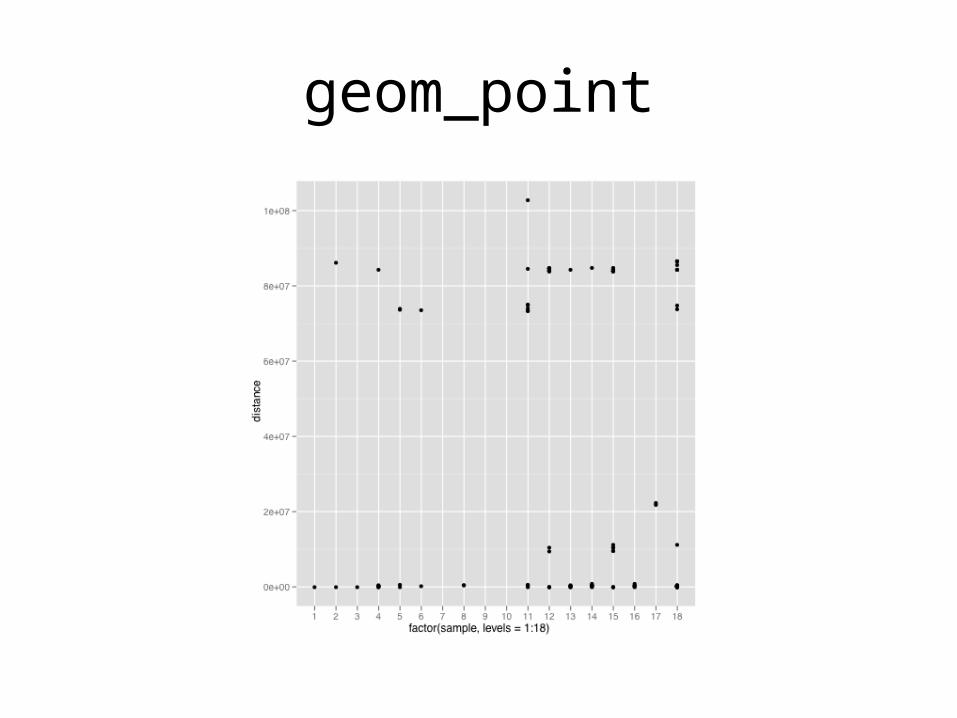
geom_point
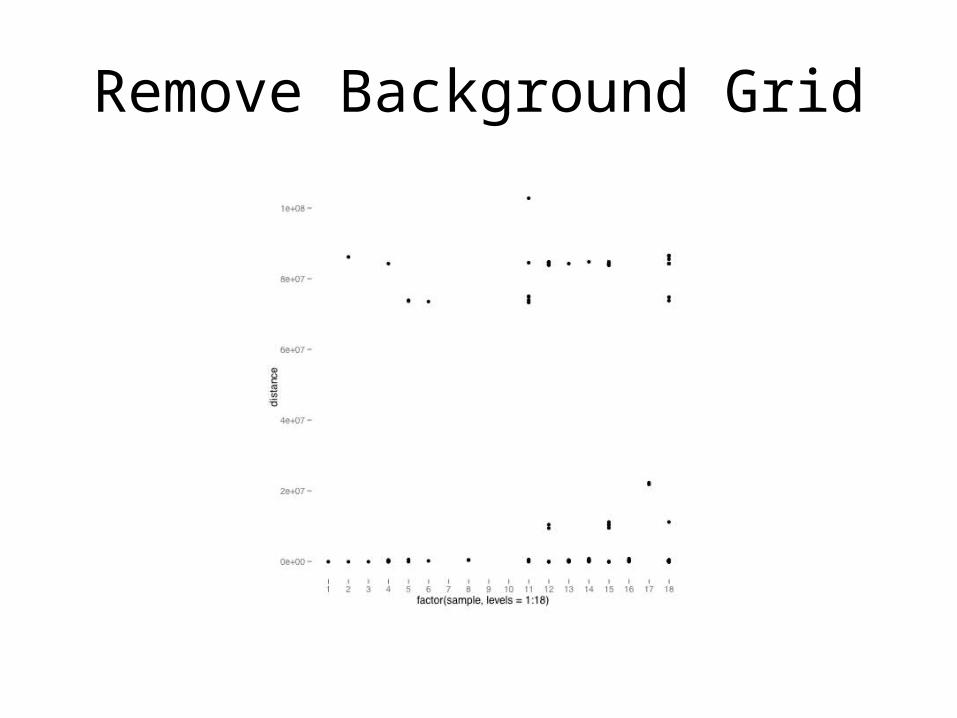
Remove Background Grid
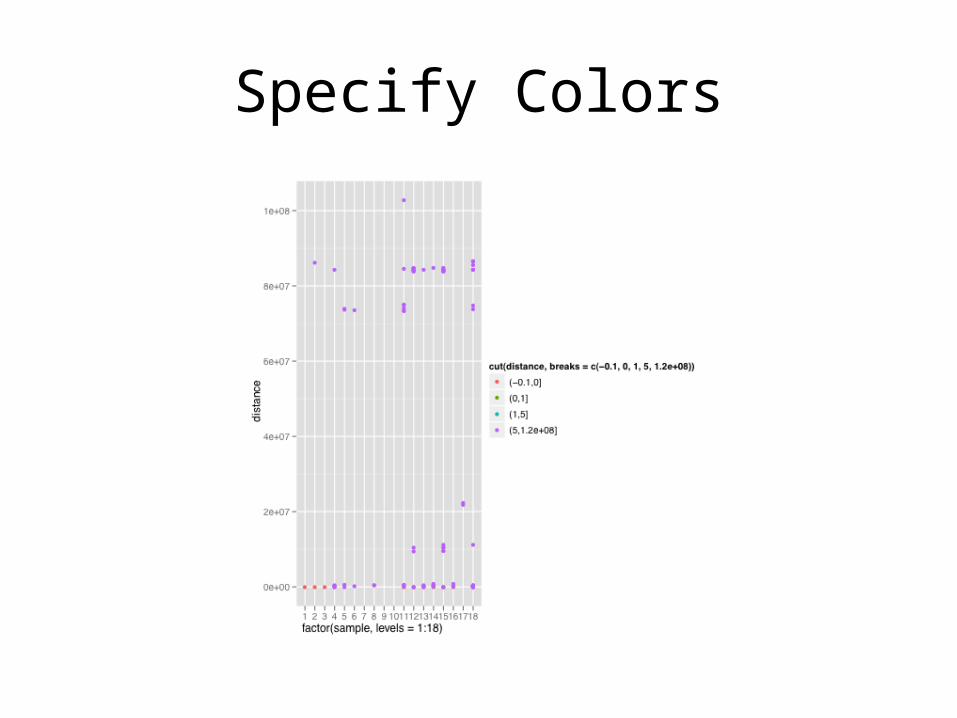
Specify Colors
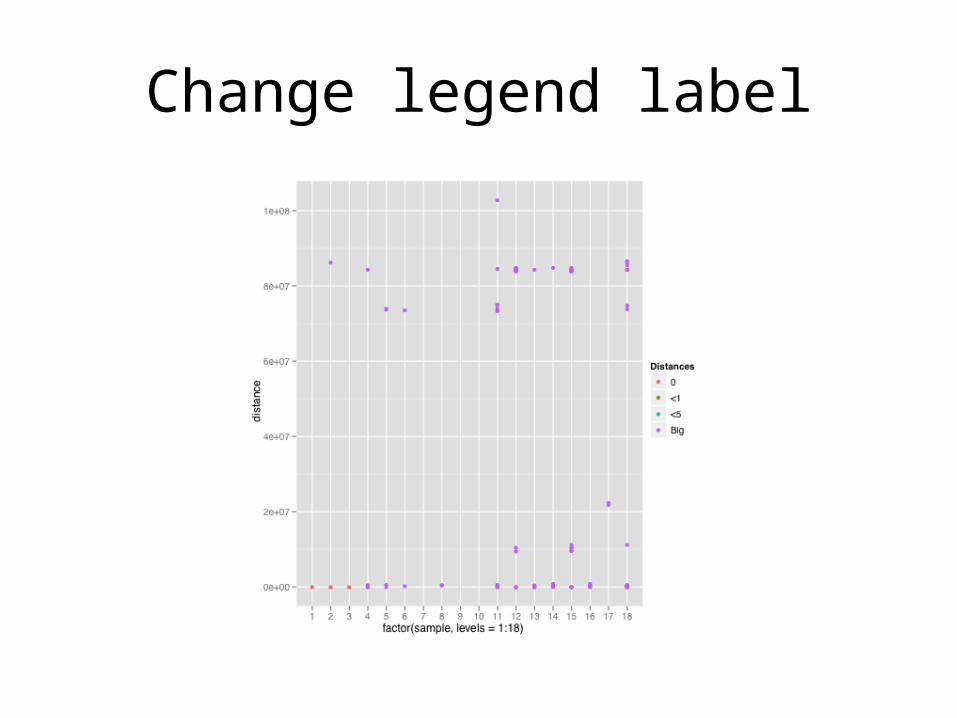
Change legend label
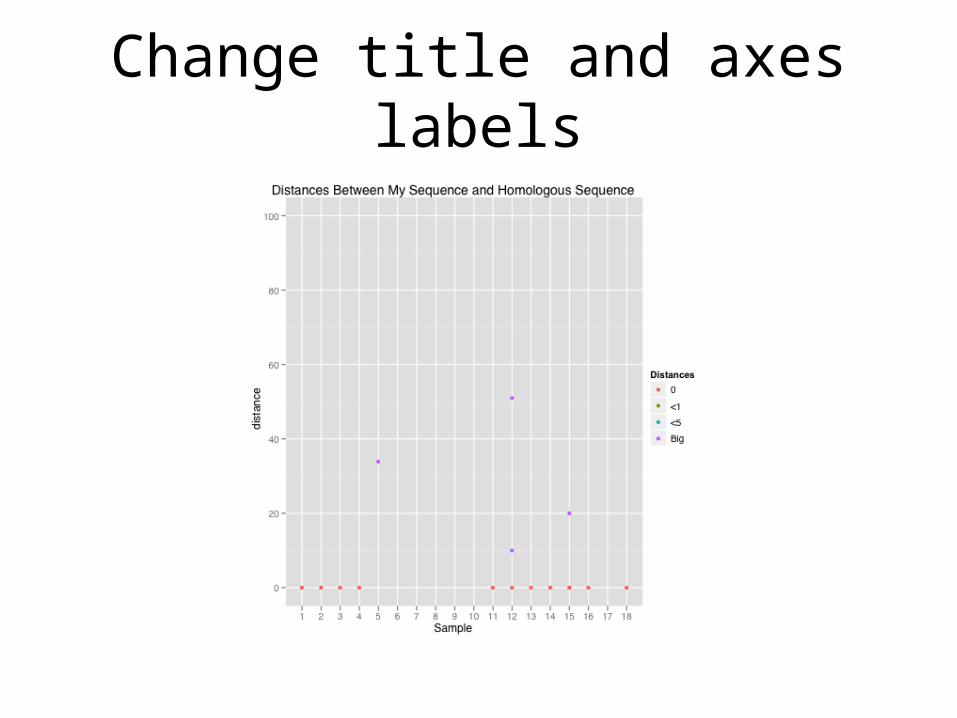
Change title and axes labels

geom_point

Facet by sample
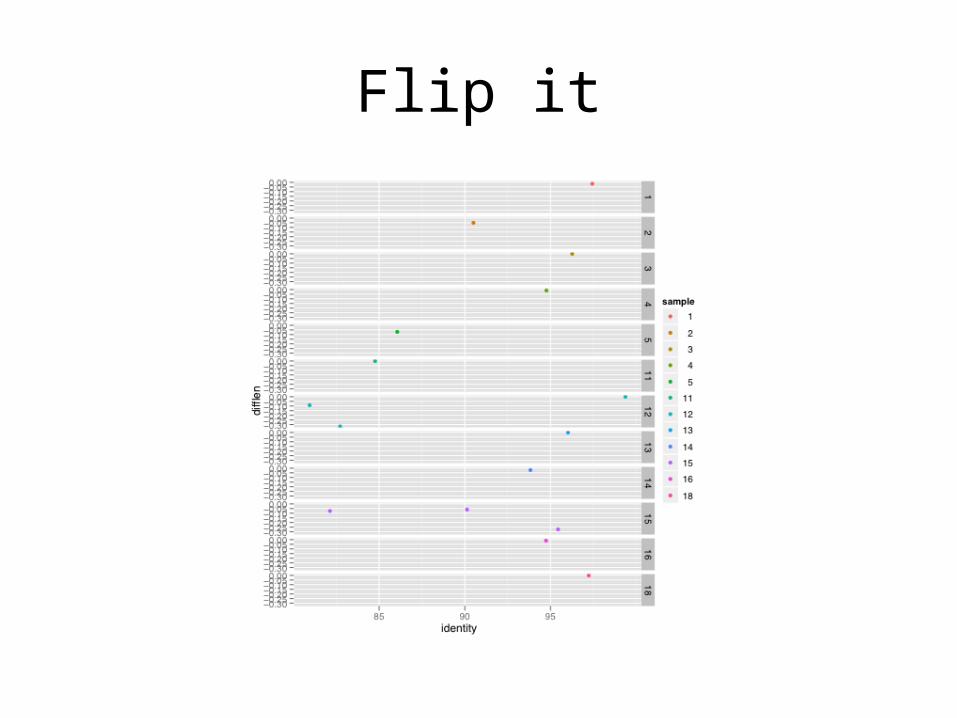
Flip it
Related Documents