ECE 333 Green Electric Energy Lecture 16 Solar Position (4.4); Sun Path Diagrams and Shading (4.5); Clear-Sky Direct-Beam Radiation (4.9) Professor Andrew Stillwell Department of Electrical and Computer Engineering Slides Courtesy of Prof. Tim O’Connell and George Gross

Welcome message from author
This document is posted to help you gain knowledge. Please leave a comment to let me know what you think about it! Share it to your friends and learn new things together.
Transcript
ECE 333
Green Electric Energy
Lecture 16Solar Position (4.4); Sun Path Diagrams and Shading
(4.5); Clear-Sky Direct-Beam Radiation (4.9)
Professor Andrew StillwellDepartment of Electrical and
Computer EngineeringSlides Courtesy of Prof. Tim O’Connell and George
Gross
Announcements
Announcements: Exam 2 Details Today
4.3: Review: Altitude Angle of the Sun at Solar Noon 4.4: Solar Position at Any Time of Day 4.5: Sun Path Diagrams for Shading Analysis 4.9: Clear-Sky Direct-Beam Radiation

Exam 2 Discussion
Date: April 9th
Format: same as Exam 1 Time: 24-hour window on April 9th
Length: same as Exam 1 Resources: Open book, open notes, open computer -
You are welcome to use any resource except another person. Bonus points: 5 bonus points on Exam 2 for attaching
your handwritten note sheets for Exam 1 and 2 (8.5” x 11”, front and back) Attach to the end of the test Submission: through Gradescope
3
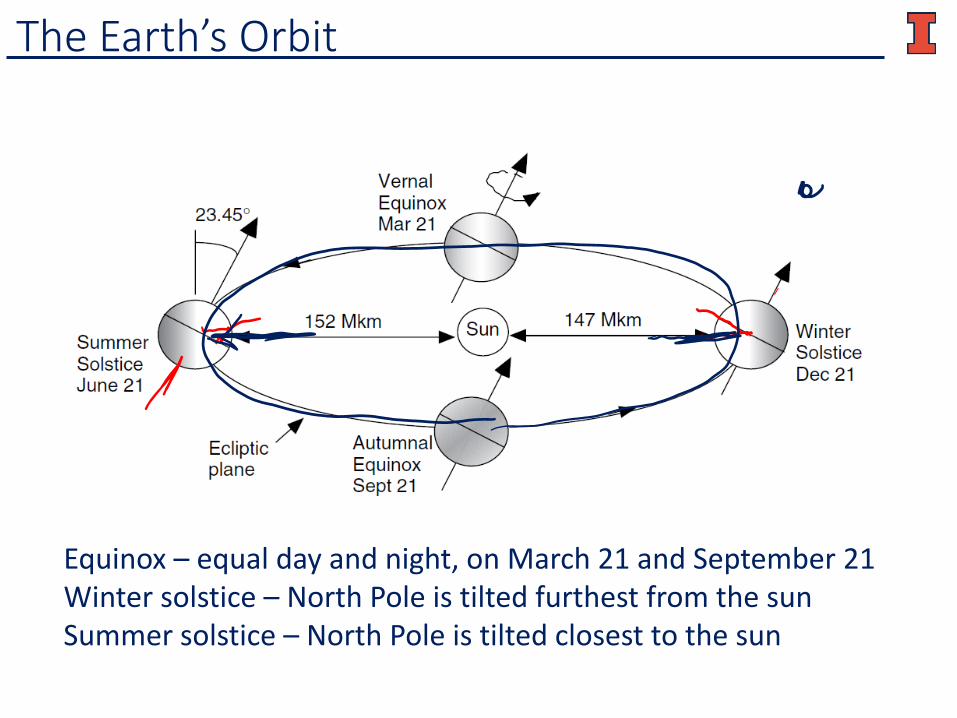
The Earth’s Orbit
Equinox – equal day and night, on March 21 and September 21Winter solstice – North Pole is tilted furthest from the sunSummer solstice – North Pole is tilted closest to the sun
Solar declination δ – the angle formed between the plane of the equator and the line from the center of the sun to the center of the earthδ varies between +/- 23.45˚
4.3: Altitude Angle of the Sun at Solar Noon
The Sun’s Position in the Sky
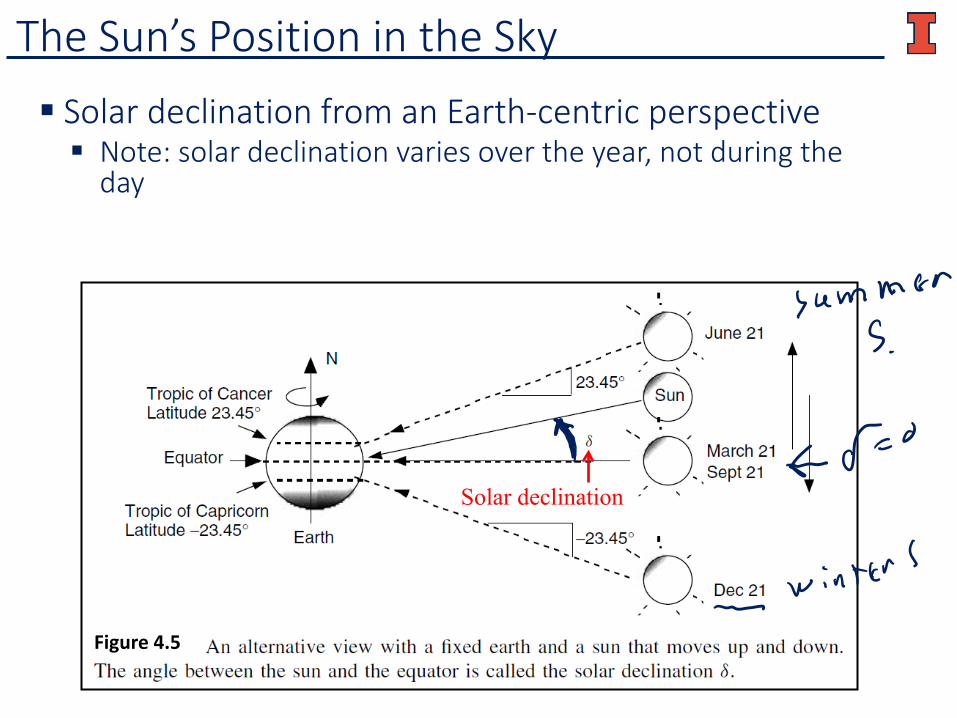
Solar declination
Figure 4.5
Solar declination from an Earth-centric perspective Note: solar declination varies over the year, not during the
day
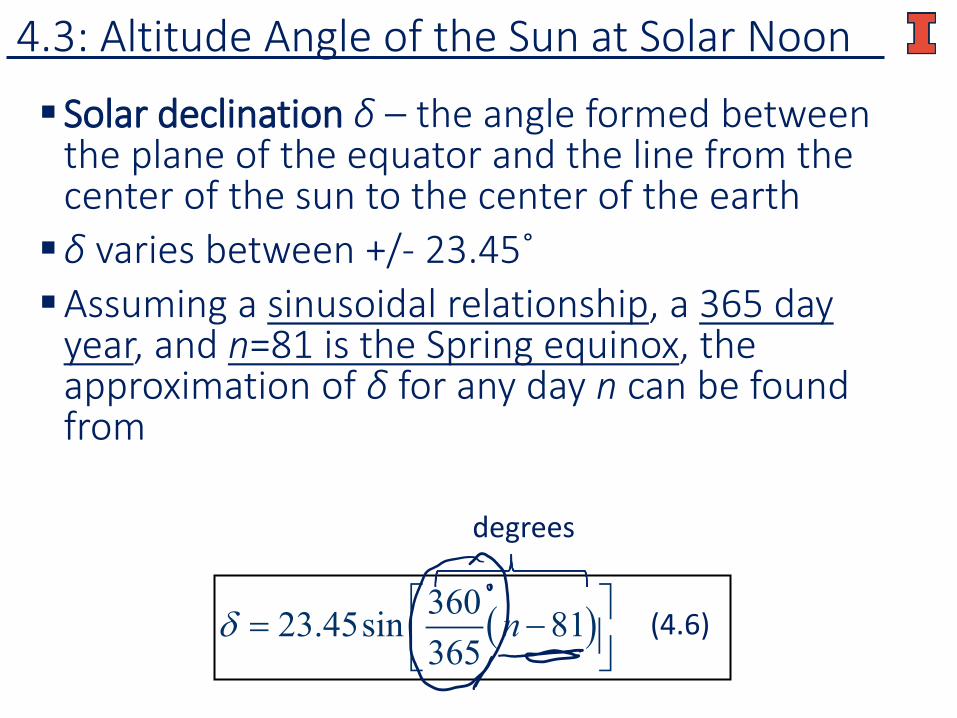
Solar declination δ – the angle formed between the plane of the equator and the line from the center of the sun to the center of the earthδ varies between +/- 23.45˚Assuming a sinusoidal relationship, a 365 day
year, and n=81 is the Spring equinox, the approximation of δ for any day n can be found from
4.3: Altitude Angle of the Sun at Solar Noon
( )36023.45sin 81 (7.6)365
nδ = −
degrees
(4.6)
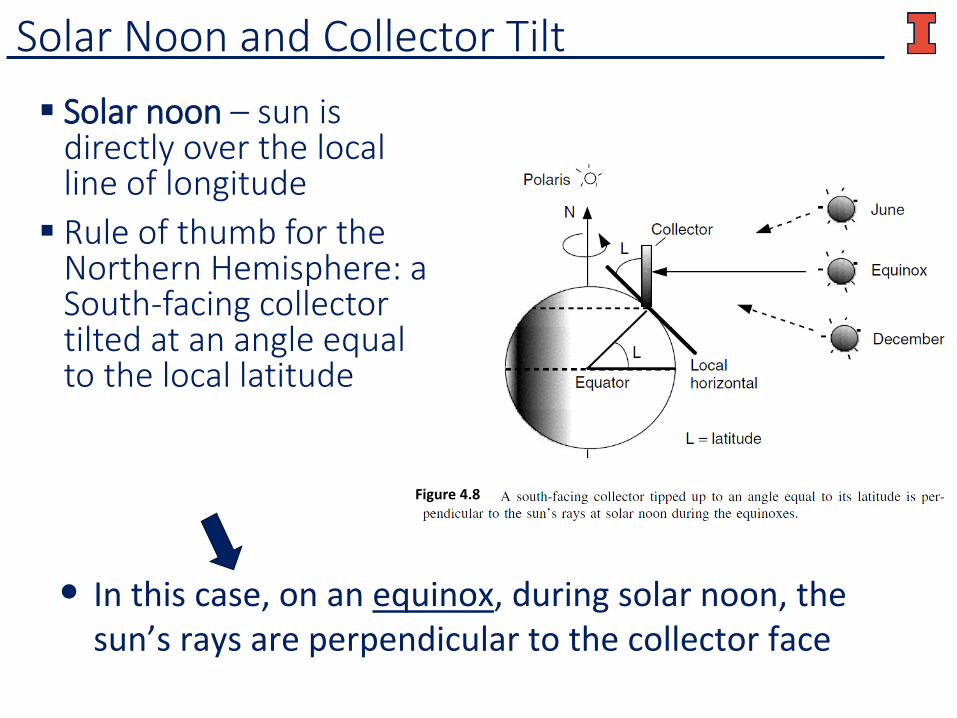
Solar Noon and Collector Tilt
• In this case, on an equinox, during solar noon, the sun’s rays are perpendicular to the collector face
Figure 4.8
Solar noon – sun is directly over the local line of longitude Rule of thumb for the
Northern Hemisphere: a South-facing collector tilted at an angle equal to the local latitude
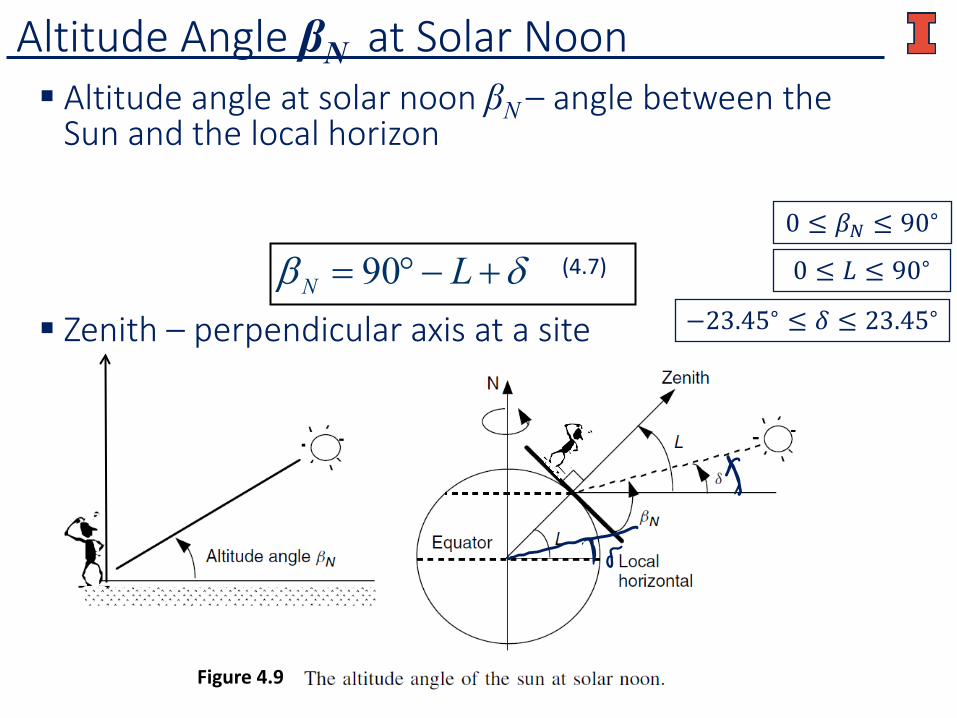
Altitude Angle βN at Solar Noon
90 (7.7)N Lβ δ= °− +
Figure 4.9
(4.7)
0 ≤ 𝛽𝛽𝑁𝑁 ≤ 90∘
0 ≤ 𝐿𝐿 ≤ 90∘
−23.45∘ ≤ 𝛿𝛿 ≤ 23.45∘
Altitude angle at solar noon βN – angle between the Sun and the local horizon
Zenith – perpendicular axis at a site
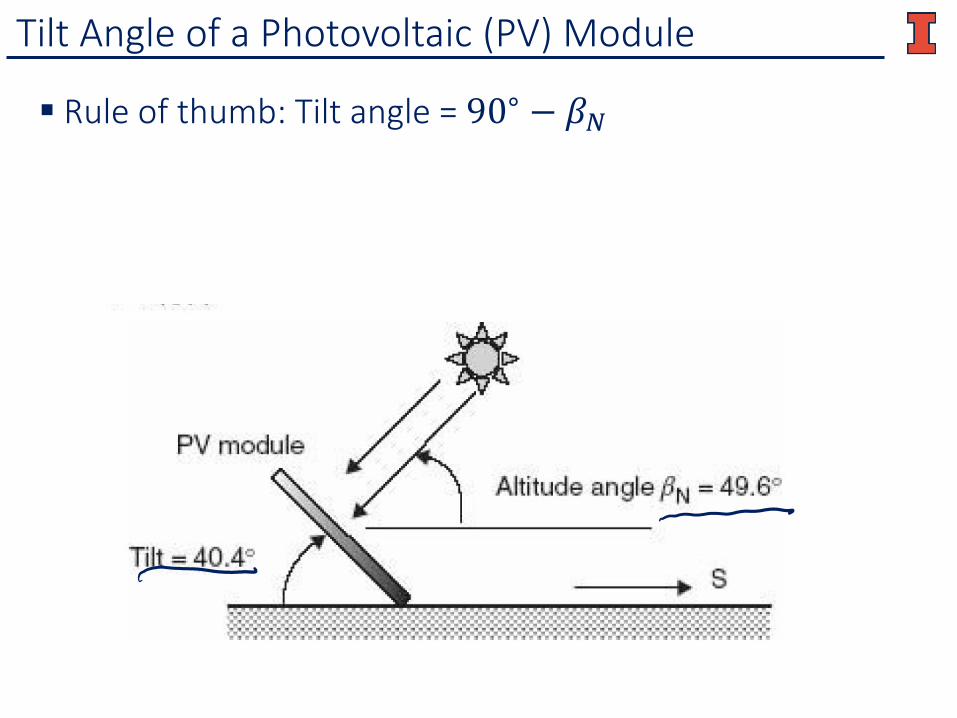
Tilt Angle of a Photovoltaic (PV) Module
Rule of thumb: Tilt angle = 90∘ − 𝛽𝛽𝑁𝑁
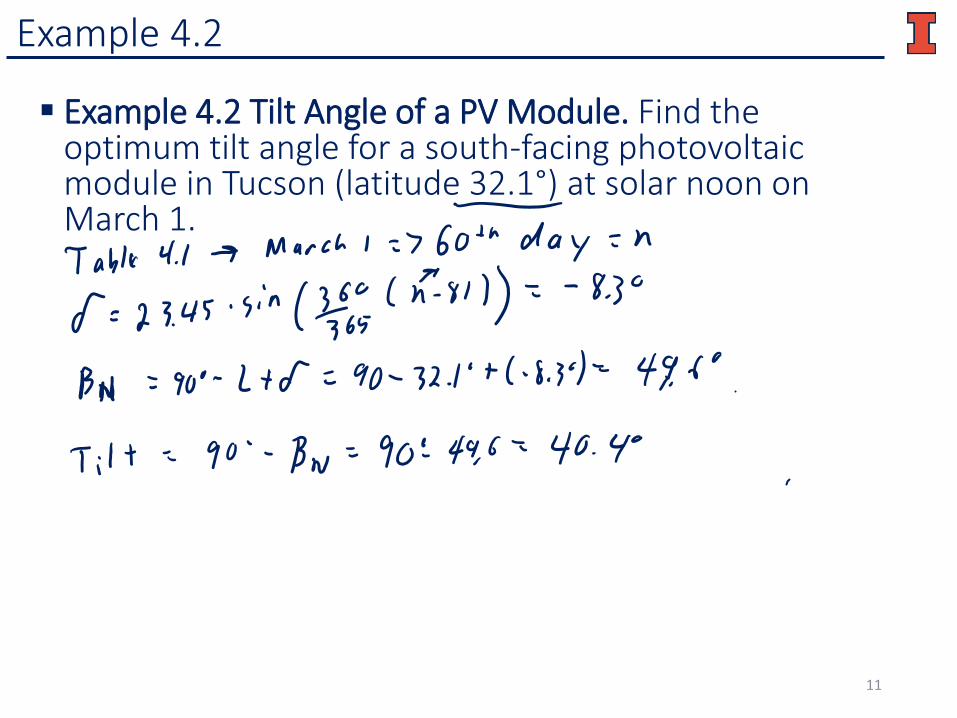
Example 4.2
Example 4.2 Tilt Angle of a PV Module. Find the optimum tilt angle for a south-facing photovoltaic module in Tucson (latitude 32.1°) at solar noon on March 1.
11
4.4: Solar Position at Any Time of Day
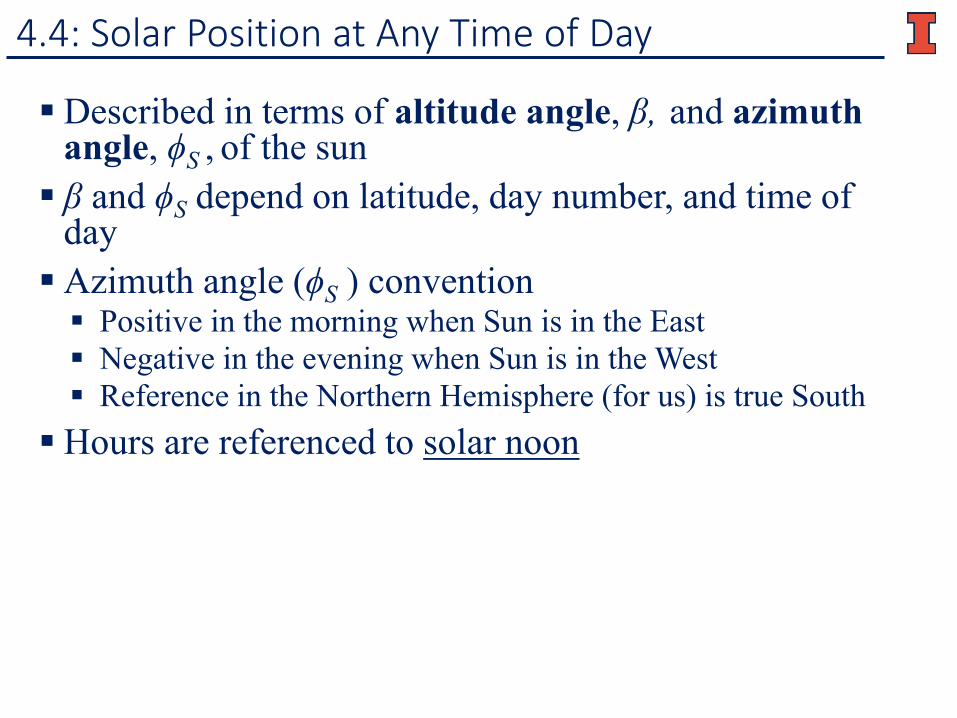
Described in terms of altitude angle, β, and azimuth angle, ϕS , of the sun β and ϕS depend on latitude, day number, and time of
dayAzimuth angle (ϕS ) convention Positive in the morning when Sun is in the East Negative in the evening when Sun is in the West Reference in the Northern Hemisphere (for us) is true SouthHours are referenced to solar noon
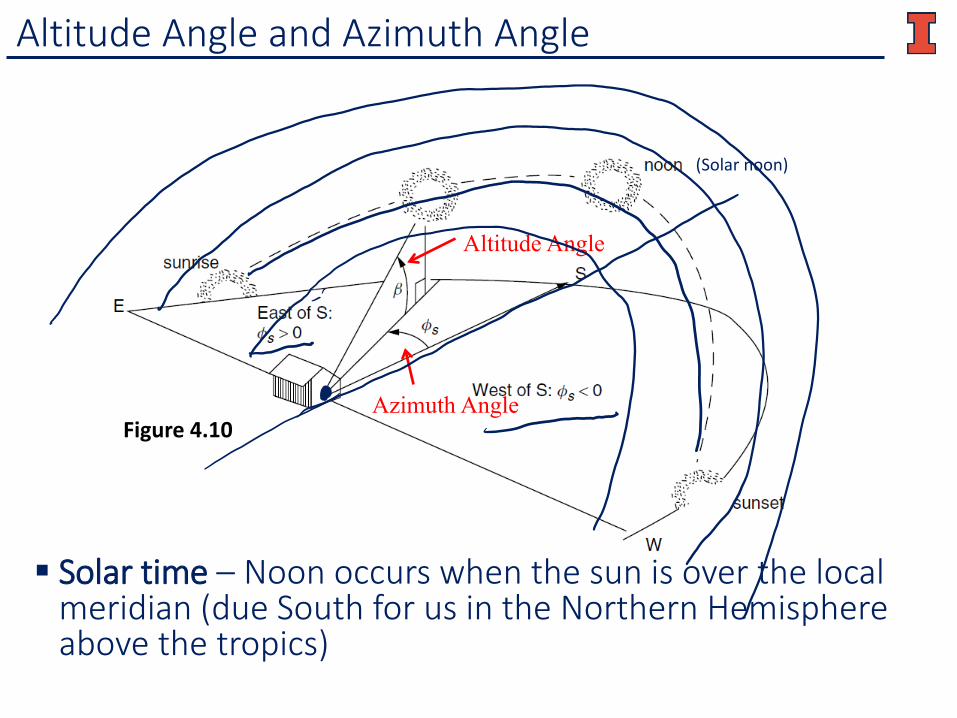
Altitude Angle and Azimuth Angle
Azimuth Angle
Altitude Angle
Solar time – Noon occurs when the sun is over the local meridian (due South for us in the Northern Hemisphere above the tropics)
(Solar noon)
Figure 4.10
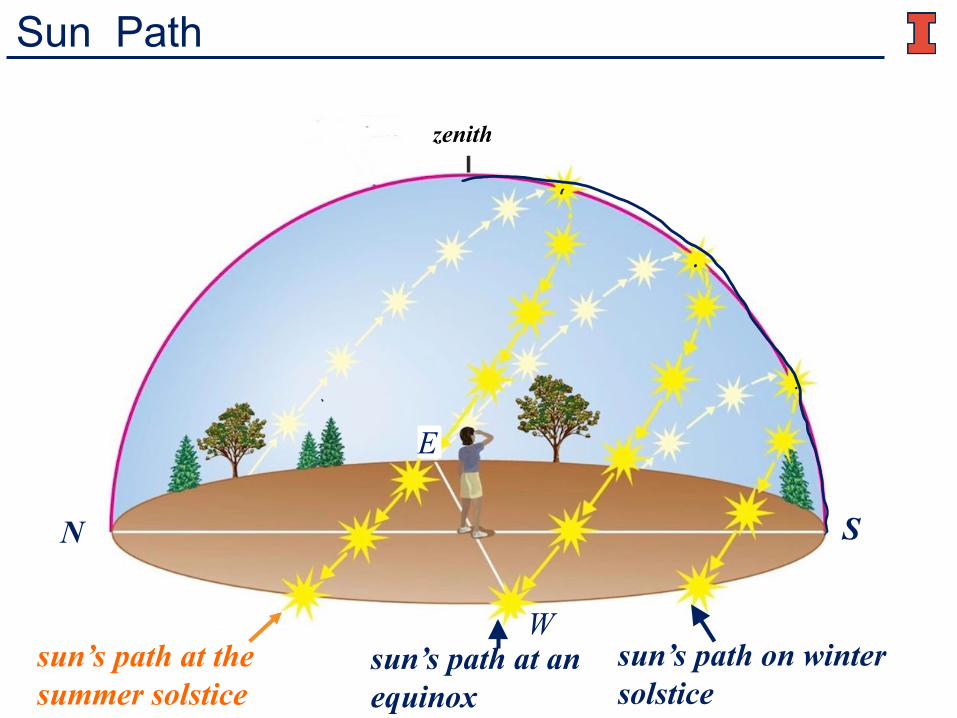
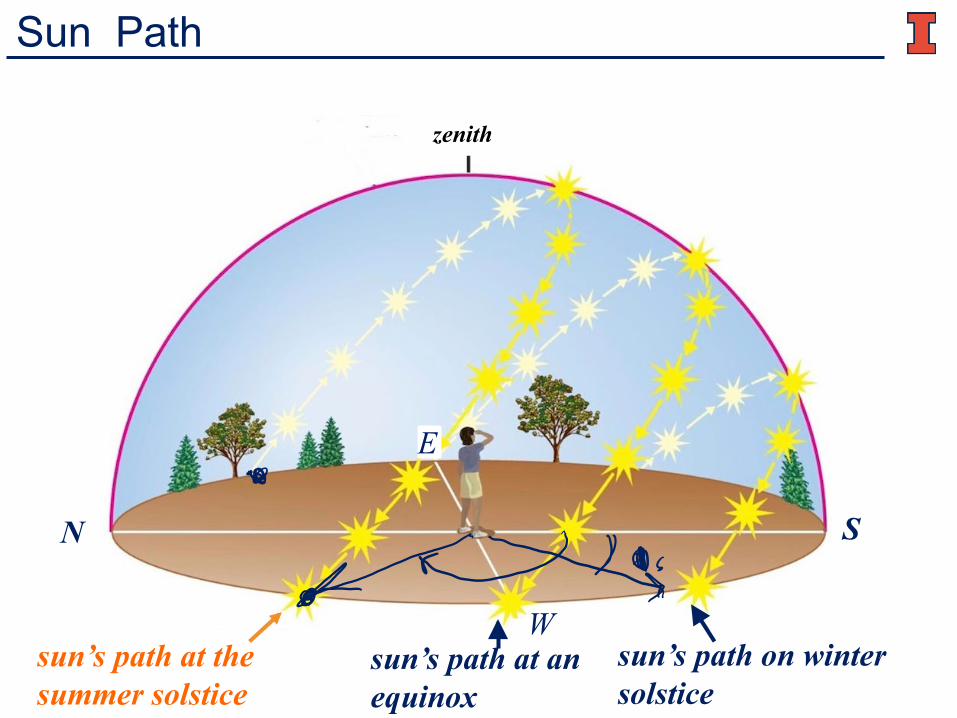
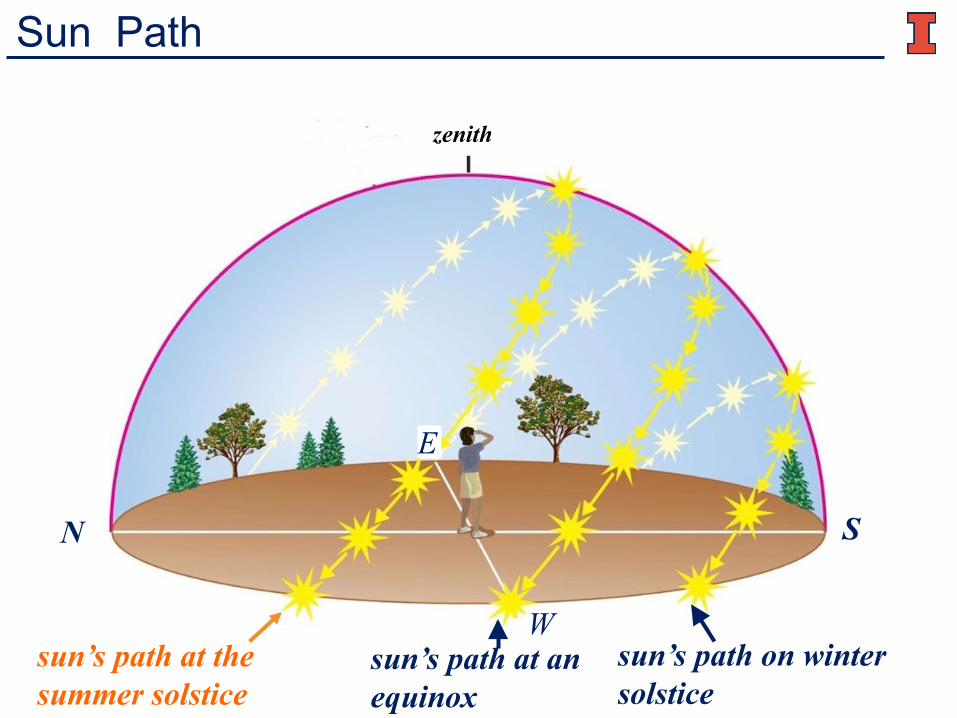
Sun Path
sun’s path at the summer solstice
sun’s path at an equinox
sun’s path on winter solstice
zenith
N S
W
E
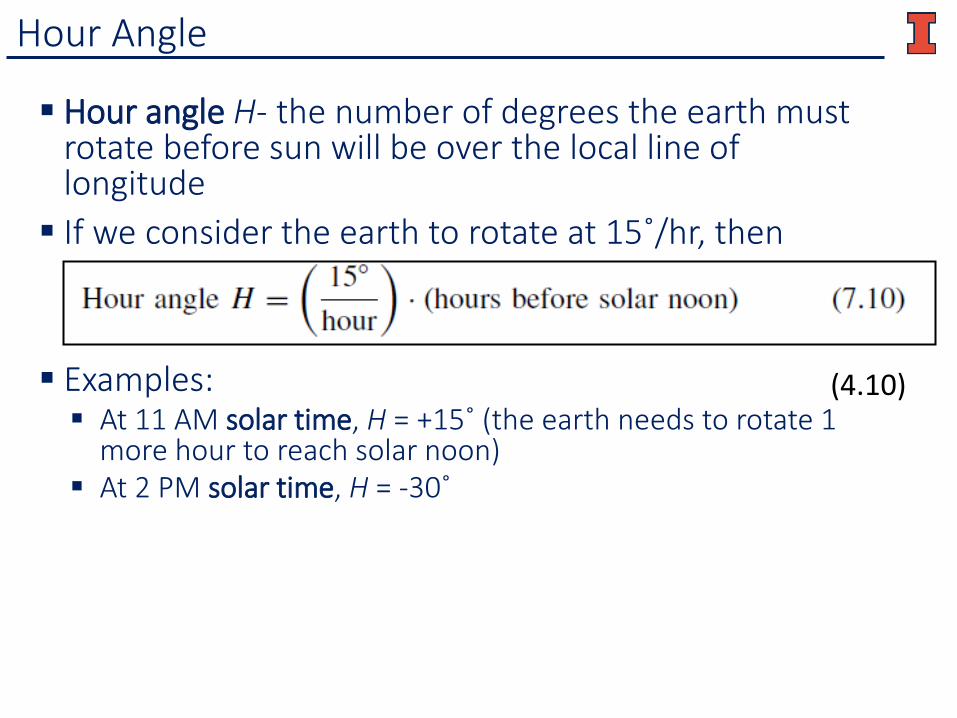
Hour Angle
Hour angle H- the number of degrees the earth must rotate before sun will be over the local line of longitude If we consider the earth to rotate at 15˚/hr, then
Examples: At 11 AM solar time, H = +15˚ (the earth needs to rotate 1
more hour to reach solar noon) At 2 PM solar time, H = -30˚
(4.10)
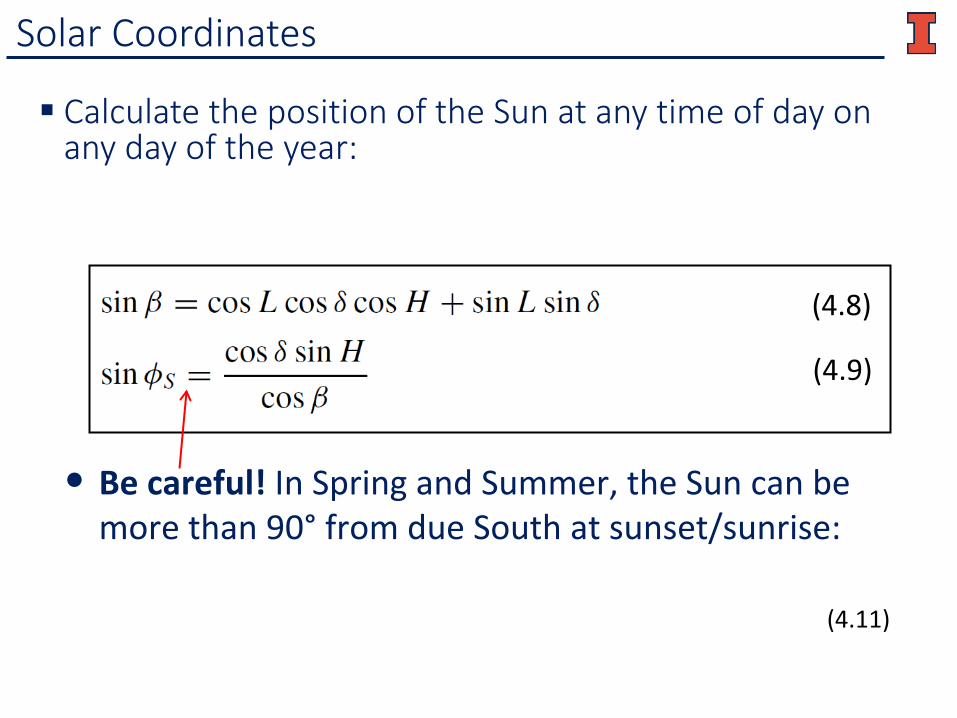
Solar Coordinates
Calculate the position of the Sun at any time of day on any day of the year:
• Be careful! In Spring and Summer, the Sun can be more than 90° from due South at sunset/sunrise:
(4.8)
(4.9)
(4.11)
Sun Path
sun’s path at the summer solstice
sun’s path at an equinox
sun’s path on winter solstice
zenith
N S
W
E
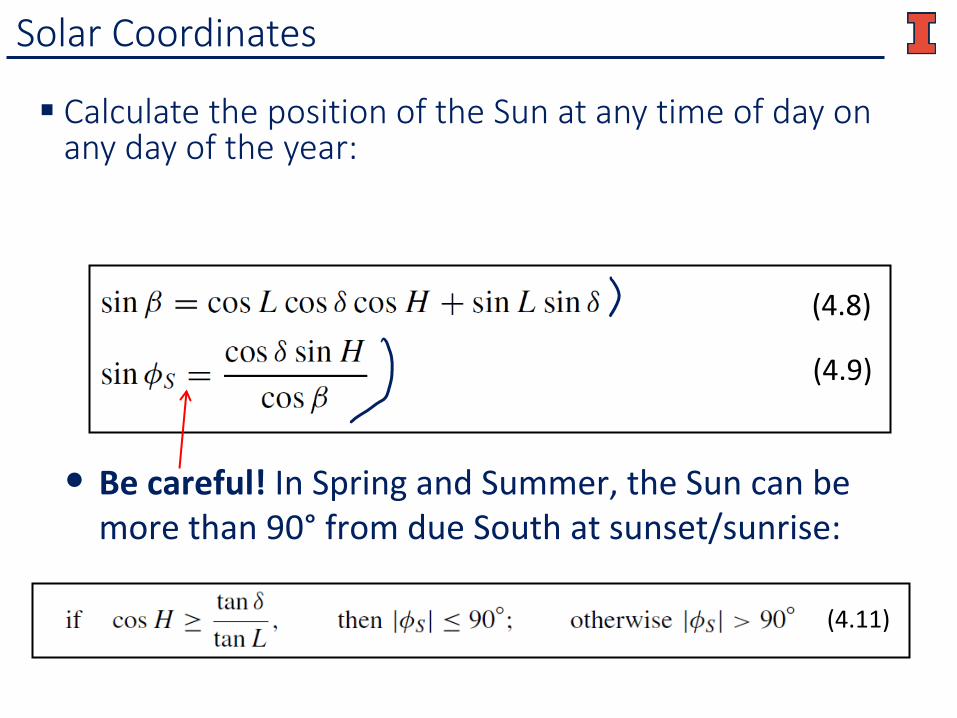
Solar Coordinates
Calculate the position of the Sun at any time of day on any day of the year:
• Be careful! In Spring and Summer, the Sun can be more than 90° from due South at sunset/sunrise:
(4.8)
(4.9)
(4.11)
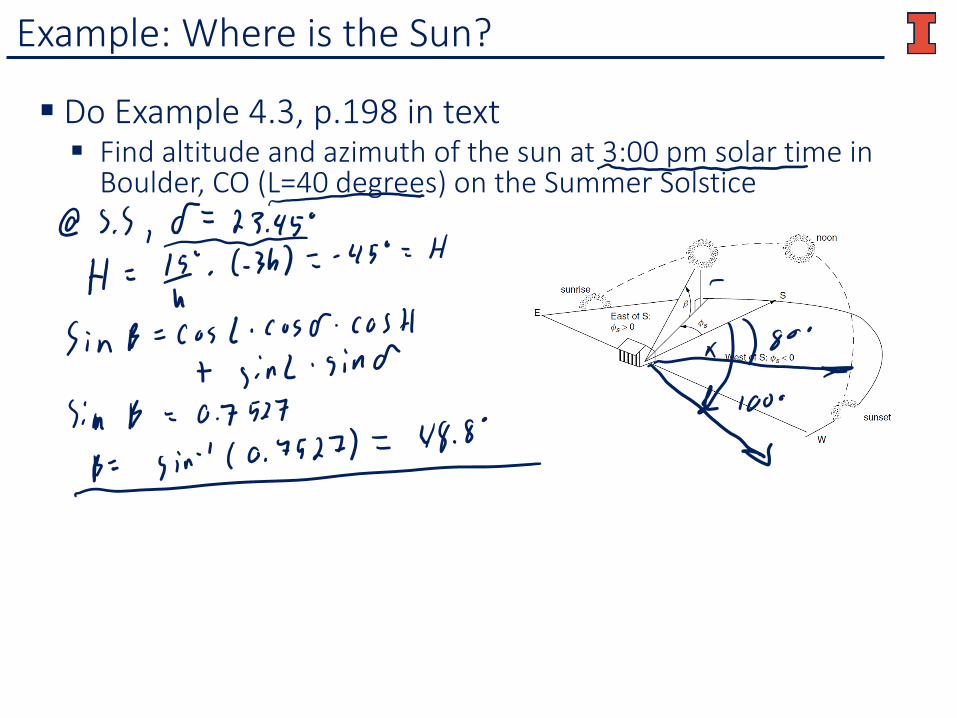
Example: Where is the Sun?
Do Example 4.3, p.198 in text Find altitude and azimuth of the sun at 3:00 pm solar time in
Boulder, CO (L=40 degrees) on the Summer Solstice
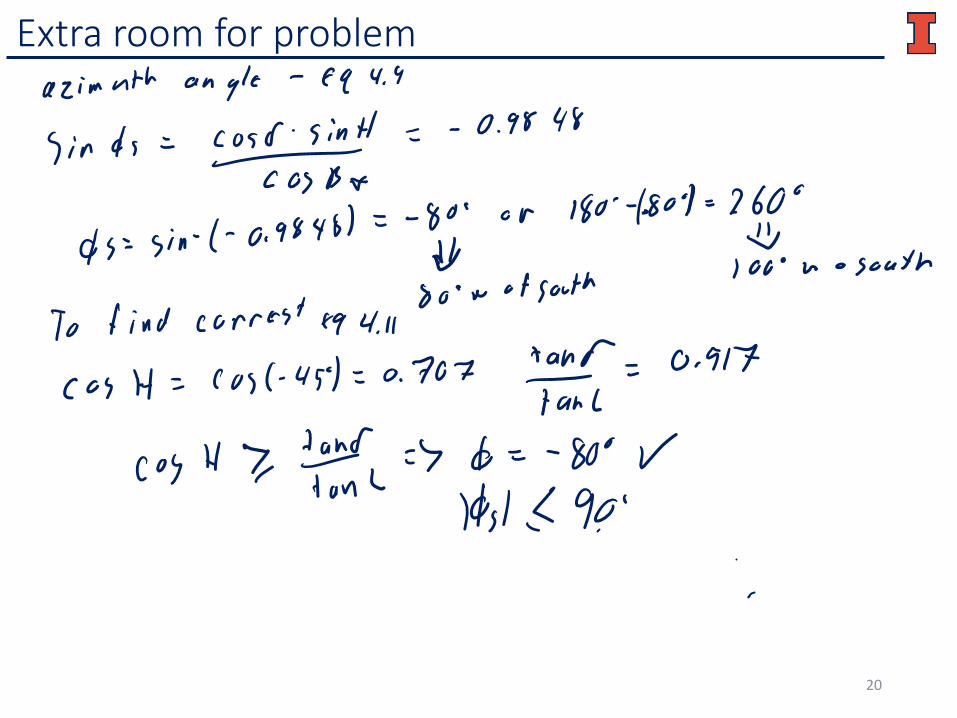
Extra room for problem
20
Sun Path
sun’s path at the summer solstice
sun’s path at an equinox
sun’s path on winter solstice
zenith
N S
W
E
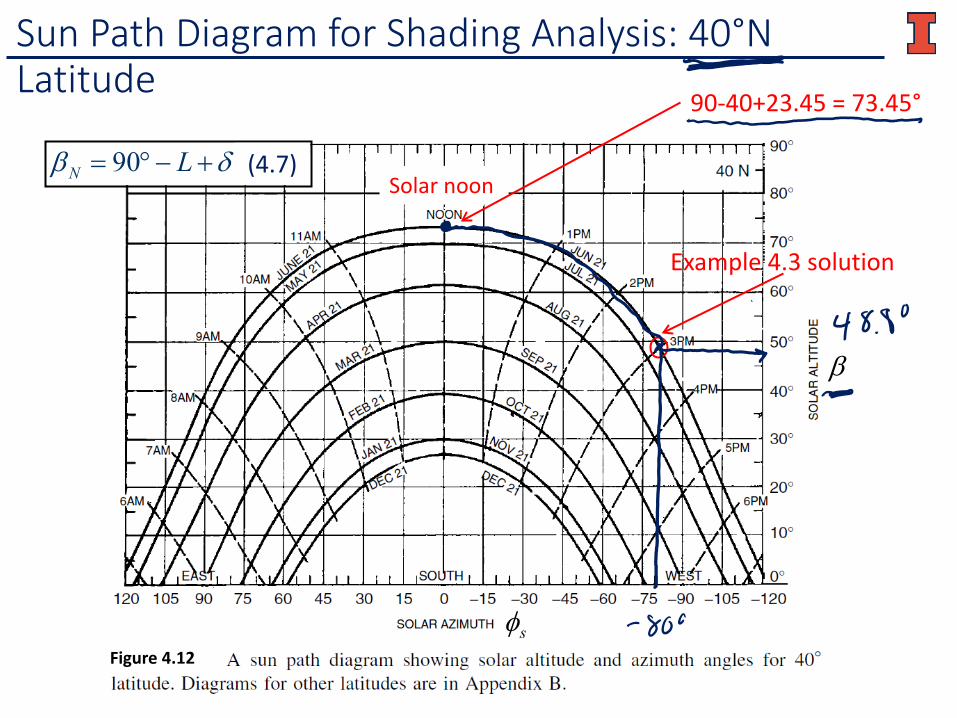
Sun Path Diagram for Shading Analysis: 40°N Latitude
Solar noon90 (7.7)N Lβ δ= °− +
90-40+23.45 = 73.45°
sφ
β
Example 4.3 solution
Figure 4.12
(4.7)
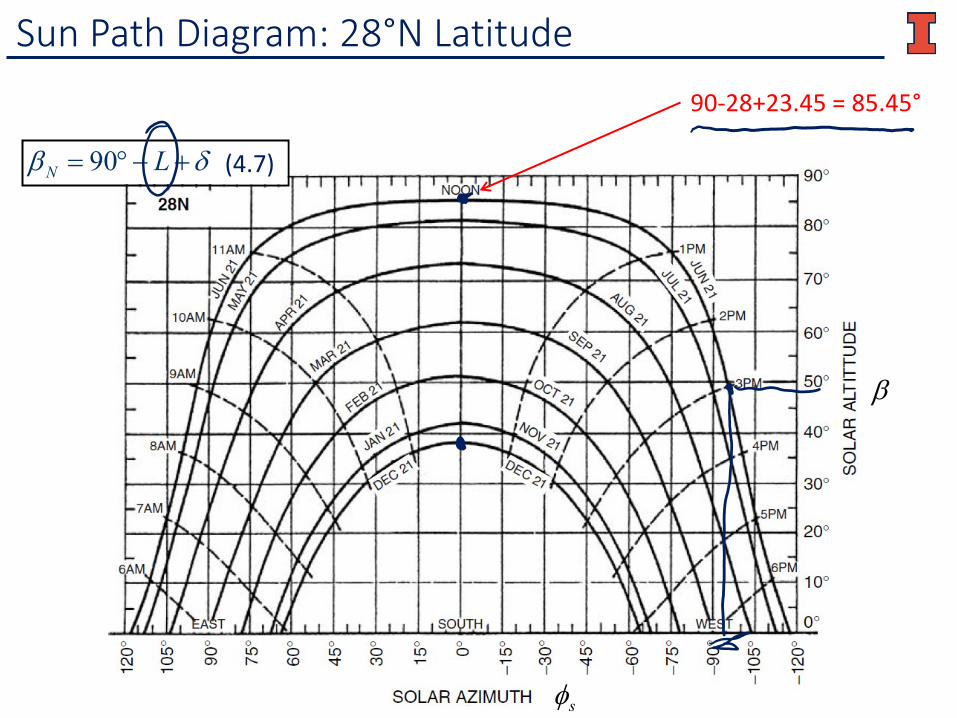
Sun Path Diagram: 28°N Latitude
90 (7.7)N Lβ δ= °− +
90-28+23.45 = 85.45°
β
sφ
(4.7)
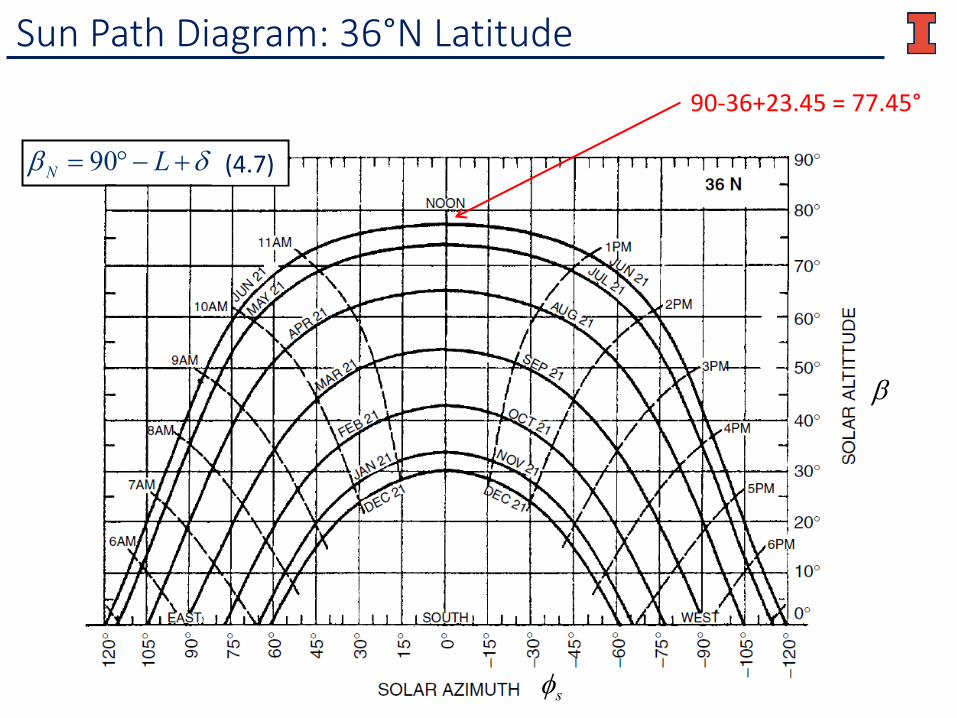
Sun Path Diagram: 36°N Latitude
90 (7.7)N Lβ δ= °− +
90-36+23.45 = 77.45°
sφ
β
(4.7)
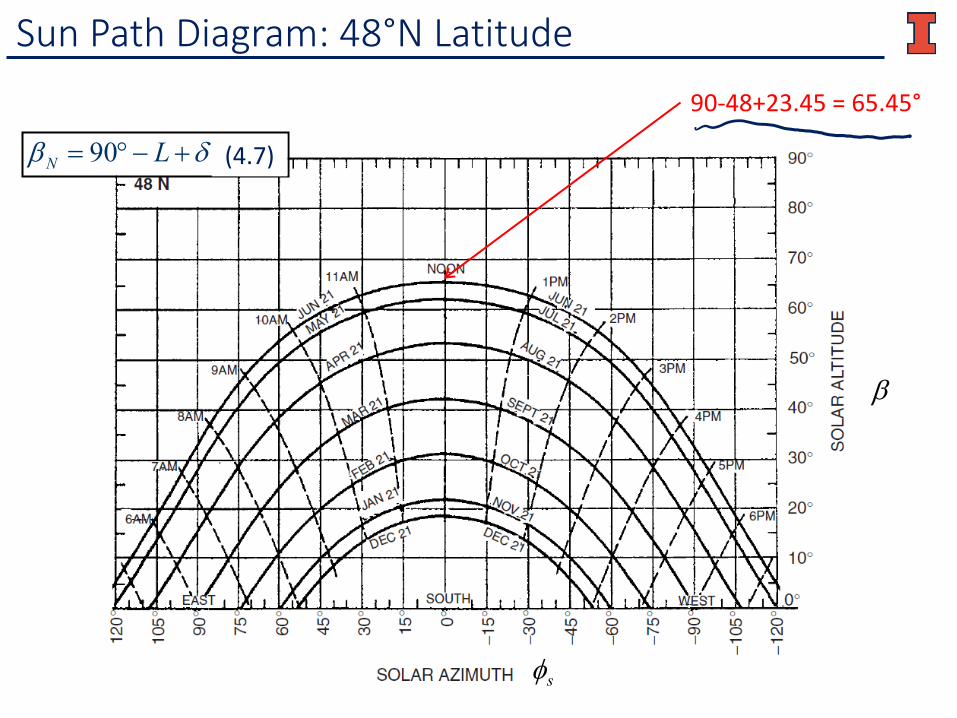
Sun Path Diagram: 48°N Latitude
90-48+23.45 = 65.45°
90 (7.7)N Lβ δ= °− +
β
sφ
(4.7)
4.5: Sun Path Diagrams for Shading Analysis
Now we know how to locate the sun in the sky at any time This can also help determine what sites will be in the
shade at any time Sketch the azimuth and altitude angles of trees, buildings,
and other obstructions Sections of the sun path diagram that are covered indicate
times when the site will be in the shade Shading of a portion of a solar panel could greatly
reduce the output for the full panel (depending upon design)
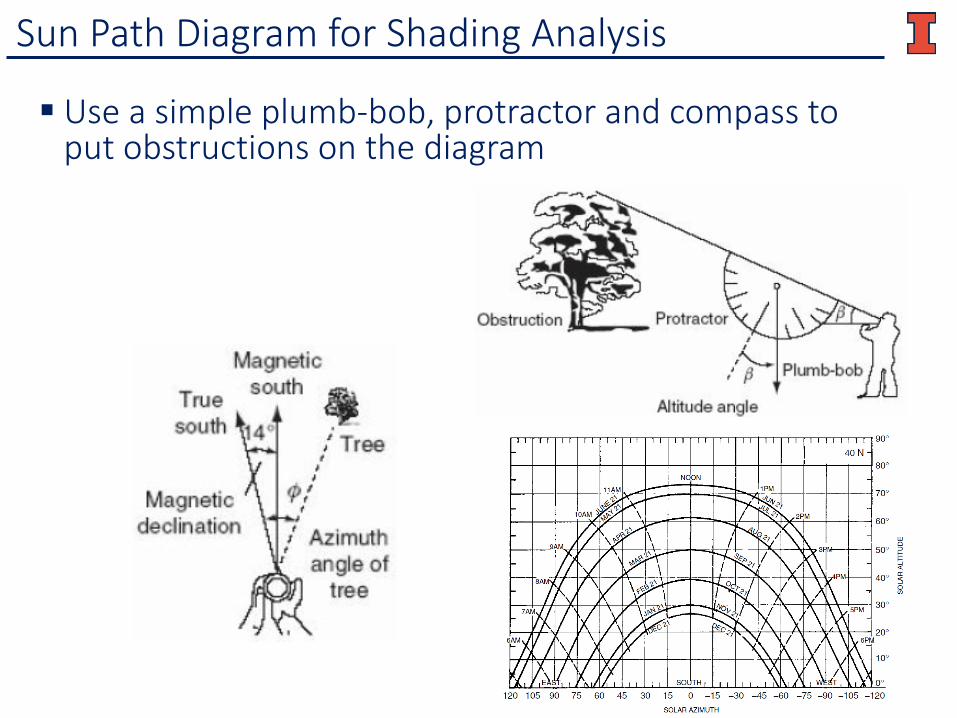
Sun Path Diagram for Shading Analysis
Use a simple plumb-bob, protractor and compass to put obstructions on the diagram
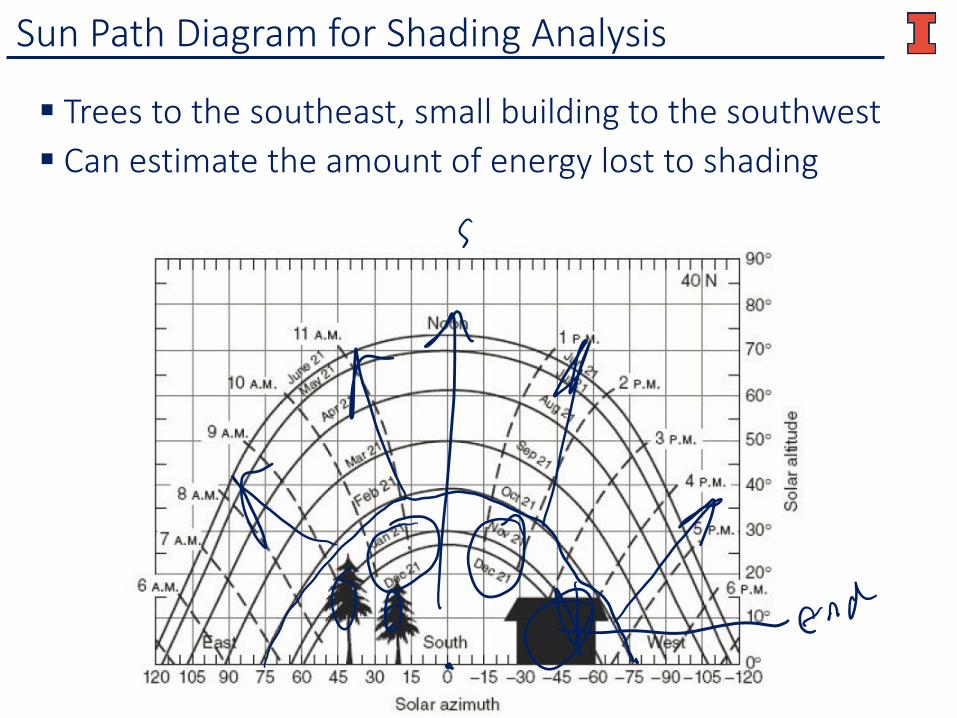
Sun Path Diagram for Shading Analysis
Trees to the southeast, small building to the southwest Can estimate the amount of energy lost to shading
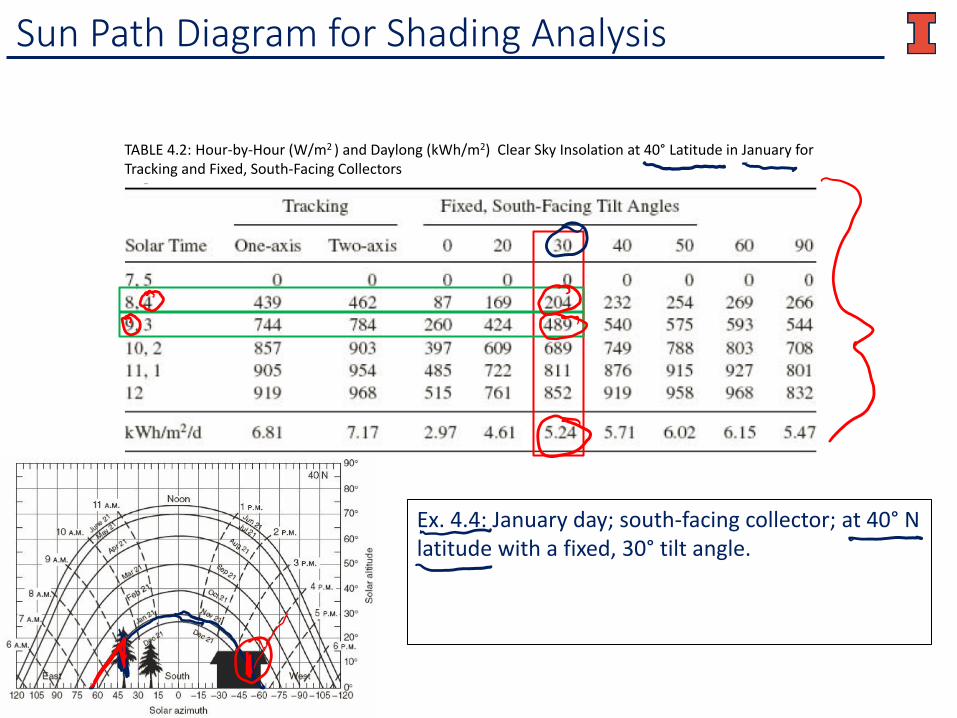
Sun Path Diagram for Shading Analysis
TABLE 4.2: Hour-by-Hour (W/m2 ) and Daylong (kWh/m2) Clear Sky Insolation at 40° Latitude in January for Tracking and Fixed, South-Facing Collectors
Ex. 4.4: January day; south-facing collector; at 40° N latitude with a fixed, 30° tilt angle.
4.9: Clear-Sky Direct-Beam Radiation
We now know where the Sun is at any given time at any location on Earth Based on this, how much solar insolation can we
expect at a given site? This will help us determine how much energy can be
expected from a solar panel installation
How much sunlight reaches us?
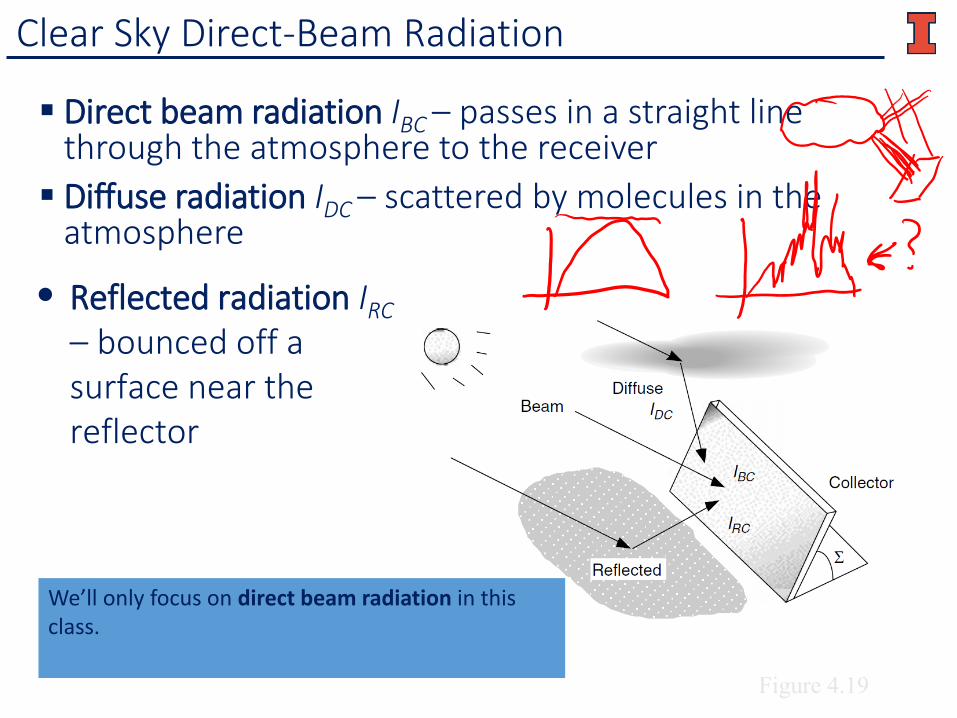
Clear Sky Direct-Beam Radiation
Direct beam radiation IBC – passes in a straight line through the atmosphere to the receiver Diffuse radiation IDC – scattered by molecules in the
atmosphere
• Reflected radiation IRC – bounced off a surface near the reflector
Figure 4.19
We’ll only focus on direct beam radiation in this class.
Extraterrestrial Solar Insolation I0
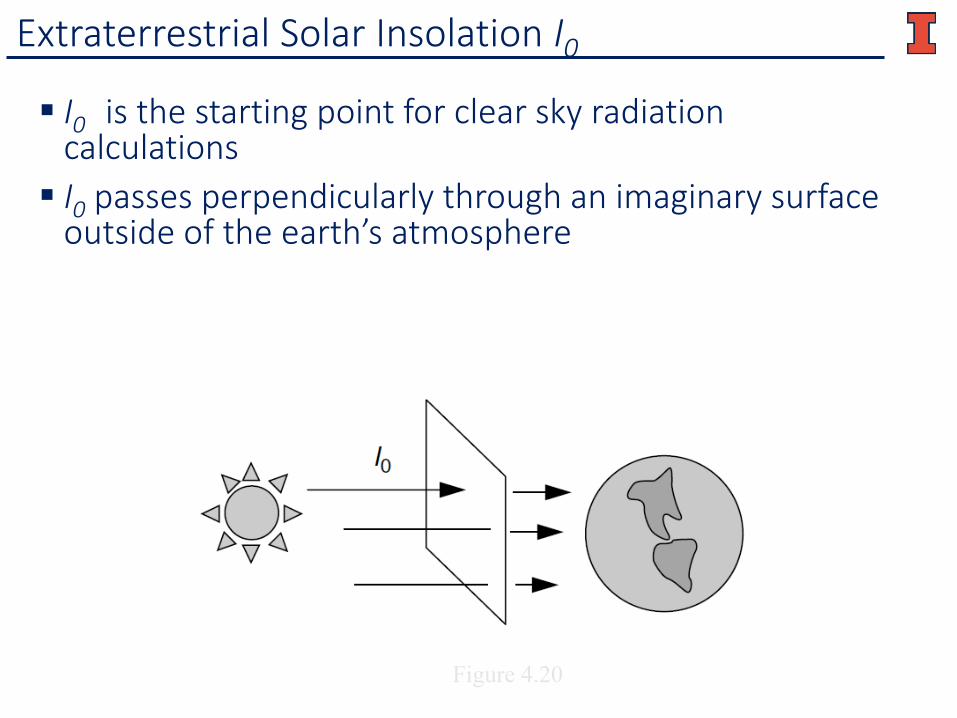
I0 is the starting point for clear sky radiation calculations I0 passes perpendicularly through an imaginary surface
outside of the earth’s atmosphere
Figure 4.20
Extraterrestrial Solar Insolation I0
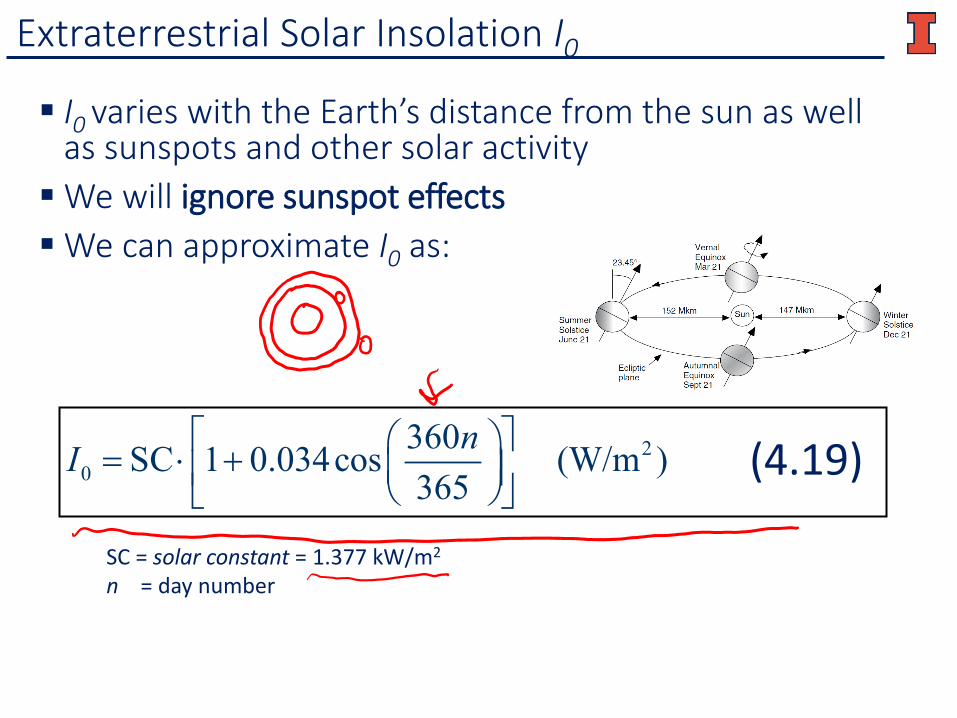
I0 varies with the Earth’s distance from the sun as well as sunspots and other solar activityWe will ignore sunspot effectsWe can approximate I0 as:
20
360SC 1 0.034cos (W/m ) (7.20) 365
nI = ⋅ +
SC = solar constant = 1.377 kW/m2
n = day number
(4.19)
Extraterrestrial Solar Insolation I0
Much of I0 is absorbed by various gases, scattered by dust, air molecules, water vapor, etc. In one year, less than half of I0 reaches earth’s surface
as a direct beam On a sunny, clear day, beam radiation may exceed 70%
of I0
Attenuation of Incoming Radiation
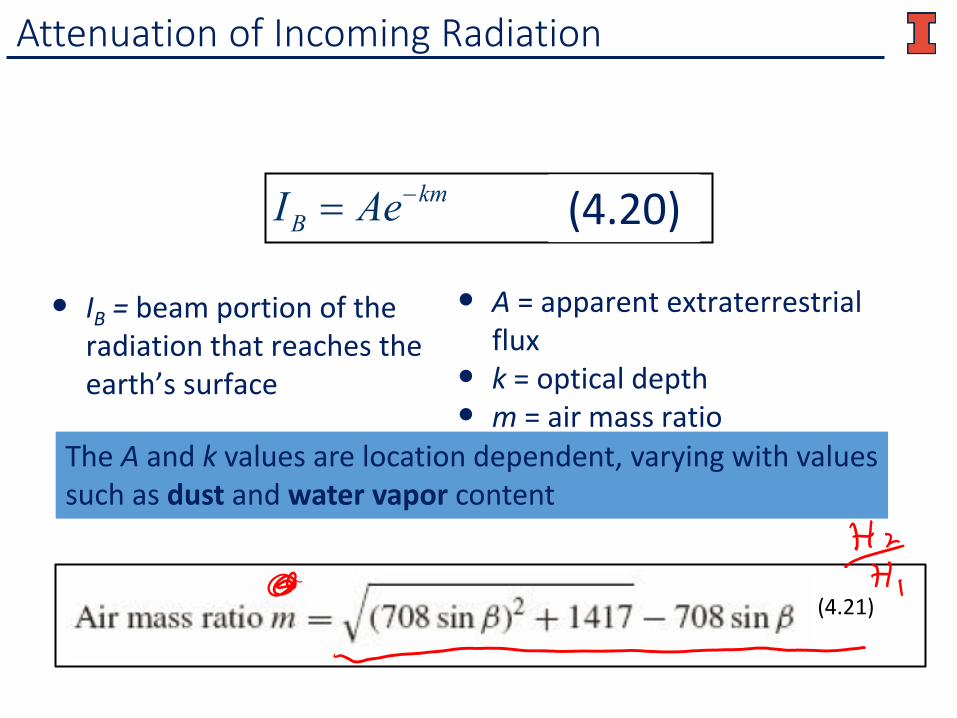
(7.21) kmBI Ae−=
• IB = beam portion of the radiation that reaches the earth’s surface
• A = apparent extraterrestrial flux
• k = optical depth • m = air mass ratio
The A and k values are location dependent, varying with values such as dust and water vapor content
(4.20)
(4.21)
Attenuation of Incoming Radiation
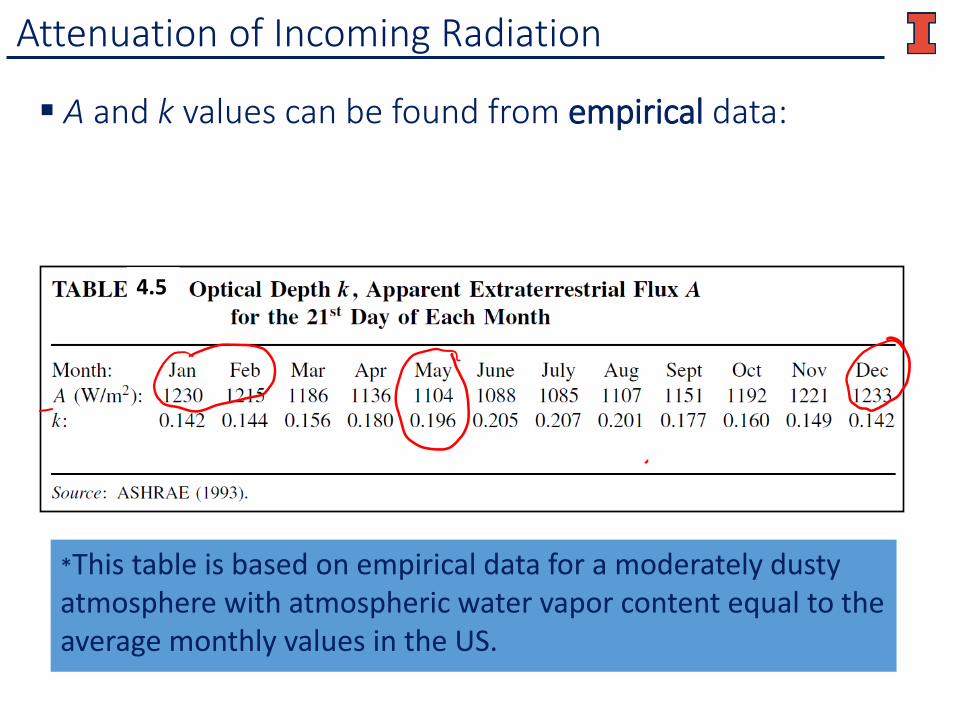
A and k values can be found from empirical data:
*This table is based on empirical data for a moderately dusty atmosphere with atmospheric water vapor content equal to the average monthly values in the US.
4.54.5
Attenuation of Incoming Radiation
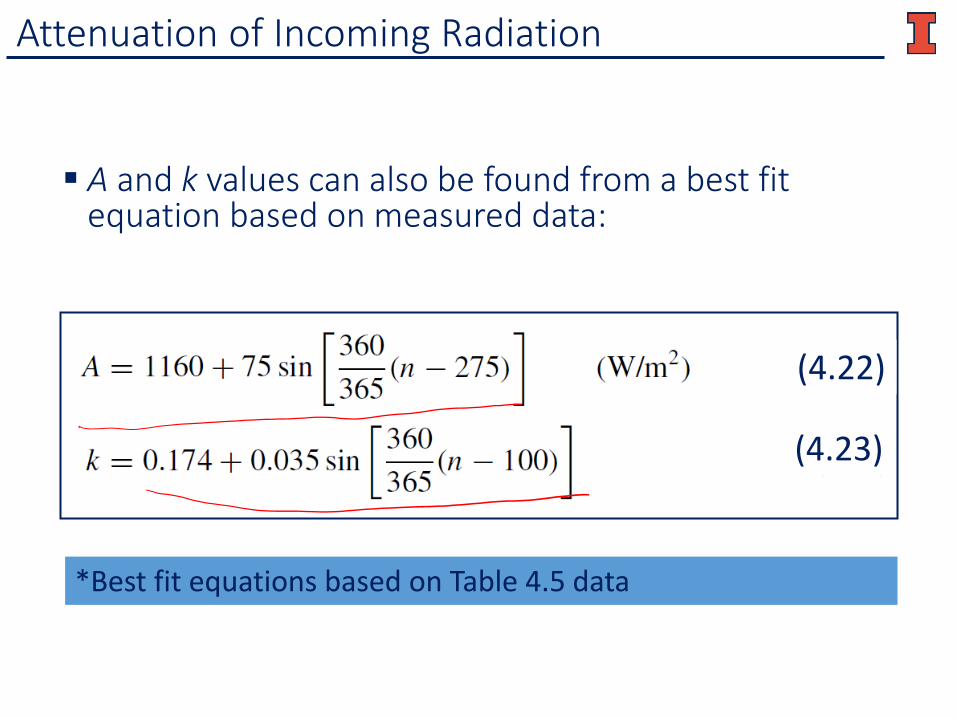
A and k values can also be found from a best fit equation based on measured data:
*Best fit equations based on Table 4.5 data
(4.22)
(4.23)
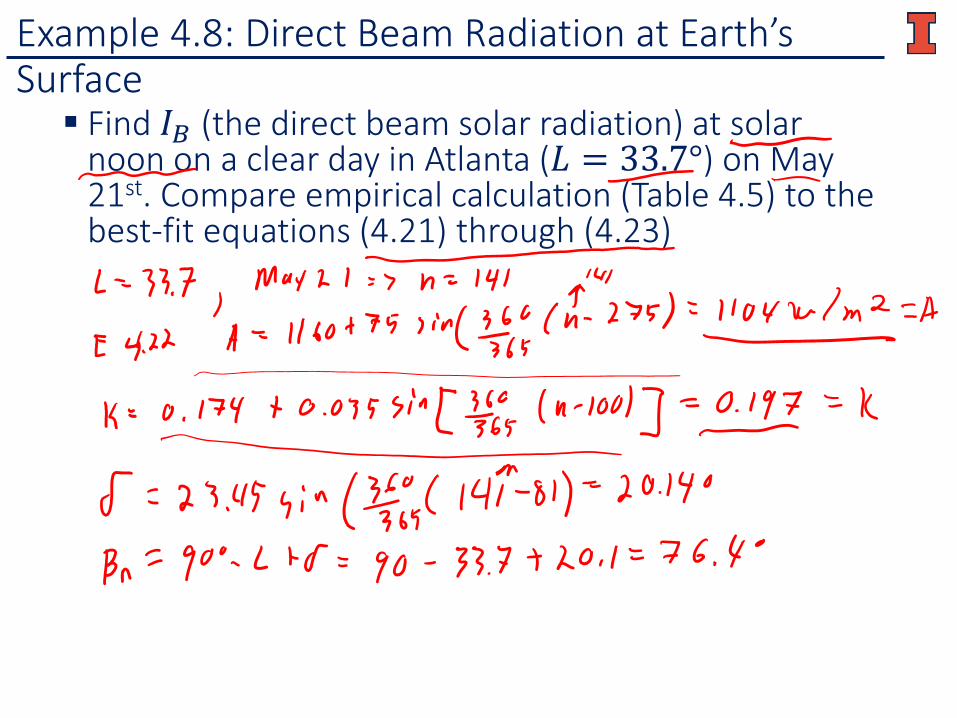
Example 4.8: Direct Beam Radiation at Earth’s Surface Find 𝐼𝐼𝐵𝐵 (the direct beam solar radiation) at solar
noon on a clear day in Atlanta (𝐿𝐿 = 33.7°) on May 21st. Compare empirical calculation (Table 4.5) to the best-fit equations (4.21) through (4.23)
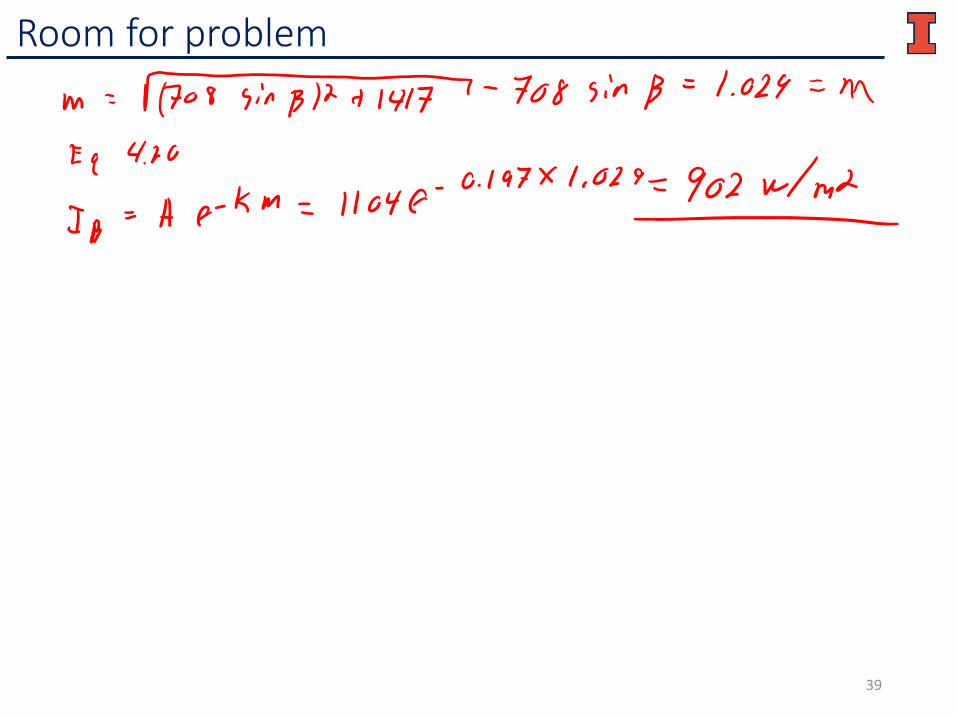
Room for problem
39

Wrap-up
That’s it for Chapter 4 No HW this week – start studying for Exam 2 I’m now a barber and part time shop teacher
40
Related Documents