NREL is a national laboratory of the U.S. Department of Energy, Office of Energy Efficiency and Renewable Energy, operated by the Alliance for Sustainable Energy, LLC. Solar Industry Update David Feldman National Renewable Energy Laboratory Coal Finance 2014 The current economics of solar, wind and energy efficiency alternatives to coal (domestic U.S. and international perspectives) March 18, 2014

Welcome message from author
This document is posted to help you gain knowledge. Please leave a comment to let me know what you think about it! Share it to your friends and learn new things together.
Transcript
NREL is a national laboratory of the U.S. Department of Energy, Office of Energy Efficiency and Renewable Energy, operated by the Alliance for Sustainable Energy, LLC.
Solar Industry Update
David FeldmanNational Renewable Energy Laboratory
Coal Finance 2014The current economics of solar, wind and energy efficiency alternatives to coal (domestic U.S. and international perspectives)
March 18, 2014
2
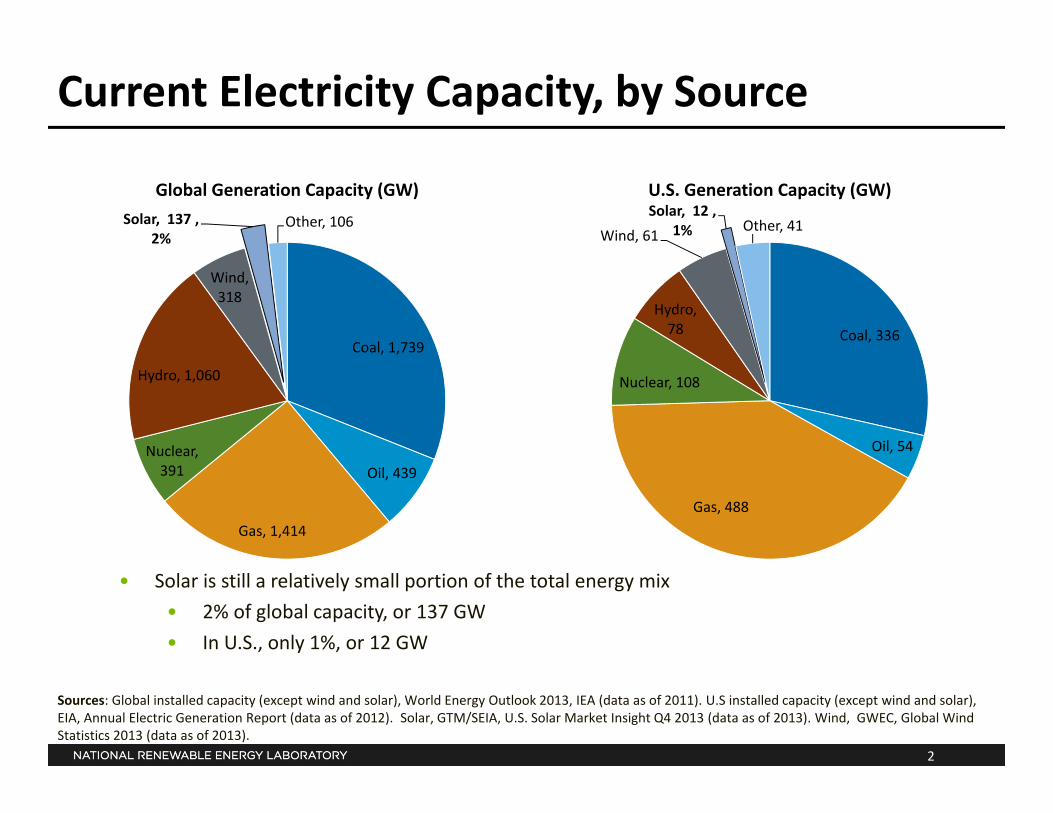
Current Electricity Capacity, by Source
Coal, 1,739
Oil, 439
Gas, 1,414
Nuclear, 391
Hydro, 1,060
Wind, 318
Solar, 137 , 2%
Other, 106
Global Generation Capacity (GW)
Coal, 336
Oil, 54
Gas, 488
Nuclear, 108
Hydro, 78
Wind, 61 Solar, 12 ,
1% Other, 41
U.S. Generation Capacity (GW)
• Solar is still a relatively small portion of the total energy mix• 2% of global capacity, or 137 GW• In U.S., only 1%, or 12 GW
Sources: Global installed capacity (except wind and solar), World Energy Outlook 2013, IEA (data as of 2011). U.S installed capacity (except wind and solar), EIA, Annual Electric Generation Report (data as of 2012). Solar, GTM/SEIA, U.S. Solar Market Insight Q4 2013 (data as of 2013). Wind, GWEC, Global Wind Statistics 2013 (data as of 2013).

3
0
10
20
30
40
50
60
70
2008 2009 2010 2011 2012 2013E 2014P 2015P 2016P
PV Ann
ual Installatio
ns (G
WDC) Europe
ROWIndiaJapanChinaU.S.
Global PV Demand
Note: E = estimate; P = projection.Sources: data displayed represents the median figures from the following sources: BNEF (12/02/13), Deutsche Bank (01/06/14), Goldman Sachs (01/06/14), Stifel Nicolaus (01/03/14).
Historic Projection
• In 2013, for the first time more PV will come on‐line globally than wind – both around 35 GW
• Continued increase in global installations expected through 2016• As European demand declines, U.S. & developing world markets expected to grow

4
0
10
20
30
40
50
60
70
80
2007 2008 2009 2010 2011 2012 2013E 2014P 2015P 2016P
Capa
city (G
W)
Thin Film Mfg. Capacity
c‐Si Mfg. Capacity
Global Installation Additions
Global PV Manufacturing Capacity vs. Demand
• Historically tightened supply/demand conditions have led to price increases (‘07‐’08) while oversupply has led to rapid price declines (‘09, ‘11‐’12)
• Near‐term estimates predict a relatively balanced supply/demand
Note: P = projectionSources: data displayed represents the median figures from the following sources: median of cell mfg. capacity: Goldman Sachs (01/06/14); GTM “WCM Database, September 2013.” Demand: BNEF (12/02/13), Deutsche Bank (01/06/14), Goldman Sachs (01/06/14), Stifel Nicolaus (01/03/14).
Historic Projection

5
Sources: Company figures based on Q4 ’13 (and previous) SEC filings by the respective companies.
PV Manufacturers’ Gross Margins
• Gross margins continue to recover due to stabilization of market pricing and continued cost reductions
• 17% avg. gross margin of above companies in 2013 compared to 5% in 2012• Still strong demand in Europe & U.S., as well as new countries like Japan & China
• Solar‐panel shipments in Q2 by three of the four largest producers exceeded projections by as much as 32% as demand in Asia surged (TSL, YGE, CSIQ)
• Stabilization (or increase) of price and continued reduction of costs translates into higher margins
-20%
-10%
0%
10%
20%
30%
40%
50%
60%
2007 2008 2009 2010 2011 2012 2013
Gro
ss M
argi
n (%
of R
even
ue)
Hanwha SolarOneSunPowerJinko SolarCanadian SolarFirst SolarTrina SolarYingli

6
PV Module & Component Spot Pricing
• Module and component prices experiencing relatively stable pricing for past year, with modest increases as supply/demand more in balance
• Jan./Jan. ‘13/14 was first positive price change for c‐Si modules since ‘07/’08• BNEF expects poly prices to rise above $20/kg in 2014• Still highly competitive markets – larger buyers might have more bargaining power
Sources: Barclays (12/14/09); BNEF Solar Spot Price Index (01/15/14); Stifel Nicolaus (05/05/11); UBS ((2/12/10, 4/23/10, 7/27/10, 10/29/2010,1/24/11, 6/3/11, 6/16/11, 8/17/11, 9/16/11, 12/12/11, 1/20/12, 2/13/12, 4/19/12)). BNEF (01/09/14).
$17.52
$0.84
$0.40 $0.24
$0
$50
$100
$150
$200
$250
$300
$350
$400
$450
$500
$0.0
$0.5
$1.0
$1.5
$2.0
$2.5
$3.0
$3.5
$4.0
$4.5
Q1 '07 Q1 '08 Q1 '09 Q1 '10 Q1 '11 Q1 '12 Q1 '13
Poly
silic
on $
/kg
$/W
att
(Nom
inal
)
Polysilicon(right axis)c-Si Module (left axis)Multi Cells (left axis)Multi Wafers (left axis)
Price Change (Jan. to Jan.) 07-08 08-09 09-10 10-11 11-12 12-13 13-14
c-Si Module (left axis) 4% -30% -39% -3% -39% -21% 3%
Multi Cells (left axis) 8% -45% -33% -2% -56% -27% 8%
Multi Wafers (left axis) 13% -40% -45% 3% -65% -24% 5%
Polysilicon(right axis) 66% -78% -39% 23% -63% -41% 13%
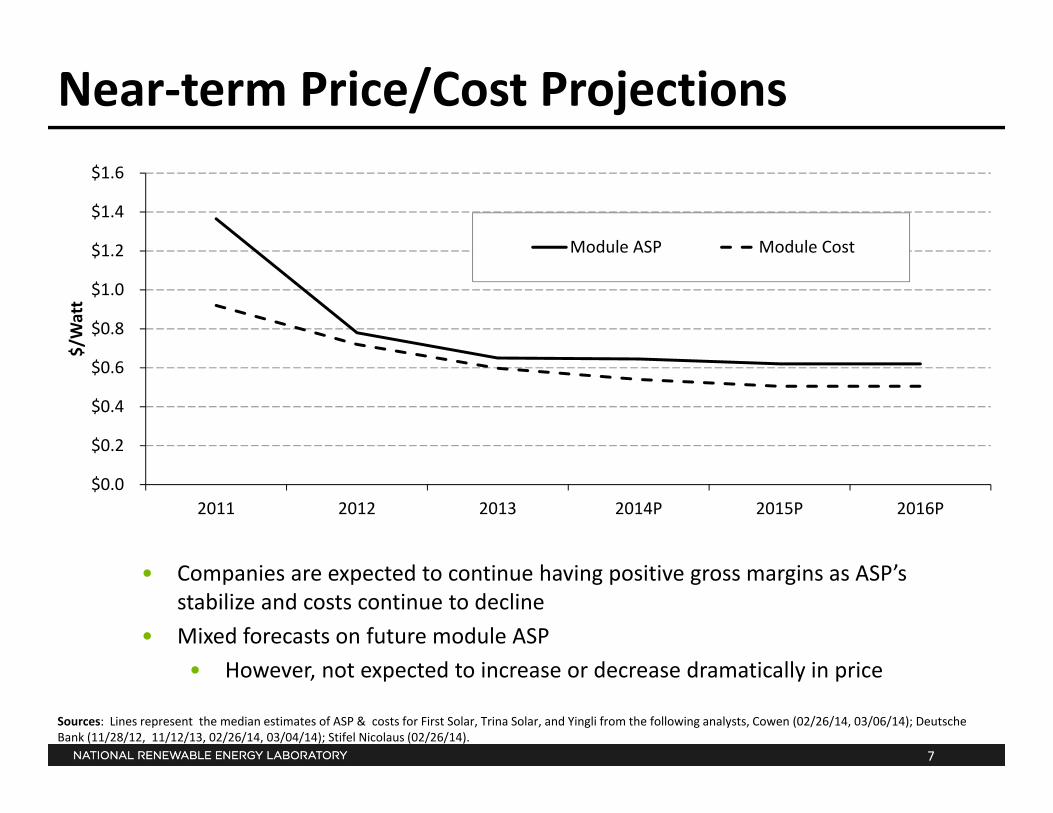
7
Near‐term Price/Cost Projections
Sources: Lines represent the median estimates of ASP & costs for First Solar, Trina Solar, and Yingli from the following analysts, Cowen (02/26/14, 03/06/14); Deutsche Bank (11/28/12, 11/12/13, 02/26/14, 03/04/14); Stifel Nicolaus (02/26/14).
• Companies are expected to continue having positive gross margins as ASP’s stabilize and costs continue to decline
• Mixed forecasts on future module ASP• However, not expected to increase or decrease dramatically in price
$0.0
$0.2
$0.4
$0.6
$0.8
$1.0
$1.2
$1.4
$1.6
2011 2012 2013 2014P 2015P 2016P
$/Watt
Module ASP Module Cost

8
First Solar 2017 Roadmap
Source: 2013 Corporate public filing.
First Solar plans to cut their costs nearly in half in the next four years, again

9
SunEdison 2016 Roadmap
SunEdison targets similar cost to First Solar
Source: 2013 corporate public filing.

10
Overall conclusion from roadmaps: industry is shooting for module costs to be $0.40/W or less in the near future – 25% margins would give a price of $0.50/W
• Not clear what efficiency goals are at this price • With continued mfg. overcapacity expected by analysts, uncertain whether mfg.’s will
spend money on new equipment• Major cost reductions may have to come from “soft‐costs”
Sources: GTM Research: PV Technology and Cost Outlook, 2013 – 2017 ( June 2013)
Best-In-Class Module Cost ReductionQ4 ‘12 – Q4 ’17 (GTM Estimate)

11
PV System Price by Country ‐ 2012
Sources: IEA PVPS (January, 2014).
$0$1$2$3$4
$5$6$7$8
System
Pric
e ($/W
)
Residential Systems
Price RangeTypical Price, Dec. '13Typical Price, Dec. '12
• U.S. residential prices in 2013 still lagged behind other mature PV markets• In particular, the higher priced U.S. markets were 2‐3x the price of other countries
• Japan was able to reduce residential system pricing by 21% versus 9% by U.S.
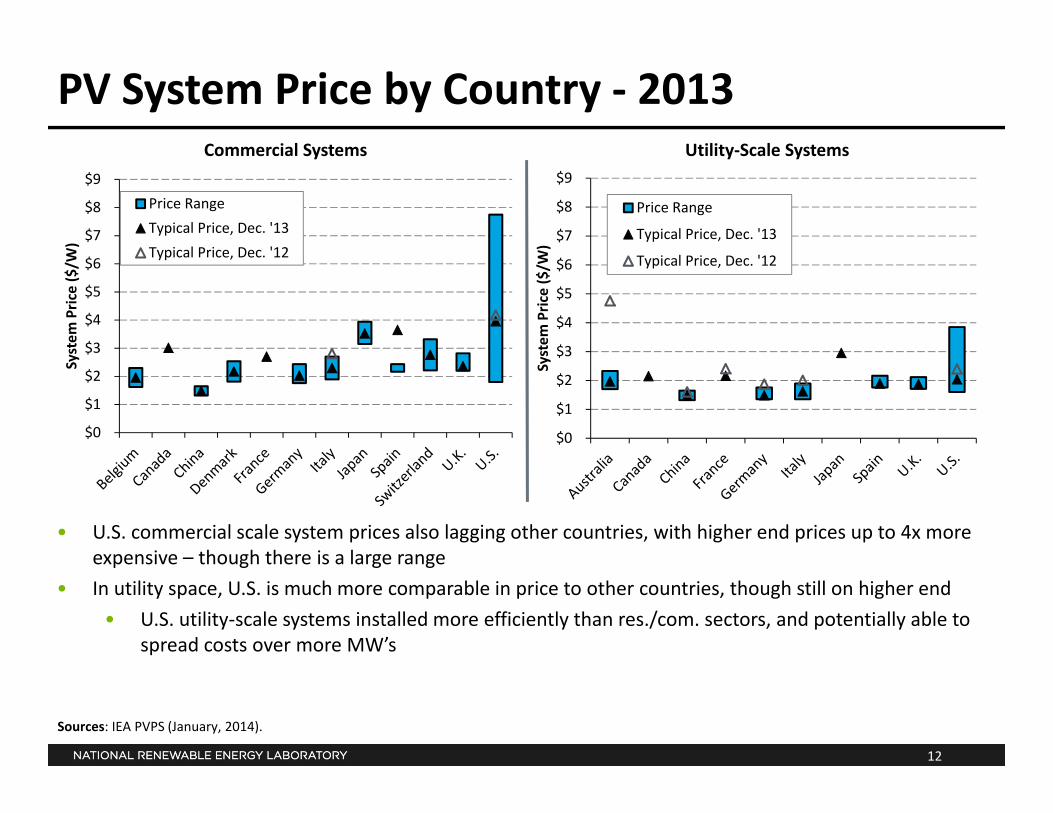
12
PV System Price by Country ‐ 2013
• U.S. commercial scale system prices also lagging other countries, with higher end prices up to 4x more expensive – though there is a large range
• In utility space, U.S. is much more comparable in price to other countries, though still on higher end• U.S. utility‐scale systems installed more efficiently than res./com. sectors, and potentially able to
spread costs over more MW’s
$0
$1
$2
$3
$4
$5
$6
$7
$8
$9
System
Pric
e ($/W
)
Commercial Systems
Price RangeTypical Price, Dec. '13Typical Price, Dec. '12
$0
$1
$2
$3
$4
$5
$6
$7
$8
$9
System
Pric
e ($/W
)
Utility‐Scale Systems
Price Range
Typical Price, Dec. '13
Typical Price, Dec. '12
Sources: IEA PVPS (January, 2014).

13
Reported, Bottom-Up, and Analyst-Projected Average U.S. PV System Prices over Time
Note: The reported system price for the residential market is representative of the median price reported for systems less than or equal to 10 kW in size. The modeled residential system price represents a ~5 kW system. The reported system price for the commercial market is representative of the median price reported for systems greater than 100 kW in size. The modeled commercial system price represents a ~220 kW rooftop system. The reported system price for the utility‐scale market represents the capacity‐weighted average reported price for ground‐mounted systems greater than 2 MW in size, with an average project size of 16.4 MW. The modeled system price of utility‐scale systems represents a ~190 MW fixed‐tilt ground‐mounted system. Bottom‐up system prices are representative of bids by an installer in the fourth quarter of the previous year. The Global Module Price Index is the average module selling price for the first buyer (P Mints SPV Market Research).
$0
$2
$4
$6
$8
$10
$12
$14
$16
1998 1999 2000 2001 2002 2003 2004 2005 2006 2007 2008 2009 2010 2011 2012 2013 P 2014 P
2012
$/W
DC
Installation Year
Analyst Expectations, Distributed PVAnalyst Expectations, Utility-ScaleReported System Price, Residential (Median)Reported System Price, Commercial (Median)Reported System Price, Utility (Cap-Wtd. Avg.)Modeled System Overnight Capital Cost, ResidentialModeled System Overnight Capital Cost, CommercialModeled System Overnight Capital Cost, Utility
Analyst Expectations of Module Price
Global Module Price Index

14
$6.81
$5.97
$4.22 $3.69
$5.04 $4.67
$3.22 $2.61
$4.30 $3.68
$2.50 $1.92
$0
$1
$2
$3
$4
$5
$6
$7
$8
Q4 2009 Q4 2010 Q4 2011 Q4 2012 Q4 2009 Q4 2010 Q4 2011 Q4 2012 Q4 2009 Q4 2010 Q4 2011 Q4 2012
Residential Commercial Utility ground mount (Fixed axis)
2012
$/W
DC
BOSInverterModule
Bottom-up Modeled Overnight Capital Cost of PV Systems by Sector, Q4 ’09 - Q4 ‘12
• Since Q4 2009, the overnight capital cost of systems has fallen between 14% –18% per year• 50% ‐ 75% of reduction attributed to module price reductions
• From Q4 ‘11 to Q4 ‘12, the overnight capital cost of systems fell between $0.53/W ‐ $0.61/W, or 13% to 23%.
Note: Standard crystalline silicon modules (13.5% efficiency in Q4 2009 to 15.0% in Q4 2012). System size (residential: 4.6 kW in Q4 2009 to 5.1 kW in Q4 2012; commercial: 202.0 kW in Q4 2009 to 222.5 kW in Q4 2012; utility‐scale: 174.6 MW in Q4 2009 to 192.8 MW to Q4 2012). The increase in module efficiency is the cause for increased system size. Modeled system sizes in the residential and commercial rooftop sectors were chosen based on typical system sizes, then adjusted for optimal inverter configuration. System sizing for utility‐scale benchmarks were chosen for comparison purposes against pricing reported from DOE’s Energy Information Administration (2010).
15
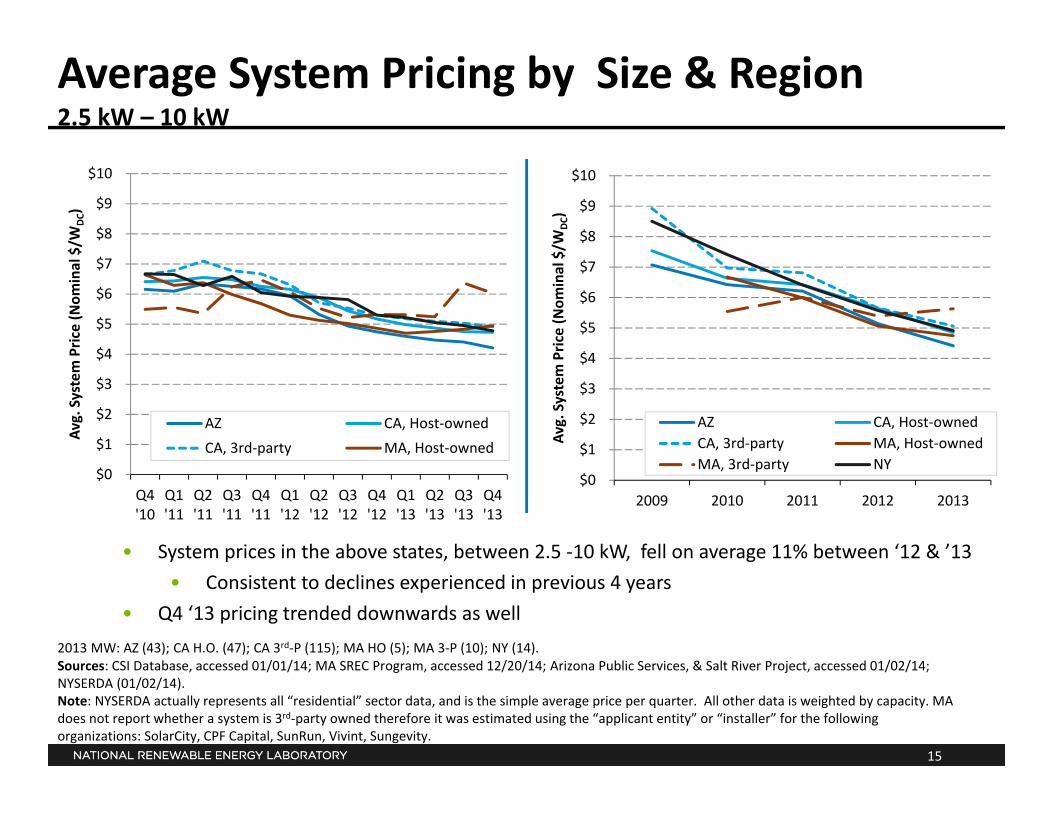
Average System Pricing by Size & Region2.5 kW – 10 kW
Sources: CSI Database, accessed 01/01/14; MA SREC Program, accessed 12/20/14; Arizona Public Services, & Salt River Project, accessed 01/02/14; NYSERDA (01/02/14).Note: NYSERDA actually represents all “residential” sector data, and is the simple average price per quarter. All other data is weighted by capacity. MA does not report whether a system is 3rd‐party owned therefore it was estimated using the “applicant entity” or “installer” for the following organizations: SolarCity, CPF Capital, SunRun, Vivint, Sungevity.
• System prices in the above states, between 2.5 ‐10 kW, fell on average 11% between ‘12 & ’13• Consistent to declines experienced in previous 4 years
• Q4 ‘13 pricing trended downwards as well2013 MW: AZ (43); CA H.O. (47); CA 3rd‐P (115); MA HO (5); MA 3‐P (10); NY (14).
$0
$1
$2
$3
$4
$5
$6
$7
$8
$9
$10
Q4'10
Q1'11
Q2'11
Q3'11
Q4'11
Q1'12
Q2'12
Q3'12
Q4'12
Q1'13
Q2'13
Q3'13
Q4'13
Avg. System Pric
e (Nom
inal $/W
DC)
AZ CA, Host‐ownedCA, 3rd‐party MA, Host‐owned
$0
$1
$2
$3
$4
$5
$6
$7
$8
$9
$10
2009 2010 2011 2012 2013
Avg. System Pric
e (Nom
inal $/W
DC)
AZ CA, Host‐ownedCA, 3rd‐party MA, Host‐ownedMA, 3rd‐party NY

16
U.S. Installation Breakdown
• U.S. Installed 4.8 GW of PV in 2013, 2.1 GW in Q4 ‘13
• Challenges maintaining growth rate in all sectors/states
• Net metering and rate design in CA, CO, AZ, TX
• GTM reports that developers in HI had difficulties with changing permit fees, state
tax credits, and market saturation in some key geographies
• U.S. non‐residential market flat• Other markets opening up could spur demand
such as MN, GA, NY (50kW‐200 kW systems)• A PV project will be installed, on average,
every 4 minutesSources: GTM/SEIA : U.S. Solar Market Insight Q4 2013.
Residential
2,218
Non‐Residenti
al4,044
Utility5,802
U.S. Cum. PV Installations by State (MWDC), 2013
0.26
0.41
1.44
0.14 0.18 0.18 0.35 0.28
0.37 0.48
0.79
0.55
0.82 0.69
1.31
0.74 0.94 0.96
2.11
0.0
0.5
1.0
1.5
2.0
2.5
Q1'10
Q2'10
Q3'10
Q4'10
Q1'11
Q2'11
Q3'11
Q4'11
Q1'12
Q2'12
Q3'12
Q4'12
Q1'13
Q2'13
Q3'13
Q4'13
Qua
rter
ly P
V In
stal
led
(MW
DC)
U.S. PV Installations by Market Segment
Utility
Non- Residential
Residential

17
U.S. Installation Breakdown
• Several states largely spurring PV market in U.S.• CA, AZ, and NJ each have more than 1 GW of cumulatively installed PV
• However, this trend is changing slowly as 16 states currently have 100 MW or more of PV capacity and 11 states each installed more than 50 MW in 2013 alone
• 92% of the # of all systems are residential• 131k res. installed in ’13
Sources: GTM/SEIA : U.S. Solar Market Insight Q4 2013.
2.62
0.42 0.34
0.71
0.66
0.0
0.5
1.0
1.5
2.0
2.5
3.0
3.5
4.0
4.5
5.0
2006 2007 2008 2009 2010 2011 2012 2013
Annu
al PV Installed (M
WDC)
U.S PV Installations by State
OtherNext Four States*NCFLCONVNJAZCA
Residential
407,985
Non-Res.
36,796
Utility627
U.S. PV Cumulative Installations (#), 2013

18
Residential 3rd‐Party System Ownership by Region
• 3rd‐party ownership continues to dominate residential sector in several markets• AZ & CA % have leveled off in past year – with continued sales of host‐owned systems
• New availability of residential loans• Rebounding of housing market allow systems to be financed through mortgages or
home equity loans
0%
10%
20%
30%
40%
50%
60%
70%
80%
90%
100%
2007 2008 2009 2010 2011 2012 2013
% of Installed Ca
pacity
AZCAMA
0%
10%
20%
30%
40%
50%
60%
70%
80%
90%
100%
Q4'10
Q1'11
Q2'11
Q3'11
Q4'11
Q1'12
Q2'12
Q3'12
Q4'12
Q1'13
Q2'13
Q3'13
Q4'13
% of Installed Ca
pacity
AZCAMA
Sources: CSI Database, accessed 01/01/14; MA SREC Program, accessed 12/20/14; Arizona Public Services, & Salt River Project, accessed 01/02/14.Note: MA does not report whether a system is 3rd‐party owned therefore it was estimated using the “applicant entity” or “installer” for the following organizations: SolarCity, CPF Capital, SunRun, Vivint, Sungevity.
19
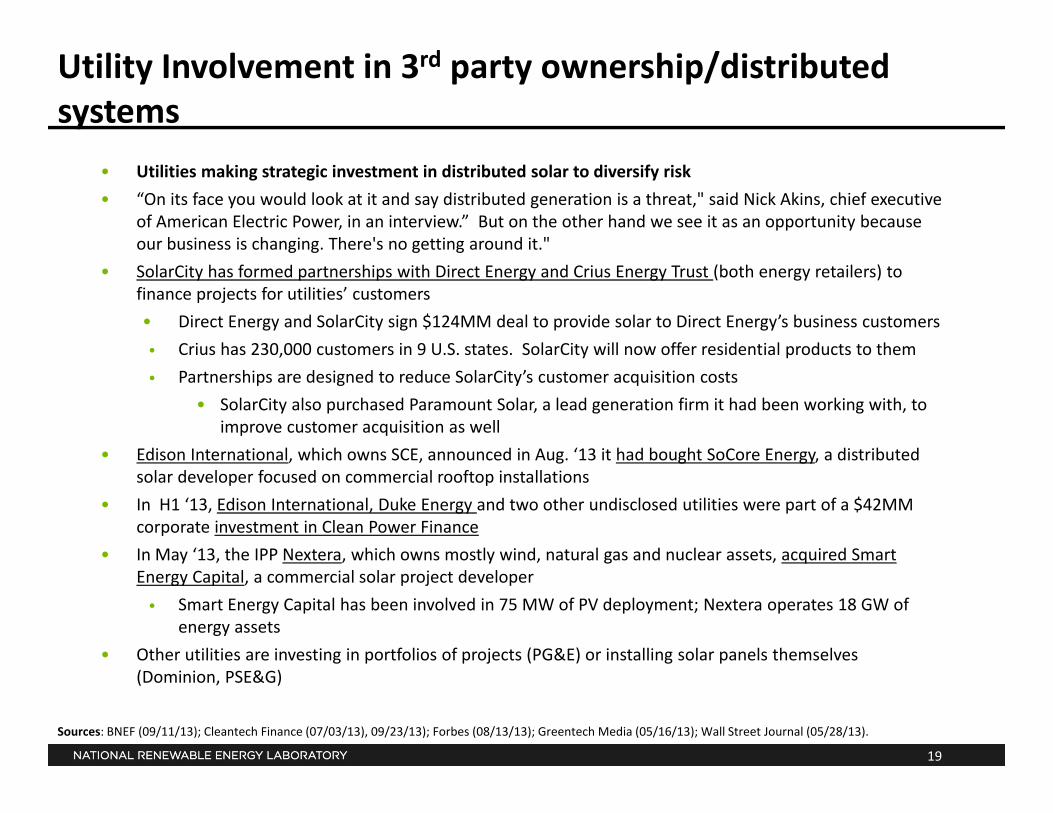
Utility Involvement in 3rd party ownership/distributed systems
• Utilities making strategic investment in distributed solar to diversify risk• “On its face you would look at it and say distributed generation is a threat," said Nick Akins, chief executive
of American Electric Power, in an interview.” But on the other hand we see it as an opportunity because our business is changing. There's no getting around it."
• SolarCity has formed partnerships with Direct Energy and Crius Energy Trust (both energy retailers) to finance projects for utilities’ customers• Direct Energy and SolarCity sign $124MM deal to provide solar to Direct Energy’s business customers• Crius has 230,000 customers in 9 U.S. states. SolarCity will now offer residential products to them• Partnerships are designed to reduce SolarCity’s customer acquisition costs
• SolarCity also purchased Paramount Solar, a lead generation firm it had been working with, to improve customer acquisition as well
• Edison International, which owns SCE, announced in Aug. ‘13 it had bought SoCore Energy, a distributed solar developer focused on commercial rooftop installations
• In H1 ‘13, Edison International, Duke Energy and two other undisclosed utilities were part of a $42MM corporate investment in Clean Power Finance
• In May ‘13, the IPP Nextera, which owns mostly wind, natural gas and nuclear assets, acquired Smart Energy Capital, a commercial solar project developer • Smart Energy Capital has been involved in 75 MW of PV deployment; Nextera operates 18 GW of
energy assets• Other utilities are investing in portfolios of projects (PG&E) or installing solar panels themselves
(Dominion, PSE&G)
Sources: BNEF (09/11/13); Cleantech Finance (07/03/13), 09/23/13); Forbes (08/13/13); Greentech Media (05/16/13); Wall Street Journal (05/28/13).

20
Utility-Scale Pricing
Sources: Individual system pricing from corporate press releases & public filings. Additional information gathered from publicly available grant data from Treasury Department. http://www.treasury.gov/initiatives/recovery/Pages/1603.aspx. Specific project location and system size based on various press releases and corporate filings. Grant basis is assumed to be 1.00/0.30 of grant award.
• Still great volatility in utility‐scale system price, however in general prices are decreasing over time – most installs now being reported between $2‐3/W
• There are a number of factors besides tracking that are driving differences in pricing
26 MW
6 MW
$‐
$1
$2
$3
$4
$5
$6
$7
$8
Aug‐07 Dec‐08 May‐10 Sep‐11 Jan‐13 Jun‐14
Repo
rted
Price (per W
DC)
Placed in Service
Tracking Fixed Tilt

21
US Solar PPA Price (Utility Projects)
* Represents aggregation of three projects in California.Source: BNEF H2 2013 NA PV Outlook.
• PPA prices have continued to decline due to intense competition among solar developers• Macho Spring was signed for $58/MWh however benefits from a $27/MWh state
tax credit• As states near RPS targets and RFP’s taper out, PPA’s are becoming harder to find
341 MW
32 MW
$-
$50
$100
$150
$200
$250
$300
Feb-08 Jul-09 Nov-10 Apr-12 Aug-13 Dec-14
PPA
Pri
ce (
$/M
Wh)
Signing Date
*

22
Change in Utility PV Projections over Time
Sources: Greenpeace/EREC, “Energy Revolution” (July 2008, 2010, 2012); International Energy Agency, “World Energy Outlook 2011/2/3” (November 2011, 2012, 2013), New Policy Scenario; Bloomberg New Energy Finance, Q2 2011, Q1 2012, Q4 2013, “PV Market Outlook” (07/18/11, 02/06/12, 12/02/13); U.S. Energy Information Administration, Annual Energy Outlook 2005-2013 & 2014 ER (December 2013).
Projected Year
PV Installed Co
st (2
010 $/W
DC)
$‐
$1
$2
$3
$4
$5
$6
2010 2015 2020 2025 2030 2035 2040 2045 2050
EIA200520072008200920102011201220132014
$‐
$1
$2
$3
$4
$5
$6
$7
2010 2015 2020 2025 2030 2035 2040 2045 2050
IEA201120122013
$‐
$1
$2
$3
$4
$5
$6
$7
2010 2015 2020 2025 2030 2035 2040 2045 2050
BNEF201120122013
$‐
$1
$2
$3
$4
$5
$6
$7
2010 2015 2020 2025 2030 2035 2040 2045 2050
EREC200820102012
• BNEF, IEA and EREC all get very close to SunShot target by 2020‐2030• EIA projections continue to be the highest. They were actually increasing through 2010,
but have fallen significantly during past couple of years
23
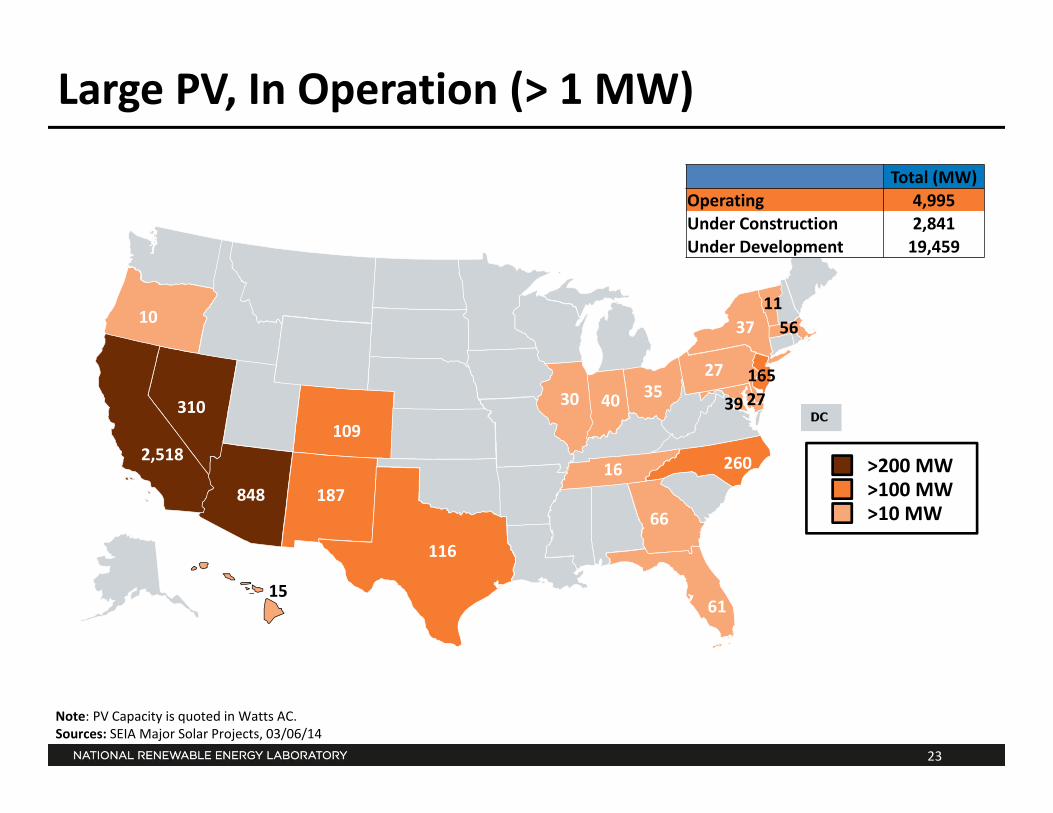
>200 MW>100 MW>10 MW
2,518
848
310109
187
61
165
116
260
30 35
37
Large PV, In Operation (> 1 MW)
Note: PV Capacity is quoted in Watts AC.Sources: SEIA Major Solar Projects, 03/06/14
39
Total (MW)Operating 4,995 Under Construction 2,841 Under Development 19,459
10
16
27
56
15
27
66
40
11

24
>200 MW>100 MW>10 MW
1,766
52
658100
40
109
77
Large PV, In Construction (> 1 MW)
>2,000 MW
Note: PV Capacity is quoted in Watts AC.Sources: SEIA Major Solar Projects, 03/06/14
Total (MW)Operating 4,995 Under Construction 2,841 Under Development 19,459
20
12
15
30

25
>1,000 MW>250 MW>25 MW
11,979
1,144
2,89467
964
137
689
Large PV, In Development (> 1 MW)
>10,000 MW
70
60
375
68
455
75
Note: PV capacity is quoted in watts AC.Sources: SEIA Major Solar Projects, 03/06/14
162
Total (MW)Operating 4,995 Under Construction 2,841 Under Development 19,459
25
44
30
50
40

26
U.S. Large CSP Pipeline (> 1 MW)
Note: CSP capacity is quoted in watts AC.Sources: SEIA Major Solar Projects, 03/06/14
883405
1,539
75110
1,150
281795
200
75
2
In OperationIn ConstructionIn Development
• Largest solar project, 392 MW Ivanpah project, and largest solar project with storage, 280 MW Solana project (w/ 6 hrs of storage) placed in service late last year

27
2010 & 2013 CSP Baselines and SunShot Goal
• 8 ¢/kWh reduction in LCOE (38%) from 2010 to 2013• An additional 7 ¢/kWh (54%) LCOE reduction still necessary to achieve
SunShot goals
9¢
2¢
5¢
1¢
4¢
2¢
3¢
1¢
4¢
3¢1¢
1¢2¢
1¢3¢
21¢/kWh
13¢/kWh
6¢/kWh
¢
5¢
10¢
15¢
20¢
25¢
2010 SystemPrice (Trough +
TES)
2013 SystemPrice (MoltonSalt Tower)
Receiver/HeatTransfer Cost
Reductions
Power PlantCost
Reductions
ThermalStorage CostReductions
Solar Field CostReductions
SunShot Goal
LCO
E (
2010
¢/k
Wh)
Receiver/Heat TransferPower PlantThermal StorageSolar Field
Note: assumes no ITC. $2013 converted to $2010 using the “Chemical Engineering Plant Cost Index.“

28
Solar Market Growth is on Pace to Meet Future Solar/DG Set‐Aside Requirements
• Cumulative capacity requirement grows to 9,200 MW by 2035• Required average annual solar capacity additions of 700 MW/yr through
2020, tapering off thereafter• By comparison, set-aside PV additions reached 1,200 MW in 2012
0
2,000
4,000
6,000
8,000
10,000
0
200
400
600
800
1,000
1,200
2010 2015 2020 2025 2030 2035
NJAZMDILPAOHMNCONMMADEDCNCNYNVMONHOR
Required Annual Capacity Additions
(left axis) Cumulative CapacityRequired
(right axis)
Cum
ulat
ive
Sola
r Cap
acity
(MW
ac)
Annu
al S
olar
Cap
acity
Add
ition
s (M
Wac
)
Source: Galen Barbose, LBNL
RPS has traditionally driven a lot of solar deployment, but unless they are raised in future, they will play less of a role

29
Total RPS Targets of all 29 States with Laws
• Solar is incentivized beyond carve‐out through total RPS targets• Solar carve‐out is a small portion of the total RPS goals
• 16 TWh solar carve‐out vs. 370 TWh’s by 2020 (10% of U.S. electricity sales)• If California, which has no solar carve‐out, satisfied additional RPS requirements from 2012‐2020 through
solar installations, it would represent ~22 GW• CO ~7GW (solar carve‐out 1.1 GW)• NV, NM, AZ ~2 GW• Other regions more likely to use larger % of Wind (and some RPS’s have % req. for other technologies)
• Other factors may push solar installations beyond RPS targets
Sources: RPS: DSIRE RPS Spreadsheet120612, Retail Sales: 2011 EIA. Assumed capacity factor 1,400 kWh/kW
0
50
100
150
200
250
300
350
400
2008 2009 2010 2011 2012 2013 2014 2015 2016 2017 2018 2019 2020
RP
S C
ompl
iant
TW
h
EastCoastMidwest
West
TX
CO
AZ
NM
NV
CA

30
David FeldmanSenior Financial Analyst
National Renewable Energy Laboratory202-488-2231
Thank You
Related Documents


