Solar Powering Your Community Solarize South Jersey

Welcome message from author
This document is posted to help you gain knowledge. Please leave a comment to let me know what you think about it! Share it to your friends and learn new things together.
Transcript

Solar Powering Your Community
Solarize South Jersey

The Solar Foundation
Alexander Winn The Solar Foundation
Philip Haddix
a
The SunShot Solar Outreach Partnership (SolarOPs) is a U.S.
Department of Energy (DOE) program designed to increase the use
and integration of solar energy in communities across the US.
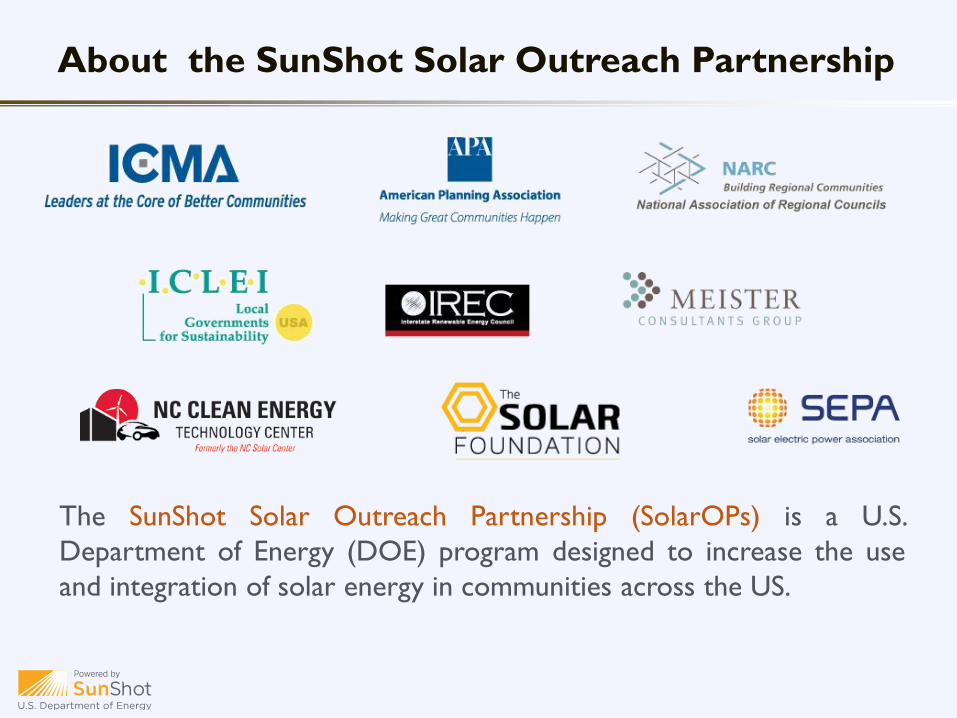
About the SunShot Solar Outreach Partnership
Increase installed capacity of solar electricity in
U.S. communities
Streamline and standardize permitting and
interconnection processes
Improve planning and zoning codes/regulations
for solar electric technologies
Increase access to solar financing options
About the SunShot Solar Outreach Partnership

e- e-
Some Basic Terminology
Capacity / Power
kilowatt (kW)
Production
Kilowatt-hour (kWh)
e-
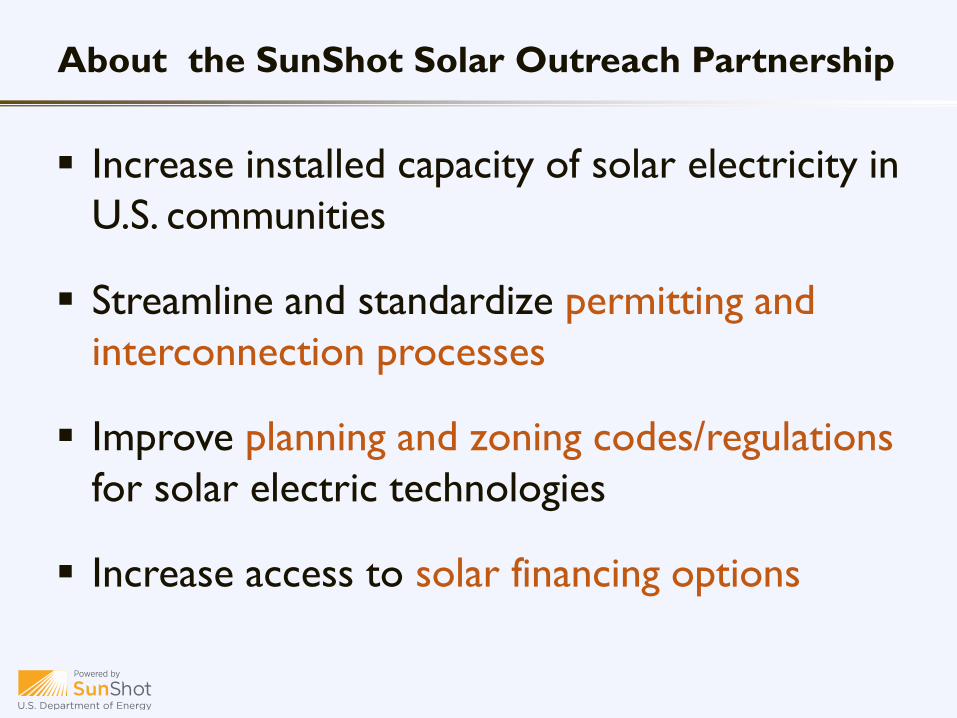
System Components

What benefits can solar bring
to your community?
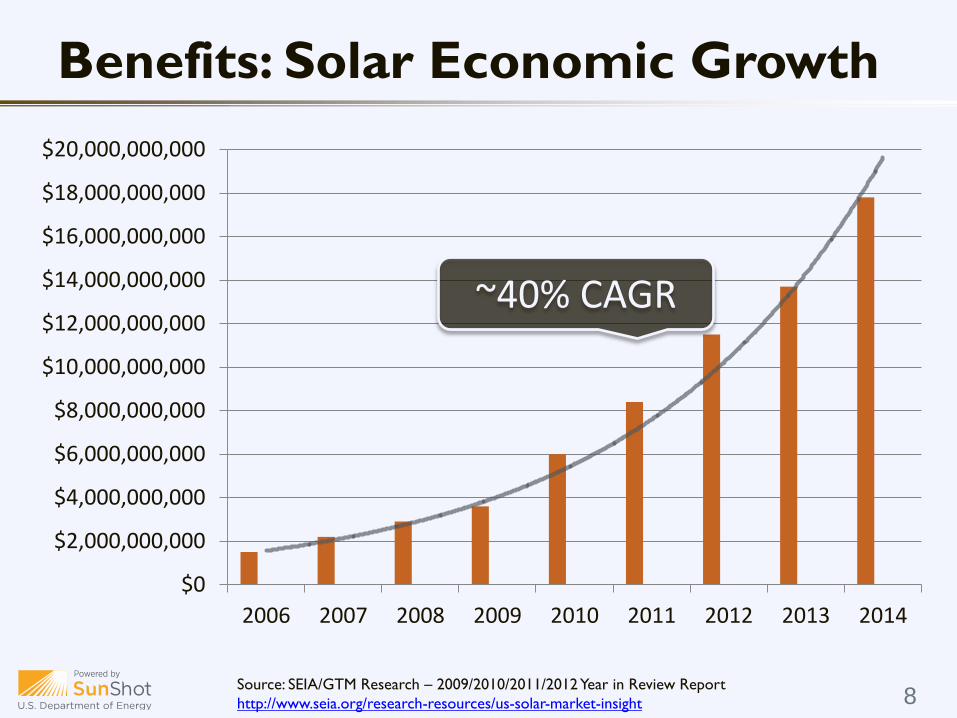
Benefits: Solar Economic Growth
Source: SEIA/GTM Research – 2009/2010/2011/2012 Year in Review Report
http://www.seia.org/research-resources/us-solar-market-insight 8
$0
$2,000,000,000
$4,000,000,000
$6,000,000,000
$8,000,000,000
$10,000,000,000
$12,000,000,000
$14,000,000,000
$16,000,000,000
$18,000,000,000
$20,000,000,000
2006 2007 2008 2009 2010 2011 2012 2013 2014
~40% CAGR
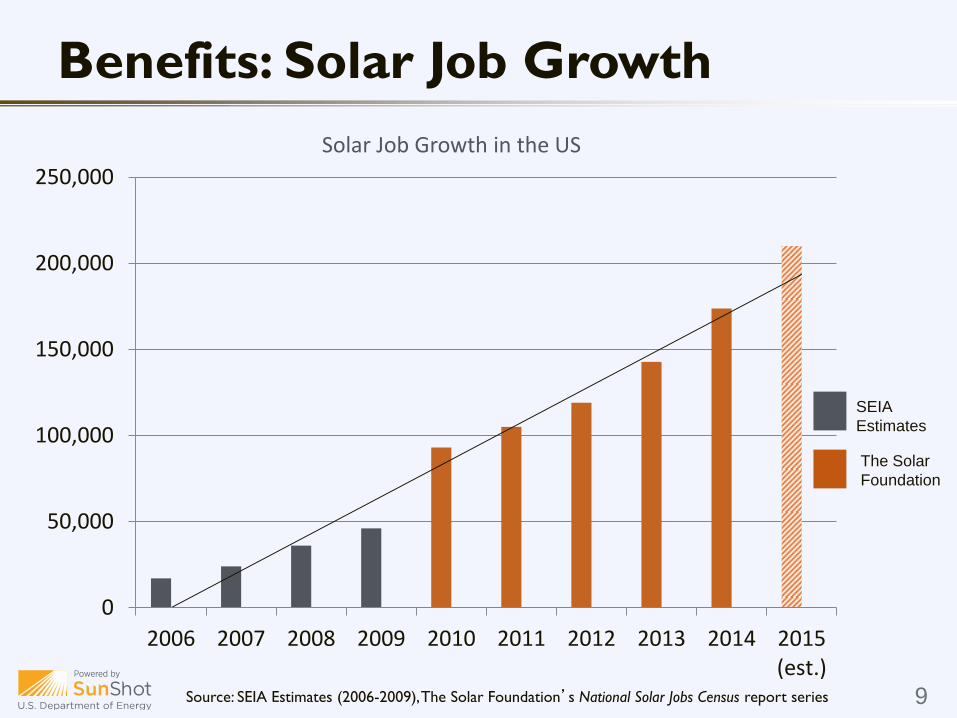
Benefits: Solar Job Growth
Source: SEIA Estimates (2006-2009), The Solar Foundation’s National Solar Jobs Census report series 9
0
50,000
100,000
150,000
200,000
250,000
2006 2007 2008 2009 2010 2011 2012 2013 2014 2015(est.)
Solar Job Growth in the US
SEIA
Estimates
The Solar
Foundation

27 Jobs and $4.2 Million
The Local Economic Opportunity
Source: JEDI Model, NREL
In economic output
1 Megawatt of Residential Solar
Development in New Jersey:
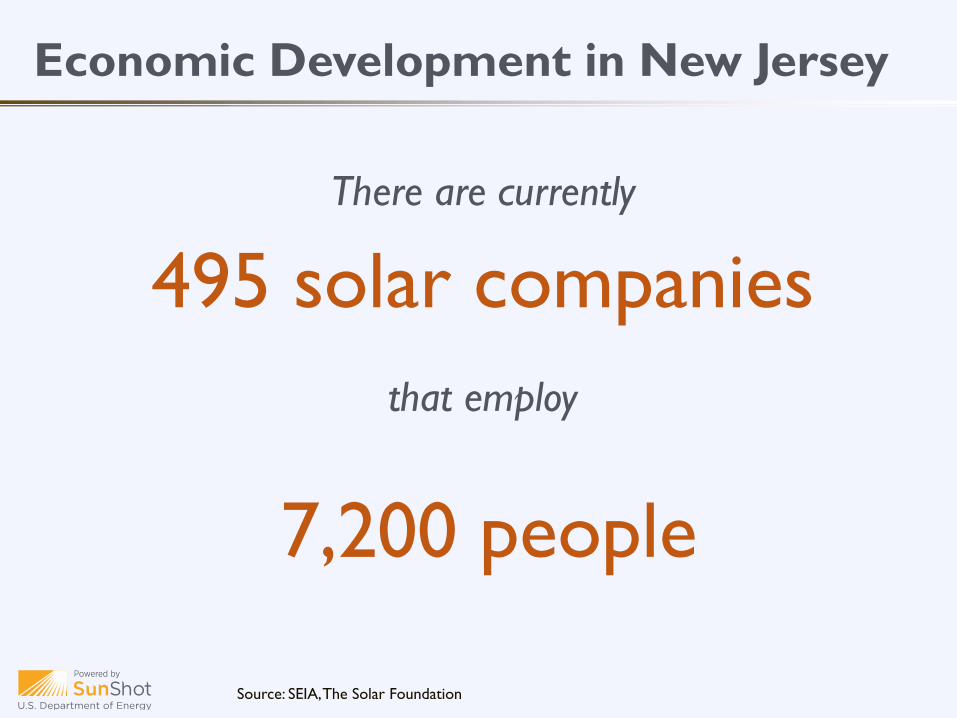
495 solar companies
that employ
7,200 people
Economic Development in New Jersey
Source: SEIA, The Solar Foundation
There are currently

Economic Development in New Jersey
Source: SEIA’s National Solar Database

Benefit: Stabilize Energy Prices
Source: NEPOOL 13
0.00
20.00
40.00
60.00
80.00
100.00
120.00
140.00
160.00
180.00
Mar
-03
Jul-
03
No
v-0
3
Mar
-04
Jul-
04
No
v-0
4
Mar
-05
Jul-
05
No
v-0
5
Mar
-06
Jul-
06
No
v-0
6
Mar
-07
Jul-
07
No
v-0
7
Mar
-08
Jul-
08
No
v-0
8
Mar
-09
Jul-
09
No
v-0
9
Mar
-10
Jul-
10
No
v-1
0
Mar
-11
Jul-
11
No
v-1
1
Mar
-12
Jul-
12
No
v-1
2
Mar
-13
Jul-
13
No
v-1
3
Mar
-14
$/M
Wh
Date
Historical Average Real-Time LMP (NEMABOS)
.

$15,000 $15,000
$11,000 $12,700
$16,000
$0
$2,000
$4,000
$6,000
$8,000
$10,000
$12,000
$14,000
$16,000
$18,000
All Homes California Rest of U.S. New Homes Existing Homes
Average Value Premium for Homes with Solar PV Systems
Smart Investment for Homeowners
Source: LBNL, Selling Into the Sun (2015)

Reduction in Air Emissions
A 5-kW solar PV system produces
6,700 kWh in the first year, equivalent to
4.6 metric tons of avoided CO2 emissions
Water Savings
Annual savings of nearly1,400 gallons of water
Environmental Benefits
Source: NREL PVWatts; EPA Greenhouse Gas Equivalencies Calculator;
http://iopscience.iop.org/1748-9326/7/4/045802/pdf/1748-9326_7_4_045802.pdf
520 gallons of
gasoline
3.8 acres of
U.S. forests

Overview of the State and
National Solar Market

New Jersey Solar Market
Source: SEIA/GTM Research, Solar Market Insight; IREC, Solar Market Trends
0
50
100
150
200
250
300
350
400
450
2008 2009 2010 2011 2012 2013 2014 2015(est.)
2016(est.)
Annual Solar PV Capacity Additions
Res Non-Res Utility Combined
Cumulative Total:
1,524 Megawatts

Source: New Jersey’s Clean Energy Program, “New Jersey Solar Installation Update 5/31/2015”
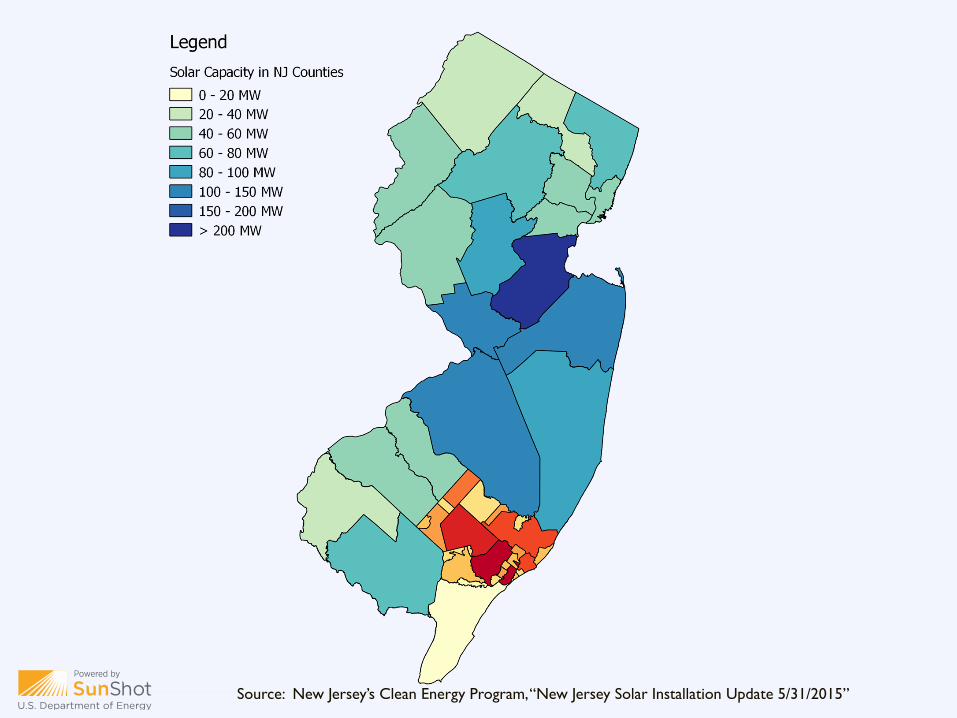
Source: New Jersey’s Clean Energy Program, “New Jersey Solar Installation Update 5/31/2015”
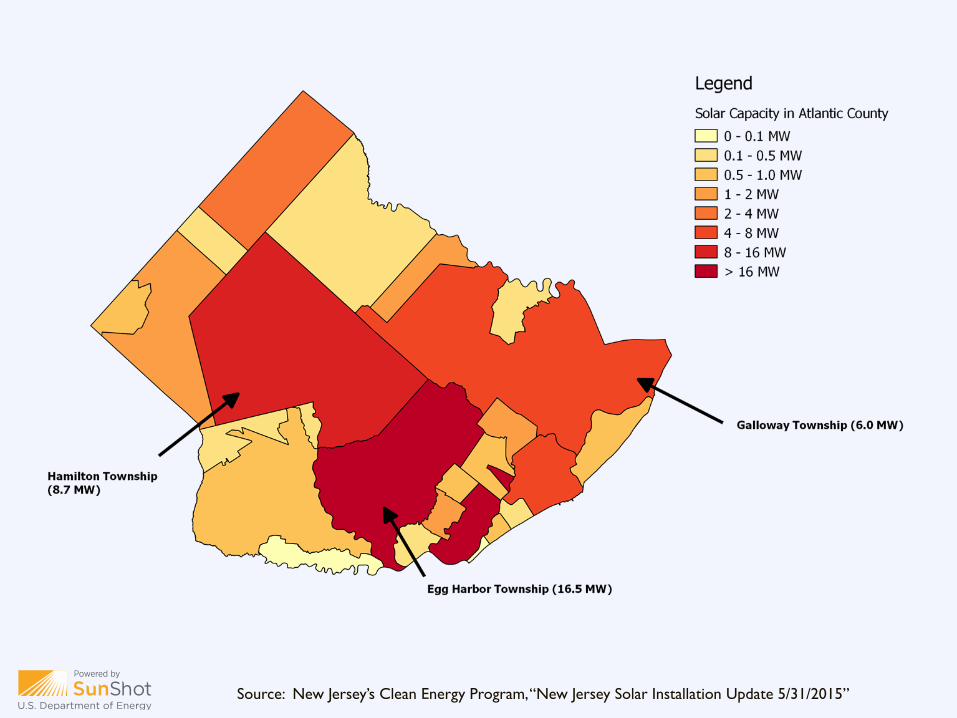
Source: New Jersey’s Clean Energy Program, “New Jersey Solar Installation Update 5/31/2015”

US Solar Market
Source: Solar Energy Industries Association/ GTM Research, Solar Market Insight: 2014 Year-in-Review
Cumulative Total:
~21,000 Megawatts

0
2000
4000
6000
8000
10000
12000
Cumulative Installed PV Capacity for Select Solar States (MW) Q2 2015
US Solar Market
Source: SEIA, Solar Market Insight Q2 2015
7.25% of US
Capacity

New Jersey Solar Market
Source: SEIA, Solar Market Insight Q2 2015
New Jersey
US
170 watts per person
68 watts per person

World Solar Market
Source: REN 21, Renewables 2015 Global Status Report
Top 5 Countries Solar Operating Capacity (2014)
Germany
China
Japan
Italy
USA
Rest of World
Germany
21.5 %
USA
10.2%

US Solar Resource
Source: National Renewable Energy Laboratory 25

The Cost of Solar PV
Tracking the Sun VIII: The Installed Cost of Photovoltaics in the US from 1998-2014 (LBNL)
$0.00
$2.00
$4.00
$6.00
$8.00
$10.00
$12.00
$14.00
2002 2004 2006 2008 2010 2012 2014
$/W
dc
Average Installed Cost for Residential Solar in NJ
48% drop in price
2010 - 2014

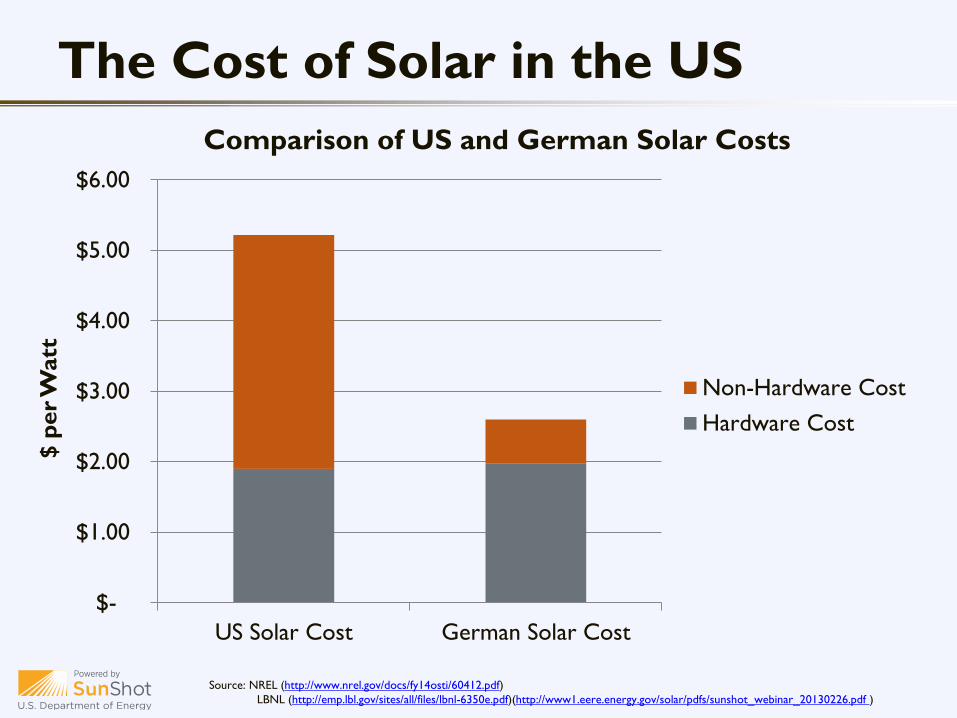
The Cost of Solar in the US
Source: NREL (http://www.nrel.gov/docs/fy14osti/60412.pdf)
LBNL (http://emp.lbl.gov/sites/all/files/lbnl-6350e.pdf)(http://www1.eere.energy.gov/solar/pdfs/sunshot_webinar_20130226.pdf )
$-
$1.00
$2.00
$3.00
$4.00
$5.00
$6.00
US Solar Cost German Solar Cost
$ p
er
Watt
Comparison of US and German Solar Costs
Non-Hardware Cost
Total Installed Cost
The Cost of Solar in the US
Source: NREL (http://www.nrel.gov/docs/fy14osti/60412.pdf)
LBNL (http://emp.lbl.gov/sites/all/files/lbnl-6350e.pdf)(http://www1.eere.energy.gov/solar/pdfs/sunshot_webinar_20130226.pdf )
$-
$1.00
$2.00
$3.00
$4.00
$5.00
$6.00
US Solar Cost German Solar Cost
$ p
er
Watt
Comparison of US and German Solar Costs
Non-Hardware Cost
Hardware Cost

The Cost of Solar in the US
$-
$1.00
$2.00
$3.00
$4.00
$5.00
$6.00
US Solar Cost German Solar Cost
$ p
er
Watt
Comparison of US and German Solar Costs
Non-Hardware Cost
Hardware Cost
Source: NREL (http://www.nrel.gov/docs/fy14osti/60412.pdf)
LBNL (http://emp.lbl.gov/sites/all/files/lbnl-6350e.pdf)(http://www1.eere.energy.gov/solar/pdfs/sunshot_webinar_20130226.pdf )

$-
$1.00
$2.00
$3.00
$4.00
$5.00
$6.00
US Solar Cost German Solar Cost
$ p
er
Watt
Comparison of US and German Solar Costs
Column1
Non-Hardware Cost
Hardware Cost
The Cost of Solar in the US
Profits, Taxes, &
Overhead
Source: NREL (http://www.nrel.gov/docs/fy14osti/60412.pdf)
LBNL (http://emp.lbl.gov/sites/all/files/lbnl-6350e.pdf)(http://www1.eere.energy.gov/solar/pdfs/sunshot_webinar_20130226.pdf )
$-
$1.00
$2.00
$3.00
$4.00
$5.00
$6.00
US Solar Cost German Solar Cost
$ p
er
Watt
Comparison of US and German Solar Costs
Column1
Non-Hardware Cost
Hardware Cost
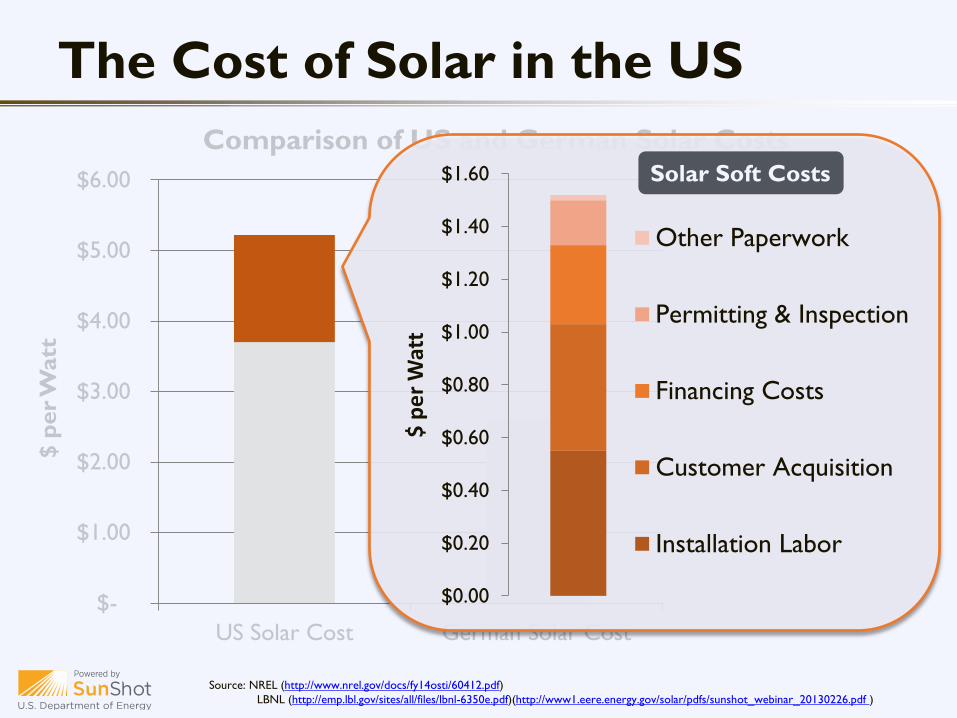
The Cost of Solar in the US
$0.00
$0.20
$0.40
$0.60
$0.80
$1.00
$1.20
$1.40
$1.60
$ p
er
Wat
t
Other Paperwork
Permitting & Inspection
Financing Costs
Customer Acquisition
Installation Labor
Solar Soft Costs
Source: NREL (http://www.nrel.gov/docs/fy14osti/60412.pdf)
LBNL (http://emp.lbl.gov/sites/all/files/lbnl-6350e.pdf)(http://www1.eere.energy.gov/solar/pdfs/sunshot_webinar_20130226.pdf )

Solar Policies, Incentives, and
Financing
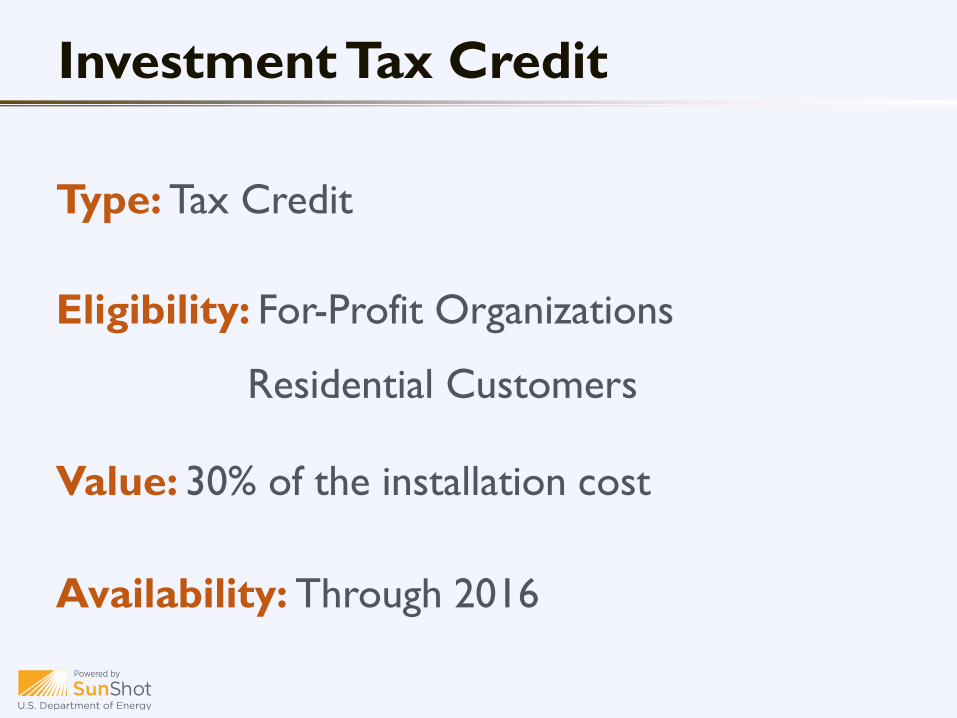
Type: Tax Credit
Eligibility: For-Profit Organizations
Residential Customers
Value: 30% of the installation cost
Availability: Through 2016
Investment Tax Credit

Renewable Portfolio Standard
Retail Electricity Sales
Any electricity source
Renewable
Energy

Renewable Portfolio Standard
Retail Electricity Sales
Any electricity source
Solar carve-out
Renewable
Energy

RPS: New Jersey Overview
New Jersey utilities required to:
Provide 22.5% renewable energy
by 2021
– 11.3% in 2015
Provide 4.1% solar by 2028
– 2.45% in 2015
Utilities may either develop their own renewable resources
or purchase Renewable Energy Certificates (RECs)
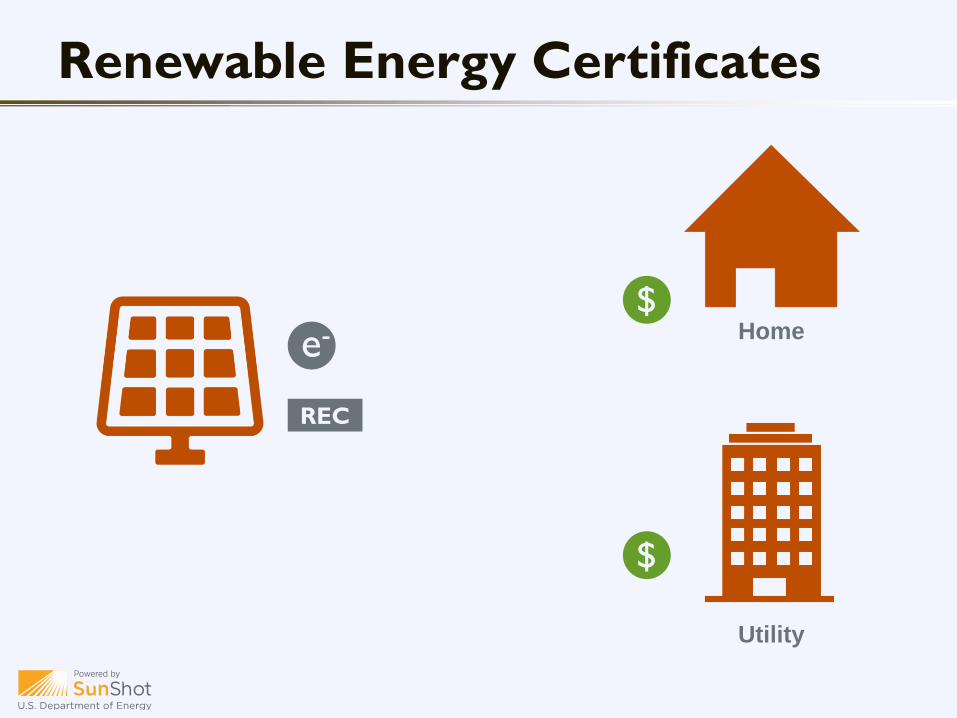
Renewable Energy Certificates
e-
REC
$
$
Utility
Home

The New Jersey SREC Market
Systems can sell RECs for first 15
years of operation
Prices determined by market
(currently around $200/MWh)
Past high prices have driven the
New Jersey solar boom

NJ SREC Price History
$0
$100
$200
$300
$400
$500
$600
$700
2005 2006 2007 2008 2009 2010 2011 2012 2013 2014
$/MWh

Financing Options for Solar
Buy Outright
Lending Third-Party Ownership

Financing Options for Solar
Buy Outright Lending Third Party
Upfront Cost High Low to None Low to None
O&M Costs Customer Customer Developer
Solar Electricity Costs None Predictable Payments Predicable Payments
Difficulty Complex Moderate Easy
Value to Customer Potentially Higher ROI Moderate ROI Shared Benefits
Development Risk Customer Customer Developer
Performance Risk Customer Customer Developer

Net metering allows customers to export
power to the grid during times of excess
generation, and receive credits that can be
applied to later electricity usage.
Net Metering

0.0
0.1
0.2
0.3
0.4
0.5
0.6
0.7
0.8
0.9
1.0
12 AM 4 AM 8 AM 12 PM 4 PM 8 PM
Ave
rage
Ho
url
y kW
h
Household Consumption Solar Generation
Net Metering
Load Met
by Grid
Exports to
Grid
Load Met
by Solar

Net Metering: Market Share
Source: IREC (http://www.irecusa.org/wp-content/uploads/IRECSolarMarketTrends-2012-web.pdf)
More than 93% of distributed
PV Installations are net-metered

Provides a “report card” for
state policy on net metering
and interconnection
http://freeingthegrid.org/
Net Metering: Resources
Resource Freeing the Grid

Net Metering: New Jersey
Source: Freeing the Grid, DSIRE
Applicable Utilities
Investor-owned utilities;
Electric suppliers
Credit Rollover
Monthly excess valued at
retail rate, annual excess
at avoided cost
Program Capacity
Option for BPU to limit to
2.5% of peak demand
(could be increased to 2.9%)
System Capacity Limit
Sized not to exceed
consumption
A 2010 2011 2012 2013 2014
A A A A A A
2015

Solar Access Laws:
1. Increase the likelihood that properties will receive
sunlight
2. Protect the rights of property owners to install
solar
3. Reduce the risk that systems will be shaded after
installation
Solar Access

Solar Access: New Jersey
Solar Rights
Limits on Homeowners Associations ability to restrict solar
10% cost adder limit
Solar Easements
Solar owners allowed to enter into easements with neighbors
Statute provides minimum information required in easement

Reducing Customer
Acquisition Soft Costs with
Solarize
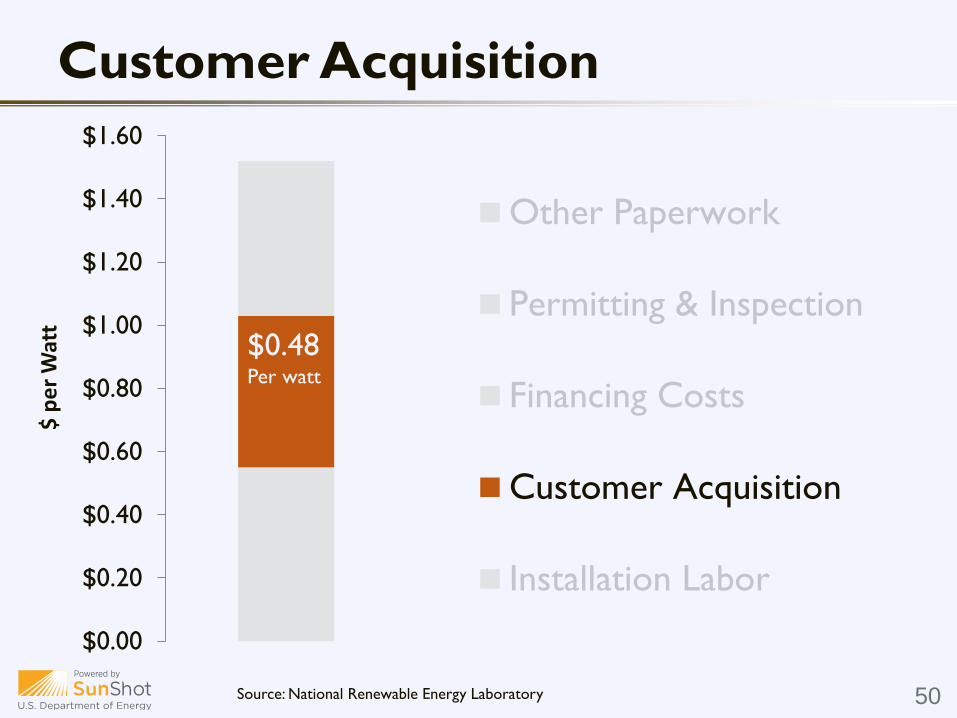
Customer Acquisition
Source: National Renewable Energy Laboratory 50
$0.00
$0.20
$0.40
$0.60
$0.80
$1.00
$1.20
$1.40
$1.60
$ p
er
Wat
t
Other Paperwork
Permitting & Inspection
Financing Costs
Customer Acquisition
Installation Labor
$0.48 Per watt
Customer Acquisition
5 % of homeowners that request
a quote choose to install solar.
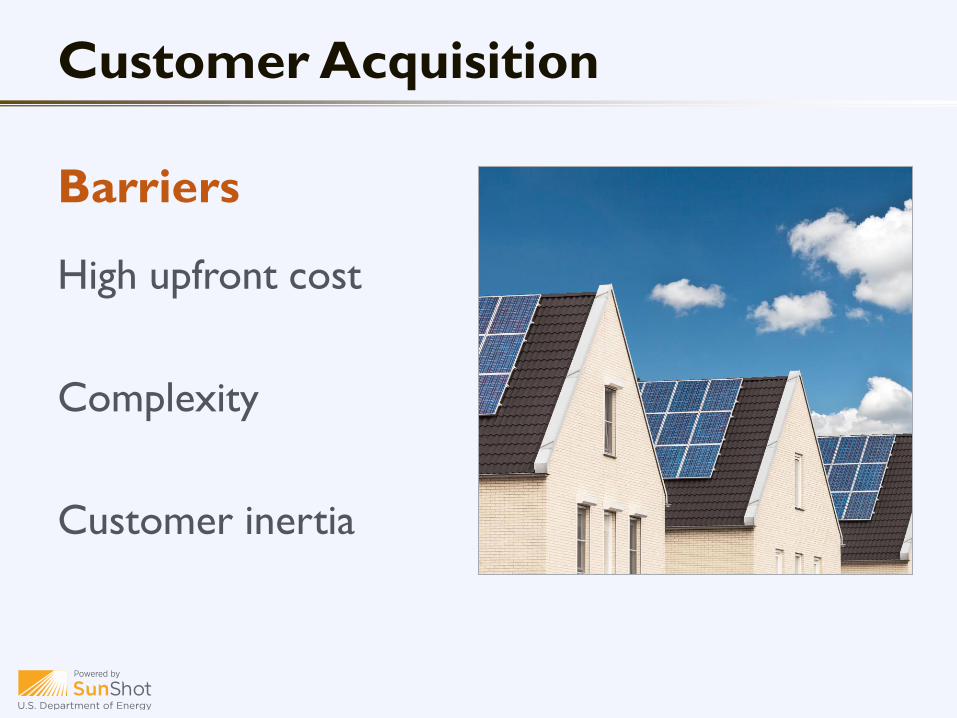
Barriers
High upfront cost
Complexity
Customer inertia
Customer Acquisition

The Solarize Program
Group purchasing for residential solar PV

Barriers
High upfront cost
Complexity
Customer inertia
Solutions
Group purchase
Vetted offer and
standardized process
Limited-time offer
The Solarize Program
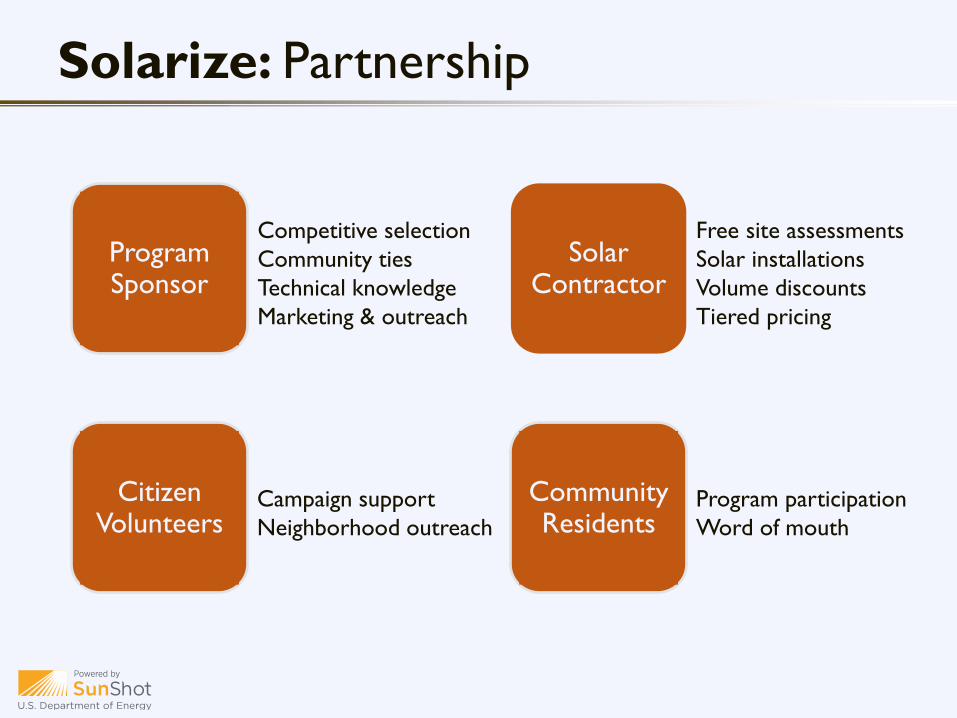
Solarize: Partnership
Program Sponsor
Solar Contractor
Citizen Volunteers
Community Residents
Competitive selection
Community ties
Technical knowledge
Marketing & outreach
Campaign support
Neighborhood outreach
Free site assessments
Solar installations
Volume discounts
Tiered pricing
Program participation
Word of mouth

Solarize: Process
Select Installer
Marketing &
Workshops Enrollment
Site Assessment
Decision &
Installation

Solarize: Case Study
Source: Wikipedia
Harvard, Massachusetts
Population: 6,520
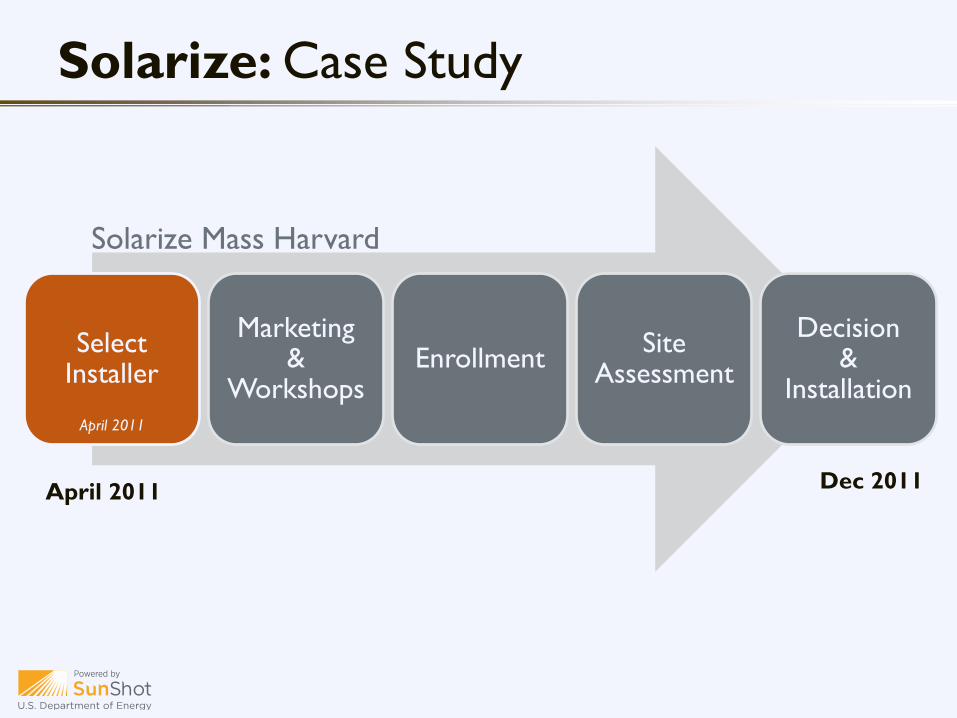
Solarize: Case Study
Select Installer
Marketing &
Workshops Enrollment
Site Assessment
Decision &
Installation
April 2011 Dec 2011
Solarize Mass Harvard
April 2011
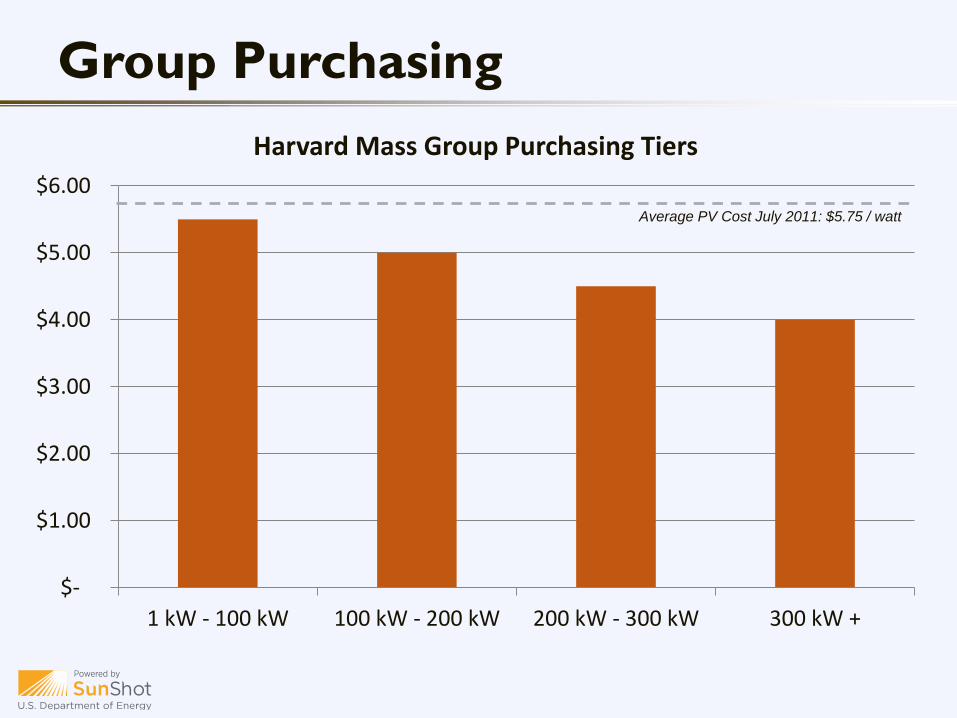
Group Purchasing
$-
$1.00
$2.00
$3.00
$4.00
$5.00
$6.00
1 kW - 100 kW 100 kW - 200 kW 200 kW - 300 kW 300 kW +
Harvard Mass Group Purchasing Tiers
Average PV Cost July 2011: $5.75 / watt

Solarize: Case Study
Select Installer
Marketing &
Workshops Enrollment
Site Assessment
Decision &
Installation
April 2011 Dec 2011
Solarize Mass Harvard
May – July 2011

Marketing Strategy:
Electronic survey of 1,100 households
Email newsletters and direct mailings
Float in July 4 parade
Articles and advertisements in local newspaper
Facebook page and online discussion board
Solarize: Case Study
Source: Vote Solar

Solarize: Case Study
Select Installer
Marketing &
Workshops Enrollment
Site Assessment
Decision &
Installation
April 2011 Dec 2011
Solarize Mass Harvard
June – Oct 2011
429 households signed up

Solarize: Case Study
Select Installer
Marketing &
Workshops Enrollment
Site Assessment
Decision &
Installation
April 2011 Dec 2011
Solarize Mass Harvard
Oct 2011
151 feasible households
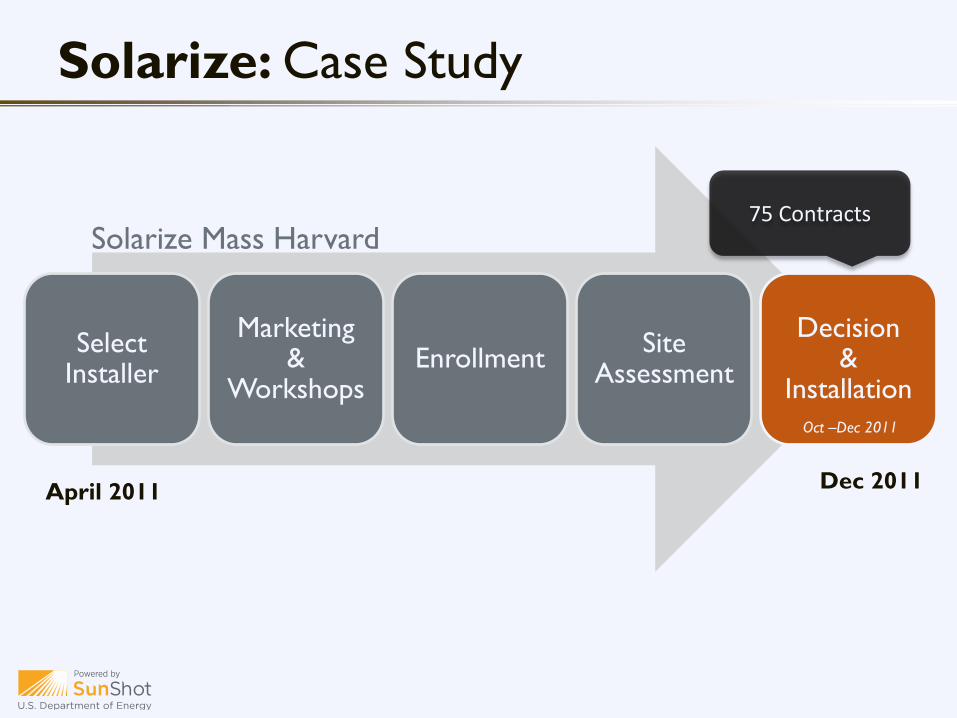
Solarize: Case Study
Select Installer
Marketing &
Workshops Enrollment
Site Assessment
Decision &
Installation
April 2011 Dec 2011
Solarize Mass Harvard
Oct –Dec 2011
75 Contracts

$-
$1.00
$2.00
$3.00
$4.00
$5.00
$6.00
1 kW - 100 kW 100 kW - 200 kW 200 kW - 300 kW 300 kW +
Harvard Mass Group Purchasing Tiers
Group Purchasing
$-
$1.00
$2.00
$3.00
$4.00
$5.00
$6.00
1 kW - 100 kW 100 kW - 200 kW 200 kW - 300 kW 300 kW +
Harvard Mass Group Purchasing Tiers
403 kW capacity contracted
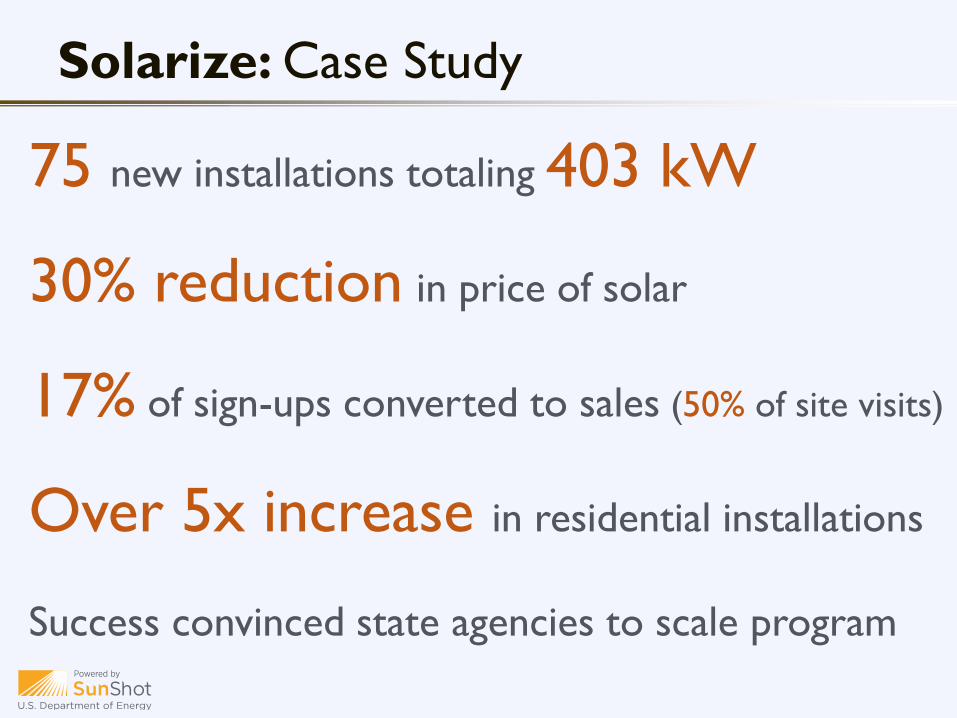
Solarize: Case Study
75 new installations totaling 403 kW
30% reduction in price of solar
17% of sign-ups converted to sales (50% of site visits)
Over 5x increase in residential installations
Success convinced state agencies to scale program

Solarize: Sample NJ Cost Savings
$3.90/W (2014 State Average)
$3.12/W (20% Solarize Discount)
System Size 5 kW
Annual Production 6,702 kWh
Total Cost $19,500 $15,600
30% Federal ITC ($5,850) ($4,680)
Net Cost $13,650 $10,920
Annual Electricity Savings $1,217
20-yr. Net Present Value $8,322 $10,836
Payback Period 6.7 Years 5.4 Years
Assumptions: Atlantic City TMY2 Weather Data; 1.1 DC to AC ratio; 96% inverter efficiency; 20 degree tilt; 180
degree azimuth; 14.08% total system losses; 0.5% annual degradation rate; 100% debt; 10 year loan @ 5% interest;
20 year analysis period; 8.14% nominal discount rate; 25% federal income tax rate; 6.37% state income tax rate; 0%
sales and property tax rate; 0.5% annual insurance rate; $20/kW/year O&M costs; 30% Federal ITC; $200/SREC for
15 years; Atlantic City Electric RS rate; net metering enabled; 0.6% annual electric cost escalator; 8,386 kWh annual
electric consumption

A household is
0.78% more likely to adopt solar
for
each additional installation in their zip code
Solarize: Lasting Impact
Source: NYU Stern and Yale School of Forestry – Peer Effects in the Diffusion of Solar Panels

Solarize: Lasting Impact
Source: NREL
Lasting Impact
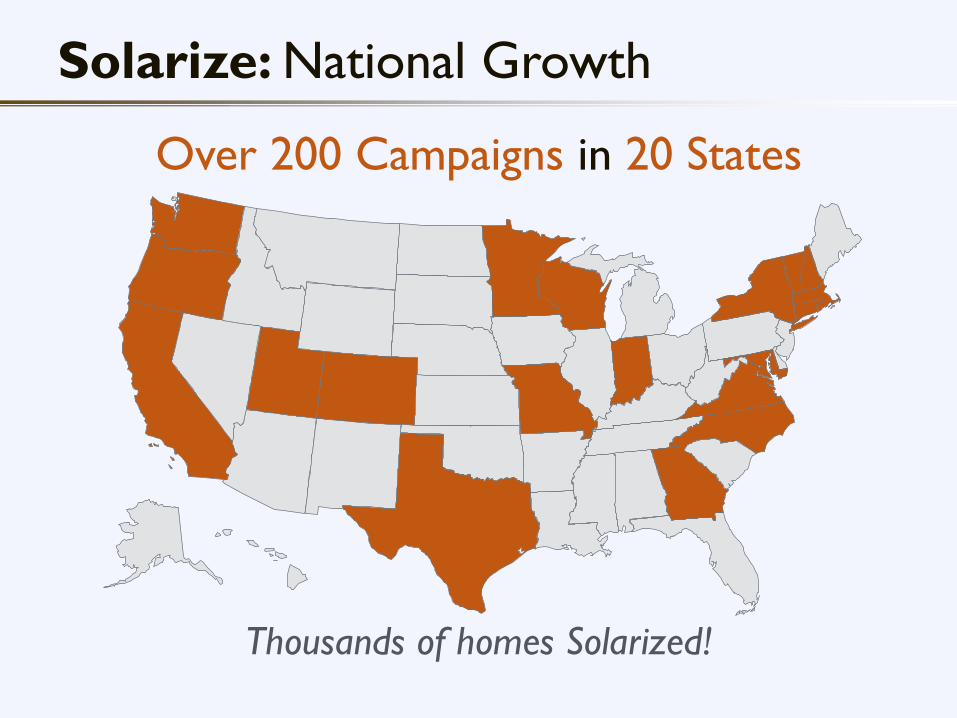
Solarize: National Growth
Over 200 Campaigns in 20 States
Thousands of homes Solarized!

Watch for the Survey Sustainable Jersey will disseminate a short survey to
gauge interest in enrolling in the program and/or in
volunteering for the campaign
Ask Questions Let us help you better understand the program and
its benefits
Sign Up to Volunteer Contact Zachary Nickerson
([email protected]) to help spread the word
Solarize: Next Steps
A roadmap for project
planners and solar advocates
who want to create their own
successful Solarize campaigns.
www.nrel.gov
Solarize: Resources
Resource The Solarize Guidebook
Related Documents