Running head: Pedestrian Safety 1 Socioeconomics, the Built Environment and Pedestrian Safety in Central Florida Best Foot Forward Crosswalk Observation and Data Collection @ Pine Hills Rd & Alhambra Dr 12.02.19 Zara Abid, Alexander Leon-Rivera, Jason Sartorio, Randy Schrader, James Smith PAD 6716 Final Paper Fall 2019

Welcome message from author
This document is posted to help you gain knowledge. Please leave a comment to let me know what you think about it! Share it to your friends and learn new things together.
Transcript
Running head: Pedestrian Safety 1
Socioeconomics, the Built Environment
and Pedestrian Safety in Central Florida
Best Foot Forward Crosswalk Observation and Data Collection @ Pine Hills Rd & Alhambra Dr 12.02.19
Zara Abid, Alexander Leon-Rivera,
Jason Sartorio, Randy Schrader,
James Smith
PAD 6716 Final Paper
Fall 2019
Pedestrian Safety 2
Abstract
Central Florida leads the nation in the number of pedestrian deaths on its roadways, taking the
top spot as the most dangerous metropolitan area for pedestrians in the overall worst state for
walkers (Dangerous by Design, 2019). However, some Central Florida communities experience
much higher rates of pedestrian crashes than others. Two factors that contribute to this disparity
include the socioeconomic status of the community and elements of the built environment. Using
Geographic Information Systems (GIS) mapping, this research explores the role both factors play
in the frequency and severity of pedestrian crashes in two Central Florida communities, Pine
Hills and Baldwin Park. Elements of the built environment such as lower speed limits and better
lighting along with a higher percentage of households with cars leads to safer roads and fewer
crashes in planned communities such as Baldwin Park. Sprawling, unplanned lower-income
neighborhoods the likes of Pine Hills have poor infrastructure combined with large numbers of
people walking to work or bus stops, leading to an increased number of walkers struck by
vehicles. While some of these issues can be difficult to address, improvements to the built
environment can make streets safer for walkers in all communities.
Pedestrian Safety 3
Background and Justification
Increasingly, streets are becoming more dangerous for pedestrians. More than 13 people
per day are struck and killed by drivers every day across America (Dangerous by Design, 2019).
Florida in particular consistently ranks among the worse place for pedestrians in the United
States, claiming eight of the top 10 spots in Smart Growth America’s Dangerous by Design 2019
(2019) rankings of the most dangerous areas for walking based on the number of pedestrians
struck and killed by drivers and controlling for population and percentage of people who walk to
work. The top spot in 2019 belongs to the Orlando-Kissimmee-Sanford metro area with 656
pedestrian deaths between 2008 and 2017 with an average of 2.82 per 100,000 people. But when
it comes to pedestrian crashes, all Central Florida communities are not created equally.
Socioeconomic factors and differences in the built environment can lead to substantial
differences in the number of pedestrian-related crashes form one community to the next. This
study focuses on two local communities, Pine Hills and Baldwin Park, in order to understand
these differences and identify next steps for future improvements.
Socioeconomics plays an important role in crash frequency with significant disparities
between poor and affluent areas. Pedestrian crashes are four times more likely in low-income
neighborhoods, according to Chakravarthy, Anderson, Ludlow, Lotfipour, and Vaca (2010). In
their study of Orange County, CA, using GIS and census tract data, they found that each one-
percent increase in percentage of low-income residents resulted in a 2.8 percent increase in
pedestrian crashes. They also demonstrated that other factors such as age, education, population
density and English fluency were associated with more crashes. But adding the variable of low
income to regression analysis of these factors demonstrated that poverty was the single-biggest
factor (Chakravarthy et al., 2010).
Pedestrian Safety 4
Utilizing GIS mapping, Chimba, Musinguzi and Kidando (2018) demonstrated that low
car ownership leads to a higher risk of pedestrian crashes due to increased exposure resulting
from a greater volume of foot traffic. Other factors they cite for elevated risk include high
population density and a concentration of commercial areas. Likewise, Siddiqui, Abdel-Aty, and
Choi (2014) examined areas defined as environmental justice (EJ) areas with low-income and
minority populations. They found that factors such as high population density, unemployment,
and low car ownership is positively associated with pedestrian crashes. “Higher pedestrian
activities result in higher pedestrian exposure which, as mentioned before, will increase the
possibility of pedestrian related crashes (Siddiqui et al., 2014).”
While economically disadvantaged areas pose a higher risk for pedestrian crashes, more
affluent neighborhoods appear to be safer. Communities where more people commute by car and
that have a higher median household income experience a reduced frequency of pedestrian
crashes (Chimba et al., 2018). People in these communities are more likely to afford reliable
transportation. People who own cars don’t need to walk to work or bus stops, thereby reducing
their exposure risk.
The built environment also significantly impacts the frequency of pedestrian crashes.
Using GIS to identify clusters of pedestrians injured in crashes, Dai (2012) found extremely
elevated risks for crashes in high-activity suburban corridors where high-speed state highways
intersect local streets, an environment matching the conditions in Pine Hills. Other common
elements of the built environment include a mixture of business and residential properties with
multiple lanes and fewer sidewalks and crosswalks. More specifically, both Pine Hills and the
clusters identified by Dai (2012) have arterial roads with 45 mph speed limits; in Pine Hills these
include State Road 50, Silver Star Road and segments of Pine Hills Road. Having these types of
Pedestrian Safety 5
roads in close proximity to commercial and residential corridors creates “high-risk zones for
pedestrian injuries, where pedestrians have to negotiate with heavy fast-speed traffic on wide
streets (Dai, 2012).” On arterial roads and major collectors, pedestrians face 50 times higher risk
than lower-speed environments (Garder, 2004).
Another significant contributing factor of pedestrian crashes due to the built environment
is poor lighting, which considerably raises the risk for pedestrian injuries (Dai, 2012). More than
half of all fatal pedestrian crashes happen at night, where drivers often report they don’t see
pedestrians before crashes (Retting, Ferguson & McCartt, 2003). Adequate street lighting at
pedestrian crossing can reduce the odds of fatal pedestrian injury 42 percent at midblock
locations and by 54 percent at intersections (Siddiqui, 2006). A study in Pinellas County,
Florida, confirmed that night-time pedestrian crashes were more frequent along segments of road
with low lighting levels than those that are well lit (Zhou & Hsu, 200).
Research Questions
This research focuses on two factors that may account for the disparities in the number of
pedestrian crashes in the Central Florida communities of Pine Hills and Baldwin Park, each with
differing socioeconomic and surrounding built environment conditions:
1. Are differing socioeconomic conditions in Pine Hills and Baldwin Park correlated to the
number of pedestrian crashes?
2. Do aspects of the built environment in Pine Hills and Baldwin Park contribute to the
frequency of pedestrian crashes?
Methodology
Study Setting/Neighborhood Profiles
Pedestrian Safety 6
The observed areas in this comparison of Pine Hills in Orange County, Florida, and the
Baldwin Park neighborhood within the City of Orlando vary immensely. Each area has a unique
history and set of circumstances occurring over time resulting in the distinct neighborhood
characteristics observed today. Various styles of developments—redevelopments, or lack
thereof—along with road networks from the period or style the respective neighborhoods were
conceived under, have been equally influential in the statistics examined under this comparison.
Pine Hills Neighborhood Profile
The Pine Hills Community is located seven miles northwest of downtown Orlando in
northwest unincorporated Orange County. The community contains 12.25 square miles of land
area with the general boundaries of Apopka-Vineland Road to the west, Clarcona-Ocoee Road
(SR 431) to the north, the Orlando City limits to the east, and the East-West Expressway (SR
408) to the south (Pine Hills Neighborhood Improvement District, 2015). Within this
comparison, the focus area has been narrowed down to a smaller area bounded by North
Hiawassee Road to the west, North Lane to the North, Pine Hills Road to the east, and Colonial
Drive to the south.
Pine Hills began as a series of large-scale subdivision developments in 1953 following a
nationwide pattern of post-World War II suburban development. The various developments
composing the greater Pine Hills area became a bedroom community for large and major
employers growing in Orlando at the time, including Martin Marietta Company, now known as
Lockheed Martin (Pine Hills NID, 2015). Road networks and the development of new homes in
Pine Hills followed the emerging trend of prioritizing private ownership and vehicle access, as
was the intention for suburban bedroom communities. The residential street grids do not entirely
connect and are cumbersome to navigate, resulting in a relative few major arterial thoroughfares
Pedestrian Safety 7
handling the majority of traffic volume, particularly Colonial Drive (SR 50), Silver Star Road
(SR 438), Hiawassee Road and the Pine Hills Road corridor included in our study.
By the late 1980s and through the 1990s, a significant increase in crime and overall
decline plagued the community. A greater sense of blight ensued as lack of investment caused
streets and properties to fall into disrepair and further economic instability resulted from the
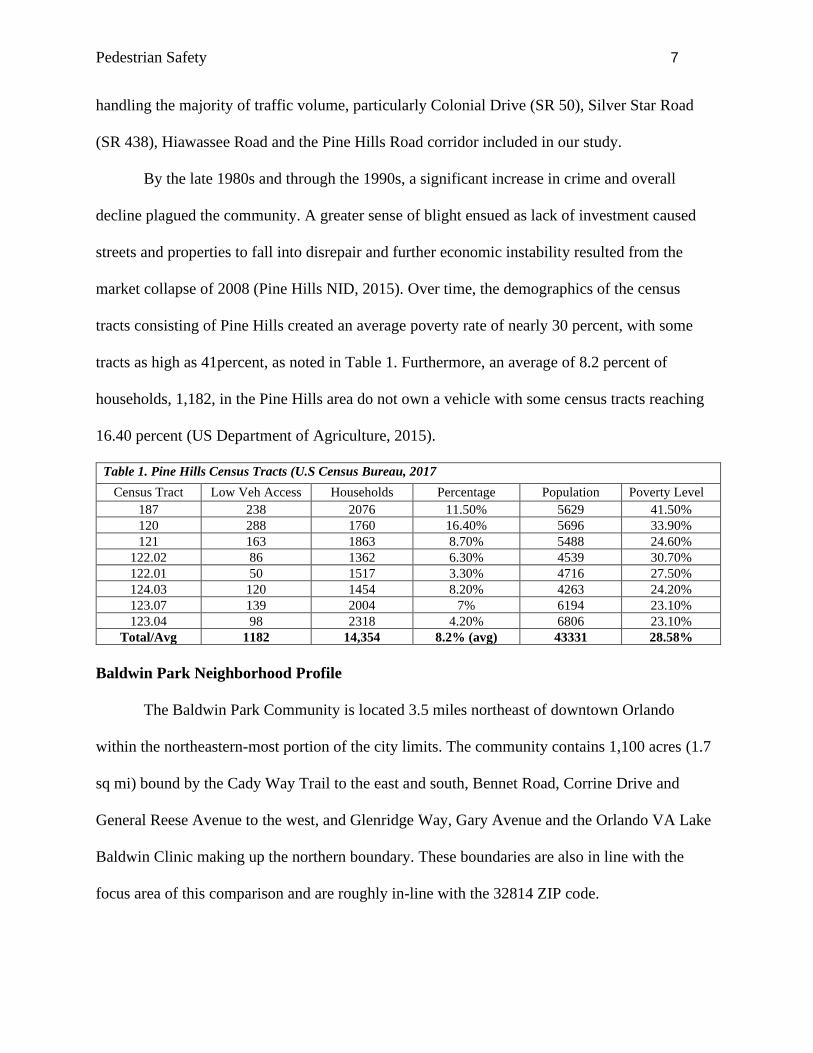
market collapse of 2008 (Pine Hills NID, 2015). Over time, the demographics of the census
tracts consisting of Pine Hills created an average poverty rate of nearly 30 percent, with some
tracts as high as 41percent, as noted in Table 1. Furthermore, an average of 8.2 percent of
households, 1,182, in the Pine Hills area do not own a vehicle with some census tracts reaching
16.40 percent (US Department of Agriculture, 2015).
Table 1. Pine Hills Census Tracts (U.S Census Bureau, 2017
Census Tract Low Veh Access Households Percentage Population Poverty Level
187 238 2076 11.50% 5629 41.50%
120 288 1760 16.40% 5696 33.90%
121 163 1863 8.70% 5488 24.60%
122.02 86 1362 6.30% 4539 30.70%
122.01 50 1517 3.30% 4716 27.50%
124.03 120 1454 8.20% 4263 24.20%
123.07 139 2004 7% 6194 23.10%
123.04 98 2318 4.20% 6806 23.10%
Total/Avg 1182 14,354 8.2% (avg) 43331 28.58%
Baldwin Park Neighborhood Profile
The Baldwin Park Community is located 3.5 miles northeast of downtown Orlando
within the northeastern-most portion of the city limits. The community contains 1,100 acres (1.7
sq mi) bound by the Cady Way Trail to the east and south, Bennet Road, Corrine Drive and
General Reese Avenue to the west, and Glenridge Way, Gary Avenue and the Orlando VA Lake
Baldwin Clinic making up the northern boundary. These boundaries are also in line with the
focus area of this comparison and are roughly in-line with the 32814 ZIP code.
Pedestrian Safety 8
The Baldwin Park community lies on land that was previously used for military purposes.
From World War II through the mid-1990s, the site was first known as the Orlando Army Air
station and eventually became the Naval Training Center (NTC) Main Base. By 1993, the federal
government identified NTC Orlando as a facility targeted for closure under the Federal Base
Realignment and Closure Commission (City of Orlando, n.d.).
The City of Orlando established the Base Reuse and Urban Design Vision Plan through
community input to guide transition of the property and facilities. This included a comprehensive
mix of uses, linking the site with the surrounding neighborhood, public access to lakes, a main
street, and a gridded street network all incorporating the use of Traditional Neighborhood Design
(TND) principles. As development teams were being selected for negotiations, city staff and
planners were assigned to each of the teams ensuring the city’s vision and objectives and for the
natural environment were incorporated, regardless of which development proposal was selected
(City of Orlando, n.d.). Through multiple negotiations between Orlando, the U.S. Navy and
developers, the site was sold in its entirety to one sole developer.
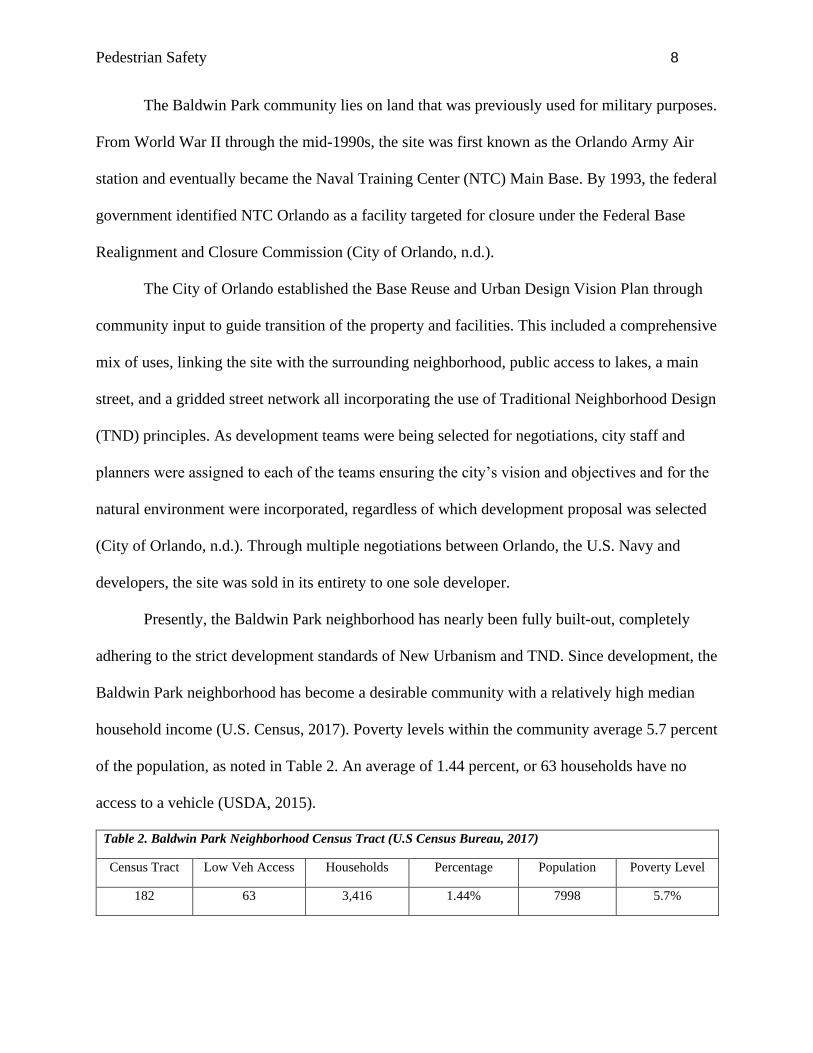
Presently, the Baldwin Park neighborhood has nearly been fully built-out, completely
adhering to the strict development standards of New Urbanism and TND. Since development, the
Baldwin Park neighborhood has become a desirable community with a relatively high median
household income (U.S. Census, 2017). Poverty levels within the community average 5.7 percent
of the population, as noted in Table 2. An average of 1.44 percent, or 63 households have no
access to a vehicle (USDA, 2015).
Table 2. Baldwin Park Neighborhood Census Tract (U.S Census Bureau, 2017)
Census Tract Low Veh Access Households Percentage Population Poverty Level
182 63 3,416 1.44% 7998 5.7%
Pedestrian Safety 9
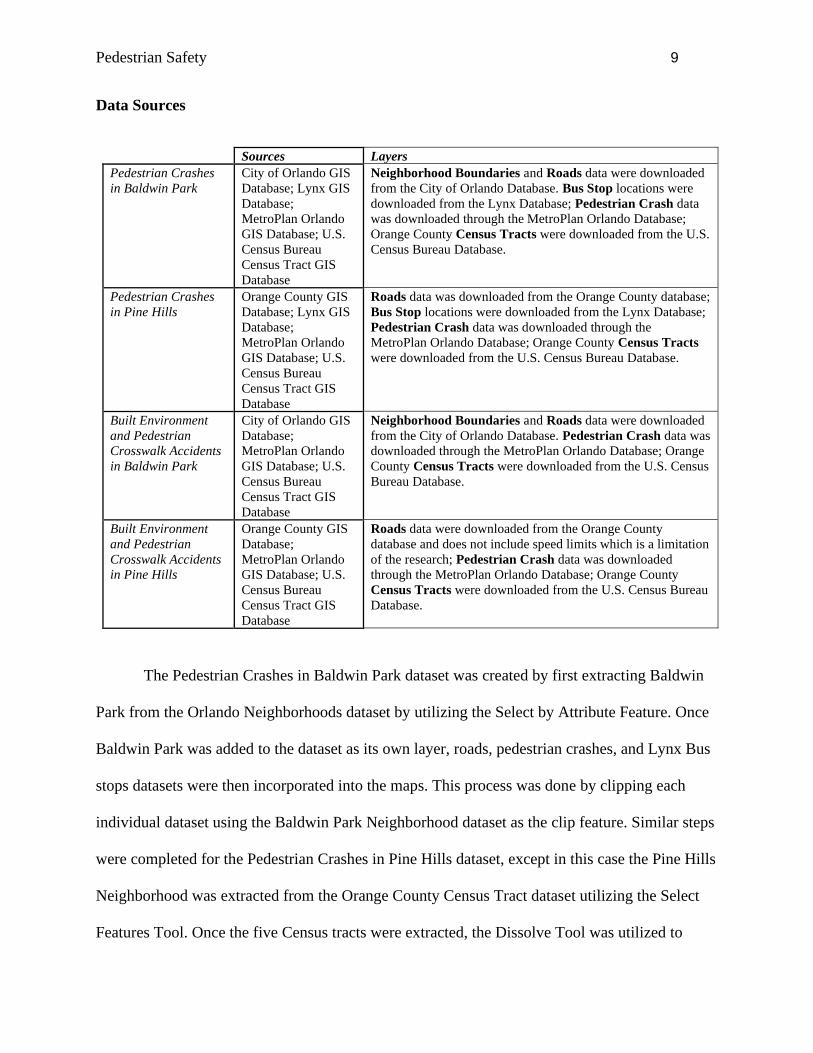
Data Sources
Sources Layers
Pedestrian Crashes
in Baldwin Park
City of Orlando GIS
Database; Lynx GIS
Database;
MetroPlan Orlando
GIS Database; U.S.
Census Bureau
Census Tract GIS
Database
Neighborhood Boundaries and Roads data were downloaded
from the City of Orlando Database. Bus Stop locations were
downloaded from the Lynx Database; Pedestrian Crash data
was downloaded through the MetroPlan Orlando Database;
Orange County Census Tracts were downloaded from the U.S.
Census Bureau Database.
Pedestrian Crashes
in Pine Hills
Orange County GIS
Database; Lynx GIS
Database;
MetroPlan Orlando
GIS Database; U.S.
Census Bureau
Census Tract GIS
Database
Roads data was downloaded from the Orange County database;
Bus Stop locations were downloaded from the Lynx Database;
Pedestrian Crash data was downloaded through the
MetroPlan Orlando Database; Orange County Census Tracts
were downloaded from the U.S. Census Bureau Database.
Built Environment
and Pedestrian
Crosswalk Accidents
in Baldwin Park
City of Orlando GIS
Database;
MetroPlan Orlando
GIS Database; U.S.
Census Bureau
Census Tract GIS
Database
Neighborhood Boundaries and Roads data were downloaded
from the City of Orlando Database. Pedestrian Crash data was
downloaded through the MetroPlan Orlando Database; Orange
County Census Tracts were downloaded from the U.S. Census
Bureau Database.
Built Environment
and Pedestrian
Crosswalk Accidents
in Pine Hills
Orange County GIS
Database;
MetroPlan Orlando
GIS Database; U.S.
Census Bureau
Census Tract GIS
Database
Roads data were downloaded from the Orange County
database and does not include speed limits which is a limitation
of the research; Pedestrian Crash data was downloaded
through the MetroPlan Orlando Database; Orange County
Census Tracts were downloaded from the U.S. Census Bureau
Database.
The Pedestrian Crashes in Baldwin Park dataset was created by first extracting Baldwin
Park from the Orlando Neighborhoods dataset by utilizing the Select by Attribute Feature. Once
Baldwin Park was added to the dataset as its own layer, roads, pedestrian crashes, and Lynx Bus
stops datasets were then incorporated into the maps. This process was done by clipping each
individual dataset using the Baldwin Park Neighborhood dataset as the clip feature. Similar steps
were completed for the Pedestrian Crashes in Pine Hills dataset, except in this case the Pine Hills
Neighborhood was extracted from the Orange County Census Tract dataset utilizing the Select
Features Tool. Once the five Census tracts were extracted, the Dissolve Tool was utilized to
Pedestrian Safety 10
remove the census tract boundaries to create one neighborhood layer. Roads, pedestrian crashes,
and Lynx Bus stops were then clipped using the Pine Hills Neighborhood dataset as the clip
feature.
The built environment dataset for Baldwin Park was created utilizing the Baldwin Park
Neighborhood layer, Baldwin Park Roads layer, and Baldwin Park Pedestrian crashes layer
created for the previous dataset. Next, speed limits were displayed by taking the roads layer and
adjusting the symbology to categorize by unique values using speed as the value field. To display
lighting conditions for crosswalk accidents, the Baldwin Park Pedestrian crashes layer was
utilized. Through the select by attributes feature, both location (within a crosswalk) and lighting
conditions (dusk, dawn, nighttime – no lighting) were selected and exported, and added to the
dataset as a new layer. The same step was completed for yield data, with the attributes selected
being location (within a crosswalk) and cause of the accident (either pedestrian failed to yield, or
motorist failed to yield). Finally, Crosswalk study locations were added to the dataset by
creating a shapefile and adding the points to the dataset manually. The same steps were followed
to create the Pine Hills built environment dataset, except speed limits were not included due to a
dataset limitation.
Results
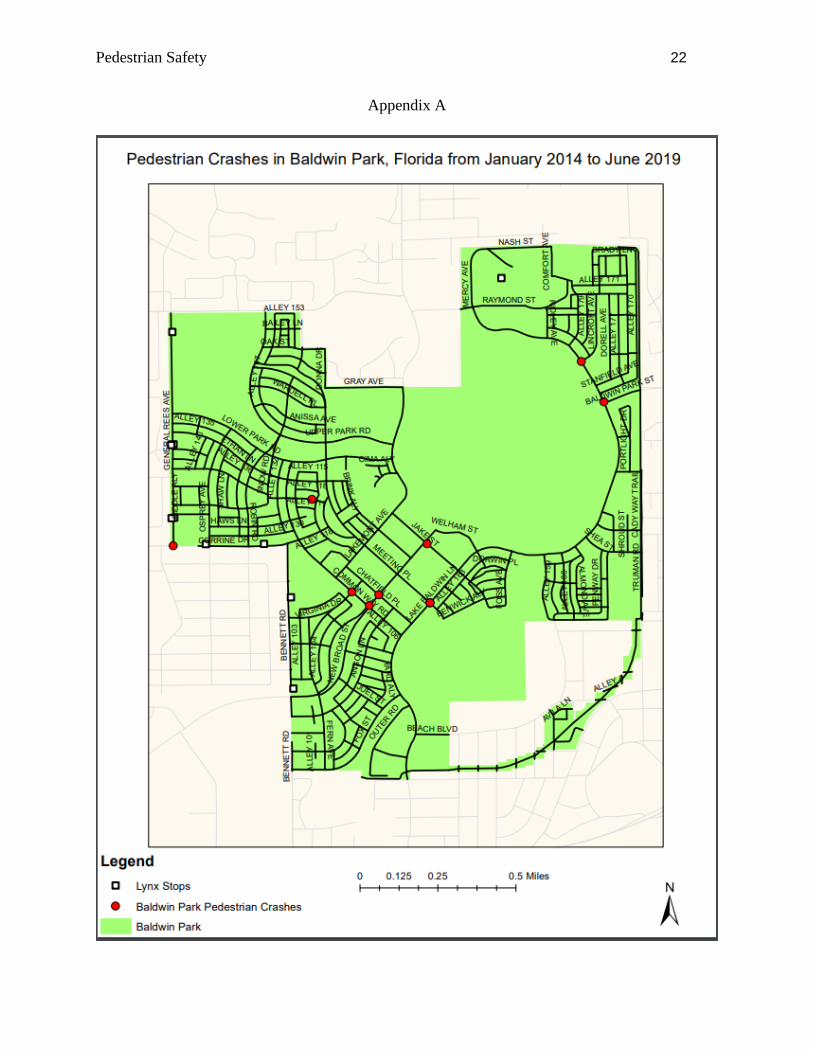
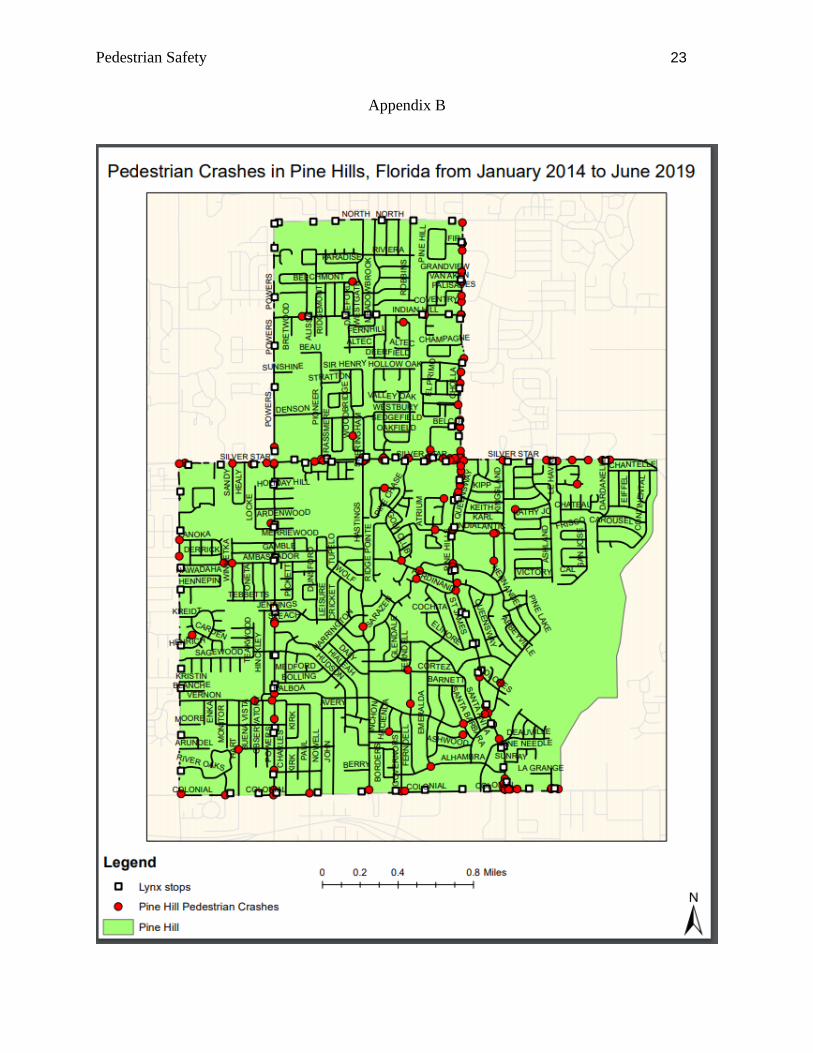
Overall, the GIS datasets created for this assessment had some conclusive results when
comparing pedestrian crash data in two different socioeconomic neighborhoods. As displayed in
the figure located in Appendix A, between January of 2014 to June of 2019, there were a total of
nine pedestrian crashes that occurred in Baldwin Park. In addition, there are a total of 10 Lynx
Bus stops located in Baldwin Park. In comparison, as displayed in Appendix B, between January
Pedestrian Safety 11
2014 to June 2019 there were 155 pedestrian crashes in Pine Hills and there is a total of 99 Lynx
bus stops.
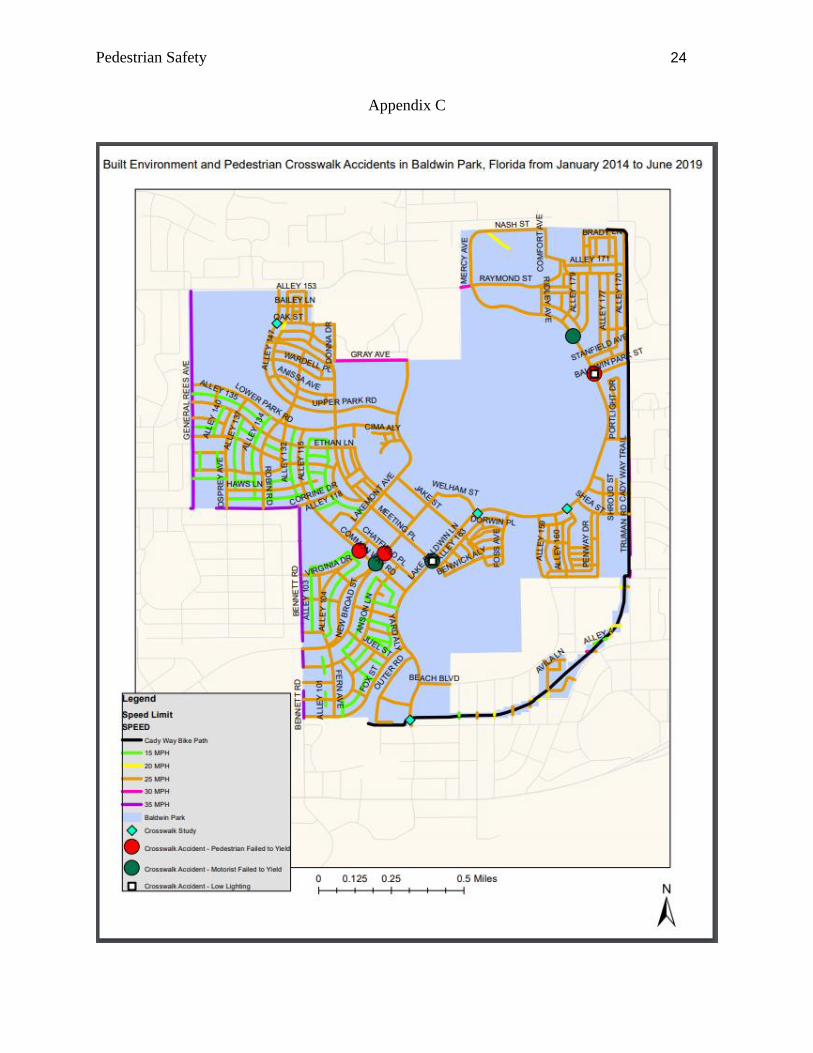
The GIS datasets for the built environment were created to analyze several factors of the
built environment: speed limits, lighting and crosswalks. As displayed in the dataset located in
Appendix C, most of the roads located in Baldwin Park have a speed limit of 25 miles per hour.
Of the nine pedestrian crashes that occurred between January 2014 and June 2019, six occurred
when a pedestrian was struck in a crosswalk; of these six pedestrian accidents in a crosswalk,
two of them occurred due to low lighting conditions. Similarly, of the six pedestrian accidents
that occurred in a crosswalk, three ere categorized as being the result of the motorist failing to
yield, while the other three were categorized as being the result of the pedestrian failing to yield.
Unfortunately, speed limits could not be compared between Baldwin Park and Pine Hills
due to data limitations. However, based on our literature research it appears that Pine Hills Road,
a focus of the Best Foot Forward Program field research discussed below, is classified as a
Minor Arterial with a speed limit of 40 mph. This speed limit is higher than the typical 25 mph
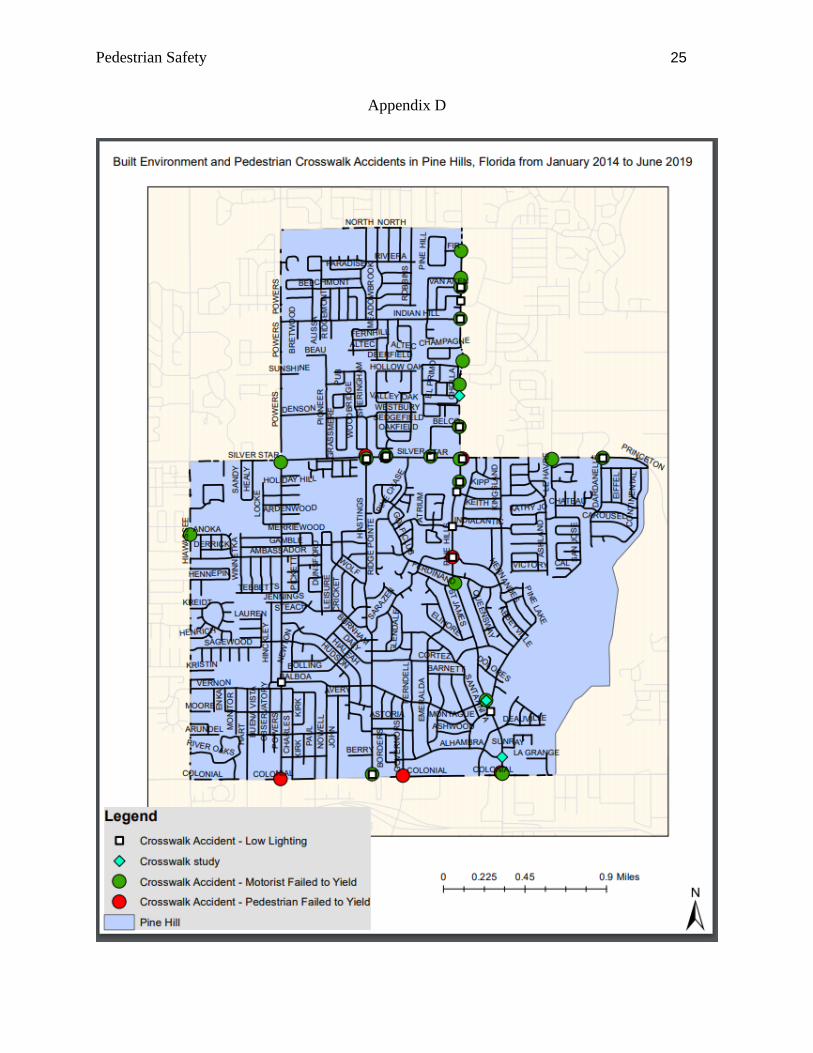
or lower posted speed limits in Baldwin Park. As displayed in Appendix D, of the 155 pedestrian
crashes that occurred in Pine Hills between January 2014 and June 2019, 28 occurred when a
pedestrian was struck in a crosswalk. Of these 28 pedestrian crosswalk accidents, 19 occurred
during low lighting conditions. Also, of the 28 pedestrian crosswalk accidents, 22 were
categorized as being the result of the motorist failing to yield, while the other six were
categorized as being a result of the pedestrian failure to yield.
Building from the data gathered regarding crashes in crosswalks due to motorists’ failure
to yield, this analysis looked at a yield study through the Best Foot Forward Program. It shows
yield averages between 2012 and 2019 for three crosswalks in Pine Hills and four crosswalks in
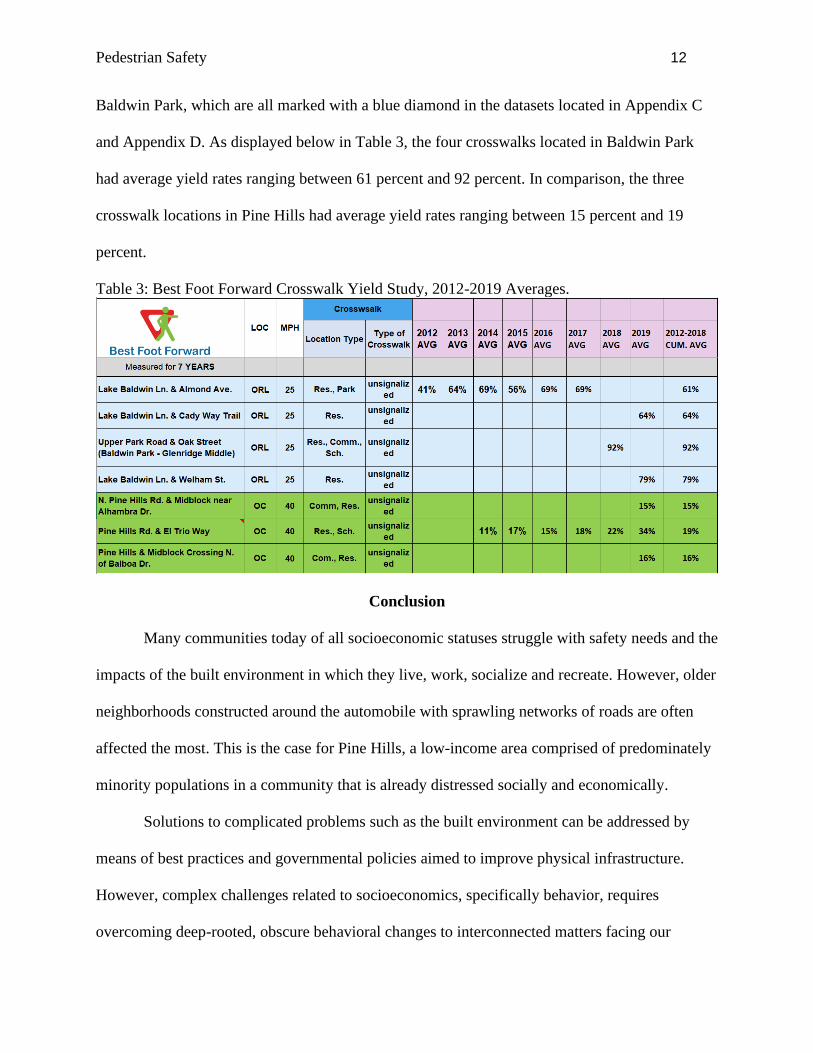
Pedestrian Safety 12
Baldwin Park, which are all marked with a blue diamond in the datasets located in Appendix C
and Appendix D. As displayed below in Table 3, the four crosswalks located in Baldwin Park
had average yield rates ranging between 61 percent and 92 percent. In comparison, the three
crosswalk locations in Pine Hills had average yield rates ranging between 15 percent and 19
percent.
Table 3: Best Foot Forward Crosswalk Yield Study, 2012-2019 Averages.
Conclusion
Many communities today of all socioeconomic statuses struggle with safety needs and the
impacts of the built environment in which they live, work, socialize and recreate. However, older
neighborhoods constructed around the automobile with sprawling networks of roads are often
affected the most. This is the case for Pine Hills, a low-income area comprised of predominately
minority populations in a community that is already distressed socially and economically.
Solutions to complicated problems such as the built environment can be addressed by
means of best practices and governmental policies aimed to improve physical infrastructure.
However, complex challenges related to socioeconomics, specifically behavior, requires
overcoming deep-rooted, obscure behavioral changes to interconnected matters facing our
Pedestrian Safety 13
communities. For example, bad driver conduct (poor yield rates) and pedestrian behavior (failure
to cross at properly designated intersections) are complex issues; regulating a person’s actions is
intangible and likely only possible by mitigating conduct through education and enforcement.
The data herein suggests that the economically disadvantaged, older neighborhood of
Pine Hills postures a higher risk for pedestrian crashes, while the newer, more well-off Baldwin
Park neighborhood emerges safer. Baldwin Park, for comparison, boasts higher median
household incomes, has more people commuting by single-occupancy automobile trips, and
appears to experience a reduced incidence of pedestrian crashes. This could be due to a number
of reasons, including greater access to reliable transportation, meaning residents need not rely on
public transportation or walking to work. This reduces their exposure associated with hazardous
active transportation options persistent throughout the region as proven by Central Florida’s top
ranking for pedestrian deaths. Little currently needs to be done to address walkability, bicycling
and overall mobility within the community with the exception that designated bike lanes are in
the door zone of the on-street parking. Otherwise, Baldwin Park is a sustainable and thriving
community. Pine Hills, on the other hand, has large numbers of people walking to work and
using public transit out of necessity, therefore, increasing their exposure to hazardous conditions.
In order to address the socioeconomic differences and safety of Pine Hills and other
disadvantaged communities in the region, administrative bodies need to provide progressive,
valued policies and adequate funding in order encourage suitable transportation and provide
guidelines for tenable, safe environments for its citizens to thrive, not just get by. Just as urban
sprawl has had undesirable effects on the built environment and existing social systems,
unequitable transportation networks can have equally negative affects; however, providing a
Pedestrian Safety 14
more equitable and sustainable environment can help to invigorate declining social capital and
stimulate the economies of diminished neighborhoods.
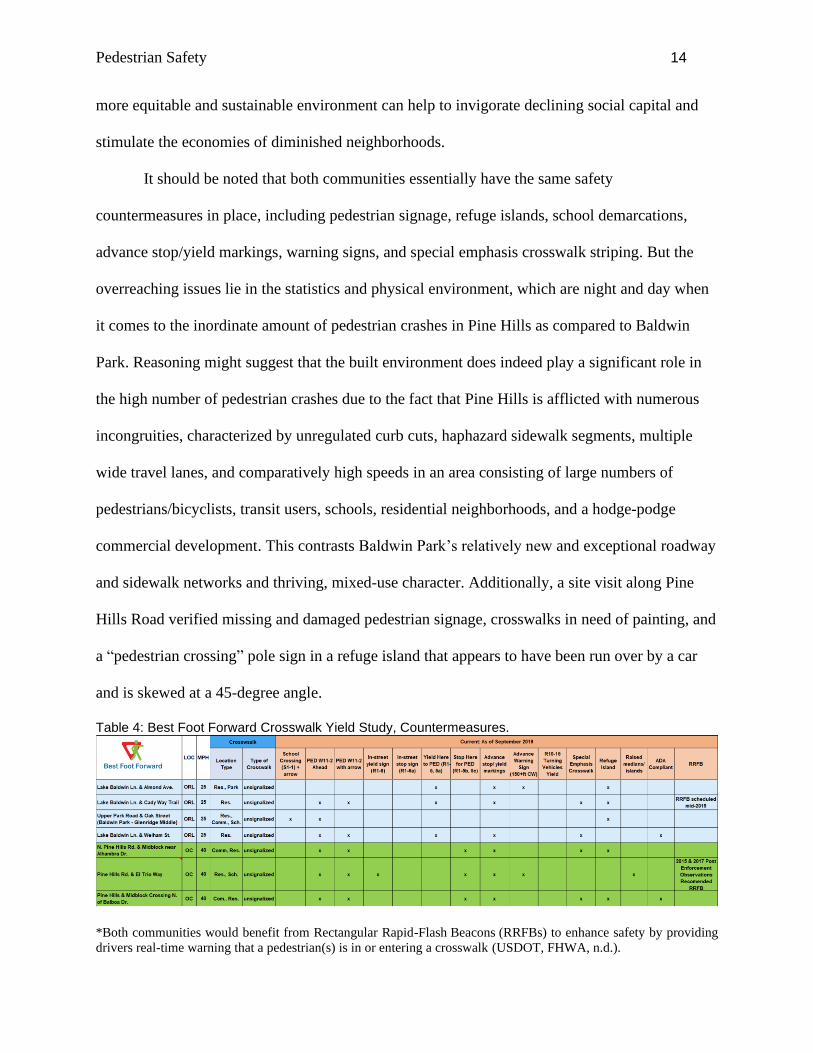
It should be noted that both communities essentially have the same safety
countermeasures in place, including pedestrian signage, refuge islands, school demarcations,
advance stop/yield markings, warning signs, and special emphasis crosswalk striping. But the
overreaching issues lie in the statistics and physical environment, which are night and day when
it comes to the inordinate amount of pedestrian crashes in Pine Hills as compared to Baldwin
Park. Reasoning might suggest that the built environment does indeed play a significant role in
the high number of pedestrian crashes due to the fact that Pine Hills is afflicted with numerous
incongruities, characterized by unregulated curb cuts, haphazard sidewalk segments, multiple
wide travel lanes, and comparatively high speeds in an area consisting of large numbers of
pedestrians/bicyclists, transit users, schools, residential neighborhoods, and a hodge-podge
commercial development. This contrasts Baldwin Park’s relatively new and exceptional roadway
and sidewalk networks and thriving, mixed-use character. Additionally, a site visit along Pine
Hills Road verified missing and damaged pedestrian signage, crosswalks in need of painting, and
a “pedestrian crossing” pole sign in a refuge island that appears to have been run over by a car
and is skewed at a 45-degree angle.
Table 4: Best Foot Forward Crosswalk Yield Study, Countermeasures.
*Both communities would benefit from Rectangular Rapid-Flash Beacons (RRFBs) to enhance safety by providing
drivers real-time warning that a pedestrian(s) is in or entering a crosswalk (USDOT, FHWA, n.d.).
Pedestrian Safety 15
Nevertheless, a counterargument could be made that pedestrian behavior may also play a
significant role in the statistics. For example, Orange County conducted a pedestrian and bicycle
study in 2017 with the goal to “Identify opportunities for implementing safety improvements for
people walking, bicycling, driving or taking the bus” (Orange County, FL, n.d.) along the Pine
Hills Road corridor. As part of the study, a survey was conducted with the following results: 38
percent always cross at intersection or crosswalk; 12 percent always do not cross at intersection
or crosswalk; 50 percent often do not cross at intersections or crosswalk; and 42 percent cross all
lanes at gaps/breaks in traffic. This information is intriguing and of concern, however, the results
of this study demonstrate that they are not the primary contributing factor in the frequency of
crashes, especially when compared to the catalyzing information provided throughout this report.
Future Directions
Present-day transportation planners, engineers and policy makers have many tools and
models to work from in order to modernize and improve our built environments and address the
needs of declining roadways due to the significant role our transportation infrastructure plays in
the frequency of pedestrian crashes. For the community of Pine Hills to rebound, actionable steps
need to be taken to improve mobility, connectivity, economic development, social capital and to
provide safe accessibility throughout the corridor.
One of the most widely accepted methods being applied today is the use of Complete
Streets guidelines that promote well-designed, all-inclusive infrastructure that enhances user
access and overall well-being by utilizing design methods that require streets and neighborhoods
to be planned, designed, operated and maintained to enable safe, convenient, comfortable and
energy efficient travel and access: pedestrians, bicyclists, motorists, transit riders, emergency
services, freight handlers and future modes that will evolve along with Smart Cities technology.
Pedestrian Safety 16
This will allow our built environment to be more appealing and beneficial for existing and future
end users.
Efforts to enhance mobility needs are being addressed by Bike/Walk Central Florida
(BWCF), a 501(c)(3) organization, through public outreach and support in Orange, Osceola and
Seminole Counties by educating the public and professionals at community and public
engagements in order to promote walkable and bikeable communities while raising public
awareness. The organization advocates for safe, active transportation and recreation by educating
walkers, cyclists, motorists and transit riders about Florida’s road laws, their rights,
responsibilities and civil behaviors; supporting transportation corridor planning and design using
Complete Streets principles; and promoting a built environment that supports physical,
environmental and economic health, safe transportation choices, and encourages interaction
among citizens of all ages, incomes and abilities. BWCF was “born out of a belief that few
people get into their cars, ride their bikes, or walk across the street with the intention of colliding
(BWCF, n.d.).”
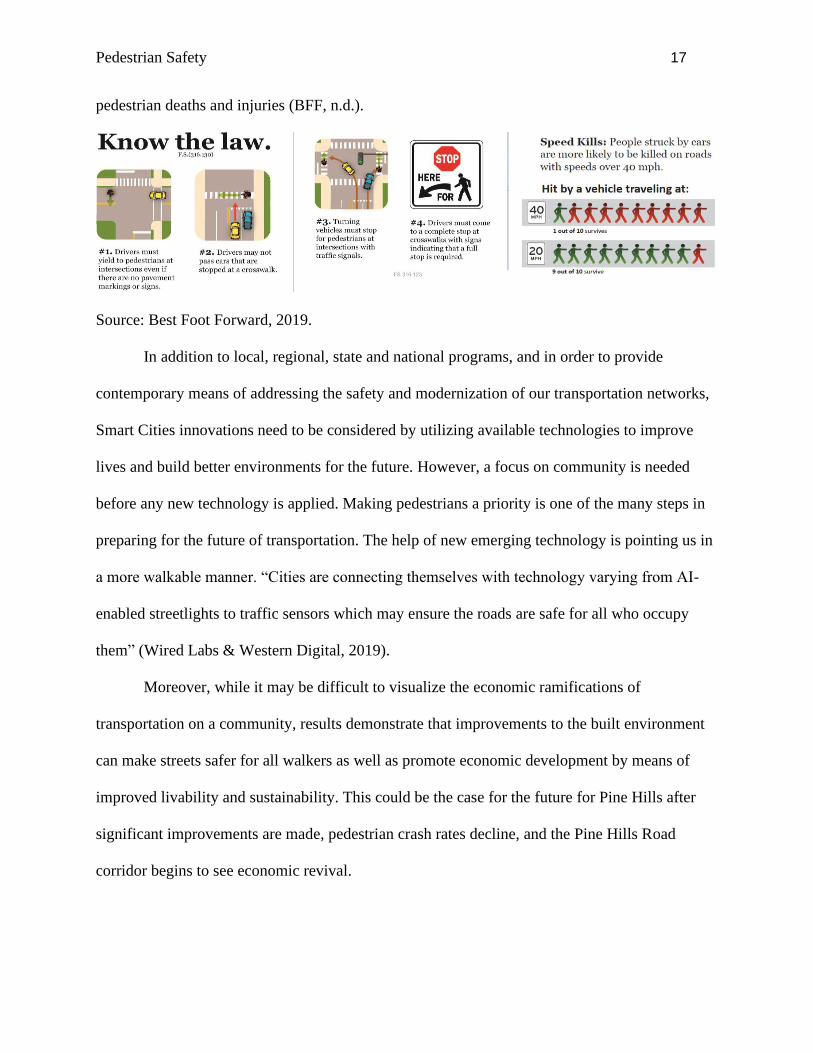
Subsequently, the Best Foot Forward (BFF) for pedestrian safety program was conceived
by and is administered through BWCF. BFF uses a Triple-E approach of education, engineering
and enforcement to improve driver yield rates at crosswalks as governed by Florida Law (Section
316.123 of Florida Statutes). BFF also conducts crosswalk observation and data collection to
promote initiatives intended to reduce pedestrian deaths and injuries, including the communities
of Pine Hills and Baldwin Park, by getting drivers to yield to pedestrians in crosswalks while
motivating pedestrians to be more careful crossing the street. Success is measured by the
percentage of drivers yielding to pedestrians in marked crosswalks with the goal of reducing
Pedestrian Safety 17
pedestrian deaths and injuries (BFF, n.d.).
Source: Best Foot Forward, 2019.
In addition to local, regional, state and national programs, and in order to provide
contemporary means of addressing the safety and modernization of our transportation networks,
Smart Cities innovations need to be considered by utilizing available technologies to improve
lives and build better environments for the future. However, a focus on community is needed
before any new technology is applied. Making pedestrians a priority is one of the many steps in
preparing for the future of transportation. The help of new emerging technology is pointing us in
a more walkable manner. “Cities are connecting themselves with technology varying from AI-
enabled streetlights to traffic sensors which may ensure the roads are safe for all who occupy
them” (Wired Labs & Western Digital, 2019).
Moreover, while it may be difficult to visualize the economic ramifications of
transportation on a community, results demonstrate that improvements to the built environment
can make streets safer for all walkers as well as promote economic development by means of
improved livability and sustainability. This could be the case for the future for Pine Hills after
significant improvements are made, pedestrian crash rates decline, and the Pine Hills Road
corridor begins to see economic revival.
Pedestrian Safety 18
References
Best Foot Forward. (n.d.). Retrieved from http://www.iyield4peds.org/
Bike/Walk Central Florida. (n.d.). Retrieved from https://bikewalkcentralflorida.org/
Chakravarthy, B., Anderson, C.L., Ludlow, J., Lotfipour, S., & Vaca, F.E. (2010) The
Relationship of Pedestrian Injuries to Socioeconomic Characteristics in a Large Southern
California County. Traffic Injury Prevention, 11(5), 508-513.
https://doi.org/10.1080/15389588.2010.497546
Chimba, D., Musinguzi, A., & Kidando, E. (2018). Associating pedestrian crashes with
demographic and socioeconomic factors. Case Studies on Transport Policy, 6(1), 11-16.
https://doi.org/10.1016/j.cstp.2018.01.006
Ciddiqui, C., Abdel-Aty, M., & Choi, K. (2012). Implications of Pedestrian Safety Planning
Factors in Areas with Minority and Low-Income Populations. International Journal of
Sustainable Transportation, 8(5), 360-381.
https://doi.org/10.1080/15568318.2012.702853
City of Orlando. (n.d.). Baldwin Park/NTC Main Base: A Brief History. City of Orlando.
Retrieved from: http://www.cityoforlando.net/city-planning/wp-
content/uploads/sites/27/2014/05/BaldwinPark-History.pdf
Dangerous By Design 2019. (2019). Retrieved from https://smartgrowthamerica.org/dangerous-
by-design/
Dai, D. (2012). Identifying clusters and risk factors of injuries in pedestrian–vehicle crashes in a
GIS environment. Journal of Transport Geography, 24, 206-214.
https://doi.org/10.1016/j.jtrangeo.2012.02.005
Pedestrian Safety 19
Florida Highway Safety and Motor Vehicles: Florida Crash Dashboard. (2019). Retrieved from
https://www.flhsmv.gov/traffic-crash-reports/crash-dashboard/
Garder, P.E. (2004). The impact of speed and other variables on pedestrian safety in Maine.
Accident Analysis & Prevention, 36(4), 533-542. https://doi.org/10.1016/S0001-
4575(03)00059-9
Gibbs, K., Slater, S.J., Nicholson, N., Barker, D.C., & Chaloupka, F.J. (2012). Income
Disparities in Street Features that Encourage Walking. Bridging the Gap Program, Health
Policy Center, Institute for Health Research and Policy, University. Of Illinois at
Chicago. Retrieved from
http://www.bridgingthegapresearch.org/_asset/02fpi3/btg_street_walkability_FINAL_03-
09-12.pdf
Gundluru, Bhaskara. (n.d.). Smart Solutions for Pedestrians in Smart Cities. Retrieved from
https://www.cdmsmith.com/en-ME/Client-Solutions/Insights/Smart-Solutions-for-
Pedestrians-in-Smart-Cities
How Cities Are Using Smart Technology to Help Keep Pedestrians Safe. (2019, March 11).
Retrieved from https://datamakespossible.westerndigital.com/smart-cities-technology-
pedestrian-safety/
Pine Hills Neighborhood Improvement District. (2015). 2015-2045 Pine Hills Neighborhood
Improvement Plan. Orange County Government. Retrieved from:
https://www.orangecountyfl.net/Portals/0/Library/Neighbors-
Housing/docs/PH_Neighborhood%20Improvement%20Plan.pdf
Pedestrian Safety 20
Redding, R.A., Ferguson, S.A., & McCartt, A.T. (2003). A Review of Evidence-Based Traffic
Engineering Measures Designed to Reduce Pedestrian–Motor Vehicle Crashes. American
Journal of Public Health, 93(9), 1456-1463. https://doi.org/10.2105/AJPH.93.9.1456
Siddiqui, N., Chu, X., & Guttenplan, M. (2006). Crossing Locations, Light Conditions, and
Pedestrian Injury Severity. Transportation Research Record: Journal of the
Transportation Research Board, 1982. 141-149.
https://doi.org/10.1177/0361198106198200118
The 2019 Florida Statutes. (n.d.). Retrieved from
http://www.leg.state.fl.us/Statutes/index.cfm?App_mode=Display_Statute&URL=0300-
0399/0316/Sections/0316.123.html
Traffic Safety Facts. (2019). Retrieved from
https://crashstats.nhtsa.dot.gov/Api/Public/ViewPublication/812681
Traffic and Transportation, Orange, Co., FL. (n.d.). Pine Hills Road Pedestrian/Bicycle Safety
Study. Retrieved from https://www.orangecountyfl.net/
U. S. Census Bureau. (2017). American Factfinder. U.S. Census Bureau. Retrieved from:
https://factfinder.census.gov/faces/nav/jsf/pages/index.xhtml
U.S. Department of Agriculture. (2015). Food Access Research Atlas. United States Department
of Agriculture: Economic Research Service. Retrieved from:
https://www.ers.usda.gov/data-products/food-access-research-atlas/go-to-the-atlas/
U.S. Department of Transportation, Federal Highway Administration. (n.d.). Rectangular Rapid
Flash Beacons (RRFB). Retrieved from
https://safety.fhwa.dot.gov/intersection/conventional/unsignalized/tech_sum/fhwasa0900
9/
Pedestrian Safety 21
Zaccaro, H., Chafetz, J., & Schonfeld, S. (2019). 2019 Dangerous by Design. Smart Growth
America and National Complete Streets Coalition. Retrieved from
https://smartgrowthamerica.org/app/uploads/2019/01/Dangerous-by-Design-2019-
FINAL.pdf
Zhou, H., & Hsu, P. (2009). Effects of Roadway Lighting Level on the Pedestrian Safety. Ninth
International Conference of Chinese Transportation Professionals (ICCTP).
https://doi.org/10.1061/41064(358)4
Pedestrian Safety 22
Appendix A
Pedestrian Safety 23
Appendix B
Pedestrian Safety 24
Appendix C
Pedestrian Safety 25
Appendix D
Related Documents