WELCOME TO PRESENTATION

Welcome message from author
This document is posted to help you gain knowledge. Please leave a comment to let me know what you think about it! Share it to your friends and learn new things together.
Transcript

WELCOME TO
PRESENTATION

SOCIO-ECONOMIC
CONDITION OF RICKSHAW
PULLERS
IN DHAKA CITY

Data level Nominal
Level
Ordinal
Level
Interval
LevelRatio Level
Number
1 Name Satisfaction with
income
Age Child Number
2 Address Family
3 Problems Related
To Job
Daily Income
4 Sources of
Entertainment
Working Hour
5 Devices used For
Entertainment
Rickshaw Rent

Variable Type Qualitative
Variable
Quantitative
VariableNumber1 NAME CHILD NUMBER
2 ADDRESS FAMILY MEMBER
3 PROBLEMS RELATED
TO JOB
DAILY INCOME
4 SOURCES OF
ENTERTAINMENT
WORKING HOUR
5 DEVICES USED FOR
ENTERTAINMENT
RICKSHAW RENT
6 SATISFACTION WITH
INCOME
AGE
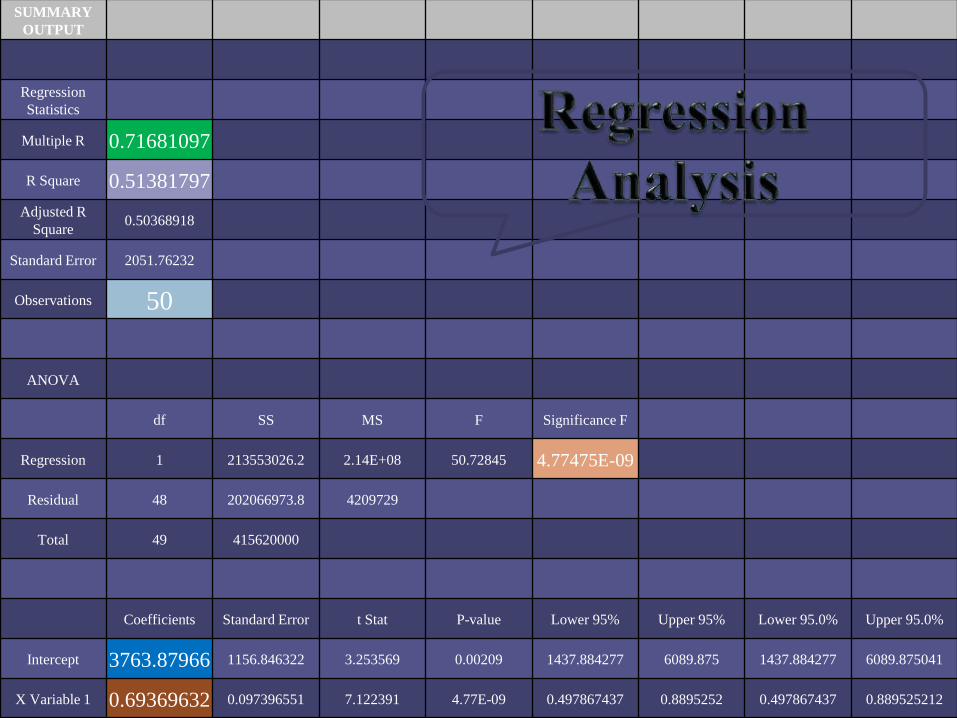
SUMMARY
OUTPUT
Regression
Statistics
Multiple R 0.71681097
R Square 0.51381797
Adjusted R
Square0.50368918
Standard Error 2051.76232
Observations 50
ANOVA
df SS MS F Significance F
Regression 1 213553026.2 2.14E+08 50.72845 4.77475E-09
Residual 48 202066973.8 4209729
Total 49 415620000
Coefficients Standard Error t Stat P-value Lower 95% Upper 95% Lower 95.0% Upper 95.0%
Intercept 3763.87966 1156.846322 3.253569 0.00209 1437.884277 6089.875 1437.884277 6089.875041
X Variable 1 0.69369632 0.097396551 7.122391 4.77E-09 0.497867437 0.8895252 0.497867437 0.889525212

Coefficient of Correlation
= r 0.71681097
Coefficient of
Determination
= r20.51381797
Observations 50

Significance F
4.77475E-09
Intercept = a 3763.87966
Slope = b 0.69369632


HISTOGRAM AND FREQUENCY
POLYGON

Cumulative frequency polygon

Frequency distribution on
the income of rickshaw pullers
400, 600, 600, 500, 400, 600, 800, 300, 200, 350, 400, 500, 450, 500,450, 500, 400, 500, 350, 500, 300, 400, 500, 400, 500, 500, 300, 500,300, 600, 450, 800, 600, 600, 600, 500, 600, 700, 500, 300, 500, 600,500, 400, 500, 400, 400, 500, 300, 600.

HISTOGRAM and Frequency
Polygon

Cumulative frequency polygon


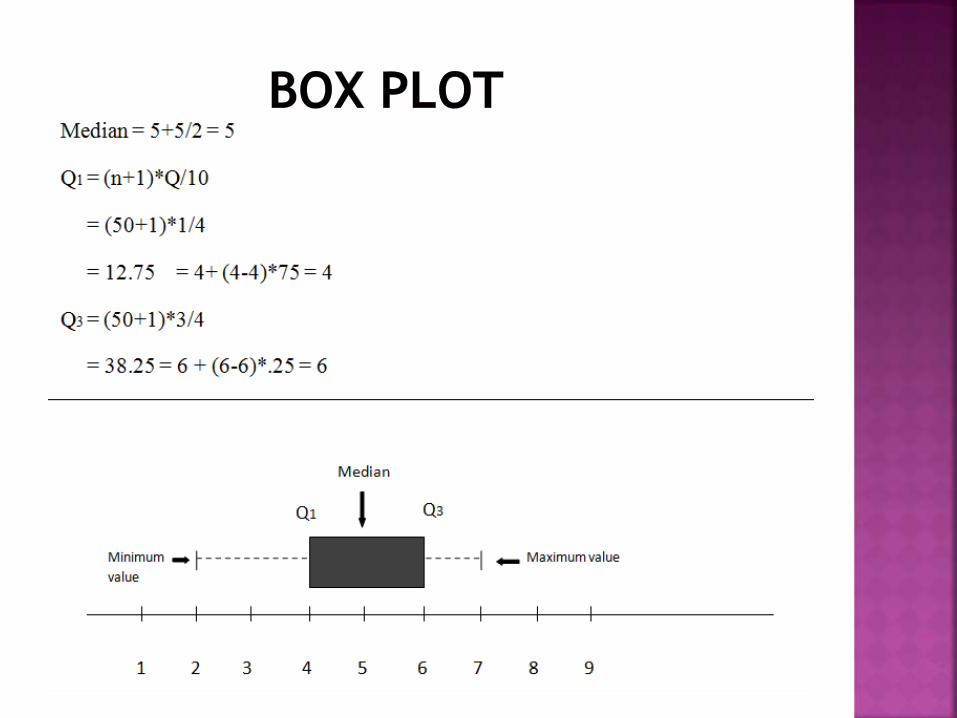
Minimum value
Q1 median
Q3Maximum
value

Thank
You
Thank You

Questions?
Related Documents