Social Media Dash boarding with Gary Angel and Scott K. Wilder

Social Media Dashboarding by Scott Wilder and semphonic
Jul 14, 2015
Welcome message from author
This document is posted to help you gain knowledge. Please leave a comment to let me know what you think about it! Share it to your friends and learn new things together.
Transcript
Social Media Dash boardingwith Gary Angel and
Scott K. Wilder

2
Gary Angel, President of SemphonicCo-Founder and President of Semphonic, the leading independent web analytics consultancy in the United States. Semphonic provides full-service web analytics consulting and advanced online measurement to digital media, financial services, health&pharma, B2B, technology, and the public sector. Gary blogs at http://semphonic.blogs.com/semangel
Introductions
Currently SVP/Social Media Architect at Edelman – Digital. Founded and managed Intuit’s Small Business Online Community and Social Programs and was the VP of Marketing and Product Development at Kbtoys / eToys, the founder and director of Borders.com, and held senior positions at Apple, AOL, and American Express. He received graduate degrees from New York University, The Johns Hopkins University and Georgetown University. Scott just jump started his blog @ www.wildervoices.com
Scott K. Wilder – SVP – Social Media Architect, Edelman Digital

3
Overview
This will be a good webinar if….You come away with a sense of how to integrate social media metrics into
dashboards

4
We will email you and post a copy of this
presentation
5
Why it Matters
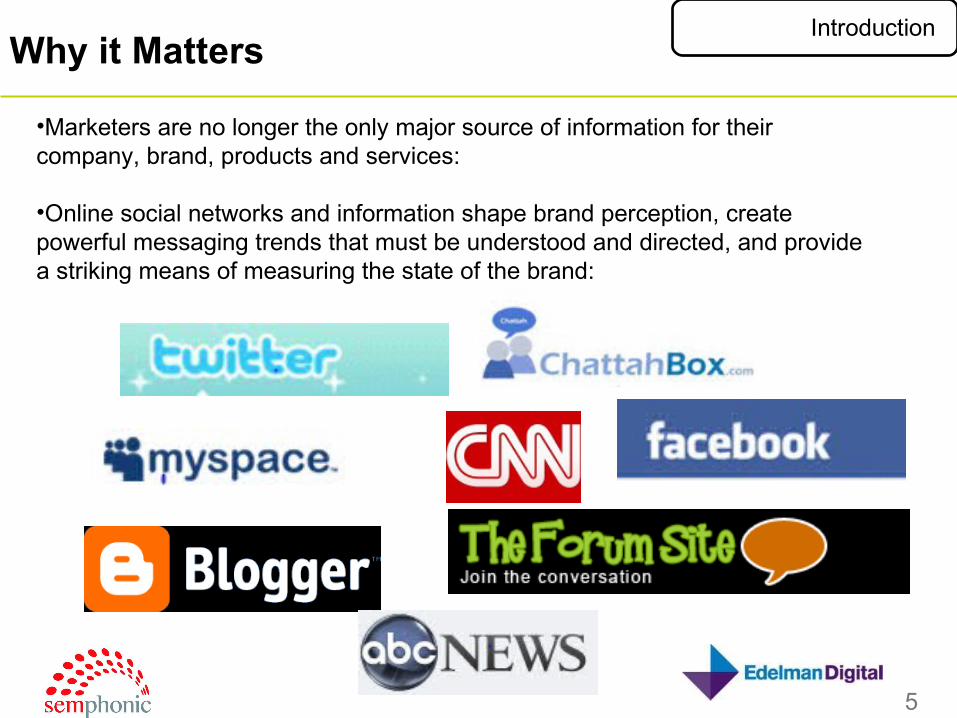
•Marketers are no longer the only major source of information for their company, brand, products and services:
•Online social networks and information shape brand perception, create powerful messaging trends that must be understood and directed, and provide a striking means of measuring the state of the brand:
Introduction

6
Why it matters

7
Social Media Tools
8
Social Media Tools
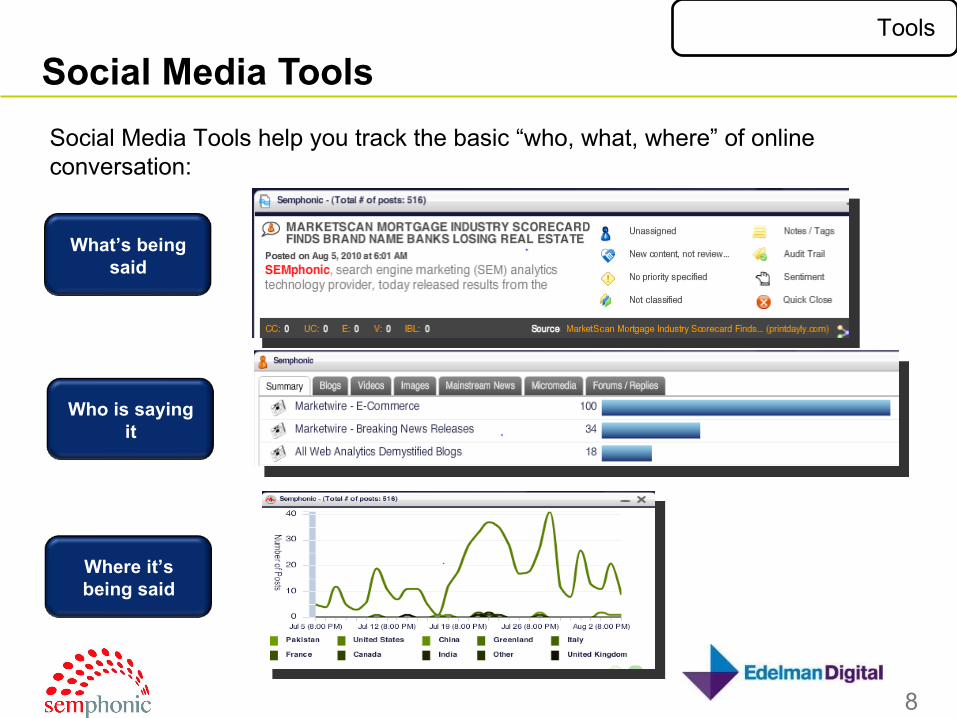
Social Media Tools help you track the basic “who, what, where” of online conversation:
What’s being said
Who is saying it
Where it’s being said
Tools

9
Social Media Tools
The basic data these programs primarily deliver (and process) unformatted text – appropriately named a “river of news”:
However Social Media data is
generated
Social Media Tools assume that someone –
some human – is reading and reacting
Tools

10
Repurposing Tools for Measurement
Measurement and Monitoring are fundamentally different functions, But with creativity and tool development a new paradigm of Social Media reporting is here
Tools

11
Challenges
Social Media Reporting with the current generation of Social Media Monitoring tools present several challenges:
Tools
12
The Three C’s of Social MediaThree C’s
Getting the Data Right Where you Want it
13
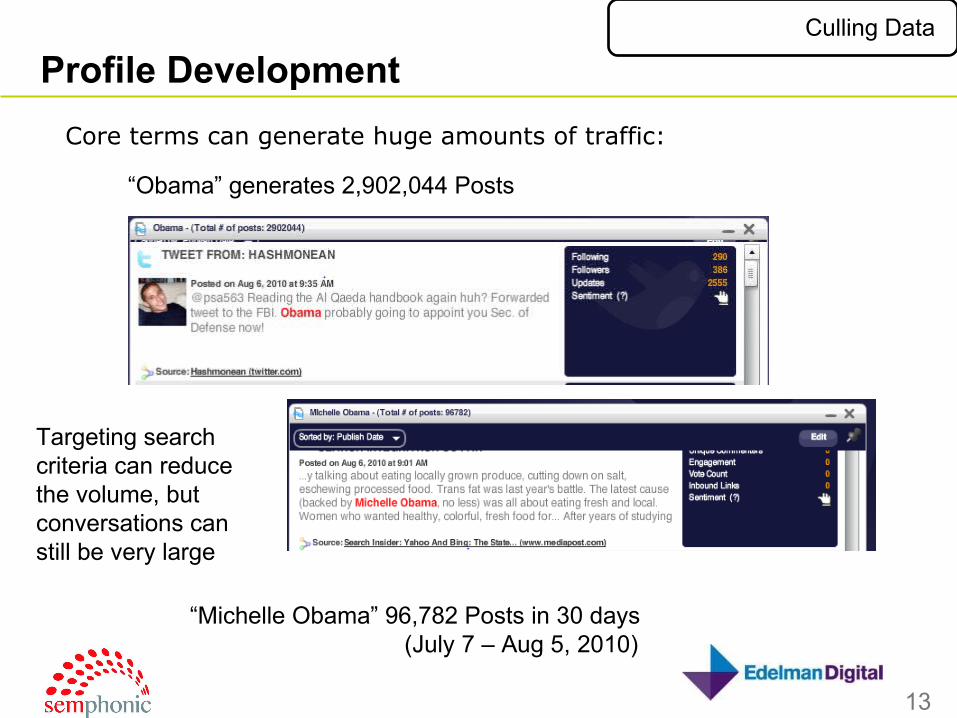
Profile Development
Core terms can generate huge amounts of traffic:
Culling Data
“Michelle Obama” 96,782 Posts in 30 days (July 7 – Aug 5, 2010)
“Obama” generates 2,902,044 Posts
Targeting search criteria can reduce the volume, but conversations can still be very large
14
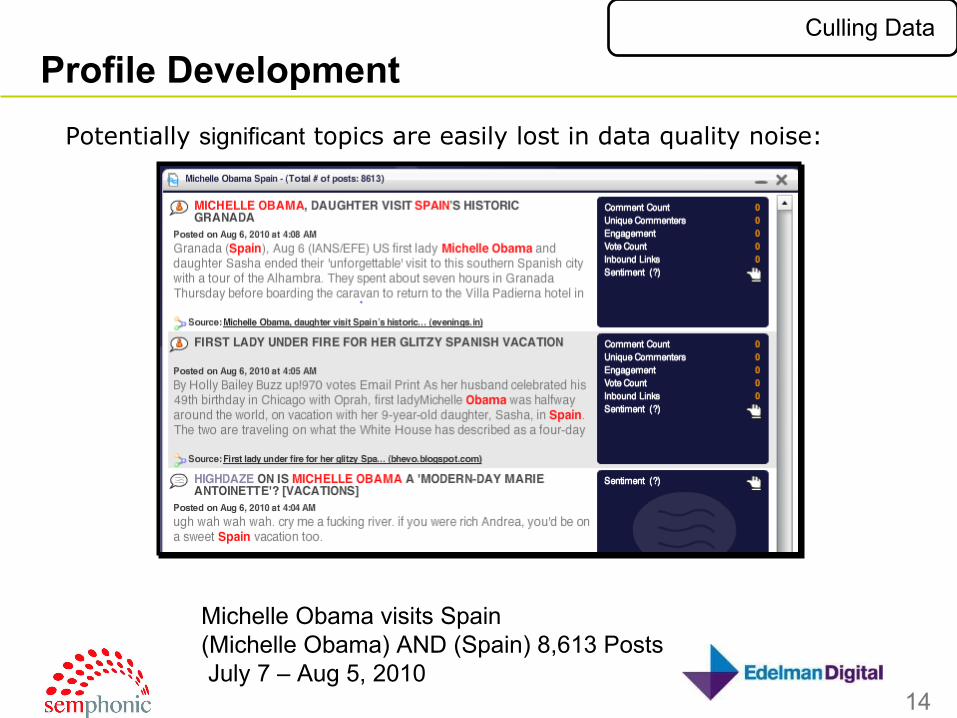
Profile Development
Potentially significant topics are easily lost in data quality noise:
Culling Data
Michelle Obama visits Spain(Michelle Obama) AND (Spain) 8,613 Posts July 7 – Aug 5, 2010
15
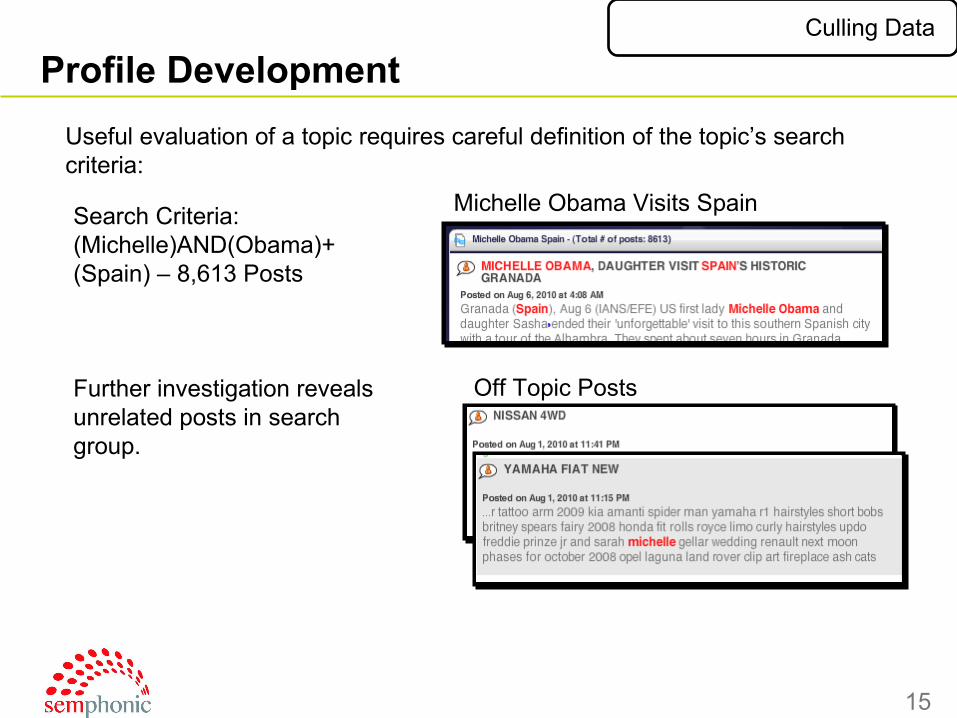
Profile Development
Useful evaluation of a topic requires careful definition of the topic’s search criteria:
Search Criteria:(Michelle)AND(Obama)+ (Spain) – 8,613 Posts
Further investigation reveals unrelated posts in search group.
Off Topic Posts
Culling Data
Michelle Obama Visits Spain

16
Culling Data
Search Criteria require ongoing adjustment to identify key new topics of conversation and clean out off topic posts
Key Takeaway

17
Classification
How do we Populate the Framework?
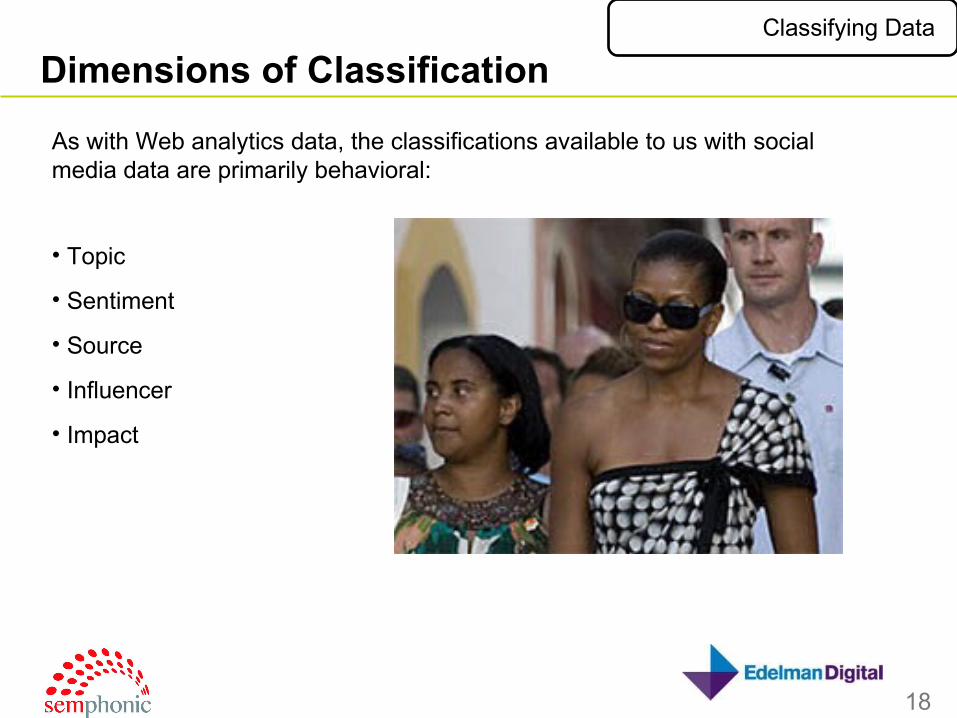
18
As with Web analytics data, the classifications available to us with social media data are primarily behavioral:
• Topic
• Sentiment
• Source
• Influencer
• Impact
Classifying Data
Dimensions of Classification

19
Classifying Data
Basic Metrics by Class
20
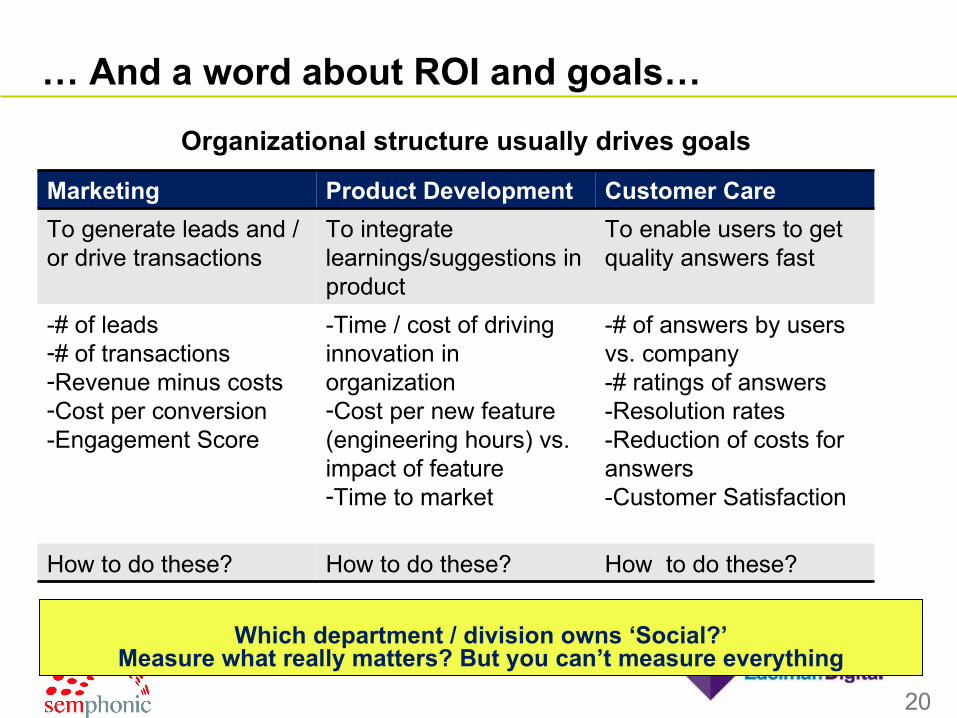
Organizational structure usually drives goals
Marketing Product Development Customer Care
To generate leads and / or drive transactions
To integrate learnings/suggestions in product
To enable users to get quality answers fast
-# of leads-# of transactions-Revenue minus costs-Cost per conversion-Engagement Score
-Time / cost of driving innovation in organization-Cost per new feature (engineering hours) vs. impact of feature-Time to market
-# of answers by users vs. company-# ratings of answers-Resolution rates-Reduction of costs for answers-Customer Satisfaction
How to do these? How to do these? How to do these?
Which department / division owns ‘Social?’Measure what really matters? But you can’t measure everything
… And a word about ROI and goals…
21
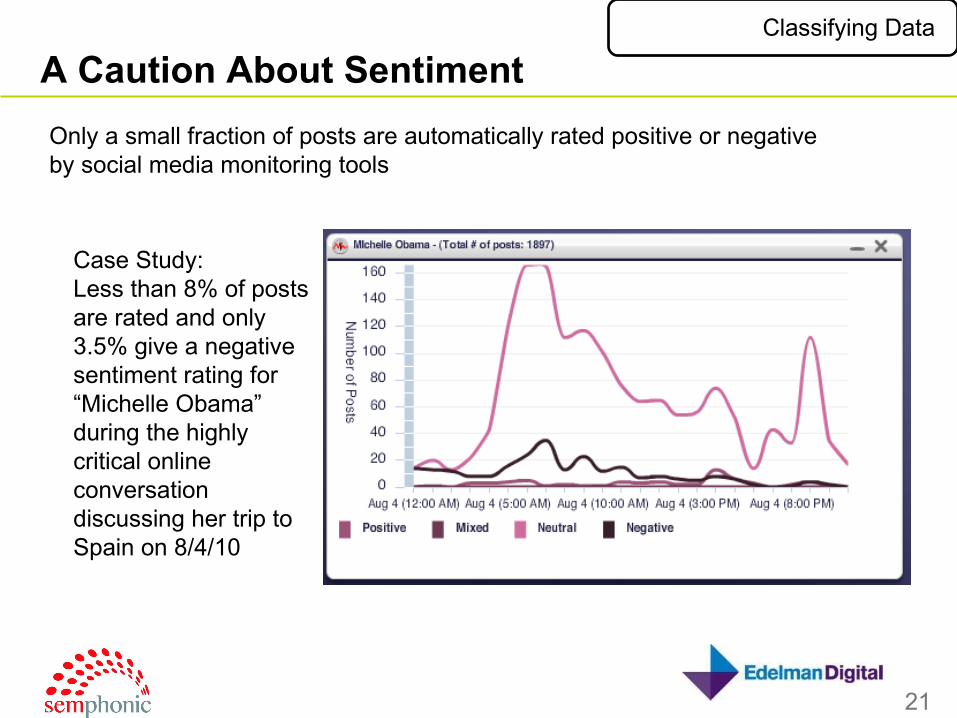
Only a small fraction of posts are automatically rated positive or negative by social media monitoring tools
Case Study:Less than 8% of posts are rated and only 3.5% give a negative sentiment rating for “Michelle Obama” during the highly critical online conversation discussing her trip to Spain on 8/4/10
Classifying Data
A Caution About Sentiment

22
While the accuracy of sentiment rating is reported by tool vendors as 60% accurate, in practice we frequently observe error rates greater than 50%
Positive Rated Post
Classifying Data
Of Those, Many are Wrong

23
Classifying Data
Key Takeaway
The primary dimensions of social media measurement are behavioral: topic, sentiment, source, influencer, impact.
Use of automated sentiment is not recommended at this time

24
WHAT DOES IT ALL MEAN?

25
Can you quantify the ROI of social media?*
Social Media presence is a reaction to an entire brand interacting with the world. Using Social Media metrics as a component of measuring the health of your Social Capital offers a more useful framework for reporting
Context
Social Media Framework
*Adobe Omniture Newsletter
26
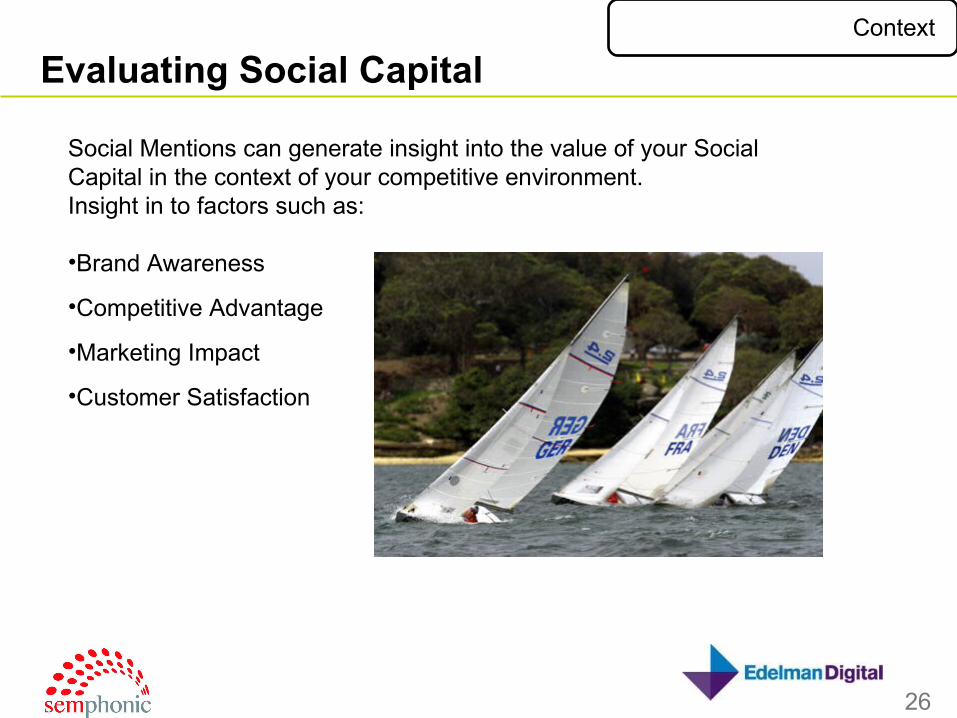
Social Mentions can generate insight into the value of your Social Capital in the context of your competitive environment.Insight in to factors such as:
•Brand Awareness
•Competitive Advantage
•Marketing Impact
•Customer Satisfaction
Context
Evaluating Social Capital

27
To Create a context around social media data, it is useful to relate the classifications and metrics to meaningful business issues/initiatives:
Context
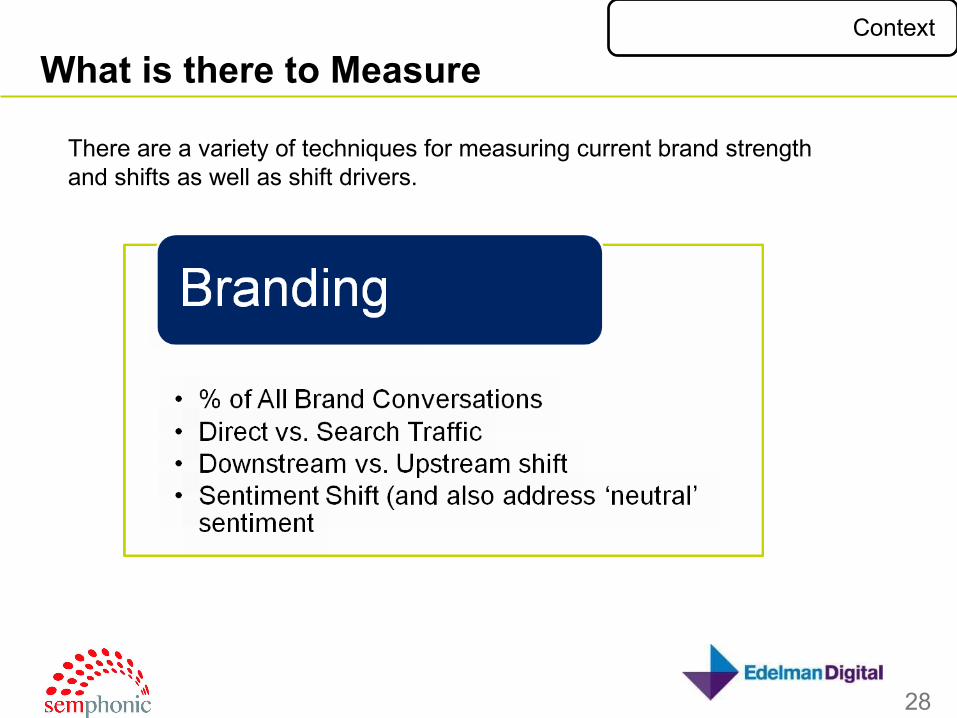
What is there to Measure
28
There are a variety of techniques for measuring current brand strength and shifts as well as shift drivers.
Context
What is there to Measure

29
Numbers and Trends vs. Competitors by brand and topic provide powerful context:
Context
What is there to Measure

30
Tracking the social arc of your marketing and content efforts opens up better knowledge about “early-stage” and branding campaigns:
Context
What is there to Measure
31
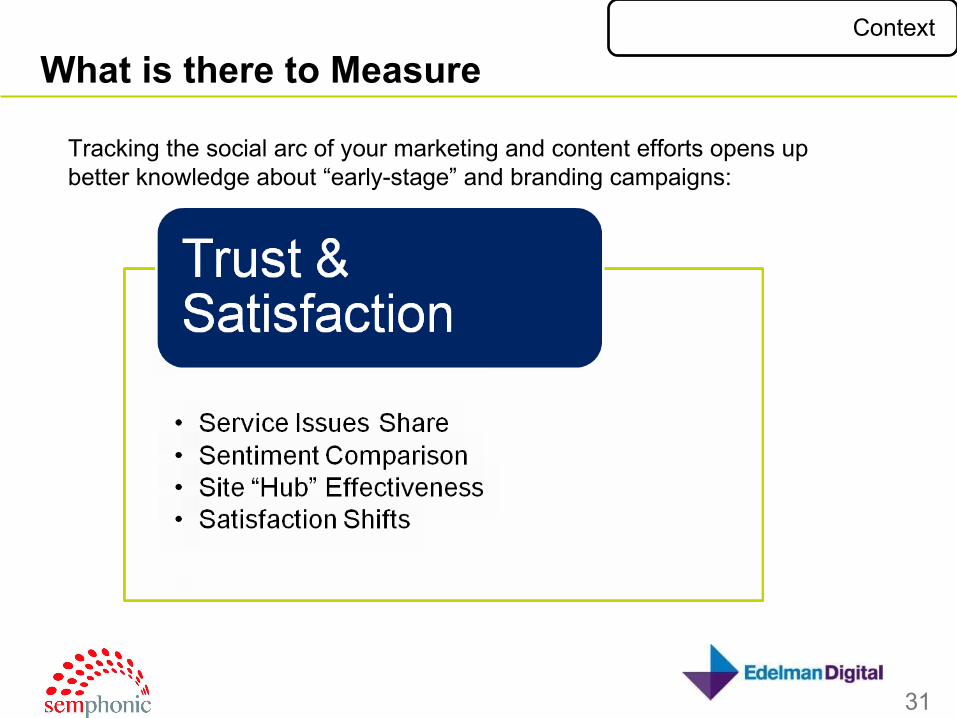
Tracking the social arc of your marketing and content efforts opens up better knowledge about “early-stage” and branding campaigns:
Context
What is there to Measure

32
SHOW AND TELL(WHEN IT COMES TO METRICS, SOMETIMES YOU DO HAVE TO YELL)
33
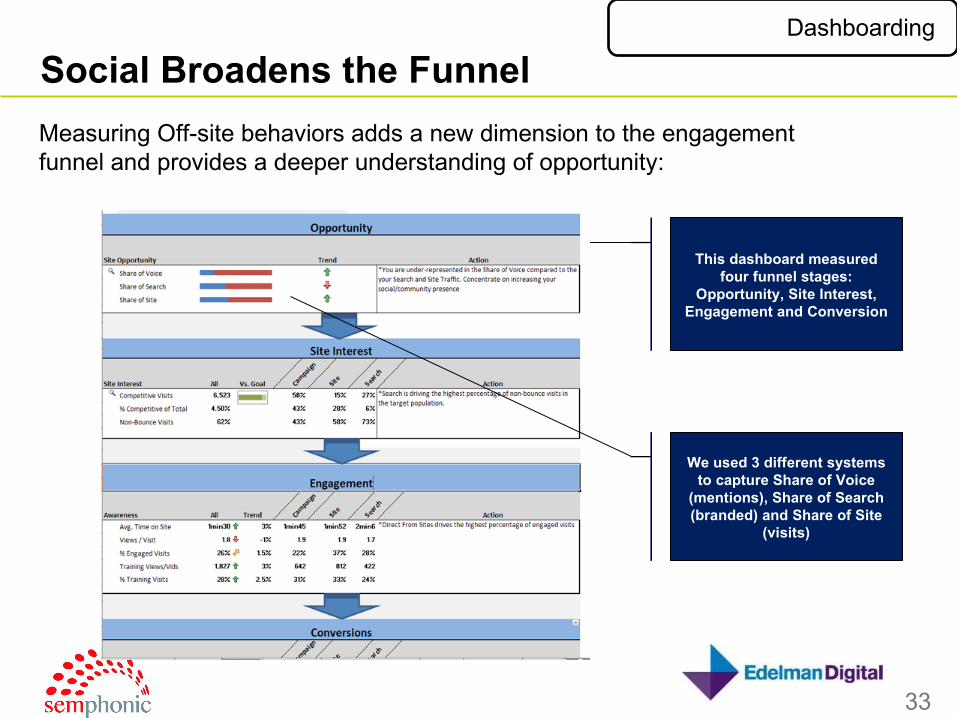
Measuring Off-site behaviors adds a new dimension to the engagement funnel and provides a deeper understanding of opportunity:
Dashboarding
Social Broadens the Funnel
This dashboard measured four funnel stages:
Opportunity, Site Interest, Engagement and Conversion
We used 3 different systems to capture Share of Voice
(mentions), Share of Search (branded) and Share of Site
(visits)

34
One huge plus to social reporting is that it allows for direct comparison with competitors:
Dashboarding
Competition as Context
Share of Brand Mentions
Remote
Linux
X.11
Lock Manage
software
Enterprise
Mask
Secure
IBM
Performance
choose
firewall
Remote
energy
scale
Topic Mentions Distribution
Brand Characteristics
35
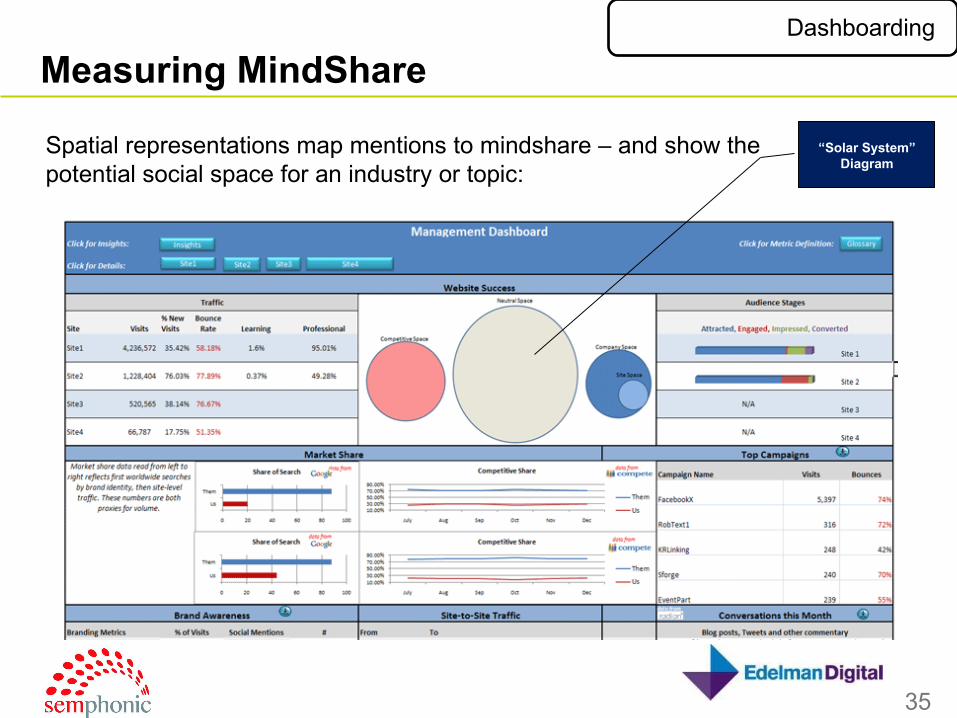
Spatial representations map mentions to mindshare – and show the potential social space for an industry or topic:
Dashboarding
Measuring MindShare
“Solar System” Diagram

36
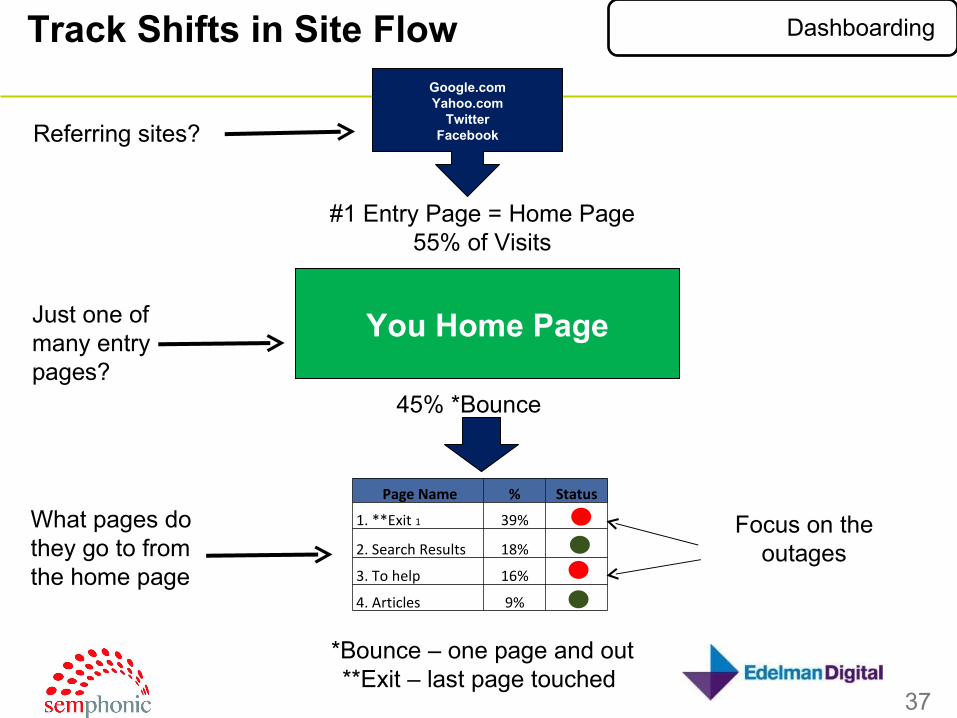
Competitive Analysis solutions allow you to track the upstream and downstream movements between sites and map this to mindshare wins:
Dashboarding
Track Shifts in Site Flow
37
#1 Entry Page = Home Page55% of Visits
45% *Bounce
Page Name % Status
1. **Exit 1 39%
2. Search Results 18%
3. To help 16%
4. Articles 9%
*Bounce – one page and out**Exit – last page touched
You Home Page
Google.comYahoo.com
TwitterFacebookReferring sites?
Just one of many entry pages?
What pages do they go to from the home page
Track Shifts in Site Flow Dashboarding
Focus on the outages

38
You can use topic specificity to understand the degree to which key influencer’s really matter to specific interest areas:
Dashboarding
Tracking Influencer Shifts

39
Tracking shifts in Publications and by Influencer provide a means of targeting PR and personal marketing efforts as well as a whole new way to measure the success of PR and brand focused efforts:
Dashboarding
Tracking Influencer Shifts

40
Your site is still the ultimate hub for online – tracking performance by channel, customer and visit type closes the loop on social performance.
Dashboarding
Site Hub Effectiveness

41
DashingBOARDING - A PROCESS
Monday Tuesday Wednesday Monday
Responsible Parties:
Thursday Friday
Source of data:
Format:
Key dependencies:
42
Framework
Social Media Dashboarding begins with the 3 C’s:● Culling: Getting the Right Data from the River● Classification: Organizing the data by Topic,
Influencer, Sentiment, Source, and Impact● Context: Linking the social metrics within each
classification to real business issues
Key Takeaways

43
Thank you!
• This presentation will be posted @
> http://www.semphonic.com
>www.slideshare.net/skwilder
>www.wildervoices.com
44
For more information…..• Gary Angel:
> Blog: http://semphonic.blogs.com/semangel/
> @garyangel
• Scott K. Wilder
> New blog: http://www.wildervoices.com
> @skwilder
> For other presentations: http://www.slideshare.net/skwilder
Related Documents