HAL Id: hal-01634202 https://hal.archives-ouvertes.fr/hal-01634202 Submitted on 2 Dec 2019 HAL is a multi-disciplinary open access archive for the deposit and dissemination of sci- entific research documents, whether they are pub- lished or not. The documents may come from teaching and research institutions in France or abroad, or from public or private research centers. L’archive ouverte pluridisciplinaire HAL, est destinée au dépôt et à la diffusion de documents scientifiques de niveau recherche, publiés ou non, émanant des établissements d’enseignement et de recherche français ou étrangers, des laboratoires publics ou privés. SMART 2008: Shaking table tests on an asymmetrical reinforced concrete structure and seismic margins assessment Benjamin Richard, Paolo Martinelli, François Voldoire, Mathieu Corus, Thierry Chaudat, Salim Abouri, Nicolas Bonfils To cite this version: Benjamin Richard, Paolo Martinelli, François Voldoire, Mathieu Corus, Thierry Chaudat, et al.. SMART 2008: Shaking table tests on an asymmetrical reinforced concrete structure and seismic margins assessment. Engineering Structures, Elsevier, 2015, 105, pp.48 - 61. 10.1016/j.engstruct.2015.09.036. hal-01634202

Welcome message from author
This document is posted to help you gain knowledge. Please leave a comment to let me know what you think about it! Share it to your friends and learn new things together.
Transcript

HAL Id: hal-01634202https://hal.archives-ouvertes.fr/hal-01634202
Submitted on 2 Dec 2019
HAL is a multi-disciplinary open accessarchive for the deposit and dissemination of sci-entific research documents, whether they are pub-lished or not. The documents may come fromteaching and research institutions in France orabroad, or from public or private research centers.
L’archive ouverte pluridisciplinaire HAL, estdestinée au dépôt et à la diffusion de documentsscientifiques de niveau recherche, publiés ou non,émanant des établissements d’enseignement et derecherche français ou étrangers, des laboratoirespublics ou privés.
SMART 2008: Shaking table tests on an asymmetricalreinforced concrete structure and seismic margins
assessmentBenjamin Richard, Paolo Martinelli, François Voldoire, Mathieu Corus,
Thierry Chaudat, Salim Abouri, Nicolas Bonfils
To cite this version:Benjamin Richard, Paolo Martinelli, François Voldoire, Mathieu Corus, Thierry Chaudat, etal.. SMART 2008: Shaking table tests on an asymmetrical reinforced concrete structureand seismic margins assessment. Engineering Structures, Elsevier, 2015, 105, pp.48 - 61.�10.1016/j.engstruct.2015.09.036�. �hal-01634202�
SMART 2008: Shaking table tests on an asymmetrical reinforcedconcrete structure and seismic margins assessment
a serieasymmt grountorsione) as pies Co(IAEA)uildingss, the foto theequencection wsessmen
shift and inter-story drift) showed an important
⇑ Corresponding author.E-mail address: [email protected] (B. Richard).
1 Current address: Politecnico di Milano, Department of Civil and EnvironmentalEngineering, Piazza L. da Vinci 32, 20133 Milan, Italy.
1
Benjamin Richard a,⇑, Paolo Martinelli a,1, François Voldoire b, Mathieu Corus b, Thierry Chaudat a,Salim Abouri c, Nicolas Bonfils c
aCEA, DEN, DANS, DM2S, SEMT, Laboratoire d’Etude de Mécanique Sismique, F-91191 Gif-sur-Yvette, Franceb EDF, DR&D, Acoustics and Mechanical Analysis Department, 1 avenue du Général de Gaulle, F-92141 Clamart, FrancecEDF, SEPTEN, Dynamic and Earthquake Engineering Group, 12-14 avenue Dutriévoz, F-69628 Villeurbanne, France
The paper reports the main findings ofconcrete model characterized by strongwas subjected to 13 bi-directional inpu0.05 to 1.0 g, which induced significantthe AZALEE shaking table (Saclay, FrancAtomic Energy and Sustainable EnergInternational Atomic Energy AgencyAssessment for Reinforced concrete bBased on the analysis of the test resultoccurred on the specimen (mainly closeobserved at the end of the seismic test s(c) an important specimen stiffness reduequal to 50%; (d) the seismic margins as
s of shaking table tests on a 3-story ¼-scale reinforcedetry, representative of a nuclear building. The specimend motions with increasing maximum acceleration fromand a nonlinear response. The tests were conducted onart of a wide research program launched by the Frenchmmission (CEA), Electricité De France (EDF) and the, titled, ‘‘Seismic design and best-estimate Methodssubjected to Torsion and nonlinear effect (SMART).”llowing conclusions were drawn: (a) moderate damagegeometric singularities) as revealed by the crack patterns; (b) the model responded mainly in the torsional mode;as observed with a shift of the first peak frequency almostt carried out with two distinct failure criteria (frequencyspecimen robustness for high seismic amplitude as well.
1. Introduction
The importance of nuclear power plants and the consequencesof a nuclear accident require that nuclear power plants be designedto safely withstand the most severe environmental conditions thatcould reasonably be expected to affect them during their lifetime.This encouraged the nuclear industry to financially support theinternational scientific community to start ambitious research pro-grams aimed at improving knowledge in several fields of primaryimportance, and thus, ensuring the safety of nuclear power plants.Within this context, significant improvements have been made inthe field of earthquake engineering to better understand the wayin which complex reinforced concrete (RC) structures behave whensubjected to seismic loading. Moreover, these improvements areoriented to assess design practices and best-estimate methodsfor structural dynamic response and floor response spectra
evaluation, in case of low to far-beyond design seismic motions,and to provide reference data for numerical models validation.
Identified as potentially being able to withstand severe damage,RC shear walls have been extensively studied from the 1970s allover the world. Many research programs aimed at studying thestructural behavior of isolated shear walls under static loadinghave been undertaken [1–11]. The experimental data producedpointed out the high bearing capacity of shear walls whensubjected to static loadings. Some experimental campaigns werecarried out on RC shear walls, with different reinforcement ratios,under pseudo-dynamic loading conditions, such as within the SAFE(Structure Armées Faiblement Elancées) program, at the JointResearch Center (JRC) operated by the European Commission,located in Ispra, Italy [12], where the available ductility has beenconfirmed. Additionally, a pronounced decrease of fundamentalfrequencies has also been observed, which is due to the concretecracking and the resulting stiffness reduction, at each step of theseries of seismic loads with increasing levels (up to 15 times thedesign level). More recently, in 2010, an experimental program,TESSH (TEsts on Strong SHear wall), was initiated at JRC withinthe European IRIS project (see [13]) on RC shear walls under static

reversed cyclic loading conditions, in real size, in order to improvethe available ductility and hysteretic models for analysis. A majorconcern that has not yet been analyzed is the fact that shear wallsare generally not used as isolated components but are included inand connected with other components. This may lead to specificstructural effects that must be understood. Additional experimen-tal investigations focused on shear walls with end walls [14–19] orframed with beams and columns [20,21] under static loadings.
Structural effects between each component due to the assemblyappeared as not negligible. Thus, experimental investigations werecarried out on three-dimensional shear walls assembly [22,23],being regular both in-plane and in elevation, which were testedunder static conditions. In order to assess the capabilities of shearwalls-based structures to withstand seismic loadings, experimen-tal studies where dynamic loadings were considered were carriedout. Nevertheless, due to the difficulties of applying a dynamicloading on an RC specimen allowing the description of the inertiaforce field, experimental data appear rarely in the literature, inparticular, when considering such loading conditions applied to athree-dimensional model of a shear walls-based structure. Experi-ments in which an impulsive loading was considered for analyzingthe fundamental dynamic properties of structures are available inthe literature [24,25]. The literature also reports a few studies inwhich a full three-dimensional structural model was subjected toa dynamic load [26–28]. From this brief state-of-the-art review,it can be observed that there is a lack of experimental data regard-ing shear walls-based structures subjected to dynamic loading.
In order to expand the knowledge about seismic behavior ofwall-based structures, the French Atomic Energy and SustainableEnergies Commission (CEA) and Electricité De France (EDF) starteda wide research program in 2006, titled ‘‘Seismic design and best-estimate Methods Assessment for Reinforced concrete buildingssubjected to Torsion and nonlinear effect” (SMART), which hasbeen partially supported by the International Atomic EnergyAgency (IAEA). The objectives of the project were: (i) to create ref-erence experimental data to better understand the way in whichasymmetric RC wall-based structures behave when subjected tohigh intensity seismic loadings, (ii) to estimate the seismic marginswith respect to the design level, and (iii) to assess the capabilitiesof numerical methods for seismic assessment of such structures,including beyond the design level by means of best-estimate non-linear simulations, and for the propagation of uncertainties to feedprobabilistic vulnerability assessment studies. The SMART projectwas split into two parts. The first part consisted in a wide experi-mental campaign where seismic tests were carried out in 2008on an asymmetric reduced scale model of an RC wall-based struc-ture by means of the AZALEE shaking table operated by the NuclearEnergy Division (DEN) in the CEA center located in Saclay (France).The second part of the project consisted on an international bench-mark aimed at allowing the international earthquake engineeringcommunity to express current seismic assessment practices andto share experiences on best-estimate methodologies, in order toprovide the engineering community with more efficient tools andguidelines.
The paper aims to expose the experimental contributions thatthe SMART project has allowed to reach. In particular, the maincontribution of the experimental part of the project lies in the factthat the structural model that was tested has an asymmetric in-plane shape, leading to high torsional and out-of-plane effects.The seismic testing sequence was chosen in order to allow theassessment of seismic margins, regarding conventional limit states.Lastly, the literature review has clearly shown the lack of availableexperimental data acquired on three-dimensional structural mod-els when subjected to a full dynamic environment.
This paper is outlined as follows. First, the experimentalcampaign carried out within the framework of the SMART project
2
is presented. The design principles of the tested RC specimen aredescribed in detail. Then, the specimen geometry is presented aswell as the basic mechanical properties of the constitutivematerials (concrete and steel). The instrumentation layout andthe seismic testing sequence are described. Second, some generalexperimental observations made during the experimentalcampaign are described. Third, the main experimental results areshown. The dynamic properties of the RC specimen that weremeasured right before and after the seismic test sequence throughan experimental identification technique are presented. Then,results in terms of floor response spectra and inter-story driftsare shown. Fourth, based on the experimental measurementspresented in the previous sections, an estimation of the seismicmargins is carried out according to several margin indicators.
2. Experimental program
2.1. Test specimen and material properties
The RC specimen is a scaled model of a simplified part of anuclear electrical building. It was prepared to reproduce the geo-metrical, physical, and dynamic characteristics of part of the realbuilding. Due to the inherent limitations related to the laboratorycapacity—nomatter the laboratory—some simplifying assumptionsmust be considered. In case of the AZALEE shaking table, eight1000 kN actuators are used to apply the seismic load, andspecimens having a maximum mass of 100 tons can be tested.The maximum acceleration is 1.0 g, the maximum displacementis 125 mm in the horizontal directions (X and Y), and 100 mm inthe vertical direction (Z). In particular, considering the size or massof the real building and given the load capacity of the AZALEEshaking table [29], the model had to be geometrically reduced toa ¼ scale. In order to ensure the representativeness of the measure-ments carried out on a reduced scaled model, similitude lawsshould be considered. The following conditions must be fulfilled:(i) geometry; (ii) relationship between stresses and strains for allthe constitutive materials; (iii) inertia and gravity forces; and (iv)initial and boundary conditions [30,31]. Considering the technicalspecifications of the AZALEE shaking table (displacement ampli-tudes, load capacity, etc.), it was possible to ensure the invarianceof the stresses and of the accelerations through the scale reduction.The well-known Cauchy–Froude similitude law was therefore cho-sen in this study. The scaling factors are given in Table 1.
Since the same material properties were chosen for the mock-up and for the actual building, in particular the same specific mass,it was necessary to set up additional masses to balance the lack ofmass, equal to 3 times the specific mass by the whole volume ofthe mock-up. It was decided to distribute this additional massuniformly on the mock-up floors, since this choice has little conse-quence on their structural role, acting essentially as diaphragms onthe RC walls, and because we were not interested in catching thespecific flexural behavior of the floors. The total mass of the RCspecimen loaded with the additional masses is equal to 44.29 tons.The first slab is loaded with 11.60 tons, second slab with12.00 tons, and the third slab with 10.25 tons. The mass of theRC specimen without the additional masses is 10.44 tons.
The RC specimen was designed according to the current Frenchdesign rules to be considered when dealing with a nuclear building[32,33]. The design spectrum that was considered is shown inFig. 1. It corresponds to an earthquake of magnitude 5.5 at a dis-tance of 10 km from the rupture plane. The nominal ground accel-eration is 0.2 g. Synthetic accelerograms were generated from thedesign spectrum. The acceleration response spectrum of theselected signal is shown in Fig. 1, where fairly good agreementwith the target spectrum can be noted. The selected signal is the

Table 1Scale factors of the Cauchy–Froude similitude law – p and m represent the realbuilding (without any scale changes) and the model respectively.
Parameter Symbol Cauchy–Froude’s scale factor Value
Length L Lp=Lm ¼ k 4Young’s modulus E Ep/Em = 1 1Specific mass q qp=qm ¼ k�1 1/4
Area A Ap=Am ¼ k2 16
Volume V Vp=Vm ¼ k3 64
Mass m mp=mm ¼ k2 16
Displacement d dp=dm ¼ k 4Velocity v vp=vm ¼ k0:5 2
Acceleration a ap/am = 1 1Weight W Wp=Wm ¼ k2 16
Force F Fp=Fm ¼ k2 16
Moment M Mp=Mm ¼ k3 64
Stress r rp/rm = 1 1Strain � �p=�m ¼ 1 1Time t tp=tm ¼ k0:5 2
Frequency f f p=f m ¼ k�0:5 1/2
one with the highest correlation factor with the target spectrum. Adetailed description of the generation technique used can be foundin [34].
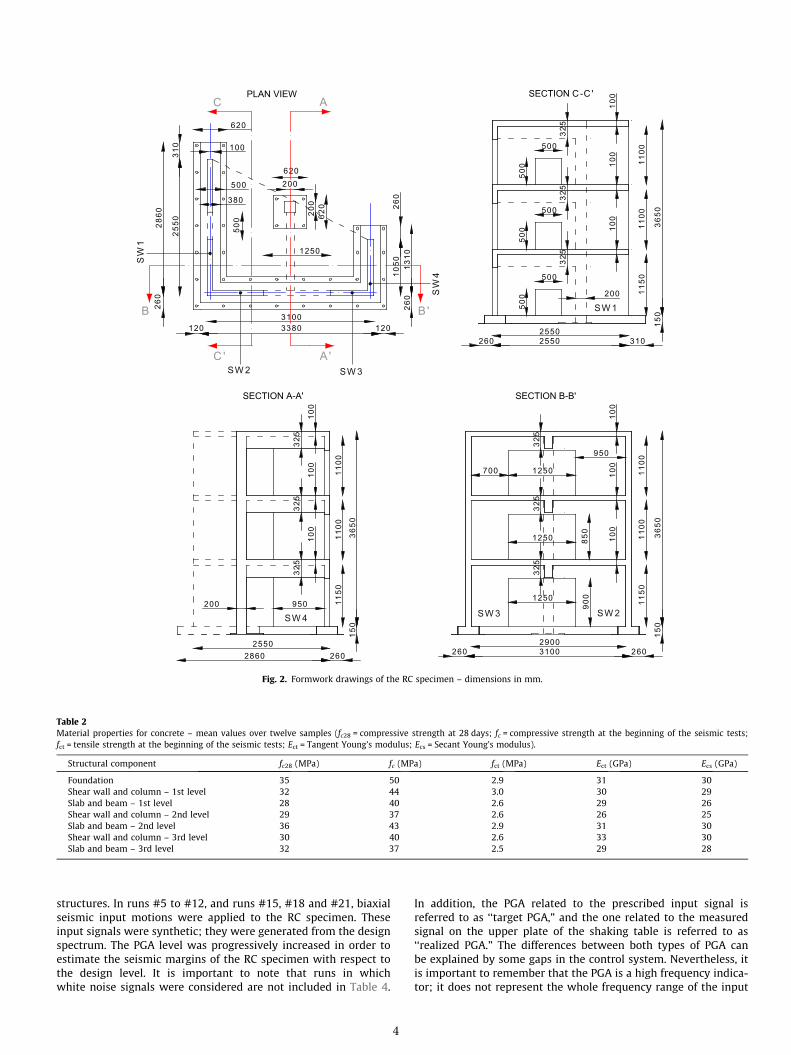
The geometry of the RC specimen was defined in order to fulfillthree conditions: (i) the specimen should have an asymmetricshape to experience significant torsional effects during the loading,(ii) the first eigenfrequencies should be in the range 4–10 Hz toensure the occurrence of significant damage, and (iii) no significantdamage should appear at 50% of the design level. It is composed ofnine structural elements: one foundation, three shear walls withopenings, three slabs, three beams and one column. The formworkdrawings of the RC specimen are shown in Fig. 2. It is 3.65 m highand has an in-plane trapezoidal shape. The main shear wall is com-posed of two shear walls (SW2 and SW3) and is 3.10 m long. Themedium shear wall (SW1) is 2.55 m long while the last shear wall(SW4) is 1.05 m long. All the shear walls and the slabs are 0.10 mthick. The RC beams, located under the lower face of thefloors, are 1.45 m long with a rectangular cross-section of0.325 m � 0.15 m. The RC column is 3.80 m high and has arectangular cross-section of 0.20 m � 0.20 m. Lastly, the shear wallfoundation is made of a continuous RC footing that is 0.38 m wideand 0.15 m high. The footing is anchored on a 0.02 m thick steelplate that is linked with the shaking table upper plate by meansof appropriate screws and nuts. The RC column is anchored on a0.62 m � 0.62 m � 0.02 m steel plate. The steel reinforcing ratio is
100
102
0
0.2
0.4
0.6
0.8
Frequency (Hz)
Pse
udo
acce
lera
tion
(g)
2% − Design5% − Design2% − Generated5% − Generated
Fig. 1. Comparison between design spectrum and response spectra for thegenerated input ground motions – 2% and 5% damping – earthquake magnitudeequal to 5.5.
3
close to 2.3% for the shear walls and 2% for the slabs. A detailed pre-sentation of the steel reinforcing drawing can be found in [35].
The target mechanical properties of the constitutive materials(concrete and steel reinforcements) used for the RC specimen havebeen defined according to the current engineering design rulesused in the French nuclear industry [33]. In order to have the nec-essary data to develop numerical models, characterization testswere carried out. In particular, concrete strength was measuredby means of compressive tests carried out on cylindrical specimens(160 mm � 320 mm) and Brazilian tests, respectively. Due to thefact that the RC specimen was built in seven different casts, con-crete was characterized in several areas not only at 28 days butalso at the beginning of the seismic tests. Twelve samples weretested per cast. The experimental results are reported in Table 2.
The steel reinforcements put in the RC specimen had five differ-ent diameters. Due to the scale reduction, diameters ranged from3 mm up to 10 mm. It is important to note that no provider hasbeen able to provide ribbed bars for all diameters. The steel barswith a diameter of 3 and 4 mm are smooth, whereas the bars withother diameters (6, 8 and 10 mm) are ribbed. Characterization testswere carried out according to the current engineering practice [36].The main results are shown in Table 3.
2.2. Sensors layout
The measurement points were defined in order to capture theoverall structural response of the specimen during the seismicloading as well as the local effects such as steel yielding. A totalof 264 acquisition channels were used, 230 were dedicated tothe RC specimen and 34 were dedicated to the shaking table.Regarding the channels devoted to the specimen, accelerometers,linear variable differential transformer (LVDT) and strain gaugeswere adopted. The location of the main measurement points(except for strain gauges) is shown in Fig. 3. Displacement timehistories were measured in both X and Y directions at the four cor-ners of each slab with respect to an external rigid frame fixed outof the shaking table (approximately 75 cm far from the shakingtable sides). In addition, displacement time histories were alsomeasured in the Z direction not only between each slab at pointE but also between the points A, B, C and D located at the thirdfloor, and the corresponding points located at the foundation level.Lastly, LVDTs were also used to monitor the relative displacementtime histories at the interface between the specimen and the shak-ing table upper plate. A detailed description of the sensors arrange-ment is available in [35]. Among the channels dedicated to theshaking table, accelerometers were put at its upper plate centerto monitor the accelerations according to both horizontal (X andY) and vertical (Z) directions. In addition, the so-called degrees offreedom (DOFs) automatically computed by the shaking table con-troller were also recorded in order to have global informationrelated to the spatial position of the tested system (shaking tableand RC specimen). This information can be used as loading inputto feed the numerical models.
2.3. Test loading protocol
The seismic loading sequence is summarized in Table 4. Theloading protocol is composed of 21 biaxial seismic runs in the hor-izontal directions (X and Y). The input signals used during the runs#1, #2, #13, #14, #16, #17, #19 and #20 were white noise signalswith a peak ground acceleration (PGA) level limited to 0.05 g. Theywere dedicated to the identification of the modal properties of theRC specimen. In runs #3 and #4, seismic signals coming fromactual records were used with a PGA level equal to 0.05 g. Theobjective of these two preliminary seismic runs was to create aninitial light damage state, as can be observed in existing RC
620
2860
2550
260
500
380
100
620
620
200
200
3380120 1203100
310
500
1250
1050
260
1310
260
A
A '
C
C '
'BB
SW
1
SW 3SW 2
SW
4
3650
150
1100
1100
100
100
100
325
325
325
2860 2602550
950200 1150
SW 4
3650
150
1100
1100
1150
100
100
100
325
325
325
1250
900
850
1250
31002900
260 260
SW 2SW 3
700 1250
950
3650
150
1100
1100
1150
100
100
100
25502550
260 310
325
325
325
500
500
500
500
500
500 200
SW 1
SECTION C-C 'PLAN VIEW
SECTION B-B'SECTION A-A'
Fig. 2. Formwork drawings of the RC specimen – dimensions in mm.
Table 2Material properties for concrete – mean values over twelve samples (fc28 = compressive strength at 28 days; fc = compressive strength at the beginning of the seismic tests;fct = tensile strength at the beginning of the seismic tests; Ect = Tangent Young’s modulus; Ecs = Secant Young’s modulus).
Structural component fc28 (MPa) fc (MPa) fct (MPa) Ect (GPa) Ecs (GPa)
Foundation 35 50 2.9 31 30Shear wall and column – 1st level 32 44 3.0 30 29Slab and beam – 1st level 28 40 2.6 29 26Shear wall and column – 2nd level 29 37 2.6 26 25Slab and beam – 2nd level 36 43 2.9 31 30Shear wall and column – 3rd level 30 40 2.6 33 30Slab and beam – 3rd level 32 37 2.5 29 28
structures. In runs #5 to #12, and runs #15, #18 and #21, biaxialseismic input motions were applied to the RC specimen. Theseinput signals were synthetic; they were generated from the designspectrum. The PGA level was progressively increased in order toestimate the seismic margins of the RC specimen with respect tothe design level. It is important to note that runs in whichwhite noise signals were considered are not included in Table 4.
4
In addition, the PGA related to the prescribed input signal isreferred to as ‘‘target PGA,” and the one related to the measuredsignal on the upper plate of the shaking table is referred to as‘‘realized PGA.” The differences between both types of PGA canbe explained by some gaps in the control system. Nevertheless, itis important to remember that the PGA is a high frequency indica-tor; it does not represent the whole frequency range of the input
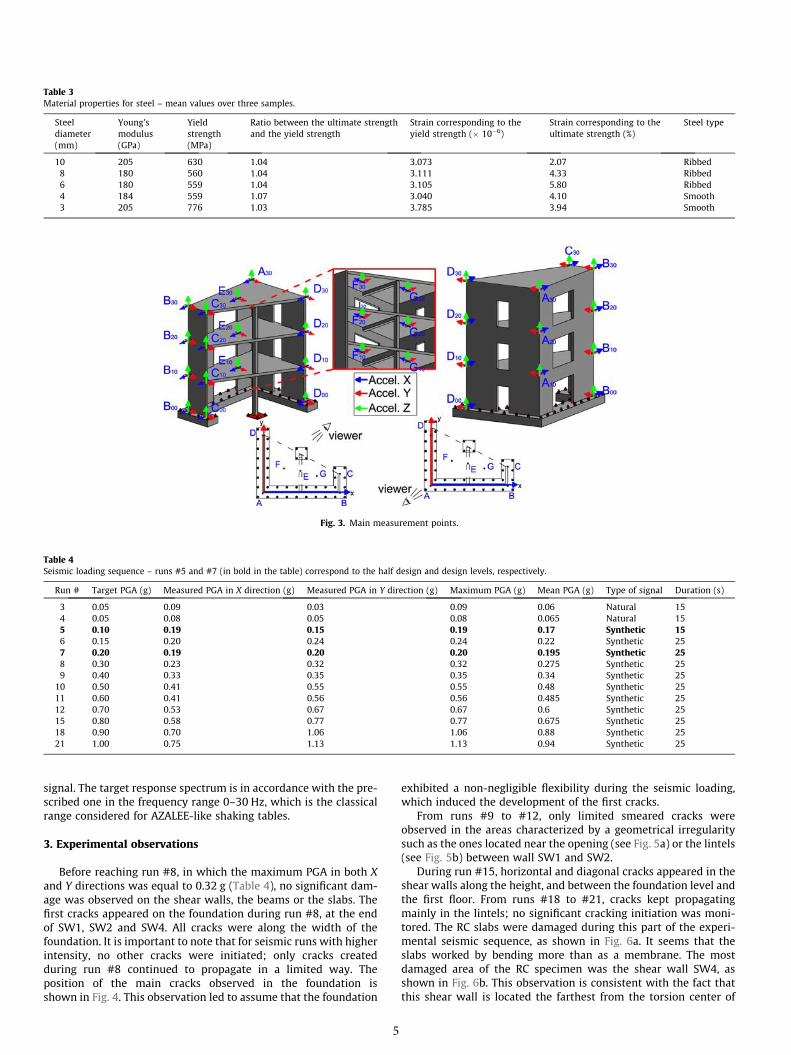
Table 3Material properties for steel – mean values over three samples.
Steeldiameter(mm)
Young’smodulus(GPa)
Yieldstrength(MPa)
Ratio between the ultimate strengthand the yield strength
Strain corresponding to theyield strength (� 10�6)
Strain corresponding to theultimate strength (%)
Steel type
10 205 630 1.04 3.073 2.07 Ribbed8 180 560 1.04 3.111 4.33 Ribbed6 180 559 1.04 3.105 5.80 Ribbed4 184 559 1.07 3.040 4.10 Smooth3 205 776 1.03 3.785 3.94 Smooth
Fig. 3. Main measurement points.
Table 4Seismic loading sequence – runs #5 and #7 (in bold in the table) correspond to the half design and design levels, respectively.
Run # Target PGA (g) Measured PGA in X direction (g) Measured PGA in Y direction (g) Maximum PGA (g) Mean PGA (g) Type of signal Duration (s)
3 0.05 0.09 0.03 0.09 0.06 Natural 154 0.05 0.08 0.05 0.08 0.065 Natural 155 0.10 0.19 0.15 0.19 0.17 Synthetic 156 0.15 0.20 0.24 0.24 0.22 Synthetic 257 0.20 0.19 0.20 0.20 0.195 Synthetic 258 0.30 0.23 0.32 0.32 0.275 Synthetic 259 0.40 0.33 0.35 0.35 0.34 Synthetic 25
10 0.50 0.41 0.55 0.55 0.48 Synthetic 2511 0.60 0.41 0.56 0.56 0.485 Synthetic 2512 0.70 0.53 0.67 0.67 0.6 Synthetic 2515 0.80 0.58 0.77 0.77 0.675 Synthetic 2518 0.90 0.70 1.06 1.06 0.88 Synthetic 2521 1.00 0.75 1.13 1.13 0.94 Synthetic 25
signal. The target response spectrum is in accordance with the pre-scribed one in the frequency range 0–30 Hz, which is the classicalrange considered for AZALEE-like shaking tables.
3. Experimental observations
Before reaching run #8, in which the maximum PGA in both Xand Y directions was equal to 0.32 g (Table 4), no significant dam-age was observed on the shear walls, the beams or the slabs. Thefirst cracks appeared on the foundation during run #8, at the endof SW1, SW2 and SW4. All cracks were along the width of thefoundation. It is important to note that for seismic runs with higherintensity, no other cracks were initiated; only cracks createdduring run #8 continued to propagate in a limited way. Theposition of the main cracks observed in the foundation isshown in Fig. 4. This observation led to assume that the foundation
5
exhibited a non-negligible flexibility during the seismic loading,which induced the development of the first cracks.
From runs #9 to #12, only limited smeared cracks wereobserved in the areas characterized by a geometrical irregularitysuch as the ones located near the opening (see Fig. 5a) or the lintels(see Fig. 5b) between wall SW1 and SW2.
During run #15, horizontal and diagonal cracks appeared in theshear walls along the height, and between the foundation level andthe first floor. From runs #18 to #21, cracks kept propagatingmainly in the lintels; no significant cracking initiation was moni-tored. The RC slabs were damaged during this part of the experi-mental seismic sequence, as shown in Fig. 6a. It seems that theslabs worked by bending more than as a membrane. The mostdamaged area of the RC specimen was the shear wall SW4, asshown in Fig. 6b. This observation is consistent with the fact thatthis shear wall is located the farthest from the torsion center of
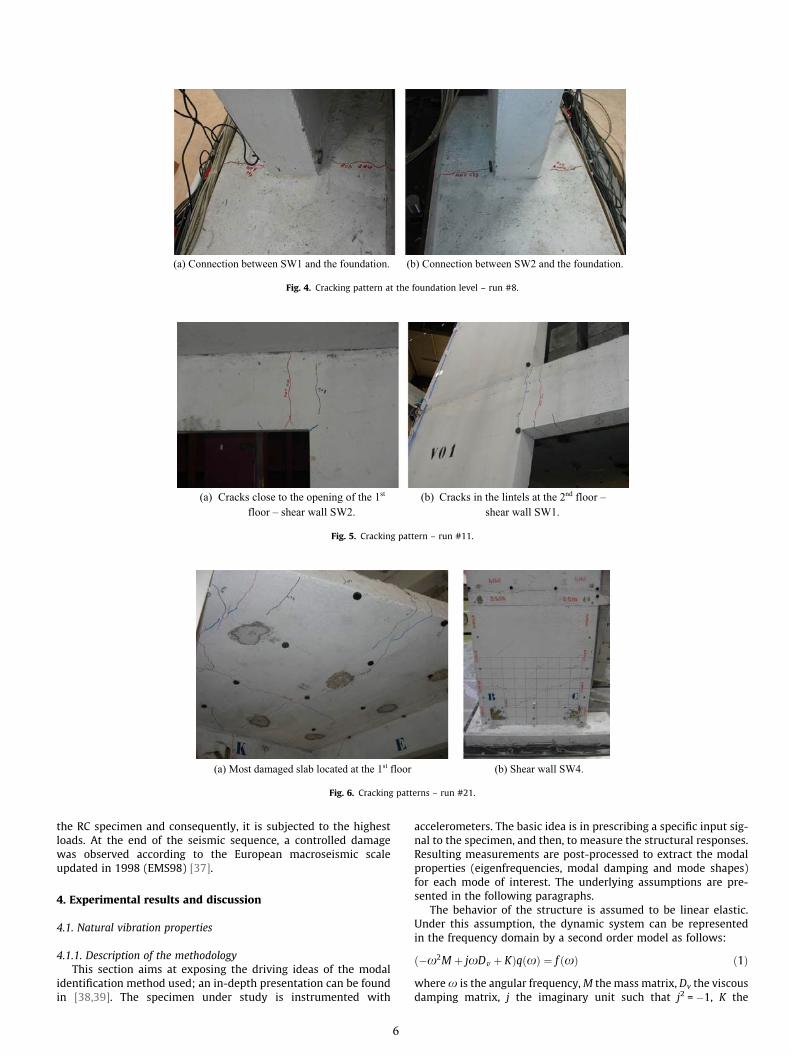
(a) Connection between SW1 and the foundation. (b) Connection between SW2 and the foundation.
Fig. 4. Cracking pattern at the foundation level – run #8.
(a) Cracks close to the opening of the 1st
floor – shear wall SW2. (b) Cracks in the lintels at the 2nd floor –
shear wall SW1.
Fig. 5. Cracking pattern – run #11.
(a) Most damaged slab located at the 1st floor (b) Shear wall SW4.
Fig. 6. Cracking patterns – run #21.
the RC specimen and consequently, it is subjected to the highestloads. At the end of the seismic sequence, a controlled damagewas observed according to the European macroseismic scaleupdated in 1998 (EMS98) [37].
4. Experimental results and discussion
4.1. Natural vibration properties
4.1.1. Description of the methodologyThis section aims at exposing the driving ideas of the modal
identification method used; an in-depth presentation can be foundin [38,39]. The specimen under study is instrumented with
6
accelerometers. The basic idea is in prescribing a specific input sig-nal to the specimen, and then, to measure the structural responses.Resulting measurements are post-processed to extract the modalproperties (eigenfrequencies, modal damping and mode shapes)for each mode of interest. The underlying assumptions are pre-sented in the following paragraphs.
The behavior of the structure is assumed to be linear elastic.Under this assumption, the dynamic system can be representedin the frequency domain by a second order model as follows:
ð�x2M þ jxDv þ KÞqðxÞ ¼ f ðxÞ ð1Þwherex is the angular frequency,M the mass matrix, Dv the viscousdamping matrix, j the imaginary unit such that j2 = �1, K the
stiffness matrix, q the generalized degrees of freedom characteriz-ing the displacement response of the dynamic system and f theexternal loading expressed in the frequency domain. Hence, thetransfer function Hij between an input located on the sensor i (force)and the output of the sensor j (displacement) is given by a secondorder model. It is assumed that the transfer function Hij is expressedas a rational fraction of numerator Pij and denominator Qij, of order rand r + 2, respectively. More precisely, the transfer function isapproximated by the following expression:
HijðxÞ ¼ PijðxÞQijðxÞ ¼
Prk¼0pkxkPrþ2k¼0qkxk
ð2Þ
where r is an even integer, pk and qk are the complex coefficients ofthe polynomial terms Pij and Qij that need to be identified. For thefrequency ranges of interest, in the neighborhood of each mode,the linear system giving coefficients of Pij and Qij is solved in theleast square sense for increasing values of r. Eigenfrequencies andrelated modal damping are given by the stable roots of Qij.
Other techniques [40,41] benefit from the rational fractionsproperties in order to improve both the computational time ofthe whole analysis and the accuracy in case of close modes. Thedynamic identification of the system was carried out right beforeand after the seismic test sequence in order to follow the evolutionof the modal properties due to damage.
4.1.2. Experimental designThe accuracy of the identification technique is mainly depen-
dent on the relevance of the experimental design to be imple-mented on the RC specimen. A preliminary numerical modalanalysis aimed at (i) estimating the range of the eigenfrequenciesto be identified, (ii) selecting the areas of interest, and (iii) defininga point to apply the load to the RC specimen, has been carried out.Within the framework of the SMART 2008 experimental campaign,several operational modal analyses under different boundary andstructural conditions were carried out. The RC analyzed specimenconditions are the following: free-free condition (RC specimenpulled out); a fixed base condition (RC specimen anchored to thesteel plate on which it was built); the RC specimen connected tothe shaking table’s upper plate with and without additional masseson the slabs; and last, the RC specimen connected with the shakingtable’s upper plate with additional masses after being subjected tothe whole seismic test sequences. For the sake of brevity, an optionhas been made in this paper to show a subset of the results andonly the ones used as starting and final points for the SMART2008 International Benchmark participants are considered [42].The results from the modal identification carried out right beforeand right after the seismic test sequence are shown and discussed.The whole experimental analysis is available in [43].
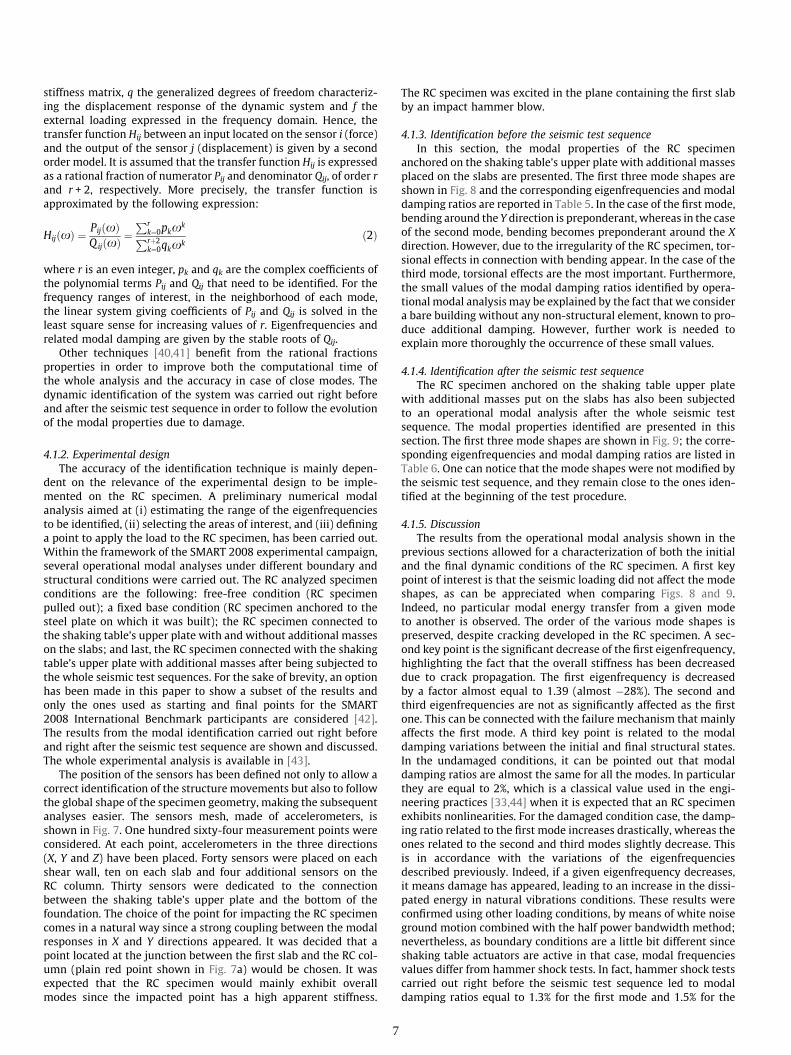
The position of the sensors has been defined not only to allow acorrect identification of the structure movements but also to followthe global shape of the specimen geometry, making the subsequentanalyses easier. The sensors mesh, made of accelerometers, isshown in Fig. 7. One hundred sixty-four measurement points wereconsidered. At each point, accelerometers in the three directions(X, Y and Z) have been placed. Forty sensors were placed on eachshear wall, ten on each slab and four additional sensors on theRC column. Thirty sensors were dedicated to the connectionbetween the shaking table’s upper plate and the bottom of thefoundation. The choice of the point for impacting the RC specimencomes in a natural way since a strong coupling between the modalresponses in X and Y directions appeared. It was decided that apoint located at the junction between the first slab and the RC col-umn (plain red point shown in Fig. 7a) would be chosen. It wasexpected that the RC specimen would mainly exhibit overallmodes since the impacted point has a high apparent stiffness.
7
The RC specimen was excited in the plane containing the first slabby an impact hammer blow.
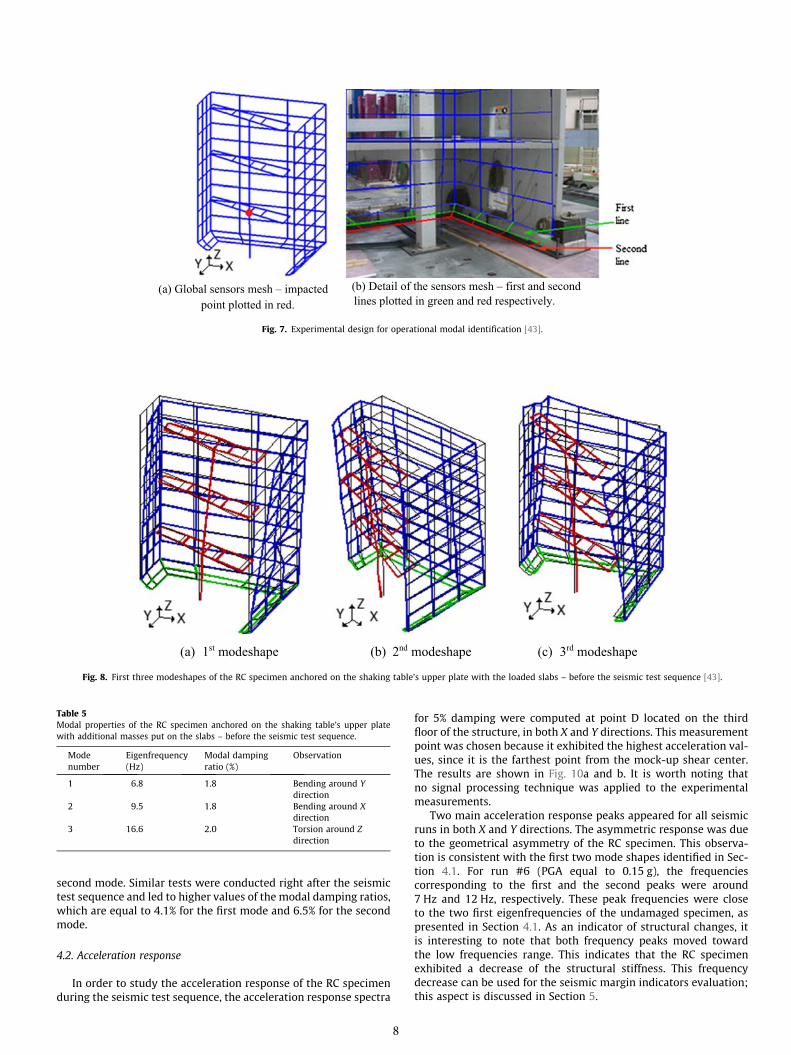
4.1.3. Identification before the seismic test sequenceIn this section, the modal properties of the RC specimen
anchored on the shaking table’s upper plate with additional massesplaced on the slabs are presented. The first three mode shapes areshown in Fig. 8 and the corresponding eigenfrequencies and modaldamping ratios are reported in Table 5. In the case of the first mode,bending around the Y direction is preponderant, whereas in the caseof the second mode, bending becomes preponderant around the Xdirection. However, due to the irregularity of the RC specimen, tor-sional effects in connection with bending appear. In the case of thethird mode, torsional effects are the most important. Furthermore,the small values of the modal damping ratios identified by opera-tional modal analysis may be explained by the fact that we considera bare building without any non-structural element, known to pro-duce additional damping. However, further work is needed toexplain more thoroughly the occurrence of these small values.
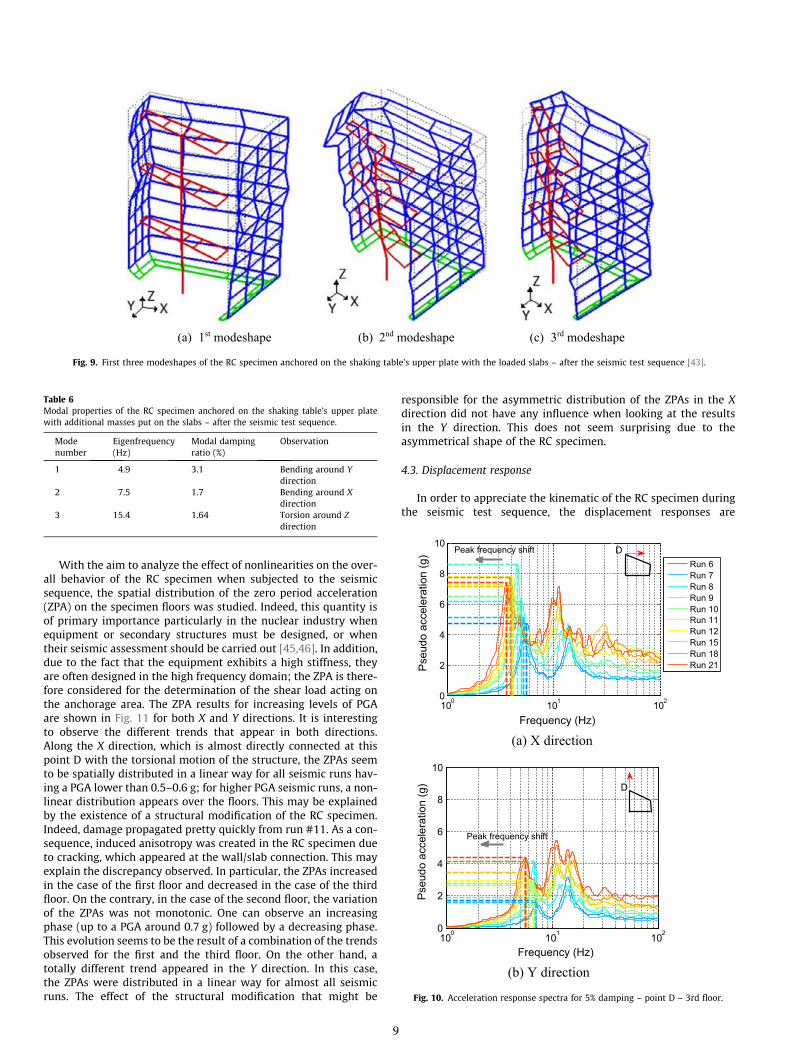
4.1.4. Identification after the seismic test sequenceThe RC specimen anchored on the shaking table upper plate
with additional masses put on the slabs has also been subjectedto an operational modal analysis after the whole seismic testsequence. The modal properties identified are presented in thissection. The first three mode shapes are shown in Fig. 9; the corre-sponding eigenfrequencies and modal damping ratios are listed inTable 6. One can notice that the mode shapes were not modified bythe seismic test sequence, and they remain close to the ones iden-tified at the beginning of the test procedure.
4.1.5. DiscussionThe results from the operational modal analysis shown in the
previous sections allowed for a characterization of both the initialand the final dynamic conditions of the RC specimen. A first keypoint of interest is that the seismic loading did not affect the modeshapes, as can be appreciated when comparing Figs. 8 and 9.Indeed, no particular modal energy transfer from a given modeto another is observed. The order of the various mode shapes ispreserved, despite cracking developed in the RC specimen. A sec-ond key point is the significant decrease of the first eigenfrequency,highlighting the fact that the overall stiffness has been decreaseddue to crack propagation. The first eigenfrequency is decreasedby a factor almost equal to 1.39 (almost �28%). The second andthird eigenfrequencies are not as significantly affected as the firstone. This can be connected with the failure mechanism that mainlyaffects the first mode. A third key point is related to the modaldamping variations between the initial and final structural states.In the undamaged conditions, it can be pointed out that modaldamping ratios are almost the same for all the modes. In particularthey are equal to 2%, which is a classical value used in the engi-neering practices [33,44] when it is expected that an RC specimenexhibits nonlinearities. For the damaged condition case, the damp-ing ratio related to the first mode increases drastically, whereas theones related to the second and third modes slightly decrease. Thisis in accordance with the variations of the eigenfrequenciesdescribed previously. Indeed, if a given eigenfrequency decreases,it means damage has appeared, leading to an increase in the dissi-pated energy in natural vibrations conditions. These results wereconfirmed using other loading conditions, by means of white noiseground motion combined with the half power bandwidth method;nevertheless, as boundary conditions are a little bit different sinceshaking table actuators are active in that case, modal frequenciesvalues differ from hammer shock tests. In fact, hammer shock testscarried out right before the seismic test sequence led to modaldamping ratios equal to 1.3% for the first mode and 1.5% for the
(a) Global sensors mesh – impacted point plotted in red.
(b) Detail of the sensors mesh – first and second lines plotted in green and red respectively.
Fig. 7. Experimental design for operational modal identification [43].
(a) 1st modeshape (b) 2nd modeshape (c) 3rd modeshape
Fig. 8. First three modeshapes of the RC specimen anchored on the shaking table’s upper plate with the loaded slabs – before the seismic test sequence [43].
Table 5Modal properties of the RC specimen anchored on the shaking table’s upper platewith additional masses put on the slabs – before the seismic test sequence.
Modenumber
Eigenfrequency(Hz)
Modal dampingratio (%)
Observation
1 6.8 1.8 Bending around Ydirection
2 9.5 1.8 Bending around Xdirection
3 16.6 2.0 Torsion around Zdirection
second mode. Similar tests were conducted right after the seismictest sequence and led to higher values of the modal damping ratios,which are equal to 4.1% for the first mode and 6.5% for the secondmode.
4.2. Acceleration response
In order to study the acceleration response of the RC specimenduring the seismic test sequence, the acceleration response spectra
8
for 5% damping were computed at point D located on the thirdfloor of the structure, in both X and Y directions. This measurementpoint was chosen because it exhibited the highest acceleration val-ues, since it is the farthest point from the mock-up shear center.The results are shown in Fig. 10a and b. It is worth noting thatno signal processing technique was applied to the experimentalmeasurements.
Two main acceleration response peaks appeared for all seismicruns in both X and Y directions. The asymmetric response was dueto the geometrical asymmetry of the RC specimen. This observa-tion is consistent with the first two mode shapes identified in Sec-tion 4.1. For run #6 (PGA equal to 0.15 g), the frequenciescorresponding to the first and the second peaks were around7 Hz and 12 Hz, respectively. These peak frequencies were closeto the two first eigenfrequencies of the undamaged specimen, aspresented in Section 4.1. As an indicator of structural changes, itis interesting to note that both frequency peaks moved towardthe low frequencies range. This indicates that the RC specimenexhibited a decrease of the structural stiffness. This frequencydecrease can be used for the seismic margin indicators evaluation;this aspect is discussed in Section 5.
(a) 1st modeshape (b) 2nd modeshape (c) 3rd modeshape
Fig. 9. First three modeshapes of the RC specimen anchored on the shaking table’s upper plate with the loaded slabs – after the seismic test sequence [43].
Table 6Modal properties of the RC specimen anchored on the shaking table’s upper platewith additional masses put on the slabs – after the seismic test sequence.
Modenumber
Eigenfrequency(Hz)
Modal dampingratio (%)
Observation
1 4.9 3.1 Bending around Ydirection
2 7.5 1.7 Bending around Xdirection
3 15.4 1.64 Torsion around Zdirection
(a) X direction
(b) Y direction
100 101 1020
2
4
6
8
10
Frequency (Hz)
Pse
udo
acce
lera
tion
(g)
Run 6Run 7Run 8Run 9Run 10Run 11Run 12Run 15Run 18Run 21
DPeak frequency shift
100 101 1020
2
4
6
8
10
Frequency (Hz)
Pse
udo
acce
lera
tion
(g)
Peak frequency shift
D
Fig. 10. Acceleration response spectra for 5% damping – point D – 3rd floor.
With the aim to analyze the effect of nonlinearities on the over-all behavior of the RC specimen when subjected to the seismicsequence, the spatial distribution of the zero period acceleration(ZPA) on the specimen floors was studied. Indeed, this quantity isof primary importance particularly in the nuclear industry whenequipment or secondary structures must be designed, or whentheir seismic assessment should be carried out [45,46]. In addition,due to the fact that the equipment exhibits a high stiffness, theyare often designed in the high frequency domain; the ZPA is there-fore considered for the determination of the shear load acting onthe anchorage area. The ZPA results for increasing levels of PGAare shown in Fig. 11 for both X and Y directions. It is interestingto observe the different trends that appear in both directions.Along the X direction, which is almost directly connected at thispoint D with the torsional motion of the structure, the ZPAs seemto be spatially distributed in a linear way for all seismic runs hav-ing a PGA lower than 0.5–0.6 g; for higher PGA seismic runs, a non-linear distribution appears over the floors. This may be explainedby the existence of a structural modification of the RC specimen.Indeed, damage propagated pretty quickly from run #11. As a con-sequence, induced anisotropy was created in the RC specimen dueto cracking, which appeared at the wall/slab connection. This mayexplain the discrepancy observed. In particular, the ZPAs increasedin the case of the first floor and decreased in the case of the thirdfloor. On the contrary, in the case of the second floor, the variationof the ZPAs was not monotonic. One can observe an increasingphase (up to a PGA around 0.7 g) followed by a decreasing phase.This evolution seems to be the result of a combination of the trendsobserved for the first and the third floor. On the other hand, atotally different trend appeared in the Y direction. In this case,the ZPAs were distributed in a linear way for almost all seismicruns. The effect of the structural modification that might be
9
responsible for the asymmetric distribution of the ZPAs in the Xdirection did not have any influence when looking at the resultsin the Y direction. This does not seem surprising due to theasymmetrical shape of the RC specimen.
4.3. Displacement response
In order to appreciate the kinematic of the RC specimen duringthe seismic test sequence, the displacement responses are
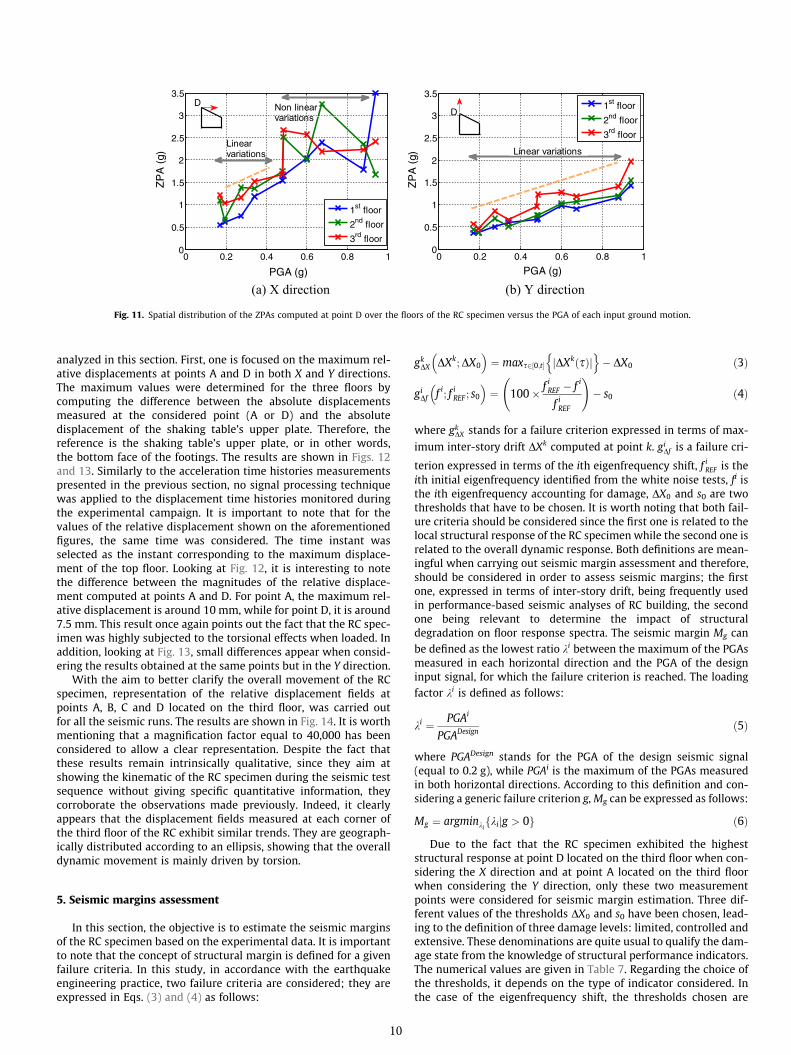
(a) X direction (b) Y direction
0 0.2 0.4 0.6 0.8 10
0.5
1
1.5
2
2.5
3
3.5
PGA (g)
ZP
A (
g)
1st floor
2nd floor
3rd floor
Non linearvariations
Linearvariations
D
0 0.2 0.4 0.6 0.8 10
0.5
1
1.5
2
2.5
3
3.5
PGA (g)
ZP
A (
g)
1st floor
2nd floor
3rd floor
D
Linear variations
Fig. 11. Spatial distribution of the ZPAs computed at point D over the floors of the RC specimen versus the PGA of each input ground motion.
analyzed in this section. First, one is focused on the maximum rel-ative displacements at points A and D in both X and Y directions.The maximum values were determined for the three floors bycomputing the difference between the absolute displacementsmeasured at the considered point (A or D) and the absolutedisplacement of the shaking table’s upper plate. Therefore, thereference is the shaking table’s upper plate, or in other words,the bottom face of the footings. The results are shown in Figs. 12and 13. Similarly to the acceleration time histories measurementspresented in the previous section, no signal processing techniquewas applied to the displacement time histories monitored duringthe experimental campaign. It is important to note that for thevalues of the relative displacement shown on the aforementionedfigures, the same time was considered. The time instant wasselected as the instant corresponding to the maximum displace-ment of the top floor. Looking at Fig. 12, it is interesting to notethe difference between the magnitudes of the relative displace-ment computed at points A and D. For point A, the maximum rel-ative displacement is around 10 mm, while for point D, it is around7.5 mm. This result once again points out the fact that the RC spec-imen was highly subjected to the torsional effects when loaded. Inaddition, looking at Fig. 13, small differences appear when consid-ering the results obtained at the same points but in the Y direction.
With the aim to better clarify the overall movement of the RCspecimen, representation of the relative displacement fields atpoints A, B, C and D located on the third floor, was carried outfor all the seismic runs. The results are shown in Fig. 14. It is worthmentioning that a magnification factor equal to 40,000 has beenconsidered to allow a clear representation. Despite the fact thatthese results remain intrinsically qualitative, since they aim atshowing the kinematic of the RC specimen during the seismic testsequence without giving specific quantitative information, theycorroborate the observations made previously. Indeed, it clearlyappears that the displacement fields measured at each corner ofthe third floor of the RC exhibit similar trends. They are geograph-ically distributed according to an ellipsis, showing that the overalldynamic movement is mainly driven by torsion.
5. Seismic margins assessment
In this section, the objective is to estimate the seismic marginsof the RC specimen based on the experimental data. It is importantto note that the concept of structural margin is defined for a givenfailure criteria. In this study, in accordance with the earthquakeengineering practice, two failure criteria are considered; they areexpressed in Eqs. (3) and (4) as follows:
10
gkDX DXk;DX0
� �¼ maxs2½0;t� jDXkðsÞj
n o� DX0 ð3Þ
giDf f i; f iREF ; s0� �
¼ 100� f iREF � f i
f iREF
!� s0 ð4Þ
where gkDX stands for a failure criterion expressed in terms of max-
imum inter-story drift DXk computed at point k. giDf is a failure cri-
terion expressed in terms of the ith eigenfrequency shift, f iREF is theith initial eigenfrequency identified from the white noise tests, fi isthe ith eigenfrequency accounting for damage, DX0 and s0 are twothresholds that have to be chosen. It is worth noting that both fail-ure criteria should be considered since the first one is related to thelocal structural response of the RC specimen while the second one isrelated to the overall dynamic response. Both definitions are mean-ingful when carrying out seismic margin assessment and therefore,should be considered in order to assess seismic margins; the firstone, expressed in terms of inter-story drift, being frequently usedin performance-based seismic analyses of RC building, the secondone being relevant to determine the impact of structuraldegradation on floor response spectra. The seismic margin Mg canbe defined as the lowest ratio ki between the maximum of the PGAsmeasured in each horizontal direction and the PGA of the designinput signal, for which the failure criterion is reached. The loadingfactor ki is defined as follows:
ki ¼ PGAi
PGADesignð5Þ
where PGADesign stands for the PGA of the design seismic signal(equal to 0.2 g), while PGAi is the maximum of the PGAs measuredin both horizontal directions. According to this definition and con-sidering a generic failure criterion g,Mg can be expressed as follows:
Mg ¼ argminkikijg > 0f g ð6Þ
Due to the fact that the RC specimen exhibited the higheststructural response at point D located on the third floor when con-sidering the X direction and at point A located on the third floorwhen considering the Y direction, only these two measurementpoints were considered for seismic margin estimation. Three dif-ferent values of the thresholds DX0 and s0 have been chosen, lead-ing to the definition of three damage levels: limited, controlled andextensive. These denominations are quite usual to qualify the dam-age state from the knowledge of structural performance indicators.The numerical values are given in Table 7. Regarding the choice ofthe thresholds, it depends on the type of indicator considered. Inthe case of the eigenfrequency shift, the thresholds chosen are

(a) Point A (b) Point D
0 5 100
1
2
3
Maximum relative displacement (mm)
Leve
l num
ber
Run 6Run 7Run 8Run 9Run 10Run 11Run 12Run 15Run 18Run 21
A
0 5 100
1
2
3
Maximum relative displacement (mm)
Leve
l num
ber
Run 6Run 7Run 8Run 9Run 10Run 11Run 12Run 15Run 18Run 21
D
Fig. 12. Absolute value of the maximum relative displacements computed in X direction.
(a) PointA (b) Point D
0 5 100
1
2
3
Maximum relative displacement (mm)
Leve
l num
ber
Run 6Run 7Run 8Run 9Run 10Run 11Run 12Run 15Run 18Run 21
A
0 5 100
1
2
3
Maximum relative displacement (mm)
Leve
l num
ber
Run 6Run 7Run 8Run 9Run 10Run 11Run 12Run 15Run 18Run 21
D
Fig. 13. Absolute value of the maximum relative displacements computed in Y direction.
(a) Runs 6 to 10 (b) Runs 11 to 21
Fig. 14. Representation of the displacement fields at points A, B, C and D – 3rd floor.
Table 7Prescribed values of the thresholds for the failure functions (h = story height equal to1200 mm).
Damage level Inter-story driftthreshold DX0 (mm)
Eigenfrequency shiftthreshold s0 (%)
Limited h400 ¼ 3 15
Controlled h200 ¼ 6 30
Extended h100 ¼ 12 50
11
based upon the feedback from experimental campaigns involvingwall-based structures [12,27]. In the case of inter-story drifts, thechoice of the thresholds was not easy because the structure isstrongly irregular. The fact that bending/shear coupling effectsare exhibited by the structure makes the use of classical inter-story drifts thresholds difficult. However, classical values allowingthe definition of drift levels range from 0.25–0.5% (light damage) to1–2% (extensive damage) [47,48]. Therefore, rather low values, in

(a) Inter-story drift computed in the X direction – point D.
(b) Inter-story drift computed in the Y direction – point A.
0 1 2 3 4 50
5
10
15
Loading factor λ i
Inte
r-st
ory
drift
(mm
)
LightControlledExtended
0 1 2 3 4 50
5
10
15
Loading factor λ i
Inte
r-st
ory
drift
(mm
)
LightControlledExtended
Fig. 15. Absolute value of the maximum inter-story drift computed between the 2nd and the 3rd floors versus the loading factor.
0 1 2 3 4 50
10
20
30
40
50
60
Loading factor λ i
Freq
uenc
y sh
ift (%
)
LightControlledExtended
Fig. 16. 1st peak frequency shift versus the loading factor.
accordance with the magnitude of the classical ones, were chosento go in the way of being conservative and to avoid the overestima-tion of seismic margins.
The results are shown in Figs. 15 and 16 in terms of maximuminter-story drift and frequency shift, respectively. Looking atFig. 15, it is interesting to observe that the inter-story driftscomputed at point D in X direction (see Fig. 15a) provide a moreconservative estimation of the seismic margin compared to theseismic margin derived from the inter-story drifts computed atpoint A in the Y direction. Indeed, if a limited damage level isallowed, Eq. (6) leads to a seismic margin between 1 and 2 in thecase of the inter-story drift computed at point D in the X directionwhile it leads to a seismic margin between 2 and 3 in the case ofthe inter-story drift computed at point A in the Y direction (seeFig. 15b). In addition, looking at Fig. 16, the variations of thefrequency shift versus the loading factor is close to the one shownin Fig. 15a. This observation strengthens the fact that the results atpoint A in the Y direction should not be considered for assessing
Table 8Estimated seismic margins for various failure criteria.
Failure criterion Limited
Inter-story drift Point D – direction X 1–2Point A – direction Y 2–3
Eigenfrequency shift 1st eigenfrequency 1–2
12
the seismic margins. If a controlled damage level is allowed,Figs. 15a and 16 show that the seismic margin is between 3 and4. Lastly, if an extensive damage level is allowed, the seismicmargin appears as being higher than 5 since the correspondingfailure criterion is never reached. A summary of the seismic marginestimation is given in Table 8.
6. Concluding remarks and outlooks
This paper discusses the results from shaking table tests carriedout on a RC specimen within the framework of the SMART 2008CEA-EDF-IAEA joint research project. The ¼ scale RC specimenunder study, fulfilling the similitude laws, is part of an electricalbuilding designed according to the French regulations applicablein the nuclear industry. The seismic test sequence was composedof natural low intensity signals and synthetic signals with a PGAreaching 1.0 g. The synthetic input ground motions have been gen-erated from the design response spectrum.
The experimental crack pattern observed at the end of the seis-mic test sequence revealed that only moderate damage occurredon the RC specimen. The main damaged areas were located closeto the geometric singularities, such as the openings or the shearwalls/slab connections. According to the European macroseismicscale updated in 1998 (EMS98) [37], a grade between 2 and 3would correspond to the observations reported in this paper.Although the collapse of the RC model was not achieved, it isexpected that with the increase of the seismic amplitude, the dam-age concentrates and continues to propagate at the geometric sin-gularities. An experimental modal identification technique wasused in order to control the initial conditions and the degradedones after the seismic sequence of the RC specimen. In particular,this analysis led to an accurate knowledge of the first eigenfre-quencies, modal damping ratios and mode shapes. These resultspointed out that the structure is prone to manifest a strong cou-pling between shear and torsional effects, if subjected to seismicloadings.
damage Controlled damage Extended damage
3–4 >54–5 >5
3–4 >5
The overall structural responses monitored during the experi-mental test sequences confirmed not only the assumed behaviorbased on the results from the modal identification analysis, butalso the fact that an increasing damage occurred. Acceleration floorresponse spectra were computed for 5% damping at the mostexcited point for both horizontal directions. These results revealedthat with the increase of the seismic amplitude, the first two peakfrequencies shift to lower frequencies. This observation indicatesthat the RC specimen exhibited a stiffness reduction, leading to afrequency shift almost equal to 30% of the initial first peak fre-quency. The maximum relative displacement responses appearedas being spatially distributed in a linear way. This is quite classicalwhen considering wall-based structures with high steel reinforcingratios. The comparisons between the displacement responses in Xand Y directions lead to conclusions regarding the preponderanceof torsional effects, not only for low amplitude seismic loadings,but also for high amplitude ones. Qualitative graphical representa-tion corroborates these observations.
The last part of this paper is dedicated to a seismic marginsassessment. Two failure criteria were considered, one expressedin terms of first peak frequency shift and another expressed interms of inter-story drift. It turned out that if a limited damagelevel is allowed, the RC specimen exhibits a seismic marginbetween 1 and 2; if a controlled damage level is allowed, the seis-mic margin is between 3 and 4, and if an extended damage level isallowed, the seismic margin is higher than 5. It is worth noting thatboth failure criteria led to the same seismic margin estimations.Taking into account the results from the shaking table tests thatfed the seismic margin assessment, it clearly appears that the RCspecimen, designed according to French current engineering rulesapplicable in the nuclear industry, is robust against high amplitudeseismic loads. This high value of robustness comes from the factthat the nuclear industry acceptance criteria are much more severethan those of the conventional building industry. In particular, asopposed to conventional building industry practice, behavior fac-tors are not taken into account by the nuclear industry. Accordingto the Eurocode 8 [49], a typical behavior factor for shear wallstructures would be around 3. In this regard, the SMART experi-mental outputs provide evidence that the very limited energyabsorption factors presented by the IAEA in its Safety Report onSeismic Evaluation of Existing NPPs (IAEA Safety Report 28, Vienna,2003) [50] are quite reasonable, even prudent; for shear walls, theIAEA proposes an energy absorption factor in the range 1.50–1.75.Nevertheless, even if no large concrete damage was detected in thelow range of seismic level applied to the SMART mock-up, there isevidence in terms of floor response spectra results that non-linearphenomena appear even for lower PGA values, similarly to thatobserved in [51]. This observation can be questionable for the con-ventional practice of computing floor response spectra on the basisof an undamaged structural model. It is believed that such anexperimental program produces a useful set of data available forimproving the computational model and methodologies for theengineering needs; that is the aim of launching the associatedSMART benchmark in 2008.
Despite the fact that the RC specimen exhibited a satisfactorybehavior under seismic loadings, presenting substantial or moder-ate damages, one should recognize that the seismic scenario con-sidered is not intrinsically realistic due to the fact that syntheticinput ground motions adopted, generated from the design spec-trum, were not related to a seismological scenario. In addition,although the proportionality of the seismic runs allowed for thepossibility of carrying out a seismic margin assessment, it alsoled to a progressive introduction or propagation of damages. Asthe main perspective of the SMART 2008 joint project, a newexperimental campaign named SMART 2013 has been launchedin which a more realistic seismic scenario is considered. In
13
particular, the effects of a high amplitude main shock, with afrequency content compatible with the first eigenfrequencies ofthe RC specimen, followed by an after-shock have been investi-gated. The results will be presented and discussed in a subsequentpaper and should confirm the robustness of the RC specimenagainst such an aggressive seismic scenario.
Acknowledgements
The authors would like to thank all the participants to theSMART 2008 project and the associated international benchmarkfor the huge work carried out, namely: R. Crambuer, S. Juster-Lermitte, A. Saudy, A. Awad, M. Elgohary, F. Maillet, N. Brännberg,H. Ekman, G. Lebon, F. Ragueneau, R. Desmorat, C. Giry, J. Mazars,P. Pegon, A. Yakut, I. Kazaz, B. Thunell, J. Moore, Y. Mondet, A. Klein,U. Burmann, I.K. Choi, D. Hahm, A. Andonov, M. Kostov,K. Apostolov, D. Stefanov, K. Hibino, T. Takada, M.G. Mulas,M. Domaneschi, G.M. Atanasiu, S. Crijanovschi, J.M. Vezin, A.Wahid.CEA and EDF are also gratefully acknowledged for material andfinancial support. The work reported in this paper has been alsosupported by the SEISM Institute (http://www.institut-seism.fr).
References
[1] Cervenka V. Inelastic finite element analysis of reinforced concrete panelsunder in-plane loads [Doctoral dissertation]. University of Colorado; 1979.
[2] Paulay T. Some aspects of shear wall design. Bull N Z Soc Earthq Eng 1972;5(3).[3] Alexander CM, Heidebrecht AC, Tso WK. Cyclic load tests on shear wall panels.
In: Proceedings of the fifth world conference on earthquake engineering,Rome; 1973. p. 1116–9.
[4] Cardenas AE, Russell HG, Corley WG. Strength of low-rise structural walls. ACISpecial Publication 63; 1980.
[5] Paulay T, Priestley MJN, Synge AJ. Ductility in earthquake resisting squat shearwalls. ACI J Proc 1982;79(4).
[6] Hidalgo PA, Ledezma CA, Jordan RM. Seismic behavior of squat reinforcedconcrete shear walls. Earthq Spectra 2002;18(2):287–308.
[7] Simeonov B. Experimental investigation of the strength, stiffness and ductilityof RC structural walls. In: World conference on earthquake engineering, vol. 6;1998. p. 387–94.
[8] Endebrock EG, Dove RC, Dunwoody WE. Analysis and tests on small-scaleshear walls. FY-82 final report (No. NUREG/CR-4274; LA-10443-MS). LosAlamos National Lab., NM, USA; 1985.
[9] Wiradinata S. Behaviour of squat walls subjected to load reversals [Doctoraldissertation]. Department of Civil Engineering, University of Toronto; 1985.
[10] Dove RC, Bennett JG, Farrar C, Anderson CA. Seismic category I structuresprogram: final report, FY 1983-84 (No. NUREG/CR-4924; LA-11013-MS). LosAlamos National Lab., NM, USA; 1987.
[11] Lefas ID, Kotsovos MD, Ambraseys NN. Behavior of reinforced concretestructural walls: strength, deformation characteristics, and failure mechanism.ACI Struct J 1990;87(1).
[12] Pegon P, Magonette G, Molina FJ, Verzeletti G, Dyngeland T, Negro P, et al.Programme SAFE: Rapport du test T5. Technical note n� I.98.66. EC JointResearch Center, I-21020 Ispra, Italy; 1998.
[13] Parulekar YM, Reddy GR, Vaze KK, Pegon P, Wenzel H. Simulation of reinforcedconcrete short shear wall subjected to cyclic loading. Nucl Eng Des 2014;270:344–50.
[14] Barda F, Hanson JM, Corley WG. Shear strength of low-rise walls withboundary elements. ACI Special Publication 53; 1977.
[15] Farrar CR, Bennett JG, Dunwoody WE, Baker WE. Static load cycle testing of alow-aspect-ratio six-inch wall TRG-type structure TRG-4-6 (1.0, 0.25) (No.NUREG/CR-5222; LA-11422-MS). Nuclear Regulatory Commission,Washington, DC, USA. Div. of Engineering; Los Alamos National Lab., NM,USA; 1989.
[16] Farrar CR, Bennett JG, Dunwoody WE, Baker WE. Low-aspect-ratio four-inchwall, TRG-type structure; 1990.
[17] Farrar CR, Bennett JG, Dunwoody WE, Baker WE. Static load cycle testing of avery low-aspect-ratio six-inch wall TRG-type structure TRG-6-6 (0.27, 0.50)(No. NUREG/CR-5533; LA-11796-MS). Nuclear Regulatory Commission,Washington, DC, USA. Div. of Engineering; Los Alamos National Lab., NM,USA; 1990.
[18] Farrar CR, Baker WE, Dove RC. Static and simulated seismic testing of the TRG-7 through-16 shear wall structures (No. NUREG/CR-5660; LA-11992-MS).Nuclear Regulatory Commission, Washington, DC, USA. Div. of Engineering;Los Alamos National Lab., NM, USA; 1991.
[19] Inada Y. Relationship between force and displacement in RC structures fornuclear reactors [Doctoral dissertation, PhD thesis]. Univ. of Tokyo; 1986.
[20] Shiga T, Shibata A, Takahashi J. Experimental study on dynamic properties ofreinforced concrete shear walls. In: Proceedings of the 5th world conference
on earthquake engineering. International Association for EarthquakeEngineering, Rome; 1973.
[21] Ogata K, Kabeyasawa T. Experimental study on the hysteretic behavior ofreinforced concrete shear walls under the loading of different moment-to-shear ratios. Trans Jpn Concr Inst 1984;6:274–83.
[22] Benjamin JR, Williams HA. Reinforced concrete shear wall assemblies. TransAm Soc Civil Eng 1961;126(2):114–45.
[23] Umemura H, Aoyama H, Ito M, Hosokawa Y. Aseismic characteristics of RC boxand cylinder walls. In: Proceedings of the sixth world conference onearthquake engineering, New Delhi, India; 1976. p. 3144–9.
[24] Bertero VV. The response of shear walls subjected to dynamic loads [Doctoraldissertation]. Massachusetts Institute of Technology; 1957.
[25] Antebi J. Model analysis of the response of shear walls to dynamic loads[Doctoral dissertation]. Massachusetts Institute of Technology, Department ofCivil and Sanitary Engineering; 1961.
[26] Gergely P. Seismic fragility of reinforced concrete structures and componentsfor application to nuclear facilities. Division of Engineering Technology,Office of Nuclear Regulatory Research, US Nuclear Regulatory Commission;1985.
[27] Ile N, Plumier C, Reynouard J. Test program on U-shaped walls leading tomodel validation and implication to design. In: Proceedings of the 12thEuropean conference on earthquake engineering; 2002.
[28] Torita H, Matsumoto R, Kitada Y, Kusama K, Nishikawa T. Shaking table test ofRc box-type shear wall in multi-axes loading. In: 13th world conference onearthquake engineering. August 1–6, 2004. Vancouver, B.C., Canada.
[29] http://www-tamaris.cea.fr/.[30] Sonin AA. The physical basis of dimensional analysis. Cambridge (MA):
Department of Mechanical Engineering, MIT; 2001.[31] Carvalho EC. Seismic testing of structures. Earthquake engineering-invited
papers: proceedings of the eleventh European conference, Paris, France, 6–11September 1998, vol. 2. CRC Press; 1999. p. 53.
[32] Rapport DES. Proposition de modification de la règle fondamentale de sûreté1.2. c relative à la détermination des mouvements sismiques à prendre encompte pour la sûreté des tranches nucléaires comportant un réacteur à eausous pression, applicable à l’ensemble des installations nucléaires de base.Institut de Protection et de Sûreté Nucléaire; 1998.
[33] Gupta O, Lacoste AC. Prise en compte du risque sismique à la conception desouvrages de génie civil d’installations nucléaire de base à l’exception desstockages à long terme des déchets radioactifs. Guide de l’Autorité de SuretéNucléaire. ASN/GUIDE/2/01. Autorité de Sureté Nucléaire; 2006.
[34] Pedron C. Generation and characterization of synthetic signals: preliminaryobservations and developments. DEN technical report, SEMT/EMSI/RT/98-022/A;1998.
14
[35] Chaudat T, Lermitte S, Vassic S, Poupin S, Garnier C, Mahe M, et al. SMART 2008test report. DEN technical report. DEN/DANS/DM2S/SEMT/EMSI/RT/10-007/C;2010. <http://smart2013.eu/images/docs/smart2008/report/RT_Essai_2008/RT10007C.pdf>.
[36] ISO, P. 6892-1: 2010. Metallic materials – tensile testing – Part, 1, 6892-1;2010.
[37] Grunthal G. European Macroseismic scale EMS-98. Cahier du Centre Européende Géodynamique et de Séismologie, vol. 15; 1998.
[38] Ewins DJ. Modal testing: theory and practice, vol. 79. Letchworth: ResearchStudies Press; 1984.
[39] Heylen W, Sas P. Modal analysis theory and testing. Katholieke UniversteitLeuven, Departement Werktuigkunde; 2006.
[40] Cauberghe B. Applied frequency–domain system identification in the field ofexperimental and operational modal analysis. VUB, Brussel: Praca doktorska;2004.
[41] Balmes E. New results on the identification of normal modes fromexperimental complex modes. Mech Syst Signal Process 1997;11(2):229–43.
[42] Richard B, Martinelli P, Voldoire F, Chaudat T, Abouri S, Bonfils N. SMART 2008:overview, synthesis and lessons learnt from the International Benchmark. EngStruct 2015 [submitted for publication].
[43] Corus M. Experimental modal analyses of the SMART 2008 RC specimen beforeand after being subjected to seismic loadings. EDF technical report. H-T61-2009-00261-FR; 2009 [in French].
[44] Martinelli P, Filippou FC. Simulation of the shaking table test of a seven-storyshear wall building. Earthq Eng Struct Dynam 2009;38(5):587–607.
[45] Kapur KK, Shao LC. Generation of seismic floor response spectra for equipmentdesign. In: Structural design of nuclear plant facilities. ASCE; 1973. p. 29–71.
[46] Lucchini A, Mollaioli F, Bazzurro P. Floor response spectra for bare and infilledreinforced concrete frames. J Earthq Eng 2014;18(7):1060–82.
[47] Council BSS. Prestandard and commentary for the seismic rehabilitation ofbuildings, FEMA-356. Federal Emergency Management Agency, Washington,DC; 2000.
[48] Ghobarah A. On drift limits associated with different damage levels. In:International workshop on performance-based seismic design, vol. 28.Department of Civil Engineering, McMaster University, June 2004.
[49] Comité Européen de Normalisation. Eurocode 8 – design of structures forearthquake resistance – Part 1: General rules, seismic actions and rules forbuildings. European Standard NF EN, 1; 1998.
[50] International Atomic Energy Agency. Seismic evaluation of existing nuclearpower plants, safety reports series, no. 28; 2003.
[51] Labbé P, Altinyollar A. Conclusions of an IAEA-JRC research project on thesafety significance of near-field seismic motions. Nucl Eng Des 2011;241(5):1842–56.
Related Documents