SLR Consulting (Africa) (Pty) Ltd SLR Project 710.02038.00001 Report No. 4 (FINAL) Commissiekraal Coal Mine including support services and associated infrastructure January 2018 Page I APPENDIX I: AIR QUALITY STUDY

Welcome message from author
This document is posted to help you gain knowledge. Please leave a comment to let me know what you think about it! Share it to your friends and learn new things together.
Transcript

SLR Consulting (Africa) (Pty) Ltd
SLR Project 710.02038.00001 Report No. 4 (FINAL)
Commissiekraal Coal Mine including support services and associated infrastructure
January 2018
Page I
APPENDIX I: AIR QUALITY STUDY

Address: 480 Smuts Drive, Halfway Gardens | Postal: P O Box 5260, Halfway House, 1685 Tel: +27 (0)11 805 1940 | Fax: +27 (0)11 805 7010
www.airshed.co.za
Specialist report requirements summary - Air Quality Specialist Impact Assessment Report for the proposed Commissiekraal Coal Mine
A specialist report prepared in terms of the Environmental Impact Regulations of
2014 must contain:
Section in report
a details of-
(i) the specialist who prepared the report; and
(ii) the expertise of that specialist to compile a specialist report including a curriculum
vitae;
Report details
(page i)
b a declaration that the specialist is independent in a form as may be specified by the
competent authority; Report details
(page i)
c an indication of the scope of, and the purpose for which, the report was prepared; Section 1.2 – Scope of Work
d the date and season of the site investigation and the relevance of the season to the
outcome of the assessment; No site investigation for air quality
e a description of the methodology adopted in preparing the report or carrying out the
specialised process; Section 1.4. – Approach and
Methodology
f the specific identified sensitivity of the site related to the activity and its associated
structures and infrastructure; Section 3 - Description of the
Receiving/Baseline Environment
g an identification of any areas to be avoided, including buffers; Section 3.1 - Air Quality Sensitive
Receptors
h a map superimposing the activity including the associated structures and infrastructure
on the environmental sensitivities of the site including areas to be avoided, including
buffers;
Section 3.1 - Air Quality Sensitive
Receptors
(Page 3-2)
i a description of any assumptions made and any uncertainties or gaps in knowledge; Section 1.5– Assumptions, Exclusions
and Limitations
j a description of the findings and potential implications of such findings on the impact of
the proposed activity, including identified alternatives on the environment; Section 4 - Impact of CCM on the
Receiving Environment
k any mitigation measures for inclusion in the EMPr; Section 5 - Recommended Air Quality
Management Measures l any conditions for inclusion in the environmental authorisation;
m any monitoring requirements for inclusion in the EMPr or environmental authorisation;
n a reasoned opinion-
(I) as to whether the proposed activity or portions thereof should be authorised; and
(ii) if the opinion is that the proposed activity or portions thereof should be authorised,
any avoidance, management and mitigation measures that should be included in the
EMPr, and where applicable, the closure plan;
Section 7 – Conclusions and
Recommendations
o a description of any consultation process that was undertaken during the course of Section 1.1 - Consultation Process

Address: 480 Smuts Drive, Halfway Gardens | Postal: P O Box 5260, Halfway House, 1685 Tel: +27 (0)11 805 1940 | Fax: +27 (0)11 805 7010
www.airshed.co.za
preparing the specialist report;
p a summary and copies of any comments received during any consultation process and
where applicable all responses thereto; and NA
q any other information requested by the competent authority. NA
Address: 480 Smuts Drive, Halfway Gardens | Postal: P O Box 5260, Halfway House, 1685 Tel: +27 (0)11 805 1940 | Fax: +27 (0)11 805 7010
www.airshed.co.za
Air Quality Specialist Impact Assessment Report for the proposed Commissiekraal Coal Mine
Project done on behalf of SLR Consulting Africa (Pty) Ltd
Project Compiled by:
N Gresse
Project Manager:
H Liebenberg-Enslin
Report No: 13SLR02 Final v2 | Date: September 2016
Air Quality Specialist Impact Assessment Report for the proposed Commissiekraal Coal Mine
Report No.: 13SLR02 Final v2 i
Report Details
Reviewed by 13SLR02
Status Final v2
Report Title Air Quality Specialist Impact Assessment Report for the proposed Commissiekraal Coal Mine
Date September 2016
Client SLR Consulting Africa (Pty) Ltd
Prepared by Natasha Gresse, BSc Hons. (Meteorology) (University of Pretoria)
Reviewed by Hanlie Liebenberg-Enslin, PhD (University of Johannesburg)
Terri Bird, PhD (University of the Witwatersrand)
Notice
Airshed Planning Professionals (Pty) Ltd is a consulting company located in Midrand, South Africa, specialising in all aspects of air quality, ranging from nearby neighbourhood concerns to regional air pollution impacts as well as noise impact assessments. The company originated in 1990 as Environmental Management Services, which amalgamated with its sister company, Matrix Environmental Consultants, in 2003.
Declaration Airshed is an independent consulting firm with no interest in the project other than to fulfil the contract between the client and the consultant for delivery of specialised services as stipulated in the terms of reference.
Copyright Warning
Unless otherwise noted, the copyright in all text and other matter (including the manner of presentation) is the exclusive property of Airshed Planning Professionals (Pty) Ltd. It is a criminal offence to reproduce and/or use, without written consent, any matter, technical procedure and/or technique contained in this document.
Natasha Shackleton (neé Gresse) (Senior Air Quality Consultant) - Report writing (Air Quality Report)
Natasha holds a BSc Honours degree in Meteorology and a BSc degree from the University of Pretoria and is currently
employed at Airshed Planning Professionals. Natasha's main focus is air quality impact studies. She has been an Air Quality
Consultant for approximately five years and as such has been focused primarily on air quality management and impact
assessment. Natasha has worked on air quality impact assessments and management plans in South Africa, Botswana,
Burkina Faso, Mozambique, Zimbabwe, Zambia, Namibia, Lesotho and Madagascar.
Revision Record
Revision Number Date Reason for Revision
Draft June 2015 For Client Review
Final v1 October 2015 Updated with Client comments
Final v2 September 2016 Update to include 5MW diesel generator

Air Quality Specialist Impact Assessment Report for the proposed Commissiekraal Coal Mine
Report No.: 13SLR02 Final v2 ii
Specialist report requirements summary
A specialist report prepared in terms of the Environmental Impact Regulations of
2014 must contain:
Section in report
a details of-
(i) the specialist who prepared the report; and
(ii) the expertise of that specialist to compile a specialist report including a curriculum
vitae;
Report details (page i)
and
Section 15 - Appendix G:
Curriculum Vitae of Author (Page
15-1)
b a declaration that the specialist is independent in a form as may be specified by the
competent authority;
Report details
(page i)
c an indication of the scope of, and the purpose for which, the report was prepared; Section 1.2 – Scope of Work (Page 1-
1)
d the date and season of the site investigation and the relevance of the season to the
outcome of the assessment;
No site investigation for air quality
e a description of the methodology adopted in preparing the report or carrying out the
specialised process;
Section 1.4. – Approach and
Methodology (Page 1-5)
f the specific identified sensitivity of the site related to the activity and its associated
structures and infrastructure;
Section 3 - Description of the
Receiving/Baseline Environment (Page
3-1)
g an identification of any areas to be avoided, including buffers; Section 3.1 - Air Quality Sensitive
Receptors (Page 3-1)
h a map superimposing the activity including the associated structures and infrastructure
on the environmental sensitivities of the site including areas to be avoided, including
buffers;
Section 3.1 - Air Quality Sensitive
Receptors (Page 3-1)
i a description of any assumptions made and any uncertainties or gaps in knowledge; Section 1.5 – Assumptions, Exclusions
and Limitations (Page 1-7)
j a description of the findings and potential implications of such findings on the impact of
the proposed activity, including identified alternatives on the environment;
Section 4 - Impact of CCM on the
Receiving Environment (Page 4-1)
k any mitigation measures for inclusion in the EMPr; Section 5 - Recommended Air Quality
Management Measures (Page 5-1) l any conditions for inclusion in the environmental authorisation;
m any monitoring requirements for inclusion in the EMPr or environmental authorisation;
n a reasoned opinion-
(I) as to whether the proposed activity or portions thereof should be authorised; and
(ii) if the opinion is that the proposed activity or portions thereof should be authorised,
any avoidance, management and mitigation measures that should be included in the
EMPr, and where applicable, the closure plan;
Section 7 – Conclusions and
Recommendations (Page 7-1)

Air Quality Specialist Impact Assessment Report for the proposed Commissiekraal Coal Mine
Report No.: 13SLR02 Final v2 iii
o a description of any consultation process that was undertaken during the course of
preparing the specialist report;
Section 1.1 - Consultation Process
(Page 1-1)
p a summary and copies of any comments received during any consultation process and
where applicable all responses thereto; and
NA
q any other information requested by the competent authority. NA
Air Quality Specialist Impact Assessment Report for the proposed Commissiekraal Coal Mine
Report No.: 13SLR02 Final v2 iv
Abbreviations
AERMIC AMS/EPA Regulatory Model Improvement Committee
Airshed Airshed Planning Professionals (Pty) Ltd
AMS American Meteorological Society
AQG(s) Air Quality Guideline(s)
AQSR(s) Air Quality Sensitive Receptor(s)
ASG Atmospheric Studies Group
ASTM American Society for Testing and Materials
CALEPA California Environmental Protection Agency
CCM Commissiekraal Coal Mine
CE Control Efficiency
CPVs Cancer Potency Values
DEA Department of Environmental Affairs
DEAT Department of Environmental Affairs and Tourism
EETMs Emission Estimation Technique Manuals
EMS Environmental Management Systems
FEL(s) Front End Loader(s)
FOE Frequency of Exceedence
GLC(s) Ground Level Concentration(s)
GLCC Global Land Cover Characterisation
I&APs Interested and Affected Parties
IRIS Integrated Risk Information System
LPG Liquefied Petroleum Gas
mamsl Meters above mean sea level
MEI Maximally Exposed Individual
MM5 Fifth-Generation Penn State/NCAR Mesoscale Model
NAAQS National Ambient Air Quality Standard(s)
NCAR National Center for Atmospheric Research
NDCR(s) National Dust Control Regulation(s)
NEM:AQA National Environmental Management: Air Quality Act 2004
NPI National Pollutant Inventory
PM Particulate Matter
RELs Reference Exposure Levels
RfC(s) Reference Concentration(s)
RoM Run of Mine
SA South African
SABS South African Bureau of Standards
SLR SLR Consulting Africa (Pty) Ltd
SP(s) Stockpile(s)

Air Quality Specialist Impact Assessment Report for the proposed Commissiekraal Coal Mine
Report No.: 13SLR02 Final v2 v
SRTM Shuttle Radar Topography Mission
TCEQ Texas Commission on Environmental Quality
Tholie Logistics Tholie Logistics (Pty) Ltd
TSP Total Suspended Particulates
URFs Unit Risk Factors
US EPA United States Environmental Protection Agency
USGS United States Geological Survey
VKT Vehicle Kilometers Travelled
WHO World Health Organisation

Air Quality Specialist Impact Assessment Report for the proposed Commissiekraal Coal Mine
Report No.: 13SLR02 Final v2 vi
Glossary
Air pollution(a) The presence of substances in the atmosphere, particularly those that do not occur naturally
Dispersion(a) The spreading of atmospheric constituents, such as air pollutants
Dust(a) Solid materials suspended in the atmosphere in the form of small irregular particles, many of which are microscopic in size
Instability(a) A property of the steady state of a system such that certain disturbances or perturbations introduced into the steady state will increase in magnitude, the maximum perturbation amplitude always remaining larger than the initial amplitude
Mechanical mixing(a) Any mixing process that utilizes the kinetic energy of relative fluid motion
Oxides of nitrogen (NOx)
The sum of nitrogen oxide (NO) and nitrogen dioxide (NO2) expressed as nitrogen dioxide (NO2)
Particulate matter (PM)
Total particulate matter, that is solid matter contained in the gas stream in the solid state as well as insoluble and soluble solid matter contained in entrained droplets in the gas stream
PM2.5 Particulate Matter with an aerodynamic diameter of less than 2.5 µm
PM10 Particulate Matter with an aerodynamic diameter of less than 10 µm
Stability(a) The characteristic of a system if sufficiently small disturbances have only small effects, either decreasing in amplitude or oscillating periodically; it is asymptotically stable if the effect of small disturbances vanishes for long time periods
Notes:
(a) Definition from American Meteorological Society’s glossary of meteorology (AMS, 2014)

Air Quality Specialist Impact Assessment Report for the proposed Commissiekraal Coal Mine
Report No.: 13SLR02 Final v2 vii
Symbols and Units
°C Degree Celsius
C Carbon
CH4 Methane
C6H6 Benzene
CO Carbon monoxide
CO2 Carbon dioxide
DPM Diesel particulate matter
g Gram(s)
g/VKT Grams per vehicle kilometre travelled
HC(s) Hydrocarbon(s)
H2S Hydrogen sulfide
kg Kilograms
1 kilogram 1 000 grams
kg/kWh Kilogram(s) per kilowatt hour
km Kilometre(s)
1 kilometre 1 000 metres
kW Kilowatt
1 kilowatt 1 000 watts
m Meter(s)
m² Square meter(s)
m/s Meters per second
µg Microgram
1 microgram 1x10⁻⁶ grams
µg/m³ Micrograms per square meter
mg Milligram
1 milligram 0.001 grams
mg/m²/day Milligrams per square meter per day
Mg Megagram
1 Mg 1 000 000 grams
m² Square meter
mm Millimetres
1 millimetre 0.001 metres
Mtpa Megatonnes per annum
1 Mtpa 1 000 000 tonnes
MW MegaWatt
1 MW 1 000 000 watts
N2 Nitrogen
N2O Nitrous oxide
NO Nitrogen oxide

Air Quality Specialist Impact Assessment Report for the proposed Commissiekraal Coal Mine
Report No.: 13SLR02 Final v2 viii
NO2 Nitrogen dioxide
NOx Oxides of nitrogen
O3 Ozone
PAH(s) Polycyclic aromatic hydrocarbon(s)
Pb Lead
PM2.5 Inhalable particulate matter
PM10 Thoracic particulate matter
SO2 Sulphur dioxide
tpa Tonnes per annum
1 tonne 1 000 000 grams
VOC(s) Volatile organic compound(s)

Air Quality Specialist Impact Assessment Report for the proposed Commissiekraal Coal Mine
Report No.: 13SLR02 Final v2 ix
Executive Summary
Tholie Logistics (Pty) Ltd (Tholie Logistics) proposes to develop a new underground coal mine and related surface
infrastructure to support a mining operation on the farm Commissiekraal 90HT. The mine will be located approximately
28 km north of Utrecht in the eMadlangeni Local Municipality and the Amajuba District Municipality, KwaZulu-Natal Province,
South Africa. Airshed Planning Professionals (Pty) Ltd (Airshed) was appointed SLR Consulting Africa (Pty) Ltd (SLR) to
conduct an air specialist study for the proposed Commissiekraal Coal Mine (CCM). The main objective of the air quality
study was to determine potential air quality related impacts associated with the proposed CCM on the surrounding
environment and human health.
Apart from reviewing interested and/or affected party (I&AP) comments received by the environmental impact assessment
(EIA) consultant during the EIA process, no other consultation with the public was part of the air quality study.
As is typical of an air quality impact assessment, the study included: a review of proposed project activities in order to
identify sources of emissions and associated pollutants emitted; a study of regulatory requirements and health
thresholds for identified key pollutants; a study of the receiving environment in the vicinity of the project; the compilation
of a comprehensive emissions inventory for the operational phase of the project, atmospheric dispersion modelling to
simulate ambient air pollutant concentrations and dustfall rates as a result of the CCM, a screening assessment to
determine compliance with air quality criteria; and the compilation of a comprehensive air quality specialist report
detailing the study approach, limitations, assumption, results and recommendations of mitigation and management of air
quality impacts.
Pollutants included in the assessment are particulate matter (PM), diesel particulate matter (DPM), carbon monoxide (CO),
nitrogen dioxide (NO2), sulfur dioxide (SO2) and volatile organic compounds (VOCs). Impacts associated with emissions
were quantified, taking into account: unmitigated operations; mitigation measures that form part of the CCM design; as well
as additional mitigation.
The main conclusion is that the proposed CCM operations are likely to result in exceedances of the NAAQS for PM2.5, PM10
and the NDCRs for dustfall at sensitive receptors located near the mine boundary with no mitigation in place. With the
design mitigation measures in place (water sprays on unpaved roads, at crushers, screens, product materials handling
points and the product stockpile), the area of impact would reduce significantly but it is still unlikely to result in compliance
to national standards and regulations at sensitive receptors, especially on a cumulative basis. Hooding combined with fabric
filters at the crushers and screens instead of water sprays, as well as additional water sprays on the unpaved roads and at
the stockpiles, are likely to reduce the impact area where the standards and regulations are exceeded to only one on-site
receptor and not off-site.
The environmental significance of the project operations is high without mitigation applied, medium-high with design
mitigation and medium with additional mitigation applied. The change from high to medium environmental significance would
advocate the use of additional mitigation measures, specifically on the access road where the environmental significance at
the sensitive receptors within 210 m from the road edge is high.
Recommendations included:
Water sprays on unpaved road surfaces should achieve at least 75% control efficiency (CE);
Water sprays at product materials handling points and product stockpile to achieve 50% CE;
Hooding with fabric filters at crusher and screen (to achieve up to 83% CE);
The diesel generator should be fitted with a low NOx burner; and
Dustfall; ambient PM10 and PM2.5 sampling.

Air Quality Specialist Impact Assessment Report for the proposed Commissiekraal Coal Mine
Report No.: 13SLR02 Final v2 x
Table of Contents
1 Introduction.................................................................................................................................................................... 1-1
1.1 Consultation Process ........................................................................................................................................... 1-1
1.2 Scope of Work ..................................................................................................................................................... 1-1
1.3 Description of Project Activities from an Air Quality Perspective ......................................................................... 1-3
1.4 Approach and Methodology ................................................................................................................................. 1-5
1.4.1 Project Information and Activity Review ......................................................................................................... 1-6
1.4.2 The Identification of Regulatory Requirements and Health Thresholds ......................................................... 1-6
1.4.3 Study of the Receiving Environment ............................................................................................................... 1-6
1.4.4 Determining the Impact of the Project on the Receiving Environment ........................................................... 1-6
1.4.5 Compliance Assessment and Health Risk Screening ..................................................................................... 1-7
1.4.6 The Development of an Air Quality Management Plan ................................................................................... 1-7
1.5 Assumptions, Exclusions and Limitations ............................................................................................................ 1-7
2 Regulatory Requirements and Assessment Criteria ..................................................................................................... 2-1
2.1 Ambient Air Quality Standards for Criteria Pollutants .......................................................................................... 2-1
2.1.1 SA National Ambient Air Quality Standards .................................................................................................... 2-1
2.2 Inhalation Health Criteria and Unit Risk Factors for Non-criteria Pollutants ........................................................ 2-1
2.3 Dust Control Regulations ..................................................................................................................................... 2-2
2.4 Screening criteria for animals and vegetation ..................................................................................................... 2-3
3 Description of the Receiving/Baseline Environment...................................................................................................... 3-1
3.1 Air Quality Sensitive Receptors ........................................................................................................................... 3-1
3.2 Atmospheric Dispersion Potential ........................................................................................................................ 3-3
3.2.1 Topography and Land-use .............................................................................................................................. 3-3
3.2.2 Surface Wind Field ......................................................................................................................................... 3-3
3.2.3 Temperature ................................................................................................................................................... 3-6
3.2.4 Rainfall ............................................................................................................................................................ 3-7
3.2.5 Atmospheric Stability and Mixing Depth ......................................................................................................... 3-8
3.3 Existing Sources of Air Pollution in the Area ....................................................................................................... 3-9
3.3.1 Miscellaneous Fugitive Dust Sources ............................................................................................................. 3-9
3.3.2 Vehicle Tailpipe Emissions ............................................................................................................................. 3-9
3.3.3 Household Fuel Burning ................................................................................................................................. 3-9

Air Quality Specialist Impact Assessment Report for the proposed Commissiekraal Coal Mine
Report No.: 13SLR02 Final v2 xi
3.3.4 Biomass Burning ............................................................................................................................................. 3-9
3.3.5 Agriculture ..................................................................................................................................................... 3-10
3.4 Status Quo Ambient Air Quality ......................................................................................................................... 3-10
4 Impact of CCM on the Receiving Environment ............................................................................................................. 4-1
4.1 Atmospheric Emissions ....................................................................................................................................... 4-1
4.1.1 Construction Phase ........................................................................................................................................ 4-1
4.1.2 Operational Phase .......................................................................................................................................... 4-2
4.1.3 Decommissioning and Closure Phases .......................................................................................................... 4-8
4.1.4 Post-closure Phase ......................................................................................................................................... 4-8
4.2 Screening of Simulated Human Health Impacts (Incremental and Cumulative) .................................................. 4-9
4.2.1 Construction Phase ........................................................................................................................................ 4-9
4.2.2 Operational Phase .......................................................................................................................................... 4-9
4.2.3 Decommissioning and Closure Phase .......................................................................................................... 4-26
4.2.4 Post Closure Phase ...................................................................................................................................... 4-26
4.3 Analysis of Emissions’ Impact on the Environment (Dustfall) (Incremental and Cumulative) ........................... 4-26
4.3.1 Construction Phase ...................................................................................................................................... 4-26
4.3.2 Operational Phase ........................................................................................................................................ 4-26
4.3.3 Decommissioning and Closure Phases ........................................................................................................ 4-29
4.3.4 Post Closure Phase ...................................................................................................................................... 4-29
4.4 Impact Significance Rating ................................................................................................................................ 4-29
5 Recommended Air Quality Management Measures...................................................................................................... 5-1
5.1 Air Quality Management Objectives .................................................................................................................... 5-1
5.2 Source Ranking ................................................................................................................................................... 5-1
5.2.1 Ranking of Sources by Emissions .................................................................................................................. 5-1
5.2.2 Ranking of Sources by Impact ........................................................................................................................ 5-1
5.3 Source Specific Recommended Management and Mitigation Measures ............................................................ 5-1
5.4 Performance Indicators ....................................................................................................................................... 5-6
5.4.1 Performance Indicators ................................................................................................................................... 5-6
5.4.2 Specification of Source Based Performance Indicators .................................................................................. 5-6
5.4.3 Receptor based Performance Indicators ........................................................................................................ 5-6
5.4.4 Ambient Air Quality Monitoring ....................................................................................................................... 5-7
5.5 Record-keeping, Environmental Reporting and Community Liaison ................................................................... 5-9

Air Quality Specialist Impact Assessment Report for the proposed Commissiekraal Coal Mine
Report No.: 13SLR02 Final v2 xii
5.5.1 Periodic Inspections and Audits ...................................................................................................................... 5-9
5.5.2 Liaison Strategy for Communication with Interested and Affected Parties (I&APs) ........................................ 5-9
5.5.3 Management Costs ......................................................................................................................................... 5-9
6 Residual Air Quality Impacts ......................................................................................................................................... 6-1
6.1 Additionally Mitigated Atmospheric Emissions .................................................................................................... 6-1
6.2 Screening of Simulated Additionally Mitigated Human Health Impacts ............................................................... 6-2
6.2.1 PM2.5 ............................................................................................................................................................... 6-2
6.2.2 PM10 ................................................................................................................................................................ 6-5
6.3 Analysis of Additionally Mitigated Emissions’ Impact on the Environment (Dustfall) ........................................... 6-5
6.4 Impact Significance Rating .................................................................................................................................. 6-9
7 Conclusions and Recommendations ............................................................................................................................. 7-1
7.1 Main Conclusions ................................................................................................................................................ 7-1
7.2 Recommendations ............................................................................................................................................... 7-1
8 References .................................................................................................................................................................... 8-1
9 Appendix A: Emissions Quantification Methodology ..................................................................................................... 9-1
9.1 Fugitive Dust Emission Estimation ...................................................................................................................... 9-1
9.1.1 Vehicle entrained dust from unpaved roads ................................................................................................... 9-1
9.1.2 Materials handling ........................................................................................................................................... 9-1
9.1.3 Crushing and screening .................................................................................................................................. 9-2
9.1.4 Ventilation ....................................................................................................................................................... 9-2
9.1.5 Wind Erosion .................................................................................................................................................. 9-3
9.2 Vehicle Exhausts ................................................................................................................................................. 9-6
10 Appendix B: Description of Suitable Additional Pollution Abatement Measures ......................................................... 10-1
10.1 Crushing ............................................................................................................................................................ 10-1
11 Appendix C: Impact Significance Methodology ........................................................................................................... 11-1
12 Appendix D: Air Quality Sensitive Receptors’ Locations ............................................................................................. 12-1
13 Appendix E: Exceedence Tables ................................................................................................................................ 13-1
14 Appendix F: Dust Effects On Vegetation And Animals................................................................................................ 14-1
14.1 Dust Effects on Vegetation ................................................................................................................................ 14-1
14.2 Dust Effects on Animals .................................................................................................................................... 14-2
15 Appendix G: Curriculum Vitae of Author ..................................................................................................................... 15-1

Air Quality Specialist Impact Assessment Report for the proposed Commissiekraal Coal Mine
Report No.: 13SLR02 Final v2 xiii
List of Tables
Table 1-1: Air emissions and pollutants associated with the underground mining ................................................................. 1-5
Table 1-2: Air emissions and pollutants associated with surface operations .......................................................................... 1-5
Table 2-1: National Ambient Air Quality Standards for criteria pollutants ............................................................................... 2-1
Table 2-2: Chronic and acute inhalation screening criteria and cancer unit risk factors ......................................................... 2-2
Table 2-3: South African National Dust Control Regulations .................................................................................................. 2-3
Table 3-1: Minimum, maximum and average temperatures in °C (MM5 data, 2011 to 2013) ............................................... 3-7
Table 3-2: Monthly rainfall for CCM (MM5 data, 2011 to 2013) .............................................................................................. 3-8
Table 4-1: Typical fugitive dust impacts and associated activities during construction of the CCM’s infrastructure ............... 4-1
Table 4-2: Emissions from unmitigated and mitigated construction activities ......................................................................... 4-2
Table 4-3: Activities, aspects and their associated assumptions for the proposed operations at CCM for emissions inventory
calculations ............................................................................................................................................................................. 4-5
Table 4-4: Summary of estimated particulate emission rates and contributions for the proposed operational phase ............ 4-6
Table 4-5: Summary of estimated gaseous emission rates for the proposed operational phase ........................................... 4-8
Table 4-6: Activities and aspects identified for the decommissioning phase of operations .................................................... 4-8
Table 4-7: Impact assessment summary table for the construction phase for CCM ............................................................ 4-29
Table 4-8: Impact assessment summary table for the operational phase for CCM .............................................................. 4-29
Table 4-9: Impact assessment summary table for the closure phase for CCM .................................................................... 4-30
Table 5-1: Air Quality Management Plan: construction phase of the proposed CCM............................................................. 5-3
Table 5-2: Air Quality Management Plan: operational phase of the proposed CCM .............................................................. 5-4
Table 5-3: Air Quality Management Plan: decommissioning and closure phase (rehabilitation activities) for the proposed
CCM ........................................................................................................................................................................................ 5-5
Table 6-1: Mitigation measures recommended and accounted for in the residual air quality impact assessment ................. 6-1
Table 6-2: Summary of estimated particulate emission rates for the proposed additionally mitigated operational phase ...... 6-1
Table 6-3: Impact assessment summary table for the operational phase for CCM ................................................................ 6-9
Table 9-1: Emission factors for metallic minerals crushing and screening ............................................................................. 9-2
Table 9-2: SA occupational exposure limits (OEL) ................................................................................................................. 9-2
Table 9-3: Vehicle exhaust emission factors .......................................................................................................................... 9-6
Table 11-1: Criteria for assessment of impacts .................................................................................................................... 11-1
Table 12-1: Location of points of interest near CCM ............................................................................................................ 12-1
Table 13-1: Unmitigated operational phase .......................................................................................................................... 13-1

Air Quality Specialist Impact Assessment Report for the proposed Commissiekraal Coal Mine
Report No.: 13SLR02 Final v2 xiv
Table 13-2: Design mitigated operational phase .................................................................................................................. 13-2
Table 13-3: Additionally mitigated operational phase ........................................................................................................... 13-4

Air Quality Specialist Impact Assessment Report for the proposed Commissiekraal Coal Mine
Report No.: 13SLR02 Final v2 xv
List of Figures
Figure 1-1: Regional setting of project area ............................................................................................................................ 1-2
Figure 1-2: Local setting of project area ................................................................................................................................. 1-3
Figure 1-3: CCM surface infrastructure layout ........................................................................................................................ 1-4
Figure 3-1: Nearby AQSRs ..................................................................................................................................................... 3-2
Figure 3-2: Topography of study area..................................................................................................................................... 3-3
Figure 3-3: Period average wind rose (MM5 data, 2012 to 2014) .......................................................................................... 3-4
Figure 3-4: Day-time and night-time wind roses (MM5 data, 2012 to 2014) ........................................................................... 3-5
Figure 3-5: Seasonal wind roses (MM5 data, 2012 to 2014) .................................................................................................. 3-6
Figure 3-6: Diurnal monthly average temperature profile (MM5 data, 2012 to 2014) ............................................................. 3-7
Figure 3-7: Diurnal atmospheric stability (MM5 Data, 2011 - 2013) ....................................................................................... 3-8
Figure 4-1: Unmitigated operational phase - PM2.5 annual average ground level concentrations transect for the access road
................................................................................................................................................................................................ 4-9
Figure 4-2: Unmitigated operational phase - Frequency of exceedance of the SA NAAQ limit of 40 µg/m³ for daily average
PM2.5 concentrations transect for the access road ............................................................................................................... 4-10
Figure 4-3: Unmitigated operational phase – PM10 annual average ground level concentrations transect for the access road
.............................................................................................................................................................................................. 4-10
Figure 4-4: Unmitigated operational phase - Frequency of exceedance of the SA NAAQ limit of 75 µg/m³ for daily average
PM10 concentrations transect for the access road ................................................................................................................ 4-10
Figure 4-5: Unmitigated operational phase - Frequency of exceedance of the SA NAAQ limit of 40 µg/m³ for daily average
PM2.5 concentrations ............................................................................................................................................................. 4-12
Figure 4-6: Unmitigated operational phase - Area of exceedance of the SA NAAQS for annual average PM2.5 concentrations
.............................................................................................................................................................................................. 4-13
Figure 4-7: Design mitigated operational phase - Frequency of exceedance of the SA NAAQ limit of 40 µg/m³ for daily
average PM2.5 concentrations ............................................................................................................................................... 4-14
Figure 4-8: Design mitigated operational phase - Area of exceedance of the SA NAAQS for annual average PM2.5
concentrations....................................................................................................................................................................... 4-15
Figure 4-9: Unmitigated operational phase - Frequency of exceedance of the SA NAAQ limit of 75 µg/m³ for daily average
PM10 concentrations .............................................................................................................................................................. 4-17
Figure 4-10: Unmitigated operational phase - Area of exceedance of the SA NAAQS for annual average PM10
concentrations....................................................................................................................................................................... 4-18
Figure 4-11: Design mitigated operational phase - Frequency of exceedance of the SA NAAQ limit of 75 µg/m³ for daily
average PM10 concentrations ................................................................................................................................................ 4-19

Air Quality Specialist Impact Assessment Report for the proposed Commissiekraal Coal Mine
Report No.: 13SLR02 Final v2 xvi
Figure 4-12: Design mitigated operational phase - Area of exceedance of the SA NAAQS for annual average PM10
concentrations....................................................................................................................................................................... 4-20
Figure 4-13: Unmitigated operational phase - Area of exceedance of the IRIS RfC for annual average DPM concentrations 4-
23
Figure 4-14: Unmitigated operational phase - Frequency of exceedance of the SA NAAQ limit of 200 µg/m³ for hourly NO2
concentrations....................................................................................................................................................................... 4-24
Figure 4-15: Unmitigated operational phase - Area of exceedance of the SA NAAQS for annual average NO2 concentrations
.............................................................................................................................................................................................. 4-25
Figure 4-16: Predicted unmitigated operational phase daily dustfall rates (SA NDCR residential limit is 600 mg/m²/day) .. 4-27
Figure 4-17: Predicted design mitigated operational phase daily dustfall rates (SA NDCR residential limit is 600 mg/m²/day)
.............................................................................................................................................................................................. 4-28
Figure 5-1: Proposed monitoring network for the proposed operations at the CCM ............................................................... 5-8
Figure 6-1: Additionally mitigated operational phase - Frequency of exceedance of the SA NAAQ limit of 40 µg/m³ for daily
average PM2.5 concentrations ................................................................................................................................................. 6-3
Figure 6-2: Additionally mitigated operational phase - Area of exceedance of the SA NAAQS for annual average PM2.5
concentrations......................................................................................................................................................................... 6-4
Figure 6-3: Additionally mitigated operational phase - Frequency of exceedance of the SA NAAQ limit of 75 µg/m³ for daily
average PM10 concentrations .................................................................................................................................................. 6-6
Figure 6-4: Additionally mitigated operational phase - Area of exceedance of the SA NAAQS for annual average PM10
concentrations......................................................................................................................................................................... 6-7
Figure 6-5: Predicted additionally mitigated operational phase daily dustfall rates (SA NDCR residential limit is 600
mg/m²/day) .............................................................................................................................................................................. 6-8
Figure 9-1: Relationship between particle sizes and threshold friction velocities using the calculation method proposed by
Marticorena and Bergametti (1995). ....................................................................................................................................... 9-5
Figure 9-2: Contours of normalised surface wind speeds (i.e. surface wind speed/ approach wind speed) (after US EPA,
1996). ...................................................................................................................................................................................... 9-6

Air Quality Specialist Impact Assessment Report for the proposed Commissiekraal Coal Mine
Report No.: 13SLR02 Final v2 1-1
Air Quality Specialist Impact Assessment Report for the proposed Commissiekraal Coal Mine
1 INTRODUCTION
Tholie Logistics (Pty) Ltd (Tholie Logistics) proposes to develop a new underground coal mine and related surface
infrastructure to support a mining operation on the farm Commissiekraal 90HT. The mine will be located approximately
28 km north of Utrecht in the eMadlangeni Local Municipality and the Amajuba District Municipality, KwaZulu-Natal Province,
South Africa (Figure 1-1).
Airshed Planning Professionals (Pty) Ltd (Airshed) was appointed SLR Consulting Africa (Pty) Ltd (SLR) to conduct an air
specialist study for the proposed Commissiekraal Coal Mine (CCM). The main objective of the air quality study was to
determine potential air quality related impacts associated with the proposed CCM on the surrounding environment and
human health.
1.1 Consultation Process
Apart from reviewing interested and/or affected party (I&AP) comments received by the environmental impact assessment
(EIA) consultant during the EIA process, no other consultation with the public was part of the air quality study.
1.2 Scope of Work
As is typical of an air quality impact assessment, the following tasks were included in the study:
A review of proposed project activities in order to identify sources of emission and associated pollutants emitted.
A study of regulatory requirements and health thresholds for identified key pollutants against which
compliance would be assessed and health risks screened.
A study of the receiving environment in the vicinity of the project; including:
o The identification of potential air quality sensitive receptors (AQSRs);
o A study of the atmospheric dispersion potential of the area taking into consideration local meteorology,
land-use and topography; and
o The analysis of all available ambient air quality information/data to determine pre-development ambient
pollutant levels and dustfall rates.
The compilation of a comprehensive emissions inventory which included:
o Fugitive dust emissions from construction phase, operational phase and decommissioning phase
activities;
o Combustion emissions (particulate matter (PM) and gaseous pollutants) during the operational phase;
Atmospheric dispersion modelling to simulate ambient air pollutant concentrations and dustfall rates as a result
of the project.
A screening assessment to determine:
o Compliance of criteria pollutants with ambient air quality standards;
o Potential health risks as a result of exposure to non-criteria pollutants; and
o Nuisance dustfall
The compilation of a comprehensive air quality specialist report detailing the study approach, limitations,
assumption, results and recommendations of mitigation and management of air quality impacts.

Air Quality Specialist Impact Assessment Report for the proposed Commissiekraal Coal Mine
Report No.: 13SLR02 Final v2 1-2
Figure 1-1: Regional setting of project area

Air Quality Specialist Impact Assessment Report for the proposed Commissiekraal Coal Mine
Report No.: 13SLR02 Final v2 1-3
1.3 Description of Project Activities from an Air Quality Perspective
The local setting of the CCM is shown in Figure 1-2 and the surface infrastructure layout is shown in Figure 1-3.
Figure 1-2: Local setting of project area
The CCM will consist of an underground mine and a mobile crushing and screening plant. The project includes the mining,
handling and transportation of run of mine (RoM) coal, crushing and screening of RoM coal and transportation of the product
along unpaved roads to final customer or a regional railway siding. In addition to these operations CCM will operate a
stationary diesel generator as a power supply. This source is unlikely to change the dust (dustfall, PM10 and PM2.5) impact
areas significantly and thus updated model runs were only completed for sulfur dioxide (SO2), carbon monoxide (CO),
nitrogen dioxide (NO2), volatile organic compounds (VOCs) and diesel particulate matter (DPM).

Air Quality Specialist Impact Assessment Report for the proposed Commissiekraal Coal Mine
Report No.: 13SLR02 Final v2 1-4
Figure 1-3: CCM surface infrastructure layout
The underground mining broadly encompasses the following processes that may result in atmospheric emissions through
the ventilation shaft:
drilling and blasting of coal;
coal handling and transportation;
The surface operations broadly encompass the following processes that may result in atmospheric emissions:
RoM coal stockpiling and handling at the surface;

Air Quality Specialist Impact Assessment Report for the proposed Commissiekraal Coal Mine
Report No.: 13SLR02 Final v2 1-5
crushing and screening of coal;
product handling and transportation;
wind erosion of stockpiles; and
stationary diesel generator.
The potential air emissions that may result from the operations are dependent on the nature of the source material itself
(Table 1-1 and Table 1-2).
Table 1-1: Air emissions and pollutants associated with the underground mining
Details Activities Pollutants
Ventilation shaft
Drilling and blasting operations Mainly total suspended particulates (TSP), particulate matter with an aerodynamic diameter of less than 10 µm (PM10) and particulate matter with an aerodynamic diameter of less than 2.5 µm (PM2.5), but blasting emissions including oxides of nitrogen (NOx), carbon dioxide (CO2), CO, SO2, methane (CH4), hydrogen sulphide (H2S) and particulates
Transportation of coal underground - wheel entrainment and exhaust gas
Mainly TSP, PM10 and PM2.5, but vehicle tailpipe emissions including NOx, CO2, CO, SO2, CH4, nitrous oxide (N2O), VOCs and particulates
Materials handling operations TSP, PM10 and PM2.5
Table 1-2: Air emissions and pollutants associated with surface operations
Details Activities Pollutants
Coal at shaft decline Conveyer transfer operations TSP, PM10 and PM2.5
Coal transfer at the RoM stockpile Offloading and reclaiming
Wheel entrainment and exhaust gas
Mainly TSP, PM10 and PM2.5, but vehicle tailpipe emissions including NOx, CO2, CO, SO2, CH4, N2O, VOCs and particulates
Coal storage Wind erosion TSP, PM10 and PM2.5
Crushers and screens Primary crushing and screening TSP, PM10 and PM2.5
Product storage Stacking and reclaiming
Wind erosion
TSP, PM10 and PM2.5
Product loading and transport Tipping operations
Wheel entrainment and exhaust gas
Mainly TSP, PM10 and PM2.5, but vehicle tailpipe emissions including NOx, CO2, CO, SO2, CH4, N2O, VOCs and particulates
Diesel generator Power generation TSP, PM10 and PM2.5, but mainly DPM and gaseous emissions including NOx, CO2, CO, SO2, CH4, N2O and VOCs
1.4 Approach and Methodology
The approach to, and methodology followed in the completion of tasks as part of the scope of work are discussed in this
section.

Air Quality Specialist Impact Assessment Report for the proposed Commissiekraal Coal Mine
Report No.: 13SLR02 Final v2 1-6
1.4.1 Project Information and Activity Review
All project/process related information referred to in this study was provided by SLR.
1.4.2 The Identification of Regulatory Requirements and Health Thresholds
In the evaluation of ambient air quality impacts and dustfall rates reference was made to:
South African National Ambient Air Quality Standards (SA NAAQS) as set out in the National Environmental
Management: Air Quality Act (Act No. 39 of 2004) (NEM:AQA) and South African National Dust Control
Regulations (SA NDCR); and,
Health risk screening levels for non-criteria pollutants published by the various internationally recognised
regulatory authorities.
1.4.3 Study of the Receiving Environment
Physical environmental parameters that influence the dispersion of pollutants in the atmosphere include terrain, land cover
and meteorology. Existing pre-development ambient air quality in the study area is also considered. Readily available terrain
and land cover data was obtained from the Atmospheric Studies Group (ASG) via the United States Geological Survey
(USGS) web site (ASG, 2011). Use was made of Shuttle Radar Topography Mission (SRTM) (90 m, 3 arc-sec) data and
Global Land Cover Characterisation (GLCC) data for Africa.
An understanding of the atmospheric dispersion potential of the area is essential to an air quality impact assessment. In the
absence of on-site meteorological data (which is required for atmospheric dispersion modelling), use was made of simulated
data for a period between 2012 and 2014. The MM5 (short for Fifth-Generation Penn State/NCAR Mesoscale Model) is a
regional mesoscale model used for creating weather forecasts and climate projections. It is a community model maintained
by Penn State University and the National Centre for Atmospheric Research (NCAR).
1.4.4 Determining the Impact of the Project on the Receiving Environment
The establishment of a comprehensive emission inventory formed the basis for the assessment of the air quality impacts
from the Project’s emissions on the receiving environment. In the quantification of emissions, use was made of emission
factors which associate the quantity of a pollutant to the activity associated with the release of that pollutant. Emissions were
calculated emission factors and equation such as those published by the United States Environmental Protection Agency
(US EPA) and Australian Environment in their National Pollutant Inventory (NPI) Emission Estimation Technique Manuals
(EETMs).
In the simulation of ambient air pollutant concentrations and dustfall rates use was made of the US EPA AERMOD
atmospheric dispersion modelling suite. AERMOD is a Gaussian plume model best used for near-field applications where
the steady-state meteorology assumption is most likely to apply. AERMOD is a model developed with the support of the
AMS/EPA Regulatory Model Improvement Committee (AERMIC), whose objective has been to include state-of the-art
science in regulatory models (Hanna, Egan, Purdum, & Wagler, 1999). AERMOD is a dispersion modelling system with
three components, namely: AERMOD (AERMIC dispersion model), AERMAP (AERMOD terrain pre-processor), and
AERMET (AERMOD meteorological pre-processor).

Air Quality Specialist Impact Assessment Report for the proposed Commissiekraal Coal Mine
Report No.: 13SLR02 Final v2 1-7
1.4.5 Compliance Assessment and Health Risk Screening
Compliance was assessed by comparing simulated ambient criteria pollutant concentrations (CO, NO2, PM2.5, PM10 and
SO2) and dustfall rates to selected ambient air quality and dustfall criteria. Health risk screening was done through the
comparison of simulated non-criteria pollutant concentrations (diesel particulate matter (DPM) and VOCs) to selected
inhalation screening levels.
1.4.6 The Development of an Air Quality Management Plan
The findings of the above components informed recommendations of air quality management measures, including mitigation
and monitoring.
1.5 Assumptions, Exclusions and Limitations
A number of assumptions had to be made resulting in certain limitations associated with the results. The most important
assumptions and limitations of the air quality impact assessment are:
This study only considered atmospheric emissions and impacts associated with CCM, and not any other
operations that may be located within the area.
No site specific particle size fraction, moisture or silt content data were available for various sources and use was
made of US EPA default values and values from similar operations in South Africa.
Only routine emissions for the proposed operations were simulated. All other operations will be continuous.
Dispersion models do not contain all the features of a real environmental system but contain the feature of interest
for the management issue or scientific problem to be solved (MFE, 2001). Gaussian plume models are generally
regarded to have an uncertainty range between -50% to 200%. It has generally been found that the accuracy of
off-the-shelf dispersion models improve with increased averaging periods. The accurate prediction of
instantaneous peaks are the most difficult and are normally performed with more complicated dispersion models
specifically fine-tuned and validated for the location. The duration of these short-term, peak concentrations are
often only for a few minutes and on-site meteorological data are then essential.
AERMOD cannot compute real time processes; average process throughputs were therefore used, even though
the nature of operations may change over the life of operations.
Gaseous emissions would result from vehicles, and underground blasting. Emission rates for combustion sources
are dependent on the amount of fuel used and for the vehicle emissions the type and size of vehicles used. Only
the total fuel use was available and thus only vehicle exhaust emissions were estimated and simulated. It was
assumed that 80% of the fuel will be used for underground operations and 20% for the surface operations.
Gaseous emissions from blasting are expected to have less of an impact than the vehicle exhaust due to the
infrequency of blasting operations.
Gaseous emissions from construction, decommissioning, closure and post-closure are expected to be minimal
compared to particulate emissions from operations associated with these phases.
Nitrogen monoxide (NO) is rapidly converted in the atmosphere into the much more toxic nitrogen dioxide (NO2).
The rate of this conversion process is determined by the rate of the physical processes of dispersion and mixing of
the plume and the chemical reaction rates as well as the local atmospheric ozone concentration.
o Nitrogen monoxide (NO) emissions are rapidly converted in the atmosphere into NO2. NO2 impacts
where calculated by AERMOD using the ozone limiting method assuming constant annual average
background ozone concentrations of 30 ppb from Zunckel, et al. (2004) and a NO2/NOx emission ratio of
0.2 (Howard, 1988).

Air Quality Specialist Impact Assessment Report for the proposed Commissiekraal Coal Mine
Report No.: 13SLR02 Final v2 1-8
o It was conservatively assumed that all NOx emitted from the generator is to be emitted as NO2.
In addition to mining and processing operations; CCM will operate a stationary diesel generator as a power supply.
This source is unlikely to change the dust (dustfall, PM10 and PM2.5) impact areas significantly and thus updated
model runs were only completed for sulfur dioxide (SO2), carbon monoxide (CO), nitrogen dioxide (NO2), volatile
organic compounds (VOCs) and diesel particulate matter (DPM).
The stack parameters were not available and thus use was made of the parameters for a similar diesel generator
operational in Africa.
A definitive location was not available; however, it was indicated that the diesel generator will likely be located
near the diesel storage area. A likely location near this area was selected.
In estimating increased lifetime cancer risk as a result of DPM, use was made of simulated annual average DPM
concentrations. This approach is conservative since it assumes an individual will be exposed to this concentration
constantly over a period of 70 years.
The estimation of greenhouse gases did not form part of the scope of this study.
The construction, decommissioning and closure phases are assessed qualitatively.
It was assumed that all processing operations will have ceased by the closure phase. The potential for impacts
during this phase will depend on the extent of rehabilitation efforts during closure and on features which will
remain. Information regarding the extent of rehabilitation procedures were limited and therefore not included in the
emissions inventory or the dispersion modelling.

Air Quality Specialist Impact Assessment Report for the proposed Commissiekraal Coal Mine
Report No.: 13SLR02 Final v2 2-1
2 REGULATORY REQUIREMENTS AND ASSESSMENT CRITERIA
2.1 Ambient Air Quality Standards for Criteria Pollutants
2.1.1 SA National Ambient Air Quality Standards
The South African Bureau of Standards (SABS) was engaged to assist the Department of Environmental Affairs (DEA, then
known as the Department of Environmental Affairs and Tourism or DEAT) in the facilitation of the development of ambient
air quality standards. This included the establishment of a technical committee to oversee the development of standards.
Standards were determined based on international best practice for PM10, PM2.5, dustfall, SO2, NO2, ozone (O3), CO, lead
(Pb) and benzene (C6H6).
The final revised SA NAAQS were published in the Government Gazette on 24 of December 2009 (DEA, 2009) and
included a margin of tolerance (i.e. frequency of exceedance) and implementation timelines linked to it. SA NAAQS for PM2.5
were published on 29 July 2012 (DEA, 2012). SA NAAQS referred to in this study are also given in Table 2-1.
Table 2-1: National Ambient Air Quality Standards for criteria pollutants
Pollutant Averaging
Period
Limit Values Frequency of Exceedance Compliance Date
Concentration (µg/m³) Occurrences per Year
CO 1 hour 30 000 88 Immediate
NO2 1 hour 200 88 Immediate
1 year 40 n/a Immediate
PM2.5
24 hour 60 4 Immediate – 31 December 2015
24 hour 40 4 1 January 2016 – 31 December 2029
24 hour 25 4 1 January 2030(b)
1 year 25 n/a Immediate – 31 December 2015
1 year 20 n/a 1 January 2016 – 31 December 2029
1 year 15 n/a 1 January 2030(b)
PM10 24 hour 75 4 1 January 2015
1 year 40 n/a 1 January 2015
SO2
1 hour 350 88 Immediate
24 hour 125 4 Immediate
1 year 50 n/a Immediate
O3 8 hours 120 11 Immediate
C6H6 1 year 5 n/a 1 January 2015
Notes:
(a) n/a – not applicable
(b) included as operations will likely continue beyond January 2030
2.2 Inhalation Health Criteria and Unit Risk Factors for Non-criteria Pollutants
The potential for health impacts associated with non-criteria pollutants emitted from mobile diesel combustion sources are
assessed according to guidelines published by the following institutions:

Air Quality Specialist Impact Assessment Report for the proposed Commissiekraal Coal Mine
Report No.: 13SLR02 Final v2 2-2
WHO air quality guidelines (AQGs) and cancer unit risk factors (URFs);
Inhalation reference concentrations (RfCs) and URFs published by the US EPA Integrated Risk Information
System (IRIS)
Reference Exposure Levels (RELs) and Cancer Potency Values (CPVs) published by the California Environmental
Protection Agency (CALEPA)
The Texas Commission on Environmental Quality (TCEQ)
Chronic inhalation criteria and URFs/CPVs for pollutants considered in the study are summarised in Table 2-2. Increased
lifetime cancer risk is calculated by applying the unit risk factors to predicted long term (annual average) pollutant
concentrations.
Table 2-2: Chronic and acute inhalation screening criteria and cancer unit risk factors
Pollutant Chronic Screening Criteria
(µg/m3)
Acute Screening Criteria
(µg/m3)
Inhalation URF/CPV
(µg/m3)-1
Diesel Exhaust as diesel particulate matter (DPM)
5 (US EPA IRIS) Not Specified 3x10-04 (CALEPA)
VOC (Diesel fuel used as indicator) 100 (TCEQ) Not Specified Not Specified
The identification of an acceptable cancer risk level has been debated for many years and it possibly will still continue as
societal norms and values change. Some people would easily accept higher risks than others, even if it were not within their
own control; others prefer to take very low risks. An acceptable risk is a question of societal acceptance and will therefore
vary from society to society. In spite of the difficulty to provide a definitive “acceptable risk level”, the estimation of a risk
associated with an activity provides the means for a comparison of the activity to other everyday hazards, and therefore
allowing risk-management policy decisions. Technical risk assessments seldom set the regulatory agenda because of the
different ways in which the non-technical public perceives risks. Consequently, science does not directly provide an answer
to the question.
Whilst it is perhaps inappropriate to make a judgment about how much risk should be acceptable, through reviewing
acceptable risk levels selected by other well-known organizations, it would appear that the US EPA’s application is the most
suitable, i.e. “If the risk to the maximally exposed individual (MEI) is no more than 1x10⁻⁶, then no further action is required.
If not, the MEI risk must be reduced to no more than 1x10⁻⁴, regardless of feasibility and cost, while protecting as many
individuals as possible in the general population against risks exceeding 1x10⁻⁶”.Some authorities tend to avoid the
specification of a single acceptable risk level. Instead a “risk-ranking system” is preferred.
2.3 Dust Control Regulations
South Africa has published the National Dust Control Regulations in November 2013 (Government Gazette No. 36974)
(DEA, 2013) with the purpose to prescribe general measures for the control of dust in all areas including residential and light
commercial areas. The acceptable dustfall rates as measured using the American Society of Testing and Materials (ASTM)
D1739:1970 (ASTM Standard D1739-70, 1998) or equivalent at and beyond the boundary of the premises where dust
originates are given in Table 2-3. It is important to note that dustfall is assessed for nuisance impact and not inhalation
health impact.

Air Quality Specialist Impact Assessment Report for the proposed Commissiekraal Coal Mine
Report No.: 13SLR02 Final v2 2-3
Table 2-3: South African National Dust Control Regulations
Restriction Area Dustfall Rate
(mg/m2-day) Permitted Frequency of Exceedence
Residential area D < 600 Two within a year, not sequential months
Non-residential area 600 < D < 1 200 Two within a year, not sequential months
2.4 Screening criteria for animals and vegetation
The impact of dust on vegetation and grazing quality may be a concern to I&APs. While there is little direct evidence of what
the impact of dust fall on vegetation is under a South African context, a review of European studies has shown the potential
for reduced growth and photosynthetic activity in sunflower and cotton plants exposed to dust fall rates greater than
400 mg/m²/day (Farmer, 1993). This is discussed in more detail in Appendix F.

Air Quality Specialist Impact Assessment Report for the proposed Commissiekraal Coal Mine
Report No.: 13SLR02 Final v2 3-1
3 DESCRIPTION OF THE RECEIVING/BASELINE ENVIRONMENT
3.1 Air Quality Sensitive Receptors
The CCM will be situated approximately 28 km north of the Utrecht. Current land uses within the vicinity of the CCM area are
agriculture, primarily livestock grazing with minor dryland crops, forestry (remnants and naturally occurring), conservation,
tourism and residential. There are a number of residences in the vicinity of the CCM site. Individual houses (private
farmsteads and rural homesteads) and community structures were included in this study as AQSRs (Figure 3-1 and Table
12-1).

Air Quality Specialist Impact Assessment Report for the proposed Commissiekraal Coal Mine
Report No.: 13SLR02 Final v2 3-2
Figure 3-1: Nearby AQSRs

Air Quality Specialist Impact Assessment Report for the proposed Commissiekraal Coal Mine
Report No.: 13SLR02 Final v2 3-3
3.2 Atmospheric Dispersion Potential
Physical and meteorological mechanisms govern the dispersion, transformation, and eventual removal of pollutants from the
atmosphere. The analysis of hourly average meteorological data is necessary to facilitate a comprehensive understanding of
the dispersion potential of the site. Parameters useful in describing the dispersion and dilution potential of the site i.e. wind
speed, wind direction, temperature and atmospheric stability, are subsequently discussed. In the absence of on-site
meteorological data (which is required for atmospheric dispersion modelling), use was made of simulated data for a period
between 2012 and 2014. The MM5 (short for Fifth-Generation Penn State/NCAR Mesoscale Model) is a regional mesoscale
model used for creating weather forecasts and climate projections. It is a community model maintained by Penn State
University and the National Centre for Atmospheric Research (NCAR).
3.2.1 Topography and Land-use
Terrain around the site has undulating mountains and flatter grasslands. The northern part of the farm is relatively flat and
low-lying. The western, southern and eastern parts of the farm are mountainous. Topographical data was included in
dispersion simulations. The terrain elevation of the study area ranges between 1 242 and 2 143 meters above mean sea
level (mamsl). The topography of the study area is shown in Figure 3-2.
Figure 3-2: Topography of study area
3.2.2 Surface Wind Field
The wind field determines both the distance of downward transport and the rate of dilution of pollutants. The generation of
mechanical turbulence is a function of the wind speed, in combination with the surface roughness. The wind field for the
study area is described with the use of wind roses. Wind roses comprise 16 spokes, which represent the directions from
which winds blew during a specific period. The colours used in the wind roses below, reflect the different categories of wind

Air Quality Specialist Impact Assessment Report for the proposed Commissiekraal Coal Mine
Report No.: 13SLR02 Final v2 3-4
speeds; the yellow area, for example, representing winds in between 5 and 7.5 m/s. The dotted circles provide information
regarding the frequency of occurrence of wind speed and direction categories. The frequency with which calms occurred,
i.e. periods during which the wind speed was below 1 m/s are also indicated.
The period wind rose for the period January 2012 to December 2014 is shown in Figure 3-3. Day-time and night-time wind
roses for the period January 2012 to December 2014 are provided in Figure 3-4. Seasonal wind roses for the period January
20121 to December 2014 are shown in Figure 3-5.
The wind field was dominated by winds from the west, east-north-east and north-east. Less frequent winds also occurred
from the north-westerly and south-westerly sectors. Calm conditions occurred 4% of the time. During the day, more frequent
winds at higher wind speeds occurred from the east-north-easterly and north-easterly sectors with almost 5.4% calm
conditions. Night-time airflow had less frequent winds from the east-north-easterly and north-easterly sectors and at lower
wind speeds with winds most frequently occurring from the westerly sectors. The percentage calm conditions decreased to
2.7%. Autumn and winter reflect the average prevailing wind direction as from the west. Summer and spring reflect the
average prevailing wind direction as from the east-north-east and north-east.
Figure 3-3: Period average wind rose (MM5 data, 2012 to 2014)

Air Quality Specialist Impact Assessment Report for the proposed Commissiekraal Coal Mine
Report No.: 13SLR02 Final v2 3-5
Day-time
Night-time
Figure 3-4: Day-time and night-time wind roses (MM5 data, 2012 to 2014)

Air Quality Specialist Impact Assessment Report for the proposed Commissiekraal Coal Mine
Report No.: 13SLR02 Final v2 3-6
Summer
(Dec - Feb)
Autumn
(Mar – May)
Winter
(Jun - Aug)
Spring
(Sep – Nov)
Figure 3-5: Seasonal wind roses (MM5 data, 2012 to 2014)
3.2.3 Temperature
Air temperature is important, both for determining the effect of plume buoyancy (the larger the temperature difference
between the plume and the ambient air, the higher a pollution plume is able to rise), and determining the development of the
mixing and inversion layers. Minimum, maximum and mean temperatures for the project area, as obtained from MM5 data,
are shown in Table 3-1. Diurnal monthly average temperatures shown provided in Figure 3-6.

Air Quality Specialist Impact Assessment Report for the proposed Commissiekraal Coal Mine
Report No.: 13SLR02 Final v2 3-7
Maximum, minimum and average temperatures were 28°C, -1°C and 14°C, respectively. The month of July experienced
lowest temperature of -1°C whereas the maximum temperature of 28°C occurred in January. Temperatures reach their
minimum just before sunrise and there maximum between midday and sunset.
Table 3-1: Minimum, maximum and average temperatures in °C (MM5 data, 2011 to 2013)
Jan Feb Mar Apr May Jun Jul Aug Sep Oct Nov Dec
Minimum 11 10 9 4 3 0 -1 0 2 4 5 9
Average 18 18 17 14 12 10 9 11 14 14 17 17
Maximum 28 28 26 26 24 19 19 23 25 26 28 28
Figure 3-6: Diurnal monthly average temperature profile (MM5 data, 2012 to 2014)
3.2.4 Rainfall
Rainfall represents an effective removal mechanism of atmospheric pollutants and is therefore frequently considered during
air pollution studies. Rain typically occurs primarily as storms and individual rainfall events can be intense. This creates an
uneven rainfall distribution over the wet season (November to April). Dust is generated by strong winds that sometimes
accompany these storms. This dust generally occurs in areas with dry soils and sparse vegetation. This area has a
unimodal rainfall pattern with a rainy season starting in November and ending in April, with maximum monthly rainfalls
occurring from December to March. The largest amount of rain falls during January (Table 3-2).

Air Quality Specialist Impact Assessment Report for the proposed Commissiekraal Coal Mine
Report No.: 13SLR02 Final v2 3-8
Table 3-2: Monthly rainfall for CCM (MM5 data, 2011 to 2013)
Monthly Rainfall (mm/hr)
Jan Feb March Apr May Jun Jul Aug Sep Oct Nov Dec
665.3 157.2 16.7 39.8 12.1 18.2 17.1 18.7 3.3 66.2 96.9 136.1
3.2.5 Atmospheric Stability and Mixing Depth
The new generation air dispersion models differ from the models traditionally used in a number of aspects, the most
important of which are the description of atmospheric stability as a continuum rather than discrete classes. The atmospheric
boundary layer properties are therefore described by two parameters; the boundary layer depth and the Monin-Obukhov
length, rather than in terms of the single parameter Pasquill Class.
The Monin-Obukhov length (LMo) provides a measure of the importance of buoyancy generated by the heating of the ground
and mechanical mixing generated by the frictional effect of the earth’s surface. Physically, it can be thought of as
representing the depth of the boundary layer within which mechanical mixing is the dominant form of turbulence generation
(CERC, 2004). The atmospheric boundary layer constitutes the first few hundred metres of the atmosphere. During daytime,
the atmospheric boundary layer is characterised by thermal turbulence due to the heating of the earth’s surface. Night-times
are characterised by weak vertical mixing and the predominance of a stable layer. These conditions are normally associated
with low wind speeds and lower dilution potential.
Diurnal variation in atmospheric stability, as calculated from on-site data, and described by the inverse Monin-Obukhov
length and the boundary layer depth is provided in Figure 3-7. The highest concentrations for ground level, or near-ground
level releases from non-wind dependent sources would occur during weak wind speeds and stable (night-time) atmospheric
conditions.
Figure 3-7: Diurnal atmospheric stability (MM5 Data, 2011 - 2013)

Air Quality Specialist Impact Assessment Report for the proposed Commissiekraal Coal Mine
Report No.: 13SLR02 Final v2 3-9
3.3 Existing Sources of Air Pollution in the Area
Land use in the region includes agriculture, primary livestock grazing with minor dryland crops, forestry, conservation,
tourism and residential. Expected sources of atmospheric emissions include:
Miscellaneous fugitive dust sources including vehicle entrainment on roads and wind-blown dust from open areas;
Gaseous and particulate emissions from vehicle exhaust emissions;
Gaseous and particulate emissions from household fuel burning;
Gaseous and particulate emissions from biomass burning (e.g. wild fires); and
Gaseous and particulate emissions from agriculture.
3.3.1 Miscellaneous Fugitive Dust Sources
Fugitive dust emissions may occur as a result of vehicle entrained dust from local paved and unpaved roads, and wind
erosion from open or sparsely vegetated areas. The extent of particulate emissions from the main roads will depend on the
number of vehicles using the roads and on the silt loading on the roadways. The extent, nature and duration of road-use
activity and the moisture and silt content of soils are required to be known in order to quantify fugitive emissions from this
source. The quantity of wind-blown dust is similarly a function of the wind speed, the extent of exposed areas and the
moisture and silt content of such areas
3.3.2 Vehicle Tailpipe Emissions
Air pollution from vehicle emissions may be grouped into primary and secondary pollutants. Primary pollutants are those
emitted directly into the atmosphere, and secondary are pollutants formed in the atmosphere as a result of chemical
reactions, such as hydrolysis, oxidation, or photochemical reactions. The significant primary pollutants emitted by vehicles
include CO2, CO, hydrocarbons (HCs), SO2, NOx, DPM and Pb. Secondary pollutants include: NO2, photochemical oxidants
(e.g. ozone), HCs, sulphur acids, sulphates, nitric acid, nitric acid and nitrate aerosols. Hydrocarbons emitted include
benzene, 1.2-butadiene, aldehydes and polycyclic aromatic hydrocarbons (PAH). Benzene represents an aromatic HC
present in petrol, with 85% to 90% of benzene emissions emanating from the exhaust and the remainder from evaporative
losses. Vehicle tailpipe emissions are localised sources and unlikely to impact far-field.
3.3.3 Household Fuel Burning
Energy use within the residential sector is given as falling within three main categories, viz.: (i) traditional - consisting of
wood, dung and bagasse, (ii) transitional - consisting of coal, paraffin and liquefied petroleum gas (LPG), and (iii) modern -
consisting of electricity and, increasingly, renewable energy. The typical universal trend is given as being from (i) through (ii)
to (iii).
3.3.4 Biomass Burning
Biomass burning includes the burning of evergreen and deciduous forests, woodlands, grasslands, and agricultural lands.
Within the project vicinity fires may therefore represent a source of combustion-related emissions.
Biomass burning is an incomplete combustion process, with CO, methane and NO2 gases being emitted. Approximately
40% of the nitrogen in biomass is emitted as nitrogen (N2), 10% is left is the ashes, and it may be assumed that 20% of the
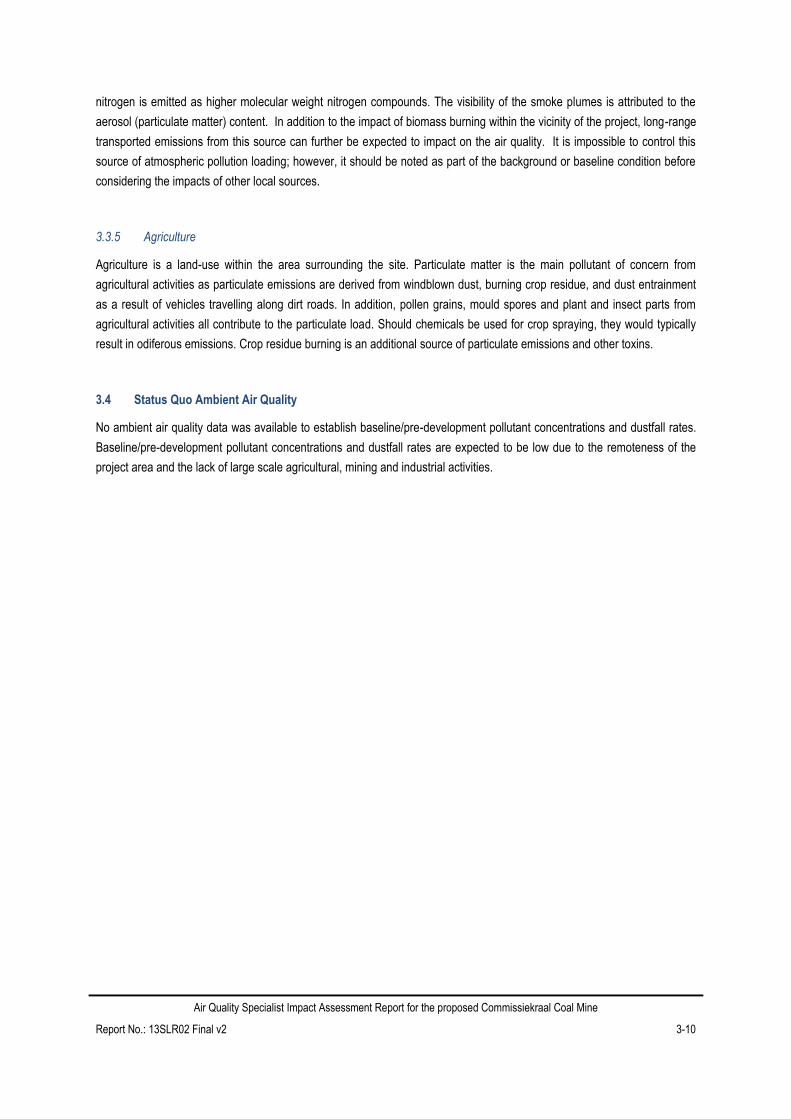
Air Quality Specialist Impact Assessment Report for the proposed Commissiekraal Coal Mine
Report No.: 13SLR02 Final v2 3-10
nitrogen is emitted as higher molecular weight nitrogen compounds. The visibility of the smoke plumes is attributed to the
aerosol (particulate matter) content. In addition to the impact of biomass burning within the vicinity of the project, long-range
transported emissions from this source can further be expected to impact on the air quality. It is impossible to control this
source of atmospheric pollution loading; however, it should be noted as part of the background or baseline condition before
considering the impacts of other local sources.
3.3.5 Agriculture
Agriculture is a land-use within the area surrounding the site. Particulate matter is the main pollutant of concern from
agricultural activities as particulate emissions are derived from windblown dust, burning crop residue, and dust entrainment
as a result of vehicles travelling along dirt roads. In addition, pollen grains, mould spores and plant and insect parts from
agricultural activities all contribute to the particulate load. Should chemicals be used for crop spraying, they would typically
result in odiferous emissions. Crop residue burning is an additional source of particulate emissions and other toxins.
3.4 Status Quo Ambient Air Quality
No ambient air quality data was available to establish baseline/pre-development pollutant concentrations and dustfall rates.
Baseline/pre-development pollutant concentrations and dustfall rates are expected to be low due to the remoteness of the
project area and the lack of large scale agricultural, mining and industrial activities.

Air Quality Specialist Impact Assessment Report for the proposed Commissiekraal Coal Mine
Report No.: 13SLR02 Final v2 4-1
4 IMPACT OF CCM ON THE RECEIVING ENVIRONMENT
4.1 Atmospheric Emissions
4.1.1 Construction Phase
The construction operations will include construction of the stockpile footprints, haul roads, conveyors, box-cut and surface
support infrastructure. The construction operations will not occur concurrently with mining operations. Construction
operations are planned to take place for 6 months.
Specific activities likely to result in air emissions are listed in Table 4-1.
Table 4-1: Typical fugitive dust impacts and associated activities during construction of the CCM’s infrastructure
Impact Source Activity
TSP, PM10 and PM2.5
Dust generation from earthworks
Drilling and blasting activities to establish box-cut
Clearing and grubbing and bulldozing activities
Soil excavation
Stockpiling of topsoil and other material
Disposal and treatment of contaminated soil
Dust generation from site development
Clearing of vegetation and topsoil
Vehicle entrained dust
Construction and use of new on-site roads, clearing of areas
Operation and movement of construction vehicles and machinery
Gases and particles
Vehicle and construction equipment activity
Tailpipe emissions from vehicles and construction equipment such as graders, scrapers and dozers
These activities normally comprise a series of different operations including land clearing, topsoil removal, road grading,
material loading and hauling, stockpiling, grading, bulldozing, compaction, (etc.). Each of these operations has their own
duration and potential for dust generation. It is anticipated that the extent of dust emissions would vary substantially from
day to day depending on the level of activity, the specific operations, and the prevailing meteorological conditions. This is in
contrast to most other fugitive dust sources where emissions are either relatively steady or follow a discernible annual cycle.
Due to the lack of detailed information, emissions from the construction activities were estimated on an area wide basis. This
approach estimates construction emissions for the entire affected area in the absence of detailed construction plans for the
project.
In the quantification of releases from the construction phase, use is made of emission factors published by the US EPA (US
EPA, 1996). The approximate emission factors for construction activity operations are given as:
ETSP = 2.69 Mg/hectare/month of activity
This emission factor is most applicable to construction operations with (i) medium activity levels, (ii) moderate silt contents,
and (iii) semi-arid climates and applies to TSP. Thus, it will result in conservatively high estimates when applied to PM10.
Also, because the derivation of the factor assumes that construction activity occurs 30 days per month, it is regarded as
conservatively high for TSP as well (US EPA, 1995). The emission factor does not provide an indication of which type of
activity during construction would result in the highest impacts. The calculated emissions from construction activities are

Air Quality Specialist Impact Assessment Report for the proposed Commissiekraal Coal Mine
Report No.: 13SLR02 Final v2 4-2
shown in Table 4-2 and are based on the entire surface infrastructure area. As fuel use or detailed fleet information was not
available for the construction phase, vehicle exhaust emissions resulting in gaseous emissions could not be calculated. It is
expected that the gaseous emissions will be slight compared to particulate emissions.
Mitigation measures to consider during the construction phase include water sprays on all cleared and graded areas; ensure
the distances between the topsoil removal and topsoil stockpiles are kept at a minimum and topsoil stockpiles vegetated.
The recommended mitigation measures are provided in Section 5. The calculated mitigated emissions from construction
activities are based on a 50% control efficiency (CE) due to the use of water sprays.
Table 4-2: Emissions from unmitigated and mitigated construction activities
Pollutant Unmitigated (tonnes per annum (tpa)) Mitigated (tpa)
PM2.5 21 10
PM10 41 21
TSP 118 59
4.1.2 Operational Phase
The proposed mining operations at the CCM will comprise a series of different operations. The main environmental impacts
associated with the surface operations are ventilation shaft, materials handling, crushing and screening, unpaved haul
roads; all contribute to the dust emissions.
An emissions inventory was completed for the surface operations for one scenario. Operational phase will be when access
road option 1 (Figure 1-3) is used.
Sources of atmospheric emission associated with the proposed operations at CCM are listed in Table 4-3 with relevant
information as used in the emissions calculations included. The emission factors and equations are provided in Appendix A
and a summary of the emission rates is provided in Table 4-4 and Table 4-5.
Emission rates were calculated for sources with given mitigation methods applied to the main sources. The mitigation
measures are based on the information provided.
4.1.2.1 Underground emissions: ventilation shaft
In the estimation of ventilation emission, use was made of the South African particulate matter Occupational Exposure
Limits (OEL). These were used to determine PM2.5, PM10 and TSP emission rates (Appendix A). Compared to the calculated
particulate emissions from underground vehicle exhausts, the emission rates for PM2.5, PM10 and TSP calculated using the
OELs are high; however, as a conservative approach these higher emissions rates were still used. Ventilation shaft (point
source) parameters are summarized in Table 4-3. Table 4-4 and Table 4-5 summarises the emission rates from ventilation
shafts.
4.1.2.2 Materials handling
The handling of ROM and coal product is potential significant sources of dust generation at the various transfer points
between the decline shaft, the stockpiles and the mobile crushing and screening plant. Conveyor transfer points also
constitute tipping points where dust emissions are generated. The quantity of dust generated depends on various climatic
parameters, such as wind speed and precipitation, in addition to non-climatic parameters such as the nature and volume of
the material handled. Fine particulates are most readily disaggregated and released to the atmosphere during the material
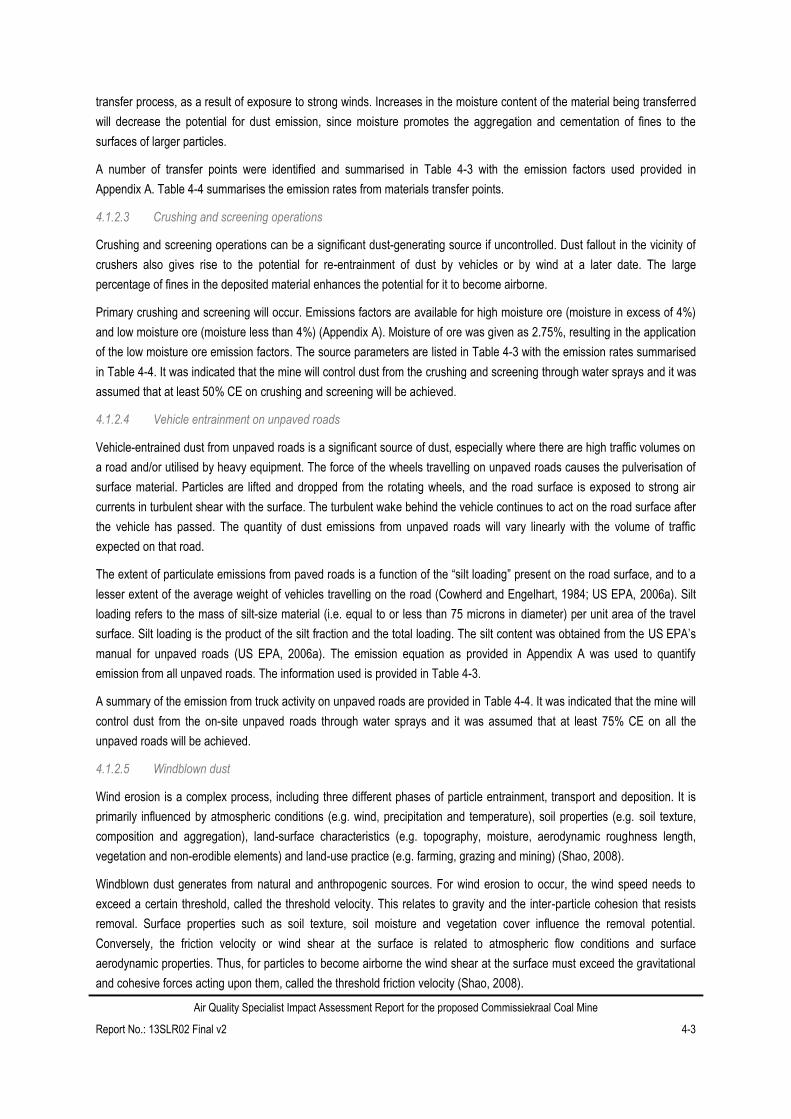
Air Quality Specialist Impact Assessment Report for the proposed Commissiekraal Coal Mine
Report No.: 13SLR02 Final v2 4-3
transfer process, as a result of exposure to strong winds. Increases in the moisture content of the material being transferred
will decrease the potential for dust emission, since moisture promotes the aggregation and cementation of fines to the
surfaces of larger particles.
A number of transfer points were identified and summarised in Table 4-3 with the emission factors used provided in
Appendix A. Table 4-4 summarises the emission rates from materials transfer points.
4.1.2.3 Crushing and screening operations
Crushing and screening operations can be a significant dust-generating source if uncontrolled. Dust fallout in the vicinity of
crushers also gives rise to the potential for re-entrainment of dust by vehicles or by wind at a later date. The large
percentage of fines in the deposited material enhances the potential for it to become airborne.
Primary crushing and screening will occur. Emissions factors are available for high moisture ore (moisture in excess of 4%)
and low moisture ore (moisture less than 4%) (Appendix A). Moisture of ore was given as 2.75%, resulting in the application
of the low moisture ore emission factors. The source parameters are listed in Table 4-3 with the emission rates summarised
in Table 4-4. It was indicated that the mine will control dust from the crushing and screening through water sprays and it was
assumed that at least 50% CE on crushing and screening will be achieved.
4.1.2.4 Vehicle entrainment on unpaved roads
Vehicle-entrained dust from unpaved roads is a significant source of dust, especially where there are high traffic volumes on
a road and/or utilised by heavy equipment. The force of the wheels travelling on unpaved roads causes the pulverisation of
surface material. Particles are lifted and dropped from the rotating wheels, and the road surface is exposed to strong air
currents in turbulent shear with the surface. The turbulent wake behind the vehicle continues to act on the road surface after
the vehicle has passed. The quantity of dust emissions from unpaved roads will vary linearly with the volume of traffic
expected on that road.
The extent of particulate emissions from paved roads is a function of the “silt loading” present on the road surface, and to a
lesser extent of the average weight of vehicles travelling on the road (Cowherd and Engelhart, 1984; US EPA, 2006a). Silt
loading refers to the mass of silt-size material (i.e. equal to or less than 75 microns in diameter) per unit area of the travel
surface. Silt loading is the product of the silt fraction and the total loading. The silt content was obtained from the US EPA’s
manual for unpaved roads (US EPA, 2006a). The emission equation as provided in Appendix A was used to quantify
emission from all unpaved roads. The information used is provided in Table 4-3.
A summary of the emission from truck activity on unpaved roads are provided in Table 4-4. It was indicated that the mine will
control dust from the on-site unpaved roads through water sprays and it was assumed that at least 75% CE on all the
unpaved roads will be achieved.
4.1.2.5 Windblown dust
Wind erosion is a complex process, including three different phases of particle entrainment, transport and deposition. It is
primarily influenced by atmospheric conditions (e.g. wind, precipitation and temperature), soil properties (e.g. soil texture,
composition and aggregation), land-surface characteristics (e.g. topography, moisture, aerodynamic roughness length,
vegetation and non-erodible elements) and land-use practice (e.g. farming, grazing and mining) (Shao, 2008).
Windblown dust generates from natural and anthropogenic sources. For wind erosion to occur, the wind speed needs to
exceed a certain threshold, called the threshold velocity. This relates to gravity and the inter-particle cohesion that resists
removal. Surface properties such as soil texture, soil moisture and vegetation cover influence the removal potential.
Conversely, the friction velocity or wind shear at the surface is related to atmospheric flow conditions and surface
aerodynamic properties. Thus, for particles to become airborne the wind shear at the surface must exceed the gravitational
and cohesive forces acting upon them, called the threshold friction velocity (Shao, 2008).

Air Quality Specialist Impact Assessment Report for the proposed Commissiekraal Coal Mine
Report No.: 13SLR02 Final v2 4-4
The proposed stockpiles are the likely sources of wind erosion. Emissions from the stockpiles are low due to the size of the
material and the moisture contents. The information used is provided in Table 4-3.
A summary of the emission from wind erosion is provided in Table 4-4.
4.1.2.6 Vehicle exhausts
Emissions resulting from motor vehicles can be grouped into primary and secondary pollutants. While primary pollutants are
emitted directly into the atmosphere, secondary pollutants form in the atmosphere because of chemical reactions.
Significant primary pollutants emitted combustion engines include CO2, carbon (C), SO2, NOx (mainly NO), particulates and
lead. Secondary pollutants include NO2, photochemical oxidants such as ozone, sulphur acids, sulphates, nitric acid, and
nitrate aerosols (particulate matter). Vehicle type (i.e. model-year, fuel delivery system), fuel (i.e. oxygen content), operating
(i.e. vehicle speed, load, power) and environmental parameters (i.e. altitude, humidity) influence vehicle emission rates
(Onursal & Gautam, 1997). The information used is provided in Table 4-3.
A summary of the emission from vehicle exhausts is provided in Table 4-4 and Table 4-5.
4.1.2.7 Diesel generator exhaust
Emissions resulting from the stationary diesel generator (combustion engine) include CO2, C, CO, SO2, NOx (mainly NO)
and particulates (PM2.5, PM10, DPM and TSP). The information used is provided in Table 4-3.
A summary of the emission from the diesel generator exhaust is provided in Table 4-4 and Table 4-5.
4.1.2.8 Emissions inventory summary - PM emissions
Operational Phase Unmitigated
The source group contributions to total emissions are shown in Table 4-4. The most significant emissions source of PM2.5,
PM10 and TSP is crushing and screening, contributing 62%, 65% and 77% to the overall PM2.5, PM10 and TSP emissions,
respectively. The second most significant source of PM2.5 and PM10 emissions is the diesel generator. The second most
significant source of TSP emissions is vehicle entrainment on unpaved roads. The most significant source of DPM is the
diesel generator. The underground vehicle exhaust contributes more to DPM that the surface vehicle exhaust emissions.
Operational Phase Design mitigated
The source group contributions to total emissions are shown in Table 4-4. The most significant source of PM2.5, PM10 and
TSP remains to be crushing and screening emissions, however contributing slightly less to the overall emissions (48%, 55%
and 75% to the overall PM2.5, PM10 and TSP emissions, respectively). The second most significant source of PM2.5, PM10
and TSP emissions is the diesel generator. The most significant source of DPM is the diesel generator. The underground
vehicle exhaust contributes more to DPM that the surface vehicle exhaust emissions.

Air Quality Specialist Impact Assessment Report for the proposed Commissiekraal Coal Mine
Report No.: 13SLR02 Final v2 4-5
Table 4-3: Activities, aspects and their associated assumptions for the proposed operations at CCM for emissions inventory calculations
Aspect Source Activity Comments/Assumptions/Mitigation
Fugitive dust (TSP, PM10 and PM2.5 ) and gases
Ventilation shaft Underground operations Based on 24 hours Monday to Sunday.
Release height: 8 m
Exit diameter: 3 m
Exit temperature: 20 °C
Exit velocity: 5 m/s
Assumed 48 000 litres of diesel fuel used per month underground.
Materials handling operations
Tipping coal onto conveyor at decline shaft and tipping from conveyor onto RoM stockpile
RoM coal from RoM stockpile to crusher
Crushed coal to product stockpile
Crushed coal from product stockpile to trucks using front end loaders (FELs)
Based on 24 hours Monday to Sunday.
RoM coal = 1 million tonnes per annum (Mtpa).
Product = 1 Mtpa.
Mitigation measures will include water sprays at product stockpiles (50% CE).
Crushing and Screening
Primary crushing of coal
Screening of coal
Based on 24 hours Monday to Sunday.
RoM coal = 1 Mtpa.
Moisture content = 2.75%
Mitigation measures will include water sprays on crusher and screen (50% CE).
Vehicle activity on unpaved haul roads
Transportation of product off-site
Vehicle exhaust emissions from haul trucks travelling on unpaved roads
Silt content of 5.1% for all unpaved access roads.
Length of access road option 1 = 312.12 m.
Width of road = 10 m.
34 tonne capacity haul trucks.
Assumed 12 000 litres of diesel fuel used per month at the surface.
Mitigation measures will include water sprays on unpaved haul roads (assumed 75% CE).
Wind erosion Wind erosion at stockpiles (SPs) Area of RoM SP: 505 m²
Area of product SPs: 3 680 m²
Mitigation measures will include water sprays on product stockpiles (50% CE).
Diesel generator Power generation Based on 24 hours Monday to Sunday.
Release height: 3.5 m
Exit diameter: 0.5 m

Air Quality Specialist Impact Assessment Report for the proposed Commissiekraal Coal Mine
Report No.: 13SLR02 Final v2 4-6
Aspect Source Activity Comments/Assumptions/Mitigation
Exit temperature: 35 °C
Exit velocity: 20 m/s
Table 4-4: Summary of estimated particulate emission rates and contributions for the proposed operational phase
Source Group PM2.5 PM10 TSP DPM PM2.5 PM10 TSP DPM
Mitigation Applied tpa tpa tpa tpa % % % %
Unmitigated
Ventilation shaft 2 7 7 2 3 5 2 9
None
Materials Handling 1 4 8 1 3 2
Crushing and Screening
42 85 296 62 65 77
Unpaved Roads 1 14 54 1 11 14
Wind Erosion 0.003 0.02 0.02 0 0 0
Surface Vehicle Exhaust
0.5 1 1 0.5 1 1 0 2
Diesel Generator 20.7 20.7 20.7 20.7 31 16 5 89
Total 67.2 132 387 23.2 100 100 100 100
Design Mitigated
Ventilation shaft 2 7 7 2 4 9 4 9 None
Materials Handling 0.5 3 7 1 4 4 50% CE on product stockpile by spraying water
Crushing and Screening
21 42 148 47 55 75 50% CE at crushing and screening plant by spraying water
Unpaved Roads 0.3 3 13 1 4 7 50% CE on unpaved roads by spraying water

Air Quality Specialist Impact Assessment Report for the proposed Commissiekraal Coal Mine
Report No.: 13SLR02 Final v2 4-7
Source Group PM2.5 PM10 TSP DPM PM2.5 PM10 TSP DPM
Mitigation Applied tpa tpa tpa tpa % % % %
Wind Erosion 0.002 0.01 0.01 0 0 0 50% CE on product stockpile by spraying water
Surface Vehicle Exhaust
0.5 1 1 0.5 1 1 1 2 None
Diesel Generator 20.7 20.7 20.7 20.7 46 27 11 89 None
Total 25 56 176 2.5 100 100 100 100

Air Quality Specialist Impact Assessment Report for the proposed Commissiekraal Coal Mine
Report No.: 13SLR02 Final v2 4-8
4.1.2.9 Emissions inventory summary - Gaseous emissions
Due to a lack of information regarding underground blasting, only gaseous emissions from vehicle exhausts could be
determined (Table 4-5). The greatest contribution to CO, NOx and SO2 and VOC emissions is the diesel generator (greater
than 90%). The greatest contributor to VOC emissions is the ventilation shafts (48%).
Table 4-5: Summary of estimated gaseous emission rates for the proposed operational phase
Source Group CO NOx SO2 VOC
tpa tpa tpa tpa
Ventilation Shafts (underground vehicle exhaust)
11 26 0.014 2
Surface Vehicle Exhaust
3 6 0.003 1
Diesel Generator 159 723 0.22 1.17
Total 173 755 0.237 4.17
Notes: NOx emissions for the diesel generator are likely an over estimation
4.1.3 Decommissioning and Closure Phases
It is assumed that all operations will have ceased by the decommissioning phase. It is expected that all surface infrastructure
will be demolished and removed and site access roads closed off. It is also expected that the surface will be covered with
topsoil and vegetated.
The potential for air quality impacts during the decommissioning phase will depend on the extent of demolition and
rehabilitation efforts during decommissioning and on features which will remain.
Aspects and activities associated with the decommissioning phase of the operations are listed in Table 4-6.
Table 4-6: Activities and aspects identified for the decommissioning phase of operations
Impact Source Activity
TSP, PM10 and PM2.5
Topsoil stockpiles
Topsoil recovered from stockpiles for rehabilitation and re-vegetation of surroundings
Unpaved roads
Vehicle entrainment on unpaved road surfaces during rehabilitation. Once that is done, vehicle activity should cease
Gases and particles
Vehicles Exhaust emissions from vehicles utilised during the closure phase. Once that is done, vehicle activity should cease.
Diesel generator
Exhaust emissions from diesel generator utilised during the closure phase. Once that is done, power generation activity should cease.
The closure phase includes the period of aftercare and maintenance after the decommissioning phase. It is when
rehabilitated areas are checked and maintained. The activities that may be included are irregular and minimal vehicle
entrainment on roads and vehicle exhaust emissions when the property is checked up on.
4.1.4 Post-closure Phase
No emissions due to the CCM are expected post-closure. Emissions from post-closure will be similar to the baseline
assuming effective rehabilitation is achieved.

Air Quality Specialist Impact Assessment Report for the proposed Commissiekraal Coal Mine
Report No.: 13SLR02 Final v2 4-9
4.2 Screening of Simulated Human Health Impacts (Incremental and Cumulative)
For the assessment of the CCM operations on air quality with regards to compliance with selected criteria “on-site” will refer
to the area within the mine boundary. “Off-site” refers to the area outside the mine boundary (refer to an appropriate figure
indicating the boundary).
4.2.1 Construction Phase
Dispersion modelling for the construction phase of the CCM was considered to be unrepresentative of the actual activities
that will result in dust and gaseous emissions, due to the overly conservative emission rate calculation. It is anticipated that
the various construction activities would not result in higher off-site PM2.5, PM10 DPM, NO2, CO, SO2 and VOC ground level
concentrations (GLCs) than the operational phase activities. The temporary nature of the construction activities would likely
reduce the significance of the potential impacts.
4.2.2 Operational Phase
4.2.2.1 Transport Route
Only an unpaved portion of the access road to the railway siding was simulated to determine the likely GLCs and frequency
of exceedance (FOE) from the centre of the road. To determine the likely GLCs due to the activities associated with the
access road only a portion of the road was simulated because the GLCs are expected to be similar along the length of the
road and it is unlikely that there will be CCM vehicles along the entire road length at one time. GLCs and FOE as would likely
be lower for the paved portion of the road.
To determine the distance from the road edge 5 m is subtracted from the distance on the graph to take into account the
portion of the road included on the graph.
Simulated annual average PM2.5 ground level concentrations are above the NAAQS for a distance of approximately 76 m
from the unmitigated road edge (Figure 4-1). The furthest distance from the unmitigated road edge that the daily PM2.5
NAAQS is exceeded is approximately 112.5 m from the source (Figure 4-2).
Simulated annual average PM10 ground level concentrations are above the NAAQS for a distance of approximately 146 m
from the unmitigated road edge (Figure 4-3). The furthest distance from the unmitigated road edge that the daily PM10
NAAQS is exceeded is approximately 210 m from the source (Figure 4-4).
There are receptors located within the exceedance area for the access road.
Figure 4-1: Unmitigated operational phase - PM2.5 annual average ground level concentrations transect for the
access road

Air Quality Specialist Impact Assessment Report for the proposed Commissiekraal Coal Mine
Report No.: 13SLR02 Final v2 4-10
Figure 4-2: Unmitigated operational phase - Frequency of exceedance of the SA NAAQ limit of 40 µg/m³ for daily
average PM2.5 concentrations transect for the access road
Figure 4-3: Unmitigated operational phase – PM10 annual average ground level concentrations transect for the
access road
Figure 4-4: Unmitigated operational phase - Frequency of exceedance of the SA NAAQ limit of 75 µg/m³ for daily
average PM10 concentrations transect for the access road
4.2.2.2 On-site Activities
4.2.2.2.1 PM2.5
Simulated unmitigated operational phase PM2.5 daily frequency of exceedance is shown in Figure 4-5 and PM2.5

Air Quality Specialist Impact Assessment Report for the proposed Commissiekraal Coal Mine
Report No.: 13SLR02 Final v2 4-11
annual GLC is shown in Figure 4-6. Over a daily average, the concentrations exceed the NAAQ limit of 40 µg/m³
for more than 4 days per year at the sensitive receptors on-site and to the east and north-east of the surface
infrastructure area off-site (Figure 4-5). Over an annual average the simulated GLCs exceed the NAAQS of
20 µg/m³ at the sensitive receptors on-site, but not off-site (Figure 4-6).
Simulated design mitigated operational phase PM2.5 daily frequency of exceedance is shown in Figure 4-7 and
PM2.5 annual GLC is shown in Figure 4-8. Over a daily average, the simulated concentrations exceed the NAAQ
limit of 40 µg/m³ for more than 4 days per year at the sensitive receptors on-site (Figure 4-7). Over an annual
average the simulated GLCs exceed the NAAQS of 20 µg/m³ at the sensitive receptors on-site, but not off-site
(Figure 4-8).
The main contributing source to the unmitigated and design mitigated PM2.5 simulated concentrations is
crushing and screening. The source that contributes the least to the unmitigated and design mitigated PM2.5
simulated concentrations is vehicle exhausts.
Due to the absence of ambient (baseline) air quality data, cumulative (ambient concentrations and future CCM
GLCs) PM2.5 concentrations could not be determined.

Air Quality Specialist Impact Assessment Report for the proposed Commissiekraal Coal Mine
Report No.: 13SLR02 Final v2 4-12
Figure 4-5: Unmitigated operational phase - Frequency of exceedance of the SA NAAQ limit of 40 µg/m³ for daily average PM2.5 concentrations
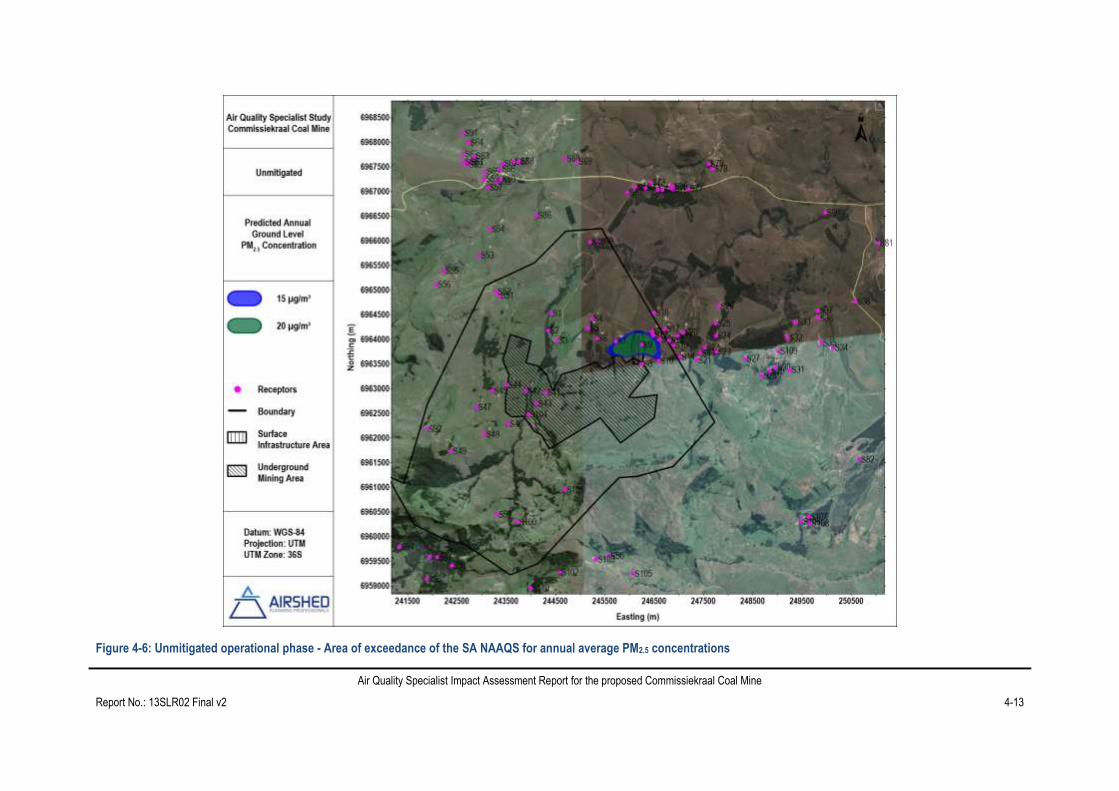
Air Quality Specialist Impact Assessment Report for the proposed Commissiekraal Coal Mine
Report No.: 13SLR02 Final v2 4-13
Figure 4-6: Unmitigated operational phase - Area of exceedance of the SA NAAQS for annual average PM2.5 concentrations

Air Quality Specialist Impact Assessment Report for the proposed Commissiekraal Coal Mine
Report No.: 13SLR02 Final v2 4-14
Figure 4-7: Design mitigated operational phase - Frequency of exceedance of the SA NAAQ limit of 40 µg/m³ for daily average PM2.5 concentrations

Air Quality Specialist Impact Assessment Report for the proposed Commissiekraal Coal Mine
Report No.: 13SLR02 Final v2 4-15
Figure 4-8: Design mitigated operational phase - Area of exceedance of the SA NAAQS for annual average PM2.5 concentrations

Air Quality Specialist Impact Assessment Report for the proposed Commissiekraal Coal Mine
Report No.: 13SLR02 Final v2 4-16
4.2.2.2.2 PM10
Simulated unmitigated operational phase PM10 daily frequency of exceedance is shown in Figure 4-9 and PM10
annual GLC is shown in Figure 4-10. Over a daily average, the concentrations exceed the NAAQ limit of 75 µg/m³
for more than 4 days per year at the sensitive receptors on-site and to the east and north-east of the surface
infrastructure area off-site (Figure 4-9). Over an annual average the simulated GLCs exceed the NAAQS
(40 µg/m³) at the sensitive receptors on-site but not off-site (Figure 4-10).
Simulated design mitigated operational phase PM10 daily frequency of exceedance is shown in Figure 4-11 and
PM10 annual GLC is shown in Figure 4-12. Over a daily average, the concentrations exceed the NAAQ limit of
75 µg/m³ for more than 4 days per year at the sensitive receptors on-site and to the east of the surface
infrastructure area off-site (Figure 4-11). Over an annual average the simulated GLCs exceed the selected criterion
(40 µg/m³) at the sensitive receptors on-site but not off-site (Figure 4-12).
The main contributing source to the unmitigated and design mitigated PM10 simulated concentrations is crushing
and screening. The sources that contribute the least to the unmitigated and design mitigated PM10 simulated
concentrations are vehicle exhausts.
Due to the absence of ambient (baseline) air quality data, cumulative (ambient concentrations and future CCM
GLCs) PM10 concentrations could not be determined.

Air Quality Specialist Impact Assessment Report for the proposed Commissiekraal Coal Mine
Report No.: 13SLR02 Final v2 4-17
Figure 4-9: Unmitigated operational phase - Frequency of exceedance of the SA NAAQ limit of 75 µg/m³ for daily average PM10 concentrations

Air Quality Specialist Impact Assessment Report for the proposed Commissiekraal Coal Mine
Report No.: 13SLR02 Final v2 4-18
Figure 4-10: Unmitigated operational phase - Area of exceedance of the SA NAAQS for annual average PM10 concentrations

Air Quality Specialist Impact Assessment Report for the proposed Commissiekraal Coal Mine
Report No.: 13SLR02 Final v2 4-19
Figure 4-11: Design mitigated operational phase - Frequency of exceedance of the SA NAAQ limit of 75 µg/m³ for daily average PM10 concentrations

Air Quality Specialist Impact Assessment Report for the proposed Commissiekraal Coal Mine
Report No.: 13SLR02 Final v2 4-20
Figure 4-12: Design mitigated operational phase - Area of exceedance of the SA NAAQS for annual average PM10 concentrations

Air Quality Specialist Impact Assessment Report for the proposed Commissiekraal Coal Mine
Report No.: 13SLR02 Final v2 4-21
4.2.2.2.3 DPM
Simulated incremental DPM concentrations as a result of vehicle exhaust and diesel generator exhaust emissions
exceed the selected annual evaluation criterion of 5 µg/m³ on-site (Figure 4-13). The DPM criterion is not
exceeded off-site but at the on-site receptors.
Due to the absence of ambient (baseline) air quality data, cumulative (ambient concentrations and future CCM
GLCs) DPM concentrations could not be determined.
In estimating increased lifetime cancer risk as a result of DPM, use was made of simulated annual average DPM
concentrations. This approach is conservative since it assumes an individual will be exposed to this concentration
constantly over a period of 70 years. Increased lifetime cancer risk as a result of chronic exposure to DPM is at a
risk level considered unacceptable by the US EPA (greater than 1:1 000 000) at one (on-site) AQSR (S9) and
steps should be taken to reduce the DPM emissions.
4.2.2.2.4 CO
Simulated incremental CO concentrations as a result of vehicle exhaust and diesel generator exhaust emissions
do not exceed the selected evaluation criterion of 30 000 µg/m³ more than 88 hours per year. Due to the low level
of impact, isopleth plots have not been prepared for CO.
Due to the absence of ambient (baseline) air quality data, cumulative (ambient concentrations and future CCM
GLCs) CO concentrations could not be determined.
4.2.2.2.5 NO2
Nitrogen monoxide (NO) is rapidly converted in the atmosphere into the much more toxic nitrogen dioxide (NO2).
The rate of this conversion process is determined by the rate of the physical processes of dispersion and mixing of
the plume and the chemical reaction rates as well as the local atmospheric ozone concentration. Nitrogen
monoxide (NO) emissions are rapidly converted in the atmosphere into NO2. NO2 impacts where calculated by
AERMOD using the ozone limiting method assuming constant annual average background ozone concentrations
of 30 ppb from Zunckel, et al. (2004) and a NO2/NOx emission ratio of 0.2 (Howard, 1988). It was conservatively
assumed that all NOx emitted from the generator is to be emitted as NO2.
Simulated incremental NO2 concentrations as a result of vehicle exhaust and diesel generator exhaust emissions
exceed the selected evaluation criteria (Figure 4-14 and Figure 4-15). Hourly NO2 exceed the SA NAAQS off-site
and at sensitive receptors (Figure 4-14). Annual average NO2 concentrations do not exceed the SA NAAQS off-
site but do at on-site receptors (Figure 4-15).
Due to the absence of ambient (baseline) air quality data, cumulative (ambient concentrations and future CCM
GLCs) NO2 concentrations could not be determined.
4.2.2.2.6 SO2
Simulated incremental SO2 concentrations as a result of vehicle exhaust and diesel generator exhaust emissions
do not exceed the selected evaluation criteria. Due to the low level of impact, isopleth plots have not been
prepared for SO2.

Air Quality Specialist Impact Assessment Report for the proposed Commissiekraal Coal Mine
Report No.: 13SLR02 Final v2 4-22
Due to the absence of ambient (baseline) air quality data, cumulative (ambient concentrations and future CCM
GLCs) SO2 concentrations could not be determined.
4.2.2.2.7 VOC
Simulated incremental VOC concentrations as a result of vehicle exhaust and diesel generator exhaust emissions
do not exceed the selected annual evaluation criterion of 100 µg/m³. Due to the low level of impact, isopleth plots
have not been prepared for VOCs.
Due to the absence of ambient (baseline) air quality data, cumulative (ambient concentrations and future CCM
GLCs) VOC concentrations could not be determined.

Air Quality Specialist Impact Assessment Report for the proposed Commissiekraal Coal Mine
Report No.: 13SLR02 Final v2 4-23
Figure 4-13: Unmitigated operational phase - Area of exceedance of the IRIS RfC for annual average DPM concentrations

Air Quality Specialist Impact Assessment Report for the proposed Commissiekraal Coal Mine
Report No.: 13SLR02 Final v2 4-24
Figure 4-14: Unmitigated operational phase - Frequency of exceedance of the SA NAAQ limit of 200 µg/m³ for hourly NO2 concentrations

Air Quality Specialist Impact Assessment Report for the proposed Commissiekraal Coal Mine
Report No.: 13SLR02 Final v2 4-25
Figure 4-15: Unmitigated operational phase - Area of exceedance of the SA NAAQS for annual average NO2 concentrations

Air Quality Specialist Impact Assessment Report for the proposed Commissiekraal Coal Mine
Report No.: 13SLR02 Final v2 4-26
4.2.3 Decommissioning and Closure Phase
Dispersion modelling was not possible due to limited information on the decommissioning and closure schedules. It is not
anticipated that the various activities for both phases would result in high off-site PM2.5, PM10, DPM, NO2, CO, SO2 and
VOCs GLCs.
4.2.4 Post Closure Phase
No atmospheric impacts are expected from the CCM project post-closure.
4.3 Analysis of Emissions’ Impact on the Environment (Dustfall) (Incremental and Cumulative)
4.3.1 Construction Phase
Dispersion modelling was regarded not representative of the actual activities that will result in dust emissions during the
construction phase for the proposed CCM. It is anticipated that the various construction activities would not result in higher
off-site dustfall rates than the operational phase activities. The temporary nature of the construction activities would reduce
the significance of the potential impacts.
4.3.2 Operational Phase
Simulated incremental dustfall rates are, in general, high on-site for unmitigated operational phase operations.
These are above the SA NDCR of 600 mg/m²/day for residential areas at one sensitive receptor on-site but below
the SA NDCR residential limit off-site (Figure 4-16).
Simulated incremental dustfall rates are high in general on-site for design mitigated operational phase
operations. These are above the SA NDCR of 600 mg/m²/day for residential areas at one sensitive receptor on-
site but below the SA NDCR residential limit off-site (Figure 4-17).
The main contributing source to the unmitigated and design mitigated simulated dustfall rates are crushing and
screening. The source that contributes the least to the unmitigated and design mitigated simulated dustfall rates
is vehicle exhausts.

Air Quality Specialist Impact Assessment Report for the proposed Commissiekraal Coal Mine
Report No.: 13SLR02 Final v2 4-27
Figure 4-16: Predicted unmitigated operational phase daily dustfall rates (SA NDCR residential limit is 600 mg/m²/day)

Air Quality Specialist Impact Assessment Report for the proposed Commissiekraal Coal Mine
Report No.: 13SLR02 Final v2 4-28
Figure 4-17: Predicted design mitigated operational phase daily dustfall rates (SA NDCR residential limit is 600 mg/m²/day)

Air Quality Specialist Impact Assessment Report for the proposed Commissiekraal Coal Mine
Report No.: 13SLR02 Final v2 4-29
4.3.3 Decommissioning and Closure Phases
Dispersion modelling was not possible due to limited information on the decommissioning and closure schedules. It is
anticipated that the various decommissioning and closure activities would not result in high off-site dustfall rates.
4.3.4 Post Closure Phase
No dust fallout rates due to the CCM are expected post-closure.
4.4 Impact Significance Rating
The impact assessment is summarised in the subsequent tables for the different phases of the proposed CCM. Table 4-7
provides the significance rating for the construction phase with the evaluation of the operational phase provided in Table
4-8. The significance rating for the closure phase is provided in Table 4-9. The methodology is described in Appendix C.
Table 4-7: Impact assessment summary table for the construction phase for CCM
Scenario Impact
Severity/
Nature of
Impact
Duration of Impact
Spatial Scale of Impacts
Consequence Probability SIGNIFICANCE
Unmitigated
PM2.5 M M M M M Medium
PM10 M M M M M Medium
Dustfall L M L L L Low
Mitigated
PM2.5 L M L L L Low
PM10 L M L L L Low
Dustfall L M L L L Low
Table 4-8: Impact assessment summary table for the operational phase for CCM
Scenario Impact
Severity/
Nature of
Impact
Duration of Impact
Spatial Scale of Impacts
Consequence Probability SIGNIFICANCE
Unmitigated
PM2.5 H M M H M High
PM10 H M M H M High
Dustfall L M L L L Low
SO2 L M L L L Low
NO2 H M M H M High
CO L M L L L Low
DPM M-H M M M L Low
Design mitigated
PM2.5 M M M M M Medium
PM10 M-H M M M-H M Medium – High
Dustfall L M L L L Low

Air Quality Specialist Impact Assessment Report for the proposed Commissiekraal Coal Mine
Report No.: 13SLR02 Final v2 4-30
Table 4-9: Impact assessment summary table for the closure phase for CCM
Scenario Impact
Severity/
Nature of
Impact
Duration of
Impact(a)
Spatial Scale of Impacts
Consequence Probability SIGNIFICANCE
Unmitigated Demolition of infrastructure
PM2.5 M M L M L Low
PM10 M M M-L M L Low
Dustfall L M L L L Low
SO2 L M L L L Low
NO2 L M L L L Low
CO L M L L L Low
DPM L M L L L Low
Notes: (a) For closure period only

Air Quality Specialist Impact Assessment Report for the proposed Commissiekraal Coal Mine
Report No.: 13SLR02 Final v2 5-1
5 RECOMMENDED AIR QUALITY MANAGEMENT MEASURES
It is recommended that the project proponent commit itself to air quality management planning throughout the life of the
operations. This section expands on the air quality management plan for the future CCM operations.
5.1 Air Quality Management Objectives
It is recommended that air quality management planning forms part of the construction, operational phase and
decommissioning of the CCM. The air quality management plan provides options on the control of dust at the main sources
with the monitoring network designed as such to track the effectiveness of the mitigation measures. The sources need to be
ranked according to sources strengths (emissions) and impacts. Once the main sources have been identified, target control
efficiencies for each source can be defined to ensure acceptable cumulative ground level concentrations.
In the places of constant human occupation pollutant concentrations should not exceed the NAAQS and dustfall rates
should be below the SA NDCR residential limit of 600 mg/m²/day.
5.2 Source Ranking
Source ranking focuses on the operational phase since the construction phase was not assessed in detail. The ranking of
sources serves to confirm, and possibly revise, the current understanding of the significance of specific sources and to
evaluate the emission reduction potentials required for each. Sources of emissions during the design mitigated operational
phase of the proposed CCM may be ranked based on emissions and impacts.
5.2.1 Ranking of Sources by Emissions
Unmitigated
The most significant sources of PM2.5, PM10 and TSP emissions are crushing and screening. The main source of DPM, NO2,
SO2, CO is the diesel generator. The most significant source of VOCs is underground vehicle exhausts.
Design mitigated
The most significant sources of PM2.5, PM10 and TSP emissions remained to be crushing and screening emissions, however
at much lower rates. The main source of DPM, NO2, SO2 and CO is the diesel generator. The most significant source of
VOCs is underground vehicle exhausts.
5.2.2 Ranking of Sources by Impact
The main contributing sources to the unmitigated and design mitigated PM2.5 and PM10 simulated concentrations, and
dustfall rates are crushing and screening. The source that contributes the least to the unmitigated and design mitigated
PM2.5 and PM10 simulated concentrations, and to dust fallout is vehicle exhausts. The main contributing source to the
unmitigated DPM and NO2 simulated concentrations is the diesel generator.
5.3 Source Specific Recommended Management and Mitigation Measures
The minimum mitigation measures must be achieved; however, it is suggested that additional mitigation measures be
considered to ensure compliance with NAAQSs off-site, specifically at the sensitive receptors. These mitigation measures

Air Quality Specialist Impact Assessment Report for the proposed Commissiekraal Coal Mine
Report No.: 13SLR02 Final v2 5-2
are briefly discussed below (Table 5-1 for construction phase, Table 5-2 for operational phase and Table 5-3 for
decommissioning and closure phase) (in more detail in Appendix B).

Air Quality Specialist Impact Assessment Report for the proposed Commissiekraal Coal Mine
Report No.: 13SLR02 Final v2 5-3
Table 5-1: Air Quality Management Plan: construction phase of the proposed CCM
Aspect Impact Management Actions/Objectives Responsible Person(s) Target Date
Land clearing activities such as bulldozing and scraping of road and blasting
PM10 and PM2.5 concentrations and dustfall rates
Water sprays at area to be cleared – 50% CE can be achieved.
Moist topsoil will reduce the potential for dust generation when tipped onto stockpiles – US EPA indicated a 62% reduction in dust generation by doubling the moisture content.
Ensure travel distance between clearing area and topsoil piles to be at a minimum.
Dustfall buckets placed around the proposed project site and at sensitive receptors (DB01 to DB05). During construction operations monthly dustfall rates should not exceed 600 mg/m²/day(a).
Dustfall buckets placed at surface infrastructure (DB06). During construction operations monthly dustfall rates should not exceed 1 200 mg/m²/day(b).
Contractor(s)
CCM Environmental Manager
During construction
Road construction activities such as road grading
PM10 and PM2.5 concentrations and dustfall rates
Water sprays at area to be graded – 50% CE
Freshly graded areas to be kept to a minimum.
Monthly dustfall rates should not exceed 600 mg/m²/day(a) at the single dustfall units DB01 to DB05.
Monthly dustfall rates should not exceed 1 200 mg/m²/day(b) at the single dustfall units DB06.
Wind erosion from exposed areas PM10 and PM2.5 concentrations and dustfall rates
Ensure exposed areas remain moist through regular water spraying during dry, windy periods.
Monthly dustfall rates should not exceed 600 mg/m²/day(a) at the single dustfall units DB01 to DB05.
Monthly dustfall rates should not exceed 1 200 mg/m²/day(b) at the single dustfall units DB06.
Notes: (a) SA NDCR residential limit of 600 mg/m²/day
(b) SA NDCR non-residential limit of 1 200 mg/m²/day

Air Quality Specialist Impact Assessment Report for the proposed Commissiekraal Coal Mine
Report No.: 13SLR02 Final v2 5-4
Table 5-2: Air Quality Management Plan: operational phase of the proposed CCM
Aspect Impact Management Actions/Objectives Responsible
Person(s) Target Date
Ventilation PM10 and PM2.5 concentrations and dustfall rates
It is recommended that ventilation emissions be monitored so that future modelling can be based on monitored data.
Monthly dustfall rates should not exceed 600 mg/m²/day(a) at dustfall units DB01 to DB05.
Monthly dustfall rates should not exceed 1 200 mg/m²/day(b) at dustfall unit DB06.
CCM Environmental Manager
On-going during operational phase
Vehicle activity on unpaved roads
PM10, PM2.5 concentrations and dustfall rates
A minimum mitigation measure of water sprays on unpaved roads to ensure a minimum of 75% CE (this could be achieved through a watering rate of (2 litres/m²/h).
Vehicle inspection and maintenance programs.
Monthly dustfall rates should not exceed 600 mg/m²/day(a) at dustfall units DB01 to DB05.
Monthly dustfall rates should not exceed 1 200 mg/m²/day(b) at dustfall unit DB06.
Materials handling PM10 and PM2.5 concentrations and dustfall rates
A minimum mitigation measure of water sprays at the product stockpile resulting in 50% CE.
Monthly dustfall rates should not exceed 600 mg/m²/day(a) at dustfall units DB01 to DB05.
Monthly dustfall rates should not exceed 1 200 mg/m²/day(b) at dustfall unit DB06.
Crushing and screening PM10 and PM2.5 concentrations and dustfall rates
A minimum mitigation measure of water sprays at crushing and screening resulting in 50% CE.
It is recommended that a permanent crushing and screening plant be installed where the crushers and screens have hooding with fabric filters. This can result in up to 83% CE.
Monthly dustfall rates should not exceed 600 mg/m²/day(a) at dustfall units DB01 to DB05.
Monthly dustfall rates should not exceed 1 200 mg/m²/day(b) at dustfall unit DB06.
Wind erosion PM10 and PM2.5 concentrations and dustfall rates
A minimum mitigation measure of water sprays at the product stockpile resulting in a 50% CE.
Monthly dustfall rates should not exceed 600 mg/m²/day(a) at dustfall units DB01 to DB05.
Monthly dustfall rates should not exceed 1 200 mg/m²/day(b) at dustfall unit DB06.
Diesel generator NO2 concentrations
It is recommended that the diesel generator should be fitted with a low NOx burner.
Short-term NO2 monitoring. If concentrations are determined to be elevated (above NAAQS) then long-term monitoring should be undertaken.
General PM10 and PM2.5 concentrations and dustfall rates
Dustfall buckets placed around the proposed project site and at sensitive receptors (DB01 to DB05). During operations monthly dustfall rates should not exceed 600 mg/m²/day(a).
Dustfall buckets placed at surface infrastructure (DB06). During operations monthly dustfall rates should not exceed 1 200 mg/m²/day(b).
PM2.5 and PM10 ambient sampler with no exceedances of the selected criteria.

Air Quality Specialist Impact Assessment Report for the proposed Commissiekraal Coal Mine
Report No.: 13SLR02 Final v2 5-5
Aspect Impact Management Actions/Objectives Responsible
Person(s) Target Date
Short-term NO2 monitoring with no exceedances of the selected criteria. If concentrations are determined to be elevated (above SA NAAQS) then long-term monitoring should be undertaken.
Notes: (a) SA NDCR residential limit of 600 mg/m²/day.
(b) SA NDCR non-residential limit of 1 200 mg/m²/day.
Table 5-3: Air Quality Management Plan: decommissioning and closure phase (rehabilitation activities) for the proposed CCM
Aspect Impact Management Actions/Objectives Responsible Person(s) Target Date
Wind erosion from exposed areas
PM10 and PM2.5 concentrations and dustfall rates
Demolition of infrastructure to have water sprays where a lot of vehicle activity is required.
Ensure site is restored to pre-mining conditions.
Contractor(s)
CCM Environmental Manager
Post-operational, can cease after vegetation cover is established

Air Quality Specialist Impact Assessment Report for the proposed Commissiekraal Coal Mine
Report No.: 13SLR02 Final v2 5-6
5.4 Performance Indicators
Increasingly environmental indicators are used in Environmental Land Use Planning and Management to simplify
environmental assessments.
Indicators are defined as a single measure of a condition of an environmental element that represents the status or quality of
that element. An index is a combination of a group of indicators to measure the overall status of an environmental element,
and a threshold is the value of an indicator or index. For example, ambient PM10 concentrations monitored within a specific
area will be the indicator, with the SA NAAQS being the threshold.
It is recommended that the criteria as listed in Section 2 be adopted as indicators for the proposed CCM. The relevant criteria
applicable for the time period should be complied with, working toward the more stringent future limits.
5.4.1 Performance Indicators
Key performance indicators against which progress may be assessed form the basis for all effective environmental
management practices. In the definition of key performance indicators careful attention is usually paid to ensure that
progress towards their achievement is measurable, and that the targets set are achievable given available technology and
experience.
Performance indicators are usually selected to reflect both the source of the emission directly and the impact on the
receiving environment. Ensuring that no visible evidence of wind erosion exists represents an example of a source-based
indicator, whereas maintaining off-site dustfall rates to below 600 mg/m2/day represents an impact- or receptor-based
performance indicator. Criteria for pollutant concentrations and dustfall rates have been published as indicated in Section 2.
The adopted evaluation criteria discussed in Section 2 should not be exceeded.
5.4.2 Specification of Source Based Performance Indicators
It is recommended that dustfall rates in the immediate vicinity should be less than 1 200 mg/m2/day for unpaved roads
associated with on-site activities. This is not mandated by the NDCRs but is regarded to be good on-site management
practice.
The absence of visible dust plume at all tipping points, crushers and screens would be the best indicator of effective control
equipment in place. In addition, the dustfall rates in the immediate vicinity of various sources (materials handling points,
unpaved roads, crushers and screens) should be less than 1 200 mg/m2/day. Dustfall rates from all activities associated with
the proposed CCM should not exceed 600 mg/m2/day at sensitive receptors (according to the NDCRs) or off-site.
5.4.3 Receptor based Performance Indicators
Dustfall collection provides a useful and cost-effective tool to track the success of mitigation measures and overall dust
generation from the proposed CCM. It is recommended that the proposed mine initiates monthly dustfall monitoring as well
as ambient PM2.5 and PM10 monitoring (Figure 5-1). It is recommended that a short-term NO2 monitoring campaign be
conducted. If concentrations are determined to be elevated (above SA NAAQS) then long-term monitoring should be
undertaken. PM2.5, PM10 and NO2 sampling at the site should be conducted near the closest off-site residence (S16) (Figure
5-1).
It is recommended that dust deposition monitoring be confined to sites within close proximity (<2 km) to the
proposed operations. Monitoring should be undertaken using the American Society for Testing and Materials
standard test method for the collection and analysis of dustfall (ASTM D-1739) (ASTM D1739-98, 2004).

Air Quality Specialist Impact Assessment Report for the proposed Commissiekraal Coal Mine
Report No.: 13SLR02 Final v2 5-7
Logsheets should be kept providing information on the surrounding conditions (such as construction activities),
sampling date and duration.
PM2.5 and PM10 monitoring is usually conducted every three days for 24 hours. Logsheets should be kept providing
information on the surrounding conditions (such as construction activities), sampling date, duration, flow rate and
filter number. This is essential for reporting on the PM2.5 and PM10 concentrations.
Short-term NO2 monitoring is usually conducted over three months for 14 days. Logsheets should be kept providing
information on the surrounding conditions (such as construction activities), sampling date, duration and tube
number. This is essential for reporting on the NO2 concentrations.
5.4.4 Ambient Air Quality Monitoring
Ambient monitoring locations were selected to be near the AQSRs where NAAQSs are likely to be exceeded as well as at
off-site (boundary) locations close to surface operations.

Air Quality Specialist Impact Assessment Report for the proposed Commissiekraal Coal Mine
Report No.: 13SLR02 Final v2 5-8
Figure 5-1: Proposed monitoring network for the proposed operations at the CCM

Air Quality Specialist Impact Assessment Report for the proposed Commissiekraal Coal Mine
Report No.: 13SLR02 Final v2 5-9
5.5 Record-keeping, Environmental Reporting and Community Liaison
5.5.1 Periodic Inspections and Audits
It is recommended that site inspections and progress reporting be undertaken at regular intervals (at least quarterly) during
operations, with annual environmental audits being conducted. Results from site inspections and off-site monitoring efforts
should be combined to determine progress against source- and receptor-based performance indicators. Progress should be
reported to all interested and affected parties, including authorities and persons affected by pollution.
Corrective action or the implementation of contingency measures must be proposed to the stakeholder forum in the event
that progress towards targets is indicated by the quarterly/annual reviews to be unsatisfactory.
5.5.2 Liaison Strategy for Communication with Interested and Affected Parties (I&APs)
Stakeholder forums provide possibly the most effective mechanisms for information dissemination and consultation. Forums
will be held at least twice annually.
5.5.3 Management Costs
The budget should provide a clear indication of the capital and annual maintenance costs associated with dust control
measures and dust monitoring plans. It may be necessary to make assumptions about the duration of aftercare prior to
obtaining closure. This assumption must be made explicit so that the financial plan can be assessed within this framework.
The financial plan for air quality management and monitoring should be reviewed on an annual basis.

Air Quality Specialist Impact Assessment Report for the proposed Commissiekraal Coal Mine
Report No.: 13SLR02 Final v2 6-1
6 RESIDUAL AIR QUALITY IMPACTS
This section discusses the emissions, simulation results and significance ratings of additionally mitigated operations without
the generator and probable significance ratings of additionally mitigated operations without the generator. The additionally
mitigated operations’ results are based on the assumption that all the additional measures as recommended in Section 5 are
implemented.
The selected and recommended mitigation measures and related dust control efficiencies applied to the residual modelling
area listed in Table 6-1.
Table 6-1: Mitigation measures recommended and accounted for in the residual air quality impact assessment
Source Mitigation Measure And Control Efficiencies
Vehicle activity on the unpaved roads
Regular water sprays on the unpaved roads to ensure a minimum of 75% CE
Reagular
Materials transfer points Materials handling at product stockpile to be controlled through water sprays resulting in 50% CE
Crushing and screening Crushing and screening to be controlled through hooding with fabric filters resulting in 83% CE
Wind Erosion Ensure product stockpile remains moist through regular water spraying during dry, windy periods (CE 50%)
6.1 Additionally Mitigated Atmospheric Emissions
Operational phase additionally mitigated
The source group contributions to total emissions are shown in Table 6-2. The most significant source of PM2.5, PM10 and
TSP is crushing and screening emissions contributing 68%, 50% and 64% to the overall PM2.5, PM10 and TSP emissions,
respectively. The second most significant source of TSP emissions is vehicle entrainment on unpaved roads. The second
most significant source of PM2.5 and PM10 emissions is ventilation.
Table 6-2: Summary of estimated particulate emission rates for the proposed additionally mitigated operational
phase
Source Group
PM2.5 PM10 TSP DPM PM2.5 PM10 TSP DPM Additional Mitigation Measures
tpa tpa tpa tpa % % % %
Additionally Mitigated
Ventilation 2 7 7 2 20 24 9 80 None
Materials Handling
0.5 3 7 - 5 11 9 - 50% CE for water sprays at product stockpiles
Crushing and Screening
7 14 50 - 68 50 64 - 83% CE for hooding with fabric filters
Unpaved Roads
0.3 3 13 - 3 12 17 -
75% CE on unpaved roads by spraying additional water on roads
Wind Erosion 0.002 0.01 0.01 - 0 0 0 - 50% CE for water sprays on product stockpiles

Air Quality Specialist Impact Assessment Report for the proposed Commissiekraal Coal Mine
Report No.: 13SLR02 Final v2 6-2
Source Group
PM2.5 PM10 TSP DPM PM2.5 PM10 TSP DPM Additional Mitigation Measures
tpa tpa tpa tpa % % % %
Additionally Mitigated
Vehicle Exhaust
0.5 1 1 0.5 4 2 1 20 None
Total 11 29 78 2.5 100 100 100 100
6.2 Screening of Simulated Additionally Mitigated Human Health Impacts
6.2.1 PM2.5
Simulated additionally mitigated1 PM2.5 daily frequency of exceedance is shown in Figure 6-1 and PM2.5 annual
GLC is shown in Figure 6-2. Over a daily average, the concentrations exceeded the selected criteria of 40 µg/m³
for more than 4 days per year at one of the sensitive receptors on-site but not off-site (Figure 6-1). Over an annual
average the simulated GLCs exceed the SA NAAQS at one of the sensitive receptors on-site but not off-site
(Figure 6-2).
The main contributing source to the additionally mitigated PM2.5 simulated concentrations are still crushing and
screening, but at much lower levels. The source that contributes the least to the additionally mitigated PM2.5
simulated concentrations remains to be vehicle exhausts.
1 Additional mitigation measures proposed to the design mitigation measures committed to.

Air Quality Specialist Impact Assessment Report for the proposed Commissiekraal Coal Mine
Report No.: 13SLR02 Final v2 6-3
Figure 6-1: Additionally mitigated operational phase - Frequency of exceedance of the SA NAAQ limit of 40 µg/m³ for daily average PM2.5 concentrations
Air Quality Specialist Impact Assessment Report for the proposed Commissiekraal Coal Mine
Report No.: 13SLR02 Final v2 6-4
Figure 6-2: Additionally mitigated operational phase - Area of exceedance of the SA NAAQS for annual average PM2.5 concentrations

Air Quality Specialist Impact Assessment Report for the proposed Commissiekraal Coal Mine
Report No.: 13SLR02 Final v2 6-5
6.2.2 PM10
Simulated additionally mitigated PM10 daily frequency of exceedance is shown in Figure 6-3 and PM10 annual
GLCs are shown in Figure 6-4. Over a daily average, the concentrations exceed the NAAQ limit of 75 µg/m³ for
more than 4 days per year at some of the sensitive receptors on-site but not for more than 4 days per year off-site
(Figure 6-3). Over an annual average the simulated GLCs exceed the SA NAAQS at one of the sensitive receptors
on-site but not off-site (Figure 6-4).
The main contributing source to the additionally mitigated PM10 simulated concentrations remains to be crushing
and screening, but at much lower GLCs. The source that contributes the least to the additionally mitigated PM10
simulated concentrations remains the vehicle exhausts.
6.3 Analysis of Additionally Mitigated Emissions’ Impact on the Environment (Dustfall)
Simulated incremental dustfall rates for additionally mitigated operational phase operations are above the
SA NDCR of 600 mg/m²/day for residential areas at one sensitive receptor on-site but below the SA NDCR of
600 mg/m²/day for residential areas off-site (Figure 6-5).
The main contributing source to the additionally mitigated simulated dustfall rates remained to be crushing and
screening but at much lower rates.

Air Quality Specialist Impact Assessment Report for the proposed Commissiekraal Coal Mine
Report No.: 13SLR02 Final v2 6-6
Figure 6-3: Additionally mitigated operational phase - Frequency of exceedance of the SA NAAQ limit of 75 µg/m³ for daily average PM10 concentrations

Air Quality Specialist Impact Assessment Report for the proposed Commissiekraal Coal Mine
Report No.: 13SLR02 Final v2 6-7
Figure 6-4: Additionally mitigated operational phase - Area of exceedance of the SA NAAQS for annual average PM10 concentrations

Air Quality Specialist Impact Assessment Report for the proposed Commissiekraal Coal Mine
Report No.: 13SLR02 Final v2 6-8
Figure 6-5: Predicted additionally mitigated operational phase daily dustfall rates (SA NDCR residential limit is 600 mg/m²/day)

Air Quality Specialist Impact Assessment Report for the proposed Commissiekraal Coal Mine
Report No.: 13SLR02 Final v2 6-9
6.4 Impact Significance Rating
The incremental impact’s significance is described in Table 6-3.
Table 6-3: Impact assessment summary table for the operational phase for CCM
Scenario Impact
Severity/
Nature of
Impact
Duration of Impact
Spatial Scale of Impacts
Consequence Probability SIGNIFICANCE
Additionally mitigated without generator
PM2.5 M M L M M Medium
PM10 M M L M L Medium
Dustfall L M L L L Low
SO2 L M L L L Low
NO2 L M L L L Low
CO L M L L L Low
DPM L M L L L Low
Additionally mitigated with generator
PM2.5 M M L M M Medium
PM10 M M L M M Medium
Dustfall L M L L L Low
SO2 L M L L L Low
NO2 L M L L L Low
CO L M L L L Low
DPM L M L L L Low

Air Quality Specialist Impact Assessment Report for the proposed Commissiekraal Coal Mine
Report No.: 13SLR02 Final v2 7-1
7 CONCLUSIONS AND RECOMMENDATIONS
7.1 Main Conclusions
The main conclusion is that the proposed CCM operations are likely to result in exceedances of the NAAQS for PM2.5, PM10
and the NDCRs for dustfall at sensitive receptors located near the mine boundary with no mitigation in place. With the design
mitigation measures in place (water sprays on unpaved roads, at crushers, screens, product materials handling points and
the product stockpile), the area of impact would reduce significantly but it is still unlikely to result in compliance to national
standards and regulations at sensitive receptors, especially on a cumulative basis. Hooding combined with fabric filters at the
crushers and screens instead of water sprays, as well as additional water sprays on the unpaved roads and at the stockpiles,
are likely to reduce the impact area where the standards and regulations are exceeded to only one on-site receptor and not
off-site. Exceedances of the NAAQS for NO2 is predicated at sensitive receptors located near the mine boundary with no
mitigation in place; assuming 20% of vehicle NOx emissions are NO2 and 100% of generator NOx emissions are NO2.
The environmental significance of the project operations is high without mitigation applied, medium-high with design
mitigation and medium with additional mitigation applied. The change from high to medium environmental significance would
advocate the use of additional mitigation measures, specifically on the access road where the environmental significance at
the sensitive receptors within 210 m from the road edge is high.
7.2 Recommendations
It is recommended that the proposed management and mitigation measures as set out in Section 5 be implemented over and
above what is included as part of the CCM design. Recommendations include:
Water sprays on unpaved road surfaces should achieve at least 75% CE;
Water sprays at product materials handling points and product stockpile to achieve 50% CE;
Hooding with fabric filters at crusher and screen (to achieve up to 83% CE);
The diesel generator should be fitted with a low NOx burner; and
Dustfall; ambient PM10 and PM2.5 sampling.
Air Quality Specialist Impact Assessment Report for the proposed Commissiekraal Coal Mine
Report No.: 13SLR02 Final v2 8-1
8 REFERENCES
Alade, L.O., 2010. Characteristics of particulate matter over the South African industrialized Highveld. Master of Science
Research Report, School of Geography, Archaeology and Environmental Studies, University of the Witwatersrand,
Johannesburg.
ASG, 2011. Air Quality Modelling Data Sets: The Atmospheric Studies Group at TRC. Retrieved September 11, 2011, from
The Atmospheric Studies Group at TRC: http://www.src.com
AMS, 2014. Glossary of Meteorology. [Online] Available at: http://glossary.ametsoc.org/wiki/ [Accessed 2 June 2014].
ASTM Standard D1739-70, 1998. Standard Test Method for Collection and Measurement of Dustfall (Settleable Particulate
Matter), ASTM International: West Conshohocken, PA, 4 pp.
ASTM Standard D1739-98, 2004. Standard test Method for Collections and Measurement of Dustfall (Settleable Particulate
Matter). American Society for Testing and Materials.
Burger, L.W., Held, G. and Snow, N.H., 1997. Revised User's Manual for the Airborne Dust Dispersion Model from Area
Sources (ADDAS). Eskom TSI Report No. TRR/T97/066.
Burger, L.W., 2010. Complexities in the estimation of emissions and impacts of wind generated fugitive dust. Proceedings of
the National Association for Clean Air Conference, Polokwane 13 – 15 October 2010.
CEPA/FPAC Working Group 1998. National Ambient Air Quality Objectives for Particulate Matter. Part 1: Science
Assessment Document, A Report by the Canadian Environmental Protection Agency (CEPA) Federal-Provincial Advisory
Committee (FPAC) on Air Quality Objectives and Guidelines.
CERC, 2004. ADMS Urban Training. Version 2. Unit A.
Cowherd, C., and Englehart, J.; 1984. Paved Road Particulate Emissions, EPA-600/7-84-077, US Environmental
Protection Agency, Cincinnati, OH.
Cowherd, C., Muleski, G. and Kinsey, J., 1988. Control of Open Fugitive Dust Sources, US Environmental Protection
Agency, North Carolina.
DEA, 2009. National Environmental Management: Air Quality Act, 39 of 2004, National Ambient Air Quality Standards 1210.
Government Gazette 32816. Republic of South Africa: s.n.
DEA, 2012. National Environmental Management: Air Quality Act, 39 of 2004, National Ambient Air Quality Standard for
Particulate Matter with Aerodynamic Diameter less than 2.5 micron metres (PM2.5). Government Gazette 35463. Republic of
South Africa: s.n.
DEA, 2013. National Environmental Management: Air Quality Act, 39 of 2004, National Dust Control Regulations.
Government Gazette 36974. Republic of South Africa: s.n.
Ernst, W. 1981. Monitoring of particulate pollutants. In L. Steubing, & H.-J. Jager, Monitoring of Air Pollutants by Plants:
Methods and Problems. The Hague: Dr W Junk Publishers.
Farmer, A.M. 1993 "The Effects of dust on vegetation-A review." Environmental Pollution 79: 63-75.
Grantz, D.A., Garner, J.H.B. and Johnson, D.W., 2003. Ecological effects of particulate matter. Env. Int 29 pp 213-239.
Hanna, S. R., Egan, B. A., Purdum, J. & Wagler, J., 1999. Evaluation of ISC3, AERMOD, and ADMS Dispersion Models
with Observations from Five Field Sites, s.l.: s.n.
Harmens, H., Mills, G., Hayes, F., Williams, P., and De Temmerman, L., 2005. Air Pollution and Vegetation. The
International Cooperative Programme on Effects of Air Pollution on Natural Vegetation and Crops Annual Report 2004/2005.

Air Quality Specialist Impact Assessment Report for the proposed Commissiekraal Coal Mine
Report No.: 13SLR02 Final v2 8-2
Holland R.E., Carson, T.L., and Donham, K.J., 2002. Chapter 6.2: Animal Health Effects. In: Iowa concentrated animal
feeding operations air quality study. Iowa State University.
http://www.deq.state.or.us/aq/dairy/docs/appendix/appendix_L.pdf#page=115. Access date: 2012-03-27.
Horzinek, M.C., and Lutz, H., 2001. Veterinary Sciences Tomorrow , http://www.vetscite.org. Access date: 2013-05-30.
Howard, J. B., 1988. Internal Combustion Engine Fundamentals. Singapore: McGraw-Hill Book Co.
Marticorena, B., and G., Bergametti, 1995: Modelling the Atmospheric Dust Cycle: 1. Design of a Soil-Derived Dust
Emission Scheme. Journal of Geophysical Research, 100, 16415-16430
MFE, 2001. Good Practice Guide for Assessing and Managing the Environmental Effects of Dust Emissions, s.l.: New
Zealand Ministry for the Environment.
Naidoo, G. and Chirkoot, D., 2004. The effects of coal dust on photosynthetic performance of the mangrove, Avicennia
marina in Richards Bay, South Africa. Environmental Pollution 127 359–366.
NPI, 2008. Emission Estimation Technique Manual for Combustion Engines. Version 3. Australian Government Department
of the Environment, Water, Heritage and the Arts.
NPI, 2012. Emission Estimation Technique Manual for Mining. Version 3.1. Australian Government Department of
Sustainability, Environment, Water, Population and Communities.
Onursal, B. & Gautam, S., 1997. Vehicular Air Pollution: Experiences from Seven Latin American Urban Centers, World
Bank Technical Paper No. 373, Washington DC.: World Bank.
Shao, Y., 2008. Physics and Modelling of Wind Erosion. Atmospheric and Oceanographic Science Library, 2nd Revised and
Expanded Edition, Springer Science.
Spencer, S., 2001. Effects of coal dust on species composition of mosses and lichens in an arid environment. Arid
Environments 49, 843-853.
Tiwary, A., and Colls, J., 2010. Air pollution: measurement, monitoring and mitigation. 3rd Edition ed. Oxon: Routledge.
US EPA, 1995. AP-42, 5th Edition, Volume I, Chapter 13: Miscellaneous Sources, 13.2.3 Heavy Construction Operations.
[Online] Available at: http://www.epa.gov/ttn/chief/ap42/
US EPA, 1996. Compilation of Air Pollution Emission Factors (AP-42), 6th Edition, Volume 1, as contained in the AirCHIEF
(AIR Clearinghouse for Inventories and Emission Factors) CD-ROM (compact disk read only memory), US Environmental
Protection Agency, Research Triangle Park, North Carolina.
US EPA, 2006a. AP-42, 5th Edition, Volume I, Chapter 13: Miscellaneous Sources, 13.2.2 Unpaved Roads. [Online]
Available at: http://www.epa.gov/ttn/chief/ap42/
US EPA, 2006b. AP-42, 5th Edition, Volume I, Chapter 13: Miscellaneous Sources, 13.2.5 Industrial Wind Erosion. [Online]
Available at: http://www.epa.gov/ttn/chief/ap42/
Zunckel, M., Venjonoka, K., Pienaar, J. J., Brunke, E.-G., Pretorius, O., Koosialee, A., van Tienhoven, A. M., 2004.
Surface Ozone over Southern Africa: Synthesis of Monitoring Results during the Cross Bortder Air Pollution Impact
Assessment Project. Atmospheric Environment, 38, 6139-6147.

Air Quality Specialist Impact Assessment Report for the proposed Commissiekraal Coal Mine
Report No.: 13SLR02 Final v2 9-1
9 APPENDIX A: EMISSIONS QUANTIFICATION METHODOLOGY
In the quantification of fugitive emissions such as fugitive dust releases from wind entrainment, vehicle entrainment, mining
operations and materials handling it is recommended that use be made of emission factors. Given that no local emission
factors are available it is proposed that reference be made to factors that are widely used internationally. The US EPA AP-42
Emission Factor Data Base is widely used for the quantification of fugitive and diffuse sources. Although this data base does
not separately address processing operations it provides a comprehensive list of emission factors for use in mining and
industrial processes. Separate emission factors are given for specific particle size ranges, viz. fine particulates in the
inhalable range (PM10) and TSP. TSP is quantified for the purpose of assessing dust nuisance impact potentials, whereas
PM10 is of concern due to the potential for human health risks associated with this Inhalable fraction.
9.1 Fugitive Dust Emission Estimation
In the quantification of fugitive dust emissions such as materials handling operations and wind entrainment from tailings
storage facilities use was primarily made of US EPA and NPI emission estimation factors and protocols.
9.1.1 Vehicle entrained dust from unpaved roads
Vehicle-entrained dust emissions have been found to account for a great portion of fugitive dust emissions from mining
operations. The force of the wheels of vehicles travelling on the on-site unpaved roads causes the pulverisation of surface
material. Particles are lifted and dropped from the rotating wheels, and the road surface is exposed to strong air currents in
turbulent shear with the surface. The turbulent wake behind the vehicle continues to act on the road surface after the vehicle
has passed. The quantity of dust emissions from unpaved roads varies linearly with the volume of traffic.
The unpaved road size-specific emission factor equation of the US EPA, used in the quantification of emissions, is given as
follows:
E = k*(s/12)a*(W/3)b*281.9 (1)
where,
E = emissions in g of particulates per vehicle kilometer travelled (g/VKT)
k = particle size multiplier (dimensionless);
S = silt content of road surface material (%);
W = mean vehicle weight (tonnes)
The particle size multiplier in the equation (k) varies with aerodynamic particle size range and is given as 0.15 for PM2.5, 1.5
for PM10 and 4.9 for TSP. The constants a and b are given as 0.9 and 0.45 respectively for PM2.5, 0.9 and 0.45 respectively
for PM10 and as 0.7 and 0.45 respectively for TSP.
9.1.2 Materials handling
The quantity of dust that will be generated from miscellaneous materials handling operations will depend on various climatic
parameters, such as wind speed and precipitation, in addition to non-climatic parameters such as the nature and volume of
the material handled. Fine particulates are most readily disaggregated and released to the atmosphere during the material
transfer process, as a result of exposure to strong winds. Increases in the moisture content of the material being transferred
would decrease the potential for dust emission, since moisture promotes the aggregation and cementation of fines to the

Air Quality Specialist Impact Assessment Report for the proposed Commissiekraal Coal Mine
Report No.: 13SLR02 Final v2 9-2
surfaces of larger particles. The following US EPA AP42 predictive equation was used to estimate emissions from material
transfer operations:
E = k*0.0016*(U/2.3)1.3*(M/2)1.4 (2)
where,
E = emissions in kg of particles per tonne of material transferred
U = mean wind speed (m/s)
M = material moisture content (%)
k = particle size multiplier (kPM2.5 = 0.053; kPM10 = 0.35; kTSP = 0.74)
9.1.3 Crushing and screening
Crushing and screening operations can be a significant dust-generating source if uncontrolled. Dust fallout in the vicinity of
crushers also give rise to the potential for re-entrainment of dust by vehicles or by wind at a later date. The large percentage
of fines in the deposited material enhances the potential for it to become airborne.
Primary crushing, secondary crushing and screening will occur at the mine. Fugitive dust emissions due to the crushing and
screening operations for mine were quantified using the NPI single valued emission factors for such operations. Emissions
factors are provided for high moisture ore (moisture in excess of 4%) and low moisture ore (moisture less than 4%) (Table
9-1).
The crushing emission factors include emissions from the loading of crusher hoppers, crushing and unloading of crushers.
The PM2.5 emission factor is assumed to be 50% of the PM10 emission factor.
Table 9-1: Emission factors for metallic minerals crushing and screening
Source
Emission Factor (kg/tonne material processed)
Low Moisture Material(a) High Moisture Material(b)
PM10 TSP PM10 TSP
Primary crushing 0.02 0.2 0.004 0.01
Secondary crushing 0.04 0.6 0.012 0.03
Tertiary crushing 0.08 1.40 0.01 0.03
Screening 0.06 0.06 - -
Notes:
(a) Moisture content of 4% or less
(b) Moisture content more than 4%
9.1.4 Ventilation
Table 9-2: SA occupational exposure limits (OEL)
SA OEL PM2.5 PM10
mg/m³ 3 10

Air Quality Specialist Impact Assessment Report for the proposed Commissiekraal Coal Mine
Report No.: 13SLR02 Final v2 9-3
Notes:
(a) 100% of the PM10 SA OEL is used for total particulates.
The SA OELs in mg/m³ were multiplied by the volumetric flow in m³/s to get the emission value in mg/s. The emission value
in g/s was input into the model.
9.1.5 Wind Erosion
Wind erosion is a complex process, including three different phases of particle entrainment, transport and deposition. It is
primarily influenced by atmospheric conditions (e.g. wind, precipitation and temperature), soil properties (e.g. soil texture,
composition and aggregation), land-surface characteristics (e.g. topography, moisture, aerodynamic roughness length,
vegetation and non-erodible elements) and land-use practice (e.g. farming, grazing and mining) (Shao, 2008).
Windblown dust generates from natural and anthropogenic sources. For wind erosion to occur, the wind speed needs to
exceed a certain threshold, called the threshold velocity. This relates to gravity and the inter-particle cohesion that resists
removal. Surface properties such as soil texture, soil moisture and vegetation cover influence the removal potential.
Conversely, the friction velocity or wind shear at the surface, is related to atmospheric flow conditions and surface
aerodynamic properties. Thus, for particles to become airborne, the wind shear at the surface must exceed the gravitational
and cohesive forces acting upon them, called the threshold friction velocity (Shao, 2008).
Saltation and suspension are the two modes of airborne particles in the atmosphere. The former relates to larger sand
particles that hop and can be deposited as the wind speed reduces or changes. Suspension refers to the finer dust particles
that remain suspended in the atmosphere for longer and can disperse and be transported over large distances. It should be
noted that wind erosion involves complex physics that is not yet fully understood (Shao, 2008).
Airshed has developed an in-house wind erosion model called ADDAS (Burger et al., 1997; Burger, 2010). This model,
developed for specific use by Eskom in the quantification of fugitive emissions from its ash dumps, is based on the dust
emission models proposed by Marticorena and Bergametti (1995) and more recently the one by Shao (2008). The model
attempts to account for the variability in source erodibility through the parameterisation of the erosion threshold (based on
the particle size distribution of the source) and the roughness length of the surface. In the quantification of wind erosion
emissions, the model incorporates the calculation of two important parameters, viz. the threshold friction velocity of each
particle size, and the vertically integrated horizontal dust flux, in the quantification of the vertical dust flux (i.e. the emission
rate).
In the quantification of wind erodable emissions, the model incorporates the calculation of two important parameters, viz. the
threshold friction velocity of each particle size, and the vertically integrated horizontal dust flux, in the quantification of the
vertical dust flux (i.e. the emission rate). The equations used are as follows:
)6134.0(10 C
ii GE (3)
where,
)1)(1(261.023
iia
i RRUg
G
(4)
U
UR it
i (5)

Air Quality Specialist Impact Assessment Report for the proposed Commissiekraal Coal Mine
Report No.: 13SLR02 Final v2 9-4
and,
Ei = Emission rate (size category i)
C = clay content (%)
a = air density
g = gravitational acceleration
U* = frictional velocity
Ut*i = threshold frictional velocity (size category i)
Dust mobilisation occurs only for wind velocities higher than a threshold value, and is not linearly dependent on the wind
friction and velocity. The threshold friction velocity, defined as the minimum friction velocity required to initiate particle
motion, is dependent on the size of the erodible particles and the effect of the wind shear stress on the surface. The
threshold friction velocity decreases with a decrease in the particle diameter, for particles with diameters >60 µm. Particles
with a diameter <60 µm result in increasingly high threshold friction velocities, due to the increasingly strong cohesion forces
linking such particles to each other (Marticorena and Bergametti, 1995). The relationship between particle sizes ranging
between 1 µm and 500 µm and threshold friction velocities (0.24 m/s to 3.5 m/s), estimated based on the equations
proposed by Marticorena and Bergametti (1995), is illustrated in Figure 10-1.
The logarithmic wind speed profile may be used to estimate friction velocities from wind speed data recorded at a reference
anemometer height of 10 m (US EPA, 2006b):
10
* 053.0 UU (6)
(This equation assumes a typical roughness height of 0.5 cm for open terrain, and is restricted to large relatively flat piles or
exposed areas with little penetration into the surface layer.)
Equivalent friction velocity can also be calculated using a re-arrangement of the logarithmic distribution of the wind speed
profile in the surface boundary (US EPA, 2006b):
(7)
where,
= friction velocity (m/s)
K = von Karma’s constant (0.41)
Z = wind speed height (in this case 10 m)
Z0 = wind speed height (in this case 10 m)

Air Quality Specialist Impact Assessment Report for the proposed Commissiekraal Coal Mine
Report No.: 13SLR02 Final v2 9-5
Figure 9-1: Relationship between particle sizes and threshold friction velocities using the calculation method
proposed by Marticorena and Bergametti (1995).
The wind speed variation over the dump was based on the work of Cowherd et al. (1988). With the aid of physical modelling,
the US EPA (2006b) has shown that the frontal face of an elevated pile (i.e. windward side) is exposed to wind speeds of the
same order as the approach wind speed at the top of the pile. The ratios of surface wind speed (us) to approach wind speed
(ur), derived from wind tunnel studies for two representative pile shapes, are indicated in Figure 9-2 (viz. a conical pile, and
an oval pile with a flat top and 37° side slope. The contours of normalised surface wind speeds are indicated for the oval,
flat top pile for various pile orientations to the prevailing direction of airflow. (The higher the ratio, the greater the wind
exposure potential.)
Particle size distribution data were taken from similar operations. The particle size distribution was taken into account both in
the estimation of emissions and in the simulation of resultant dust fall and ambient PM10 concentrations.
Particle Size vs Threshold Friction Velocity
0.0
0.5
1.0
1.5
2.0
2.5
3.0
3.5
4.0
4.5
5.0
5.5
1 10 100 1000
Particle Size (µm)
Th
resh
old
Fri
cti
on
Velo
cit
y (
m/s
)

Air Quality Specialist Impact Assessment Report for the proposed Commissiekraal Coal Mine
Report No.: 13SLR02 Final v2 9-6
Figure 9-2: Contours of normalised surface wind speeds (i.e. surface wind speed/ approach wind speed) (after US
EPA, 1996).
9.2 Vehicle Exhausts
PM2.5, PM10, CO, NOx and SO2 emission factors published by the NPI (NPI, 2008) for diesel vehicles are provided in Table
9-3. The diesel SO2 emission factor is based on 10 ppm sulphur content.
Table 9-3: Vehicle exhaust emission factors
Mobile Equipment Type Unit PM2.5 PM10 CO NOx SO2 VOCs
Diesel Vehicle Exhaust Emissions (miscellaneous)
kg/l 3.30x10-03 3.60x10-03 1.86x10-02 4.50x10-02 2.40x10-05 4.20x10-03

Air Quality Specialist Impact Assessment Report for the proposed Commissiekraal Coal Mine
Report No.: 13SLR02 Final v2 10-1
10 APPENDIX B: DESCRIPTION OF SUITABLE ADDITIONAL POLLUTION ABATEMENT MEASURES
10.1 Crushing
The use of shrouds or enclosures for crushers can contain the dust so that a dust control system can operate more
efficiently. The following measures are recommended for higher emission control effeciencies:
A crusher feed box with a minimum number of openings should be installed;
Rubber curtains should be used to minimize dust escape and air flow;
The crusher should be choke fed to reduce air entrainment and dust emission; and
Dust escape at the crusher discharge end can be minimized by properly designed and installed transfer chutes.
Dust from crushers is normally controlled by water sprays and local exhaust ventilation from the crusher enclosure. The
amount of water needed to do the job is hard to specify since it depends on the type of material crushed and the degree to
which water will cause downstream handling problems. If the ore is dry a starting point would be to add a water quantity
equivalent to 1% of the weight of the material being crushed. The nozzle pressure of sprays should avoid stirring the dust
cloud and reducing the capture efficiency of the ventilation system.
The amount of air required for dust control depends on how much the crusher can be enclosed. Enough air should be
exhausted from a plenum under the crusher to produce a strong in-draught around the crusher.
Emission reductions that can typically be afforded are as follows (NPI, 2012):
65% for hooding with cyclones
75% for hooding with scrubbers
83% for hooding with fabric filters

Air Quality Specialist Impact Assessment Report for the proposed Commissiekraal Coal Mine
Report No.: 13SLR02 Final v2 11-1
11 APPENDIX C: IMPACT SIGNIFICANCE METHODOLOGY
Table 11-1: Criteria for assessment of impacts
PART A: DEFINITION AND CRITERIA*
Definition of SIGNIFICANCE Significance = consequence x probability
Definition of CONSEQUENCE Consequence is a function of severity, spatial extent and duration
Criteria for ranking of the SEVERITY of environmental impacts
H Substantial deterioration (death, illness or injury). Recommended level will often be violated. Vigorous community action.
M Moderate/ measurable deterioration (discomfort). Recommended level will occasionally be violated. Widespread complaints.
L Minor deterioration (nuisance or minor deterioration). Change not measurable/ will remain in the current range. Recommended level will never be violated. Sporadic complaints.
L+ Minor improvement. Change not measurable/ will remain in the current range. Recommended level will never be violated. Sporadic complaints.
M+ Moderate improvement. Will be within or better than the recommended level. No observed reaction.
H+ Substantial improvement. Will be within or better than the recommended level. Favourable publicity.
Criteria for ranking the DURATION of impacts
L Quickly reversible. Less than the project life. Short term
M Reversible over time. Life of the project. Medium term
H Permanent. Beyond closure. Long term.
Criteria for ranking the SPATIAL SCALE of impacts
L Localised - Within the site boundary.
M Fairly widespread – Beyond the site boundary. Local
H Widespread – Far beyond site boundary. Regional/ national
PART B: DETERMINING CONSEQUENCE
SEVERITY = L
DURATION Long term H Medium Medium Medium
Medium term M Low Low Medium
Short term L Low Low Medium
SEVERITY = M
DURATION Long term H Medium High High
Medium term M Medium Medium High
Short term L Low Medium Medium
SEVERITY = H
DURATION Long term H High High High
Medium term M Medium Medium High
Short term L Medium Medium High
L M H
Localised
Within site boundary
Site
Fairly widespread
Beyond site boundary
Local
Widespread
Far beyond site boundary
Regional/ national
SPATIAL SCALE
PART C: DETERMINING SIGNIFICANCE
PROBABILITY
(of exposure to impacts)
Definite/ Continuous H Medium Medium High
Possible/ frequent M Medium Medium High
Unlikely/ seldom L Low Low Medium

Air Quality Specialist Impact Assessment Report for the proposed Commissiekraal Coal Mine
Report No.: 13SLR02 Final v2 11-2
L M H
CONSEQUENCE
PART D: INTERPRETATION OF SIGNIFICANCE
Significance Decision guideline
High It would influence the decision regardless of any possible mitigation.
Medium It should have an influence on the decision unless it is mitigated.
Low It will not have an influence on the decision.
*H = high, M= medium and L= low and + denotes a positive impact.

Air Quality Specialist Impact Assessment Report for the proposed Commissiekraal Coal Mine
Report No.: 13SLR02 Final v2 12-1
12 APPENDIX D: AIR QUALITY SENSITIVE RECEPTORS’ LOCATIONS
Table 12-1: Location of points of interest near CCM
ID Latitude Longitude
S1 -27.418737 30.414718
S2 -27.421867 30.414038
S3 -27.423752 30.415876
S4 -27.419845 30.423089
S5 -27.421554 30.422264
S6 -27.423500 30.423996
S7 -27.424080 30.427899
S8 -27.428338 30.433081
S9 -27.424811 30.433140
S10 -27.427862 30.436554
S11 -27.423964 30.436901
S12 -27.423103 30.435549
S13 -27.422413 30.435385
S14 -27.427217 30.440986
S15 -27.425019 30.439703
S16 -27.424131 30.438774
S17 -27.422033 30.438007
S18 -27.418981 30.435857
S19 -27.423323 30.440534
S20 -27.422698 30.441734
S21 -27.427896 30.444382
S22 -27.425531 30.446072
S23 -27.42637 30.448396
S24 -27.423433 30.448434
S25 -27.421212 30.448417
S26 -27.418065 30.449156
S27 -27.427772 30.454322
S28 -27.430961 30.457739
S29 -27.430119 30.459352
S30 -27.4295 30.460579
S31 -27.429979 30.463454
S32 -27.424091 30.463121
S33 -27.421285 30.464905
S34 -27.426098 30.472474

Air Quality Specialist Impact Assessment Report for the proposed Commissiekraal Coal Mine
Report No.: 13SLR02 Final v2 12-2
ID Latitude Longitude
S35 -27.425172 30.470034
S36 -27.420685 30.469541
S37 -27.419231 30.469475
S38 -27.417722 30.477174
S39 -27.405773 30.424743
S40 -27.405807 30.423044
S41 -27.433217 30.413302
S42 -27.432819 30.409204
S43 -27.435213 30.411432
S44 -27.431658 30.405352
S45 -27.432718 30.402347
S46 -27.43883 30.405437
S47 -27.435619 30.399061
S48 -27.440654 30.400607
S49 -27.443607 30.393713
S50 -27.463358 30.42562
S51 -27.41531 30.404164
S52 -27.414554 30.40359
S53 -27.40786 30.400225
S54 -27.403056 30.40255
S55 -27.410527 30.392909
S56 -27.413035 30.391248
S57 -27.39546 30.402303
S58 -27.39449 30.404048
S59 -27.393904 30.401591
S60 -27.394014 30.404958
S61 -27.390726 30.398542
S62 -27.389269 30.397431
S63 -27.389656 30.399671
S64 -27.387155 30.398579
S65 -27.392524 30.401791
S66 -27.392117 30.40493
S67 -27.391104 30.405435
S68 -27.390467 30.418277
S69 -27.391075 30.420712
S70 -27.39688 30.430853
S71 (School) -27.395902 30.432526
S72 -27.396114 30.434617
S73 -27.395162 30.435675

Air Quality Specialist Impact Assessment Report for the proposed Commissiekraal Coal Mine
Report No.: 13SLR02 Final v2 12-3
ID Latitude Longitude
S74 -27.396516 30.437067
S75 -27.396558 30.438048
S76 -27.396541 30.440334
S77 -27.396454 30.443412
S78 -27.392907 30.448479
S79 -27.392003 30.44771
S80 -27.401316 30.471367
S81 -27.407116 30.482105
S82 -27.446644 30.47736
S83 -27.426539 30.445126
S84 -27.39614 30.439805
S85 -27.395956 30.440209
S86 -27.400738 30.412147
S87 -27.390832 30.407696
S88 -27.390754 30.408813
S89 -27.391213 30.398227
S90 -27.390715 30.397403
S91 -27.385415 30.397463
S92 -27.439441 30.388775
S93 -27.436208 30.381298
S94 -27.460864 30.382564
S95 -27.462893 30.388704
S96 -27.46689 30.388116
S97 -27.462975 30.390337
S98 -27.464547 30.393223
S99 -27.455323 30.402763
S100 -27.456806 30.406952
S101 -27.451061 30.416814
S102 -27.466149 30.415391
S103 -27.463913 30.4229
S104 -27.437176 30.409621
S105 -27.466699 30.430468
S106 -27.457775 30.465192
S107 -27.456935 30.466682
S108 -27.458128 30.466983
S109 -27.426508 30.46122
S110 -27.468994 30.409325

Air Quality Specialist Impact Assessment Report for the proposed Commissiekraal Coal Mine
Report No.: 13SLR02 Final v2 13-1
13 APPENDIX E: EXCEEDENCE TABLES
AQSRs at which exceedences occur are marked with a tick in the tables below.
Table 13-1: Unmitigated operational phase
Unmitigated
Receptor PM2.5 Annual PM2.5 Daily FOE for 40 µg/m² PM10 Annual PM10 Daily FOE for 75 µg/m² Dustfall
S4 (4 days)
S5 (4 days)
S6 (7 days)
(14 days)
S7
(15 µg/m³)
(33 days)
(42 µg/m³)
(58 days)
S8
S9
(112 µg/m³)
(209 days)
(274 µg/m³)
(225 days)
(16 007 mg/m²/day)
S10 (33 days)
(39 days)
S11 (27 days)
(32 days)
S12 (22 days)
(29 days)
S13 (17 days)
(22 days)
S14 (11 days)
(16 days)

Air Quality Specialist Impact Assessment Report for the proposed Commissiekraal Coal Mine
Report No.: 13SLR02 Final v2 13-2
S15 (13 days)
(18 days)
S16 (15 days)
(20 days)
S17 (6 days)
(9 days)
S18 (4 days)
(7 days)
S19 (6 days)
(10 days)
S20 (5 days)
S21 (4 days)
S22
S83
Table 13-2: Design mitigated operational phase
Design mitigated
Receptor PM2.5 Annual PM2.5 Daily FOE for 40 µg/m² PM10 Annual PM10 Daily FOE for 75
µg/m² Dustfall
S4
S5
S6

Air Quality Specialist Impact Assessment Report for the proposed Commissiekraal Coal Mine
Report No.: 13SLR02 Final v2 13-3
S7 (10 days)
(21 days)
S8
S9
(65 µg/m³)
(165 days)
(140 µg/m³)
(179 days)
(8 617 mg/m²/day)
S10 (7 days)
(13 days)
S11 (7 days)
(11 days)
S12 (8 days)
(10 days)
S13 (7 days)
(10 days)
S14 (4 days)
S15
S16 (4 days)
S17
S18
S19
S20
S21
S22

Air Quality Specialist Impact Assessment Report for the proposed Commissiekraal Coal Mine
Report No.: 13SLR02 Final v2 13-4
S83
Table 13-3: Additionally mitigated operational phase
Additionally mitigated
Receptor PM2.5 Annual PM2.5 Daily FOE for 40 µg/m² PM10 Annual PM10 Daily FOE for 75
µg/m² Dustfall
S4
S5
S6
S7
S8
S9
(26 µg/m³)
(67 days)
(58 µg/m³)
(95 days)
(3 521 mg/m²/day)
S10
S11
S12
S13

Air Quality Specialist Impact Assessment Report for the proposed Commissiekraal Coal Mine
Report No.: 13SLR02 Final v2 13-5
S14
S15
S16
S17
S18
S19
S20
S21
S22
S83

Air Quality Specialist Impact Assessment Report for the proposed Commissiekraal Coal Mine
Report No.: 13SLR02 Final v2 14-1
14 APPENDIX F: DUST EFFECTS ON VEGETATION AND ANIMALS
14.1 Dust Effects on Vegetation
Suspended particulate matter can produce a wide variety of effects on the physiology of vegetation that in many cases
depend on the chemical composition of the particle. Heavy metals and other toxic particles have been shown to cause
damage and death of some species as a result of both the phytotoxicity and the abrasive action during turbulent deposition
(Harmens et al, 2005). Heavy loads of particle can also result in reduced light transmission to the chloroplasts and the
occlusion of stomata (Harmens et al, 2005; Naidoo and Chirkoot, 2004), decreasing the efficiency of gaseous exchange
(Harmens et al, 2005; Naidoo and Chirkoot, 2004, Ernst, 1981) and hence water loss (Harmens et al, 2005). They may also
disrupt other physiological processes such as budbreak, pollination and light absorption/reflectance (Harmens et al, 2005).
The chemical composition of the dust particles can also affect the plant and have indirect effects on the soil pH (Spencer,
2001).
To determine the impact of dust deposition on vegetation, two factors are of importance: (i) Does dust collect on vegetation
and if it does, what are the factors influencing the rate of deposition (ii) Once the dust has deposited, what is the impact of
the dust on the vegetation?
Regarding the first question, there is adequate evidence that dust does collect on all types of vegetation. Any type of
vegetation causes a change in the local wind fields, with an increase in turbulence which enhances the collection efficiency.
The characteristics of the vegetation influences the rate; the larger the “collecting elements” (branches and leaves), the
lower the impaction efficiency per element. This would seem to indicate that, for the same volume of tree/shrub canopy,
finer leaves will have a better collection efficiency. However, the roughness of the leaves themselves and particularly the
presence of hairs on the leaves and stems plays a significant role, with veinous surfaces increasing deposition of 1-5 micron
particles by up to seven times compared to smooth surfaces. Collection efficiency rises rapidly with particle size; for
moderate wind speeds wind tunnel studies show a relationship of deposition velocity on the fourth power of particle size
(Tiwary and Colls 2010). In wind tunnel studies , windbreaks or “shelter belts” of three rows of trees has shown a decrease
in 35 to 56% in the downwind mass transport of inorganic particles.
On the effect of particulate matter once it is deposited on vegetation, this depends on the composition of the dust.
Internationally it is recognised that there are major differences in the chemical composition of the fine PM (the fraction
between 0 and 2.5 µm in aerodynamic diameter) and coarse PM (the fraction between 2.5 µm and 10 µm in aerodynamic
diameter). The former is often the result of chemical reactions in the atmosphere and may have a high proportion of black
carbon, sulphate and nitrate, whereas the latter often consist of primary particles resulting from abrasion, crushing, soil
disturbances and wind erosion (Grantz et al. 2003). Sulphate is however often hygroscopic and may exist in significant
fractions in coarse PM. Alade 2010. Grantz et al (op .cit.) do however indicate that sulphate is much less phototoxic than
gaseous sulphur dioxide and that “it is unusual for injurious levels of particular sulphate to be deposited upon vegetation”.
Naidoo and Chirkoot conducted a study during the period October 2001 to April 2002 to investigate the effects of coal dust
on Mangroves in the Richards Bay harbour. The investigation was conducted at two sites where 10 trees of the Mangrove
species: Avicennia Marina were selected and mature, fully exposed, sun leaves tagged as being covered or uncovered with
coal dust. From the study it was concluded that coal dust significantly reduced photosynthesis of upper and lower leaf
surfaces. The reduced photosynthetic performance was expected to reduce growth and productivity. In addition, trees in
close proximity to the coal stockpiles were in poorer health than those further away. Coal dust particles, which are
composed predominantly of carbon were found not to be toxic to the leaves; neither wasit found that it occlude stomata as
these particles were larger than fully open stomatal apertures (Naidoo and Chirkoot, 2004).

Air Quality Specialist Impact Assessment Report for the proposed Commissiekraal Coal Mine
Report No.: 13SLR02 Final v2 14-2
In general, according to the Canadian Environmental Protection Agency (CEPA), air pollution adversely affects plants in one
of two ways. Either the quantity of output or yield is reduced or the quality of the product is lowered. The former (invisible)
injury results from pollutant impacts on plant physiological or biochemical processes and can lead to significant loss of
growth or yield in nutritional quality (e.g. protein content). The latter (visible) may take the form of discolouration of the leaf
surface caused by internal cellular damage. Such injury can reduce the market value of agricultural crops for which visual
appearance is important (e.g. lettuce and spinach). Visible injury tends to be associated with acute exposures at high
pollutant concentrations whilst invisible injury is generally a consequence of chronic exposures to moderately elevated
pollutant concentrations. However given the limited information available, specifically the lack of quantitative dose-effect
information, it is not possible to define a Reference Level for vegetation and particulate matter (CEPA, 1998).
Exposure to a given concentration of airborne PM may therefore lead to widely differing phytotoxic responses, depending on
the mix of the deposited particles. The majority of documented toxic effects indicate responses to the chemical composition
of the particles. Direct effects have most often been observed around heavily industrialised point sources, but even there,
effects are often associated with the chemistry of the particulate rather than with the mass of particulate.
14.2 Dust Effects on Animals
Most of the literature regarding air quality impacts and animals, specifically cattle, refers to the impacts from feedlots on the
surrounding environment, hence where the feedlot is seen as the source of pollution. This mainly pertains to odours and
dust generation. The US EPA has recently started to focus on the control of air pollution from feed yards and dairies,
primarily regulating coarse particulate matter (Horzinek and Lutz, 2001). The National Cattle Beef Association in the USA in
response has disputed this decision based on the lack of evidence on health impacts associated with coarse dust (TSP)
concentrations.
A study was conducted by the State University of IOWA on the effects of air contaminants and emissions on animal health in
swine facilities. Air pollutants included gases, particulates, bioaerosols, and toxic microbial by-products. The main findings
were that ammonia is associated with lowered average number of pigs weaned, arthritis, porcine stress syndrome, muscle
lesions, abscesses, and liver ascarid scars. Particulates are associated with the reduction in growth and turbine pathology,
and bioaerosols could lower feed efficiency, decrease growth, and increase morbidity and mortality. The study concurred
the lack of information on the health effects and productivity problems of air contaminants on cattle and other livestock.
Ammonia and hydrogen sulphide are regarded the two most important inorganic gases affecting the respiratory system of
cattle raised in confinement facilities, affecting the mucociliary transport and alveolar macrophage functions. With regard to
particulates, it was found that it is the fine inhalable fraction that is mainly deriving from dried faecal dust (Holland et al.,
2002). Another study conducted by DSM Nutritional Products North America indicated that calves exposed to a dust-stress
environment continued to have lower serum vitamin E concentrations.
Inhalation of confinement house dust and gases produces a complex set of respiratory responses. An individual’s response
depends on characteristics of the inhaled components (such as composition, particle size and antigenicity) and of the
individual’s susceptibility, which is tempered by extant respiratory conditions. Most of the studies concurred that the main
implication of dusty environments are causing animal stress which is detrimental to their health. However, no threshold
levels exist to indicate at what levels these are having a negative effect. In this light it was decided to use the same
screening criteria applied to human health, i.e. international standards and SA NDCR values.

Air Quality Specialist Impact Assessment Report for the proposed Commissiekraal Coal Mine
Report No.: 13SLR02 Final v2 15-1
15 APPENDIX G: CURRICULUM VITAE OF AUTHOR

Air Quality Specialist Impact Assessment Report for the proposed Commissiekraal Coal Mine
Report No.: 13SLR02 Final v2 15-2

Air Quality Specialist Impact Assessment Report for the proposed Commissiekraal Coal Mine
Report No.: 13SLR02 Final v2 15-3

Curriculum Vitae: Natasha Anne Shackleton Page 1 of 3
CURRICULUM VITAE NATASHA ANNE SHACKLETON
FULL CURRICULUM VITAE
Name of Firm Airshed Planning Professionals (Pty) Ltd
Name of Staff Natasha Anne Shackleton (nee Gresse)
Position Senior Air Quality Consultant
Profession Meteorologist employed as an Air Quality Consultant
Date of Birth 12 September 1988
Years with Firm 5 Years
Nationality South African
MEMBERSHIP OF PROFESSIONAL SOCIETIES
Golden Key International Honour Society, 2011 to present.
KEY QUALIFICATIONS
Natasha has 5 years of experience in air quality impact assessment and management. She is an
employee of Airshed Planning Professionals (Pty) Ltd and is involved in the compilation of
emission inventories, air pollution mitigation and management, and air pollution impact work.
Airshed Planning Professionals is affiliated with Francois Malherbe Acoustic Consulting cc and in
assisting with projects she has gained experience in environmental noise measurement,
modelling and assessment.
A list of projects competed in various sectors is given below.
Mining Sector
Coal mining: Argent Colliery, Commissiekraal Coal Mine, Estima Coal Project
(Mozambique), Grootegeluk Coal Mine, Matla Coal Mine, Rietvlei Coal Mine, Vuurfontein
Coal Mine.
Curriculum Vitae: Natasha Anne Shackleton Page 2 of 3
Metalliferous mines: Bakubung Platinum Mine, Bannerman Uranium Mine (Namibia),
Gold Fields’ South Deep Gold Mine, Kitumba Copper Project (Zambia), Lehating
Manganese Mine, Lesego Platinum Mine, Lofdal Mining Project (Namibia), Marula
Platinum Mine, Maseve Platinum Mine, Mkuju River Uranium Project (Tanzania),
Namakwa Sands Quartz Rejects Disposal and Mine, Otjikoto Gold Project (Namibia),
Otjikoto Gold Mine’s Wolfshag Project (Namibia), Pan Palladium Project, Perkoa Zinc
Project (Burkina Faso), Tete Iron Ore Project (Mozambique), Thabazimbi Iron Ore’s
Infinity Project, Toliara Sands Project (Madagascar), Trekkopje Uranium Mine (Namibia),
Tschudi Copper Mine (Namibia), Wayland Iron Ore Project, Zulti South Project.
Quarries: AfriSam Saldanha Cement Project Limestone Quarry.
Industrial Sector
AfriSam Saldanha Project; CAH Chlorine Caustic Soda and HCl Plant, Namakwa Sands Dryer,
Otavi Rebar Manufacturing, Pan Palladium Project, PPC Riebeeck Cement, Rare Earth Elements
Saldanha Separation Plant, Siyanda Project.
Power Generation, Oil and Gas
Hwange Thermal Power Station Project (Zimbabwe), Ibhubesi Gas Project, Expansion of
Staatsolie Power Company, Suriname Operations (Suriname).
Waste Disposal and Treatment Sector
Fishwater Flats Waste Water Treatment Works, Moz Environmental Industrial Landfill
(Mozambique).
Petroleum Sector
Puma South Africa’s Fuel Storage Facility.
Transport and Logistics Sector
Saldanha Port Project.

Curriculum Vitae: Natasha Anne Shackleton Page 3 of 3
EDUCATION
BSc (2010), University of Pretoria. Major courses completed include:
o meteorology,
o remote sensing,
o cartography,
o GIS,
o land surveying,
o mathematics, and
o physics.
BSc(Hons) Meteorology (2011), University of Pretoria. Major courses completed include:
o dynamical meteorology,
o remote sensing,
o cloud dynamics,
o cloud microphysics,
o boundary layer meteorology,
o numerical modeling applications, and
o tropical and mesoscale meteorology.
COUNTRIES OF WORK EXPERIENCE
South Africa, Botswana, Burkina Faso, Mozambique, Madagascar, Namibia, Suriname, Tanzania,
Zambia and Zimbabwe.
LANGUAGES
Speak Read Write
English Excellent Excellent Excellent
Afrikaans Good Good Good
CERTIFICCATION
I, the undersigned, certify that to the best of my knowledge and belief, these data correctly
describe me, my qualifications and my experience.
01/04/2016
Related Documents