Sliding episodes during the 2002–2003 Stromboli lava effusion: Insights from seismic, volcanic, and statistical data analysis S. Falsaperla, V. Maiolino, and S. Spampinato Istituto Nazionale di Geofisica e Vulcanologia, Sezione di Catania, P.zza Roma 2, I-95123 Catania, Italy ([email protected]) O. Jaquet In2Earth Modelling Ltd., c/o Wirtschafts-Treuhand AG, Arnold Bo ¨cklin-Strasse 25, CH-4051 Basel, Switzerland M. Neri Istituto Nazionale di Geofisica e Vulcanologia, Sezione di Catania, P.zza Roma 2, I-95123 Catania, Italy [1] Repeated phenomena of flank instability accompanied the 28 December 2002 to 21 July 2003 eruption of Stromboli volcano. The major episodes were two tsunamigenic landslides on 30 December 2002, 2 d after the volcano unrest. After 30 December, sliding processes remodeled the area affected by slope instability. We propose analyses of 565 sliding episodes taking place from December 2002 to February 2003. We try to shed light on their main seismic features and links with the ongoing seismic and volcanic activity using variogram analysis as well. A characterization of the seismic signals in the time and frequency domains is presented for 185 sliding episodes. Their frequency content is between 1 Hz and 7 Hz. On the basis of the dominant peaks and shape of the spectrum, we identify three subclasses of signals, one of which has significant energy below 2 Hz. Low-frequency signatures were also found in the seismic records of the landslides of 30 December, which affected the aerial and submarine northwestern flank of the volcano. Accordingly, we surmise that spectral analysis might provide evidence of sliding phenomena with submarine runouts. We find no evidence of sliding processes induced by earthquakes. Additionally, a negative statistical correlation between sliding episodes and explosion quakes is highlighted by variogram analysis. Variograms indicate a persistent behavior, memory, of the flank instability from 5 to 10 d. We interpret the climax in the occurrence rate of the sliding processes between 24 and 29 January 2003 as the result of favorable conditions to slope instability due to the emplacement of NW-SE aligned, dike-fed vents located near the scarp of the landslide area. Afterward, the stabilizing effect of the lava flows over the northwestern flank of the volcano limited erosive phenomena to the unstable, loose slope not covered by lava. Components: 7353 words, 12 figures. Keywords: rockfalls; seismicity; volcanoes; volcano collapses; Stromboli. Index Terms: 8419 Volcanology: Volcano monitoring (7280); 7280 Seismology: Volcano seismology (8419); 5499 Planetary Sciences: Solid Surface Planets: General or miscellaneous. Received 15 October 2007; Revised 11 February 2008; Accepted 13 February 2008; Published 15 April 2008. Falsaperla, S., V. Maiolino, S. Spampinato, O. Jaquet, and M. Neri (2008), Sliding episodes during the 2002–2003 Stromboli lava effusion: Insights from seismic, volcanic, and statistical data analysis, Geochem. Geophys. Geosyst., 9, Q04022, doi:10.1029/2007GC001859. G 3 G 3 Geochemistry Geophysics Geosystems Published by AGU and the Geochemical Society AN ELECTRONIC JOURNAL OF THE EARTH SCIENCES Geochemistry Geophysics Geosystems Article Volume 9, Number 4 15 April 2008 Q04022, doi:10.1029/2007GC001859 ISSN: 1525-2027 Click Here for Full Articl e Copyright 2008 by the American Geophysical Union 1 of 16

Welcome message from author
This document is posted to help you gain knowledge. Please leave a comment to let me know what you think about it! Share it to your friends and learn new things together.
Transcript

Sliding episodes during the 2002–2003 Stromboli lavaeffusion: Insights from seismic, volcanic, and statistical dataanalysis
S. Falsaperla, V. Maiolino, and S. SpampinatoIstituto Nazionale di Geofisica e Vulcanologia, Sezione di Catania, P.zza Roma 2, I-95123 Catania, Italy([email protected])
O. JaquetIn2Earth Modelling Ltd., c/o Wirtschafts-Treuhand AG, Arnold Bocklin-Strasse 25, CH-4051 Basel, Switzerland
M. NeriIstituto Nazionale di Geofisica e Vulcanologia, Sezione di Catania, P.zza Roma 2, I-95123 Catania, Italy
[1] Repeated phenomena of flank instability accompanied the 28 December 2002 to 21 July 2003 eruptionof Stromboli volcano. The major episodes were two tsunamigenic landslides on 30 December 2002, 2 d afterthe volcano unrest. After 30 December, sliding processes remodeled the area affected by slope instability.Wepropose analyses of 565 sliding episodes taking place from December 2002 to February 2003. We try to shedlight on their main seismic features and links with the ongoing seismic and volcanic activity using variogramanalysis as well. A characterization of the seismic signals in the time and frequency domains is presented for185 sliding episodes. Their frequency content is between 1 Hz and 7 Hz. On the basis of the dominant peaksand shape of the spectrum, we identify three subclasses of signals, one of which has significant energy below2 Hz. Low-frequency signatures were also found in the seismic records of the landslides of 30 December,which affected the aerial and submarine northwestern flank of the volcano. Accordingly, we surmise thatspectral analysis might provide evidence of sliding phenomena with submarine runouts. We find no evidenceof sliding processes induced by earthquakes. Additionally, a negative statistical correlation between slidingepisodes and explosion quakes is highlighted by variogram analysis. Variograms indicate a persistentbehavior, memory, of the flank instability from 5 to 10 d.We interpret the climax in the occurrence rate of thesliding processes between 24 and 29 January 2003 as the result of favorable conditions to slope instabilitydue to the emplacement of NW-SE aligned, dike-fed vents located near the scarp of the landslide area.Afterward, the stabilizing effect of the lava flows over the northwestern flank of the volcano limited erosivephenomena to the unstable, loose slope not covered by lava.
Components: 7353 words, 12 figures.
Keywords: rockfalls; seismicity; volcanoes; volcano collapses; Stromboli.
Index Terms: 8419 Volcanology: Volcano monitoring (7280); 7280 Seismology: Volcano seismology (8419); 5499
Planetary Sciences: Solid Surface Planets: General or miscellaneous.
Received 15 October 2007; Revised 11 February 2008; Accepted 13 February 2008; Published 15 April 2008.
Falsaperla, S., V. Maiolino, S. Spampinato, O. Jaquet, and M. Neri (2008), Sliding episodes during the 2002–2003 Stromboli
lava effusion: Insights from seismic, volcanic, and statistical data analysis, Geochem. Geophys. Geosyst., 9, Q04022,
doi:10.1029/2007GC001859.
G3G3GeochemistryGeophysics
Geosystems
Published by AGU and the Geochemical Society
AN ELECTRONIC JOURNAL OF THE EARTH SCIENCES
GeochemistryGeophysics
Geosystems
Article
Volume 9, Number 4
15 April 2008
Q04022, doi:10.1029/2007GC001859
ISSN: 1525-2027
ClickHere
for
FullArticle
Copyright 2008 by the American Geophysical Union 1 of 16
1. Introduction
[2] Stromboli volcano, on the homonymous island,is situated in the northeastern part of the Aeolianarchipelago, Italy (Figure 1). Its frequent explo-sions with ejection of ash, lapilli, and lava bombsgive the name to a typical eruptive style, the so-called Strombolian activity. Unlike its persistentexplosive activity, which has made this volcanofamous worldwide, lava effusion episodes areusually long spaced. In the past century, theyranged from mild and quite short-lived lava flowsto climactic eruptions with hot avalanches andpyroclastic flows [Barberi et al., 1993].
[3] The effusive activity during 2002–2003 createdmuch scientific interest aswell as public concern, onlypartly caused by the eruptive phenomenon itself. By28 December 2002, lava flows had begun to pourfrom a roughly 300 m long NE-trending fracture[Acocella et al., 2006], which opened at the base ofCrater 1 without seismic precursory signs[Bonaccorso et al., 2003]. The lava effusion lasted206 d, erupting 9–10 � 106 m3 of lava (mergingdata from Calvari et al. [2005] and Ripepe et al.[2005]) and making this the longest eruption in thelast 200 years. By 30 December at 1214 UT, twohuge landslides affected both the aerial part as wellas the submarine prolongation of the Sciara delFuoco (SdF; Figure 1). This is a collapse depressionformed �13 ka in the northwestern part of thevolcano, mainly filled with unconsolidated material.The landslides were associated with tsunami waves,which swept the coasts of the whole island andmoved on south and eastward, reaching Sicily andCalabria [Tinti et al., 2004]. Immediately after thetwo landslides and tsunami, the Istituto Nazionale diGeofisica e Vulcanologia (INGV) along with theItalian Civil Defense established an operational baseon Stromboli to boost the volcanic and geophysicalmonitoring, and provide scientific advice on the stateof the volcano to local and governmental authorities.The life-threatening danger caused by the anomaloussea waves and the possibility that another impendingdisastrous phenomenon could occur, led the localauthorities and Italian Civil Defense to advise theinhabitants to leave the island for a few weeks.Additionally, nonresidents were not allowed to reachStromboli until the end of February 2003. The highvolcanic risk alert lasted several months. The appro-priateness of such ameasurewas borne out on 5April2003 when a paroxysmal activity, encompassing avulcanian explosion, severely affected the craters,
partially destroying and remodeling the summitportion of the volcano. Similar paroxysms, the so-called explosive sequences, are rapid successions ofpowerful Strombolian explosions reported almostyearly from 1985 on, even though with compara-tively minor intensity [e.g., Bertagnini et al., 1999;Falsaperla and Spampinato, 2003].
[4] Detachment of a mass of material and/orcascading debris frequently occurred from theSdF throughout the 2002–2003 lava emission(Figure 2). The two main landslides of 30 Decem-ber involved a volume of over 30 � 106 m3 ofdisplaced material, �2/3 of which moved from thesubmarine portion of the SdF [Bonaccorso et al.,2003; Pino et al., 2004]. The collapse enhancedlatent instability of the scarp mostly in the form ofrockfalls and flowing debris [Falsaperla et al.,2006]. Seismic signals attributable to these phe-nomena are common on volcanoes where steepflanks and unconsolidated material yield favorableconditions to sliding. Particularly, the generationof rockfalls is well documented on andesiticvolcanoes (such as Mount St. Helens [Mellors etal., 1988], Unzen [Sato et al., 1992; Ui et al.,1999], Merapi [Voight et al., 2000], Soufriere Hillsvolcano [Calder et al., 2002]) where rockfalls andpyroclastic flows are often reported during lavadome collapses. The nature of volcanic products,ranging from calcalinic to shoshonitic [e.g.,Barberi et al., 1974], and the mild typical eruptivestyle distinguish Stromboli from the andesiticvolcanoes aforementioned. Nevertheless, flankinstability phenomena have become a topic ofincreasingly extensive study at Stromboli as well.
[5] The aim of this paper is to help reduce the gapin information concerning the beginning of theflank collapse phenomena. In particular, we pro-pose analyses of the sliding episodes occurringbetween December 2002 and February 2003, i.e.,about 1 month before and 2 months after the onsetof the effusive activity. Our study is based on theseismic records of a station permanently deployedon the island. We provide occurrence rate, ampli-tude, and duration to shed light on their distributionin time, analyze their frequency content to outlineessential features in the frequency domain, andapply variogram analysis in the time domain toexplore memory effects of the sliding phenomenaas well as statistical correlation with explosionquakes. Additionally, we discuss how the slidingepisodes can be grouped in subsets according to
GeochemistryGeophysicsGeosystems G3G3
falsaperla et al.: sliding episodes at stromboli in 2002–2003 10.1029/2007GC001859
2 of 16

Figure 1. Location of the Aeolian archipelago in the Tyrrhenian Sea, southern Italy, and map of Stromboli Island.In the map, the solid triangle and dot mark the positions of the seismic stations STR (1 s, three components) and PL1(1 s, vertical component), respectively.
Figure 2. Main structural features of the 2002–2003 Stromboli eruption (modified from Acocella et al. [2006]).Digital orthophoto taken on 6 February 2003 by Italian Civil Defense. The dashed line in the inset indicates theenlarged area. The yellow line marks the landslide margins. (1) Name (locations a–g) and altitude (m, asl) of themain vents. (2) Alignment of the main vents. (3) Eruptive fissure opened at the eruption onset. (4) Extension fracturesformed since 28 December between the summit craters (in pink) and the northern wall of the Sciara del Fuoco. Ventmigration (from locations b to f) occurred during the last week of January 2003.
GeochemistryGeophysicsGeosystems G3G3
falsaperla et al.: sliding episodes at stromboli in 2002–2003 10.1029/2007GC001859falsaperla et al.: sliding episodes at stromboli in 2002–2003 10.1029/2007GC001859
3 of 16

their spectrum, and analyze possible relationshipswith seismic and volcanic activity.
2. Data Acquisition and Characteristicsof Seismicity
[6] In the time span considered in this study, theseismic monitoring of Stromboli was carried out ata reference station STR located in the southwesternside of the island, close to the village of Ginostra(Figure 1). A second station (PL1) was alsooperative in the southern flank of the volcano(Figure 1). Both stations belonged to the permanentseismic network that monitors the Aeolian archi-pelago. STR was equipped with three short-period(1 s) Geothech S13 seismometers; PL1 had thevertical sensor only. The analog seismic signalsfrom the two stations were radio transmitted to thedata acquisition center at Lipari, which is run byINGV, and there they were acquired in digitalformat using a 12 bit A/D converter. The samplingfrequency was 160 Hz. A Virtual Private Networkover a 2 Mb/s CDN telephone line guaranteedaccess to the data at the main data acquisitioncenter in Catania in near real time.
[7] INGV has gradually boosted and upgraded theseismic network since the end of January 2003[Martini et al., 2004]. In this paper, the data covera time span over which the information from thenew network was either absent or still fragmentary.STR was chosen as reference station because of itslong operational time, ever since 1985, whichallowed characterizing seismic events recorded onthe volcano over years. In February 2003, we fill atemporary gap of data due to an instrumentalfailure at this station using the seismic records ofPL1.
[8] There are different typologiesof seismic signals atStromboli: explosion quakes, volcanic tremor, volca-no-tectonic events, explosive sequences, and rock-falls (Figure 3).
[9] Explosion quakes (Figure 3a) form the largestgroup of the aforementioned signals, with anoccurrence rate that varies according to Strombo-lian activity. Indeed, Schick and Muller [1988]observed that more than 95% of explosion quakesare linked to Strombolian eruptions. The use ofbroadband seismic stations has highlighted thepresence of very long period events, ranging froma few seconds to some tens of seconds [e.g.,Chouet et al., 1999]. The air wave associatedwith the explosions may affect the high-frequency
(>5 Hz) part of the seismic signal, as reported byBraun and Ripepe [1993] and Ripepe [1996].Overall, explosion quakes form a fairly homoge-neous group, with duration never exceeding a fewtens of seconds, and waveforms attributable to afew reference classes [e.g., Ntepe and Dorel, 1990;Falsaperla et al., 1996; Chouet et al., 1999]. Thisis evidence of a repetitive and nondestructivesource whose location, some 200 m below thecrater terrace, is surprisingly stable in time [e.g.,Neuberg and Luckett, 1996; Chouet et al., 1997,1999; Wassermann, 1997].
[10] Volcanic tremor (Figure 3b) is continuouslyrecorded as background signal. This continuityindicates the state of persistent activity of thevolcano, which, besides Strombolian eruptions, ishighlighted by continuous emission of gas andvapor from the summit vents. Dominant frequencyvalues are from 1 Hz to 6 Hz at STR, even thoughamplitude and spectral content of this signal canchange dramatically within this frequency rangeaccording to the height of the magma column[Langer and Falsaperla, 1996; Falsaperla et al.,1998].
[11] Volcano-tectonic events (Figure 3c) are earth-quakes originating within the volcanic edifice. Theoccurrence rate and seismic strain release of crustalvolcano-tectonic events from instrumental datahighlight the minor role played by processes ofbrittle failure of rocks at Stromboli [Falsaperla etal., 1999]. Historical catalogs covering the timespan from 1885 to 1977 confirm this finding, andled Falsaperla and Spampinato [1999] to hypoth-esize that crustal seismicity is affected by condi-tions which allow only a limited storage of stress.
[12] Explosive sequences (Figure 3d) are paroxysmalevents originating at the summit craters [e.g.,Bertagnini et al., 1999]. These powerful Strombolianexplosions are associated with a typical seismicsignature, which consists of a rapid succession ofexplosion quakes along with a temporary increase inthe amplitude of volcanic tremor. The occurrence rateis twice yearly on average, even though years with noparoxysms are almost as frequent as years with morethan three explosive sequences [Falsaperla andSpampinato, 2003].
[13] Rockfalls are associatedwith a typologyof signals(Figure 3e) which has barely drew attention before theclimactic landslide episodes of 30 December 2002described by Bonaccorso et al. [2003] and Pino et al.[2004] (Figure 3f). Large collapses affected thevolcano throughout its geological history [e.g., Rosi,
GeochemistryGeophysicsGeosystems G3G3
falsaperla et al.: sliding episodes at stromboli in 2002–2003 10.1029/2007GC001859
4 of 16

Figure 3. Example seismograms and relative spectrograms of the typologies of signals recorded at Strombolivolcano: (a) explosion quake, (b) volcanic tremor, (c) volcano-tectonic event, (d) explosive sequence, and (e) rockfall.(f) Seismic signature and relative spectrogram of the main landslides of 30 December 2002 with onset at 1214 UT.The dashed rectangles marked with 1 and 2 in Figure 3f refer to the parts of seismic signal used in the computation ofthe spectrum in Figure 10b. P.S.D. and A.U. stand for power spectral density and arbitrary units, respectively.
GeochemistryGeophysicsGeosystems G3G3
falsaperla et al.: sliding episodes at stromboli in 2002–2003 10.1029/2007GC001859
5 of 16
1980; Zanchi and Francalanci, 1989; Pasquare et al.,1993]. The potential hazard related to landslides and,particularly, the poor stability of the SdF has beenpointed out by various authors as well [e.g., Barberiet al., 1993; Romagnoli et al., 1993; Kokelaar andRomagnoli, 1995; Falsaperla et al., 2006]. However,important phenomena of flank instability in historicaltimes were not reported before 2002. Additionally,there is an information gap on small-scale events suchas rockfalls and flowing debris that occurred shortlybefore and after the main landslides of 30 December2002. The analyses in the following provide a de-scription of these minor events based on seismicrecords.
3. Seismic Signatures of Rockfalls
[14] Throughout the 2002–2003 lava emissionover 30 � 106 m3 of material detached from thefresh-formed lava flows and old rocks in the SdF,and avalanched below sea level along the north-western flank of the volcano. Their seismic recordsat STR mark clearly distinguishable transientevents from the other typologies of signals(Figure 3). Usually, they have emergent onset,elongated spindle-like shape, longer duration thanexplosion quakes, and variable amplitude overtheir duration. On the basis of this distinctive
seismic signature, we collect a catalog of 565episodes between 1 December 2002 and 28 Feb-ruary 2003. This time span covers the preeffusiveperiod (1–27 December) and the first 2 months oflava emission. Images of video cameras are notavailable in the period of our analysis. It is alsoworth noting that there are no clues as regards thesliding mechanism from the seismograms, e.g.,whether it consists mainly of jumping and rollingblocks, such as in a rockfall (Figure 4), or involvesflowing debris only [Falsaperla et al., 2006]. Wehenceforth refer to rockfalls to indicate both.Figure 5a depicts the daily count of rockfalls. InFigure 5a, the data from 15 to 28 February refer tothe seismic records of PL1, during a temporaryinstrumental failure at STR. Four small rockfallsoccurred on 8, 9, and 14 December 2002. Rockfallswere absent the day before 28 December, and untilthe opening of the eruptive fracture. Starting from0210 to 1745 UT on 29 December, eight rockfallspreceded the two main landslides on 30 December(Figure 5a). The highest occurrence rate covers atime span between 24 and 29 January, when theeruptive activity was characterized by the repetitiveopening and closure of numerous NW-SE alignedvents located close to the head scarp of the land-slide area (Figure 2). Temporary conditions ofhighly noisy signal due to windy weather and/or
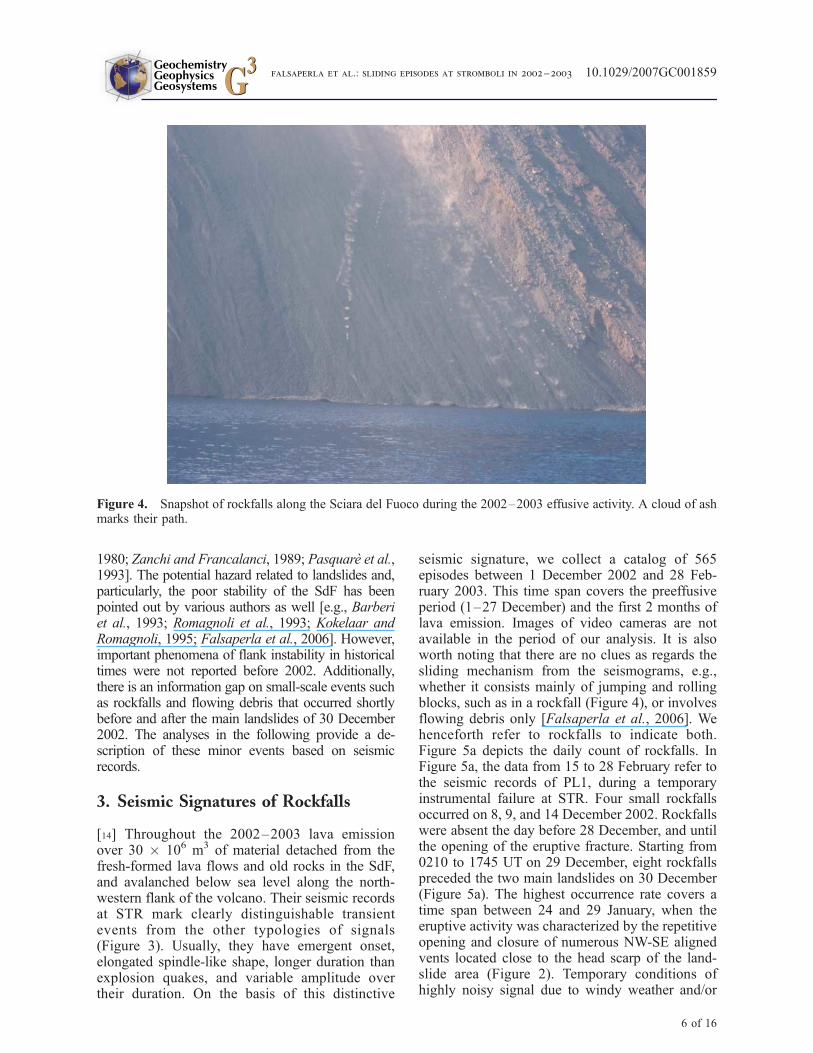
Figure 4. Snapshot of rockfalls along the Sciara del Fuoco during the 2002–2003 effusive activity. A cloud of ashmarks their path.
GeochemistryGeophysicsGeosystems G3G3
falsaperla et al.: sliding episodes at stromboli in 2002–2003 10.1029/2007GC001859
6 of 16
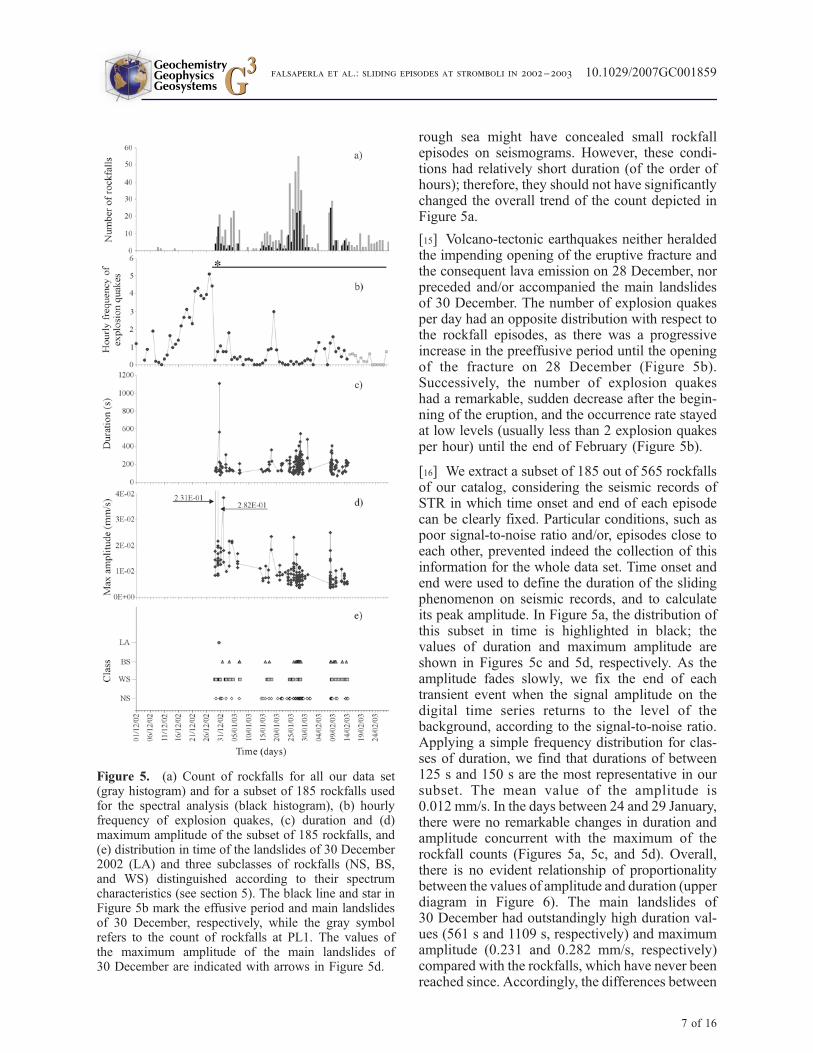
rough sea might have concealed small rockfallepisodes on seismograms. However, these condi-tions had relatively short duration (of the order ofhours); therefore, they should not have significantlychanged the overall trend of the count depicted inFigure 5a.
[15] Volcano-tectonic earthquakes neither heraldedthe impending opening of the eruptive fracture andthe consequent lava emission on 28 December, norpreceded and/or accompanied the main landslidesof 30 December. The number of explosion quakesper day had an opposite distribution with respect tothe rockfall episodes, as there was a progressiveincrease in the preeffusive period until the openingof the fracture on 28 December (Figure 5b).Successively, the number of explosion quakeshad a remarkable, sudden decrease after the begin-ning of the eruption, and the occurrence rate stayedat low levels (usually less than 2 explosion quakesper hour) until the end of February (Figure 5b).
[16] We extract a subset of 185 out of 565 rockfallsof our catalog, considering the seismic records ofSTR in which time onset and end of each episodecan be clearly fixed. Particular conditions, such aspoor signal-to-noise ratio and/or, episodes close toeach other, prevented indeed the collection of thisinformation for the whole data set. Time onset andend were used to define the duration of the slidingphenomenon on seismic records, and to calculateits peak amplitude. In Figure 5a, the distribution ofthis subset in time is highlighted in black; thevalues of duration and maximum amplitude areshown in Figures 5c and 5d, respectively. As theamplitude fades slowly, we fix the end of eachtransient event when the signal amplitude on thedigital time series returns to the level of thebackground, according to the signal-to-noise ratio.Applying a simple frequency distribution for clas-ses of duration, we find that durations of between125 s and 150 s are the most representative in oursubset. The mean value of the amplitude is0.012 mm/s. In the days between 24 and 29 January,there were no remarkable changes in duration andamplitude concurrent with the maximum of therockfall counts (Figures 5a, 5c, and 5d). Overall,there is no evident relationship of proportionalitybetween the values of amplitude and duration (upperdiagram in Figure 6). The main landslides of30 December had outstandingly high duration val-ues (561 s and 1109 s, respectively) and maximumamplitude (0.231 and 0.282 mm/s, respectively)compared with the rockfalls, which have never beenreached since. Accordingly, the differences between
Figure 5. (a) Count of rockfalls for all our data set(gray histogram) and for a subset of 185 rockfalls usedfor the spectral analysis (black histogram), (b) hourlyfrequency of explosion quakes, (c) duration and (d)maximum amplitude of the subset of 185 rockfalls, and(e) distribution in time of the landslides of 30 December2002 (LA) and three subclasses of rockfalls (NS, BS,and WS) distinguished according to their spectrumcharacteristics (see section 5). The black line and star inFigure 5b mark the effusive period and main landslidesof 30 December, respectively, while the gray symbolrefers to the count of rockfalls at PL1. The values ofthe maximum amplitude of the main landslides of30 December are indicated with arrows in Figure 5d.
GeochemistryGeophysicsGeosystems G3G3
falsaperla et al.: sliding episodes at stromboli in 2002–2003 10.1029/2007GC001859
7 of 16

individual episodes are less remarkable than thosefrom these landslides and the rockfalls.
4. Variogram Analysis
[17] Volcanic activity usually presents complex andirregular patterns in time, which may exhibit, froma statistic point of view, some structured behavior
linked to the dynamics of the volcanic system. Inthis light, seismic signals recorded on active vol-canoes are not expected to be completely randomlydistributed, but should present some correlation orpersistence in time. Statistical methods are oftenused to detect correlations in time between pro-cesses related to the volcano feeder, which mayyield Strombolian activity, lava emission, etc. [e.g.,
Figure 6. Distribution of the maximum amplitude versus duration (a) of all rockfalls and of each of the threesubclasses: (b) NS, (c) BS, and (d) WS, distinguished according to their spectrum characteristics (see section 5).
GeochemistryGeophysicsGeosystems G3G3
falsaperla et al.: sliding episodes at stromboli in 2002–2003 10.1029/2007GC001859
8 of 16
Jaquet and Carniel, 2001]. In dynamic systems,such correlations indicate that these processes arecapable of remembering their past and, conse-quently, can be used to detect memory effects.Detection and quantification of these behaviors in
the monitoring of volcanic activity can be assessedby variogram analysis [e.g., Chiles and Delfiner,1999; Jaquet and Carniel, 2006].
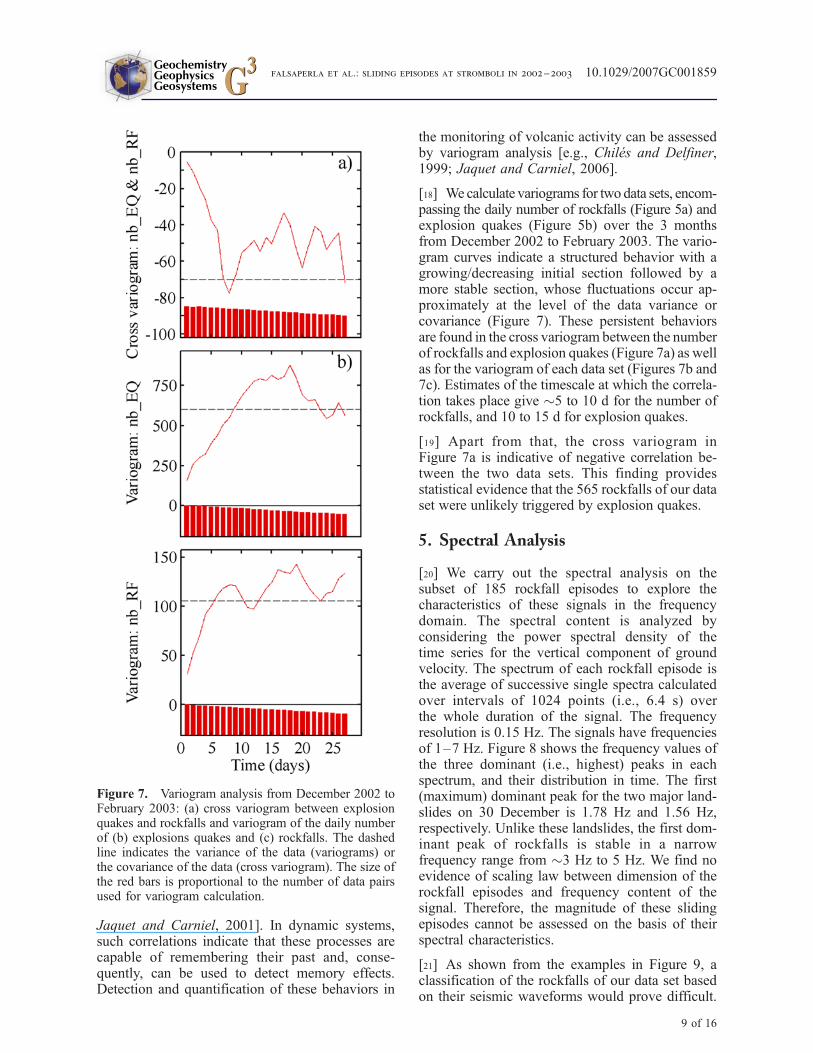
[18] We calculate variograms for two data sets, encom-passing the daily number of rockfalls (Figure 5a) andexplosion quakes (Figure 5b) over the 3 monthsfrom December 2002 to February 2003. The vario-gram curves indicate a structured behavior with agrowing/decreasing initial section followed by amore stable section, whose fluctuations occur ap-proximately at the level of the data variance orcovariance (Figure 7). These persistent behaviorsare found in the cross variogram between the numberof rockfalls and explosion quakes (Figure 7a) as wellas for the variogram of each data set (Figures 7b and7c). Estimates of the timescale at which the correla-tion takes place give �5 to 10 d for the number ofrockfalls, and 10 to 15 d for explosion quakes.
[19] Apart from that, the cross variogram inFigure 7a is indicative of negative correlation be-tween the two data sets. This finding providesstatistical evidence that the 565 rockfalls of our dataset were unlikely triggered by explosion quakes.
5. Spectral Analysis
[20] We carry out the spectral analysis on thesubset of 185 rockfall episodes to explore thecharacteristics of these signals in the frequencydomain. The spectral content is analyzed byconsidering the power spectral density of thetime series for the vertical component of groundvelocity. The spectrum of each rockfall episode isthe average of successive single spectra calculatedover intervals of 1024 points (i.e., 6.4 s) overthe whole duration of the signal. The frequencyresolution is 0.15 Hz. The signals have frequenciesof 1–7 Hz. Figure 8 shows the frequency values ofthe three dominant (i.e., highest) peaks in eachspectrum, and their distribution in time. The first(maximum) dominant peak for the two major land-slides on 30 December is 1.78 Hz and 1.56 Hz,respectively. Unlike these landslides, the first dom-inant peak of rockfalls is stable in a narrowfrequency range from �3 Hz to 5 Hz. We find noevidence of scaling law between dimension of therockfall episodes and frequency content of thesignal. Therefore, the magnitude of these slidingepisodes cannot be assessed on the basis of theirspectral characteristics.
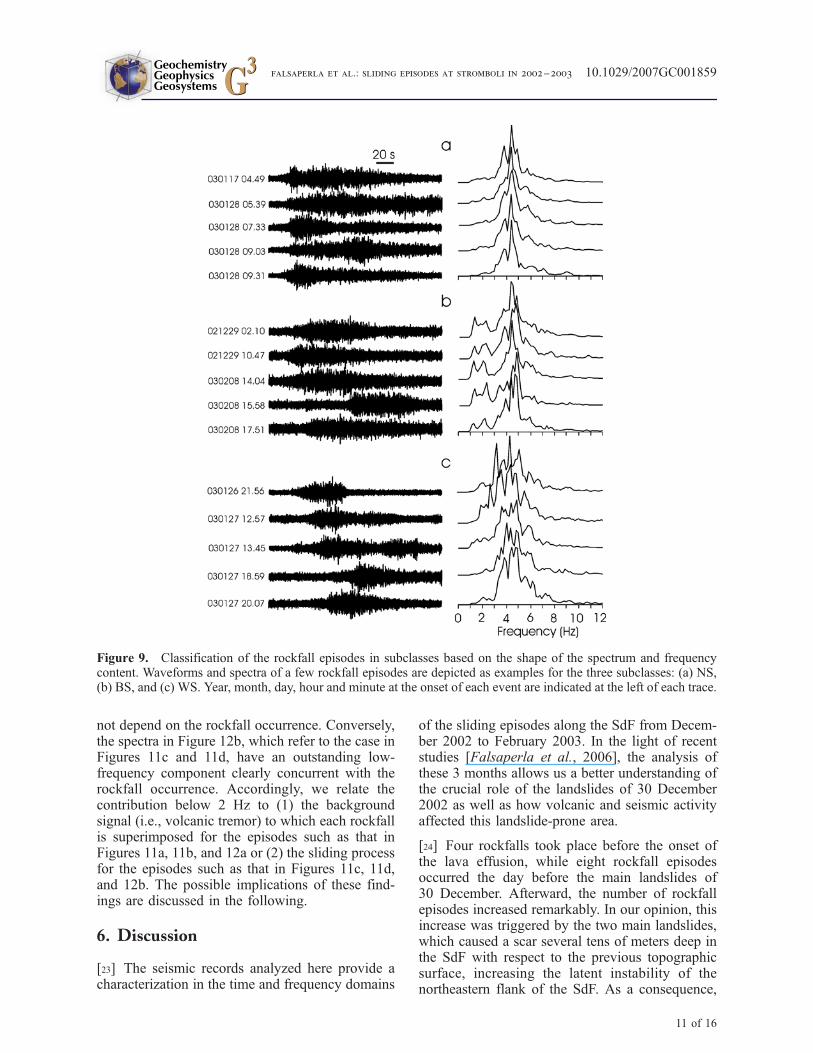
[21] As shown from the examples in Figure 9, aclassification of the rockfalls of our data set basedon their seismic waveforms would prove difficult.
Figure 7. Variogram analysis from December 2002 toFebruary 2003: (a) cross variogram between explosionquakes and rockfalls and variogram of the daily numberof (b) explosions quakes and (c) rockfalls. The dashedline indicates the variance of the data (variograms) orthe covariance of the data (cross variogram). The size ofthe red bars is proportional to the number of data pairsused for variogram calculation.
GeochemistryGeophysicsGeosystems G3G3
falsaperla et al.: sliding episodes at stromboli in 2002–2003 10.1029/2007GC001859
9 of 16

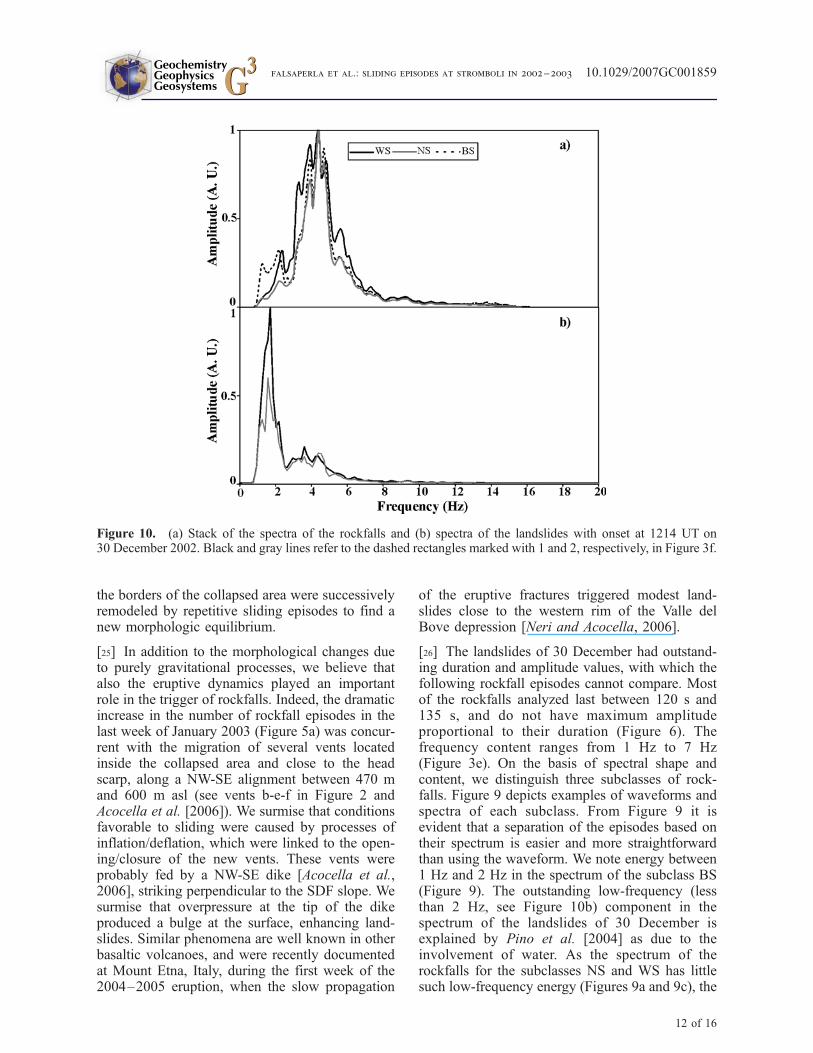
Conversely, the spectra which share similar shapeand frequency content are readily grouped in threedistinct subclasses: narrow-band spectrum (NS),bimodal spectrum (BS), and wide spectrum (WS).With 93 rockfall episodes, NS is the most numer-ous subclass of spectra; it has a peaked, narrow-band spectrum between 3 Hz and 5 Hz (Figure 9a).The subclass BS (44 episodes) differs from theprevious one for its bimodal spectrum, whichconsists of a dominant high-frequency part similarto NS, and minor energy at frequency between 1 Hzand 2 Hz (Figure 9b). WS (46 episodes) has afrequency content in between NS and BS, having awider spectrum than NS and dominant peaksbetween 1.8 Hz and 6.5 Hz (Figure 9c). Figure 10aportrays the stack of all the spectra for the episodesbelonging to each subclass. The twomain landslidesof 30 December form a separate group witha bimodal distribution, where the relationshipbetween the amplitudes of the dominant peaks isinverted with respect to BS, in the sense that the low-frequency (1–2 Hz) part is largely dominant overthe rest of the spectrum (Figure 10b). In relation tothe total number of rockfalls as well as their durationand amplitude, the subclasses NS, BS, and WSoccurred without any peculiar temporal distributionin the time span analyzed (Figure 5e). Similarly, theanalysis of amplitude versus duration values foreach individual subclass (Figures 6b–6d) confirmsthe lack of proportionality aforementioned for theepisodes considered on the whole (Figure 6a).
[22] Exploring the relationship between degassingand rockfall signals at Soufriere Hills volcano,Montserrat, Luckett et al. [2002] identified subsets
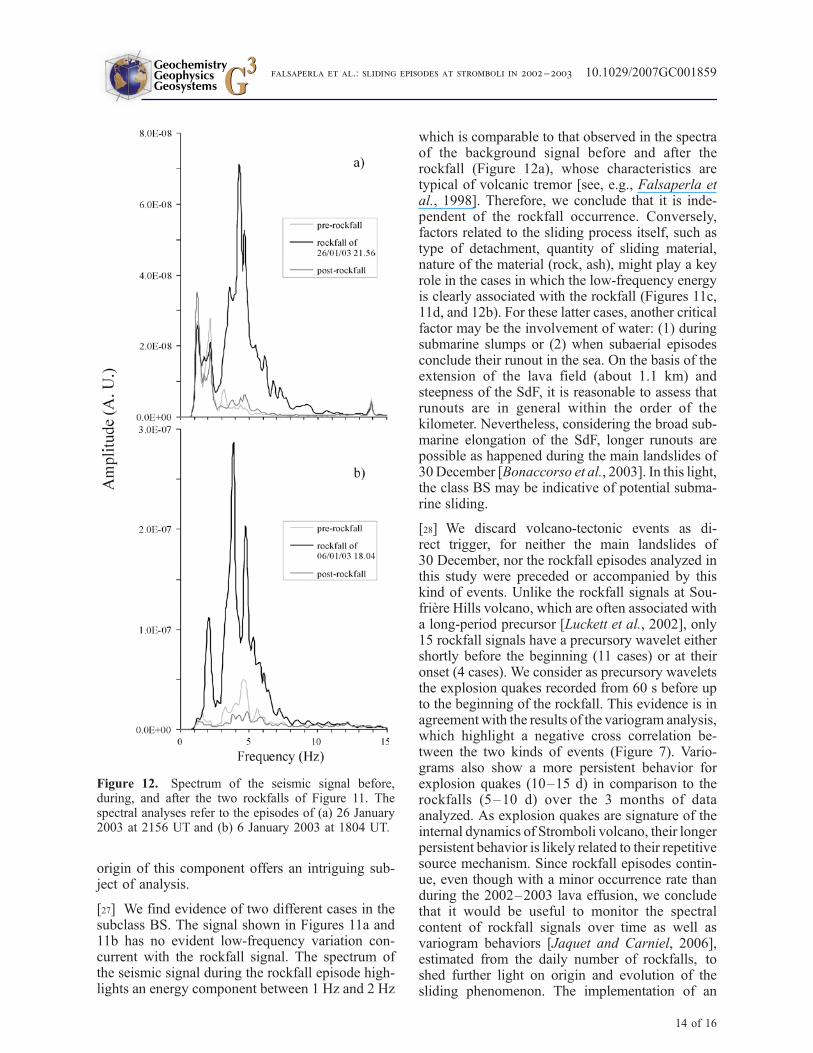
of rockfalls that contained energy below 2 Hz. Thelow-frequency energy was found as a precursorywavelet or at the onset of the signal. This evidenceled Luckett et al. [2002] to surmise that manyrockfalls at Soufriere Hills volcano were associatedwith gas venting. We try to shed some light on thelow-frequency (1–2 Hz) component at Stromboliduring the rockfall episodes of the subclass BS,applying a low-pass filter at 2 Hz on the signal. Wefind that in some of the filtered signals there is nochange concurrent with the rockfall (Figures 11aand 11b). Conversely, in other episodes, a clearvariation of the signal is associated with the rock-fall (Figures 11c and 11d). It is worth noting thatthis association is independent of the maximumamplitude of the rockfall on the seismic record, ascan be found even in transients with small ampli-tude. Additionally, the inspection of the filteredseismic record over time windows of several tensof minutes highlights the nonrandom nature of thislow-frequency component and its different seismicsignature from the typical low-frequency compo-nent of explosion quakes (Figures 11c and 11d).We investigate the frequency content of the back-ground signal, carrying out the spectral analysisbefore and after the rockfalls of the BS subclass.For this analysis the power spectral density overconsecutive time windows with overall durationcomparable to the corresponding rockfall is calcu-lated, choosing time series during which no explo-sion quake occurs. The spectra before, during, andafter the rockfall in Figure 12a refer to the samecase of Figures 11a and 11b, and confirm that thelow-frequency component is always present andhas comparable amplitude; that is, its origin does
Figure 8. Temporal distribution of the first three dominant (i.e., highest) peaks of the spectrum. The gray ellipsehighlights the three dominant peaks of the spectrum for the landslides of 30 December 2002.
GeochemistryGeophysicsGeosystems G3G3
falsaperla et al.: sliding episodes at stromboli in 2002–2003 10.1029/2007GC001859
10 of 16
not depend on the rockfall occurrence. Conversely,the spectra in Figure 12b, which refer to the case inFigures 11c and 11d, have an outstanding low-frequency component clearly concurrent with therockfall occurrence. Accordingly, we relate thecontribution below 2 Hz to (1) the backgroundsignal (i.e., volcanic tremor) to which each rockfallis superimposed for the episodes such as that inFigures 11a, 11b, and 12a or (2) the sliding processfor the episodes such as that in Figures 11c, 11d,and 12b. The possible implications of these find-ings are discussed in the following.
6. Discussion
[23] The seismic records analyzed here provide acharacterization in the time and frequency domains
of the sliding episodes along the SdF from Decem-ber 2002 to February 2003. In the light of recentstudies [Falsaperla et al., 2006], the analysis ofthese 3 months allows us a better understanding ofthe crucial role of the landslides of 30 December2002 as well as how volcanic and seismic activityaffected this landslide-prone area.
[24] Four rockfalls took place before the onset ofthe lava effusion, while eight rockfall episodesoccurred the day before the main landslides of30 December. Afterward, the number of rockfallepisodes increased remarkably. In our opinion, thisincrease was triggered by the two main landslides,which caused a scar several tens of meters deep inthe SdF with respect to the previous topographicsurface, increasing the latent instability of thenortheastern flank of the SdF. As a consequence,
Figure 9. Classification of the rockfall episodes in subclasses based on the shape of the spectrum and frequencycontent. Waveforms and spectra of a few rockfall episodes are depicted as examples for the three subclasses: (a) NS,(b) BS, and (c) WS. Year, month, day, hour and minute at the onset of each event are indicated at the left of each trace.
GeochemistryGeophysicsGeosystems G3G3
falsaperla et al.: sliding episodes at stromboli in 2002–2003 10.1029/2007GC001859
11 of 16
the borders of the collapsed area were successivelyremodeled by repetitive sliding episodes to find anew morphologic equilibrium.
[25] In addition to the morphological changes dueto purely gravitational processes, we believe thatalso the eruptive dynamics played an importantrole in the trigger of rockfalls. Indeed, the dramaticincrease in the number of rockfall episodes in thelast week of January 2003 (Figure 5a) was concur-rent with the migration of several vents locatedinside the collapsed area and close to the headscarp, along a NW-SE alignment between 470 mand 600 m asl (see vents b-e-f in Figure 2 andAcocella et al. [2006]). We surmise that conditionsfavorable to sliding were caused by processes ofinflation/deflation, which were linked to the open-ing/closure of the new vents. These vents wereprobably fed by a NW-SE dike [Acocella et al.,2006], striking perpendicular to the SDF slope. Wesurmise that overpressure at the tip of the dikeproduced a bulge at the surface, enhancing land-slides. Similar phenomena are well known in otherbasaltic volcanoes, and were recently documentedat Mount Etna, Italy, during the first week of the2004–2005 eruption, when the slow propagation
of the eruptive fractures triggered modest land-slides close to the western rim of the Valle delBove depression [Neri and Acocella, 2006].
[26] The landslides of 30 December had outstand-ing duration and amplitude values, with which thefollowing rockfall episodes cannot compare. Mostof the rockfalls analyzed last between 120 s and135 s, and do not have maximum amplitudeproportional to their duration (Figure 6). Thefrequency content ranges from 1 Hz to 7 Hz(Figure 3e). On the basis of spectral shape andcontent, we distinguish three subclasses of rock-falls. Figure 9 depicts examples of waveforms andspectra of each subclass. From Figure 9 it isevident that a separation of the episodes based ontheir spectrum is easier and more straightforwardthan using the waveform. We note energy between1 Hz and 2 Hz in the spectrum of the subclass BS(Figure 9). The outstanding low-frequency (lessthan 2 Hz, see Figure 10b) component in thespectrum of the landslides of 30 December isexplained by Pino et al. [2004] as due to theinvolvement of water. As the spectrum of therockfalls for the subclasses NS and WS has littlesuch low-frequency energy (Figures 9a and 9c), the
Figure 10. (a) Stack of the spectra of the rockfalls and (b) spectra of the landslides with onset at 1214 UT on30 December 2002. Black and gray lines refer to the dashed rectangles marked with 1 and 2, respectively, in Figure 3f.
GeochemistryGeophysicsGeosystems G3G3
falsaperla et al.: sliding episodes at stromboli in 2002–2003 10.1029/2007GC001859
12 of 16

Figure 11. Example seismograms with rockfalls of the BS subclass. The two traces on top and those at the bottomrefer to the rockfall episodes of 26 January 2003 at 2156 UT and 6 January 2003 at 1804 UT, respectively. (a–d)Unfiltered and low-pass (f < 2 Hz) filtered signals for each episode, respectively, highlighted in gray. RK and EQmark the signature of a rockfall and an explosion quake, for comparison. A seismic signature associated with therockfall in the low-pass filtered signal is visible in Figure 11d only and is clearly distinguishable from that of theexplosion quake.
GeochemistryGeophysicsGeosystems G3G3
falsaperla et al.: sliding episodes at stromboli in 2002–2003 10.1029/2007GC001859
13 of 16
origin of this component offers an intriguing sub-ject of analysis.
[27] We find evidence of two different cases in thesubclass BS. The signal shown in Figures 11a and11b has no evident low-frequency variation con-current with the rockfall signal. The spectrum ofthe seismic signal during the rockfall episode high-lights an energy component between 1 Hz and 2 Hz
which is comparable to that observed in the spectraof the background signal before and after therockfall (Figure 12a), whose characteristics aretypical of volcanic tremor [see, e.g., Falsaperla etal., 1998]. Therefore, we conclude that it is inde-pendent of the rockfall occurrence. Conversely,factors related to the sliding process itself, such astype of detachment, quantity of sliding material,nature of the material (rock, ash), might play a keyrole in the cases in which the low-frequency energyis clearly associated with the rockfall (Figures 11c,11d, and 12b). For these latter cases, another criticalfactor may be the involvement of water: (1) duringsubmarine slumps or (2) when subaerial episodesconclude their runout in the sea. On the basis of theextension of the lava field (about 1.1 km) andsteepness of the SdF, it is reasonable to assess thatrunouts are in general within the order of thekilometer. Nevertheless, considering the broad sub-marine elongation of the SdF, longer runouts arepossible as happened during the main landslides of30December [Bonaccorso et al., 2003]. In this light,the class BS may be indicative of potential subma-rine sliding.
[28] We discard volcano-tectonic events as di-rect trigger, for neither the main landslides of30 December, nor the rockfall episodes analyzed inthis study were preceded or accompanied by thiskind of events. Unlike the rockfall signals at Sou-friere Hills volcano, which are often associated witha long-period precursor [Luckett et al., 2002], only15 rockfall signals have a precursory wavelet eithershortly before the beginning (11 cases) or at theironset (4 cases). We consider as precursory waveletsthe explosion quakes recorded from 60 s before upto the beginning of the rockfall. This evidence is inagreement with the results of the variogram analysis,which highlight a negative cross correlation be-tween the two kinds of events (Figure 7). Vario-grams also show a more persistent behavior forexplosion quakes (10–15 d) in comparison to therockfalls (5–10 d) over the 3 months of dataanalyzed. As explosion quakes are signature of theinternal dynamics of Stromboli volcano, their longerpersistent behavior is likely related to their repetitivesource mechanism. Since rockfall episodes contin-ue, even though with a minor occurrence rate thanduring the 2002–2003 lava effusion, we concludethat it would be useful to monitor the spectralcontent of rockfall signals over time as well asvariogram behaviors [Jaquet and Carniel, 2006],estimated from the daily number of rockfalls, toshed further light on origin and evolution of thesliding phenomenon. The implementation of an
Figure 12. Spectrum of the seismic signal before,during, and after the two rockfalls of Figure 11. Thespectral analyses refer to the episodes of (a) 26 January2003 at 2156 UT and (b) 6 January 2003 at 1804 UT.
GeochemistryGeophysicsGeosystems G3G3
falsaperla et al.: sliding episodes at stromboli in 2002–2003 10.1029/2007GC001859
14 of 16
automatic routine for the count of rockfalls wasexperimentally tested during the effusive activityfor monitoring purposes [Di Grazia et al., 2004]. Inthe light of our findings, the applications of vario-gram analysis and classification tools might yieldan efficacious characterization of the phenomenon.
7. Conclusions
[29] We analyze a data set of 565 sliding episodesrecorded at Stromboli volcano between December2002 and February 2003 to investigate their possi-ble links with the ongoing volcanic and seismicactivity. We find that the evolution of the instabilityphenomena was mainly driven by both gravitationalprocesses and the dynamic of the eruptive activity.Gravitational processes were due to the morpho-logical remodeling of the deep eroded portion ofthe SdF after the 30 December main landslides.The occurrence rate of sliding processes achieved amaximum between 24 and 29 January 2003, wheninflation/deflation phenomena occurred during theopening/closure of eruptive NW-SE dike-fed ventslocated close to the head scarp of the collapsed area.This observation supports the hypothesis that theemplacement of dikes striking perpendicular to theSdF slope may induce gravitational instabilities.
[30] On the basis of the dominant peaks and shapeof the spectrum of seismic signals recordedthroughout 185 rockfall episodes, we identify threesubclasses of signals, one of which has significantenergy below 2 Hz. There are two possible sourcesof the low-frequency component, i.e., volcanictremor and the sliding process itself, conditionedby the type of detachment, the quantity and natureof sliding material, and the involvement of waterduring submarine slumps/runout in the sea. Thelast mechanism was directly observed during thelandslides of 30 December 2002 [Pino et al.,2004], and may be at the origin of some of thesliding episodes, such as that in Figure 12b. Norockfall episode analyzed in this study was pre-ceded/accompanied by volcano-tectonic events. Inaddition, in the time span investigated, explosionquakes did not yield significant morphologicalinstability. Nevertheless, the conditions conduciveto shaking instability changed over time. Under thenew competing action between the stabilizingeffect of the lava flows formed in 2003 and erosivephenomena, the loose slope not covered by lavacontinued to be affected by sliding episodes. Theoccurrence of minor sliding episodes shortly pre-ceded by low-intensity Strombolian eruptions andthe enlargement of the head scarp between 2002
and 2004 [Falsaperla et al., 2006] documentindeed the more and more precarious stability ofthe upper scarp of SdF.
Acknowledgments
[31] We wish to thank Valerio Acocella for his useful com-
ments and suggestions and John Tarduno for the critical
reading of the manuscript. We are also grateful to Mike Burton
for the snapshot in Figure 4. This work was supported
financially by Istituto Nazionale di Geofisica e Vulcanologia
and Dipartimento per la Protezione Civile, project INGV-DPC
V4/02.
References
Acocella, V., M. Neri, and P. Scarlato (2006), Shallow magmaemplacement during the 2002–2003 Stromboli (Italy) erup-tion, Geophys. Res. Lett., 33, L17310, doi:10.1029/2006GL026862.
Barberi, F., F. Innocenti, G. Ferrara, J. Keller, and L. Villari(1974), Evolution of Aeolian Arc volcanism (southernTyrrhenian Sea), Earth Planet. Sci. Lett., 21, 269–276,doi:10.1016/0012-821X(74)90161-7.
Barberi, F., M. Rosi, and A. Sodi (1993), Volcanic hazardassessment at Stromboli based on review of historical data,Acta Vulcanol., 3, 173–187.
Bertagnini, A., M. Coltelli, P. Landi, M. Pompilio, and M. Rosi(1999), Violent explosions yield new insights into dynamicsof Stromboli volcano, Eos Trans. AGU, 80(52), 633–636,doi:10.1029/99EO00415.
Bonaccorso, A., S. Calvari, G. Garf ı, L. Lodato, and D. Patane(2003), Dynamics of the December 2003 flank failure andtsunami at Stromboli volcano inferred by volcanological andgeophysical observations, Geophys. Res. Lett., 30(18), 1941,doi:10.1029/2003GL017702.
Braun, T., and M. Ripepe (1993), Interaction of seismic and airwaves recorded at Stromboli volcano, Geophys. Res. Lett.,20, 65–68, doi:10.1029/92GL02543.
Calder, E. S., R. Luckett, R. S. J. Sparks, and B. Voight (2002),Mechanisms of lava dome instability and generation ofrockfalls and pyroclastic flows at Soufriere Hills volcano,Montserrat, in The Eruption of Soufriere Hills Volcano,Montserrat from 1995 to 1999, edited by T. H. Druitt andB. P. Kokelaar, Mem. Geol. Soc. London, 21, 173–190.
Calvari, S., L. Spampinato, L. Lodato, A. J. L. Harris, M. R.Patrick, J. Dehn, M. R. Burton, and D. Andronico (2005),Chronology and complex volcanic processes during the2002–2003 flank eruption at Stromboli volcano (Italy)reconstructed from direct observations and surveys with ahandheld thermal camera, J. Geophys. Res., 110, B02201,doi:10.1029/2004JB003129.
Chiles, J. P., and P. Delfiner (1999), Geostatistics: ModelingSpatial Uncertainty, John Wiley, Hoboken, N. J.
Chouet, B., G. Saccorotti, M. Martini, P. Dawson, G. De Luca,G. Milana, and R. Scarpa (1997), Source and path effects inthe wavefields of tremor and explosions at Stromboli volcano,Italy, J. Geophys. Res., 102, 15,129–15,150, doi:10.1029/97JB00953.
Chouet, B., G. Saccorotti, P. Dawson, M. Martini, R. Scarpa,G. De Luca, G. Milana, and M. Cattaneo (1999), Broadbandmeasurements of the sources of explosions at Stromboli vol-cano, Italy, Geophys. Res. Lett., 26, 1937 – 1940,doi:10.1029/1999GL900400.
GeochemistryGeophysicsGeosystems G3G3
falsaperla et al.: sliding episodes at stromboli in 2002–2003 10.1029/2007GC001859
15 of 16
Di Grazia, G., F. Ferrari, and D. Patane (2004), A computerpackage for automatic detection and recognition of low-fre-quency seismic events and landslides at Stromboli volcano,Geophys. Res. Abstr., 6, sref:1607-7962/gra/EGU04-A-04135.
Falsaperla, S., and S. Spampinato (1999), Tectonic seismicityat Stromboli volcano (Italy) from historical data and seismicrecords, Earth Planet. Sci. Lett., 173, 425–437, doi:10.1016/S0012-821X(99)00246-0.
Falsaperla, S., and S. Spampinato (2003), Seismic insight intoexplosive paroxysms at Stromboli Volcano (Italy), J. Volca-nol. Geotherm. Res., 125, 137–150.
Falsaperla, S., S. Graziani, G. Nunnari, and S. Spampinato(1996), Automatic classification of volcanic earthquakes byusing multi-layered neural networks, Nat. Hazards, 13, 205–228, doi:10.1007/BF00215816.
Falsaperla, S., H. Langer, and S. Spampinato (1998), Statisticalanalysis and characteristics of volcanic tremor on Strombolivolcano (Italy), Bull. Volcanol., 60, 75–88, doi:10.1007/s004450050217.
Falsaperla, S., G. Lanzafame, V. Longo, and S. Spampinato(1999), Regional stress field in the area of Stromboli (Italy):Insights into structural data and crustal tectonic earthquakes,J. Volcanol. Geotherm. Res., 88, 147–166, doi:10.1016/S0377-0273(98)00113-9.
Falsaperla, S., M. Neri, E. Pecora, and S. Spampinato (2006),Multidisciplinary study of flank instability phenomena atStromboli volcano, Italy, Geophys. Res. Lett., 33, L09304,doi:10.1029/2006GL025940.
Jaquet, O., and R. Carniel (2001), Stochastic modelling atStromboli: A volcano with remarkable memory, J. Volcanol.Geotherm. Res., 105, 249– 262, doi:10.1016/S0377-0273(00)00254-7.
Jaquet, O., and R. Carniel (2006), Estimation of volcanichazards using geostatistical models, in Statistics in Volca-nology, IAVCEI Spec. Publ., vol. 1, edited by H. M. Maderet al., pp. 89–103, Geol. Soc. of London, London.
Kokelaar, P., and C. Romagnoli (1995), Sector collapse, sedi-mentation and clast population evolution at an active island-arc volcano—Stromboli, Italy, Bull. Volcanol., 57, 240–262.
Langer, H., and S. Falsaperla (1996), Long-term observation ofvolcanic tremor on Stromboli volcano (Italy): A synopsis,Pure Appl. Geophys., 147, 57–82, doi:10.1007/BF00876436.
Luckett, R., B. Baptie, and J. Neuberg (2002), The relationshipbetween degassing and rockfall signals at Soufriere Hillsvolcano, Montserrat, in The Eruption of Soufriere Hills Vol-cano, Montserrat From 1995 to 1999, edited by T. H. Druittand B. P. Kokelaar, Mem. Geol. Soc. London, 21, 595–602.
Martini, M., F. Giudicepietro, W. De Cesare, L. D’Auria,M. Orazi, G. Scarpato, M. Cattaneo, and L. Badiali (2004), TheStromboli volcano broadband seismic monitoring system,Geo-phys. Res. Abstr., 6, sref:1607-7962/gra/EGU04-A-06536.
Mellors, R. A., R. B. Waitt, and D. A. Swanson (1988), Gen-eration of pyroclastic flows and surges by hot-rock ava-lanches from the dome of Mount St. Helens volcano,USA, Bull. Volcanol., 50, 14–25, doi:10.1007/BF01047505.
Neri, M., and V. Acocella (2006), The 2004–05 Etna eruption:Implications for flank deformation and structural behaviourof the volcano, J. Volcanol. Geotherm. Res., 158, 195–206,doi:10.1016/j.jvolgeores.2006.04.022.
Neuberg, J., and R. Luckett (1996), Seismo-volcanic sourceson Stromboli volcano, Ann. Geofis., 39(2), 377–391.
Ntepe, N., and J. Dorel (1990), Observations of seismic volcanicsignals at Stromboli volcano (Italy), J. Volcanol. Geotherm.Res., 43, 235–251, doi:10.1016/0377-0273(90)90054-J.
Pasquare, G., L. Francalanci, V. H. Garduno, and A. Tibaldi(1993), Structure and geologic evolution of the Strombolivolcano, Aeolian Islands, Italy, Acta Vulcanol., 3, 79–89.
Pino, N. A., M. Ripepe, and G. B. Cimini (2004), The Strom-boli volcano landslides of December 2002: A seismologicaldescription, Geophys. Res. Lett., 31, L02605, doi:10.1029/2003GL018385.
Ripepe, M. (1996), Evidence for gas influence on volcanic seis-mic signals recorded at Stromboli, J. Volcanol. Geotherm.Res., 70, 221–233, doi:10.1016/0377-0273(95)00057-7.
Ripepe, M., E. Marchetti, G. Ulivieri, A. J. L. Harris, J. Dehn,M. Burton, T. Caltabiano, and G. Salerno (2005), Effusive toexplosive transition during the 2003 eruption of Strombolivolcano, Geology, 33, 341–344, doi:10.1130/G21173.1.
Romagnoli, C., P. Kokelaar, P. L. Rossi, and A. Sodi (1993),The submarine extension of Sciara del Fuoco feature (Strom-boli isl.): Morphologic characterization, Acta Vulcanol., 3,91–98.
Rosi, M. (1980), The island of Stromboli, Rend. Soc. Ital.Miner. Petrol., 36, 345–368.
Sato, H., T. Fuji, and S. Nakada (1992), Crumbling dacitedome lava and generation of pyroclastic flows at Unzenvolcano, Nature, 360, 664–666, doi:10.1038/360664a0.
Schick, R., and W. Muller (1988), Volcanic activity and erup-tion sequences at Stromboli during 1983–1984, in ModelingVolcanic Processing, edited by C.-Y. King and R. Scarpa, pp.120–139, Vieweg, Wiesbaden, Germany.
Tinti, S., A. Manucci, A. Armigliato, G. Pagnoni, F. Zaniboni,A. Maramai, and L. Graziani (2004), The 30th December2002 tsunami in Stromboli: Sequence of the events recon-structed from the eyewitness accounts, Geophys. Res. Abstr.,6, sref:1607-7962/gra/EGU04-A-03354.
Ui, T., N. Matsuwo, M. Sumita, and A. Fujinawa (1999),Generation of block and ash flows during the 1990–1995eruption of Unzen volcano, Japan, J. Volcanol. Geotherm.Res., 89, 123–137, doi:10.1016/S0377-0273(98)00128-0.
Voight, B., E. K. Constantine, S. Siswowidjoyo, and R. Torley(2000), Historical eruptions of Merapi volcano, Central Java,Indonesia, 1768–1998, J. Volcanol. Geotherm. Res., 100,69–138, doi:10.1016/S0377-0273(00)00134-7.
Wassermann, J. (1997), Locating sources of volcanic explosionsand volcanic tremor at Stromboli volcano (Italy) using beam-forming on diffraction hyperboloids, Phys. Earth Planet. In-ter., 104, 271–281, doi:10.1016/S0031-9201(97)00041-1.
Zanchi, A., and L. Francalanci (1989), Analisi geologico-strutturale dell’isola di Stromboli: Alcune considerazionipreliminari, Boll. Gruppo Naz. Vulcanol., 2, 1027–1044.
GeochemistryGeophysicsGeosystems G3G3
falsaperla et al.: sliding episodes at stromboli in 2002–2003 10.1029/2007GC001859
16 of 16
Related Documents