Copyright Pearson Prentice Hall Slide 1 of 41 Biology

Welcome message from author
This document is posted to help you gain knowledge. Please leave a comment to let me know what you think about it! Share it to your friends and learn new things together.
Transcript

Copyright Pearson Prentice Hall
Slide 1 of 41
Biology

Copyright Pearson Prentice Hall
Slide 2 of 41
3–2 Energy Flow

Copyright Pearson Prentice Hall
3–2 Energy Flow
Slide 3 of 41
Producers
Where does the energy for life processes come from?

Copyright Pearson Prentice Hall
3–2 Energy Flow
Slide 4 of 41
Producers
Producers
Without a constant input of energy, living systems cannot function.
Sunlight is the main energy source for life on Earth.

Copyright Pearson Prentice Hall
3–2 Energy Flow
Slide 5 of 41
Producers
In a few ecosystems, some organisms obtain energy from a source other than sunlight.
Some types of organisms rely on the energy stored in inorganic chemical compounds.
Copyright Pearson Prentice Hall
3–2 Energy Flow
Slide 6 of 41
Producers
Only plants, some algae, and certain bacteria can capture energy from sunlight or chemicals and use that energy to produce food.
These organisms are called autotrophs.
Copyright Pearson Prentice Hall
3–2 Energy Flow
Slide 7 of 41
Producers
Autotrophs use energy from the environment to fuel the assembly of simple inorganic compounds into complex organic molecules.
These organic molecules combine and recombine to produce living tissue.

Copyright Pearson Prentice Hall
3–2 Energy Flow
Slide 8 of 41
Producers
Because they make their own food, autotrophs are called producers.

Copyright Pearson Prentice Hall
3–2 Energy Flow
Slide 9 of 41
Producers
Energy From the Sun
The best-known autotrophs harness solar energy through a process known as photosynthesis.
During photosynthesis, these autotrophs use light energy to convert carbon dioxide and water into oxygen and energy-rich carbohydrates.

Copyright Pearson Prentice Hall
3–2 Energy Flow
Slide 10 of 41
Producers
Photosynthesis is responsible for adding oxygen to—and removing carbon dioxide from—Earth's atmosphere.

Copyright Pearson Prentice Hall
3–2 Energy Flow
Slide 11 of 41
Producers
Plants are the main autotrophs on land.
Algae are the main autotrophs in freshwater ecosystems and in the upper layers of the ocean.
Photosynthetic bacteria are important in certain wet ecosystems such as tidal flats and salt marshes.
Copyright Pearson Prentice Hall
3–2 Energy Flow
Slide 12 of 41
Producers
Life Without Light
Some autotrophs can produce food in the absence of light.
When organisms use chemical energy to produce carbohydrates, the process is called chemosynthesis.

Copyright Pearson Prentice Hall
3–2 Energy Flow
Slide 13 of 41
Producers

Copyright Pearson Prentice Hall
3–2 Energy Flow
Slide 14 of 41
Producers
Chemosynthesis is performed by several types of bacteria.
These bacteria represent a large proportion of living autotrophs.

Copyright Pearson Prentice Hall
3–2 Energy Flow
Slide 15 of 41
Producers
Some chemosynthetic bacteria live in very remote places on Earth, such as volcanic vents on the deep-ocean floor and hot springs.
Others live in more common places, such as tidal marshes along the coast.

Copyright Pearson Prentice Hall
3–2 Energy Flow
Slide 16 of 41
Consumers
Consumers
Many organisms cannot harness energy directly from the physical environment.
Organisms that rely on other organisms for their energy and food supply are called heterotrophs.
Heterotrophs are also called consumers.

Copyright Pearson Prentice Hall
3–2 Energy Flow
Slide 17 of 41
Consumers
There are many different types of heterotrophs.
• Herbivores eat plants.
• Carnivores eat animals.
• Omnivores eat both plants and animals.
• Detritivores feed on plant and animal remains and other dead matter.
• Decomposers, like bacteria and fungi, break down organic matter.

Copyright Pearson Prentice Hall
3–2 Energy Flow
Slide 18 of 41
Feeding Relationships
How does energy flow through living systems?

Copyright Pearson Prentice Hall
3–2 Energy Flow
Slide 19 of 41
Feeding Relationships
Feeding Relationships
The relationships between producers and consumers connect organisms into feeding networks based on who eats whom.
Copyright Pearson Prentice Hall
3–2 Energy Flow
Slide 20 of 41
Feeding Relationships
Energy flows through an ecosystem in one direction, from the sun or inorganic compounds to autotrophs (producers) and then to various heterotrophs (consumers).

Copyright Pearson Prentice Hall
3–2 Energy Flow
Slide 21 of 41
Feeding Relationships
Food Chains
A food chain is a series of steps in which organisms transfer energy by eating and being eaten.
Copyright Pearson Prentice Hall
3–2 Energy Flow
Slide 22 of 41
Feeding Relationships
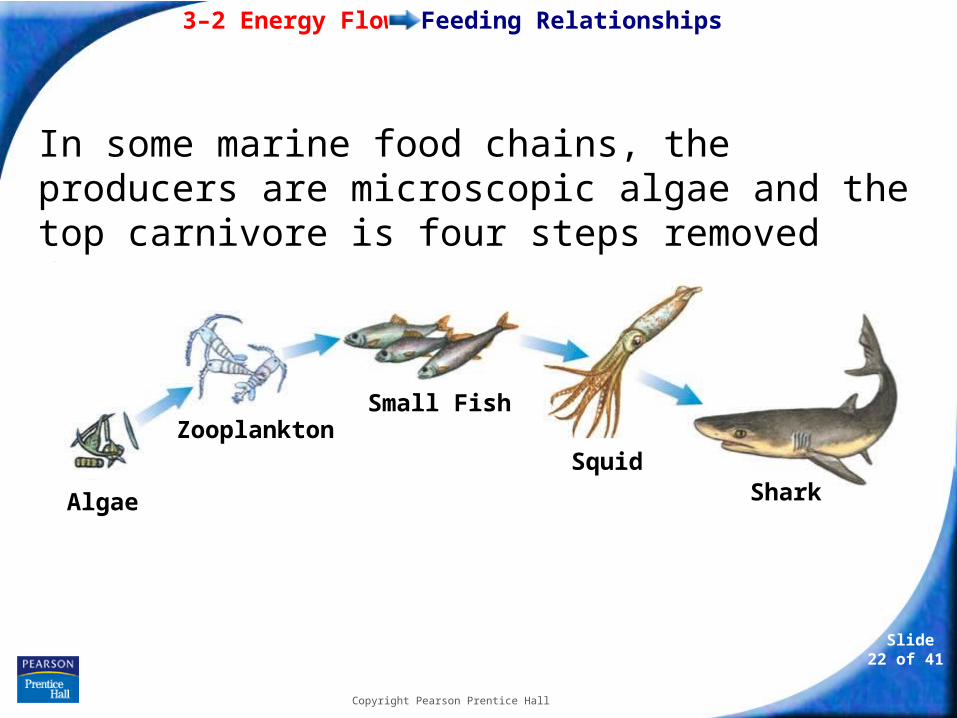
In some marine food chains, the producers are microscopic algae and the top carnivore is four steps removed from the producer.
Algae
ZooplanktonSmall Fish
SquidShark

Copyright Pearson Prentice Hall
3–2 Energy Flow
Slide 23 of 41
Feeding Relationships
Food Webs
Ecologists describe a feeding relationship in an ecosystem that forms a network of complex interactions as a food web.
A food web links all the food chains in an ecosystem together.

Copyright Pearson Prentice Hall
3–2 Energy Flow
Slide 24 of 41
Feeding Relationships
This food web shows some of the feeding relationships in a salt-marsh community.

Copyright Pearson Prentice Hall
3–2 Energy Flow
Slide 25 of 41
Feeding Relationships
Trophic Levels
Each step in a food chain or food web is called a trophic level.
Producers make up the first trophic level.
Consumers make up the second, third, or higher trophic levels.
Each consumer depends on the trophic level below it for energy.

Copyright Pearson Prentice Hall
3–2 Energy Flow
Slide 26 of 41
Ecological Pyramids
How efficient is the transfer of energy among organisms in an ecosystem?

Copyright Pearson Prentice Hall
3–2 Energy Flow
Slide 27 of 41
Ecological Pyramids
Ecological Pyramids
The amount of energy or matter in an ecosystem can be represented by an ecological pyramid.
An ecological pyramid is a diagram that shows the relative amounts of energy or matter contained within each trophic level in a food chain or food web.

Copyright Pearson Prentice Hall
3–2 Energy Flow
Slide 28 of 41
Ecological Pyramids
Ecologists recognize three different types of ecological pyramids:
• energy pyramids
• biomass pyramids
• pyramids of numbers
Copyright Pearson Prentice Hall
3–2 Energy Flow
Slide 29 of 41
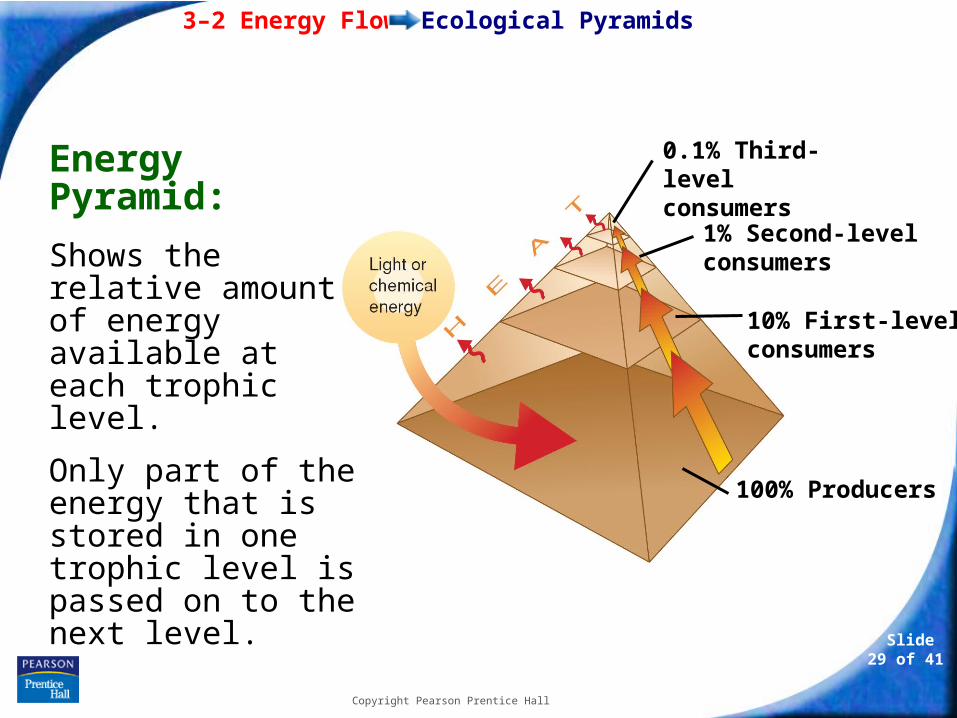
Ecological Pyramids
0.1% Third-level consumers
1% Second-level consumers
10% First-level consumers
100% Producers
Energy Pyramid:
Shows the relative amount of energy available at each trophic level.
Only part of the energy that is stored in one trophic level is passed on to the next level.

Copyright Pearson Prentice Hall
3–2 Energy Flow
Slide 30 of 41
Ecological Pyramids
The more levels that exist between a producer and a top-level consumer in an ecosystem, the less energy that remains from the original amount.
Only about 10 percent of the energy available within one trophic level is transferred to organisms at the next trophic level.

Copyright Pearson Prentice Hall
3–2 Energy Flow
Slide 31 of 41
Ecological Pyramids
Biomass Pyramid
The total amount of living tissue within a given trophic level is called biomass.
Biomass is usually expressed in terms of grams of organic matter per unit area.
A biomass pyramid represents the amount of potential food available for each trophic level in an ecosystem.

Copyright Pearson Prentice Hall
3–2 Energy Flow
Slide 32 of 41
Ecological Pyramids
50 grams of human tissue
500 grams of chicken
5000 grams of grain
Biomass Pyramid: Represents the amount of living organic matter at each trophic level. Typically, the greatest biomass is at the base of the pyramid.

Copyright Pearson Prentice Hall
3–2 Energy Flow
Slide 33 of 41
Ecological Pyramids
Pyramid of Numbers
A pyramid of numbers shows the relative number of individual organisms at each trophic level.

Copyright Pearson Prentice Hall
3–2 Energy Flow
Slide 34 of 41
Ecological Pyramids
Pyramid of Numbers:Shows the relative number of individual organisms at each trophic level.

Copyright Pearson Prentice Hall
3–2 Energy Flow
Slide 35 of 41
Ecological Pyramids
For some ecosystems, the shape of the pyramid of numbers is the same as that of the energy and biomass pyramids.
However, in ecosystems where there are fewer producers than there are consumers, such as a forest ecosystem, the pyramid of numbers would not resemble a typical pyramid at all.

Copyright Pearson Prentice Hall
- or -Continue to: Click to Launch:
Slide 36 of 41
3–2
Copyright Pearson Prentice Hall
Slide 37 of 41
3–2
The main source of energy for life on Earth is
a. organic chemical compounds.
b. inorganic chemical compounds.
c. sunlight.
d. producers.

Copyright Pearson Prentice Hall
Slide 38 of 41
3–2
Organisms that feed on plant and animal remains and other dead matter are
a. detritivores.
b. carnivores.
c. herbivores.
d. autotrophs.

Copyright Pearson Prentice Hall
Slide 39 of 41
3–2
How does a food web differ from a food chain?
a. A food web contains a single series of energy transfers.
b. A food web links many food chains together.
c. A food web has only one trophic level.
d. A food web shows how energy passes from producer to consumer.
Copyright Pearson Prentice Hall
Slide 40 of 41
3–2
In a biomass pyramid, the base of the pyramid represents the mass of
a. heterotrophs.
b. primary consumers.
c. producers.
d. top level carnivores.

Copyright Pearson Prentice Hall
Slide 41 of 41
3–2
The amount of energy represented in each trophic level of consumers in an energy pyramid is about
a. 10% of the level below it.
b. 90% of the level below it.
c. 10% more than the level below it.
d. 90% more than the level below it.

END OF SECTION
Related Documents