Innovation in Tech Transfer Federal Laboratory Consortium Mid-Atlantic Meeting – Rocky Gap September 16, 2008

Welcome message from author
This document is posted to help you gain knowledge. Please leave a comment to let me know what you think about it! Share it to your friends and learn new things together.
Transcript
Innovation in Tech TransferFederal Laboratory Consortium Mid-Atlantic Meeting – Rocky Gap
September 16, 2008
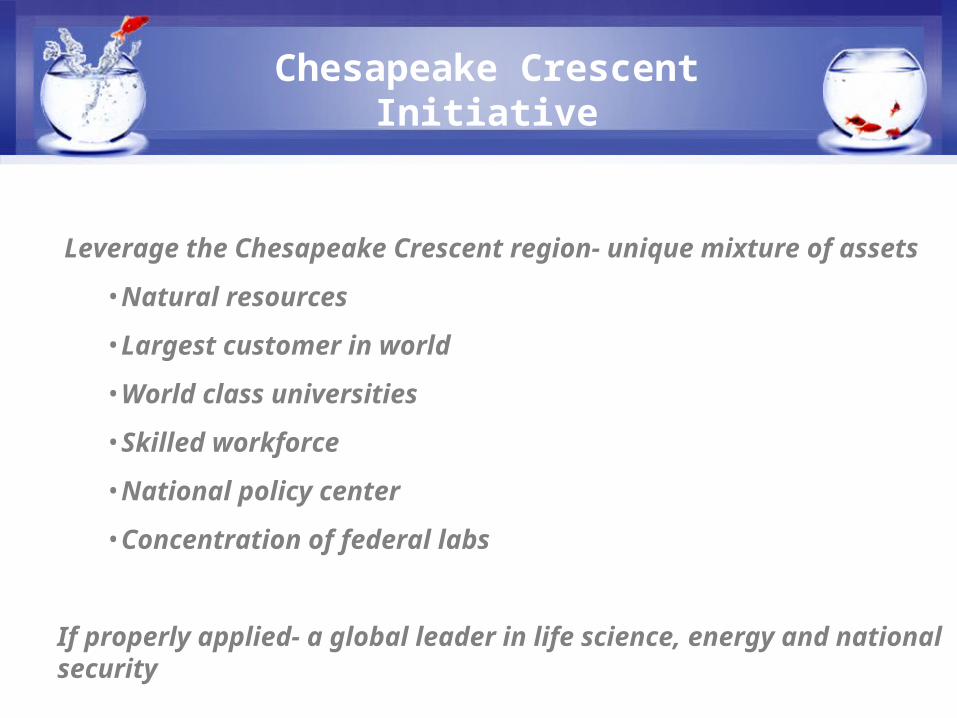
Leverage the Chesapeake Crescent region- unique mixture of assets
•Natural resources
•Largest customer in world
•World class universities
•Skilled workforce
•National policy center
•Concentration of federal labs
If properly applied- a global leader in life science, energy and national security
Chesapeake CrescentInitiative
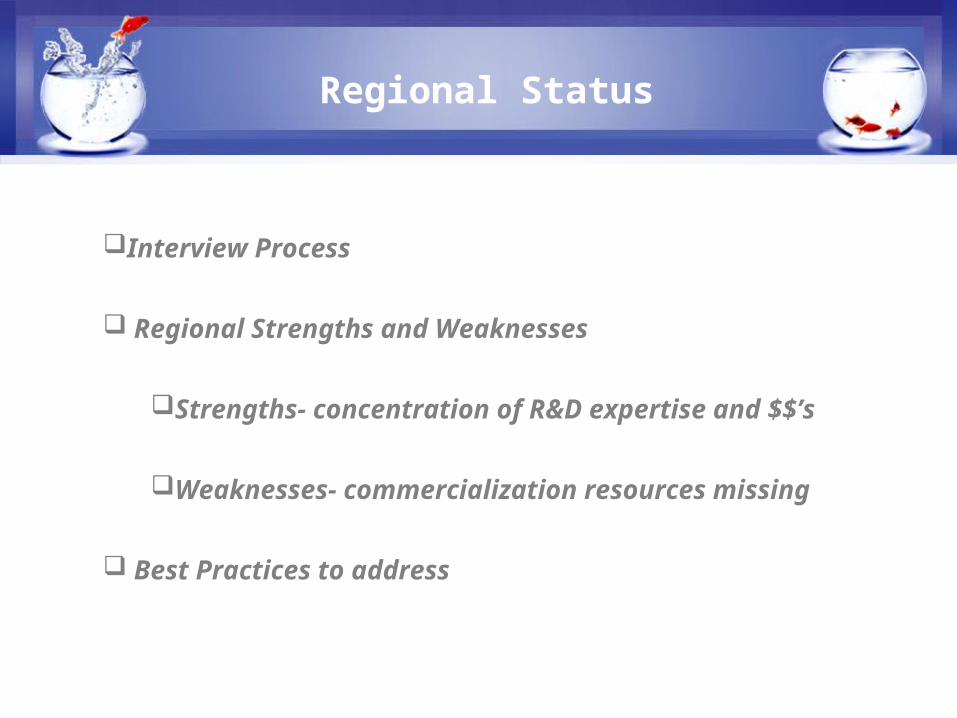
Interview Process
Regional Strengths and Weaknesses
Strengths- concentration of R&D expertise and $$’s
Weaknesses- commercialization resources missing
Best Practices to address
Regional Status
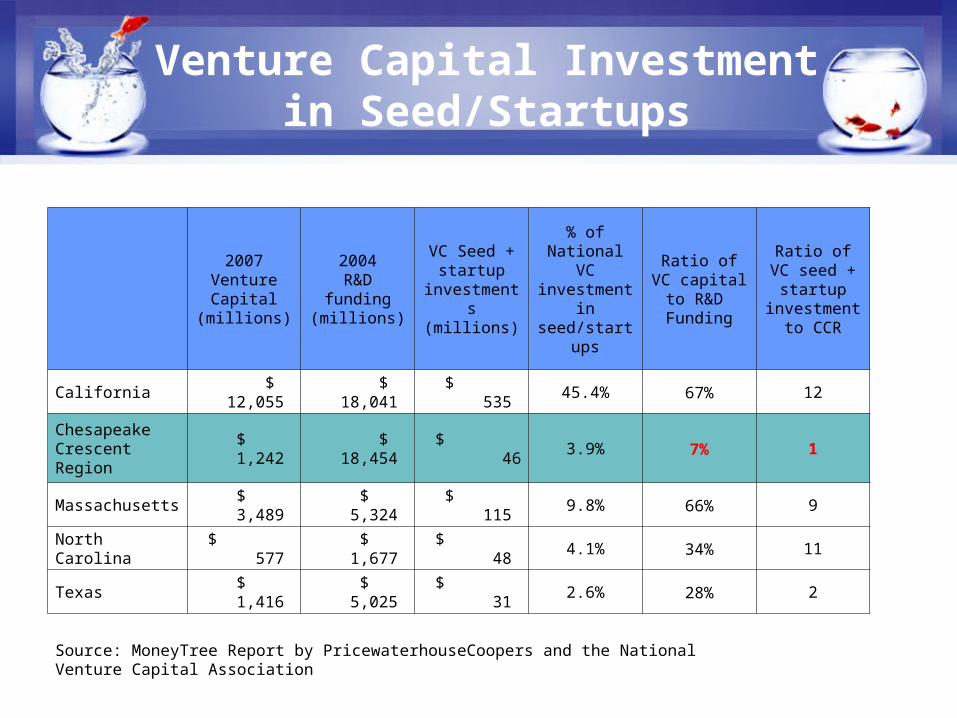
Venture Capital Investment in Seed/Startups
2007Venture Capital
(millions)
2004R&D
funding(millions)
VC Seed + startup
investments (millions)
% of National VC
investment in seed/startups
Ratio of VC capital to
R&D Funding
Ratio of VC seed + startup
investment to CCR
California $ 12,055 $ 18,041 $ 535 45.4% 67% 12
Chesapeake Crescent Region $ 1,242 $ 18,454 $ 46 3.9% 7% 1
Massachusetts $ 3,489 $ 5,324 $ 115 9.8% 66% 9
North Carolina $ 577 $ 1,677 $ 48 4.1% 34% 11
Texas $ 1,416 $ 5,025 $ 31 2.6% 28% 2
Source: MoneyTree Report by PricewaterhouseCoopers and the National Venture Capital Association
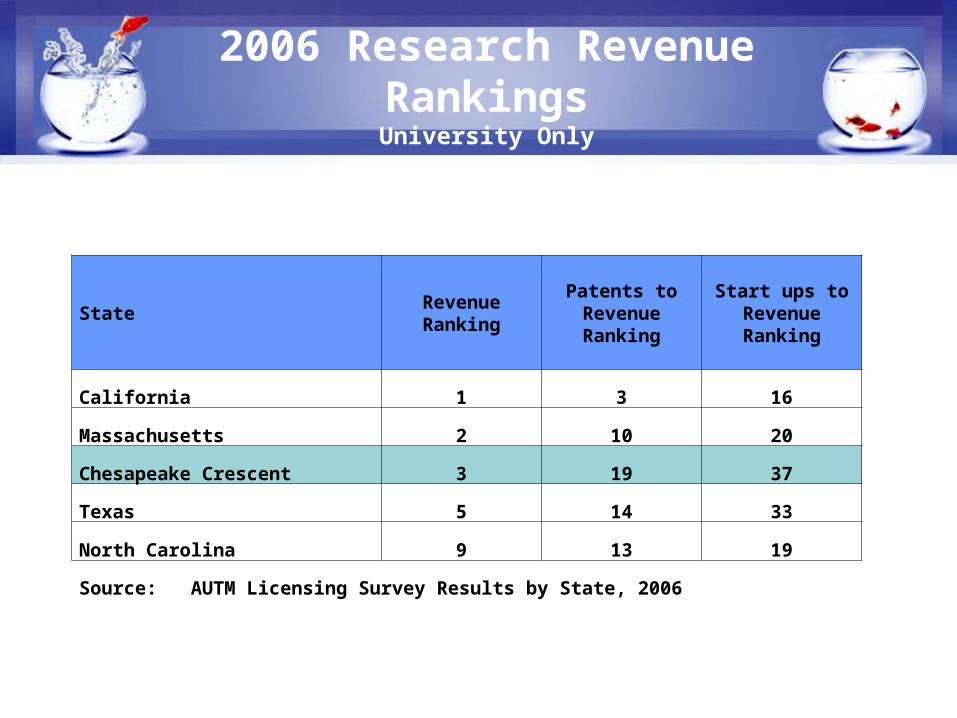
2006 Research Revenue RankingsUniversity Only
State Revenue Ranking
Patents to Revenue Ranking
Start ups to Revenue Ranking
California 1 3 16
Massachusetts 2 10 20
Chesapeake Crescent 3 19 37
Texas 5 14 33
North Carolina 9 13 19
Source: AUTM Licensing Survey Results by State, 2006
X-Prizes
Embedded Entrepreneurs in Residence
Rapid Prototyping
Tech Scouting
Innovation in Tech Transfer
Northrop Grumman Lunar Lander Challenge
Ultimate Fuel Economy Challenge
Ansari X PRIZE
American Security Challenge
DARPA Urban Challenge
X-Prizes
Carnegie Mellon University (SRI, MIT, DOE)
match Serial Entrepreneur with appropriate innovation
standardized terms (timeframe, no-shop, field of use, consideration)
embed Serial Entrepreneur with research team
complete due diligence (G2M, cap plan, etc)
win-win at end of term either way
Embedded E-I-R Programs
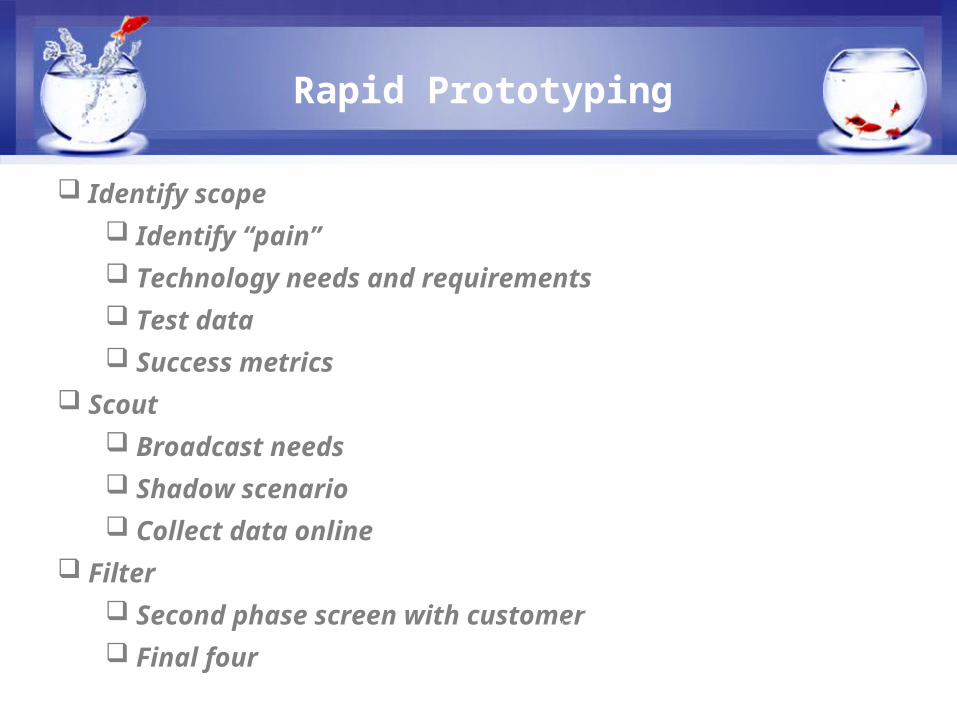
Identify scope Identify “pain” Technology needs and requirements Test data Success metrics
Scout Broadcast needs Shadow scenario Collect data online
Filter Second phase screen with customer Final four
Rapid Prototyping
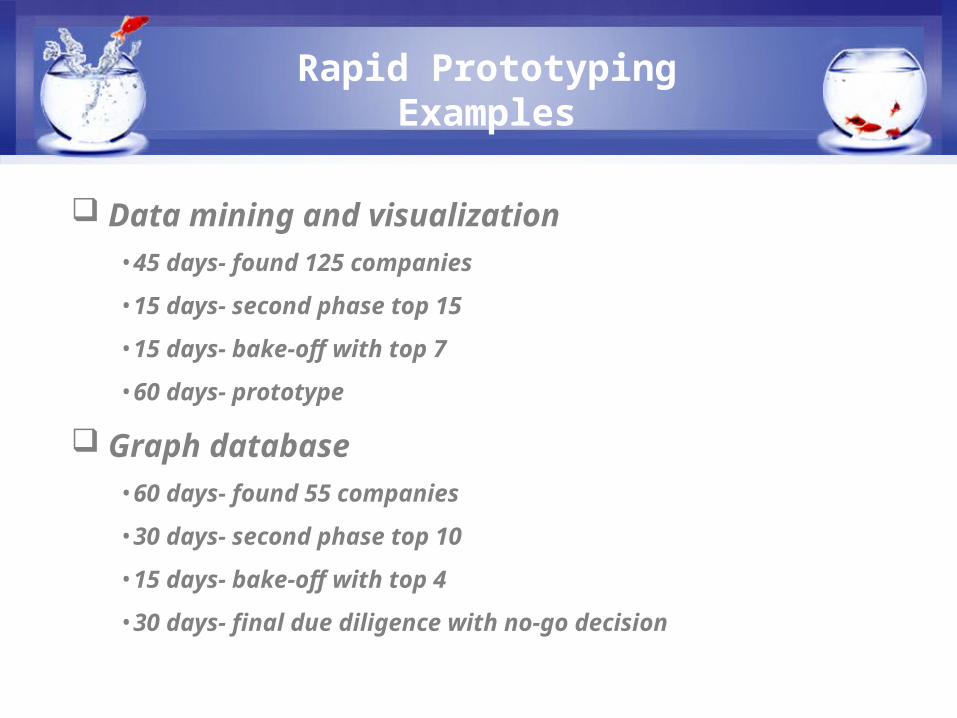
Data mining and visualization•45 days- found 125 companies•15 days- second phase top 15•15 days- bake-off with top 7•60 days- prototype
Graph database •60 days- found 55 companies•30 days- second phase top 10•15 days- bake-off with top 4•30 days- final due diligence with no-go decision
Rapid PrototypingExamples
Tech ScoutingClients

Tech ScoutingProcess
Client X
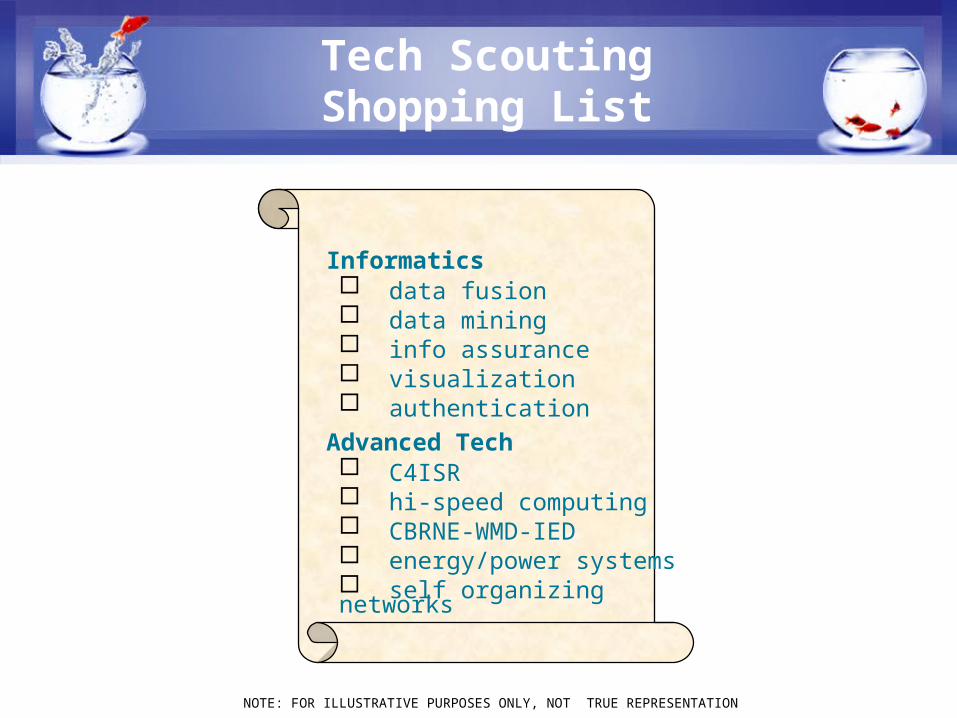
Informatics data fusion data mining info assurance visualization authentication
Advanced Tech C4ISR hi-speed computing CBRNE-WMD-IED energy/power systems self organizing networks
Tech ScoutingShopping List
NOTE: FOR ILLUSTRATIVE PURPOSES ONLY, NOT TRUE REPRESENTATION
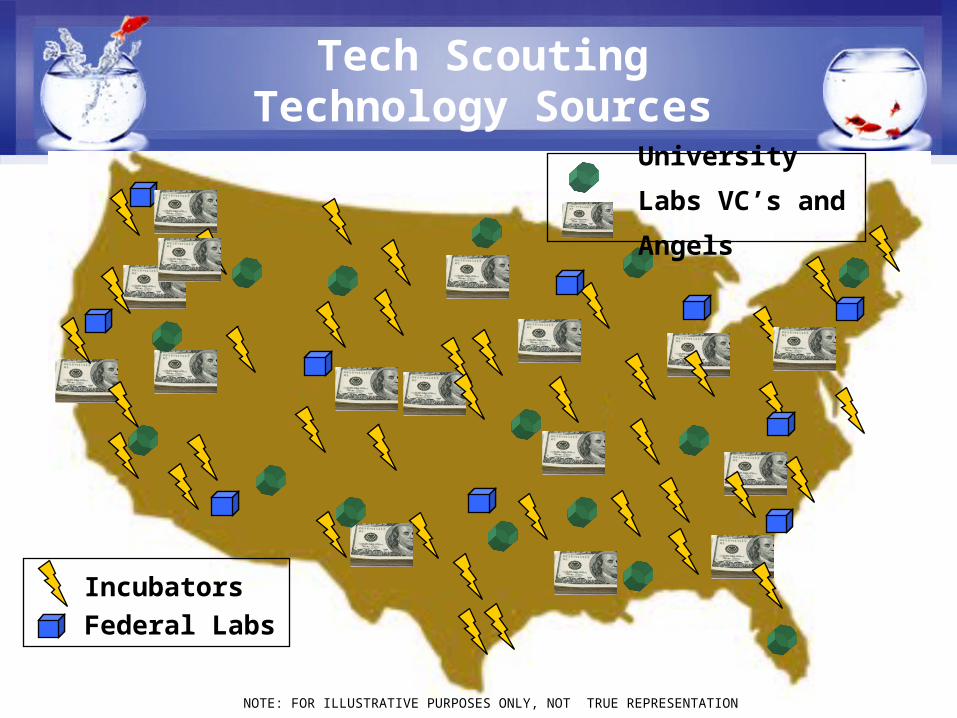
Tech ScoutingTechnology Sources
NOTE: FOR ILLUSTRATIVE PURPOSES ONLY, NOT TRUE REPRESENTATION
Incubators Federal Labs
University Labs VC’s and Angels
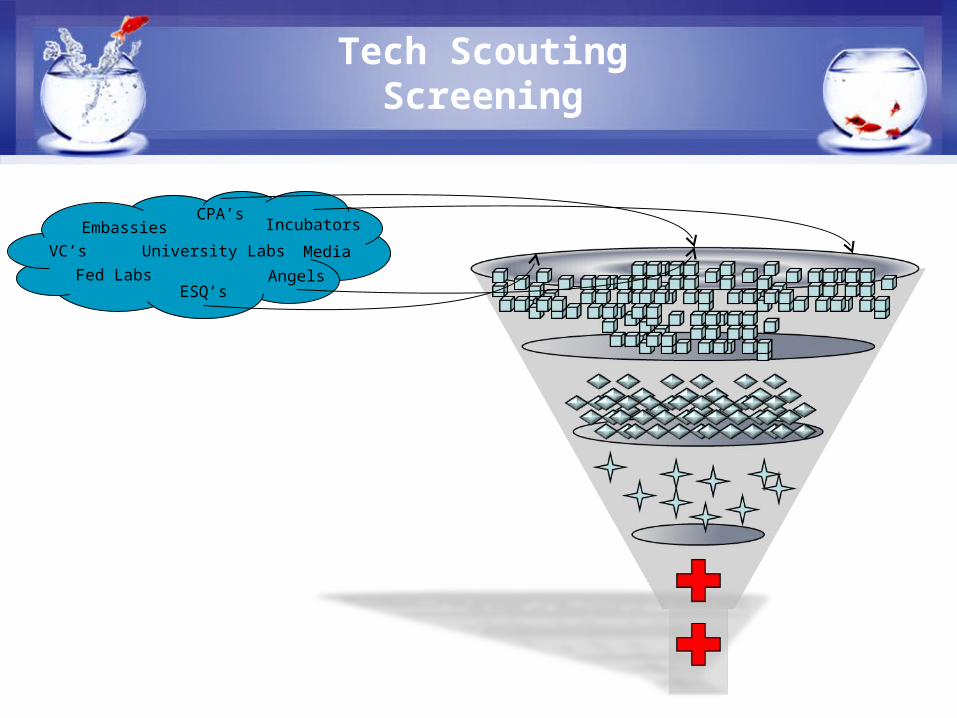
Tech ScoutingScreening
MediaEmbassies Incubators
VC’s University LabsFed Labs
ESQ’sAngels
CPA’s
MediaEmbassies Incubators
VC’s University LabsFed Labs
ESQ’s Angels
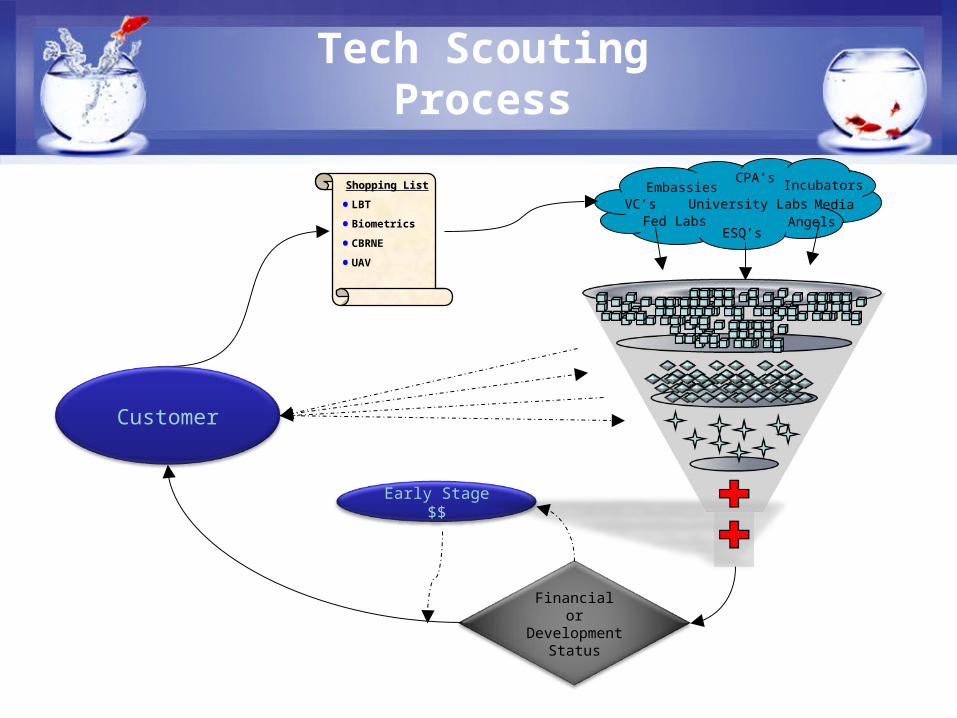
CPA’sShopping ListShopping List
•LBT
•Biometrics
•CBRNE
•UAV
Early Stage $$
Financial or Development
Status
Customer
Tech ScoutingProcess
Roger London Innovation Economy Program Director
Chesapeake Crescent410-340-5335
Thank You
Related Documents


![ppt CV strut&uso [modalità compatibilità] · 2014-09-03 · 2 slide 1 slide Premessa 1 slide Struttura Presentazione generale Nella progettazione didattica 3 slide 4 slide 4 slide](https://static.cupdf.com/doc/110x72/5ec2cecb5f432f006d0f52ea/ppt-cv-strutuso-modalit-compatibilit-2014-09-03-2-slide-1-slide-premessa.jpg)