Team: Jennifer Garrity and Anne Bowers (Co-Team Leaders) Ed Matthews George Landry Dennis Bell (SME) Green Belt Project Objective: To Reduce Light Fleet Vehicle Maintenance Costs Six Sigma DMAIC Improvement Story Ed Matthews (Sponsor) Cash For Clunkers Last Updated: 3-14-17 Facilities Division, PR&F, Fleet Mgmt (Process Owner)

Welcome message from author
This document is posted to help you gain knowledge. Please leave a comment to let me know what you think about it! Share it to your friends and learn new things together.
Transcript

Team:
Jennifer Garrity and Anne Bowers (Co-Team Leaders)
Ed Matthews George Landry Dennis Bell (SME)
Green Belt Project Objective:
To Reduce Light Fleet Vehicle Maintenance Costs
Six Sigma DMAIC Improvement Story
Ed Matthews (Sponsor)
Cash For Clunkers
Last Updated: 3-14-17
Facilities Division, PR&F, Fleet Mgmt (Process Owner)

Overview of Light Fleet Operations
2▪Define ▪Measure ▪Analyze ▪Improve ▪Control
▪ St. Lucie County Board of County Commissioners’ and Department
policy is to acquire only those vehicles required to fulfill county
responsibilities and to use those assets in a cost-effective, controlled
fashion.
▪ “Light Fleet Assets" are defined as vehicles, one ton and under
and their related equipment. These assets are under the
management of the Light Fleet Management section of the Parks,
Recreation, & Facilities Department. The number of vehicles in the
Fleet is approximately 300.
▪ One manager coordinates Light Fleet Vehicle Maintenance which
includes the acquisition, maintenance, inter-agency use, replacement
assistance, disposition and administration of all light fleet vehicles.
Project Alignment to Strategy
3Define Measure Analyze Improve Control
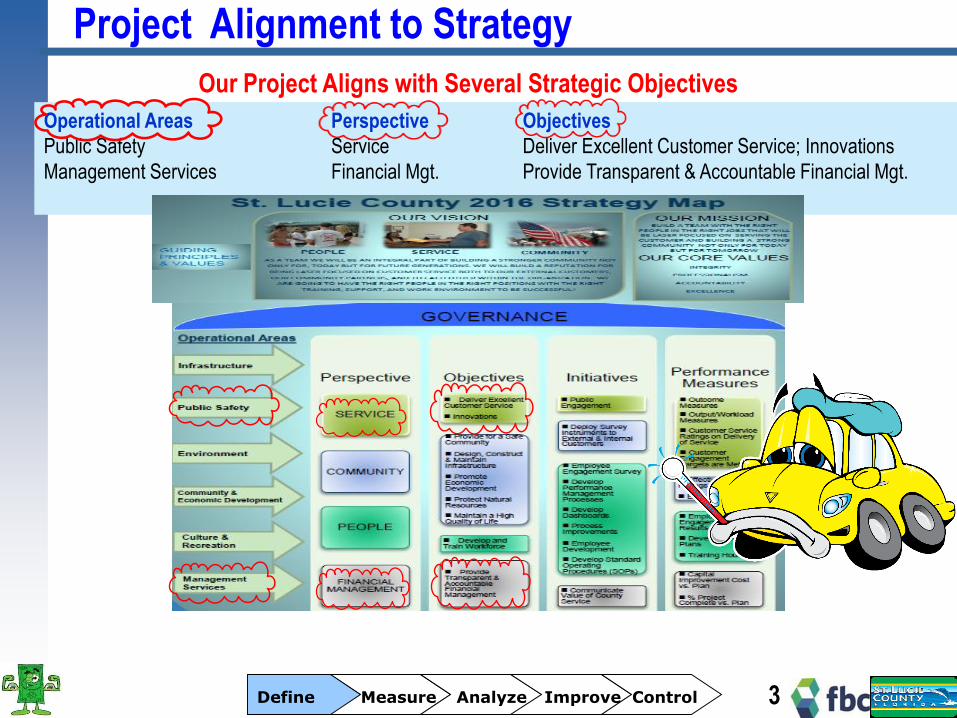
Our Project Aligns with Several Strategic Objectives
Operational Areas Perspective Objectives
Public Safety Service Deliver Excellent Customer Service; Innovations
Management Services Financial Mgt. Provide Transparent & Accountable Financial Mgt.

Identify Project CharterThe team developed a team Project Charter:
Project Name: Reduce Fleet operating and Maintenance Costs
Problem/Impact:
SLC Light Fleet is an Important part of SLC operations.
Maintaining Light Fleet in good working order and minimizing
vehicle Downtime and costs of unplanned maintenance and
repairs is very important. Currently Light fleet costs are too
high at $448 annually per vehicle.
Expected Benefits: Cost Savings, Increased Light Fleet Availability
Outcome Indicator(s)Q1- Annual Maintenance Cost per Light Fleet Vehicle;
Q2-Maint $ Cost per Mile
Proposed Target(s) Q1= $241 (based on existing fleet vehicles of 1-7 years of age); Q2=TBD
Time Frame: Nov 2016 through March 2017
Strategic Alignment:Supports County's Provide Transparent, Accountable Financial Management strategic objectives
In Scope:County Light Fleet Vehicle
Out-of-Scope:Heavy equipment and trailors
Authorized by: Howard Tipton
Sponsor: Ed Matthews
Team Leader: Anne Bowers, Jennifer Garrity
Team Members:George Landry, Ed Matthews, Dennis Bell (SME)
Process Owner(s): Facilities, PR&F, Fleet Mgmt
Mgmt Review Team: County Admisitrator and project Reports- OMB
Completion Date: 31-Mar-17
Review Dates: Monthly and Final Review in March 2017
Key Milestone Dates:See Action Plan
Team
Schedule
Project Charter
Business
Case
Objectives
Scope
4Define Measure Analyze Improve Control
1. 2.
Business Case – Objectives – Scope – Team - Schedule
• Problem: Costs too
high for light fleet
maint.
• Objective: Reduce
maint. cost per mile
without compromising
safety
• Scope: 300 Light Fleet
vehicles

Stakeholder Needs for Light Fleet Operations
5Define Measure Analyze Improve Control
The team identified stakeholders needs for SLC Fleet services:
6Define Measure Analyze Improve Control
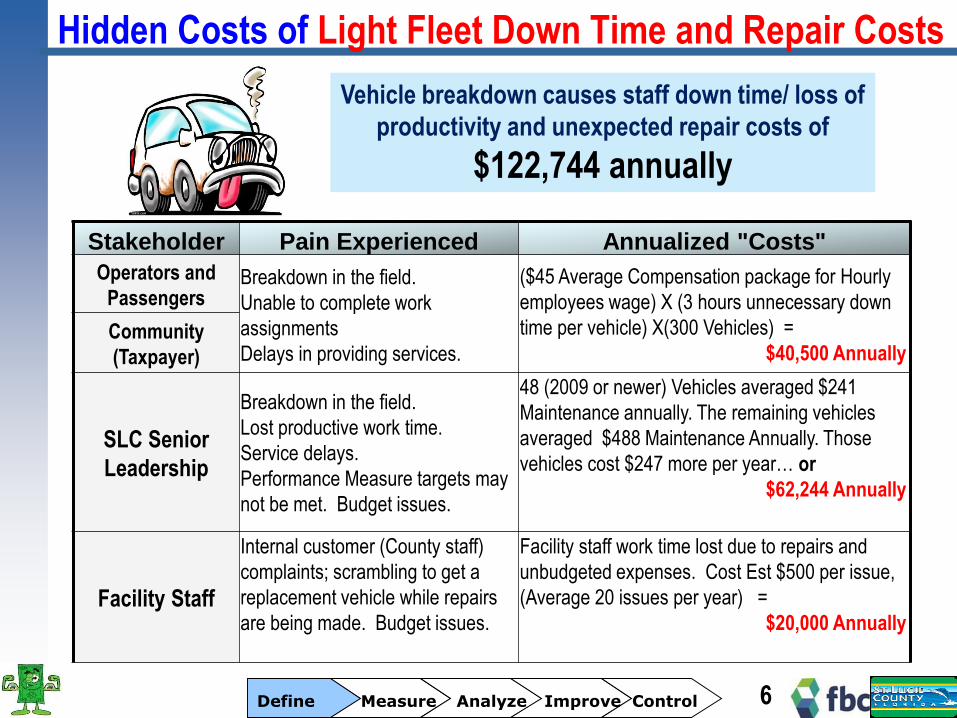
Hidden Costs of Light Fleet Down Time and Repair Costs
Vehicle breakdown causes staff down time/ loss of
productivity and unexpected repair costs of
$122,744 annually
Stakeholder Pain Experienced Annualized "Costs"
Operators and
PassengersBreakdown in the field.
Unable to complete work
assignments
Delays in providing services.
($45 Average Compensation package for Hourly
employees wage) X (3 hours unnecessary down
time per vehicle) X(300 Vehicles) =
$40,500 AnnuallyCommunity
(Taxpayer)
SLC Senior
Leadership
Breakdown in the field.
Lost productive work time.
Service delays.
Performance Measure targets may
not be met. Budget issues.
48 (2009 or newer) Vehicles averaged $241
Maintenance annually. The remaining vehicles
averaged $488 Maintenance Annually. Those
vehicles cost $247 more per year… or
$62,244 Annually
Facility Staff
Internal customer (County staff)
complaints; scrambling to get a
replacement vehicle while repairs
are being made. Budget issues.
Facility staff work time lost due to repairs and
unbudgeted expenses. Cost Est $500 per issue,
(Average 20 issues per year) =
$20,000 Annually

Review Process Flow Chart
The team next looked closer how to capture indicator data.
The team constructed a Process Flow Chart describing steps in the Vehicle Maintenance Process.
7
Per vehicle:
• Q1 – Annual Maint. cost
• Q2 – Maint. Cost per Mile
• Q3 – Annual Fuel Cost
• Q4 – Fuel Cost per Mile
• Q5 - Annual O&M Cost
• Q6 – O&M Cost per Mile
WHO
STEP
NEED
Maintain Light Fleet Vehicles
FBC_DMAIC_Story_Reduce Fleet Maintenance Costs_Light Fleet Cost Summary_12-18-16.vsd 12/18/16
Vehicle Maintained And Availabel To Counter Operators
NOTIFY/CONTACT
(Process Owner: Fleet Manager)
OPERATOR
Need To Maintain Light Fleet In Safe Operating Condition
OPERATE/TAKE/
INSERT/CHECK
Legend
ProKee= Vehicle Maintenance Data Base System
WO= Work Order
OK Without Maintenance?
FLEET MANAGER
DISCUSS/DISCUSS
CREATE/SPECIFY/
CONTRACT VENDOR
▪ Fuel Master System Notifies Operator To Maintenance Needed
▪ Contact Fleet Mgr To Discuss Maint RqdNO
P1 - % of PM Work Orders Worked Late
YES
DETERMINE/TAKE/
PROVIDE
RECEIVE/INSPECT
Able To Set A Schedule
NO
▪ Determine Whether Or Not To Wait Or Drop Vehicle Off For Maintenance Work
▪ Take Vehicle To Contract Vendor At Scheduled Time
▪ Provide Vehicle And WO To Vendor
▪ Discuss Additional Work And Resolve▪ Update WO And Fuel Mgmt System As Needed
▪ Discuss Notification And Operator’s Schedule▪ Discuss Possible Dates And Times To Schedule Maintenance With Contract Vendor
Free Of Other Issues?
▪ Contact Fleet MgrCONTACT
DISCUSS/UPDATE
COMPLETE/NOTIFY/PICK-UP
NO
Q1- Annual Maintenance Cost (per Vehicle)
▪ Create A Work Order And Identify Vendor▪ Specify The Scope Of Work For Contract Vendor▪ Print Out Work Order And Give To Operator
▪ Operate Vehicle For County Business▪ Take Vehicle To County Pump For Gas▪ Insert Key Into ProKee System▪ System Checks For Maintenance Needs
YES
▪ Receive Vehicle And WO▪ Inspect Vehicle For Other Issues
MAINTAINED
NO
YES
▪ Complete Authorized Vehicle Work▪ Notify Operator When Complete▪ Operator Picks Up & Signs For Vehicle
▪ Operate Vehicle & Report Any Problems
▪ Travel To Contract Vendor On Fridays And Secure Invoices For Vehicle Work
▪ Update Vehicle Record And System▪ Process Invoice For Contract Vendor Payment
Q2- Maintenance Cost per Mile
Q3- Annual Fuel Cost (per Vehicle)
Q4- Fuel Cost per Mile
Q5- Annual O&M Cost (per Vehicle)
Q6- O&M Cost per Mile
Q7- ReSale Value / Annual O&M Cost
Q8- % of Planned Utilization Q9- # of Work Order per 5000 miles
OPERATE
TRAVEL/UPDATE/
PROCESS

BB
Ann'l $ Rank $/Mile Rank Ann'l $ Rank $/Mile Rank Ann'l $ Rank $/Mile Rank Ret'n Value Rank %Utilzn Rank Miles/Gal Rank
A v e r a g e Avg Avg Avg Avg Avg Avg Avg
$448 $0.07 $1,537 $0.20 $25,533 $0.21 -$3,125 $587 -$1,269 112% 11.0
Q7 Q8 Q9
$1,753 300 $0.12 276 $4,091 290 $0.27 206 $85,816 299 $0.28 207 $11,629 $14,578 $13,104 300 203% 274 11.0 173 876 295 1253 247
$1,294 297 $0.10 257 $3,470 276 $0.27 206 $56,179 278 $0.28 207 $7,579 $10,528 $9,054 299 173% 258 11.1 167 853 292 1209 242
$1,429 299 $0.12 276 $3,060 262 $0.25 187 $47,968 251 $0.25 179 $8,690 $9,194 $8,942 298 167% 245 12.1 145 873 294 1118 222
Life-To-Date Maintenance Cost Above Plan
AR=(AP+AQ)/2
Vehicle
Life-to-Date
Costs Over
Plan
AQ=(X+AB*L-
AC)-
Vehicle
Life-To-
Date AGE
Costs
Above
Plan
Vehicle
Life-To-
Date
MILEAGE
Costs
Above
Plan
Q6Q3
Maintenance
Miles
per
Gallon
SUM
OF
RANKS
(Maint+
Fuel part
of O&M)
Efficiency BA=
AM+AO+AS
+AV+AX
AW=
M/T
O U T C O M E S
Annual
Maint.
Costs
SUM
OF
RANKS
(not
Including
Fuel)
Utilization
ALL Vehicle Performance
MeasuresVehicle Performance Measures
AD=
X/L
VEHICLE
MAINT-
ENANCE
LEADER-
BOARD
POSITION
OVERALL
VEHICLE
PERFOR-
MANCE
LEADER-
BOARD
POSITION
AI=
Y/M
AL=
AD+AH
AN=
(AL*L)/M
Total
O&M
Cost per
Mile
AT=
100*(M/L)/7405K
AP=(X+AB*L-
AC)-
% of Planned
Utilization
(Avg Ann'l Miles
vs 7405 miles)
Maintenance and
Retention Factors
Maint
Cost
Per Mile
Annual
Fuel
Costs
Fuel
Cost
Per Mile
Total
Annual
O&M
Cost
AY=
AE+AG+
AS
AF=
X/M
AH=
Y/L
O&MFuel
Q10
Avg Life-To-Date Costs Above Plan
Q1 Q2 Q4 Q5
Retain Vehicles with Neg. Values
Q11
Identify Data Collection NeedsThe team developed a spreadsheet to help analyze the Light Fleet Vehicles process.
8Define Measure Analyze Improve Control
Light Fleet Cost Summary (every Row is a Light Fleet Vehicle)BCB
Operating
Fuel
B C D E F I J K L M N Y Z AA AC
Lin
e #
Fuel Dept
Avg Yr%FORD %400s %U %Y Avg Avg %8 Avg Total A v e r a g e
2005 68.3 55.3 97.7 92% 11 79,138 19.3 36,902 $43,772 $63,380 $101,540 $1,516,020 $110,705 $189,963 7.0 $4,500 $5,667
1 204019 2005 FORD LIGHT400 UNLEADEDY $17,500 11 165,610 7 14,999 $18,533 $323 $424 $19,280 $44,998 $85,816 7 $1,500 $6,000
2 407676 2005 FORD LIGHT400 UNLEADEDY $17,500 11 141,040 7 12,722 $12,575 $662 $994 $14,230 $38,167 $56,179 7 $1,500 $5,000
3 409362 2007 FORD LIGHT400 UNLEADEDY $17,500 9 111,113 10 9,180 $12,665 $112 $82 $12,859 $27,540 $47,968 7 $1,500 $6,000
7,405Avg Miles per Year=>
MaintenanceOper-
ations
U
Est'd
Total Fuel
(@ $3 per
Gal)
$
V W AB=
(K-$7k)/AA
Total
Labor
Cost
$
Total
Parts
Cost
$
Total
Maint.
$
Vehicle
Age
(Years)
Resale
Value
Depreciation
Expense
Total
Vehicle
Cost
$ # Y
rs t
o D
epre
cia
te
# Yrs to
Dep
Calculated
Annual
Depreciation
Expense
$
Fuel
Qunty
(Gal)
Outside
Repair
Costs
$
Resale
$
Total Maintenance & Repair
Operating and
Maint Costs
T o t a lMake Size
Purchase
Price Odometer
X=
U+V+W
F I N A N C I A L R E S U L T S
Clas
s
D E M O G R A P H I C S
T
WHAT
Out of
Warranty (36K Mile
or 36 mo)Unit # Year

0
50
100
150
200
250
300
350
400
450
500
'2016
Calendar Year
Ave
rage
Ann
ual M
aint
enan
ce $
Target
Average
Ann'l Maint $per Veh
Review key In-Process Indicator
The team next looked closer at the Gap.
The team collected Q1 indicator data and reviewed performance trends:
9▪Define ▪Measure ▪Analyze ▪Improve ▪Control
GAP
GOOD
Q1- Annual Maintenance Cost per Vehicle
Target = $241 (based on average of existing vehicles aged 1-7 years)
$448 Annual Maintenance per Vehicle

0
5
10
15
20
25
30
35
40
45
50
# of
Veh
icle
s
Total Maintenance Cost
SLC Light Fleet 1997-2015 Vehicles with >2000 miles
39
27
35
38
43
35
23 23
1110
6
43
21
_x
n = 300 ($1,516,020 total Maint Costs)mean = 5053.4std dev = 3433.7
Stratify the Problem
10
The team stratified the 300 SLC Light Fleet Vehicles using a histogram and found…
Define Measure Analyze Improve Control
5.
The team next looked more closely at the 161 vehicles.
161 (54%) Vehicles incurred $1,213,875
(80%) of Maintenance Costs.
(all between $4,465 and $20,047)

Stratify the Problem
11
The team looked closer at these 56 Vehicles with both High overall Maintenance costs and high
cost per miles driven.
56 (35%) Vehicles averaged 10.8 Cents
per Mile (each over 9 cents per mile)
(ie 17% of Light Fleet Vehicles incurred
33% ($497,587)of Light Fleet
Maintenance Dollars)
The team stratified the 161 vehicles many ways and found…
Define Measure Analyze Improve Control
5.

Stratify the Problem
12
The team looked closer at these 53 unleaded fuel vehicles.
The team stratified the 56 vehicles many ways and found…
Define Measure Analyze Improve Control
5.
53
3
%
0
10
20
30
40
50
60
70
80
90
100
0
10
20
30
40
50
UNLEADED DIESEL
% o
f Tot
al
# of
Veh
icle
s
Vehicle Fuel
SLC Light Fleet 1997-2015 Vehicles with >2000 miles and Total Maint Cost >$4,465 AND 9 Cents Maint. Cost Per Mile
n = 56
53 (95%) Vehicles used
Unleaded Fuel
Totaled $466,597
Maintenance Dollars)
U = Unleaded Fuel
D = Diesel Fuel
Legend

Stratify the Problem
13
The team looked closer at these 45 Vehicles.
The team stratified the 53 vehicles many ways and found…
Define Measure Analyze Improve Control
5.
0
5
10
15
20
25
30
1.65 5.35 9.05 12.75 16.45 20.15 23.85 27.55 31.25 34.95 38.65
# of
Veh
icle
s
Vehicle Miles per gallon
SLC Light Fleet 1997-2015 Unleaded Fuel Vehicles with >2000 miles and Total Maint Cost >$4,465 AND 9 Cents Maint Cost Per Mile
12
25
8
12 2 2
1
_x n = 53
mean = 12.942std dev = 6.214
45 Vehicles averaged less than 16.5
Miles per Gallon (Totaled $407,981
Maintenance Dollars)
Stratify the Problem
14
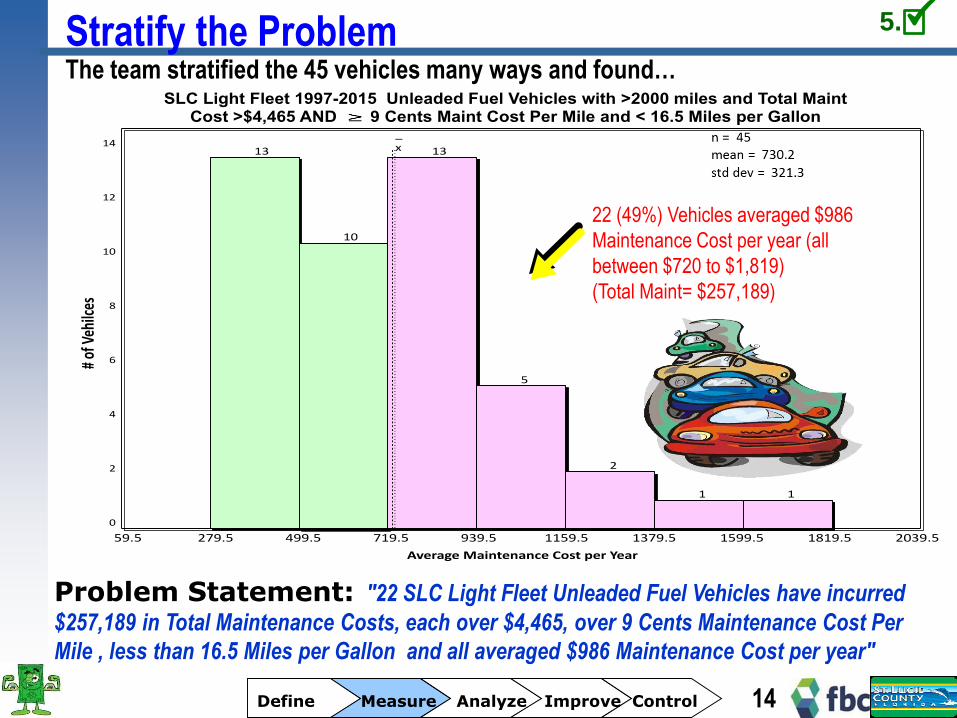
The team stratified the 45 vehicles many ways and found…
Define Measure Analyze Improve Control
5.
Problem Statement: "22 SLC Light Fleet Unleaded Fuel Vehicles have incurred
$257,189 in Total Maintenance Costs, each over $4,465, over 9 Cents Maintenance Cost Per
Mile , less than 16.5 Miles per Gallon and all averaged $986 Maintenance Cost per year"
0
2
4
6
8
10
12
14
59.5 279.5 499.5 719.5 939.5 1159.5 1379.5 1599.5 1819.5 2039.5
# of
Veh
ilces
Average Maintenance Cost per Year
SLC Light Fleet 1997-2015 Unleaded Fuel Vehicles with >2000 miles and Total Maint Cost >$4,465 AND 9 Cents Maint Cost Per Mile and < 16.5 Miles per Gallon
13
10
13
5
2
1 1
_x
22 (49%) Vehicles averaged $986
Maintenance Cost per year (all
between $720 to $1,819)
(Total Maint= $257,189)

Identify Potential Root CausesThe team reviewed the 15 vehicles’ history and discussed each vehicle with the Fleet Maint
personnel before conducting Single Case Bore Analysis.
15
The team next looked closer at these five (5) factors.
Define Measure Analyze Improve Control
9.
A
Single Case Bore Analysis
Reasons or Factors
(that contributed to high Maint.
Costs and High Maint cost per
Mile
15 of 22 Vehicles
Problem Statement: "22 SLC Light Fleet Unleaded Fuel Vehicles have incurred $257,189 in Total Maint Costs, each over
$4,465 Costs; > 9 Cents Maint Cost Per Mile; < 16.5 Miles per Gallon averaged $986 Maintenance Cost per year"
1-#2
0401
9- '0
5 FO
RD
w/1
6561
0 M
iles
2-#4
0936
2- '0
7 FO
RD
w/1
1111
3 M
iles
3-#4
0767
6- '0
5 FO
RD
w/1
4104
0 M
iles
4-#4
0861
7- '0
6 FO
RD
w/1
2491
8 M
iles
5-#4
0747
6- '0
5 FO
RD
w/1
0533
0 M
iles
6-#4
0855
0- '0
6 FO
RD
w/1
0826
2 M
iles
7-#4
0702
8- '0
4 FO
RD
w/1
4307
1 M
iles
8-#4
0574
4- '0
2 DO
DG
E w
/158
430
Mile
s
9-#4
0783
3- '0
5 FO
RD
w/1
2741
6 M
iles
10-#
4085
59- '
06 F
OR
D w
/103
546
Mile
s
11-#
4063
60- '
03 F
OR
D w
/919
24 M
iles
12-#
4049
94- '
01 F
OR
D w
/151
674
Mile
s
13-#
4083
02- '
06 F
OR
D w
/815
26 M
iles
14-#
4083
01- '
06 F
OR
D w
/921
44 M
iles
15-#
4037
94- '
98 G
MC w
/120
299
Mile
s
Tota
lPe
rcen
tage
Reasons or Factors
(that contributed to high Maint.
Costs and High Maint cost per
Mile
1) High Tire Replacements Costs X X X X X X X X X X X X X 13 87%
2) A/C Work higher than normal X X X X X X X X X X X 11 73%
3) High Usage Vehicle (>11K miles/ Yr) X X X X X X X 7 47%
4) Transmission High Expenses X X X X X 5 33%
5) Battery/Ignition Sys High Costs X X X X X X X X 8 53%
6) Fuel System/ Fuel Pump X X X X X X 6 40%
7) Brakes X X X X X X 6 40%
8) Cooling System X X X 3 20%
9) ( Abnormal Use vehicles
(payload, towing, speciality
use)Mosquito Control Operations
X X X X X 5 33%
B
C
D
E

Identify Potential Root CausesThe team completed Cause and Effect Analysis and found…
The team next looked to verify these 3 Potential Root Causes.
16Define Measure Analyze Improve Control
9.,10.
"22 SLC Light Fleet
Unleaded Fuel
Vehicles have
incurred $257,189 in
Total Maint Costs,
each over $4,465
Costs; > 9 Cents
Maint Cost Per Mile;
< 16.5 Miles per
Gallon averaged
$986 Maintenance
Cost per year"
Problem
Statement
Fishbone
Cause and Effect
Diagram
= Potential Root
Cause
Operators not fully trained on
Heavy payload/Abnormal
Vehicle operations (including
precheck and driving habits)
A- High Tire Replacements Costs (87%)
Operators are not fully
aware of impact driving a
heavy Veh has on tires
Heavy Payload and Operator
factors cause high tire wear
A
D-Battery/ Ignition High Sys Costs (53%)
Vehicle Mileage related Guidelines
are not consistent for depts
Air Conditioning expenses are
higher on these older vehicles
Improper Operating A/C impacts
vehicle A/C System over time
D
B-A/C Work higher than normal (73%)
Operators do not have guidelines on
vehicle routing and how to minimize
mileage during operations
D-High Usage Vehicle
(>11K miles/ Yr) (47%)
Vehicles with High Maint Costs
used many hours of day for very
specialized (abnormal) Use
Operators not fully trained on Heavy
payload Vehicle operations (including
precheck and driving habits)
Operators are not fully aware of
appropriate use of A/C on vehicle A
High Mileage usage requires more
tune-ups and
Operators not fully trained on
Heavy payload/Abnormal
Vehicle operations (including
precheck and driving habits)
Operat’rs not fully aware of
Maint. impact of Veh oper’n
used for abnnormal useE A
Abnormal Vehicles
have high usage
and Maint Costs
No written policy for
when it is economical
to replace abnomal/
specialized vehicles
Replacement decision
often delayed for
Abnormal vehicles
E- Abnormal Use vehicles (payload,
towing, speciality use)Mosquisto
Control Operations (33%)

A Operators not fully trained
on Heavy payload/Abnormal
Vehicle operations
(including precheck and
driving habits)
Root Cause
D Vehicle Mileage related
Guidelines are not
consistent for all depts Root Cause
E No written policy for when it
is economical to replace
Abnomal/Specialized
vehicles
Root Cause
Root Cause
or Symptom
Reviewed Procedures and policies
for training and confirmed no formal
training provided for abnormal use
vehicles in all Departments.
Reviewed Procedures and policies
and found that there is no written
policy defining when it is economical
to replace abnomal/ specialized
vehicles
Reviewed Procedures and policies
and confirmed no written guidelines
for all Departments to use related to
Mileage and idle time on Abnormal
use vehicles
Potential Root Cause How Verified?
Verify Root CausesThe team collected data to verify the root causes and found….
17
…All potential root causes were validated.
Define Measure Analyze Improve Control
11.,12.

Identify and Select Countermeasures
The team selected four (4) countermeasures for implementation.
The team brainstormed many countermeasures and narrowed them down to these for evaluation:
18Define Measure Analyze Improve Control
13.,14.
Eff
ec
tiv
en
es
s
Fe
as
ibilit
y
Ov
era
ll
Ta
ke
Ac
tio
n?
Ye
s/N
o
A1- Employee Training/ Checklist: provide
mandatory training and SOP on use of County
vehicles; require submission of checklist for walk-
around inspection
4 5 20 Y
D- Vehicle Mileage related Guidelines
are not consistent for depts
E1- Utilize the Light Fleet Vehicle Summary
Spreadsheet to Rank Vehicles and help Identify
Abnormal/Specialized Vehicles for Retirement
5 4 20 Y
E2- Dispose of high cost vehicles; replace with new
vehicles with oil and tire air pressure monitors; new
fleet vehicles purchased according to size, weight, use
needed; standardized policy; avg replacement cost
$21,000
5 5 25 Y
5 5 25 Y
"22 SLC Light
Fleet Unleaded
Fuel Vehicles have
incurred $257,189
in Total Maint
Costs, each over
$4,465, over 9
Cents Maint Cost
Per Mile , over 16.5
Miles per Gallon
and all averaged
$986 Maintenance
Cost per year"
"22 SLC Light
Fleet Unleaded
Fuel Veh
E- No written policy for when it is
economical to replace abnomal/
specialized vehicles
Countermeasures Matrix
Problem
Statement Countermeasures
A- Operators not fully trained on Heavy
payload/Abnormal Vehicle operations
(including precheck and driving habits)
A2/D1- Expand GPS - Expand vehicle tracking --Will
provide driving factors: hard braking, idle time, jack
rabbit starts, vehicle speed;
Legend: 3=Moderately 5=Extremely 2=Somewhat
4=Very 1=Little or None
Ratings
Verified Root Causes
Develop and Implement Action PlanLegend:
= Actual
= Proposed
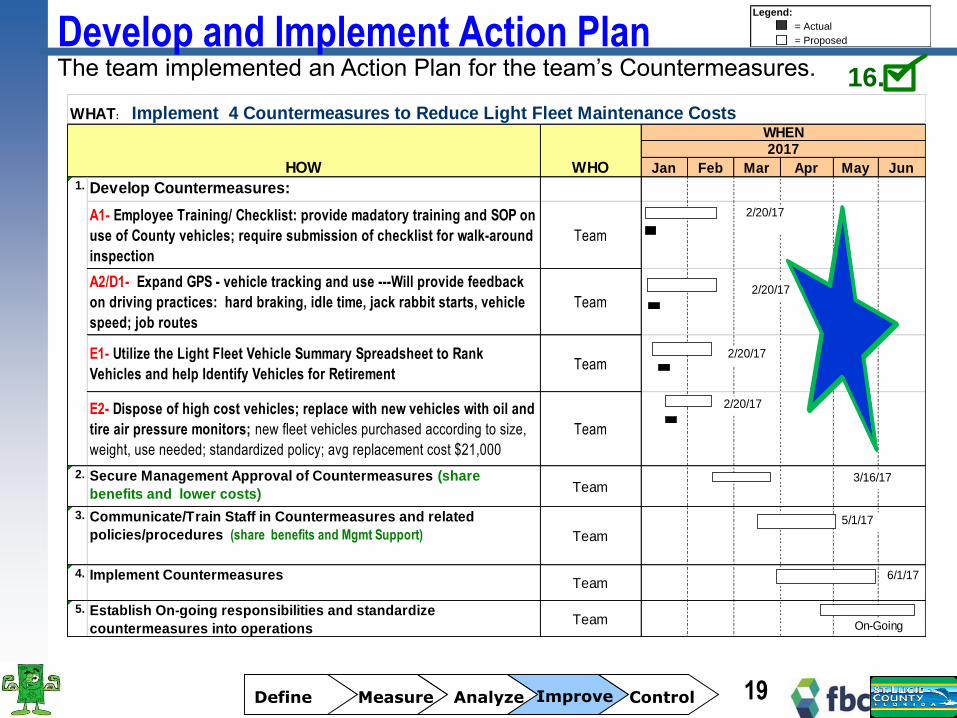
The team implemented an Action Plan for the team’s Countermeasures.
19Define Measure Analyze Improve Control
16.
Jan Feb Mar Apr May Jun
Develop Countermeasures:
A1- Employee Training/ Checklist: provide madatory training and SOP on
use of County vehicles; require submission of checklist for walk-around
inspection
Team
A2/D1- Expand GPS - vehicle tracking and use ---Will provide feedback
on driving practices: hard braking, idle time, jack rabbit starts, vehicle
speed; job routes
Team
E1- Utilize the Light Fleet Vehicle Summary Spreadsheet to Rank
Vehicles and help Identify Vehicles for RetirementTeam
E2- Dispose of high cost vehicles; replace with new vehicles with oil and
tire air pressure monitors; new fleet vehicles purchased according to size,
weight, use needed; standardized policy; avg replacement cost $21,000
Team
2. Secure Management Approval of Countermeasures (share
benefits and lower costs)Team
3. Communicate/Train Staff in Countermeasures and related
policies/procedures (share benefits and Mgmt Support) Team
4. Implement CountermeasuresTeam
5. Establish On-going responsibilities and standardize
countermeasures into operationsTeam
WHAT: Implement 4 Countermeasures to Reduce Light Fleet Maintenance Costs
HOW WHO1.
WHEN2017
On-Going
5/1/17
2/20/17
2/20/17
2/20/17
2/20/17
3/16/17
6/1/17

Countermeasures A1- Vehicle Checklist
20Define Measure Analyze Improve Control
SOP for use of County Vehicles to require:
▪ Mandatory Employee training on fleet vehicle use including abnormal operations.
▪ Mandatory Employee training on checklist for vehicle inspections. (see below)
▪ Submission of checklist after walk around inspection by supervisor.
Department:
Vehicle Property ID#: Make/Model:
Inspection Date Inspection Date Inspection Date
____/____/____ ____/____/____ ____/____/____
Inspected by/ Mileage: Inspected by/ Mileage: Inspected by/ Mileage:
________ / ________ ________ / ________ ________ / ________
1
2
3
4
5
6
7
8
9
10
Note: Do not operate any vehicle if an unsafe condition
exists
Visually Check Fluid Level Reservoirs (Brake,
coolant, windshield washer)
Vehicle Safety Equipment
Brake Operation
Windshield Wiper and Washer Sprayer
Directional Signals
Lights (Head, Tail and Emergency )
Horn and Mirrors
Tire Inflation, Safe Tread Depth and Even wear
Exterior & Interior Condition (free of body damage,
stains, ripped fabrics, windshield cracks, etc.)
Air Conditioning (from previous day’s usage)
Comments:
Note: Any item not passing inspection shall immediately be reported to the Dept Head/ Fleet Manager and a
garage work order issued and the vehicle repaired and returned to services as soon as possible.
MOTOR VEHICLE WEEKLY SAFETY CHECKLISTInstructions: To be completed weekly by Driver or when a CHANGE of driver takes place.
Ok= Unacceptable= X

0
2000
4000
6000
8000
10000
12000
14000
Q9 - Vehicle Life-To-Date Maintenance Cost Above Plan (Based on Vehicle Age & Mileage)
Vehicle Unit# - Year - Make
Plan based on 7 year depreciation and vehicle costs for vehicles under 7 years in service; those Vehicles Avg $241 Maint per Yr; Vehicles approaching 70,000 miles averaged 7 Cents per mile
GOOD
Countermeasures E1- Utilize Vehicle Summary Spreadsheet
21Define Measure Analyze Improve Control
The Summary Spreadsheet below Ranks the worst performing Vehicles for “Q9 :
Life-To-Date Maintenance Costs Above Plan” in graphic format.
These vehicles
are ranked by
the worst
performing
vehicles in terms
of maintenance
costs as
compared to
expected or
planned costs .

0
200
400
600
800
1000
1200
1400
1600
1800
2000
0 50000 100000 150000 200000 250000
Aver
age V
eh
icle
Main
ten
an
ce C
ost
Per
Year
Vehicle Miles
SLC Light Fleet Vehicle Annual Maint. Cost Vs Mileagen=300 Light Fleet Vehicles 1-11-17
A “Vehicle Life Cycle” plot is automatically created which compares
Annual Maintenance Costs versus Vehicle Mileage ….
22Define Measure Analyze Improve Control
13 Vehicles averaged
Maintenance costs of
over $1,000 per
year…and should be
investigated for
possible retirement.
GOOD
Countermeasures E1- Utilize Vehicle Summary Spreadsheet

0
50
100
150
200
250
300
350
400
450
500
'2016
Calendar Year
Ave
rage
Ann
ual M
aint
enan
ce $
Target
Average
Ann'l Maint $per Veh
GOOD
Review Results
The team was encouraged by the results and will continue to monitor the countermeasures.
The team collected indicator data and reviewed results of the countermeasures
23
RESULTS….Note Performance to be documented
after implementation of Countermeasures
Define Measure Analyze Improve Control
17.,18.,19.,20.
Countermeasures implemented in March 2017
Q1- Annual Maintenance Cost per Vehicle
Target = $241 (based on average of existing vehicles aged 1-7 years)
$448 Annual Maintenance per Vehicle

WHO
STEP
NEED
Maintain Light Fleet Vehicles
FBC_DMAIC_Story_Reduce Fleet Maintenance Costs_Flowchart_1-22-17_Future State.vsd 1/22/17
Vehicle Maintained And Availabel To Counter Operators
NOTIFY/CONTACT
(Process Owner: Fleet Manager)
OPERATOR
Need To Maintain Light Fleet In Safe Operating Condition
COMPLETE/OPERATE/
TAKE/INSERT/CHECK
Legend
ProKee= Vehicle Maintenance Data Base System
WO= Work Order
OK Without Maintenance?
FLEET MANAGER
DISCUSS/DISCUSS
CREATE/SPECIFY/
CONTRACT VENDOR
▪ Fuel Master System Notifies Operator To Maintenance Needed
▪ Contact Fleet Mgr To Discuss Maint RqdNO
P1 - % of PM Work Orders Worked Late
YES
DETERMINE/TAKE/
PROVIDE
RECEIVE/INSPECT
Able To Set A Schedule
NO
▪ Determine Whether Or Not To Wait Or Drop Vehicle Off For Maintenance Work
▪ Take Vehicle To Contract Vendor At Scheduled Time
▪ Provide Vehicle And WO To Vendor
▪ Discuss Additional Work And Resolve▪ Update WO And Fuel Mgmt System As Needed
▪ Discuss Notification And Operator’s Schedule▪ Discuss Possible Dates And Times To Schedule Maintenance With Contract Vendor
Free Of Other Issues?
▪ Contact Fleet MgrCONTACT
DISCUSS/UPDATE
COMPLETE/NOTIFY/PICK-UP
NO
Q1- Annual Maintenance Cost (per Vehicle)
▪ Create A Work Order And Identify Vendor▪ Specify The Scope Of Work For Contract Vendor▪ Print Out Work Order And Give To Operator
▪ Complete Pre-Op Checklist On Vehicle And Report Issues To Fleet Mgr
▪ Operate Vehicle Per Oper Guidelines ▪ Take Vehicle To County Pump For Gas▪ Insert Key Into ProKee System▪ System Checks For Maintenance Needs
YES
▪ Receive Vehicle And WO▪ Inspect Vehicle For Other Issues
MAINTAINED
NO
YES
▪ Complete Authorized Vehicle Work▪ Notify Operator When Complete▪ Operator Picks Up & Signs For Vehicle
▪ Operate Vehicle & Report Any Problems
▪ Travel To Contract Vendor On Fridays And Secure Invoices For Vehicle Work
▪ Update Vehicle Record And System▪ Process Invoice For Contract Vendor Payment▪ Review Vehicle Leaderboard Qtrly For Additional
Actions (Transfer, Replace, Etc)
Q2- Maintenance Cost per Mile
Q3- Annual Fuel Cost (per Vehicle)
Q4- Fuel Cost per Mile
Q5- Annual O&M Cost (per Vehicle)
Q6- O&M Cost per Mile
Q7- ReSale Value / Annual O&M Cost
Q8- % of Planned Utilization Q9- # of Work Order per 5000 miles
OPERATE
TRAVEL/UPDATE/
PROCESS
Standardize Countermeasures
The team revised
indicators and
incorporated the
improvements
into the Process
flowchart.
24
The team
looked to
standardize the
Indicator
monitoring
21.,22.,23.

Identify Lessons LearnedLessons Learned
3) Lean Six Sigma needs to be the approach utilized by the County to
achieve continuous and long term process improvements.
2) Using the Lean Six Sigma tools and techniques helped us find the
Actual Root Cause(s) …which were different from what we initial
perceived.
25
Next Steps
1) Continue to monitor the countermeasures
and performance results.
1) Learned that Lean Six Sigma can help organizations improve their
Key Metrics, Scorecards and Strategic Goals.
Define Measure Analyze Improve Control
24.,25.
4) Data quality is an important success factor for problem solving. The
light fleet data was in a summary format and needed to converted to
detail info by vehicle before problem solving could proceed.
Related Documents